00 INVESTIGATION OF THERMAL IMAGING TECHNIQUES … · 00 INVESTIGATION OF THERMAL IMAGING...
106
AFCRL-63-73 00 INVESTIGATION OF THERMAL IMAGING TECHNIQUES FINAL REPORT Prepared by Tibor S. Laszlo Paul J. Sheehan, Jr. RESEARCH AND ADVANCED DEVELOPMENT DIVISION j AVCO CORPORATION Wilmington, Massachusetts SRAD-TR-63-7 C." u Contract AF19(604).7204 Project 4619 .- J Task 46190 15 March 1963 Prepared for ELECTRONICS RESEARCH DIRECTORATE AIR FORCE CAMBRIDGE RESEARCH LABORATORIES OFFICE OF AEROSPACE RESEARCH UNITED STATES AIR FORCE Bedford, Massachusetts
Transcript of 00 INVESTIGATION OF THERMAL IMAGING TECHNIQUES … · 00 INVESTIGATION OF THERMAL IMAGING...

AFCRL-63-73
00 INVESTIGATION OF THERMAL IMAGING TECHNIQUESFINAL REPORT
Prepared by
Tibor S. Laszlo
Paul J. Sheehan, Jr.
RESEARCH AND ADVANCED DEVELOPMENT DIVISIONj AVCO CORPORATION
Wilmington, Massachusetts
SRAD-TR-63-7
C." u Contract AF19(604).7204
Project 4619
.- J Task 46190
15 March 1963
Prepared for
ELECTRONICS RESEARCH DIRECTORATEAIR FORCE CAMBRIDGE RESEARCH LABORATORIES
OFFICE OF AEROSPACE RESEARCHUNITED STATES AIR FORCE
Bedford, Massachusetts

AF CRL-63-73 This document consists of 108F-90 copies, Series A
INVESTIGATION OF THERMAL IMAG ING TECHN IQUESFINAL REPORT
Prepared by
Tibor S. LaszloPaul J. Sheehan, Jr.
RESEARCH AND ADVANCED DEVELOPMENT DIVISIONAVCO CORPORATION
Wilmington, Massachusetts
RAD-TR-63-7
Contract AF19(604).7204
Project 4619
Task 46190
15 March 1963
Prepared for
ELECTRONICS RESEARCH DIRECTOR.ATEAIR FORCE CAMBRIDGE RESEARCH LABORATORIES
OFFICE OF AEROSPACE RESEARCHUNITED STATES AIR FORCE
Bedford, Massachusetts
Requests for additional copies by Agencies of the Department of Defense, their
contractors, and other Government agencies should be directed to the:
ARMED SERVICES TECHNICAL INFORMATION AGENCYARLINGTON HALL STATION
ARLINGTON 12, VIRGINIA
Department of Defense contractors must be established for ASTIA Services orhave their "need-to-know" certified by the cognizant military agency of theirproject or contract. All other persons and organizations should apply to the:
U. S. DEPARTMENT OF COMMERCE
OFFICE OF TECHNICAL SERVICES
WASHINGTON 25, D.C.
-ii-

ABSTRACT
Experiments and measurements which can be performed successfully in imagefur-naces are listed together with the necessary special instrumentation. Therestrictions imposed by basic principles of image furnaces upon their operationare discussed, and methods to overcome these restrictions are proposed. Sam-ple holders were designed and built which permit operation in controlled atmos-pheres with rotation of the sample on, or perpendicular to the optical axis, andwhich are suitable for the measurement of electrical properties at high tempera-tures. A fast action, on-off shutter has been designed to be operated by com-pressed air and vacuum. A new guidance control system has been built havinggreater sensitivity and precision than the previous model. An experimentalsetup has been constructed for the direct measurement of solar reflection co-efficients. A 36-inch paraboloidal reflector has been fabricated by a newmethod. A method has been developed which makes it possible to calculate thetemperature dependence of a property from measurements of the uneven fluxdistribution of the image at several peak flux values. Blackbody cavities arediscussed, and a new shape blackbody is presented which absorbs a larger por-tiori of the incident radiant energy than previously known shapes. Analyticalevaluation for this shape was made and compared with results for previouslyknown shapes. A calorimeter was built using this shape and fluxes in the solar"furnaces were measured with it. The resultant correlation of normal-incidencesolar radiation and the concentrated flux in the focal area is presented. Theuse of the solar furnace as a high-intensity radiant-flux standard is proposed.The flux distribution was measured with a fine resolution radiometer using MgO-coated absorbing surface. A method for the determination of the sensitivityof the radiometer using a single flux measurement has been developed. Photo-rnicrographs of high-melting point ceramics, melted in the rotating sample-holder, are presented. Single crystals of thoria grown by vapor condensationare shown. A method for the measurement of the electrical resistivity ofrefractory oxides was developed. A survey of image-furnace facilities has beenmnad e.
-iii-

* CONTENTS
I. Introduction ............................................ 1
II. Design and Operating Parameters ......................... 3
III. Restrictions on the Operation of Image Furnaces ............ 6
IV. The Sample Holders ...................................... 7
V. The Shutter ............................................... 14
VI. The New Guidance System for Solar Furnaces ............... 16
VIt. Solar- Reflection Coefficient-Measuring Apparatus ........... 18
VIII. A New Method for the Manufacture of Precision Reflectors ..... 21
IX. Flux Distribution ........................................ 30
X. The New Shape Blackbody ................................. 34
XI. Flux M easurements ....................................... 44
A. Calorim etry ......................................... 44B. Radiom etry I......................................... 53
XII. Heating of Refractory Oxides in the Solar Furnace ........... 63
XIII. The Measurement of the Electrical Resistivity ofRefractory Oxides ......................................... 79
XIV. Deliveries ... ..... ........... . . ............ 85
XV. Visits ......... .......................................... 86
XVI. Publications a.............................................. 87
XVII. References ................................................ 89
Appendix: Image Furnace Facilities Survey ................ 91
-V-

ILLUSTRATIONS
Figure 1 Avco PAD Solar Furnace ............ ............ 2
2 Controlled Atmosphere Sample Holder ................... 8
3 Transparent Hemisphere Mount .......................... 9
4 Controlled Atmosphere Sample Holder ................... 10
5 Sample Holder for Electrical Measurements ............ 11
6 Sample Holder for Electrical Resistivity Measurements.. 13
7 Solar Furnace Shutter .............................. 15
8 Circuitry Modification on Minneapolis HoneywellBrown Amplifier 353170-3 .............................. 17
9 Solar Reflection Coefficient Apparatus (SchematicDiagram) ............................................. 19
10 Solar Reflection Coefficient Apparatus Mounted on
Solar Furnace ........................................ 20
11 Testing of Paraboloidal Mirrors ....................... 23
12 Reflected Test Pattern ................................ 24
13 Reflected "Lest Pattern ............................... 25
14 Flux Distribution in 36-Inch Paraboloid ................. 27
15 Thirty-Six Inch Reflector Mounted in 60-Inch SolarFurnace ........................ .................... 28
16 Image Temperature Distribution ....................... 31
17 Artificial Blackbody Shapes ............................ 35
18 New Shape Blackbody ............................... 38
19 Comparison of the Effective Emissivity of the CylinderWith That of the New Shape Blackbody ................ 42
-vi-

* ILLUSTRATIONS (Concl'd)
Figure 20 Cone Angle versus Effective Emissivity of the NewShape Blackbody.................................... 43
21 Block Diagram of Calorimetric Measurement System .... 45
22 Flux versus Attenuator Position in the Solar Furnace .... 46
23 Flux versus Rim Angle .............................. 47
24 Calibration of Radiometer ............................. 55
25 Change of Flux versus Screen Position ................. 57
26 Peak Flux versus Normal Incidence Solar Radiation 60
27 Edge of Alumina Crater .............................. 64
28 Cross Section of Alumina Crater ..................... 65
29 Single Crystals Grown Below Crater ................... 66
30 Slowly Cooled Alumina Crater ........................ 67
31 Zirconia Crater ..................................... o 68
32 Edge of Zirconia Crater .............................. 69
33 Zirconia Crystals Grown Below Crater ................ 70
34 Zone Effect on Alumina Crater ....................... 71
35 Condensation Crystals Around Thoria Crater ........... 73
36 Rod-Like Single Crystals of Thoria .................... 74
37 Octohedral Single Crystal of Thoria .................. 75
38 Thoria Crystal Cluster ............................... 76
39 Multiple Twin Thoria Crystals ........................ 77
40 Dendritic Thoria Crystals ............................ 78
41 Operation of Rotating Sector .......................... 81
42 Uncorrected Optical Pyrometer Readings AlongSam ple ............................................. 83
-vii-
1. INTRODUCTION
Image furnaces are highly suitable for high-temperature experimentation andmeasurements. 1 For successful operation, however, it is important to con-sider the unusual heating conditions which exist at the focal area. In mostcases, conventional instruments and techniques cannot be used because of thesmall size and uneven flux distribution of the image. Another restriction ofoperating conditions is the fact that heating takes place only at the front sur -face of the specimen. In order to overcome these difficulties, completely newmethods and instruments must be devised in many cases to accomodate theunusual space and radiation conditions in image furnace.
Recognizing this need, the Air Force Cambridge Laboratory awarded contractAF 19(604)-7204 to Avco RAD on 16 February 1960 calling for the investigationof requirements for a precision solar imager and for the development of ther-mal imaging techniques to be used in high-temperature refractory-materialsresearch.
For administrative reasons a report on this work was issued at the end of thefirst year. 2 The present report also includes all the material of the previousreport.
The following scientists and engineers participated in the reported work:Tibor S. Laszlo, (principal investigator); Murray S. Klamkin, Salvatore Motta,Paul J. Sheehan, Jr., Arthur W. Shores, and Royal N. Schweiger. The contractwas monitored by Mr. George P. Ploetz, CRRCPS. The experimental work wasperformed on the Avco RAD 60-inch solar furnace shown in figure 1.
S
-1-
-9

Figure 1 AVCO RAD SOLAR FURNACEP-59-1192

II. DESIGN AND OPERATING PARAMETERS
In order to select the most important experimental and instrumentation problemsfor the present investigations, a survey was prepared defining the field ofactivity for image furnaces. Only such work as would benefit by the specialadvantages of image furnaces was considered, as were areas where thereappeared to be a reasonable probability of overcoming restrictions specific toimage furnaces. In the following, the suggested experiments are listed togetherwith the needed accessory equipment. All listings are cumulative.
A. MEASUREMENT OF PHYSICAL PROPERTIES
1. Temperature
Required: Sample positioning in the three spatial coordinates, observationhole at the optical axis, flux control, separation of radiation emitted byand reflected from the sample, and manual or recording optical pyrometeror radiation pyrometer designed for the aperture existing in the furnace.
2. Emissivity
Required: Watercooled, calibrated radiometer on a semicircular mount,permitting measurement at any angle up to 90 degrees off the optical axis,monochromator for spectral emission measurement, and artificial black-body for reference.
3. Melting Point
Required: Controlled atmosphere sample holder with rotating samplemount, provision for removal of condensations from window, and telescopefor sample observation.
4. Thermal Expansion Coefficient
Required: Controlled atmosphere sample holder to rotate the sample nor-mal to the optical axis, reflector behind the sample, and specially de-signed optical cathetometer.
5. Electrical Resistivity
Required: Liquid-cooled, rotating copper contacts with keyed faces, slidingcontacts, and standard measuring instrumentation.
-3-

6. Dielectric Constant
Required: Resonant cavity dielectrometer modified for image furnace use.
7. Thermionic Emission
Required: Vacuum sample holder for closely spaced systems, speciallydesigned contacts with standard potential, and current measuring instru-ments.
8. Evaporation Rate
Required: Controlled atmosphere sample holder with provision for removalof material, and fast action shutter.
9. Magnetic Susceptibility
Required: Thermally shielded electromagnetic equipment, contacts, andstandard instruments.
10. Radiation Standard
Required: Water-cooled radiation calorimeter with differential thermopiles,thermostat, pumps, and standard instruments. £
11. Specific Heat
Required: Copper-block calorimeter fitting into sample holder, specialsample suspension, and dropping mechanism.
B. OBSERVATION AND MEASUREMENT OF CHEMICAL PROPERTIES
Required: Mechanism to feed solids, liquids, and gases into a controlled atmos-phere reaction chamber, and to remove vaporized products. An inert solidsurface to absorb radiant energy for gas-gas reactions. The design and per-formance of these mechanisms will vary according to the reaction.
C. SPECIAL TECHNIQUES
1. Growing of Single Crystals
Required: Powder feed and seed crystal mount, automatic temperaturecontrol monitored by a recording optical pyrometer or a specially designedradiation pyrometer.
-4-

2. Zone Refining
Required: Sample mount supporting both ends of the sample rod androtating it; and mechanism to oscillate the sample mount with adjustablelength.
3. High Temperature Fabrication
Required: Mounts for welding thermocouple beads in inert atmosphere,shaping of ceramics, welding ceramics to ceramics or to metals, cuttingand casting of refractory materials; electronic position indicator, second-ary mirrors of special design, and flux redistributors may also berequired.
b -5-
I.t

III. RESTRICTIONS ON THE USE OF IMAGE FURNACES
Image furnaces place certain limitations on experimentation. For successfuloperation, therefore, it is important to develop special equipment as well asspecial methods which take these limitations into consideration. In some cases,it is possible to adapt conventional experimental techniques to the restrictionsof the image furnace; in others, a completely new approach to the problem mustbe found.
Three specificities require consideration when one is planning experiments inan image furnace. The first is the small size of the hot zone. In carbon-arcimage furnaces the image size can be increased by increasing the anode diameter.The required increase in power requirement, however, and the decrease in fo-cusing precision are limiting factors. In solar furnaces, a large image may beobtained by increasing the size of the reflector. However, the technical prob-lems involved in the building and operation of a large solar furnace are con-siderable. In addition, it is not possible to manufacture a large paraboloidalreflector, especially one composed of several plane or spherical mirrors, withthe same high precision as can be done with a smaller one. It appears that abetter solution to this problem is to change experimental techniques so as tomake use of a small image. The precision of the measurements is not neces-sarily affected by the reduction of the size of the heated portion of a sample.If the analogy of the development of microanalysis can be applied here, thedecrease in sample size may even increase the accuracy of certain tests.
The second limitat on, namely, that heating takes place only on one side of thesample, is more restrictive. Heating in a cavity has been suggested 3 to over-come this difficulty. The refractoriness of the cavity material, however, setsa rather low temperature limit on such a technique. In addition. owing to thepresence of the sample in the cavity, it is unlikely that a uniform wall tempera-ture can be reached. With this technique, there is also the danger that theproximity of the hot cavity wall may contaminate the sample. A more promis-ing technique is the rotation of the sample around an axis perpendicular to theoptical axis of the image furnace to achieve even heating around the entire cir-cumference.
The third restrictive property, the nonuniform flux across the image area, re-quires the most serious consideration. Two methods appear to be possible toovercome this difficulty. One experimental approach would apply additionaloptical elements in an image furnace to decrease or perhaps totally eliminateflux differences. The other approach, as evolved during the present work, usesan experimental technique which, together with a newly developed analyticalprocedure, permits the calculation of the temperature dependence of a propertymeasured in the nonuniform flux area.
-6-

ii°
IV. THE SAMPLE HOLDERS
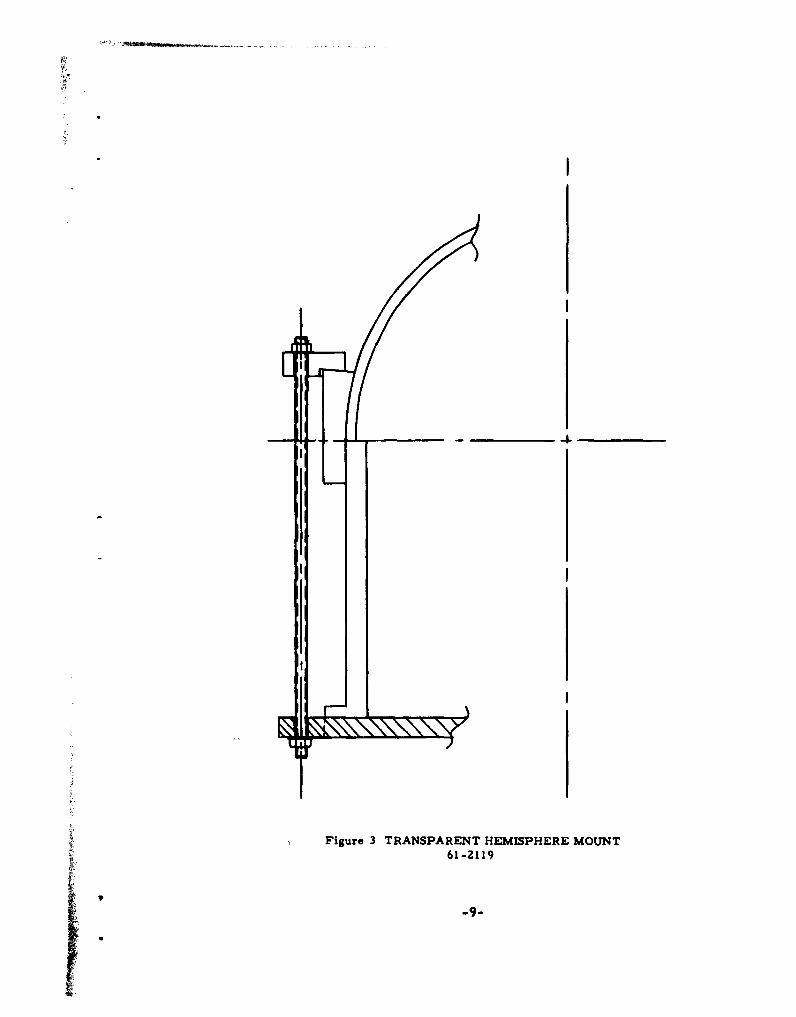
In order to overcome the one-sided heating of a sample, two special sampleholders have been designed and built. The first holder is shown schematicallyin figure Z. The cylindrical transite enclosure is topped by a transparent hemi-sphere. Generally, a pyrex hemisphere cut from a one-liter, round-bottom
flask is used. When the highest obtainable fluxes are required, a clear fusedsilica or a vycor hemisphere is recommended. An oscillating wiper bladescrapes deposits off the inside of the hemisphere. The wiper blade is made ofsteel tailored to the shape of the hemisphere and covered with a woven silica-fiber sleeving. The sample can be rotated at variable rpm around the opticalaxis of the furnace in order to ootain symmetrical heating. Gas inlet and out-let connections are located at the base plate. The method of mounting the hemi-sphere is illustrated in figure 3. A transite ring surrounds the hemisphere andpresses it to the transite cylinder; the ring itself is tied down by bolts to thebase plate. The nuts for the bolts are springloaded in order to avoid failure dueto differential thermal expansion. A photograph of the completed sample holderis depicted in figure 4.
The second sample holder, which has been built, permits the rotation of a sam-ple perpendicular to the optical axis of the furnace and provides electrical con-tacts at the two ends of the sample, as shown in figure 5.
Two hollow stainless steel shafts are used as sample support. The cooling li-quid is carried through a small tube inside the shafts to the tips and returns inthe space between the tube and the shaft. Gold-plated copper contacts are fittedtightly over the tip of the shafts. The faces of the copper contacts are made tofit the sample diameter, and are provided with a key to firmly engage a slot inthe end of the sample. One of the shafts is rotated by a servo motor through agear mechanism while the other rotates freely. The driven shaft can be adjustedlaterally to accommodate samples of various length. The other shaft is spring-loaded in the lateral direction in order to make good mechanical contact with thesample. Through this contact the shaft follows the rotation of the driven shaft.In addition, the springloading facilitates sample insertion and removal. Coppertubes for the cooling liquid connections are mounted on the bearing housings and"ti01" rings are used to make a liquid-tight rotating seal.
The two rotating shafts are isolated electrically by the use of teflon gasketsunderneath the bearing housings which are fastened to the baseplate with nylon-coated screws. Electrical contacts to the rotating shafts are made by the useof nickelplated copper discs silver-soldered onto the shaft and immersed in acontainer filled with mercury. The mercury container is mounted in suchfashion that it can rotate freely around a horizontal axis. By this arrangement,the container will always be in a horizontal position, regardless of the actualpointing angle of the solar furnace. A cover placed over the container, with a
-7-

0J
ANGLE OF ROCDENT
RADIATIONE
HEMISPHERE -"
RCHAMBERWIEAR DRIV
SAMPLE ROTATINGG E A R M O T O R
Figure 2 CONTROLLED ATMOSPHERE SAMPLE HOLDER60-2613A
-8-
-
Figure 3 TRANSPARENT HEMISPHERE MOUNT61-2119
V -9-
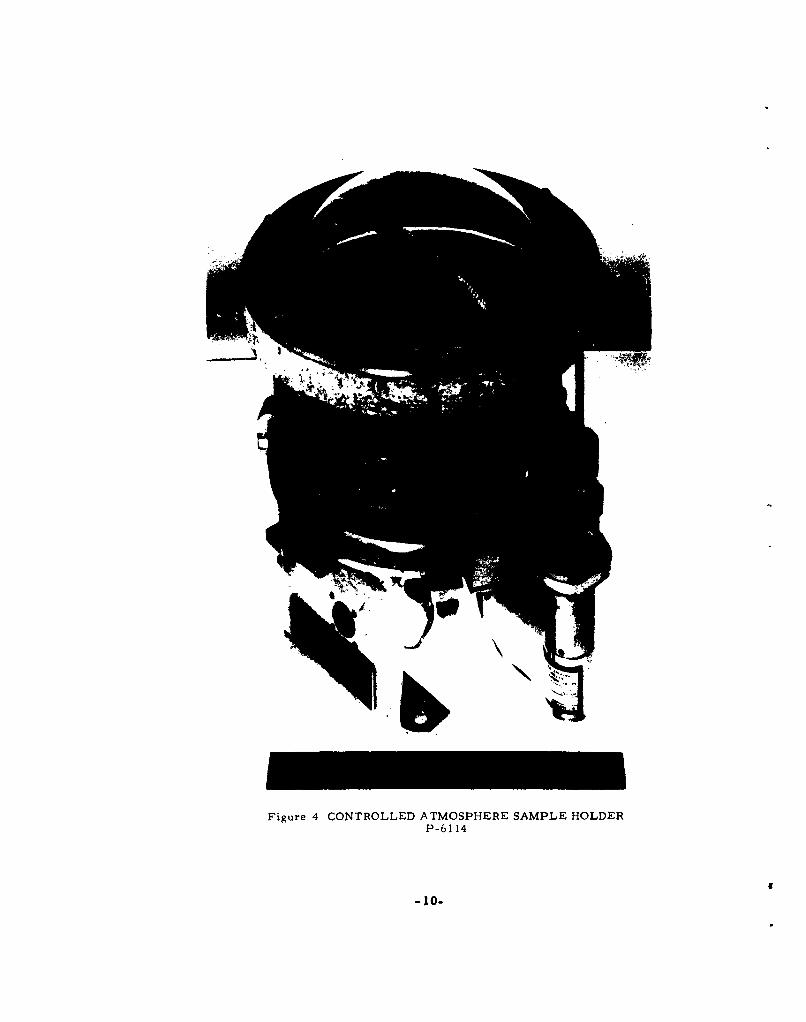
Figure 4 CONTROLLED ATMOSPHERE SAMPLE HOLDERP-61 14
-10-

5W w:5(r -jw a.ox
CL w
OU) U) -i -iwi J w 41U) 42 z:)w -i Q U)LLx i
OCLX w0 ý- w0
co
zw0 OW mC)z wcr
0 lw(rz lXw Ir5miloLL.4 1.ýCoz R 20 044 z 0,SaxUJ< u_j ir ý4CD Q 9
cr F-4
z < Uw w
(9 Ln
0
w
0jrw cr z XW!i x
> U)
U) 0-i cr cr
CAL w w
LL a
w be-i
w0
0
IL)
0 T) U.
5U) z
0-iz U.-j0 W41
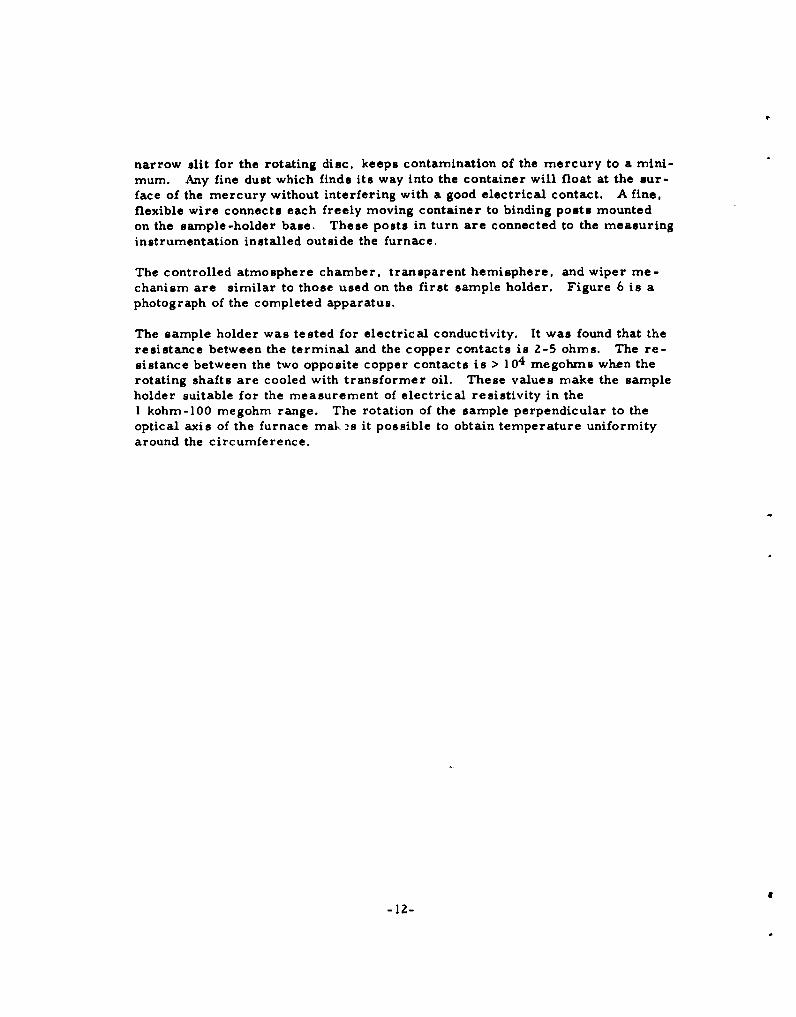
narrow slit for the rotating disc, keeps contamination of the mercury to a mini-mum. Any fine dust which finds its way into the container will float at the sur-
face of the mercury without interfering with a good electrical contact. A fine,flexible wire connects each freely moving container to binding posts mountedon the sample-holder base. These posts in turn are connected to the measuringinstrumentation installed outside the furnace.
The controlled atmosphere chamber, transparent hemisphere, and wiper me-chanism are similar to those used on the first sample holder. Figure 6 is aphotograph of the completed apparatus.
The sample holder was tested for electrical conductivity, It was found that theresistance between the terminal and the copper contacts is 2-5 ohms. The re-sistance between the two opposite copper contacts is > 104 megohms when therotating shafts are cooled with transformer oil. These values make the sampleholder suitable for the measurement of electrical resistivity in the1 kohm-100 megohm range. The rotation of the sample perpendicular to theoptical axis of the furnace malk 3s it possible to obtain temperature uniformityaround the circumference.
-12-
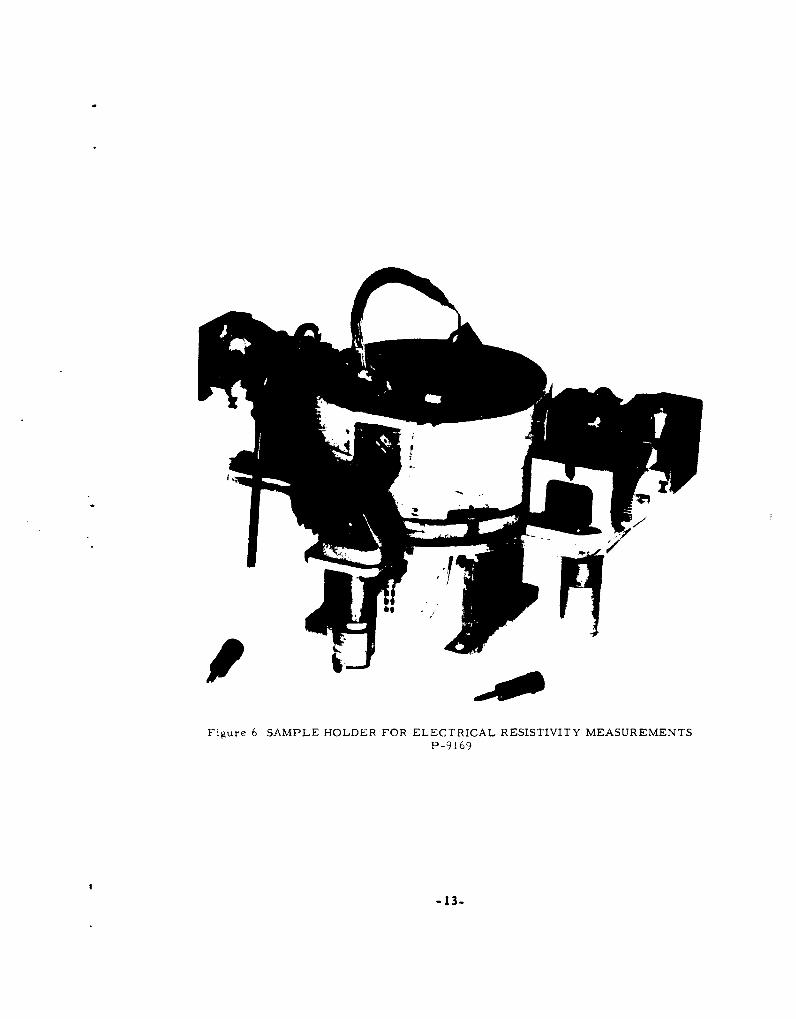
Figure 6 SAMPLE HOLDER FOR ELECTRICAL RESISTIVITY MEASUREMENTSP-9169
-13-

V. THE SHUTTER
In many image furnaces the intensity of the flux impinging on a specimen iscontrolled by a cylinder moving along the optical axis. For certain experi-ments, however, an instantaneous on-off flux control is necessary. Venetian-blind-type shutters are now in use on some furnaces 4 which combine the effectof flux attenuation and on-off control. A disadvantage of this mechanism isthat, even in the fully open position, it blocks the passage of radiation due tothe thickness of the slats and the support members which are needed.
A fast-action, on-off shutter has been designed, which does not cast any shadowon the reflector when in a retracted position. Figure 7 illustrates the mechan-ism of the shutter. The flux interceptor has a ribbed umbrella-like structurewhich is supported by a telescoping tube. In its retracted position the entirestructure is behind the mirror, and when not needed it can be swung away fromthe observation hole. It is extended by the application of compressed air andretracted by vacuum. In the center of the telescope structure, there is anothertelescoping tube, which permits observation of the sample during the entireoperation.
-14-

II
aw
U,
U
z
0U,
I.
-15-

VI. NEW GUIDANCE SYSTEM FOR SOLAR FURNACES
A new guidance system has been developed for solar furnaces. It has theadvantage of being lightweight, inexpensive, highly sensitive, and simple toconstruct, since off-the-shelf electronic assemblies of proven reliability areused. The system consists of three parts: (1) the sensing unit, (2) the con-trol unit, and (3) the drive motor as shown in figure 8. The sensing unit con-sists of four 1P41 phototubes mounted at the end of a 22-inch collimating tubehaving a 1-inch diameter orifice. As the furnace has an altitude-azimuthmounting, two phototubes are aligned parallel to the horizontal axis of rotationof the mirror, and two are mounted parallel to the vertical axis. A filter ismounted in front of the aperture to reduce the intensity of the light falling onthe phototubes. An opaque diffusor is directly in front of the phototubes toeliminate the effect of variations in cathode surface sensitivity. The entiresensing assembly is mounted on the furnace housing with the axis of the col-limating tube parallel to the optical axis of the paraboloidal mirror. Whenthe mirror is focused on the sun, an image of the aperture falls on the centerof the opaque diffusor and provides equal illumination to all four tubes. Anydeviation from perfect alignment causes the spot to move off center, and asa consequence unequal amounts of light to fall on the two opposite tubes, whichare part of the same circuit. This generates an error signal which is fed tothe control unit.
The control unit is composed of two identical -nodules, one to monitor andcontrol the altitude sensor and drive motor, ,<nd the other to monitor andcontrol the azimuth sensor and drive motor. Each module is a MinneapolisHoneywell Brown continuous balance un•it number 353170-3, with minormodifications to the input circuitry as shown in figure 8. The modificationis identical for both modules. The error signal from the paired phototubeschanges the intensity and, if necessary, the polarity of the current outputof the balance units. The modulated current is fed into two reversibleMinneapolis Honeywell-type 364949-1 motors which drive the furnace rotatinggears.
In use, the new guidance system proved to be highly satisfactory. It operateswithout any discernible backlash or deviation from the true position as observedon an optical indicator. Even when running for several hours, no manual ad-justment of the solar furnace was found to be necessary.
-16-

A AMPLIFIER MOTOR
110 VAC
I P41
B BROWN CONVERTER
12AX7 NO. I
2.2m 0 .. 252u f ..2 005p f
A1 ,K
51K -00/ 150/u. f
M 500
75 K 12AX7 N02
Figure 8 CIRCUITRY MODIFICATION ON MINNEAPOLIS HONEYWELL
BROWN AMPLIFIER 353170-363-2164
-1?-

VII. SOLAR REFLECTION COEFFICIENT MEASURING APPARATUS
In the consideration of reflection, absorption, and concentration of solar energy,the knowledge uf the solar reflection coefficient is of utmost importance. Thisoptical constant, however, is known only for few materials. 5 Further, thepublished data have two shortcomings. First, the values have not been measureddirectly, but rather calculated from spectral data using the weighted ordinatemethod in the integration for the solar spectrum. Second, the definition of thesurface, a very important parameter, is either completely missing or scantily
given at best.
An apparatus was therefore designed and built suitable for the direct measure-ment of solar reflection coefficients using solar radiation as light source. Adiagram of the apparatus is shown in figure 9. The measuring instrument is
a Hilger radiometer equipped with a collimating tube. In position "A" theradiometer is locked with a springloaded pin in such fashion that its optical axispoints at the sun. Thus, the normal incidence solar radiation is recorded.
Following this, the radiometer is turned around a pivot into position "B"looking at the sample at 5 degreeb off the optical axis. The sample in turn ismounted 5 degrees off the optical axis in the opposite direction. Accordingly,the radiometer in position "B" measures the solar radiation as reflected bythe sample. The ratio of the reflected radiation to the normal incidence solarradiation is the solar reflection coefficient. In use, the radiometer output isfed into a recording potentiometer. Since the radiometer can be turnedaround in a few seconds, one reflectivity measurement can be completed withintwo minutes, during which tinie the normal incidence solar radiation is con-stant under favorable weather conditi-ins.
The alignment of the radiometer, locking pins, sample holder, and pinhole
was made on an optical bench to insure accuracy. The entire apparatus wasthen mounted on the solar furnace in such manner that the optical axis of theinstrument is parallel with the optical axis of the solar furnace. As the solar
furnace automatically follows the apparent motion of the sun, solar radiationimpinges on the sample at exactly 5 degrees. Figure 10 illustrates the appa-ratus mounted on the solar furnace.
- 18-

z V zw
w0
14
0 O0
00
40.
4W
9c
-19-
zw/

0
z0
Ell
0
0
rz °
-200
HI
u
-20,0

VIIL A NEW METHOD FOR THE MANUFACTUREOF PRECISION REFLECTORS
Mirrors in most image furnaces currently in use have been constructed forsome other purpose. With few exceptions, either large paraboloidal mirrorsfrom surplus searchlights or ellipsoidal mirrors from motion picture projec-tors are used. These reflectors are generally of good quality but their greatestadvantage is their low cost. The fabrication of reflectors by conventionaltechniques specifically for use in image furnaces is prohibitively expensive be-cause they are not built in large numbers. Furthermore, the cost increases
greatly with a small increase in size. Finally, irrespective of the cost, therequired optical precision poses great technical difficulties for large reflectorfabrication. Thus, methods for the fabrication of inexpensive precise one-piece paraboloidal reflectors were sought. Several attempts were made earlierto solve the technical difficulties of fabrication at a moderate cost. 6 In theseattempts, however, use was made of the availability of a high-precision master.If one were not available the fabrication of the master would involve even moredifficulties and greater expense than that of the reflector. These processes,therefore, are justified only if a large number of identical reflectors are re-quired.
It has been found that two recently developed processes, when combined, canbe used for the fabrication of inexpensive, precise paraboloidal reflectors withany aperture up to 30 feet. The first process7 uses the principle that a liquidin a revolving horizontal pan takes the shape of a paraboloid. If a liquid resin,
mixed with a hardening agent is thus rotated, a precise paraboloid will be ob-tained after hardening. A modification of this method was applied in the follow-ing process which proved to be suitab1., for the fabrication of large, precise,
and inexpensive paraboloidal mirrors.
A 36-inch diameter aluminum dish, which had approximately the shape of thewanted reflector, was formed by spinning. The centerhole in the metal dishwas closed by a wooden plug flush with the inside surface of the metal, and thedish was mounted on a turntable which could be rotated at a precisely controlledangular velocity. A bubblefree mixture of a clear epoxy resin and hardener waspoured into the rotating dish enclosed in a dustfree atmosphere. The rotatingliquid mixture formed the surface of a paraboloid, its diameter being definedby a rim on the aluminum dish. The paraboloid had a focal length given by
1474f
(r p m)2
The rotation was continued until the resin hardened (approximately 24 hours).During the latter part of the hardening period radiant heat was applied to accel-erate the reaction.
-21-

The resulting paraboloidal dish had a very smooth, even surface with only a fewimperfections visible near the rim. The testing of the dish for geometrical per-fection was performed by an optical method illustrated in figure 11. A targetpattern consisting of a polar coordinate type graph paper was mounted at thefocal point of the paraboloid on three crossways in such a fashion that it couldbe positioned exactly on the three spatial axes. The target was illuminatedwith a slide projector placed behind the centerhole of the dish. A wide-angle-lens camera (focal length 19 inches) was located approximately 100 feet from thedish. The camera, the target, slide projector, and paraboloid all were alignedon the same optical axis. Photographs were then taken of the target as reflectedby the paraboloidal epoxy surface. The target diameter was much larger than thatof the focal area. Therefore, since the focus was well defined, it was necessaryto take several photographs with the target in different positions in relation tothe focus. Figures 12 and 13 showed the reflection of the target in the epoxy dishphotographed at different target-focus relative positions. Some optical distor-tion was visible on the upper right quadrant of the dish. This distortion indicatedsuch minor local surface inperfections which could not be detected by mechanicalmeans. This quadrant was not used during the successive preparation of thereflecting lining.
The conventional method used to make a reflecting epoxy resin surface consistsof the vapor deposition of a metal on it. This process requires a vacuum cham-ber large enough to accommodate the entire dish, a condition which might berestrictive in the case of large dishes. In addition, it is very difficult to obtaina metal coating which adheres well to the resin and provides a mirror-likefinish. Another process was used which is not limited by the size of availablevacuum chambers, and in which a highly reflective metal lining is bonded to theresin with an epoxy adhesive. It was necessary then to select that liner mate-rial which possesses a suitably high coefficient of solar reflection, durabilityof finish, and good forming characteri: tics.
The selection of materials was reduced to two: Alzak finished aluminum and aspecially treated, silver-plated copper. * Several tests were performed in orderto determine the resistance of the materials to atmospheric corrosion and ero-sion, and for an estimation of their expected durability as reflector surfaces.
Samples of both materials were subjected to a salt-spray test, the test facilityconforming to the requirements of MIL-E-5272. In this test, the sample wasplaced in a chamber where a finely atomized 18-22 percent sodium chloridesolution was circulated freely at 38* C for six hours. Both the silver and thealuminum samples passed this test with only a slight decrease in solar reflec-tivity as measured with the apparatus described in section VII. A second groupof samples was subjected to a sand and dust test conforming to the specificationsof MIL-E-5272. The test chamber was maintained at a relative humidity of lessthan 30 percent, and the sand and dust were circulated with an airstream of1800-2800 ft/min for one hour at 25° C, and then for one hour at 36* C. Thesand and dust concentration was 0. 1 and 0. 5 g/ft 3 , respectively. In this test thesilver failed completely while the aluminum showed only a moderate decreasein solar reflectivity.
"*Made by Foremost Manufacturing Co., Maplewood, N.J. -22-

L0
o * '
_U IJ4
Ia.
a,-I -

z
1Z4
EZ4
-24-

�Z4
V
- Z5-
In further test on the Alzak treated aluminum, samples have been exposed to thelaboratory and outside atmosphere, respectively, for 64 days. No deteriorationof the mirror finish was observed. Another aluminum sample was washed witha detergent and water 63 times without visible deterioration. The same sample,together with a commercial-grade aluminum alloy and a high purity aluminummetal was placed in direct contact with crystals of corrosive sublimate (HgCl 2 ).Within a few minutes, the two latter samples showed corrosion marks and,after 24 hours, deep corrosion pits. The Alzak finished sample did not showany sign of corrosion, even after 24 hours of contact.
Accordingly, the Alzak finished aluminum was selected for the fabrication made.First, a fiber-reinforced plastic casting was made of the most perfect sectionof the dish. Specially polished 0. 035-inch aluminum sheets, prepared for thiswork at the Alcoa Research Laboratories, were stretch-formed over the castingto obtain petals of the reflector. During the first attempt of stretch forming,the material became so hard it cracked before the desired degree of deformationwas reached. It was found that annealing at 445* F relieved the workhardeningwithout adversely affecting the mirror finish. After annealing, eight petalswere formed from these sheets and were handpolished in order to removestretch marks. Following this operation, the sections were Alzak-processedin a colorless electi'olyte for the formation of a corrosion-erosion resistantsurface. The sections then were trimmed to fit exactly the original epoxydish and bonded to it with an epoxy adhesive. During the hardening process thepetals were pressed into the original dish with a plastic male mold.
The completed paraboloidal reflector was mounted coaxially in the 60-inch solarfurnace for testing; figure 15is a photograph of the installation. A fast responseradiometer was mounted in the focal area, and the maximum flux in the solarimage was located by displacing the radiometer along the three spatial axesuntil a maximum signal was obtained. Following this, the radiometer was dis-placed along one of the axes until its output became zero, keeping its positionunchanged in reference to the other two axes. Then the radiometer was movedat a constant speed across the image along the same axis, and its output wasrecorded. The same procedure was followed for the other two axes. The re-sulting output signals are presented in figure 14. The left-right crossing wasmade at a higher normal solar incidence than the up-down and in-out crossings,resulting in a greater relative flux intensity. Some irregularity near the mirrorperiphery is indicated at the edge of the image, but the center portions show a
very regular Gaussian distribution. These results are borne out by visual ob-servations. The lines marking the edges of the individual petals are hardlyperceptible in figure 15, and the continuity of the image is preserved when itprogresses from one petal to an adjoining one. A slight distortion of the curvedimageline is visible at the peripheries.
-26-

LEFT-RIGHT
IN-OUTI-
LUP-DOWN
x-J
CALCULATED IMAGE DIAMETER CALCULATED IMAGEDIAMETER
0.28 cm 0.28 cm
0.39 0 0.39 0.51 0 0.51 0.41 0 0.41
IMAGE RADIUS, cm
Figure 14 FLUX DISTRIBUTION¶N 36 INCH PARABOLOID
-27-

z
F-z
C,
-28-

This reflector is the first one made according to this new process. It is expect-ed that the experience gained during its fabrication will make it possible to pro-duce reflectors to even better quality. Although 36-inch diameter reflectors ofgood quality are readily available from surplus searchlights, this size waschosen as the most convenient for testing the procedure. Facilities are avail-able at the fabricators for the production of such paraboloid mirrors up to 30feet in diameter.
-29-

IX. FLUX DISTRIBUTION
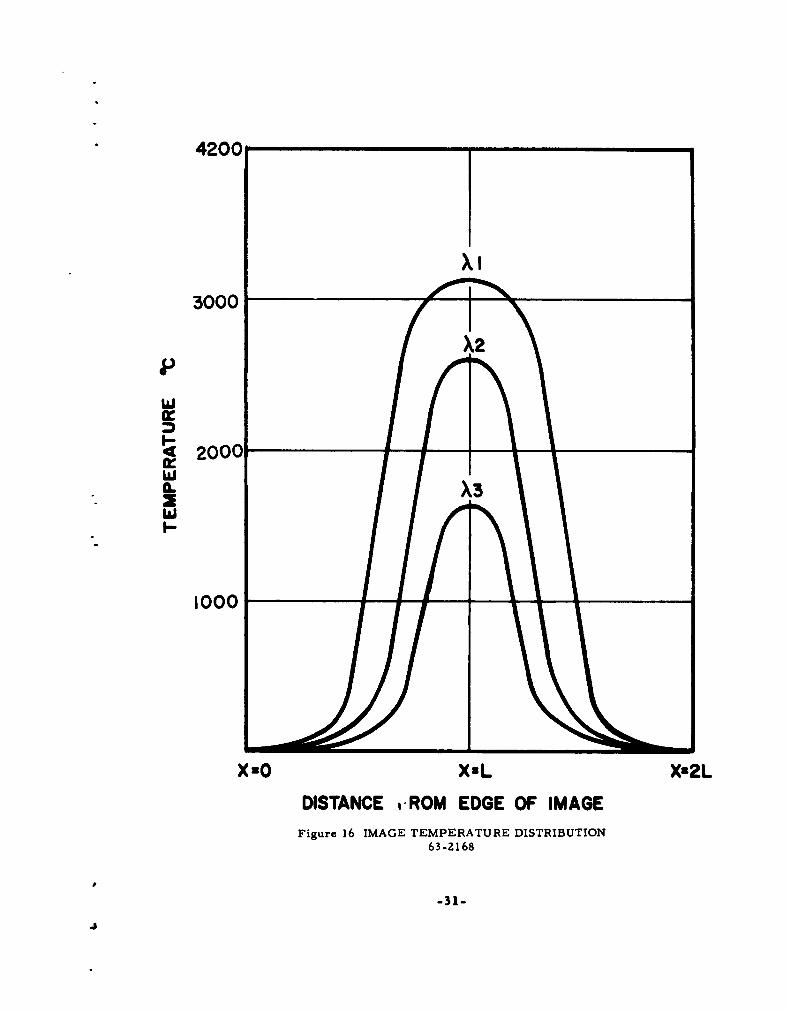
Regardless of the radiation source, the focal area in image furnaces is notuniformly irradiated. The flux distribution usually can be illustrated by a bell-shaped curve with its maximum located at the center of the focal area (figure 16).When flux of such distribution impinges on a sample, a corresponding tempera-ture distribution is generated. Thus, when a mechanical, physical, or chemicalproperty of a sample is measured, it is possible to obtain only one value for theentire temperature range. Such a value has little, if any, definitive meaning sofar as the temperature dependence of the property is concerned.
One possibility of overcoming this problem is to reduce, or preferably to com-pletely eliminate the flux (temperature) differences through the use of opticalelements. The most direct (and most difficult) approach consists of designingsuch a nonparaboloidal, compound curvature concentrator which delivers auniform flux to the focal area. The only known effort in this direction is asmall aluminum reflector built in the U. S. S. R. 8 It consists of aluminum stripsarranged radially and narrowing down from the periphery to a circular piece atthe center. It is claimed that this reflector gives a fairly uniform temperaturedistribution. No information, however, is available on how uniform the flux isand the amount of the loss in the maximum obtainable flux.
A second optical method9 uses a kaleidoscope-type system placed in front of thesample. The system, consisting of a mirror-walled tube, receives the unevenflux from the reflector and, by multiple reflections, redistributes it to a welldelineated even flux in the image area. The flux variations are less than* 5 per cent; and it is possible to adjust the size of the image, within limits, toparticular requirements. The main disadvantage of this method is the fact thatit greatly reduces the obtainable maximum flux, thus wiping out one of the mostimportant advantages of image furnaces. In addition, approximately 50 percentof the total energy is lost in the redistributor.
A new method developed during the present investigation does not alter the unevenflux distribution, and thus does not reduce the maximum obtainable flux. In-stead, this method makes it possible to interpret the measurements made withthe uneven flux (temperature) distribution as if the results would have been ob-tained with a preselected narrow temperature range.
The method consists of measuring the property with the uneven but knowntemperature distribution. Following this, a second measurement is made afterthe temperature maximum has been altered by a preselected value. The chang-ing of the temperature peak, followed by a measurement of the property, isrepeated until the entire desired-temperature range is covered. From the re-sults of these measurements the temperature dependence of the property iscalculated.
-30-
4200
XI
3000
LXu
2000
LX3
1000
Xa0 XaL Xz2L
DISTANCE 'ROM EDGE OF IMAGE
Figure 16 IMAGE TEMPERATURE DISTRIBUTION63-2168
-31-

In an image furnace it is possible to change the maximum temperature by varyingthe position of the flux attenuator. The different temperature distributions as afunction of the image diameter are illustrated in figure 16 where 2L is the dia-meter of the image. Let this family of curves be represented by
T = 4, (x ,A) (i)
where x is the distance from the edge of the image and 4(x,A) the temperaturedistribution.
The measured property per-unit-length at temperature T is denoted by R(T) .The total value of the property of the sample at a given temperature distributionis
R 2 f R(T) dx (2)
0
or
L
R 2 R 1 (,A) I, dx (3)
This is an integral equation relating th desired function R(T) to the temperaturedistribution 6(x, A) and the measured total value of the property R(A). Sincethe function 6 (z, A) is determined graphically, a numerical method of solutionfor R(T) is proposed.
If it is desired to determine R(T) for intervals of 300' C, at least 10 valuesare needed to cover the entire temperature range of 3000' C. This necessitatesthe measurement of 10 iT(A) values, one for each 300' C interval between tem-perature maxima. Ten temperature distribution curves, depicting T = (x, A)for the same intervals also are required. If R(T) changes rapidly with temper-ature, the intervals may be decreased and the number of measurements in-creased in order to improve the accuracy of the method.
On the temperature-distribution curves, horizontal lines are drawn correspond-ing to the specified temperature brackets, e. g. , at T1 = 600' C, T2 = 900' C
... T 0= 3300 C. The intersection of each line with each 4(3x,A) curvedetermines a set of x and A values. It then follows that the integral (3) can beapproximated by the finite sum.
-32- '.

1/2 R(A) - R (TO)(XI -Xo) + R (T2)(X 2 -X 1 ) (4)
...... R (TI 0 ) (X 1 0 - X9 )
or
10
R (A) = 2 R (T ) (X( - X 1 )5)T (X -Xii-I
Where 2Ti =Ti T_ 1 , X0 0 and TI0 is the maximum temperature obtainedduring the measurements. Consequently X10 = L.
From the 10 equations like (5), obtained for 10 different A it is possible to deter-mine the 10 unknown (Ti ) values. The resultant values for R (T) are plottedversus T, and a smooth curve is drawn from which values for R can be read offfor each temperature interval, in this case 300 C.
In carrying out the experimental part of this method, it is important to deter-mine accurately the temperature distribution of the sample placed in the imagearea as shown in figure 16. It is necessary not only to control the maximumtemperature at the center but also the temperature at the coolest part of thesample. For this reason the sample holder designed for this method has liquid-cooled clamps in direct contact with the sample. The sample is a very thin rodand, accordingly, the only temperature distribution is lengthwise.
-33-
.,,

X. NEW SHAPE BLACKBODY
The high heat fluxes encountered in image furnaces are usually measured withcalorimeters or with radiometers calibrated with calorimeters. Several water-cooled calorimeters have been designed which are suitable for use in imagefurnaces. 0 These calorimeters employ a spherical cavity as an artificial black-body to absorb the incident radiation.
The problem of finding the optimum shape for an artificial blackbody has beeninvestigated extensively. Buckley I I studied the radiation from the inside of acircular cylinder. He derived an expression for the radiation from an annulusto any other annulus in a cylinder of infinite length taking into account multiplereflections. He then applied the same method to the case of a finite, uniformlyheated cylinder and obtained an approximate solution. Finally, he adapted themethod to the problem of a uniformly heated finite cylinder closed at one end,a shape which closely approximates some artificial blackbodies being used inoptical pyrometry.
One of the most interesting results of his work is the relationship between cylin-der length and orifice radius. This shows that if the emissivity of the cylinderwall is 0. 75, a cylinder length/orifice-radius ratio of 3. 8 gives radiation inten-sities within 1 percent of blackbody radiation. This ratio decreases rapidly asthe emissivity of the wall increases, with the result that, for materials of highemissivity, the length of the cavity can be greatly reduced without reducing theorifice radius as well.
GouffA compared the sphere, the cylinder, and the conc in his search for theoptimum artificial blackbody shape. 1 2 He based his comparison on the valueL/R, where L is the length of the blackbody and R is the radius of its orifice.From these data, he calculated the total surface area of the cavity S and thesurface area of the orifice s. The ratio s/S then expressed the relative valueof the cavity as a radiant-energy trap. It should be pointed out that in his cal-culation, S includes the area of the orifice s, which is not an absorbing surface.A more exact expression for the evaluation of the cavity would be s/S-s. Theshapes considered by Gouff are shown in figure 17 a, b, c.
During the present investigation, a new shape for artificial blackbodies wasconceived, consisting of a truncated right cone with the smaller end as theorifice. The bottom of the cavity is a right circular cone (figure 17 d). In acavity of this shape, only a very small fraction of the total area "sees" theorifice perpendicularly and, accordingly, losses due to reradiation are low.
Gouffe's method of evaluation has been applied to this shape. The results, to-gether with Gouffe's data for the shapes he has considered are presented intable I.
-34-

IT
2r 2r
(a) (b)
Sr 2R 2r
(c) (d)
Figure 17 ARTIFICIAL BLACKBODY SHAPES60-2633
-35-

TABLE I
COMPARISON OF ARTIFICIAL BLACKBODY SHAPES
L/R s/S s/S - s/So t
Double DoubleSphere* Cylinder* Cone* Cone** Cylinder* Cone* Cone**
1 0. 500 0. 250 0. 415 0. 175 -0. 250 -0. 085 -0. 325
2 0. 200 0. 167 0. 309 0. 094 -0. 033 +0. 109 -0. 106
3 0. 100 0. 125 0. 241 0. 059 +0. 025 +-. 141 -0. 041
4 0.059 0. 100 0. 195 0. 041 +0. 041 +0. 136 -0. 018
5 0. 039 0. 083 0. 164 0. 030 +0. 044 +0. 125 -0. 009
6 0.016 0.056 0. 111 0. 015 +0.040 +0.095 -0.001
*Shapes Considered by Gouffe**Shape Proposed by Present Investigation
t Comparison of Shapes with Sphere (s/So)
-36-

From the table, it can be seen that if the L/R ratio is greater than 2, both thecylinder and the cone are inferior to the sphere as indicated by the s/S value.The double cone shape, however, results in an s/S value which is more favorablethan that for the sphere, even for L/R ratios as high as 8. Such a high L/Rratio is required only if the emissivity of the wall is as low as 0. 25, an unlikelychoice for the cavity material.
The s/S ratio, however, does not express perfectly how closely a cavity approxi-mates the radiation characteristics of a blackbody. The effect of multiple re-flections must be considered in order to determine what fraction of the radiationentering the cavity will escape from it after many relections from its walls.Therefore, using an analytical approach, a set of integral equations was developed.The equations determine the effective emissivity for an almost blackbody by con-sidering every point of the cavity as both a receiver and an emitter of radiation.The body under consideration is depicted in figure 18.
The letters s,, Si . and Sp, respectively, denote the following surfaces of the body:
So - outer conical surface.
Si inner conical surface.
S - plane surface of aperture.
The equations for the three surfaces are given as follows:
So: R2 + y2 = a2 _2 (a-fixed)
h > z > ho (ho-fixed) (6)
Si: x2 + y 2 = b2 (z -h) 2
h > z > h
b - ah/(h - h1) (7)
SP: z = ho
,2+y2 < r a2 h 2 (fo - fixed) (8)
These equations are transformed into cylindical coordinates with the parameterspand 0.
-37-

z
Sz =hCONEI
I ' =h
APERTURE- I II z=h 0
Figure 18 NEW SHAPE BLACKBODY63-2344
-38-
4.

A source of light is located on the axis of the body in such a manner that thecone of light formed by the aperture has a semivertical angle of 70 degrees.The problem then is to determine the ratio of the energy which comes out ofthe body through Sp to the energy entering it, taking into consideration themultiple reflections in the cavity.
The assumption is made that the walls of the cavity reflect perfectly diffusely(i.e. , all surfaces have constant radiance); then 1 3
S
SdA+ H H(p,0) r(p,0)(-R a) )(R "n) -dA9
S(9)whe re
H (p,) irradiance at point (p, 0) due to the primary beam without anyreflections,
H(p, 0') = irradiance at point (p',O') caused by the reflected flux,
r (P.O) = total reflectance at point (p, 0),
= unit normal at point (p ,0 ) of surface,
= unit normal at point (p',Od') of surface,
R = position vector from point (p, 0 ) to point (p',O').
The reflectivity r(p,O) is zero on the aperture SP and is constant on surfacesS, and Si.
As the cavity is made up from the three different surfaces So , S. , and SP , thekernel function K( p, O,p,"O') = (-R.n) (R. n')/'4, will have different representationsaccording to which pair of surfaces the points (pO) and (p',O') correspond to.
This expression assumes that any point of the surface can be seen from anyother point on the surface. This, however, is not the case. Accordingly, theequation must be first integrated over the whole surface and then the shadowedsurface, i. e., that portion of the surface which cannot be seen from the point(p',O') must be subtracted from the integral. Because of the axial symmetry,H(p', 0') is independent of 0 and thus can be integrated out of the kernels. Thefollowing three sets of equations express the solution of the problem as givenfor both the shadowed and unshadowed portions of the cavity.
-39-

w1 Ho (P') =f {J ýo P+ (lK 0dahfi(p) , H0 (p)'j K~d + dp (10)a h 0ah
(Unshadowed Case)
where Koi denotes the kernel function K when point (p') is an element of So[ i.e., (p') eso and (p)t$i and similarly for the other K's].
ir-I Ho (P') = Ho (p)+ k.o(P)) jK'o - K ýd H p + I~ (p) K ' dp (11)
o
(Shadowed Region)
ah
lnr-IHi(p') = f Ho(P) + o(P)} {Kio + Kio + Kio + K io•' dp (12)
ah ah
ir r 1 Hp (p') =] {Ho (p) + H (p)} Kf~0 dp +f H (p) + H- pf Kpi dp (13)
0
The set of expressions were programmed for the Philco S-2000 high-speed com-
puter. As a check of the theory and the correctness of the programming, nu-merical data were substituted for the hypothetical case of a blackbody with awall reflectivity of unity. Since, in this case, the radiation incident in the black-body is completely reflected whenever it hits the walls after multiple reflections,
-40-
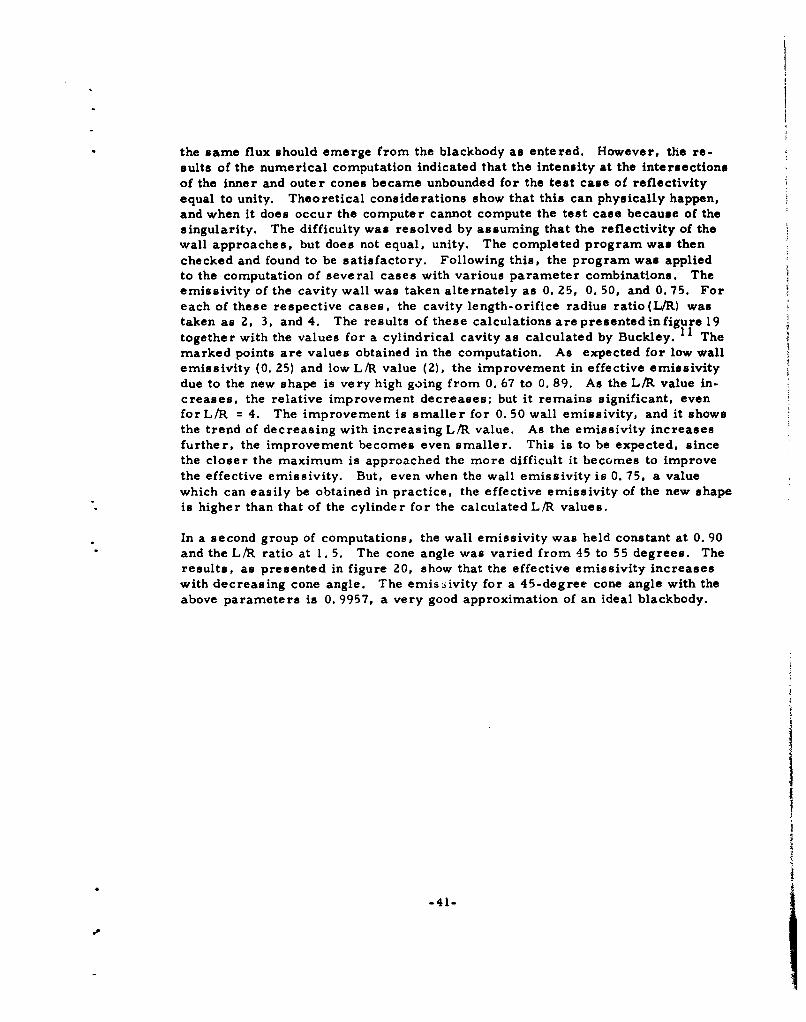
the same flux should emerge from the blackbody as entered. However, the re-sults of the numerical computation indicated that the intensity at the intersectionsof the inner and outer cones became unbounded for the test case of reflectivityequal to unity. Theoretical considerations show that this can physically happen,and when it does occur the computer cannot compute the test case because of thesingularity. The difficulty was resolved by assuming that the reflectivity of thewall approaches, but does not equal, unity. The completed program was thenchecked and found to be satisfactory. Following this, the program was appliedto the computation of several cases with various parameter combinations. Theemissivity of the cavity wall was taken alternately as 0. 25, 0. 50, and 0. 75. Foreach of these respective cases, the cavity length-orifice radius ratio(LUR) wastaken as 2, 3, and 4. The results of these calculations are presented infigure 19together with the values for a cylindrical cavity as calculated by Buckley. 11 Themarked points are values obtained in the computation. As expected for low wallemissivity (0. 25) and low L/R value (2), the improvement in effective emissivitydue to the new shape is very high going from 0. 67 to 0. 89. As the L/R value in-creases, the relative improvement decreases; but it remains significant, evenfor L/R = 4. The improvement is smaller for 0. 50 wall emissivity, and it showsthe trend of decreasing with increasing L/R value. As the emissivity increasesfurther, the improvement becomes even smaller. This is to be expected, sincethe closer the maximum is approached the more difficult it becomes to improvethe effective emissivity. But, even when the wall emissivity is 0. 75, a valuewhich can easily be obtained in practice, the effective emissivity of the new shapeis higher than that of the cylinder for the calculated L/R values.
In a second group of computations, the wall emissivity was held constant at 0. 90
and the L/R ratio at 1. 5. The cone angle was varied from 45 to 55 degrees. Theresults, as presented in figure 20, show that the effective emissivity increaseswith decreasing cone angle. The emis iivity for a 45-degree cone angle with the
above parameters is 0. 9957, a very good approximation of an ideal blackbody.
-41-

I I I ! I I I "1 I I I I I I I I I')
.C4
• NSO0 N _-C
0 0
\ , ItJ ,
o "
00
I0I \\I '
Iz
0
0',
I I , I I I I I I I I I I I I I I
0 0 ~d d d 0 d (0 1 o 0 0 1 N 0 0 d
AIIAISSII43 3AIi0313
-42-
-i
0~It)
z
0
P0
La nu1- 10
z0 0
00-
o of
o 0lo
AJ.IAISSIVI3 3AI±D3AA3
-43-

XI. CALORIMETRIC AND RADIOMETRIC MEASUREMENTS
A. CALORIMETRY
A water-cooled calorimeter has been constructed using an adiabatically installedabsorbing cavity of the new shape. The calorimeter is mounted in the focal areaof the solar furnace, and the concentrated radiant flux enters through a well-defined orifice. The radiant energy is absorbed by the cavity walls, and theheat thus generated is transmitted to distilled water passing through the water-jacket of the cavity at a controlled and measured rate of flow. The resultantwater temperature rise is measured with differential thermopiles. The massof the water and the elapsed time is also measured. From these data, the totalamount of radiant energy entering the cavity can be calculated. A block dia-gram of the experimental set-up is shown in figure 21.
The normal incident solar radiation is concurrently measured with an Eppley
normal-incidence pyrheliometer mounted directly on the solar furnace parallelwith its optical axis. The time and length of each calorimetric run is recordedon the normal-incidence chart, thus synchronizing the two measurements. Fromthese data, the radiant-energy flux-per-unit normal-incidence solar radiation(Ly/min) is calculated. Several hundred such flux measurements have beenmade in the 60-inch solar furnace. Some of the results of these measurementsare presented in table II. In this table, the flux-controlling screen position isindicated on an arbitrary linear scale. At the maximum flux the deviation fromthe average is * 3. 7 percent. The average flux values have been plotted againstthe screen position in figure 22.
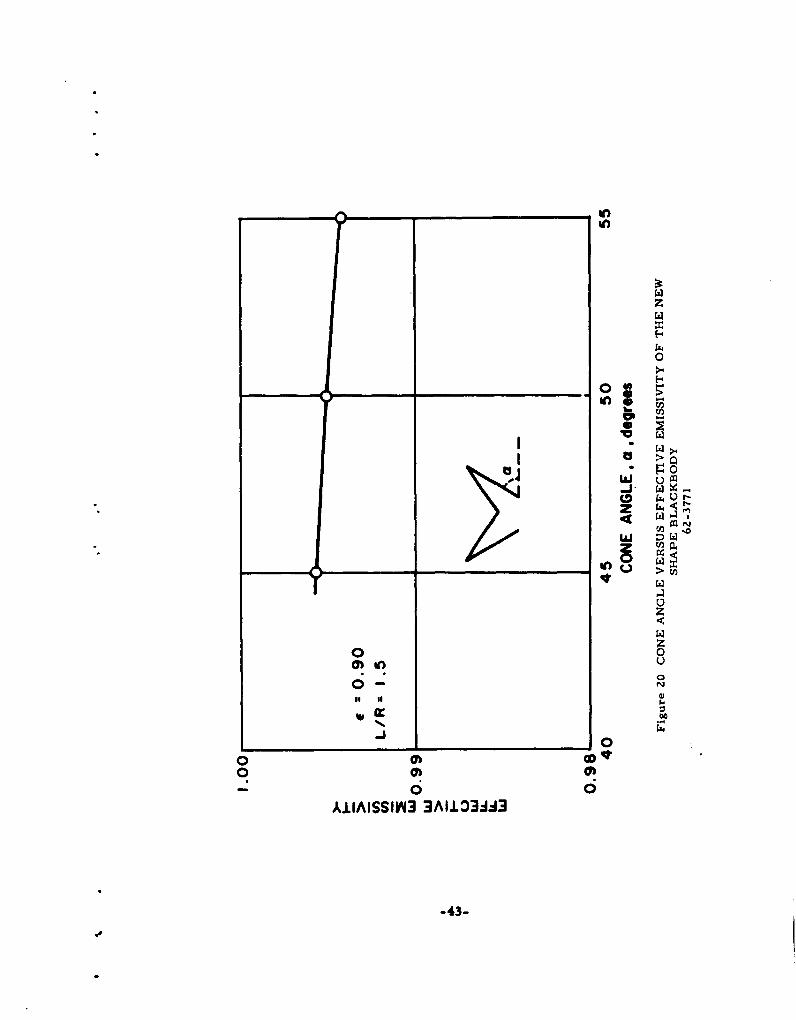
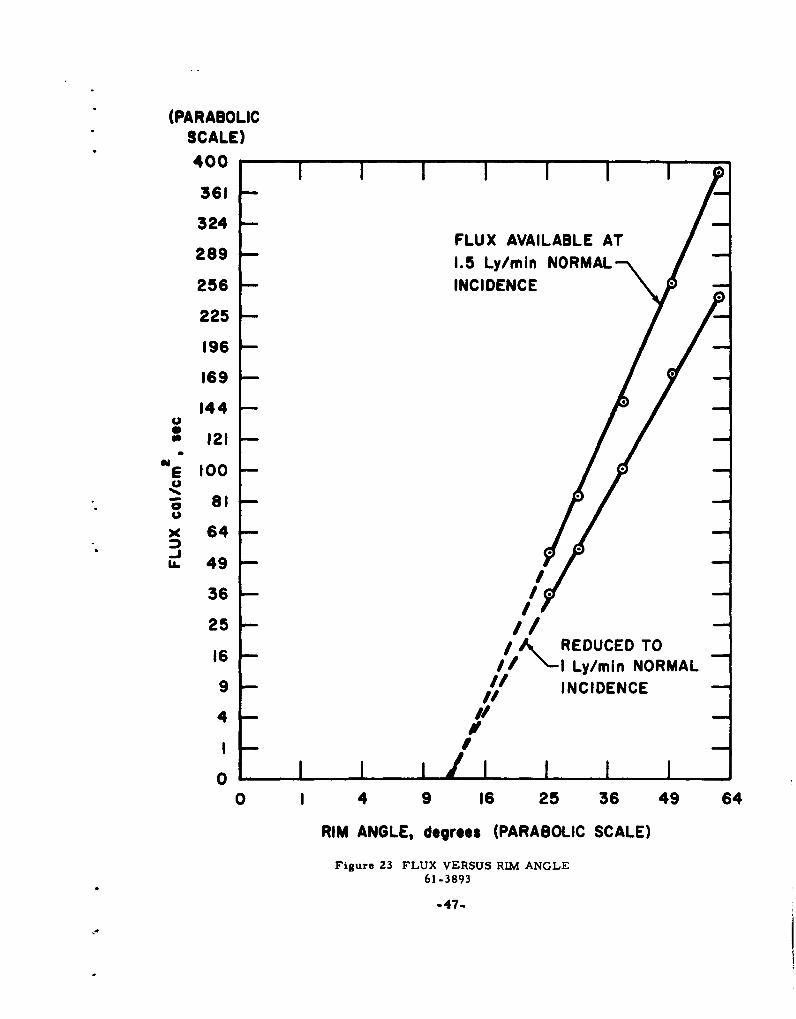
The shape of the resultant curve is seen to be suggestive of that of a parabola.Accordingly, the curve was plotted using a parabolic scale on the ordinate. At
the same time the abscissa linear scale of the flux-controlling screen waschanged to the more meaningful effective rim angle of the mirror. The resultof this plot is shown as the lower curve in figure 23 for unit Ly/min normal in-cidence.
These results prove the direct relationship between normal incidence solarradiation intensity and the concentrated flux at the image area. Thus, by measur-ing the normal incidence solar radiation the average flux value at the focal areacan be obtained through the use of the above correlation. The flux is continuouslyvariable from 35 to approximately 360 cal/cm2 - sec depending on the normal-
incidence solar radiation and on the position of the flux-control screen. Becauseof this well-defined correlation, the solar furnace can be used as a high-intensityradiation standard with a maximum average flux of 360 cal/cm 2 - sec * 3.7 per-cent, a value superior to any thermal radiation standard known to be available.
-44-

wJ -J W -
wo w
IL0Iw
I.-.
I -w-J (
Z 0
1MW 4- M~ Z
-ow
00CD OD
-45.40

250
20C
S150
"E
z2I,-
w
x-Jbc
50
OO 10 20 30
FLUX ATTENUATOR POSITION (cm)
Figure 22 FLUX VERSUS ATTENUATOR POSITION IN THE SOLAR FURNACE61-5017
-46- 1.
(PARABOLICSCALE)
400
361 -
324 -FLUX AVAILABLE AT
289 -1.5 Ly/min NORMAL
256 - INCIDENCE
225 -
196 -
169 -
144 -U
121
E 1006 81 .--
x 64
S49 -
36 --
25 -
16 -/, REDUCED TO1/ '-I Ly/min NORMAL
9 - INCIDENCEI'
' - V0 I I I I I I I I
0 4 9 16 25 36 49 64
RIM ANGLE, degrees (PARABOLIC SCALE)
Figure 23 FLUX VERSUS RIM ANGLE61-3893
-47-

TABLE II
FLUX VERSUS SCREEN POSITION MEASURED IN THE AVCO RAD60-INCH SOLAR FURNACE (NORMALIZED TO I LY/MIN NORMAL-
INCIDENCE SOLAR RADIATION)
Screen Position 0.5 cm 6.5 cm 12. 8 cm 18. 1 cm Full Out
Flux values (cal/cm2 .sec) 34.08 53.91 96.46 168.59 235.9434. 16 54.44 97.27 168. 92 237.2334. 18 54.50 97.45 169.47 238. 1034. 35 55.30 97. 59 169.65 239.6634.59 55.51 97.69 170. 30 240.4234.62 55.63 97.78 170.46 241.2834.67 55.66 98. 35 170. 51 241. 3335.00 55.69 98.51 171.04 241.5035.02 55.83 98.90 171.43 241.6835.05 55.94 99.06 171.43 241.9935.14 55.95 99.09 171. 56 242.4635.27 56.21 99.55 171.59 242.7435.31 56.36 99.62 171.79 243.3135.48 56.44 99.99 171.98 243.4235.49 56,53 100.18 172.39 244.9635.59 56.56 100.76 173.03 245. 1235.61 56.61 102.23 173.04 245. 1335.69 56. 84 102.27 173. 24 245.6035. 85 56.96 102.33 173.49 246.3135. 87 57. 20 103.07 173.76 246. 4535.90 57.26 103.12 174.47 247.2135.93 57. 34 103. 15 174.61 247.4635.93 57. 41 103. 16 174.63 247.6335.96 59. 25 103.24 174. 88 247.7236.02 59.48 103.44 175.49 248.0136.07 59.90 104.07 175.70 248. 1636.16 60. 32 104. 35 175.71 248. 7236.18 60.75 105. 88 177.92 249.0936.44 61.02 178.57 249.4936.48 61.72 179.21 249.7436.69 251.3636.81 251.5136.82 251.8337.07 252. 4237.08 253.8637. 13
Average flux value 35.67 57.08 100.63 172.96 245.40Deviation from the average (%) *4.4% *6.8% *4.6% *3.1% *3.7%Median flux value 35. 85 56.55 100.09 172. 71 245.60Deviation from the median (%) *4.2% *6.9% *4.8% *3.1% *3.7%
-48-

The results of the flux measurements have been scrutinized as to the possibleeffects of experimental conditions (table III). Flux values measured at 25-de-gree, 24-minute rim-angle screen position are arranged in calendaric order.The measured flux appears to be independent of the variations in ambient tem-perature, large though they were. During this time, the mirror of the solarfurnace was frequently exposed to outdoor corrosive agents and was washedevery two or three weeks. No decline in flux values indicative of deteriorationof the mirror surface was apparent.
Table IV represents flux values measured at the effective 61-degree, 22-minuterim-angle screen position at various solar incidences. From these data it isapparent that the flux values, reduced to I Ly/min normal incident are inde-pendent of the actual value of the normal incidence. In table V the results offlux measurements taken at 49-degree, 46-minute rim-angle screen positionsare shown, together with the various waterflow rates of the calorimeter. Asexpected, changes in waterflow rate do not affect the results of the calorimetermeasurements.
These considerations appear to prove that the flux in a particular solar furnacedepends only on the normal-incidence solar radiation and the position of theflux-control mechanism (or active rim angle of the mirror). The maximum ob-tainable flux is defined by the normal-incidencu solar radiation at the time ofthe experiment. Any flux value below this can be obtained by the adjustment ofthe flux-control mechanism.
Once the correlation between normal-incidence solar radiation and the concen-trated flux has been determined for a particular furnace, it can be used to pro-duce a flux of known value up to the maximum obtainable. The reduced fluxvalues, as presented in table II and figure 22 are multiplied by the actual value
of normal-incidence solar radiation. Thus, a correlation is obtained betweenthe actual flux at the focal zone and the position of the flux attenuator. An ex-ample of this is presented in figure 23, where the upper line represents theactual flux values for a normal incidence of 1. 5 Ly/min, the highest valuemeasured thus far at the furnace location. This same procedure can be used
for any other normal incidence of solar radiation.
It is interesting to note that the two lines intersect the abscissa at the samepoint. This point represents that rim-angle mirror section which produces
zero flux (11 degrees, 58.8 minutes). Accordingly, it can be assumed that allcauses of fixed flux losses, such as the shadow cast by the sample holder,mirror cut-out, and so forth, are contained in a paraboloid of Il-degree,58.8-minute rim angle. This method can be used for the experimental deter-mination of such losses of image furnaces.
-49-

TABLE III
FLUX MEASURED AT DIFFERENT TIMES OF THE YEAR
Flux* Flux(cal/cm2 - sec) Date (cal/cm2 - sec) Date
34.08 3 Oct 35.85 18 Nov34. 16 4 Oct 35.87 5 Oct34. 18 24 Aug 35.90 15 July34.35 4 Oct 35.93 18 Nov34.59 3 Oct 35.93 18 Nov34.62 24 Aug 35.96 5 Oct34.67 24 Aug 36.02 15 July35.00 4 Oct 36.07 15 July35.02 7 Oct 36.11 12 Jan35.05 18 Nov 36.16 7 Oct35. 14 18 Nov 36.18 18 Nov35.27 7 Oct 36.44 15 July35.31 7 Oct 36.48 15 July35.48 12 Jan 36.69 5 Dec35. 49 7 Oct 36. 81 26-Sept35. 59 3 Oct 36. 82 26 Sept35.61 12 Jan 37.07 26 Sept35.69 3 Oct 37.08 5 Dec
37.13 5 Dec
*-Flux values reduced to 1 Ly/min normal incidence. Measure-ment taken with a 25-degree, 24-foot rim angle.
-50-

TABLE IV
FLUX MEASURED AT VARIOUS NORMAL SOLARINCIDENCE VALUES
Flux Normal Incidence Flux Normal Incidence(cal/cm-sec) (Ly/min) (cal/cm2 -sec) (Ly/min)
235.94 1.33 245.60 0.98237.23 1.31 246.31 1.07238.10 1.35 246.45 1.13239.66 1.13 247.21 1.12240.42 1.30 247.46 0.90241.28 1.27 247.63 0.94241.33 1.30 247.72 0.92
241.50 1.30 248.01 1.30241.68 1.02 248.16 1.10241.99 1.27 248.72 1.08242.46 1. 14 249 09 1.29242.74 1.14 249.49 1.27243.31 1.14 249.74 0.85
243.42 1.28 251.36 1. 26
244.96 1.29 251.51 1.26245.12 1.27 251.83 1.08"245.13 1.12 252.42 1.26
253. 86 0. 86
*Flux values reduced to 1 Ly/min normal incidence. Measurements takenwith a 61-degree, 22-foot rim angle.
-51-

TABLE V
FLUX MEASURED AT VARIOUS WATER FLOW RATES
Flux* Water Flow Flux Water Flow(cal/cm2 -sec) Grams/min (cal/cm2-sec) Grams/min
168.59 571.1 173.03 447.2168.92 470.4 173.04 548.4169.47 473.6 173.24 470.0169.65 561.6 173.49 462.4170.30 433.7 173.76 462.7170.46 448.4 174.47 549.5170.51 559. 8 174.61 549.3171.04 561.6 174.63 468.5171.43 462.0 174.88 558.2171.43 440. 1 175.49 555.1171.56 440.4 175.70 467.8171.59 402.5 175.71 566.2171.79 470. 3 177.92 550. 1171.98 461.7 178.57 555.5172.39 462.8 179. Zl 559.9
*Flux values reduced to 1 Ly/min normal incidence. Measure-ments taken with a 49-degree, 46-foot rim angle.
-52-
a.

B. RADIOMETRY
Calorimetric measurements yield an average value for the flux across the en-tire orifice. The flux, however, is not uniform; it shows a very sharp peak atthe center of the image. In order to measure the flux distribution with fineresolution, a radiometer is needed which has a small sensing area, and whichcan be moved across the hot zone without damage. The only fast-response in-strument available with the necessary characteristics for the measurement ofhigh-heat fluxes encountered in solar furnaces is the modified Gardon radiome-ter. 14 It consists of a water-cooled, copper-constantan thermocouple, the con-stantan being in the form of a thin, circular foil. This instrument has a fastresponse (60 percent of signal reached in 0. 02 sec) and a fine resolution (sens-ing disc diameter is 0.899 mm). However, thc carbon camphor-soot coatingof the disc, as supplied by the manufacturer of the instrument, has two majordeficiencies: (1) its emissivity is not constant above 270 C, and (2) it tends toburn off in the presence of oxygen when exposed to high heat fluxes.
It was proposed that a solution to this problem possibly can be found by replac-ing the carbon coating with one of magnesium oxide and, therefore, an experi-mental program was begun to verify this. While the emissivity of MgO is muchlower than that of carbon, the coating is very stable for all flux values underconsideration, even in oxidizing atmospheres. It has been reported 1 5 that thereflectivity of MgO changes with time. This aging effect was attributed to thedecomposition of magnesium nitride traces under the influences of ultravioletradiation. It was assumed that the traces of magnesium nitride are formedwhen MgO is deposited by burning magnesium in air. This assumption was
proved by the generation of ammonia gas on contact of the product of combus-tion with water. However, the nitride was converted to the oxide shortly afterthe freshly coated radiometer was exposed to the high-heat flux in the solarfurnace. This was observed as the sensitivity of a freshly coated radiometerdecreased during the first few minutes of exposure but became stable after
approximately 10 minutes. Accordingly, before a freshly coated radiometerwas used for measurements, it was "baked out" at maximum heat flux for
10 minutes. Another advantage of the MgO coating over the carbon coating isthe fact that an old, contaminated coating can be easily removed with water anda new coating quickly applied.
Although the sensitivity of the radiometer can be calculated from the dimensionsof the sensing disc, 16 the instrument has to be calibrated for precise measure-ments. The flux in the image area is known from the calorimetric flux measure-ments as outlined in section A above. These values, however, represent anaverage across the entire .mage as the orifice of the calorimeter cavity is ap-proximately the same size as the image, The diameter of the radiometer sensingdisc is approximately one-tenth that of the image diameter. Therefore, anysingle reading of the radiometer cannot be equated with the average flux valuedetermined calorimetrically.
-53-

This difficulty was overcome by the following method: the radiometer wascoated with MgO and baked out. The instrument was then positioned at the exactcenter of the focal area and moved across the image along the horizontal axis.Its emf output was recorded and its position relative to the center of the imagewas indicated on the emf record chart. Five crossings were made for eachreading and the average values were used in the calculation. Five to 10 read-ings were taken for each coating in order to establish the stability of the sensi-tivity.
A typical record thus obtained is the bellshaped curve on figure 24. In thisgraph the abscissa is the image radius in cm with the 0 at the center of theimage, and the ordinate is the radiometer emf output. The problem now is re-duced to finding the flux equivalent of the recorded emf values.
Superimposed on the bellshaped curve is a rectangle (striations running upward).This rectangle represents the average flux over the entire image area as meas-ured by the calorimetric method (Section XI. A). The abscissa has the samevalue for both curves, but for the calorimetric record the ordinate representsflux and its scale is known. By rotating both curve and rectangle around the 0abscissa axis, two volumes are defined. Both volumes represent the total energycontent of the image area and are, therefore, equal. For the rectangle, bothordinate and abscissa are known numerically, and from these data the volume iscalculated.
Vcy = I r2 h (14)
where
r = the radius of the focus.h = the flux density
For the radiometer output curve only the abscissa is known numerically; theordinate in term of flux is unknown. The numerical value of the volume definedby rotating the curve can be obtained, however, from the graph by the trapezoidalmethod
r
VRC = 2E (rh)avAt (15)
where
(rnhn + rn+lhn+1 )(r h)av = 2
Ar = n+1 -r
-54-

10
0
•. 250 co I/cm 2 -,,c
w
0/IhJ
0
-1.05 0 ÷ .O5
0.8i-m
IMAGE RADIUS (cm)
Figure 24 CALIBRATION OF RADIOMETER61-488
-55-

r is the radius of the focal area, divided into n increments, selected to
achieve the desired precision,
h is the ordinate value for each increment of r in terms of emf.
By equating the two volumes, a scale factor k is calculated:
kr2 h= r (16)
2 rr (rh) ar
0
If Y is the height read from the graph in terms of emf, then kYmax transformsthe emf ordinate value into flux. The emfs/flux ratio in turn is the sensitivityof the radiometer.
Measurements were performed in order to determine whether the sensitivity ofthe radiometer is constant under all flux conditions obtainable in the solar fur-nace. First, the radiometer was placed at the center of the focal area and its
output was recorded while the flux-control screen was moved from minimum tomaximum flux position. The radiometer output is shown in figure 25. Fromthe principle of flux modulation with the screen, the absolute flux value at anyscreen position is a function of the normal incidence solar radiation, and theratio of flux values at given screen positions is constant.
The radiometer output was recorded at five arbitrarily selected screen posi-tions, and the ratio of output at four positions was taken with respect to onescreen position (0. 5 cm). More than 100 such flux measurements were madeusing 10 different MgO coatings on the radiometer. The results of the ratiocomputations are summarized in table VI for a wide variance of normal solar-incidence values. These results prove that for any MgO coating the ratio of emfoutput for a particular flux value to a preselected flux value is constant and in-
dependent of the normal-incidence solar radiation. This can be so only if thesensitivity of the instrument is constant within the flux values obtained in the
solar furnace.
In a second group of measurements, efforts were made in order to establish acorrelation between MgO coating thickness and sensitivity. Should such a cor-relation exist, the sensitivity determination could be reduced to a single measure-ment of coating thickness. A reference line was engraved on the housing of theradiometer adjacent to the sensing disc. The distance of the uncoated disc fromthe reference line was measured microscopically. The disc was then coatedwith MgO, and the distance of the coating surface from the reference line was
measured.
-56-

0
04
U)
z 0
N
~Z
Ai3SNRLNI xfli 3AIlVI30
-57-

TABLE VI
LINEARITY OF RADIOMETER SENSITIVITY
MgORadiometer Ratios of Radiometer Output NormalCoating* Incidence
No. A/B A/C A/D A/E Ly/rmin
1 0.64 0.40 0.28 0.22 1.35
2 0.63 0.40 0.28 0.22 1.232 0.63 0.39 0.28 0.22 1.352 0.64 0.40 0.27 0.22 1.36
3 0.64 0.40 0.28 0.22 1.273 0.64 0.41 0.28 0.22 1.27
4 0.63 0.39 0.27 0.21 1.194 0.64 0.40 0.27 0.21 1.20
5 0.63 0.40 0.27 0.22 1.035 0.64 0.40 0.27 --- 1.04
6 0.62 0.39 0.27 0.21 1.066 0.63 0.40 0.27 0.22 1.05
7 0.63 0.39 0.26 0.21 0.997 0.64 0.37 0.27 0.21 0.977 0.63 0.39 0.27 0.22 1.087 0.64 0.40 0.27 0.22 1.09
8 0.64 0.39 0.28 0.21 1.078 0.63 0.40 0.27 0.22 1.08
9 0.66 0.41 0.29 0.22 0.999 0.65 0.41 0.27 0.22 0.97
10 0.64 0.38 0.25 0.21 0.9110 0.62 0.39 0.25 0.21 0.8710 0.62 0.37 0.26 0.21 1.1210 0.63 0.39 0.26 0.22 1.10
AVG. 0.635 0.395 0.270 0.216 ---
A = Radiometer output at Flux Attenuator Position 0. 5 cmB = if i i ,f 1 I 6.5 cmC = to I " to It 12.8 cmD = If it ,, 18.1 cmE = If i " I 22.4 cm
* Coating thickness not controlled
- 58-

The results of a large number of measurements on 50 different MgO coatingsproved that it is not possible to focus the microscope sharply on the smoothMgO surface and, accordingly, the precision of the measurement is unsatis-factory. This method of calibration, therefore, was not adapted.
Another approach, however, reducing the sensitivity determination to a singlemeasurement proved to be successful. The method is based on the considera-tion that the shape of the flux distribution ermf record is independent of thecoating thickness and of the sensitivity of the radiometer; further, that the peakvalue of the distribution curve is determined only by the normal solar incidencevalue and the sensitivity of the radiometer. If the peak values obtained forseveral coatings of various thickness reduced to unit normal solar incidencecoincide, the sensitivity of the instrument is independent of the coating thick-ness, and it can be obtained by the measurement of the peak value only.
Such sensitivity measurements were performed on 12 different coatings. Theresults are presented in figure 26, where the peak flux values at the center ofthe image, as determined by this method, are plotted against the normal solarincidence. The points appear to define well the linear correlation between thetwo parameters. This proves the assumption that the peak flux readings aredependent solely on the normal solar incidence. This in turn proves that thesensitivity of the instrument is constant throughout the range investigated thusfar. Further, it proves that the sensitivity of the instrument is independent ofthe thickness of the coating. A restriction on the latter statement comes fromthe statistical analysis of the several hundred coating thickness/sensitivitymeasurements. It appears that the coating thickness should be kept below 55microns ior the correlation to be valid. It is suggested, therefore, to engravea mark approximately 55 microns abcie the sensing disc to insure that coatingof suitable thickness is applied.
From figure 26, the sensitivity of the instrument is read as 0. 0090 mv/cal/cm 2 -sec. A sensitivity of 0.037 mv/cal/cm2 - sec is given by the manufacturerfor the camphor soot-coated instrument. The difference between the two valuesindicates that the camphor black-coated radiometer absorbs four times moreradiant energy than the MgO coated one. This finding agrees well with theo-retically expected values.
The maximum flux measured with the radiometer was 892 cal/cm 2 -sec atI. 38 Ly/min normal incidence. From figure 26, a maximum flux of 975cal/cm 2 -sec is obtained for 1. 5 Ly/min normal incidence, the high value forthe Boston area. The highest peak flux values in solar furnaces reported thusfar are summarized in table VII.
It is realized that the peak flux determined during this work, 975 cal/cm2 - sec,is unexpectedly high, and its validity can be accepted only if proven by a methodindependent of the described measurement. Such a method was found in check-ing the melting point of several high refractory compounds in the solar furnace.
-59--

8I 0
z-8 0
Sz
CN -E ~
00
-0 04:0 - -u
0CD u
u
0 -Z 4
I- <
-x
0-0 !a-
z N
.8.
(ujw/A-1) NOliVIaVH MVIOS 33N3CIlONI IVkMWON
-60-

If the data presented in figure 26 are true, it should be possible to melt a highrefractory compound, e.g., thoria (m.p. 30500 C) at a flux lower than thepeak flux obtainable at 1. 28 Ly/min normal incidence.
The correlation between flux attenuator position and modulation of peak flux,as shown in figure 25, has been previously determined independently of calori-metic measurements and of the use of a calibrated radiometer. Accordingly,if the peak flux at a given normal incidence is obtained from figure 26, it ispossible to reduce it to a desired value by adjusting the flux attenuator. Con-versely, if the flux at a given attenuator position is determined by an absolutemethod, e.g., by the melting of thoria, the peak flux can be arrived at fromthe known relationship of attenuator position and flux modulation.
TABLE VII
PEAK FLUX IN SOLAR FURNACES
Peak Flux
cal/cm2 - sec at1. 5 Ly/min Method of Determination Type of Furnace Reference
573 Measurement 60 inch paraboloid (13)
638 Calculated from 60 inch paraboloid (10)measured average
665 Theoretical 105 feet paraboloid (17)calculation mosair zon-nosed of
2 ft Y I , . ricaliairrors
975 Measurement 60 inch paraboloid presentwork
Three refractory compounds were selected for use in the checking procedure;alumina, stabilized zirconia, and thoria.
First, the alumina was melted in the solar furnace with a normal incidence of1. 17 Ly/min. It was not possible to freeze the molten alumina under these
conditions even when the flux was reduced to the minimum possible value withthe flux attenuator. From figure 26, the peak flux at 1. 17 Ly/min is 705 cal/cm 2 . sec. The attenuator position reduces this value to 148 cal/cm2 - sec.
-61-

Assuming an effective emissivity of 0. 5, the calculated temperature of the
alumina is 24500 C. The fact that the alumina was liquid during this testproves that the temperature was definitely above 20200 C and, thus, the peakflux was higher than 341 cal/cm 2 -sec.
The stabilized zirconia was melted with a normal incidence of 1. 22 Ly/minwith the attenuator in the maximum flux re uction position. From figure 26the peak flux at 1. 22 Ly/min is 746 cal/cm - sec. The attenuator position re-duces this to 157 cal/cm 2 -sec. Assuming an effective emissivity of 0.5, thecalculated temperature of the molten sample is 2500* C. According to thesupplier of the stabilized zirconia, the melting point is approximately 25900 C.Thus, the peak flux had to be at least 746 cal/cm 2- sec in order to melt thezirconia at the given attenuator position.
The thoria was melted with a normal incidence of 1. 28 Ly/min with the attenua-tor at 9.6 on the arbitrary, linear flux-control scale. The peak flux at 1.28Ly/min normal incidence is 794 cal/cm 2 -sec. The attenuator at the given posi-tion reduces this to 293 cal/cm 2 -sec. Assuming an effective emissivity of 0.5,the calculated temperature of the molten thoria is 2970* C. This agrees well
with the literature data of 30500 C. Thus, the peak flux had to be at least 794cal/cm 2 sec in order to melt thoria under the experimental conditions.
In these calculations the emissivity value of 0. 5 was assumed for the varioussamples because no reliable information is available. This was taken as arealistic value considering the few data reported in the literature. A difference
of * 0. 1 in emissivity does not alter the conclusions drawn from these tests.
As a result of the flux measurement program, it can be stated that underfavorable normal solar-incidence conditions in the Boston area (1. 00 - 1. 40Ly/min) peak fluxes are available in the 60-inch solar furnace correspondingto a blackbody temperature of 42000 - 4800* C. Under optimum normal solar-incidence conditions (1. 40 - 1. 50 Ly/min), the available flux corresponds to a
blackbody temperature of 48000 - 49000 C. Since the compounds with the knownhighest melting points are carbides with high emissivities and reported meltingpoints below 40000 C, it appears that it is possible to melt every known solidin the solar furnace.
-62-
S.

XII. HEATING OF REFRACTORY OXIDES IN THE SOLAR FURNACE
Several refractory oxides were heated in the 60-inch solar furnace, using asample holder which permits rotation perpendicular to the optical axis.
Figure 27 shows part of a molten crater of an alumina sample (mp 2050*C).The molten portion is well defined and has a sharp rim produced by quenchingthe sample. Incipient radial crystal growth is visible at the rim. Specks ofimpurities are concentrated on the unmelted portion of the alumina. Figure 28is a cross section through the paraboloidal crater formed by fast spinning of themolten alumina. The voids below the surface were formed during the cooling,crystallization process. Figure 29 shows the cube-like single crystals grownin the voids below the surface. Figure 30 is the photomicrograph of anotheralumina crater which was heated for a longer period of time and cooled offslowly by moving the flux-control cylinder in small steps. This explains theconcentric rings. The hole in the center completes the phonograph record-likeappearance. The large voids were formed during the shrinkage and crystal-lization of the liquid alumina. Figure 31 shows the crater of a zirconia sample(mp 2700* C). The fused surface shows concentric rings caused by decreasingthe image size step by step. In figure 32, the sharp definition of the hot zoneis demonstrated. The fused crater is surrounded by the original, unmeltedporous structure. Figure 33 is a cross section of a zirconia crater. At thesurface, a thin, well-defined layer formed during the fast quenching is visible.Underneath, the cooling was slower; and, as a result, somewhat larger and well-defined crystals developed. Figure 34 is a full view of the alumina sample shownpartially in figure 27. The impurities diffused away from the hot zone anddeposited in a circle at the cooler portion of the sample. The color of the un-melted portion adjoining the crater i" much lighter than the original sample,indicating a zone-refining effect.
The same zone-refining effect has been observed when a five-inch long mulliterod was moved back and forth in the image area. After several passages, thecenter of the rod became much lighter in color, whereas towards both ends darkrings developed, showing an increased concentration of impurities.
Using a stationary sampleholder, thin rods (1/16 and 1/8 inch in diameter) ofalumina, zirconia, and thoria were heated in the solar furnace. The rods wereexposed head-on to the concentrated radiation, positioned in such fashion thatonly the center of the rod reached melting temperature. During the heating andconsequent cooling, the specimens were observed through a telescope and opticalpyrometer alternately through a center hole in the mirror. The radiant flux in-cident on the samples was changed by small increments with the aid of the con-trol screen. With this technique, it was possible to create at the center of therod a minute molten pool in contact with the unmolten material.
-63-
A

N
�
4-
C)
0
-64-
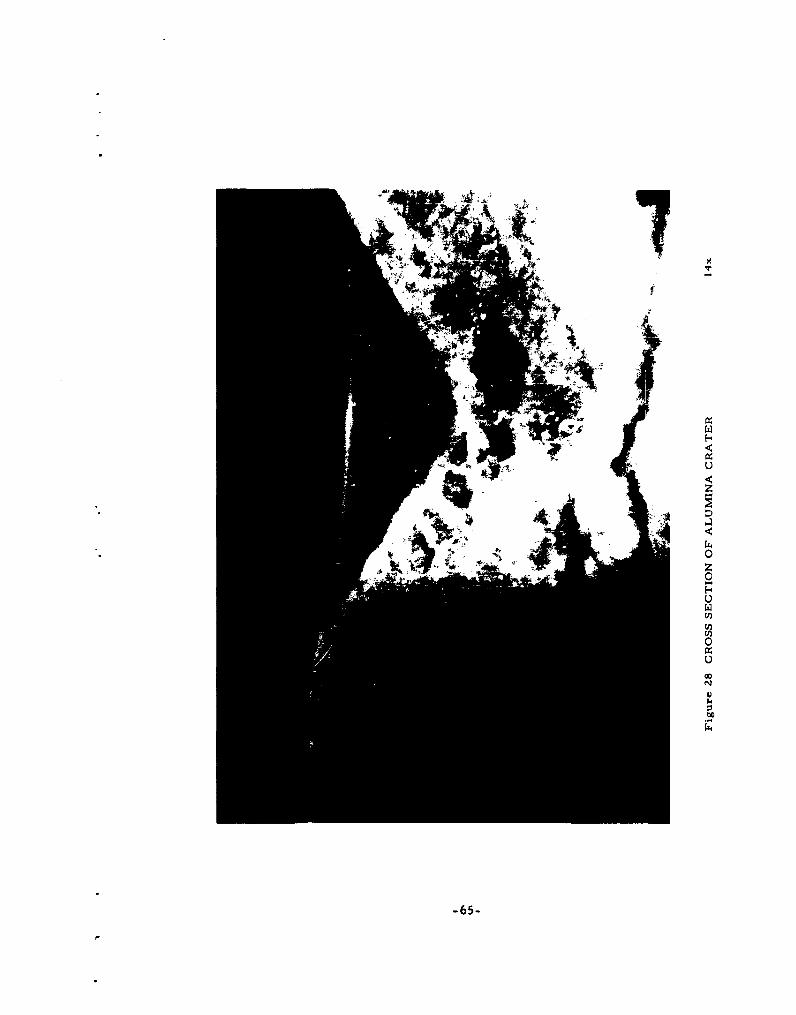
-65-,

00
0
-66-


x
t
-68-

4.,.4
A0
-69-
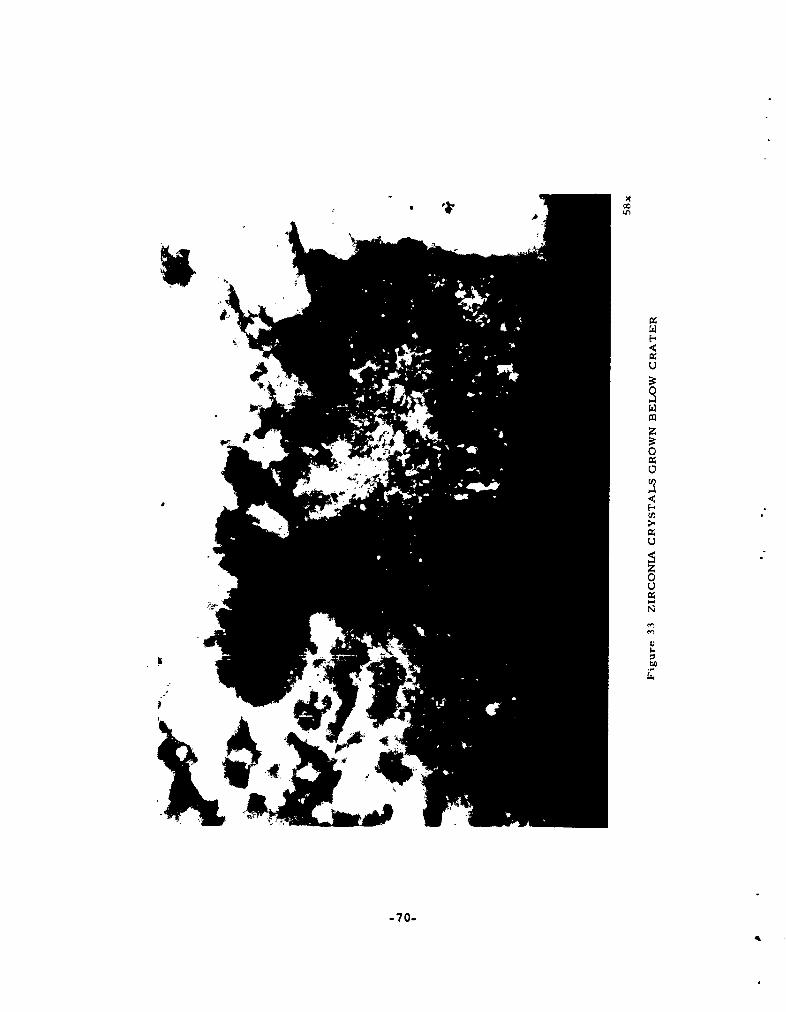
z
-700

14'
2 1/Zx
Figure 34 ZONE EFFECT ON ALUMINA CRATER
P-6093
-71-

When the thoria rods were exposed to fluxes much greater than those necessaryfor melting, the thoria vaporized at a very rapid rate. The vapors condensedupon reaching the cooler portion of the sample at the edge of the focal area.As a result of the condensation, single crystals and crystal clusters were form-ed at the periphery of the crater (figure 35). Figure 36 shows a rod-like singlecrystal with sharply defined faces on the top. Figure 37 is an octohedral singlecrystal attached to the sample by a thread-like formation. Figure 38 presentsseveral crystal clusters composed of similar sizes. Figure 39 shows alsotwining along the c axis, but the crystals are ordered in decreasing size.Figure 40 is a photograph of small crystals in dendritic growth but well definedcrystal habit.
-7 Z-

-- 3
00

160x
Figure 36 ROD-LIKE SINGLE CRYSTALS OF THORIA
-74-

255x
Figure 37 OCTOHEDRAL SINGLE CRYSTAL OF THORIA
-75-

160xFigure 38 THORIA CRYSTAL CLUSTER
-76-

Figure 39 MULTIPLE TWIN THORIA CRYSTALS 160x
-77-
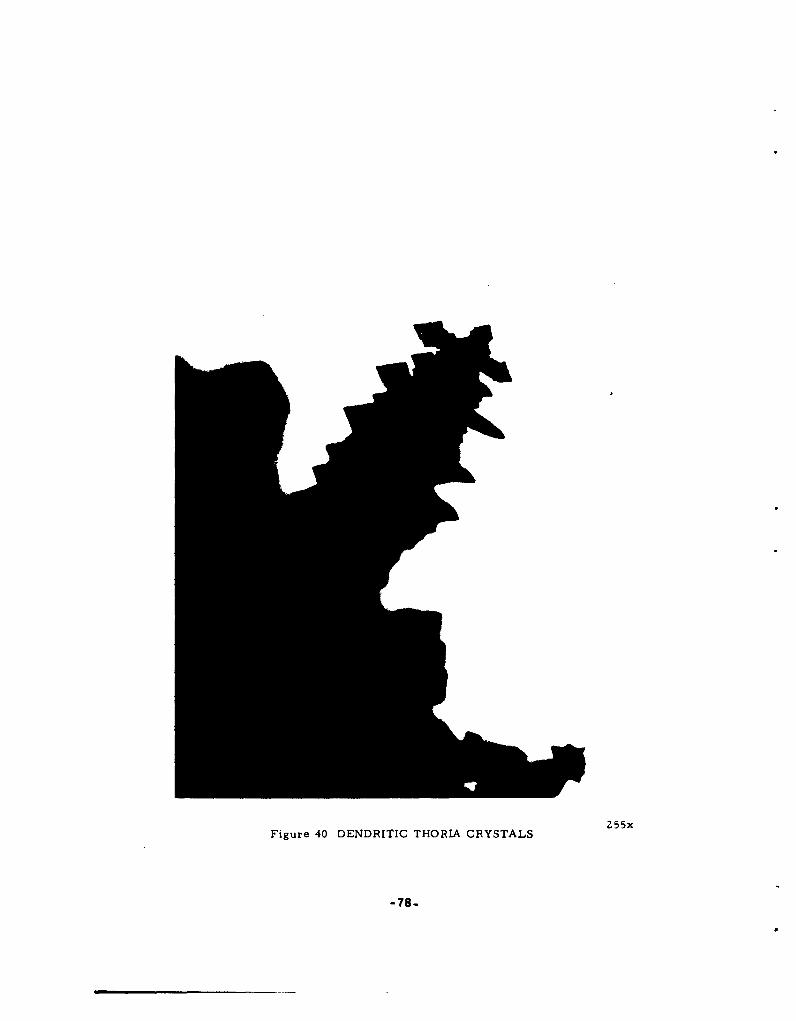
255x
Figure 40 DENDRITIC THORIA CRYSTALS
-78-
XIII. THE MEASUREMENT OF THE ELECTRICAL RESISTIVITYOF REFRACTORY OXIDES
Electrical resistivity measurements of refractory oxides at high temperaturespresent a number of problems which are difficult to solve. The heating of suchmaterials is usually accomplished by radiation from a resistively or inductivelyheated conductor. At high temperatures, the conductor has to be heated invacuum or inert atmosphere. It has been observed, however, 18 that the con-ductivity of alumina increased with time when heated in vacuum at a constanthigh temperature. The explanation offered by Hartmann was that alumina dis-sociates when heated in vacuum thus causing an increase in conductivity. Whenit is reheated in air, the conductivity decreases to the original value. A fur-ther drawback of such heating is the volatility of the heating elements and otherparts of the furnace. Whether the heating takes place in vacuo or inert atmos-phere, the vapors of the heater may introduce impurities into the sample.
In high temperature furnaces, thermionic emission occurs at the surface of allheated parts. This emission may produce a shunt effect which can render theresultant resistivity values meaningless. 19 Operating in vacuo naturally tendsto increase emission.
The electrical contacts required for resistivity measurements also cause diffi-culties. Since the metallic contacts are at the same high temperature as thesample, reaction between the two is both possible and probable. Cooled metal-lic contacts, on the other hand, cannot be used as the resultant heat loss wouldupset the temperature uniformity of the sample.
If the conductor is heated by induction, the high-frequency electromagneticfield may also interfere with the measurements.
It appears that the measurement of electrical resistivity of oxides at high tem-perature in an image furnace does not raise these difficulties. A sample canbe heated in any atmosphere, including air. The concentrated radiant energyheats only the sample and no other part of the furnace. As a result, no con-taminating reaction can take place and thermal emission is restricted tothe sample surface.
The metallic contacts are not heated and thus no reaction at the interface canoccur. If required, the metal contacts can be liquid cooled; and the resultingeffect on the temperature distribution is considered together with the uneventemperature distribution specific to image furnaces. There is also no electro-magnetic field surrounding the sample which would interfere with measurements.
-79-

An experimental program was carried out in order to prove the suitability ofimage furnaces for the measurement of the electrical resistivity of oxides.Alumina was chosen for this program because it can be easily obtained in highpurity; it can be formed into any shape by conventional techniques, and itselectrical resistivity has been measured up to 1500* C by several investigators. 19
Samples were prepared from 99. 5 percent pure A12 0 3 by ball milling and by bothslip casting and hydraulic pressing, using an organic binder. The shapes wereprefired at 1100. C and machined to the desired dimensions. The final firing wasmade in an induction furnace at 1750" C, using a tungsten susceptor with analumina lining. The samples were of cylindrical shape, with two slots at thebases to engage with the drive key of the sample holder jaws. The followingsample sizes were fabricated:
Length Diameter
1. 000 inch 0. 875 inch1. 000 inch 0. 625 inch0. 750 inch 0. 500 inch0. 500 inch 0. 375 inch0. 450 inch 0. 335 inch
These samples were mounted in the sample holder (shown in figure 5) and ex-posed to the concentrated solar radiation. It was observed that with the fourlongest samples a portion of the sample was outside the focal area. The 0. 450-inch long sample was found to be suitable in length and diameter to obtain thedesired temperature distribution lengthwise as wefl as the maximum heatedarea about its circumference.
This size of sample was used for all successive heating and measuring tests inthe solar furnace. During the heating, the sample was rotated perpendicular tothe optical axis of the solar furnace in order to obtain maximum temperatureuniformity across its diameter. The brightness temperature was observed with aPYRO micro-optical pyrometer. The pyrometer was mounted on a micrometerslideway in such a fashion that it could be displaced perpendicularly to the opti-cal axis of the furnace by measured small increments. Thus the temperaturedistribution along the sample could be measured with a fine resolution. Thesample-holder jaws were not affected by the proximity of the hot zone, and thecooling transformer oil did not heat up perceptibly.
The radiation observed with the optical pyrometer included both the radiationemitted by the hot sample and the solar radiation reflected by the sample. Thusthe temperature readings could not be interpreted as the temperature of the sam-ple. In order to make meadtingful temperature measurements, a rotating sec-tor based on a design of Conn and Braught 20 was used to separate the emittedradiation from the reflected solar radiation. A sketch of the rotating sector isshown in figure 41. In operation, the sector is rotated at a speed of 200 c/secby a synchronous motor through a nonslip drive belt. When the specimen, the
-80-

COUNTER
VIEW I BALANCE
SPECIMEN SHIELDEDMEASURE EMITTED ROTATING
RADIATION ONLY - RADIATIONSOLAR SED
i FIXED
COLLIMATIONTUBEROTATING
00
0, MEASURE EMITTED ANDREFLECTED RADIATION
Figure 41 OPERATION OF ROTATING SECTOR62-8929
61 -

rotating shield, and the orifices of both discs all are aligned, no solar radia-tion falls on the specimen, and only the radiation emitted by it reaches theradiation detector. When the spring-loaded disc is retarded, however, it trans-mits radiation from the specimen while it is heated by solar radiation. Thus,the emitted plus-reflected radiation reaches the detector.
The sample was heated in the solar furnace with the rotating sector in opera-tion. The temperature distribution.along the sample was measured with theoptical pyrometer. The results of such a measurement are presented in figure42. This temperature distribution was observed with the flux-control screenat the minimum-flux position. By repositioning the control screen, the maxi-mum temperature can be increased in discrete steps while the temperature atthe ends is held constant by the cooled contacts. Thus, the conditions for thecalculation of the temperature dependence of the measured property describedin section IX are fulfilled.
The resistance of the heated samples was measured with an Industrial Instru-ments Model L-7 megohmmeter and a standard vacuum-tube voltmeter. The re-sistance of a 0. 450-inch long, 0. 335-inch diameter alumina sample having abrightness temperature distribution shown in figure 42 was measured usingapplied voltages of 2-1/2, 150, 250, and 350 volts. The following values wereobtained:
Test voltage Resistance
2-1/2 2. 00 x 108 ohm150 1.80 x 10⁸ ohm250 1.75 x 10⁸ ohm350 1.80 x 10⁸ ohm
The polarity was reversed several times during these measurements. With thehigh-test voltages, no change in resistance was observed with the reversal ofpolarity. With the 2-1/2-volt tests, however, the polarity reversal increasedthe resistivity to 4. 50 x 108 ohms. The resistance increase was not permanent,and a decrease with time was observed. A similar observation was reportedby Arizumi and Tani, 21 who attributed this to the presence of ionic currents inthe alumina.
In figure 42, brightness temperatures are shown as measured directly on theoptical pyrometer. Emittance values for the alumina sample are necessaryto convert these to true temperatures. No emittance values are available inthe literature which would be applicable to a particular sample of given compo-sition, crystal structure, and surface conditions. Separate investigations inthis laboratory are in progress in order to establish a method for the measure-ment of emittance at high temperatures. It appears possible to perform theemittance measurements simultaneously with the measurement of other hightemperature properties. Thus, such emittance values willbe obtained which aredirectly applicable to the calculation of the true temperature of the sample at whichthe high temperature property was measured.
-82-
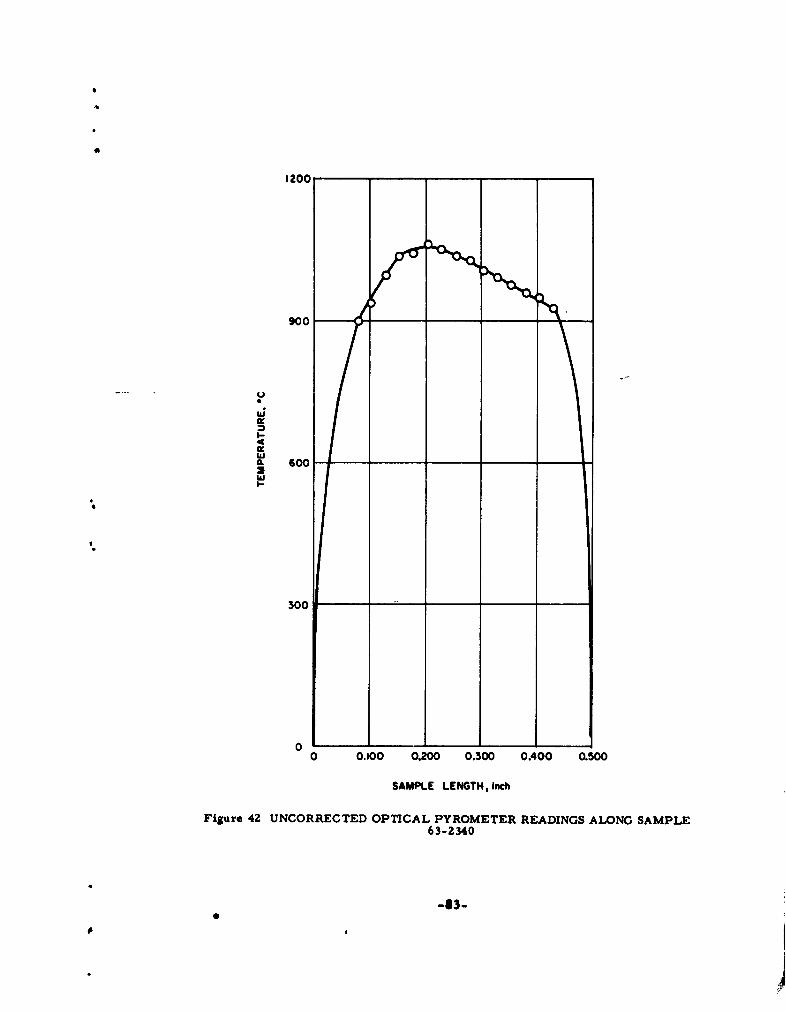
I
1200
900
90 60
0 A
0 0.100 0.200 0.300 0.400 0.500
SAMPLE LENGTH, Inch
Figure 42 UNCORRECTED OPTICAL PYROMETER READINGS AL40NG SAMPLE63-2340
-83-
0

After the true temperature distribution of the sample is known, the flux ischanged in order to alter the peak temperature. With this new flux setting,another resistance and temperature distribution measurement is made. Thesame procedure is repeated as many times with as small peak temperaturechanges as required for the application of the method outlined in section IX.Thus, the temperature dependence of the electrical resistivity of the samplecan be determined.
-84-

* XIV. DELIVERIES
In accordance with the requirements of the contract, the following items weredelivered to the contracting agency:
1. Prototype model of vacuum and gas-filled image chamber
2. Thirty-six-inch diameter paraboloidal reflector
3. Engineering drawings:
LA-2923, Solar Furnace Shutter-Design Study No. 2
LA-2924, Sensing Element-Guiding Mechanism
LA-2925, Shutter-Solar Furnace
LA- 2926, Furnace-Solar
LA-2927, Solar Furnace-Guiding System
LA-2700, Sample Holder-Solar Furnace
-85-
XV. VISITS
Visits were made by the principal investigator to several laboratories wheresimilar research activity is in progress. The following organizations werevisited:
Naval Radiation Defense Laboratory, San Francisco, California.Stanford Research Institute, Menlo Park, California.Holloman Air Force Base, New Mexico.Material Laboratory, Naval Shipyard. Brooklyn, New York.Arthur D. Little, Inc., Cambridge, Mass.Laboratoire de L'Energie Solaire, Montlouis, France.
The problems of image furnace techniques were discussed at great lengthwith the scientific personnel of these organizations. Their interest andcooperation is greatly appreciated.
-86-

XVI. PUBLICATIONS
The following is a list of publications where partial or total sponsorship of thiscontract has been acknowledged:
Anonym., New England Supplies Fuel for Solar Furnace New EnglandProfessional Engineer 13 (5), 4-6 (1960).
Laszlo, T. S., High Temperature Physics and Chemistry Lecture series,The American University, Washington, D. C. (29 June - I July 1960).
Laszlo, T. S. and M. S. Klamkin, Determination of the Temperature De-pendence of Material Properties in Image Furnaces, AFCRL-TN-60-797,
(18 October 1950); Solar Energy 4 (3), 20-21 (1960).
Laszlo, T. S., On Radiant Energy in High Temperature Research, pre-sented at the annual meeting of the American Society of Mechanical Engi-neer New York City, (30 November 1960); Solar Energy, Vol V, No. 4(October - December 1961).
Laszlo, T. S. Image Furnaces for High Temperature Research, presentedat the meeting of the Boston Section of The Electrochemical Society (23February 1961).
* Laszlo, T. S., Present Status and Prospects of High Temperature Research"with the Solar Furnace, Solar Energy Symposium, University of Florida,Gainesville, Florida, (11 April, 1961).
Laszlo, T. S., and P. J. Sheehan Jr., Final Report-Investigation of ThermalImaging Techniques AFCRL 131, (18 April 1961).
Laszlo, To S. High Temperature Physics and Chemistry Lecture Series,The American University, Washington, D. C. (28-30 June 1961).
Laszlo, T. S., Measurement and Application of High Heat Fluxes in a SolarFurnace, presented at the XVIII International Congress of Pure and AppliedChemistry, Montreal, Canada; (9 August 1961), Solar Energy, Vol. VI No. 2,69 (1962).
Laszlo, T. S., and M. S. Klamkin, Analytical Evaluation of a New ShapeArtifical Blackbody (tentative title-to be published).
Laszlo, T. S. New Techniques and Possibilities in Solar Furnaces, presentedat the United Nations Conference on New Sources of Energy, Rome, Italy(21-31 August 1961).
-87-

PUBLICATIONS (Concl'd)
Laszlo, T. S., Solar Energy in High Temperature Research, presentedat the NATO Advanced Study Institute for Solar and Aeolian Energy,Sounion, Greece. (4-17 September 1961).
Laszlo, T. S., Utilization of Solar Energy, presented at the Science Con-gress organized by the Department of Education of the Commonwealth ofMassachusetts and the IAE, (2 June 1962).
Laszlo, T. S., High Temperature Physics and Chemistry Lecture Series,The American University, (27-29 June 1962).
Laszlo, T. S., and P. J. Sheehan, Investigations of Thermal ImagingTechniques, presented at " A Conference of Imaging Techniques"Cambridge, Massachusetts. (4-5 October, 1962).
Laszlo, T. S., P. J. Sheehan, Sample Holder for Electrical Measure-ments, technical note to be published in Solar Energy.
Laszlo, T. S., P. J. Sheehan, Radiometer Calibration, technical noteto be published in Solar Energy.
Laszlo, T.S., Image Furnace Techniques, to be published in the seriesTechniques of Inorganic Chemistry, edited by Jonassen and Weissberger,published by John Wiley and Sons, Inc.
-88-

XVII. REFERENCES
1. Laszlo, T. S., Solar Furnace in High-Temperature Research, Science 124,797 (1956).
2. Laszlo, T. S., and P. J. Sheehan, Final Report-Investigation of ThermalImaging Techniques, RAD-TR-61-9, AFCRL 131, (18 April 1961).
3. Glaser, P. E., Engineering Research with a Solar Furnace, J. SolarEnergy 2, 7 (1958).
4. Davies, J. M., and E. S. Cotton, Design of the Quartermaster Solar Fur-nace, J. Solar Energy 1, 16 (1957).
5. Gubareff, G." G., J. E. Janssen, and R. H. Torborg, Thermal RadiationProperties Survey, Honeywell Research Center, Minneapolis, Minn. (1960).
6a. Gillette, R., H. E. Snyder, and T. Timar, Lightweight Solar ConcentratorDevelopment, Solar Energy V, No. 1, 24 (1961).
6b. Bolin, J., C. J. Tenukest, and C. J. Milner, Plastic-Replica Mirror Seg-"* ments for a Solar Furnace, Solar EnergyV, No. 3, 99 (1961).
6c. Bradford, A. P., W. W. Erbe, and G. Hass, Two-Step Method for Pro-is, ducing Replica Mirrors with Epoxy Resins, J. Opt. Soc. Am. 49, No. 10,
990 (1959).
6d. Saxton, J. H., and D. E. Kline, Optical Characteristics and Physical Pro-perties of Filled-Epoxy Mirrors, J. Opt. Soc. Am. 50, 1103 (1960).
7. Archibald, P. B., A Method for Manufacturing Parabolic Mirrors, J. SolarEnergy 1, 102 (1957).
8. Khanna, M. L. , USSR Solar Energy Exhibit, The Sun at Work VII, No. 1,4, (1962).
9. Glaser, P. E., M. M. Chen, and J. Berkowitz-Mattuck, The Flux Redis-tributor, Solar Energy VII, No. 1, 12 (1963).
10. Farber, J., Images of Very High Temperature Sources, Symposium onHigh Temperature-A Tool for the Future, Stanford Research Institute,(1956).
11. Buckley, H., On the Radiation from the Inside of a Circular Cylinder,Phil. Magazine, 4, 753 (1927); 6, 447 (1928); 17, 576 (1934).
-89-
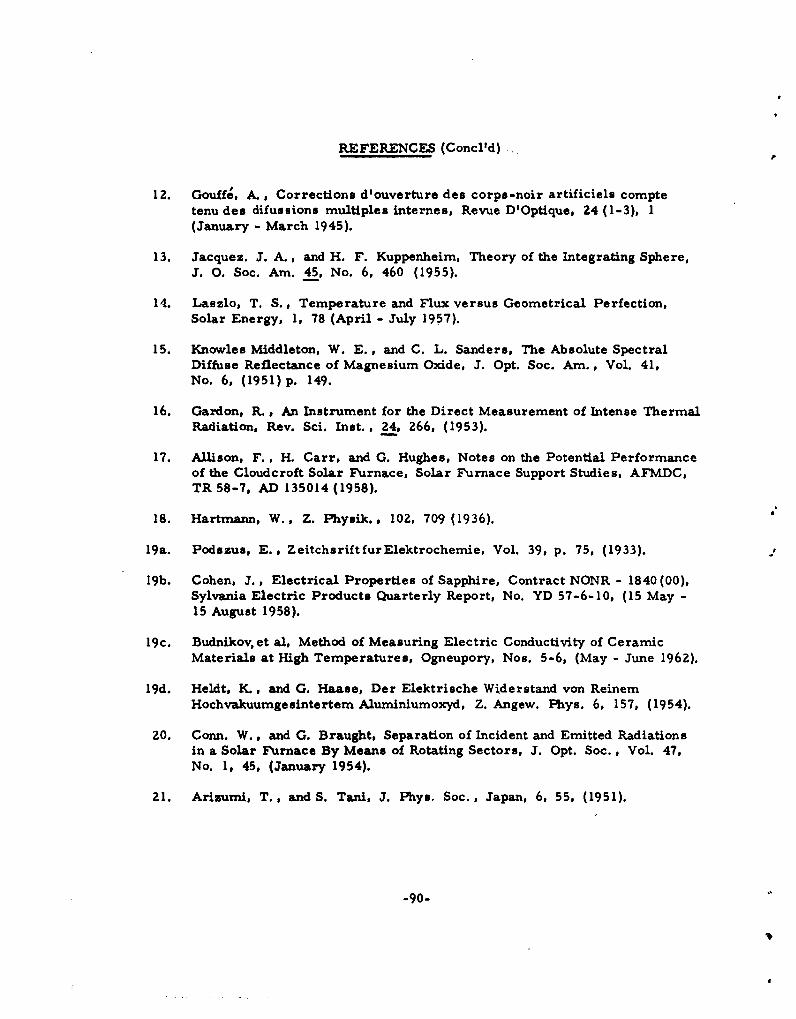
REFERENCES (Concl'd)
12. Gouffe, A., Corrections d'ouverture des corps-noir artificiels comptetenu des difussions multiples internes, Revue D'Optique, 24 (1-3), 1(January - March 1945).
13. Jacquez. J. A., and H. F. Kuppenheim, Theory of the Integrating Sphere,J. 0. Soc. Am. 45, No. 6, 460 (1955).
14. Laszlo, T. S., Temperature and Flux versus Geometrical Perfection,Solar Energy, 1, 78 (April - July 1957).
15. Knowles Middleton, W. E., and C. L. Sanders, The Absolute SpectralDiffuse Reflectance of Magnesium Oxide, J. Opt. Soc. Am., Vol. 41,No. 6, (1951) p. 149.
16. Gardon, R. , An Instrument for the Direct Measurement of Intense ThermalRadiation, Rev. Sci. Inst., 24, 266, (1953).
17. Allison, F., H. Carr, and G. Hughes, Notes on the Potential Performanceof the Cloudcroft Solar Furnace, Solar Furnace Support Studies, AFMDC,TR 58-7, AD 135014 (1958).
18. Hartmann, W., Z. Physik., 102, 709 (1936).
19a. Podazus, E., ZeitchsriftfurElektrochemie, Vol. 39, p. 75, (1933).
19b. Cohen, J., Electrical Properties of Sapphire, Contract NONR - 1840 (00),Sylvania Electric Products Quarterly Report, No. YD 57-6-10, (15 May -15 August 1958).
19c. Budnikov, et al, Method of Measuring Electric Conductivity of CeramicMaterials at High Temperatures, Ogneupory, Nos. 5-6, (May - June 1962).
19d. Heldt, K., and G. Haase, Der Elektrische Widerstand von ReinemHochvakuumgesintertem Aluminiumoxyd, Z. Angew. Phys. 6, 157, (1954).
20. Conn. W., and G. Braught, Separation of Incident and Emitted Radiationsin a Solar Furnace By Means of Rotating Sectors, J. Opt. Soc., Vol. 47,No. 1, 45, (January 1954).
21. Arizumi, T., and S. Tani, J. Phys. Soc., Japan, 6, 55, (1951).
-90-

APPENDIX
IMAGE FURNACE TECHNIQUES SURVEY
Image furnaces have found wide application recently in high temperature researchand testing. Because of their peculiar characteristics, new instruments, ex-perimental set-ups, and methods had to be found for their successful operation.Some of this recently developed knowledge has been published in different journals,proceedings, and research reports, but most of the results are not widely avail-able. As a consequence, investigators have to devote much time and effort tosolve those instrumentation and procedural problems which have already beensolved by others. Worse still, the distinct advantages of using image furnacetechniques for the solution of some very difficult experimental problems arenot even recognized in many cases.
A survey work was therefore initiated with the intention of remedying thissituation. In addition to a thorough literature search, all organizations known tobe active in this field were requested to supply information about recent investi-gations, including new techniques and instrumentation, special problems en-countered, and so forth. Altogether, 129 organizations were contacted, andtechnical information has been received from 70.
The first result of the survey is presented in a tabulated form listing the loca-tion of the facility together with a few pertinent data.. /The technical material is presently undergoing a systematic arrangement, be-ginning with the discussion of various radiation sources and ending with the de-scription of experiments performed in image furnaces. The information willbe presented in such manner that a newcomer to the field should be able to de-cide whether imaging techniques are suitable to his research problem. In thecase of a positive answer, he should be able to select the equipment and methodsbest suited to his needs. For the experienced investigator, in turn, there willbe enough details included on specific experimental setups and methods to aidin solving his particular problems and to compare his approach to that of others.
The entire survey will be published under the title, "Image Furnace Techniques",in the series Technique of Inorganic Chemistr t, edited by Jonassen andWeissberger, to be published by John Wiley & Sons, Inc.
!A -91-

No.- Owl Add-.. 008300 opm0o syoo.. s-'on boo.. . .- .1.p ni. ao..1.. ii.4 taq..10.oni
AWEI3A
1.011100.4.1 C....- P.,.. 6. 40.. i.pob0* T 9.. 1kwflt &1 800o . .4s.l00805.A16. l'~ oj. 6 Voo0.-i.0.. ft G.o,. I:., ,opaooik'.. 0.o.~
M. 7...... £1. .. 110 44.P.ep .. d-Qto Iit
AUSTILALIA
C R-ooo ...oob S. H. W.Y-.*o4 6001. S....d3 T.. RooolbOf .04. hi&Ii- ni. d Of nackL~boro_.~.o. 04.30.,.. ."00 Wi... 03000.. A. C.O-fl01 . C.O. Z01.
C.0.C.Ol, CAD-m.Tb
Thoi UO.W.l 003 M40. ft.(. C. J. 04..0 I1I.-i dii.. S... I000001p0 100 0*. phylo .k a4 0 0..S ..44 0040, S. 0. Ci.ooý% Poo.lw.14.1l 00.0 15pnp~jo...' o W60..Kii.niiv i. N0. S. . o04h MI.~o~
Pr... U.-,i .1 hMo... ]. ctas Dil"Io.Utpu.:.l ]C.o,0Vp.P.....i- nwhil0.
CANADA
D.i..o. U-..ab cl-i.ola L. G. Woloo C.-O..... ftk. 010 - 1 fl191- 0.004000 44od .40.1 040 "woo00&4.000. ~~ .0.. I00.11 book Uo-o..d .. M.04o fristo *nm 44l ,04.
r i.ywrbol.i4 oo~ 000S0W AHD
WMv.oan ltOn.och & K~e.. 7.. eooili -"' 0 ..n C.O... IZO .1C300I.Al 431o003.001 .0.
Dolp.L. 1.. Loa.. 0. 7zliki1, 40.0. Pooo04o ooO0
L_ r. HO bo
Pi30lgtvii 0044.. .. L I.KA. Pi110..... I SO.... di. py... a"... C-o. 0 To1 4 04.
R-00Mt~.i.o U"Mib-0boo.0, 3.. D,.L.- T .0. _.W Mo.b.o4.l Corbo. -r IS0 5 0.00. "I01. 04...W410000 W4 Ao.Oini- 000
0.404 Kige-~ A-oo tinily p.0,o I4I. 4o'ni :111,o..d.1 I-o C..bo .r. T1*o o,o0.r 04..Sludy 04A.44..oy. 00000.14 d0. .0.4 ill-'or 0,0i..go ..... 1".".414 oor.0I
U -0.001" 01 0....,ti. W Ifi d .L A, Wr-.1 T-01 oiuiSO- dwl0 00. p.-.. 100 Tho-t" P-p-ts. ohg.(-I ,oy f-iinlibiri-
0000*04. LC.00310 04. 80. too.(-0 P-~bb10 R.-00 cb0 " 000. . .. io.imlsrwd.,~ opliob.
M.0 psoo-, lbboit..0.0000000
9-"i.. L.. Coobo.. L..r.00o Z. Tooq... 00001. ioUliptil -- iior Coobo. CO T..q--0r. 1-05.u_ o.1 04k.-0. sirmpb00.tpi.., - On - Own. Sn00 It 14-110 .) 1o 500-C
&od.A0a~l..C. 70.... I oo 30.... d"0. P.0- CO-b-.1c. W4000.. d-0 - it.rtoMl .lO.oo 1
Goooopooitio. proidofl.
01.0.0,010 a# IFi~ibow. roolboo POOL . al... P.0. tikt. I.0 ,0 0 8. T- ~ o. F4.0180 010 00 1.0
Nattemal Plivakal Labor.Oty. . L0... P..0..10 ... . 1 .12i. CnWii. ..
JAPAN
C.000. R-1.110 L"b. T*kvo F.Obo Too 41-i.0i.3100.01 00.0.-. %IS53 0lW00011. Co.0o10.M0isai -040t"0 0001400.
I. - I...C.. L
T.b.h. tUoO-it0y, .0. Is.~ T.0.0 00.009 . 410. poftb00d" sin000.0000.0 nth4 00110000
0o.o~~oo 0.0011....oo T. Nogoki I10o.o diw. P .0. *-1&' So. V.-..... o 00.00.0.4.1.00000. 380030. 04. 30.3.14 001000,00"00030000
T. K..*.~
MMILOELAI800
mip.01p R..00,b G.0.o0. . K, 04.wom ho g.... 03io00wI Coobo. 00 I.00 -. 48o. Zo. 00M100.1 04 00.....080. TWA
0004.db-00000400. 000.-404 0o10 niow iinn30
~4~~0

A. 0. LhoIo 1... P. Z. am0.. i . au1 , 4 1 l. o wl todI" sidvi 91..,.oo. as*oIooI~o P,0it 9401610% mft040000 ofc~o"W . M.. D.Y. 01k.4.. 1. per. .1.Utj.ot mmi.100.,i VpM1000WAO 01*f* U
Aoo.-I45o. Sir0.o. DMiot. R. No.-, D3.0.b.i-Hp-o14.I. wi* C b.o r. 140 c,/.I1ro5
.o Abk1tW. Fifto.0rS . .1 p10i. 1..0USAF. W.itk..p.o..oe Air i 40* M-.1 i.i.,t,,.0 40o" esooto/o'j.. blab wilis..o 4..otn .mo . lbr..A
F..0.. lob. o.40,05.a-- 40001 ~rohgp00.01. Tb.owl ..4W4..a
A., P.-a0.b M0S A.fI0 -"q -I J. W. k401.0*4 60., 41.. peoN"Iw :1-1 cft:::.J. tft .4.1 u lab.""""
Ai, 11.... C.Idj~igo C. P. Pslo.M. vi.. fo..4 60 414, wo.e Coo.. 0- 1lftliot01 ofA00.. - "5 c...... o ýt.o
A,. o.111 0000fi * . P.C Jo.. 6a.. p.91.40* S". I..1-sptift #9 R.p.ov 9isa 9.04.
Aoo..ogftl At.o.- .. d It*..rohwrift Q16 - 13
Mol.... " Nl.J. 04.0100 at 40110s"000.AO
Ako..Wo.. No. $Ie I~a W*o4p0.16I0o.16
Wo1.oif M.. 0.0. P.;. T-0..o omoOOomo.. as*.0. owow..00 w.01010
ofoaw. .W1owoh
%.,0*0N~r00. 1.. C LnF... T IA. $.I' Uq1p-Ml Cork.. . M~ ISO ..1 oo 1.0.41010 00. Mk..
16- P-.66.1. Moor0 Cork. or. 101ont
100,*0.. Tot, 60.. Ho. 1.,000*0, C-ook.1. C-15.0.00y. .
C.- 0 , CAM.� ol
CRnot V-1-1 7- 0 d " .10 -0- -
C.o.. 00., Ga. rk. W,.V-.Jr 1,0 pfb.CI mto.w.o01. p.,00 .001010 .
C.,koA- .1 ..A.C 000 131*o..l0 00.00 f~~tvM.40.0..
Co .- cC. HpL o-o T. Akooo43 bOkoo- pI.ýy.0aoo 0001.1...w .0 .
A..,.. 10. . -.. R.. l ...... 0.000of 0. 3491.50.004,0
To6. o0.y. Pl.i.0%,. 30 5010015w 44. ~0050.R..ft i - - 0 .,.- .6s A & - -f
A- t.09.4 6000. po .. 0..o 3.0pokl Coka~o M.0.oWild .5040.. .0.0000C~oop00o o...ok S Crok oo0~M0Oo0 0910 004.100 0.A 01. hu ca 4ot.0
0.060.0000.. Poo A10. LE A015.. .S.Wt001I*. " 004 o1.4v v0*".0.000.0000t I.U 0.0 000mors10
1"1 e
s~.Mo ri.o.lAr.01Co, . .. y. Pa.. pk,..It 0.00. or.f - 05 Uetru0o ,0..1. .4 0 .4411. ,010 S
80. dv.J Lo.t 00.ao T-0.00 0 .144. C..-..g.fl~r. o0*00o w" ilofmm~u*
ki. ibtp 1"ik mi-.*** wvifftqý sW)10o
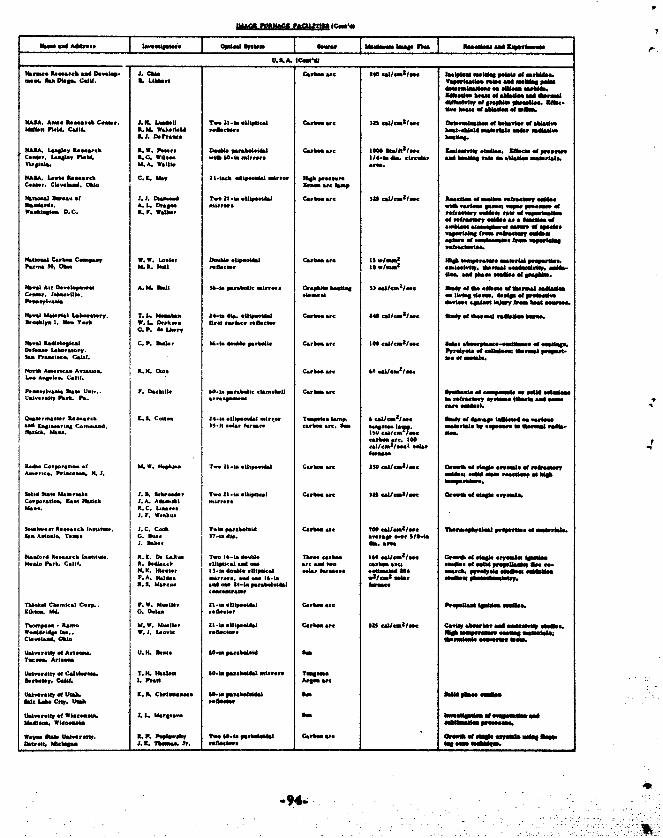
V.S.A. 4C..44
.4.4. ft. 0
4.p. CQ4. a. LAM.Ps V~e444..44. 44*# mil IMisg P"IB
3444444* ofa 0, OM.44. M.-*,4*" ft w44. 66"". .445"am
NASA. Aim. E.-.... CI.44.. 2.34 Lmm4U T'. 34.. *43p444 C4.44.us 334 ".43".3.. oww.,4..4o4d ww. ... 44. .4.4144
MA"A LS4g4.y Rt.-.b. a. W. ft4.,. D..44 m-44.4.4. C..4w..C two0 awn,/-I. 344.4443 44.dls. Mum 44. p44om.C..4.4. L..Iel 44.44 5.0. 54444 .*45.4.44444. _j 14.4.44.. c.4.44s #Ad 4.444g 444." "AtM64 me"4.444
NASA. L..4. Roam-be C. 3. bu.y alk3 w4.4..h 4np4.1 *.- 0140 P44.
ftskmi.. 11m... W4 2.2I. Di...." 7T. 3414 tA olt.444. C..b. "U3M -&J../-. 5A.0.4. .1 mok44 I..4. I.add&*54.4.444.. A... F. 44414. -I,-.4. Uh .. "ime van mp" 4444444
4.4 M64.0"014.0 .. 4* ftmot o
tko4... C.,14 Cmp".4 W. W. L..4., D.Wm4 .444.444. C-lms4. Seto I4g mom4444 .rN-W I~4U
P.... 3A. 04.M. S.u "I Pb .04441bl .. 0..4. Is s.S. 0 ..u.4 .ft*" .4..g.4ma. selffC~sm' Ub"Uls. -" -4m. .- , .0p alp M ad4
Q.P. 4.L14.y
D.S..4 Lb-"444. py-t 3 4444 W -Itomm; *eh444 poop34.&
3.4 A-....4. Av4.4.. S.. 34. m. .,... 04/441
4... 14444.. C.I.Cm C b-.6
P-4I..ks4 -ft4 UM.4... r. DMchile 6. l wo~. 444444.4.4 C-b- mewm4.f ft4*4 .4m 444.
ml., 44.3
44.m.4,.. 4W.44444. 1.%.U-w Cm 4a44 ..#.449.4. W..9fi WA-, ~~~~ ~.44 .,..6- N.1 40_Wmmrt
4.3,3*e41 4,I4
M..p...4 . 3443444 . . I--.4444 4444
2.7r. V4k..
2.f Aww To*.. II4g. 4A 444,Si"
344.344 ." .a R.43,. 9. D. 1.5.. 7.. 16-444.44.bk4, Th- . 4 "4.,.3". 3.1 ""W ........... ll..W4.I4. P.Ak. CalHf. R.S. 344... u334tk.4344"A .. 44 .1. d - - 44u 0.4444N4ad 1 44 ean It"4344 ft4.
.K. &44.4 4344.34 4*94 .444 hf444 Otb-*d4 804 -6416 "444lf4. .444*44 ow44"7.14. 44434.. %4W-4. 44-0 16-1. .1IM, *44 owlise pho144ww.S.It. L M4. "4 - "-I4p.4. W4444.1w 3144
Th3.k.4 C4.ý..44 C-.,. F. V. 44444 44.444.41 3.4.. It...3444i 444454 4i4.4.341.44. 4.& 0. 04..- 4.4443
V4444.M W4., V.2J. L.-ic4 44044.4 Mok *ft*" 44444444444444
44.4.44444.9A0--`44 V. K4 4444 60-444444444444 W.
1bo.k.1Y. 3.443 1. p""4 An-444
1.34 LOW. City, V"4 .434
*V. am 4444 44..4444. S. P. P"pbwmy .- 04.t. pe44144444.&t1Gw~ at1.44 04*No . 4"aft" of fta..044444. 464445. .3.3 54444. $. 4404444 44060 OdO4&4"4

MOW*.. U..d.0%. A. J. smgmm 60-16 WPmhmbd$W so.M sk ml. o.. 1.hd
JoeTem =0mm . lbmmd. wig Pfb.ks Wimmo wa d. os
.0. A-imd. & IL L A. Abku*Wl pb#Odm"i.6W ~mA.A. Daib*pm
IMANWm. L hbimm. "kO MMOI
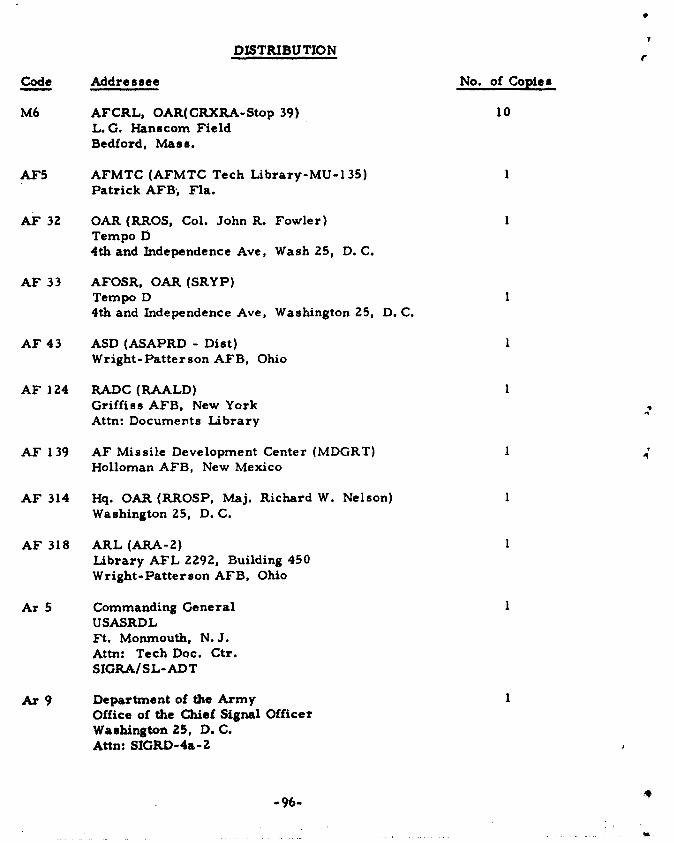
I
DISTRIBUTION
Code Addressee No. of Copies
M6 AFCRL, OAR(CRXRA-Stop 39) 10L.G. Hanscom FieldBedford, Mass.
AF5 AFMTC (AFMTC Tech Library-MU-135) IPatrick AFB;, Fla.
AF 32 OAR (RROS, Col. John R. Fowler) 1Tempo D4th and Independence Ave, Wash 25, D. C.
AF 33 AFOSR, OAR (SRYP)Tempo D 14th and Independence Ave, Washington 25, D. C.
AF 43 ASD (ASAPRD - Dist) IWright-Patterson AFB, Ohio
AF124 RADC(RAALD) IGriffiss AFB, New YorkAttn: Documerts Library
AF 139 AF Missile Development Center (MDGRT) 1 A
Holloman AFB, New Mexico
AF 314 Hq. OAR (RROSP, Maj. Richard W. Nelson) 1Washington 25, D. C.
AF 318 ARL (ARA-2) 1Library AFL 2292, Building 450Wright-Patterson AFB, Ohio
Ar 5 Commanding General IUSASRDLFt. Monmouth, N.J.Attn: Tech Doc. Ctr.SIGRA/SL-ADT
Ar 9 Department of the Army 1Office of the Chief Signal OfficerWashington 25, D. C.Attn: SIGRD-4a-2
-96-

DISTRIBUTION (Cont'd)
Code Addressee No. of Copies
Ar 50 Commanding Officer 1Attn: ORDTL-012Diamond Ordnance Fuze LaboratoriesWashington 25, D. C.
Ar 67 Redstone Scientific Information Center 1U.S. Army Missile CommandRedstone Arsenal, Alabama
Ar 107 U. S. Army Aviation Human Research Unit IU. S. Continental Army CommandP.O. Box 428, Fort Rucker, AlabamaAttn: Maj. Arne H. Eliasson
G 2 ASTIA (TIPAA) 10Arlington Hall StationArlington 12, Virginia
* 31 Office of Scientific Intelligence ICentral Intelligence Agency2430 E Street, N. W.Washington 25, D. C.
O 8 Library 2Boulder LaboratoriesNational Bureau of StandardsBoulder, Colorado
-G 68 Scientific and Technical Information Facility 1Attn: NASA Representative (S-AK/DL)P.O. Box 5700Bethe sda, Maryland
G109 Director ILangley Research CenterNational Aeronautics and Space AdministrationLangley Field, Virginia
N 9 Chief, Bureau of Naval Weapons 2Department of the NavyWashington 25, D. C.Attn: DLI-31
-97-

p
DISTRIBUTION (Cont'd)
Code Addressee No. of Copies
N 29 Director (Code 2027) 2U.S. Naval Research LaboratoryWashington 25, D.C.
I 292 Director, USAF Project RAND 1The Rand Corporation1700 Main StreetSanta Monica, CaliforniaTHRU: AF Liaison Office
M 63 Institute of the Aerospace Sciences, Inc. I2 East 64th StreetNew York 21, New YorkAttn: Librarian
U 32 Massachusetts Institute of Technology 1 IResearch LaboratoryBuilding 26, Room 327Cambridge 39, MassachusettsAttn: John H. Hewitt
A. Shores (Avco Holloman AFB) New Mexico I
Dr. Paul D. Jose 1Directorate of Research AnalysisSRLSAir Force Office of Scientific ResearchUnited States Air ForceHolloman Air Force Base, New Mexico
Lt. Col. Ralph W. ConnersChief Solid State SciencesAFOSRAtt. SRPSWashington 25, D.C.
Mr. Murray Klamkin
Division of Interdisciplinary Studies and ResearchUniversity of BuffaloBuffalo 26, N.Y.
Max SwerdlowAFOSRAttn: SRPSWashington 25, D.C.

DISTRIBUTION (Corc)' d)
Code Addrc-ssee
Dr. Nevin K. Hiester, ManagerStanford Research Institute'Menlo Park, California
MT. Clay P. ButlerRadiation Characteristics and Effecs Pk-U. S. Naval Radiological Laboratory,S-.in Francisco 24, California
Brig. Gen. Harold WalmsleyAsssoc. for Applied Solar EnergyArizona State Universityx empe, Arizona
Central Files
Document Control
6* lResearch Library
9
6i99


![THERMAL IMAGING GUIDEBOOK - flirmedia.com · THERMAL IMAGING GUIDEBOOK FOR FACILITIES MAINTENANCE. Table of Contents: 1] How thermal imaging cameras work 2 ... and water intrusion](https://static.fdocuments.in/doc/165x107/5b47a1fc7f8b9a252e8b889b/thermal-imaging-guidebook-thermal-imaging-guidebook-for-facilities-maintenance.jpg)