
00 intro v3 MM - Schlumberger
20
Transcript of 00 intro v3 MM - Schlumberger


PotentialIntrinsic
Carbonate reservoirs can be extremely challenging.Their complex lithology and porosity variations makethem difficult to characterize and develop efficiently.Improved borehole imaging and nuclear magneticresonance methods are helping to unlock thepotential of carbonate reservoirs around the world.For the first time, exploration teams feel confidentenough to target carbonates in small or evenmarginal fields. The key is modern techniques that provide unambiguous information on essentialreservoir parameters such as fracture distributions,and porosity and permeability variations.
In this article, Bob Dennis, Mahmoud Akbar and Mario Petricola explain how establishing a link between petrophysical and geologicalmeasurements is helping to deliver more-accuratereservoir models.
Contribution from Hitoshi Takezaki.
6
Num
ber 4, 2003
Middle East & Asia Reservoir Review
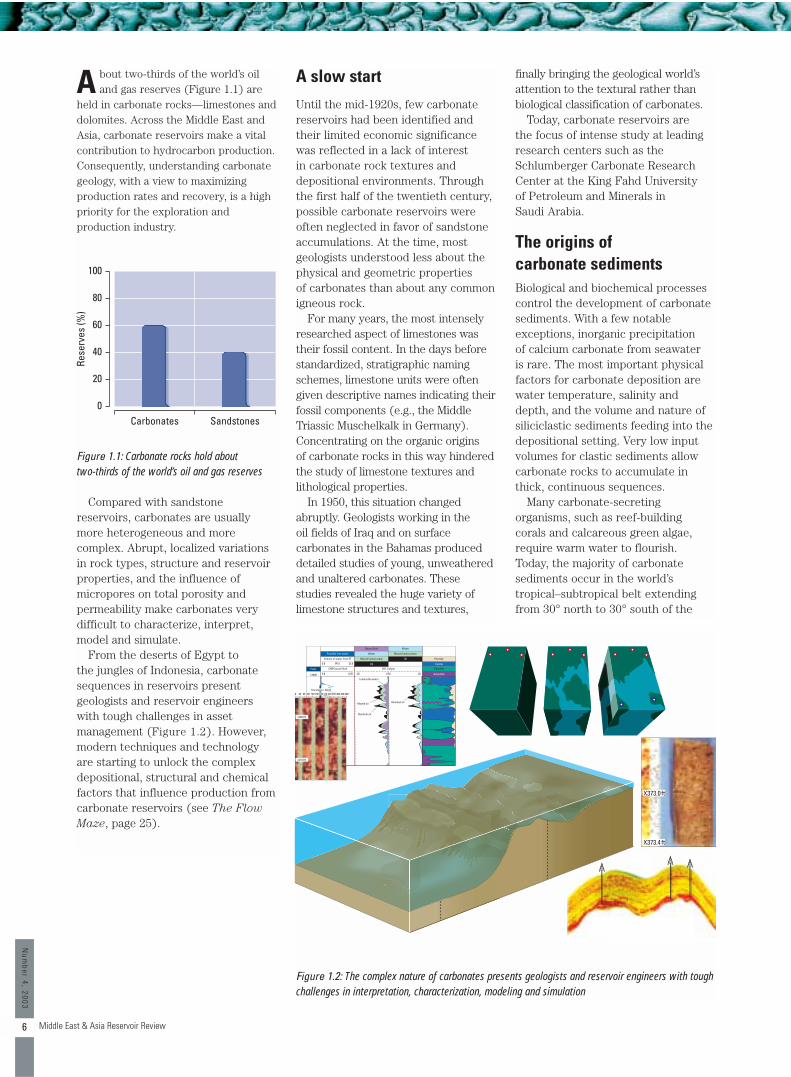
A bout two-thirds of the world’s oiland gas reserves (Figure 1.1) are
held in carbonate rocks—limestones anddolomites. Across the Middle East andAsia, carbonate reservoirs make a vitalcontribution to hydrocarbon production.Consequently, understanding carbonategeology, with a view to maximizingproduction rates and recovery, is a highpriority for the exploration andproduction industry.
Compared with sandstonereservoirs, carbonates are usuallymore heterogeneous and morecomplex. Abrupt, localized variationsin rock types, structure and reservoirproperties, and the influence ofmicropores on total porosity andpermeability make carbonates verydifficult to characterize, interpret,model and simulate.
From the deserts of Egypt to the jungles of Indonesia, carbonatesequences in reservoirs presentgeologists and reservoir engineerswith tough challenges in assetmanagement (Figure 1.2). However,modern techniques and technologyare starting to unlock the complexdepositional, structural and chemicalfactors that influence production fromcarbonate reservoirs (see The Flow
Maze, page 25).
A slow startUntil the mid-1920s, few carbonatereservoirs had been identified andtheir limited economic significancewas reflected in a lack of interest in carbonate rock textures anddepositional environments. Throughthe first half of the twentieth century,possible carbonate reservoirs wereoften neglected in favor of sandstoneaccumulations. At the time, mostgeologists understood less about thephysical and geometric properties of carbonates than about any commonigneous rock.
For many years, the most intenselyresearched aspect of limestones wastheir fossil content. In the days beforestandardized, stratigraphic namingschemes, limestone units were oftengiven descriptive names indicating theirfossil components (e.g., the MiddleTriassic Muschelkalk in Germany).Concentrating on the organic origins of carbonate rocks in this way hinderedthe study of limestone textures andlithological properties.
In 1950, this situation changedabruptly. Geologists working in the oil fields of Iraq and on surfacecarbonates in the Bahamas produceddetailed studies of young, unweatheredand unaltered carbonates. Thesestudies revealed the huge variety oflimestone structures and textures,
finally bringing the geological world’sattention to the textural rather thanbiological classification of carbonates.
Today, carbonate reservoirs are the focus of intense study at leadingresearch centers such as theSchlumberger Carbonate ResearchCenter at the King Fahd University of Petroleum and Minerals in Saudi Arabia.
The origins of carbonate sedimentsBiological and biochemical processescontrol the development of carbonatesediments. With a few notableexceptions, inorganic precipitation of calcium carbonate from seawater is rare. The most important physicalfactors for carbonate deposition arewater temperature, salinity anddepth, and the volume and nature ofsiliciclastic sediments feeding into thedepositional setting. Very low inputvolumes for clastic sediments allowcarbonate rocks to accumulate inthick, continuous sequences.
Many carbonate-secretingorganisms, such as reef-buildingcorals and calcareous green algae,require warm water to flourish. Today, the majority of carbonatesediments occur in the world’stropical–subtropical belt extendingfrom 30° north to 30° south of the
0
100
80
60
40
Rese
rves
(%)
Carbonates Sandstones
20
Figure 1.2: The complex nature of carbonates presents geologists and reservoir engineers with toughchallenges in interpretation, characterization, modeling and simulation
Figure 1.1: Carbonate rocks hold about two-thirds of the world’s oil and gas reserves

Middle East & Asia Reservoir Review
equator. Most of the carbonatesformed during geological time havebeen deposited in low latitudes.
Carbonate sands are found at higherlatitudes in Europe and off southernAustralia. The European examplesinclude deposits on the western coasts of Ireland and Norway, wherecalcareous red algae and mollusk shellfragments dominate the sediment.
Ancient carbonates—a note of cautionCarbonate sediments occurthroughout the world in everygeological period. In the Precambrian,the limestones are often dolomitic(i.e., they contain a large proportionof magnesium carbonate) and manyfeature mat-like structures(stromatolites) that were produced by blue-green algae.
When geologists say that “thepresent is the key to the past”, theymean that modern processes can helpto elucidate past events and revealthe details of former environments.Unfortunately, this is not always thecase with carbonate environments.
The distribution of carbonatesthrough the stratigraphic recordreflects the changing fortunes—evolution and extinction—ofinvertebrate animals with carbonatebody parts.
During the Phanerozoic, many of the creatures that contributed tocarbonate buildups evolved, flourishedand became extinct (Figure 1.3).Reef-building organisms of the pastwere, therefore, quite different tothose found in modern oceans. Thismeans that modern analogies withancient reefs are invalid, especially for reefs older than the Cenozoic.
A second major difference betweenmodern and ancient carbonatedeposits is the average width of theshelf on which they were deposited.Many ancient carbonate shelves weremuch wider than their moderncounterparts. In the Cretaceous, forexample, shallow (epeiric) seawayscovered vast areas of the continents.These areas are marked by thedeposition of widespread butrelatively thin (less than 700 m)limestone sequences. Modern oceanscontain no comparable setting—this is because of the relatively low sealevels that have persisted through theCenozoic to the present day.
Carbonates classifiedOne of the key differences betweenclastic and carbonate rocks is thedistance between the site where thesediment was created and where itwas deposited. While sand and siltmay travel hundreds of miles downriver systems before deposition andlithification, the grains that comprisecarbonate sediments are usuallydeposited very close to the placewhere they were created. Transport-related abrasion of carbonate grains is uncommon, and size sorting isgenerally very poor.
Most carbonate rocks are formedfrom accumulations of skeletalfragments—the remains of carbonate-secreting animals and plants.Although the animals are betterknown to geologists, it is the plants(particularly blue-green and redalgae) that, as a major food source formarine microorganisms, control thedistribution of carbonate sediments.
Numerous methods of carbonaterock classification have beenproposed over the past 50 years. The most widely accepted methodwas devised by R. J. Dunham in 1962.It concentrates on the features thatcontrol porosity and permeability, i.e.,grain–matrix relationships and mudcontent (Figure 1.4).
Cenozoic
Fora
min
ifera
Arch
aeoc
yath
ids
Spon
ges
Cora
ls
Stro
mat
opor
oids
Bryo
zoan
s
Brac
hiop
ods
Biva
lves
Gast
ropo
ds
Ceph
alop
ods
Trilo
bite
s
Ostra
cods
Echi
node
rms
Calc
areo
us a
lgae
Stro
mat
olite
s
CretaceousJurassicTriassicPermian
CarboniferousDevonianSilurian
Ordovician
Cambrian
Precambrian ? ?
? ?
?
Figure 1.3: During the Phanerozoic many of thecreatures that contributed to carbonate buildupsevolved, flourished and became extinct
7
Num
ber 4, 2003

8
Num
ber 4, 2003
Middle East & Asia Reservoir Review
BoundstoneThe components in a boundstonewere organically bound togetherduring deposition. Blue-green algaeand corals played a major role in thistype of carbonate sedimentation,producing laminated carbonates and coral reefs respectively.
GrainstoneGrainstones are grain-supportedcarbonates containing less than 10% lime mud. With very little mudblocking the pore space, grainstonesoften exhibit high porosity andpermeability at the time of depositionand after diagenesis. They have thepotential to become excellent
reservoir rocks. Many of the MiddleEast’s biggest and best-knowncarbonate reservoirs (e.g., Ghawar field in Saudi Arabia and Zakum fieldin Abu Dhabi) are grainstones. Thepore systems are predominantlyinterparticle, but microporosity ispresent in the grains and in the mudfraction of some grainstones.
The microporosity within agrainstone sequence may have arelatively simple diagenetic origin that results from the leaching andincomplete reprecipitation ofmetastable calcite, or it may beinfluenced by tectonic events such asuplift exposing the sequence to fresh-water leaching. The CMR* Combinable
Figure 1.4: The mostwidely acceptedmethod of carbonateclassificationconcentrates on thefeatures that controlporosity andpermeability, i.e.,grain–matrixrelationships andmud content
Magnetic Resonance tool can provideaccurate borehole measurements of thepore-size distributions in grainstonesequences. These measurements canbe very helpful for the geologicalanalysis of depositional environments,and can be used to identify the majordiagenetic modifications in a sediment.
PackstonePackstones also have a grain-supportedtexture, but the rock contains largeamounts of mud, so the originalporosity is lower than in grainstones.Packstones are found typically in lowerenergy environments than grainstones.
Mudstone
Less than10% grains
Mud supportedContains mud, clay and fine
silt-size carbonate
Depositional texture
recognizable
Lacks mud and is grain supported
Original components were bound togetherDepositional
texture recognizable
Depositional texture not recognizable
Wackestone
Grainstone
Boundstone
Crystalline
Packstone
Original components not bound together
during deposition
More than10% grains
Mud supportedContains mud, clay and fine
silt-size carbonate
Original components not bound together
during deposition
Depositional texture
recognizable
Grain supported
Contains mud, clay and fine
silt-size carbonate
Original components not bound together
during deposition
Depositional texture
recognizable
Original components not bound together
during deposition
Depositional texture
recognizable

WackestoneIn wackestones, the carbonate grainsfloat in an extensive mud matrix. Thisrock type is distinguished frommudstones by the proportion ofgrains—more than 10% of the totalvolume. Wackestones are typicallyfound in low-energy environments,behind a reef or in the deeper parts ofa carbonate shelf. The mud and grainfractions may contain micropores.
MudstoneThe low-energy environments in acarbonate sequence are characterizedby lime-rich mudstones with less than10% carbonate grains.
The variations in reservoirperformance for carbonate rocks makeit critical to examine the producingzone in detail and to characterize itaccurately before major productiondecisions are made. These rocks donot become reservoirs unless fracturedor affected by dolomitization.
Carbonates, like sandstones, occur in identifiable sequences thatreflect changing marine conditionsand environments. The bestinterpretations place each carbonateunit in a sequence context. Thisallows geoscientists to predict whattypes of changes in permeability andporosity may be anticipated above orbelow the zone of interest.
Porosity evolution incarbonate sedimentsPore systems in limestones fall intotwo categories—primary porosity(effectively unaltered sincedeposition) and secondary(diagenetic–tectonic) porosity.
There are three main types ofprimary porosity: ■ framework porosity—pore space
formed by rigid carbonate skeletalcomponents such as corals
■ interparticle porosity in carbonatesands that depends on grain size,shape and distribution
■ porosity in carbonate mudsprovided by features such asfenestrae (bird’s-eyes).
Secondary porosity includes■ molds, vugs and caverns formed
when grains or rocks are dissolved by groundwater
■ intercrystalline pores produced bydolomitization
■ fracture porosity formed by tectonicmovements.The porosity of carbonate
sediments is generally very high attime of deposition, but is reduced orlost through cementation, compactionand pressure solution. However, thisis not a one-way process. Porosity canincrease as a result of solution,dolomitization and tectonic fracturing(Figure 1.5).
1
10
100
1000
Deposition
Compaction
Fracturing
Leaching of cement
15Porosity (%)
30 45
Cementation Leaching of grains
Perm
eabi
lity
(md)
0
Figure 1.5: The porosity of carbonate sediments is generally very high at deposition, but is reducedor lost through cementation, compaction and pressure solution. However, this is not a one-wayprocess. Porosity can increase as a result of solution, dolomitization and tectonic fracturing
9
Num
ber 4, 2003
Middle East & Asia Reservoir Review
Diagenesis and cementationOnce the sediments have beendeposited, a range of chemical andphysical processes begin to modifythem—altering fundamental rockcharacteristics such as porosity andpermeability. This is known asdiagenesis.

10
Num
ber 4, 2003
Middle East & Asia Reservoir Review
At deposition, carbonate sedimentsoften have very high primaryporosities (35 to 75%), but thisdecreases sharply as the sediment islithified and buried to reservoir depths(Figure 1.6). Primary porosity inlimestones is quite different to that insandstones. Planar grain surfaces arerare in limestones, so pores tend to bepolyconcave micropores (Figure 1.7).The best primary limestone porositiesare in grainstones, especially oolitesand calcarenites such as back-reeflime sands.
Packstones, wackestones andmudstones that consist of purelimestone have a compact texture at time of deposition, and thiscompaction increases during burial.During burial, carbonate porosity isalmost always reduced. Burial-relatedcompaction can reduce the thicknessof a limestone bed by up to 30%under just a few hundred meters ofoverburden. However, the reductionof carbonate porosity by compactionis only really significant if thecarbonate remains uncemented.There is an inverse relationshipbetween cementation and compactionin limestones.
Calcium carbonate is so abundantthat cementation of carbonate rocks is always likely to happen. Otherminerals—such as anhydrite—dooccur in the cements of carbonaterocks, but sparry calcite derived fromthe limestone itself is by far the mostcommon cement. The process ofpressure solution is much moreimportant in carbonate rocks than inclastic rocks, and it is this processthat allows carbonates to generatetheir own cements. One indication ofpressure solution is the developmentof stylolites (or pressure seams),which are common features in manysequences. Under extreme conditions,cementation may continue until thecement becomes the single largestcomponent in the rock.
Counteracting this cementationprocess, is a susceptibility to solution in carbonated waters, which havetaken their carbon dioxide intosolution from the atmosphere, soils orother limestones. This solution processleads to the development of secondaryporosity, the ultimate development ofwhich is karst topography.
The tide goes out—the power of marine regression
The process most favorable to leachingis a marine regression that allows theexposure of carbonates to meteoric(surface) waters. Subsequenttransgressions bury the weathered,fractured zone (characterized by highsolution porosity) below anunconformity or at a depositionalbreak. Nearly all of the oil in the MiddleEast’s limestone reservoirs is pooled inthis type of reservoir and trap.
Chalks differ from most marinelimestones in being initially composedlargely of stable, low-magnesiumcalcite. This makes them much less
soluble than aragonitic limestones.Primary chalk pores are intergranularbetween coccoliths or their fragments.Porosity values as high as 70% arequite common at the sediment–waterinterface, but are reduced by pressuresolution and reprecipitation to just 15%at depths of around 2000 m and to zeroat 3000 m. However, a few fields (thelargest being the Ekofisk field in theNorwegian sector of the North Sea)produce prolific oil from chalkreservoirs that have primary porositiesof 30 to 40% at depths greater than3000 m. Preservation of this highporosity may be caused by either areduction in grain-to-grain pressuresthrough overpressuring of the whole
Freq
uenc
y
0 10 20 30 40 50 60 70 80
Porosity (%)
All ancient carbonate rocksCarbonate reservoir rocksRecent carbonate sediments
Figure 1.7: Planargrain surfaces arerare in limestones—so pores tend to be polyconcavemicropores, resultingin a primary porositythat is quite differentto that in sandstones
Figure 1.6: Once the sediment has been lithified and buried to reservoir depths, the primary porosity ofcarbonate sediments decreases sharply from the very high primary porosities (35 to 75%) at deposition

11
Num
ber 4, 2003
Middle East & Asia Reservoir Review
formation, or to the hindering ofcarbonate reactions by early entry of oil into the pore spaces.
Chalks are readily susceptible tofracture porosity and permeability.Matrix permeability is generally verylow (1 to 10 md).
DolomitizationGood porosity in carbonate reservoirsis often a result of recrystallizationand, most commonly, dolomitization.In the Gulf region, approximately 20% of hydrocarbon reservoirs aredolomites. The replacement ofcalcium carbonate by magnesiumcarbonate involves a 12.3% decreasein volume (and equivalent increase in porosity) if the replacement ismolecule for molecule. In many fieldswith partially dolomitized carbonatereservoirs, the oil is restricted to thedolomitized sections.
The selective nature ofdolomitization extends to its effects on the skeletal components of thecarbonate sediment. Aragonite is muchmore easily dolomitized than calcite, sothe shells of gastropods, cephalopodsand corals are dolomitized earlier thanthose of brachiopods, ostracods orechinoderms. Calcareous algae areeasily dolomitized because high-magnesium calcite is deposited onthem during their lives, and the algae themselves reduce the sulfatethat would otherwise inhibit thedolomitization process. The vast matsof algae in the epicontinental seas ofthe great Paleozoic transgressions areundoubtedly a factor in the prevalenceof Paleozoic dolomites. There is verylittle dolomite in the stratigraphicrecord since the Cretaceous.
In the Arab-D zone in the Jurassic of Saudi Arabia, principal productioncomes from detrital, bioclastic oroolitic limestones. Where oil isproduced from dolomites, however,the rocks that have been dolomitizedwere predominately micrites.
More about molds and vugsOil and gas geologists who work incarbonate reservoirs often spend a lot of time evaluating molds and vugs.Molds are pores formed by solution ofan existing rock particle such as a shellfragment, crystal or grain. Theresulting porosity is referred to as
moldic porosity and is describedaccording to the type of particleremoved (e.g., oomoldic for an oolitefrom which ooids have been dissolved).
If the leaching of the originalparticle passes the point at which itcan be identified, the hole is referredto as a vug (Figure 1.8). This factor,not the size of the hole, determineswhether it is a mold or a vug. Extremeexamples of vugs include the cavernsthat develop in some limestonesequences as a result of dissolutionover thousands or millions of years.
The MDT* Modular FormationDynamics Tester helps geoscientiststo characterize vuggy reservoir zonesfrom cores or borehole images(Figure 1.9). While testing vuggyzones, the MDT tool can beconfigured to include an inflatablepacker module that allows users toachieve a seal and test the best vuggyor fractured intervals.
The distribution of primaryporosity, and often secondaryporosity, is facies controlled. Rocksoccur in characteristic assemblages
Figure 1.8: Stages in the development of molds and vugs
Figure 1.9: The MDT tool helps geoscientists tocharacterize vuggy reservoir zones identified incores or borehole images
X340 ft
X343 ft
0 30 60 90 120 150 180Orientation: north
210 240 270 300 330 360

12
Num
ber 4, 2003
Middle East & Asia Reservoir Review
or facies that are controlled by thedepositional environment. Certainfacies, such as reefs and fore reefs,have high primary porositiescompared to other facies, such asfine-grained lagoonal deposits orouter-shelf carbonates. Therefore, to assess reservoir potential,geoscientists must conduct detailedstudies of depositional environments.
Porosity measurement usingconventional logs andborehole images
In the past, downhole porositymeasurements were made usingwireline logs, logging-while-drillingmethods and core analysis. Inhomogeneous carbonate sequencesthis approach is generally adequate—log porosities usually provide areasonable estimate of core values.However, in heterogeneous carbonateunits that have complex pore systems(particularly as a result of leaching ordissolution, cementation anddolomitization) there are importantdiscrepancies between core- and log-derived porosity values. To makematters worse, thin interbeds of highand low porosity, which have a majorinfluence on production, cannot beidentified on conventional logs becausetheir vertical resolution is 2 to 3 ft.
Geoscientists have developed a new method to generate a porositylog with a vertical resolution down to 0.2 in. This takes into account theheterogeneities of the reservoir asexposed in the wellbore.
This high-resolution porosity logand the entire porosity spectrumaround the wellbore rely on the use of borehole images as constraintsafter calibration using log porosityand resistivity. This innovativemethod is helping to revolutionize the characterization of carbonatereservoirs. It allows users to■ identify thin-bed sequences that
alternate between high and lowporosity
■ quantify secondary, vuggy andmoldic porosity
■ characterize carbonate facies androck types.In Abu Dhabi, the Shuaiba
formation comprises rudist carbonatebuildups with associated back- andfore-reef limestones. The formation ischaracterized by 17 different reservoirrock types. PoroSpect* carbonateporosity solution results showed thatsome of the reservoir zones containedthin beds with highly variablealternations between high and lowporosity values.
The porosity histograms and variabledensity porosity displays provided by the PoroSpect method show a
narrow and unimodal distribution,indicating that the lime mud interval is homogeneous. However, they alsoshow broad and bimodal/complexporosity distributions for the algalfloatstone interval, indicating itsheterogeneous nature.
Figure 1.10 highlightsheterogeneities in Shuaiba limestonecaused by dense, cemented(recrystallized micrite) patches andlayers and high-porosity stringers.The limited vertical resolution andunidirectional measurement of thenuclear porosity log cannot resolveheterogeneities such as these. Theenhanced porosity log obtained usingthe PoroSpect solution, however,clearly identifies the heterogeneitiesand indicates lower porosity values(than those from conventional logs)across the dense features and highervalues (than log porosity) across thethin, porous intervals.
Depositional environmentsThe facies dependence of fundamentalreservoir properties such as porosityand permeability makes it essentialthat geoscientists understand thedepositional environments for theircarbonate reservoirs.
Many reservoir limestones weredeposited on broad shelves andplatforms that often bordered deeper
FMI dynamic image 0.5 0(%)
FMI average porosity
FMI average FMI average porosityporosity
Secondary porosity
Dense patchesDense patches
Unimodal distributionUnimodal distribution
FMI average porosity
Dense patches
Unimodal distribution
Porous patchesPorous patches
Unimodal distributionUnimodal distribution
Porous patches
Unimodal distribution
Log average porosity Log average
porosity
0.4 0(%) 0.4 0(%)FMI por. hist.
0.5 0(%)FMI por. hist.
(ft)
X3
X4
X5
X6
X7
X8
X9
X6
X7
X8
X9
X0
X1
X2
FMI dynamic image(ft)Figure 1.10: TheseFMI* FullboreFormationMicroImager imagesand porosityhistograms highlightthe nature ofheterogeneities in asection of Shuaibalimestone caused bydense and relativelyhigh porosity streaksthat are not pickedup by nuclearporosity because of their smallervertical bed

13
Num
ber 4, 2003
Middle East & Asia Reservoir Review
basins. Carbonate facies are generallyarranged in a broad pattern from theshore zone out to the shelf break.
In the near-shore and intertidalareas, mud flats dominate, passinglandwards into evaporite depositstypical of sabkhas and salinas ifsituated in an arid belt. Modernsabkhas and salinas can be seen inmany places across the Middle East.
In the main shelf area, carbonateskeletal sands may form barriers,beaches and shoals. Carbonate tidaldeltas and sites of ooid deposition maydevelop along barrier coastlines at themouths of major tidal channels thatconnect lagoons and the open sea.
Reefs and other forms of carbonatebuildup develop along the shelf margin,
and may also form lagoonal barriers.Small patch reefs often form on theshelf and within the open lagoons.
There are three key depositionalenvironments:■ Carbonate shelves—during
transgressions gently slopingshelves and platforms becomecovered by shallow water carbonatesediments. Biogenic limestonesbuild up on the shelf, and algal andforaminiferal limestones (includingpatch reefs) are well developed.Relatively continuous reefs maygrow along the shelf edges. Thedepositional units in this settingare typically interrupted anddiscontinuous, both laterally andvertically. This variation presents
a major challenge for reservoirgeologists and engineers (Figure 1.11a).
■ Carbonate banks or ramps—gentlysloping carbonate platforms thatpass, without abrupt changes ofslope, from shoreline to basin. Unitsin a typical shelf sequence havewide lateral continuity, making forvery easy stratigraphic and/or faciescorrelations (Figure 1.11b).
■ Reefs form on shelves and ramps.Linear reefs—the trends oftenfollowed by explorationists aregenerally developed at the edges of shelves.
Open littoral Open-reef shoals
Back-reef shoals Reef wall Fore-reef shoals Fore-reef basinReef talus
slopeFore-reef
transition zone
Fore-reef transition zone Open basin
Boundstones of reef
Grainstones of reef talus
Grainstones and wackestones of back reef and top reef
Packstones and wackestones of upper shelf slope (fore reef)
Wackestones and mudstones of lower shelf slope and basin
Clastics and evaporites of littoral zone and sabkha
Sea level
Sea level
Upper FarsMiddle Fars
Lower Fars
Spatnagid shales Spatnagid shales
Cap rock anhydrite
Eocene limestone
Khamir limestone
Lower Miocene absentor in a gypseous facies
Naft Khaneh
Pliocene and upper Miocene
Tortonian
Helvetian
Burdigalian
Upper Eocene
Aquitanian and Oligocene
Lurestan
NW SE
Shiraz KhamirBakhtiariAghaJari Gachsaran
Kalhur gypsum
Kalhur limestone Upper Asmari limestone
Lower Asmari limestone
Brissopsis beds
km
0 200
Figure 1.11a: Idealized shelf cross section
Figure 1.11b: Idealized ramp cross section

14
Num
ber 4, 2003
Middle East & Asia Reservoir Review
Coral reefs can be classified intothree main types: fringing reefs,barrier reefs and atolls (Figure 1.12).On ramps, the reefs develop asisolated features, making them harderto locate and exploit when they arehydrocarbon bearing.
Producing hydrocarbonsfrom carbonate reservoirsCarbonate reservoirs exhibit a muchgreater range of producibility than their sandstone counterparts. Themost-prolific, sustained productionrates ever recorded have come fromcarbonate reservoirs, and most of thosewere fractured or vuggy limestonesrather than dolomites. The Asmarilimestone fields in Iran provide some of the most spectacular examples. Atthe peak of its output, the Agha Jarifield was producing more than100,000 m3 of oil every day fromaround 35 wells. At the oppositeextreme, are hundreds of tightlimestone reservoirs, commonlysiliceous, micritic or chalky, that will not yield their oil at all.
Log interpretation ofcarbonate reservoirsFormation evaluation in carbonatesequences (particularly thosecontaining evaporites) is verydifferent to that for sandstone–shalesuccessions.
The complex pore systems found in some carbonate oil reservoirs aredifficult to evaluate. Borehole imagerycan define fractures and faults in thewells and remove major uncertaintyfrom formation evaluation. Standardopenhole well logs provide porosityand saturation information, but thesedata are often insufficient for theevaluation of complex, high-resistivitycarbonate sequences.
In some cases, apparent porosity andsaturation can be misleading, giving afalse indication of which fluids will flowand of the flow rates from a particularzone. Low-porosity layers can have thehighest permeability in a reservoir, andthe highest-porosity interval may becomposed entirely of micropores and,therefore, will be impermeable. In somewells, zones described as having highwater saturations may flow dry oil, and
tar mats may be interpreted incorrectlyas oil zones.
The poor performance ofconventional logs has forcedgeoscientists to rely on extensivelaboratory analysis to evaluatecarbonate sequences. Modern downholemethods are helping to change this,particularly nuclear magnetic resonance(NMR) systems such as the CMR tool.
NMR technology has advancedsignificantly since the 1980s, and nowprovides several reliable applicationsfor reservoir evaluation. Theseinclude: effective and total porosity;capillary-bound and producibleporosity for water cut potential;permeability for reservoir quality; andpore-size distributions that help withfacies identification and mapping. The pore-size distribution allowsgeoscientists to identify microporosityand determine capillary-bound wateror irreducible water saturations.
To get the most from the CMR tool,core petrophysicists, log analysts andgeologists must cooperate.
Combining the CMR tool with anFMI survey, geoscientists can detectand quantify pore sizes ranging frommicropores to megapores, which inthe most general sense includes openfaults that may extend up into a gaszone or down into an aquifer.
Initially, logging speeds in carbonateswere relatively slow, but the latestgeneration CMR tool has revolutionizedNMR logging. The CMR-Plus* CMRlogging tool with high logging speedcapability offers enhanced precision.This compact tool (less than 16-ft long)delivers high-resolution data onreservoir permeability, water cut andhydrocarbon pore volume at muchhigher logging speeds than previousgenerations of NMR tools. In MiddleEast carbonates, engineers run theCMR-200* Combinable MagneticResonance tool at 200 ft/hr and theCMR-Plus tool at about 600 ft/hr. Theseanswers are invaluable for the initialevaluation of the reservoir and as inputinto the completion design to enhancewell performance.
Figure 1.12: Coralreefs can beclassified into threemain types, fringingreefs (top), barrierreefs (middle) andatolls (bottom)

Figure 1.13: The FMIimage, NMR logresponse and coreappearance fortypical grainstonesare shown
15
Num
ber 4, 2003
Middle East & Asia Reservoir Review
Facies estimation in acarbonate reservoirAt Sabriyah field in Kuwait,geoscientists have integrated logcharacteristics and textural signaturesfrom image data to develop apragmatic facies classification that isvalidated by core data.
The study used a neural networkapplication (RockCell* advancedmultiwell lithology/facies classification)to integrate information from coreswith data from conventional logs,nuclear magnetic resonance andborehole images. This provided a faciesdatabase for the Mauddud carbonatereservoir that could be used to predictfacies from log measurements inadjacent, uncored wells. The inputs to the RockCell classification includedconventional porosity logs, texturalinformation from the CMR pore-size
data, and heterogeneity curves derivedfrom the FMI tool.
The results were calibrated witheight core-derived facies (based onDunham’s texture classification) inthe reservoir section. Severalnetworks were trained iteratively and the best one selected for faciesestimation over the entire loggedinterval. The resulting log-derivedfacies information was validated withthe core-derived classification.
Facies analysis and reservoir heterogeneity The combination of borehole imagingand nuclear magnetic resonance isgaining wider acceptance for visualtexture analysis and rock typeidentification.
The high vertical resolution of theFMI tool can identify subtle variationsin rock fabric. The borehole image
analysis application BorTex* textureclassification describes the FMIimages quantitatively, and relatesthem to a description of reservoirheterogeneity. The pore-sizedistributions and permeabilityinferences that geoscientists makefrom NMR measurements help themto describe microtextures and toestimate reservoir quality incarbonate reservoirs.
The FMI image, NMR log responseand core appearance for typicalgrainstones are shown in Figure 1.13.The calibration of lithological faciesand FMI image-derived facies hasbeen the basis for launching the log-based neural network facies analysis.
Once the geologists have dividedthe reservoir section into zones on the basis of facies or texture, theRockCell application can create adatabase of the zones and relate them
0 360
ConductiveResistive
240120FMI image
.021 FMI . DYNA (C48)Horizontal scale 1 : 17.8
FMI texture
0: <Undefined facts1: Mb/Ml2: Lwd3: lpg4: Lgd5: Lgc6: Lgb7: Sb8: Sl
1st facies( )0 8
1st facies( )0 100
2nd facies( )0 100
AMP_DIST.C( )0 30
T2-distrib.( )0 30
CFF4.CMR.1(ft3/ft3)0.3 0
Perc./cumul.( )1 1
CFF1.CMR.1(ft3/ft3)0.3 0
CFF2.CMR.1(ft3/ft3)0.3 0
CFF3.CMR.1(ft3/ft3)0.3 0
CFF5.CMR.1(ft3/ft3)0.3 0
CFF6.CMR.1
Lst. de. (300–30µm)
Clay (0.3–3µm)
Micropore (≥3µm)
Lst. de. (300–30)
Cond. connected 8 pots
Cond. isolated 8 pots
Res. patches
Res. spots
Small pore (10µm)
Med. pore (30–1µm)
Large pore (100–3µm)
(ft3/ft3)0.3 0
NMRpore size
Core facies
16
Num
ber 4, 2003
Middle East & Asia Reservoir Review
to facies types. For example, acarbonate texture could be describedas layered or massive with strongdiagenetic imprints, while porositytypes can be attributed to vugs,moulds, karst, inter- or intraparticleporous patches resulting fromdiagenesis, bioturbation orpreferential cementation. Denselimestone areas and porous sectionswith residual hydrocarbon areresistive and are pale areas on theimages. The darker areas correspondto shale, mud-invaded porous rocks,vugs and moulds.
The result is a conductivity–resistivitymap of heterogeneities on the boreholewall. Information obtained from the FMIimage-derived heterogeneity analysisincludes depth-indexed continuouscurves for the proportion and size ofeach type of formation heterogeneity.Resistive spots are shown in dark blue,while large resistive patches are paleblue. The conductive events are furtherclassified into large patches, connectedspots and isolated spots. The neuralnetwork was trained to identify anddistinguish each of these. Theirproportions are displayed in differentcolors along the images as magenta, redand orange respectively. The curves areaveraged over a 1-ft window andoutput at 6 in. to match the scale ofconventional logs.
Facies description Eight characteristic rock types wereidentified from Mauddud reservoircores: mudstone, clay-bearing skeletalwackestone, clean packstone,glauconitic packstone, skeletalpackstone (profuse and diffuse clay-bearing), bioturbated/laminatedskeletal/peloidal grainstone, bioturbatedsandstone and laminated sandstone.
In the study well, the faciesdivisions were made using the texturalfacies from images, electrofacies fromconventional openhole logs, andmicrotexture and permeability valuesfrom the NMR data.
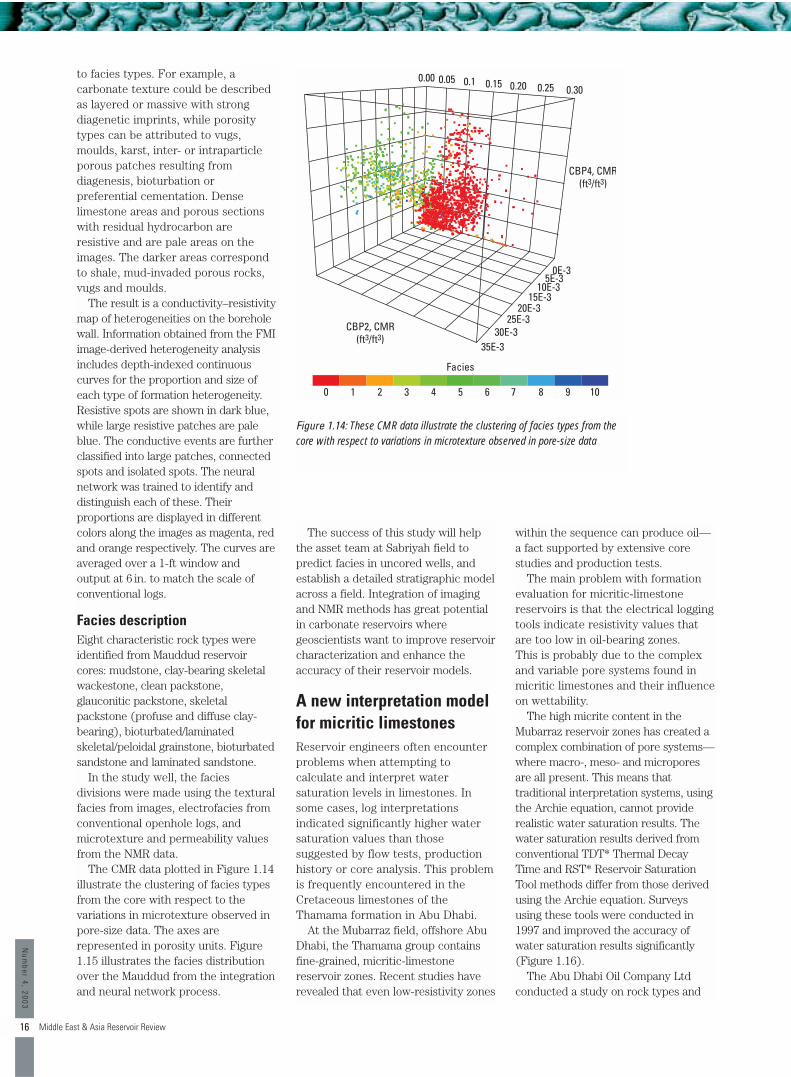
The CMR data plotted in Figure 1.14illustrate the clustering of facies typesfrom the core with respect to thevariations in microtexture observed inpore-size data. The axes arerepresented in porosity units. Figure1.15 illustrates the facies distributionover the Mauddud from the integrationand neural network process.
The success of this study will helpthe asset team at Sabriyah field topredict facies in uncored wells, andestablish a detailed stratigraphic modelacross a field. Integration of imagingand NMR methods has great potentialin carbonate reservoirs wheregeoscientists want to improve reservoircharacterization and enhance theaccuracy of their reservoir models.
A new interpretation modelfor micritic limestonesReservoir engineers often encounterproblems when attempting tocalculate and interpret watersaturation levels in limestones. Insome cases, log interpretationsindicated significantly higher watersaturation values than thosesuggested by flow tests, productionhistory or core analysis. This problemis frequently encountered in theCretaceous limestones of theThamama formation in Abu Dhabi.
At the Mubarraz field, offshore AbuDhabi, the Thamama group containsfine-grained, micritic-limestonereservoir zones. Recent studies haverevealed that even low-resistivity zones
CBP4, CMR(ft3/ft3)
CBP2, CMR(ft3/ft3)
0 1 2 3 4 5 6 7 8 9 10
Facies
0.00 0.05 0.1 0.15 0.20 0.25 0.30
0E-35E-3
10E-315E-3
20E-325E-3
30E-335E-3
Figure 1.14: These CMR data illustrate the clustering of facies types from thecore with respect to variations in microtexture observed in pore-size data
within the sequence can produce oil—a fact supported by extensive corestudies and production tests.
The main problem with formationevaluation for micritic-limestonereservoirs is that the electrical loggingtools indicate resistivity values thatare too low in oil-bearing zones. This is probably due to the complexand variable pore systems found inmicritic limestones and their influenceon wettability.
The high micrite content in theMubarraz reservoir zones has created acomplex combination of pore systems—where macro-, meso- and microporesare all present. This means thattraditional interpretation systems, usingthe Archie equation, cannot providerealistic water saturation results. Thewater saturation results derived fromconventional TDT* Thermal DecayTime and RST* Reservoir SaturationTool methods differ from those derivedusing the Archie equation. Surveysusing these tools were conducted in1997 and improved the accuracy ofwater saturation results significantly(Figure 1.16).
The Abu Dhabi Oil Company Ltdconducted a study on rock types and

17
Num
ber 4, 2003
Middle East & Asia Reservoir Review
the wettability of limestone based on core descriptions, pore textures and SCAL* special core analysismanagement software data. This studyconfirmed that there were three typesof pores in the formation (distinguishedby pore-throat size) and thatwettability could change.
Pore texturesThe three basic elements in theThamama Group at Mubarraz field arepeloidal grain, micrite particle andmicrite crystal (Figure 1.17). The size ranges for these components
are 100–300 µm, 10–20 µm and 1–2 µmrespectively. Interparticle pores madeup of these elements are divided intothree categories by pore-throat radius:■ macro >4 µm■ meso 0.3–4 µm■ micro <0.3 µm.
The CMR tool was used tocharacterize the reservoir’s poresystem. Engineers also devised a newsaturation equation that would yieldresults in agreement with empiricalevidence such as core analysis andproduction tests. This new saturationequation (based on a triple-pore
system) is a direct and effectiveextension of the dual-porosity model.
The saturations in the three types of porosity are computed sequentially,faithfully following the oil migrationreservoir model that states that oilmigrates into the macropores (quicklymaking those pores oil wet) and theninto the mesopores, while themicropores remain largely water filled.
XX400
XX450
XX500
XX550
SW-ELAN
SW-RST
1.0 0.0
Mezopore
Macropore
Micrite particle
Grain
Figure 1.16: TDT and RST methods improvedthe accuracy of water saturation estimates
Figure 1.17: The three basic elements in theThamama Group at Mubarraz field are peloidalgrain, micrite particle and micrite crystal
Figure 1.15: Thefacies distributionover the Mauddudunit from theintegration andneural networkprocess
FormationTop7263
7627
Mudstone Wackestone Clean packstone
Glauconitic packstone Skeletal packstone,clay bearing
Skeletal peloidalgrainstone bioturbated/laminatedBioturbated sandstone Laminated sandstone
NameOpenholelog data
MD(ft) FMI dynamic image Facies
727072807290730073107320733073407350736073707380739074007410742074307440745074607470748074907500751075207530754075507560757075807590760076107620

18
Num
ber 4, 2003
Middle East & Asia Reservoir Review
Fractured carbonate—an oil and gas bonanzaThe first clue to the presence of effective fracture porosity andpermeability is well performance.Wells yield better test results andhigher production rates than theproperties of the producing horizonsuggest would be possible.
Identification of the fractures intheir true subsurface state is not easy.In the past, geologists had to piecetogether fracture models from cores,but this was not very effective. Coresamples can reveal low matrixporosity (indicating that fracturesmust be present to account for highproduction rates), but they do notpreserve fractures in their originalstate and orientation.
Modern downhole imagingtechniques help the geologist toidentify fractures in situ, and to recordtheir orientation, aperture and anymineralization that may be present.
The most famous fracturedcarbonate reservoirs are in theOligo–Miocene Asmari limestonefields of Iran. Figure 1.18 is asimplified cross section of the AghaJari oil field. The reservoir limestone,more than 300-m thick, has beenfolded into concentric flexures.Average matrix porosity is about 8%and the permeability is just 1 md.
Easy and rapid fluid migration ismade possible, however, by lateraland vertical, free connection offissures in the reservoir rock.
The fractures do not control oilstorage, but control the productionrate because the wells receive oil fromthem. The fractures are replenishedfrom a much larger source volumewith a more limited flow rate.
Subtle traps and smaller reservoirsMost of the world’s giant anticlines and large reef structures have beensurveyed and drilled. New discoveriesin reefs and carbonate shoals are likelyto be smaller than those already inproduction, and will probably be foundonly through careful, step-by-stepprocessing and informed interpretationof high-resolution seismic surveys.
In many carbonate settings, thedistribution of oil and gas is controlledby the depositional characteristics ofthe sediment.
The first step is a preliminaryinterpretation of the structure, seismicsequence analysis and interpretation of depositional facies. The next stepproduces a complete interpretation of the depositional environment using all available data. The final step issynthetic modeling to check theinterpretation and to give an
indication of the geophysical riskfactors involved.
Risk evaluation is vital inexploration projects, particularlywhere the seismic, structural anddepositional interpretations are basedon limited data sets. Explorationistsoften have to deal with very complexsedimentological and structuralproblems in prospective areas. Theiraim is to understand the detail ofreservoir variations, while drawing allof the available data into a definitivepicture of the reservoir developmentand overall hydrocarbon potential.
Sequence stratigraphy is a vital tool in the description of carbonatesequences and guides the explorationteam to the zones most likely tocontain oil and gas (Figure 1.19).Sequence stratigraphy attempts toclassify sediments and sedimentarypackages by their relationships tochanging sea levels for local andglobal water-depth variations. This allows the explorationist todefine different sequences and theimportant sequence boundaries thatare created when sea level falls.
Sequences and their boundarysurfaces can be identified on seismiclines—giving vital clues to thestructure and probable composition of sediments. Micropaleontology helpsthe exploration team to confirm thedepositional setting.
Many gas seepages
Upper Farsand Bakhtiari
Upper Farsand Bakhtiari
Asmari limestone
Eocene–Oligocene
Cretaceous and olderCap rock
Middle FarsLower Fars stage I and II
Lower Fars stage III
Figure 1.18: The Agha Jari oil field in Iran andits prolific, fractured carbonate reservoirs

19
Num
ber 4, 2003
Middle East & Asia Reservoir Review
Indonesian experience—the Oseil fieldSeram Island in Indonesia is located onthe northern rim of the Banda arc. It issituated in a strongly compressionaland overthrust setting. The oceaniccrust of the Banda Sea and a volcanicisland arc lie to the south; while in theSeram trough to the north of the islanda portion of the Australian plate isbeing subducted (Figure 1.20).
Oil has been produced in Seramsince 1896, when Dutch operatorsdeveloped the Bula oil field from oiland gas seeps in the northeasternpart of the island. More recently,Kufpec has discovered commercial
quantities of oil in the Jurassiccarbonate reservoirs of the Oseil field.Calcareous shales and argillaceouslimestones are believed to be the mainsources for oil and gas in the fracturedManusela limestone reservoirs.
The Manusela reservoir isessentially a limestone in whichhydrocarbon storage is provided bymacro- and microfractures of tectonicorigin. This dual-porosity system isinterpreted as offering good drainageof reserves, with overall recoveryestimated at approximately 34%.
It is anticipated that horizontalwells will prove to be an optimum wayof developing the Manusela carbonateand increasing ultimate recoveries.
Sequence boundary
Ceno
man
ian
Albi
an
Nat
ih fo
rmat
ion
c
d
e
f
g TST I
TST II
Maximum flooding surface II
HST ILowstand I
HST II
X600
X500
X400
X300
a/b
BasinDepth
(m)
0 100
Gamma ray log
0 100
Gamma ray logPlatform edge
Nah
r Um
r fm
n
Sequ
ence
I
Sequ
ence
II
Maximum flooding surface I
Figure 1.19: Sequence stratigraphy is a vital tool for the characterizationand exploitation of carbonate reservoirs

20
Num
ber 4, 2003
Middle East & Asia Reservoir Review
Discovery and development
In 1993, the Seram production-sharingcontract partners drilled the Oseil-1wildcat discovery well. Located at theeastern end of a 6000-acre structuralclosure, the well tested oil from twozones in the thick, Jurassic Manuselalimestone at a combined rate of6000 BOPD, limited by pump capacity.The discovery was 23-km inland fromexisting facilities at Bula.
Appraisal well Oseil-2, around 5-kmnorthwest of Oseil-1, was drilled in July1998 and suspended as a future oilproducer. An oil column in excess of200 m was encountered and the wellflowed at rates from 685 to 2112 BOPD.
The third appraisal well was drilledin August 1998. Of the three wells, thiswas the most successful, flowing at anaverage rate of 6377 BOPD and1.1 MMscf/D gas over the interval2067–2156 m.
Kufpec, as operator on behalf of theKalrez, Kufpec and Canada NorthwestEnergy joint venture, is leading thedevelopment of the Oseil discovery. Itis anticipated that Oseil will producebetween 12,000 and 14,000 BOPDduring phase 1 of production,increasing to 45,000 BOPD duringphase 2.
Figure 1.20: Seram Island is situated in astrongly compressional and overthrust setting,with the Banda Sea oceanic crust and avolcanic island arc to the south, and the Seramsubduction trough to the north, where part ofthe Australian plate is being consumed beneaththe island
Seram trough
Australian plate
Australian plateBanda Sea
(oceanic crust)
Ambonvolcanic arc
Ocea
nic
crus
t
Seram thrust beltThrust belt
foreland basinsAccretionary
wedge and mélange
Pre-Triassic
Triassic to upper Miocene
S N
Wahai basin
Bula
Walio
Mogoi
Wiriagar
Wasian
Vorwata
Roabiba 1Ubadari 1
KasimKlalin
Oseil-1Bulabasin
Kepala Burung foredeep basin
Misool
Seram Island
Salawati basin
Berau basin
Bintunibasin
Onin
Kumawa
Sorong fault zone
Waigeo
Weda basin
Ayamaruplateau
Aiduna fault
Yapen fault
Ransiki fault
Wandam
enfault zone
Lenggurufold
belt
Argunithrust
Sekakridge
Tosem block
Seramtrench
Misool Onin anticline
km
0 100
BasinsContinental crustMiddle Miocene igneous rocks

21
Num
ber 4, 2003
Middle East & Asia Reservoir Review
Seram exploration
The majority of the 7620 Seramexploration areas remains virtuallyunexplored. Two deep wells, BolifarUtara-1 and East Neif-1, were drilledin 1988, prior to the Oseil discovery.Both recovered low-to-medium API oil from within the Manusela limestoneand gas from shallower levels.
The balance of the block has beenexplored with field geological, gravity,magnetic and seismic surveys. Morethan 12 prospects and leads havebeen identified, including severalsimilar to the Oseil structure. Theserepresent considerable upsidepotential for the joint-venturepartners, and significant explorationeffort is likely in the future.
Ongoing challenges Carbonate reservoirs will continue to pose the familiar challenges ofcomplex lithology and porosityvariations. But geoscientists now havethe necessary tools to make sense ofcarbonate complexity and to developthe reservoir accordingly.
Recent advances in analyticaltechniques such as borehole imagingand NMR are unlocking the vastpotential of carbonate fields aroundthe world. In the past, explorationteams would only be able to find and exploit the largest of carbonatereservoirs (Figure 1.21)—uncertaintyand the economic consequences ofdeveloping small, marginal fields wereenough to discourage most operators.Modern methods for establishing thedetails of reservoir dimensions andother crucial characteristics, such asthe distribution of open fractures anddetailed maps of porosity andpermeability, are making even smallcarbonate accumulations much moreattractive prospects.
The integration of core samples withconventional logs (such as lithologyand porosity) with image analysis ofrock texture and other methods forthe assessment of reservoir quality—such as Stoneley analysis—help assetteams to develop a facies database fortheir carbonate reservoirs.
This drive towards greaterintegration of technology will improvereservoir characterization, establish alink between petrophysical andgeological measurements, and delivermore-accurate reservoir models.
Figure 1.21: This ancient Triassic reef in Oman indicates the scale of the large, oil-bearing structuresfound in the Middle East. Many of the world’s largest carbonate reservoirs have already enteredproduction, and future field developments will require innovative methods to locate and exploitsmaller structures

22
Num
ber 4, 2003
Middle East & Asia Reservoir Review
A fter graduating in geology in 1988, Salem joined the Abu Dhabi
National Oil Company and has heldvarious operational, technical andmanagement assignments in on- andoffshore operating companies in AbuDhabi and overseas.
Salem has seen significant changes inthe industry over the past decade andhas a clear understanding of the keyissues influencing the development ofcarbonate reservoirs.
“The main challenges we face in our carbonate sequences are linked touncertainty,” he says. “This uncertaintyis reflected in abrupt facies changeswithin the reservoir, and difficult-to-answer questions about the extent andinfluence of reservoir fractures, andthe role of thief zones and diageneticeffects. We are committed to applyingthe most appropriate technology in ourfields and are always happy to field-test new equipment and techniquesdeveloped by service companies suchas Schlumberger. One of the majorchallenges is assessing permeabilityvariations and how they affect oil and
gas production. If I could have onesolution, here right now, it would be a tool that measured permeabilitydirectly. That would make a hugedifference to our development andproduction planning.”
Modern computing technology and integrated reservoir modelingsystems have helped to improve fieldmanagement. At the start of the 1990s the various oilfield disciplinesworked in separate teams of geologists,petrophysicists and reservoirengineers. Since then, integrated teamworking has become standard practicein Abu Dhabi, with multidisciplinaryteams working together to assess andreduce uncertainty—as Salem explains.
“Before 1995, geologists dealtpurely in facies descriptions. This wasfine when geologists wanted to talk toother geologists, but very frustratingfor a colleague who happened to be a reservoir engineer. The geologist’sdescriptive classification of rock typesand relationships could not give theengineer values for properties such as porosity, permeability and capillary
Salem Rashed Al Matroushi is Team Leader, Best Practice and SkillsManagement at the Abu Dhabi National Oil Company. He leads a multiculturalteam that aims to improve business performance through the integration ofappropriate technology and skills management in the various technicalexpertise pools, including geoscience. Salem’s background and experience as a geoscientist have given him a clear insight into the challenges of assessingand managing carbonate reservoirs in Abu Dhabi. In this interview, hehighlights the need to reduce uncertainty when characterizing and modelingthese complex systems.
Characterization and Modeling

23
Num
ber 4, 2003
Middle East & Asia Reservoir Review
pressure. The emergence of the rock-type concept allowed geologists todescribe facies in terms of a rock typewith a clearly defined range ofpossible property values. This hasmade a huge difference to reservoirmodeling and simulation efforts.
“The collaboration between thedisciplines has given team membersgreater respect and understandingfor their colleagues. It has alsoimproved the accuracy of reservoirplans and predictions.
“Today, even in complex carbonatereservoirs, asset teams can produceextremely accurate long-termdevelopment plans. Field developmentplans that extend to 5, 10 or even 25years are possible, thanks to a bettershared-earth model and closercooperation between disciplines.”
During the 1990s, the focus ofexploration and production movedfrom developing new reservoirs tomaximizing the value of existing assetswhile minimizing environmentalimpact. Advances in seismicsurveying, data processing andinterpretation continued to delivermajor benefits.
“Geophysical techniques havechanged dramatically in recent years,with 3D seismic greatly improving thedelineation and development of fields.Any new prospect that we selected toenter production would have to besurveyed in this way to assess the finedetail of the field,” Salem says.
Also in the 1990s, oil and gasreservoirs across the United ArabEmirates were being probed with newwireline logging and logging-while-
drilling tools and the latest indownhole imaging technology. AbuDhabi’s oil and gas operators havegained a reputation as progressive and technically proficient companies.They are recognized regionally andworldwide as early adopters oftechnology and techniques that boostthe efficiency of field developmentand asset management. In the future,operators seem certain to reinforcethis reputation as they adopt anddevelop leading reservoir-managementtechniques for the 21st century.
“To date, 4D seismic surveys havenot been a priority for our fieldsunder development, but in the futurewe might pilot a seismic monitoringstudy on one section of a field toassess the suitability of the method,”Salem concludes.
GeologyReservoir
engineeringGeophysics
GeochemistryProduction
engineeringPetrophysics
Drilling
GeologyReservoir
engineeringGeophysics
GeochemistryProduction
engineeringPetrophysics
Drilling
In the past, asset team members focused ontheir own areas of expertise with little overlapbetween the oilfield disciplines (top). Today,close cooperation between various explorationand production disciplines and shared access toa single earth model (bottom) give individualmembers of the asset team a greaterunderstanding of the work conducted by theircolleagues. It also improves the accuracy ofreservoir plans and predictions