Growth Strategies for Gold Producers: Greg Robinson, Newcrest Mining at Mines and Money 2013

Technical Report Newcrest Mining March 2014
TECHNICAL REPORT ON THE
TELFER PROPERTY IN
WESTERN AUSTRALIA AUSTRALIA
Prepared by Newcrest Mining Limited,
in accordance with the requirements of National Instrument 43-101, Standards for Disclosure of Mineral Projects,
of the Canadian Securities Administrators.
Qualified Persons: Mr Colin Moorhead BSc (Hons), FAusIMM
Effective Date of Report: 31 December 2013

i Newcrest Mining – Technical Report on the Telfer Property - 31 December 2013
CONTENTS
1 SUMMARY ................................................................................................................. 1 Introduction and Terms of Reference ........................................................................ 1 1.1 Geology ........................................................................................................ 1 1.2 Mine Production ............................................................................................ 1 1.3 Mineral Resources ........................................................................................ 1 1.4 Mineral Reserves .......................................................................................... 2 1.5 Mining Operations ......................................................................................... 3
1.5.1 Main Dome and West Dome (Open Pit) ............................................. 3 1.5.2 Telfer Main Dome Underground (Underground) ................................ 4
1.6 Infrastructure and Concentrate Handling ....................................................... 6 1.7 Environment and Community Management .................................................. 6 1.8 Capital and Operating Costs ......................................................................... 6 1.9 Conclusions .................................................................................................. 7 1.10 Recommendations ........................................................................................ 7
2 INTRODUCTION ........................................................................................................ 8 2.1 General and Terms of Reference .................................................................. 8 2.2 Report Authors .............................................................................................. 8 2.3 Units of Measure and Currency ..................................................................... 9
3 RELIANCE ON OTHER EXPERTS ........................................................................... 11
4 PROPERTY DESCRIPTION AND LOCATION.......................................................... 12 4.1 Property Location ........................................................................................ 12 4.2 Land Tenure ............................................................................................... 13 4.3 Relevant Agreements.................................................................................. 18
4.3.1 Westwin Option Agreement ............................................................. 18 4.3.2 Acebell Option Agreement ............................................................... 18 4.3.3 Cape Lambert Withdrawal and Royalty Agreement ......................... 18 4.3.4 Martu Agreements ........................................................................... 19
4.4 Royalties Payable ....................................................................................... 19 4.4.1 Mount Isa Mines Limited .................................................................. 19 4.4.2 Mineral Commodities Limited .......................................................... 19
4.5 Environmental Liabilities ............................................................................. 19
5 ACCESSIBILITY, CLIMATE, LOCAL RESOURCES, INFRASTRUCTURE AND PHYSIOGRAPHY ..................................................................................................... 20
5.1 Accessibility ................................................................................................ 20 5.1.1 Road ............................................................................................... 20 5.1.2 Air Strip ........................................................................................... 20
5.2 Climate ....................................................................................................... 20 5.3 Local Resources ......................................................................................... 20 5.4 Infrastructure ............................................................................................... 20
5.4.1 Water Supply ................................................................................... 20 5.4.2 Electricity Generation ...................................................................... 21 5.4.3 Gas Supply ...................................................................................... 21 5.4.4 Port Facilities ................................................................................... 21 5.4.5 Mining Camp ................................................................................... 21 5.4.6 Auxiliary Infrastructure ..................................................................... 21
6 HISTORY .................................................................................................................. 22 6.1 Discovery .................................................................................................... 22

ii Newcrest Mining – Technical Report on the Telfer Property - 31 December 2013
6.2 Telfer Gold Mine Development History ........................................................ 22 6.2.1 Introduction ..................................................................................... 22 6.2.2 Oxide Mining ................................................................................... 22 6.2.3 Sulphide Reef Mining ...................................................................... 23 6.2.4 High Cyanide Soluble Copper Mining .............................................. 23 6.2.5 Telfer Main Dome Underground (Deeps) ......................................... 23
6.3 Historic Mineral Resources ......................................................................... 24 6.4 Summary .................................................................................................... 24
7 GEOLOGICAL SETTING AND MINERALIZATION ................................................... 26 7.1 Telfer .......................................................................................................... 29
7.1.1 Geology ........................................................................................... 29 7.1.2 Mineralization .................................................................................. 32
7.2 O'Callaghans .............................................................................................. 36 7.2.1 Geology ........................................................................................... 36 7.2.2 Mineralization .................................................................................. 37
7.3 Camp Dome ................................................................................................ 37 7.3.1 Geology ........................................................................................... 37 7.3.2 Mineralization .................................................................................. 38
8 DEPOSIT TYPES ..................................................................................................... 39 8.1 Telfer .......................................................................................................... 39 8.2 O'Callaghans .............................................................................................. 39 8.3 Camp Dome ................................................................................................ 40
9 EXPLORATION ........................................................................................................ 41 9.1 Telfer .......................................................................................................... 41 9.2 O'Callaghans .............................................................................................. 41 9.3 Camp Dome ................................................................................................ 42
10 DRILLING ................................................................................................................. 43 10.1 Drilling Programmes.................................................................................... 43 10.2 Survey Control ............................................................................................ 47 10.3 Geological Logging ..................................................................................... 48 10.4 Sampling Procedures .................................................................................. 48
11 SAMPLE PREPARATION, ANALYSES AND SECURITY ......................................... 49 11.1 Historical Sample Preparation, Analysis and Security ................................. 49 11.2 Sample Preparation and Analyses .............................................................. 50 11.3 Sample Security .......................................................................................... 53 11.4 Main Dome QAQC ...................................................................................... 54
11.4.1 Certified Reference Materials .......................................................... 54 11.4.2 Coarse Duplicates and Pulp Replicates ........................................... 55 11.4.3 Second Laboratory Checks ............................................................. 57
11.5 West Dome QAQC ...................................................................................... 58 11.5.1 Certified Reference Materials (CRMs) ............................................. 58 11.5.2 Coarse Duplicates and Pulp Replicates ........................................... 60 11.5.3 Second Laboratory Checks ............................................................. 61
11.6 Satellite Projects ......................................................................................... 62 11.6.1 Certified Reference Materials (CRMs) ............................................. 62 11.6.2 Coarse Duplicates and Pulp Replicates ........................................... 63 11.6.3 Second Laboratory Checks ............................................................. 63
11.7 Summary of QAQC January 2011 to December 2013 ................................. 63
12 DATA VERIFICATION .............................................................................................. 64

iii Newcrest Mining – Technical Report on the Telfer Property - 31 December 2013
13 MINERAL PROCESSING AND METALLURGICAL TESTING .................................. 65
14 MINERAL RESOURCE ESTIMATES ........................................................................ 67 14.1 Telfer Main and West Dome Mineral Open Pit Resource Estimate Summary68 14.2 Telfer Underground Mineral Resource Estimate .......................................... 72
14.2.1 Geology Model ................................................................................ 72 14.2.2 Drill Data and Compositing .............................................................. 74 14.2.3 Bulk Domain Grade Modelling ......................................................... 74 14.2.4 Reef Grade Modelling ...................................................................... 82 14.2.5 Density Modelling ............................................................................ 87 14.2.6 Final Model Construction and Validation .......................................... 88 14.2.7 Resource Classification ................................................................... 90
14.3 Comparison to Previous Mineral Resource Estimate................................... 91 14.4 Factors Affecting Mineral Resource Estimate .............................................. 91
15 MINERAL RESERVE ESTIMATES ........................................................................... 92 15.1 Introduction ................................................................................................. 92 15.2 Mineral Reserve Assumptions ..................................................................... 93
15.2.1 Commodity Prices and Exchange Rates .......................................... 93 15.2.2 Cost Estimates ................................................................................ 93
15.3 Telfer Main Dome Open Pit Mineral Reserve .............................................. 93 15.4 Telfer West Dome Open Pit Mineral Reserve .............................................. 94 15.5 Telfer Main Dome Underground Mineral Reserves ..................................... 96
15.5.1 Telfer UG SLC Mineral Reserve ...................................................... 96 15.5.2 Telfer UG Western Flanks Mineral Reserve .................................... 97 15.5.3 Telfer UG M Reef Mineral Reserve .................................................. 99
15.6 Comparison to Previous Mineral Reserve Estimate .................................. 100 15.6.1 Factors Affecting the Mineral Reserve Estimates .......................... 101
16 MINING METHODS ................................................................................................ 102 16.1 Telfer Main Dome and West Dome Open Pit ............................................ 102 16.2 Telfer Main Dome Underground ................................................................ 103
16.2.1 Telfer UG Sub-level Cave (SLC) .................................................... 103 16.2.2 Telfer UG Western Flanks ............................................................. 103 16.2.3 Telfer UG M Reefs Selective Mining .............................................. 104
17 RECOVERY METHODS ......................................................................................... 105
18 PROJECT INFRASTRUCTURE .............................................................................. 108 18.1 Access Roads ........................................................................................... 108 18.2 Tailings Management ................................................................................ 108 18.3 Water Supply ............................................................................................ 108 18.4 Power Supply ............................................................................................ 108 18.5 Gas Supply ............................................................................................... 109 18.6 Port Facilities ............................................................................................ 109 18.7 Other Site Infrastructure ............................................................................ 109
19 MARKET STUDIES AND CONTRACTS ................................................................. 110 19.1 Newcrest Concentrate Characteristics ...................................................... 110 19.2 Transport and Storage .............................................................................. 110 19.3 Newcrest Concentrate Destination Smelters ............................................. 110 19.4 Concentrate Treatment and Copper Refining Charges .............................. 110 19.5 Precious Metal Terms and Refining Charges ............................................ 111 19.6 Weighing, Sampling and Moisture Determination and Assays and Analyses111 19.7 Doré .......................................................................................................... 111

iv Newcrest Mining – Technical Report on the Telfer Property - 31 December 2013
19.8 Marketing Resources ................................................................................ 111
20 ENVIRONMENTAL STUDIES, PERMITTING AND SOCIAL OR COMMUNITY IMPACT .................................................................................................................. 112
20.1 Overview ................................................................................................... 112 20.2 Individual Environmental Issues ................................................................ 112
20.2.1 Environmental Approvals ............................................................... 112 20.2.2 Management of Acid Forming Waste ............................................. 113 20.2.3 Water Supply and Management .................................................... 114 20.2.4 Closure and Rehabilitation ............................................................. 114 20.2.5 Community and Social Issues ....................................................... 115 20.2.6 Other Environmental Issues .......................................................... 115
21 CAPITAL AND OPERATING COSTS ..................................................................... 116
22 ECONOMIC ANALYSIS .......................................................................................... 118
23 ADJACENT PROPERTIES ..................................................................................... 119
24 OTHER RELEVANT DATA AND INFORMATION ................................................... 120
25 INTERPRETATION AND CONCLUSIONS ............................................................. 121
26 RECOMMENDATIONS ........................................................................................... 122
27 REFERENCES ....................................................................................................... 123
28 QUALIFIED PERSONS' CERTIFICATES ............................................................... 126
TABLES
Table 1.1 Telfer Copper and Gold Mineral Resources at 31 December 2013 ................2 Table 1.2 O'Callaghans Polymetallic Mineral Resource at 31 December 2013 .............2 Table 1.3 Telfer Copper and Gold Mineral Reserves at 31 December 2013 ..................3 Table 1.4 Telfer Operations FY2013 Actual Production and Operating Costs* ..............7 Table 1.5 Telfer Operations FY2014 Cost and Capital Guidance ..................................7 Table 2.1 Persons who Prepared or Contributed to this Technical Report .....................8 Table 2.2 Key Terms and Abbreviations........................................................................9 Table 4.1 Telfer Tenure Details ................................................................................... 13 Table 4.2 Telfer Details of Licence Holders ................................................................. 16 Table 6.1 Summary of Project History ......................................................................... 25 Table 10.1 Main Dome Drilling up to December 2013 ................................................... 44 Table 10.2 West Dome Drilling up to December 2013 ................................................... 45 Table 10.3 Telfer Main Dome Underground Drilling up to December 2013 .................... 45 Table 14.1 Telfer Copper and Gold Mineral Resources at 31 December 2013 .............. 67 Table 14.2 O'Callaghans Polymetallic Mineral Resource at 31 December 2013 ........... 68 Table 14.3 Wireframes for Geological Model ................................................................ 74 Table 14.4 Basic statistics for gold grade (ppm) for all bulk domains (undeclustered) ... 77 Table 14.5 Example Indicator variogram models used in the MIK estimation of gold
grade for the VSC domain. .......................................................................... 78 Table 14.6 Search neighbourhood parameters for MIK estimation of gold and copper
grade in the bulk domains. .......................................................................... 79 Table 14.7 Variogram models used in the OK estimation of gold and copper grade for
the LLU and Oakover domains. ................................................................... 79

v Newcrest Mining – Technical Report on the Telfer Property - 31 December 2013
Table 14.8 Search neighbourhood parameters for OK estimation of gold and copper grade in the LLU and Oakover bulk domains. .............................................. 80
Table 14.9 Grade caps implemented for bulk domains during the OK estimation of sulphur, arsenic and cobalt grade ................................................................ 80
Table 14.10 The linear regression equations used to estimate sulphur as a function of copper ......................................................................................................... 81
Table 14.11 The linear regression equations used to estimate arsenic as a function of sulphur ........................................................................................................ 81
Table 14.12 The linear regression equations used to estimate cobalt as a function of sulphur ........................................................................................................ 82
Table 14.13 Basic statistics for gold grade (ppm) and intercept length (m) for all reef domains ...................................................................................................... 82
Table 14.14 Variogram, models for the estimation of gold and copper grade in the reef estimation domains ..................................................................................... 84
Table 14.15 Search parameters for OK Tetra Modelling of gold and copper grade in the reef domains ............................................................................................... 84
Table 14.16 Variogram, models for the estimation of sulphur, arsenic and cobalt grade in reef domains ............................................................................................... 85
Table 14.17 Search parameters for OK Tetra Modelling of sulphur, arsenic and cobalt grade in the reef domains ............................................................................ 85
Table 14.18 The linear regression equation used to estimate sulphur as a function of copper ......................................................................................................... 86
Table 14.19 The linear regression equation used to estimate arsenic and cobalt as functions of sulphur ..................................................................................... 86
Table 14.20 Basic statistics for density data, by domain, with no length-weighting applied .................................................................................................................... 87
Table 14.21 Constant density values assigned to bulk domains ...................................... 88 Table 15.1 Telfer Main Dome Open Pit Mineral Reserve Estimate at 31 December 2013
.................................................................................................................... 94 Table 15.2 Telfer West Dome Open Pit Mineral Reserve Estimate at 31 December 2013
.................................................................................................................... 95 Table 15.3 Telfer UG SLC Mineral Reserve Estimate at 31 December 2013 ................ 97 Table 15.4 Telfer Deeps Western Flanks Mineral Reserve Estimate at 31 December
2013 ............................................................................................................ 98 Table 15.5 Telfer UG M50 Reef Mineral Reserve Estimate at 31 December 2013 ...... 100 Table 17.1 Telfer Gold Production............................................................................... 106 Table 17.2 Telfer Production Statistics ........................................................................ 107 Table 21.1 Historical Production and Costs per Ounce of Gold Produced ................... 116 Table 21.2 Telfer Operations Gold and Copper Production, FY 2013* ........................ 116 Table 21.3 Telfer Operations Historical Capital Expenditure ....................................... 116 Table 21.4 Telfer Operations FY 2014 Cost and Capital Guidance ............................. 117
FIGURES
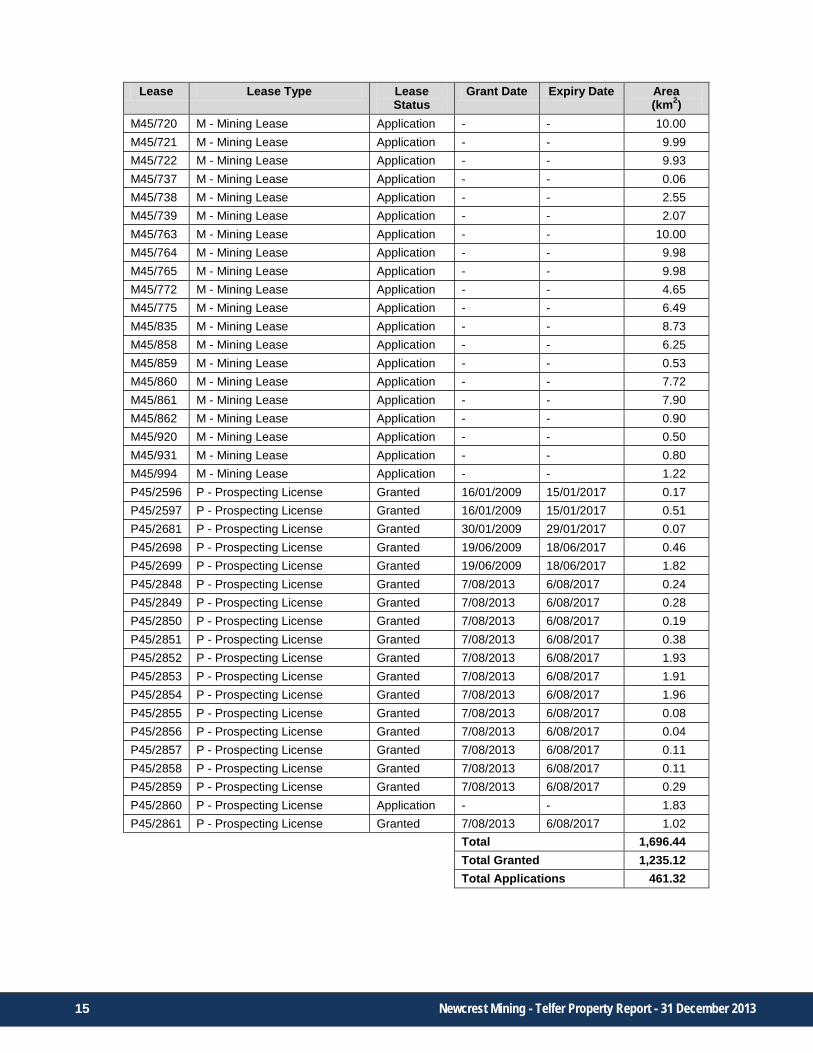
Figure 4.1 Telfer Location Map ..................................................................................... 12 Figure 7.1 Telfer Regional Geology .............................................................................. 26 Figure 7.2 Telfer Regional Stratigraphy ........................................................................ 27 Figure 7.3 Telfer Regional Geology .............................................................................. 28 Figure 7.4 Location of O'Callaghans and Camp Dome ................................................. 29 Figure 7.5 Telfer Local Stratigraphy ............................................................................. 30 Figure 7.6 Telfer Pre-Mining Structural and Stratigraphic Setting ................................. 32 Figure 7.7 Oblique Schematic View Looking North showing Key Mineralized Systems 33

vi Newcrest Mining – Technical Report on the Telfer Property - 31 December 2013
Figure 7.8 Schematic Cross Section of O'Callaghans Skarn Deposit ........................... 36 Figure 10.1 Cross Section 11300N through Main Dome (Open pit & UG) ...................... 43 Figure 10.2 Cross Section 11300N through West Dome (Open pit)................................ 44 Figure 10.3 Telfer Drill Location Plan ............................................................................. 46 Figure 11.1 BZ Assay Protocol ....................................................................................... 51 Figure 11.2 AY Assay Protocol ....................................................................................... 52 Figure 11.3 O'Callaghans Assay Protocol ...................................................................... 53 Figure 11.4 Gold Z-Scores from Main Dome January 2011 to December 2013 .............. 54 Figure 11.5 Copper Z-Scores from Main Dome January 2011 to December 2013 .......... 55 Figure 11.6 Main Dome Gold in Coarse Duplicates ........................................................ 56 Figure 11.7 Main Dome Gold in Pulp Replicates ............................................................ 56 Figure 11.8 Main Dome Gold in Second Laboratory Checks .......................................... 57 Figure 11.9 Main Dome Copper in Second Laboratory Checks ...................................... 58 Figure 11.10 Gold Z-Scores from West Dome January 2011 to December 2013 ............. 59 Figure 11.11 Copper Z-Scores from West Dome January 2011 to December 2013 ......... 59 Figure 11.12 West Dome Gold in Coarse Duplicates ....................................................... 60 Figure 11.13 West Dome Gold in Pulp Replicates ............................................................ 60 Figure 11.14 West Dome Gold in Second Laboratory Checks .......................................... 61 Figure 11.15 West Dome Copper in Second Laboratory Checks ...................................... 62 Figure 11.16 Gold Z-Scores from Satellites from January 2011 to December 2013 ......... 62 Figure 11.17 Copper Z-Scores from Satellites from January 2011 to December 2013 ..... 63 Figure 14.1 Cross Section 13000N through West Dome Open Pit ................................. 71 Figure 14.2 Cross Section 11300N through West Dome Open Pit ................................. 71 Figure 14.3 The reef domains (red) and bulk domains estimated (E-W section looking
north at 11300mN). ..................................................................................... 73 Figure 14.4 The reef and bulk domains estimated .......................................................... 76 Figure 14.5 Log-probability plot for composite gold grade, per bulk domain ................... 77 Figure 14.6 Log-probability plot for composite gold grade, per bulk domain ................... 83 Figure 14.7 Cross Section 11300N through Main Dome UG .......................................... 90 Figure 15.1 Telfer West Dome Location Relative to Main Dome and Telfer Deeps ........ 95 Figure 15.2 Telfer UG SLC remaining Life of Mine Design - Isometric View ................... 97 Figure 15.3 Plan View showing Telfer UG Western Flanks ............................................ 99 Figure 15.4 Typical Cross Section through M Reefs ..................................................... 100 Figure 16.1 Western Flanks Proposed Mine Layout - Isometric View ........................... 104 Figure 17.1 Telfer Treatment Plant - Basic Process Flow ............................................. 106 Figure 18.1 Natural Gas Supply Network ..................................................................... 109

1 Newcrest Mining - Telfer Property Report - 31 December 2013
1 SUMMARY
Introduction and Terms of Reference
The annual Mineral Resources and Mineral Reserves update of Newcrest Mining Limited (Newcrest) of Melbourne, Australia has recently been completed and includes material changes to the Telfer property (Telfer or the Property).
This Technical Report (the Report) on Telfer in the State of Western Australia, Australia has been prepared by Newcrest as an update in response to material changes in the Telfer Mineral Resource and Mineral Reserve released on the 14 February 2014 in Newcrest’s Annual Resources and Reserves Statement-31 December 2013, which can be found on its website at www.newcrest.com.au and at www.sedar.com.
The Report was prepared in accordance with the requirements of National Instrument 43-101 (NI 43-101), “Standards of Disclosure for Mineral Projects”, of the Canadian Securities Administrators (CSA) for lodgement on CSA’s “System for Electronic Document Analysis and Retrieval” (SEDAR).
1.1 Geology
The Telfer Gold Mine is 100% owned by Newcrest and is located within the Great Sandy Desert of Western Australia, approximately 450km by road southeast of Port Hedland and 680km northeast of Newman.
The project area is comprised of granted mining leases that contain gold and copper mineralization characterized as bimodal in nature with relatively high grade stratabound reefs and spatially associated lower grade stockworks hosted within Proterozoic sediments. Deep weathering depleted the copper in the upper sections of the orebody, whilst the underlying resource retained both copper and gold content.
Historical gold production was processed using gravity and cyanide leaching processes. The current operation consists of both open pit and underground operations. Ore processing facilities now exploit the large gold and copper sulphide resources by flotation producing a gold rich copper concentrate and doré recovered from gravity circuits. Additional small tonnages of oxide material are processed through dump leach circuits.
1.2 Mine Production
In the financial year (FY) ending 30 June 2013, Telfer milled 21.5Mt of ore producing 525koz of gold and 26.5kt of contained copper. Cash costs for the year are reported at A$1,022/oz Au after other by-product credits.
1.3 Mineral Resources
The 31 December 2013 Mineral Resource update has been based on a detailed review completed by Newcrest of all Telfer production sources to take into account Newcrest’s current view of long term metal prices, foreign exchange and cost assumptions, and mining and metallurgy performance to inform cut-off grades and physical mining parameters. This has resulted in the most marginal ounces being removed and this has been reflected in changes to Mineral Resource estimates. The Measured and Indicated Mineral Resources for Telfer as at 31 December 2013 include a material reduction of approximately 5.2Moz of gold to 13Moz of gold, compared with the 31 December 2012 estimate of 18.2Moz of gold.

2 Newcrest Mining - Telfer Property Report - 31 December 2013
This reduction has primarily come from West Dome and Main Dome open pit Mineral Resources as a result of the review of long term economic assumptions.
Table 1.1 lists Telfer gold and copper Mineral Resources at 31 December 2013. The Main Dome and West Dome open pit Mineral Resources are reported inside optimization shells to reflect that part of the resource model for which there are reasonable prospects for eventual economic extraction. Mineral Resources are reported inclusive of Mineral Reserves. Vertical Stockwork Corridor ("VSC"), Sub-Level Cave ("SLC"), Western Flanks and underground selective reefs external to the SLC are reported as Telfer Underground Mineral Resources.
Table 1.1 Telfer Copper and Gold Mineral Resources at 31 December 2013 Tonnes
(Mt) Au
(g/t) Cu (%)
Au (Moz)
Cu (Mt)
Measured Resource Main Dome Stockpiles 24 0.40 0.09 0.3 0.02
Total Measured Resource 24 0.40 0.09 0.3 0.02 Indicated Resources
Main Dome Open Pit 210 0.67 0.09 4.5 0.18 West Dome Open Pit 170 0.66 0.06 3.6 0.10 Telfer Underground 96 1.5 0.33 4.7 0.31 Other Satellite Deposits 0.57 4.2 0.03 0.1 <0.01
Total Indicated Resource 480 0.84 0.12 13 0.59 Inferred Resources
Main Dome Open Pit 2.6 0.56 0.09 0.05 <0.01 West Dome Open Pit 1.1 0.46 0.06 0.02 <0.01 Telfer Underground 53 0.95 0.21 1.6 0.11 Camp Dome 14 - 0.37 - 0.05 Other Satellite Deposits 1.7 2.58 0.08 0.14 <0.01
Total Inferred Resource 73 0.79 0.23 1.8 0.17 Notes: 1. The figures above include those resources converted to reserves
2. Rounding may cause some computational discrepancies 3. Telfer Underground includes SLC, VSC, Western Flanks and M Reef Mineral Resources
Table 1.2 lists the Mineral Resource for the O'Callaghans polymetallic deposit.
Table 1.2 O'Callaghans Polymetallic Mineral Resource at 31 December 2013 Tonnes
(Mt) WO3 (%)
Zn (%)
Pb (%)
Cu (%)
Indicated Resource 69 0.34 0.55 0.27 0.29 Inferred Resource 9 0.25 0.15 0.07 0.24
1.4 Mineral Reserves
The 31 December 2013 Mineral Reserve update has been based on a detailed review completed by Newcrest of all Telfer production sources to take into account Newcrest’s current view of long term metal prices, foreign exchange and cost assumptions, and mining and metallurgy performance to inform cut-off grades and physical mining parameters. This has resulted in the most marginal ounces being removed and this has been reflected in changes to Mineral Reserve estimates. The Mineral Reserves for Telfer as at 31 December 2013 include a material reduction of approximately 5.3Moz of gold to 5.6Moz of gold,

3 Newcrest Mining - Telfer Property Report - 31 December 2013
compared with the 31 December 2012 estimate of 10.9Moz of gold. This reduction has primarily come from the West Dome and Main Dome open pit Mineral Reserves as a result of the review of long term economic assumptions.
Table 1.3 lists Telfer gold and copper Mineral Reserves at 31 December 2013.
Table 1.3 Telfer Copper and Gold Mineral Reserves at 31 December 2013 Tonnes
(Mt) Au
(g/t) Cu (%)
Au (Moz)
Cu (Mt)
Proven Mineral Reserves Main Dome Open Pit Stockpiles 24 0.40 0.09 0.3 0.02
Total Proven Mineral Reserves 24 0.40 0.09 0.3 0.02 Probable Mineral Reserves
Main Dome Open Pit 74 0.95 0.10 2.3 0.08 West Dome Open Pit 73 0.68 0.06 1.6 0.05 Telfer Underground 37 1.2 0.21 1.5 0.08
Total Probable Mineral Reserves 180 0.90 0.11 5.3 0.20 Notes: 1. The cut offs applied are variable and are described in the text of the report
2. Metal prices used, gold - US$1,250/oz, copper - US$2.70/lb 3. Rounding may cause some apparent computational discrepancies
1.5 Mining Operations
The original mining operations at Telfer commenced in 1977 and continued until October 2000 over which time they produced approximately 6Moz of gold. Production was suspended due to escalating costs, with the operations placed on care and maintenance until feasibility studies for redevelopment of the mine were completed.
Modern operations recommenced with mining production from the open pits in late 2004 and commissioning of two process trains recovering gold as well as recovering copper as a valuable by-product.
The recommencement of underground operations in 2006 created opportunities to augment production from the main open pits through the selective mining of deeper, dispersed, higher grade areas that could not be economically extracted with surface mining techniques. There are numerous aspects to the current and developing underground mining areas within the Telfer operation with differing mining techniques matched to specific ground conditions.
The original design production capacity of the redeveloped open pit production was 17Mtpa with an additional 4Mtpa scheduled for production from underground mining. The feasibility study recognized that the mining rate could achieve in excess of 18Mtpa when softer ore was being mined. Since commissioning, the production from underground operations has increased to approximately 6Mtpa and open pit ore makes up the remainder of the plant feed. The combined open pit and underground mining operations fed the mill with 21.5Mt of ore in the year ending 30 June 2013.
1.5.1 Main Dome and West Dome (Open Pit)
Mining methods at Main Dome and West Dome are the same. Current mining activities at the Telfer open pits are conducted via conventional truck and shovel operations, standard waste rock dumps and stockpiling and reclaim of lower grade ore. An excavator configured

4 Newcrest Mining - Telfer Property Report - 31 December 2013
load fleet is utilised to selectively extract ore material from a total twelve metre design bench height via three 4m high ‘flitches’. The 4m ‘flitches’ are used in order to reduce ore dilution and loss. Bulk waste is stripped via two 6m ‘flitches’. Productivities, availabilities and utilisations used within the production schedule have been based on current performance.
The current mining fleet employed within the Telfer open pit includes:
• 2 x CAT 6060 excavators; • 2 x Caterpillar 994 class front end loaders; • Up to 32 x Caterpillar 793 class rigid body off-highway dump trucks; and • Various ancillary equipment (drills, dozers, graders, etc.)
Open pit operations within the Main and West Dome pits have traditionally focused on the selective extraction of the ore material within the Mineral Reserve through the use of the site excavator fleet. This configuration of this equipment, and selective ore mining approach adopted for ore mining, has led to the use of 12m benches comprising of three 4m ‘flitches’.
Reef and adjacent waste, as well as the edges of stock work ore, are selectively mined, while broad areas of stock work ore and waste are bulk mined. Some near-surface oxidised stock work is dump leached and this is bulk mined. All other ore is fed to the processing plant and is referred to as direct float ore. Direct float ore is hauled to the ROM and normally direct tipped into the two gyratory crushers, but with allowance for stockpiling and rehandling a percentage of the direct float ore on the ROM pad. Dump leach ore is dumped for leaching on existing pads to the west of Main Dome and to the east of West Dome. Waste is used for tailings storage facility construction or delivered to a dump south of the Main Dome pit and west of the West Dome pit. Of the total waste to be mined, approximately 20% has been identified as potentially acid-forming and will continue to be segregated into confined cells within the waste dump and encapsulated using non-acid-forming waste.
Ore and waste zones are all blasted on standard pattern spacing with 12m benches irrespective of the subsequent mining method being either a selective approach utilizing the excavator flitch extraction or a bulk shovel/loader configuration. However, blast drill hole diameter and explosive powder factors are adjusted to account for the varying mining methods. All blast hole drilling is undertaken with either hammer or rotary drill rigs depending upon the required hole size and rock characteristics.
Geological and geotechnical conditions are complex and a number of batter failures, and in some cases multiple batter failures, have occurred. The pit has an extensive array of sensing equipment providing real time monitoring of pit wall stability. Mining practices include standoff periods after blasting against a high wall and installation of wall reinforcement in places. Back analysis of these failures informs future pit slope design parameters for pit optimization and design.
1.5.2 Telfer Main Dome Underground (Underground)
The Telfer underground consists of the Telfer Sub-level Cave (SLC) and selective M Reef operations. The Western Flanks is yet to be mined. The deposits are beneath the Main Dome open pit and previously known as Telfer Deeps
The Telfer SLC is being mined using the sub-level cave method. SLC involves the development of a series of parallel cross-cuts through the orebody in a regular geometrical

5 Newcrest Mining - Telfer Property Report - 31 December 2013
pattern. Ore is progressively recovered from drawpoints developed in the crosscuts. As material is loaded from a drawpoint, broken ore above the extraction level progressively mixes with material from higher levels in the cave. Once a predetermined draw tonnage is loaded from the drawpoint, loading ceases and the next ring is fired. As the process continues the rock overlying the mining footprint progressively caves, as does the rock immediately adjacent to the caved area.
Loaded ore is tipped down an ore pass system to the haulage level where it is trucked to the underground crushing station. A hoisting shaft facilitates transport of ore to surface, from a hoist depth of approximately 1,100m.
A decline provides access for the transport of personnel and materials from a portal entry in the open pit to the base of the underground mine.
All major infrastructure is in place to service the current mine plan. Development is well in advance of the current production horizons with all main orebody access points in place. Production level development is currently being carried out on the penultimate planned production level.
The mine design layout follows an established geometry employed since production commenced in 2006. As the design and operation of the Telfer Deeps SLC are mature there is minimal risk associated with the mining method and design used in the preparation of the Mineral Reserve estimate.
The mining method for extraction of M Reef resources is narrow vein, shallow dipping sub-level open stoping (SLOS). Electric scraping is employed to recover blasted material due to the shallow dip of the orebody. The extraction design incorporates a 1.1m slot rise that establishes each stope, with a 5m wide square rib pillar between adjacent stopes. The slot rises are excavated as a blasted whinze rise. Where geotechnical considerations allow, intermediate rib pillars are incorporated to facilitate maximum extraction.
A minimum mining width of 1.8m was used to estimate planned dilution. All dilution material was assumed to have zero grade and a density of 2.7 t/m3. M Reef material is trucked to a surface stockpile in the vicinity of the portal. The open pit mining fleet rehandles the material to ROM stockpiles.
The planned mining method for the Western Flanks is a flat-dipping modified SLC. The mining process for the Telfer SLC and Western Flanks SLC are essentially the same, with the key difference being the flat dipping nature of the Western Flanks resource requiring a series of steps in the SLC layout. This modification impacts the draw rate and mining recovery assumptions and the planned Western Flanks assumptions are appropriately adjusted relative to the Telfer Deeps SLC cave draw assumptions.
It is planned that material mined from the Western Flanks will be extracted by trucking a short distance to the existing 1,100m hoisting shaft facility where it will then be hoisted to surface. The Western Flanks will also be serviced by the existing single portal entry for transport of material and men into the mine.

6 Newcrest Mining - Telfer Property Report - 31 December 2013
1.6 Infrastructure and Concentrate Handling
On-site mineral processing infrastructure includes a gravity circuit, carbon-in-leach (CIL) circuit, and dump leach pads produce a doré which accounts for approximately 25% of the mine's gold production. Production from these circuits is smelted on site prior to being transported securely to a third party refinery.
The flotation circuit produces a copper-gold concentrate that is trucked to Port Hedland for shipping to smelters. Newcrest has long term relationships with most regional smelters in Japan and Korea and well as with certain smelters in China. Newcrest also has contracts with merchants in Switzerland and Singapore.
Electrical power requirements for mining and processing equipment are met by two power stations at Telfer. The Primary Power Station (PPS) comprises three GE LM6000 gas turbines and the Secondary Power Station (SPS) comprises eight diesel generators. This provides a maximum rating of installed power generation at Telfer of 150MW. Natural gas supply for the turbines is fed from a dedicated 450km purpose-built pipeline.
The site is a fly-in fly-out operation with a work force of approximately 1,100 full time equivalent (FTE) staff and contractors. The accommodation facilities on site comprise a total of 1,733 rooms to service the numerous rosters in place for these personnel. The operation is serviced by an all-weather airstrip.
1.7 Environment and Community Management
Telfer is a relatively large (total disturbance more than 4,000ha) and complex operation, but is not confronted by environmental or community challenges likely to significantly constrain current and future operations. This reflects its remote, desert location and an absence of significant biodiversity and conservation issues, together with a proven history of responsible environmental management. Sound relationships have been developed with the indigenous traditional landowners (Martu), who hold one of the largest Native Title Determinations in Australia over Telfer and its associated tenements.
Statutory environmental approvals are obtained and environmental performance is reported to regulators through standard protocols for assessment of monitoring results. Compliance is supported by the ongoing implementation of environmental management plans to manage key risks.
A closure plan was developed in 2010 for Telfer and is scheduled to be updated in 2014.
Agreements were in place with the Martu people in respect of Telfer for the purposes of the Telfer expansion project (2002-2005). There are current negotiations underway to seek to put in place a comprehensive agreement to support future operations at Telfer.
1.8 Capital and Operating Costs
Telfer actual production and operating costs for FY 2013 are shown in Table 1.4. The Newcrest financial year closes on 30 June each year.

7 Newcrest Mining - Telfer Property Report - 31 December 2013
Table 1.4 Telfer Operations FY2013 Actual Production and Operating Costs*
Telfer Unit FY13 Actual Gold Production koz 525 Copper Production kt 26 Total Site Cash Costs A$M 850 Waste Stripping and Ore Inventory A$M -198 Third Party Smelting, Refining and Transporting A$M 60 Royalty A$M 29 Depreciation A$/oz 389
*Costs included in table exclude applicable by-product credits.
FY2014 cost and capital guidance for Telfer, as released 12 August 2013, is shown in Table 1.5.
Table 1.5 Telfer Operations FY2014 Cost and Capital Guidance
Telfer Unit FY14 Guidance Cash cost (including by-product credits) 1 A$M 490-540 On-site exploration expenditure A$M 10-11 Production Waste stripping A$M 20-25 Sustaining capital A$M 60-70 Corporate, rehabilitation, other A$M 11-17 All-in sustaining cost A$M 590-660 Production Waste Stripping2 A$M 20-25 Sustaining Capital2 A$M 60-70 Projects and development capital A$M - Total capital expenditure A$M 80-90
1 Costs assume AUD:USD 0.96, copper price US$3.30/lb, silver price US$22.0/oz 2 Duplicated above under All-in sustaining costs and under Capital expenditure
1.9 Conclusions
Telfer Gold Mine is an established operation with a long history to support development of plans to exploit the available Mineral Resources.
Factors that may have a material impact on the Telfer Gold Mine include those discussed in the risks section of Newcrest’s annual operating and performance review which forms part of Newcrest’s Full Year Financial Results for the year ended 30 June 2013, which can be found on its website at www.newcrest.com.au and at www.sedar.com.
1.10 Recommendations
Telfer is an established mining operation with Mineral Reserves sufficient for an extended mine life. In view of the nature of Telfer's mining operations and the substantial Mineral Reserve inventory, no recommendations are included.

8 Newcrest Mining - Telfer Property Report - 31 December 2013
2 INTRODUCTION
2.1 General and Terms of Reference
This Technical Report (the Report) on the Telfer Property (Telfer) in the State of Western Australia, Australia has been prepared by Newcrest Mining Limited (Newcrest) of Melbourne Australia, as an update in response to material change in the Telfer Mineral Resource and Mineral Reserve.
The Report was prepared in accordance with the requirements of National Instrument 43-101 (NI 43-101), "Standards of Disclosure for Mineral Projects", of the Canadian Securities Administrators (CSA) for lodgement on CSA's "System for Electronic Document Analysis and Retrieval" (SEDAR).
2.2 Report Authors
The overall Report was assembled by Mr Kevin Gleeson under the direction of the Qualified Person (QP) Colin Moorhead, with contributions from other Newcrest employees. A listing of details of the authors of the Report, together with those who assisted and sections for which they are responsible or to which they contributed is contained in Table 2.1.
Table 2.1 Persons who Prepared or Contributed to this Technical Report Qualified Person
Position Employer Independent of Newcrest
Date of Last Site
Visit
Professional Designation
Sections of Report
Qualified Persons responsible for the preparation and signing of this Technical Report C Moorhead Executive General
Manager Minerals Newcrest Mining Limited
No Jan 13-14 2014
FAusIMM (CP) All Sections
Other persons who assisted the Qualified Person K Gleeson Head of Mineral
Resource Management
Newcrest Mining Limited
No Aug 2013 MAusIMM Compilation of Report
L Bowyer Manager Land Tenure
Newcrest Mining Limited
No - N/A 4
P Griffin Head of Processing Operations
Newcrest Mining Limited
No Aug 2013 MAusIMM 13, 17
J Biggam Mineral Resource Manager-Telfer
Newcrest Mining Limited No Site
based MAusIMM 14
R Secis Manager-Telfer Mine Planning
Newcrest Mining Limited No Dec 2013 MAusIMM 15, 16
A de Sousa General Manager - Marketing and Logistics
Newcrest Mining Limited
No Sept 2011
NA 19
Blair Sands Head of Health and Environment
Newcrest Mining Limited
No - N/A 20
K Kerr General Manager-Commercial and Planning
Newcrest Mining Limited No July 2011 CA (Chartered
Accountant)
21,22

9 Newcrest Mining - Telfer Property Report - 31 December 2013
Mr Colin Moorhead was employed at Telfer between 1991 and 1997 and has visited the Telfer site on numerous occasions in his current role including several occasions during 2013 at which time he inspected both underground and surface aspects of the mining operations in addition to the processing and infrastructure facilities. Mr Moorhead is currently an employee of Newcrest and accepts Qualified Person responsibility for the Report. Mr Moorhead last visited the Telfer operations in January 2014. Mr Kevin Gleeson and Mr Paul Griffin are employees of Newcrest who visit Telfer to review relevant aspects of the operation. Mr James Biggam is an employee of Newcrest and has been appointed as the Competent Person for reporting Telfer Mineral Resources under the JORC Code1. Mr Ron Secis is an employee of Newcrest and has been appointed as the Competent Person for reporting Telfer Ore Reserves under the JORC Code1.
This Report is based on internal information (listed in Section 27), site visits undertaken by the Qualified Person, and discussions with other Newcrest personnel.
This Report is effective as of 31 December 2013.
2.3 Units of Measure and Currency
Throughout this Report, measurements are shown in metric units and currency in Australian dollars unless otherwise stated. Table 2.2 includes key terms used and their abbreviations.
Table 2.2 Key Terms and Abbreviations Abbreviation Unit/Term Abbreviation Unit/Term AHD Australian height datum NSR Net Smelter Return AAS Atomic Absorption Spectrometry NAF Non-Acid Forming BWI Bond Ball Work Index µm One millionth of a meter Cu Copper PC Panel Caves m3 Cubic metres % Percent CN Cyanide pa Per annum DWi Drop Weight /oz Per ounce (Troy) EA Environmental Assessment /lb Per pound (avdp) ELs Exploration Licenses /t Per tonne Au Gold ICP-OES Plasma-optical Emission Spectrometry g/t Grams /t PAF Potentially Acid Forming g/t Au Grams /t of gold lb Pound (avdp) HGPR High Pressure Grinding Rolls PFS Prefeasibility study ICP Inductively-Coupled Plasma QAQC Quality Assurance Quality Control Fe Iron RPD Relative Paired Difference kg Kilogram(s) RWi Rod Mill Work Index km Kilometre(s) NPV Net Present Value koz Kilo ounce SAG Semi-autogenous grinding ktpa Kilotonne per annum km2 Square kilometres kWh/t Kilowatt-hours per tonne m2 Square metres
1 Australasian Code for Reporting of Exploration Results, Mineral Resources and Ore Reserves, The JORC Code 2012, effective 1 December 2013, prepared by the Joint Ore Reserves Committee of the Australasian Institute of Mining and Metallurgy, Australian Institute of Geoscientists and Minerals Council of Australia (JORC).

10 Newcrest Mining - Telfer Property Report - 31 December 2013
Abbreviation Unit/Term Abbreviation Unit/Term Pb Lead SLC Sub-Level Caving l Litre S Sulphur m Metre(s) t Tonne(s) Mt Million tonnes TJ Terra Joule(s) Mtpa Million tonnes per annum TSF Tailings Storage Facility MW Megawatts t/m3 Tonnes per cubic metre mm Millimetres W Tungsten Moz Million ounces (troy) WO3 Tungsten trioxide MLs Mining Leases WSMD Weighing, Sampling and Moisture
Determination Mo Molybdenum wmt Wet metric tonnes mRL Metres above a Reduced Level
set at 5,000m below AHD Zn Zinc

11 Newcrest Mining - Telfer Property Report - 31 December 2013
3 RELIANCE ON OTHER EXPERTS
The Qualified Persons relied, in respect of legal and environmental aspects, upon the work of certain Experts listed below. To the extent permitted under NI 43-101, the Qualified Persons disclaim responsibility for these sections of the Report.
The following disclosure is made in respect of each of these Experts:
Ms L Bowyer, Manager Land Tenure, Newcrest:
• Report, opinion or statement relied upon: Information on mineral tenure and status, title issues, royalty obligations, etc.
• Extent of reliance: full reliance following a review by the Qualified Person.
• Portion of Technical Report to which disclaimer applies: Section 4, excluding Section 4.3.
Mr B Sands, Head of Health and Environment, Newcrest:
• Report, opinion or statement relied upon: Information on environmental, permitting, and social/community matters.
• Extent of reliance: full reliance following a review by the Qualified Person.
• Portion of Technical Report to which disclaimer applies: Section 20.
Mr A de Sousa, General Manager, Marketing & Logistics, Newcrest:
• Summary report on Newcrest marketing.
• Extent of reliance: status of Newcrest’s sales arrangements.
• Portion of Technical Report to which disclaimer applies: Section 19.

12 Newcrest Mining - Telfer Property Report - 31 December 2013
4 PROPERTY DESCRIPTION AND LOCATION
4.1 Property Location
The 100% owned Telfer Gold Mine is located in the Great Sandy Desert in the Paterson Province of Western Australia, approximately 450km east-southeast of Port Hedland. The project site is 1310km by air and 1900km by road from Perth and falls within the boundaries of the East Pilbara Shire, an area covering 386,000km2. The project is located at 21º42'44" S latitude, 122º12'25" E longitude. The location of the project is illustrated in Figure 4.1.
Figure 4.1 Telfer Location Map

13 Newcrest Mining - Telfer Property Report - 31 December 2013
4.2 Land Tenure
Newcrest currently has tenure over the mine site through a series of mining leases, exploration licenses, general purpose leases and miscellaneous licenses that cover all the infrastructure in the immediate vicinity of the mine site, including the open pit and underground mining areas, village, plant site, power station and bore fields. All the mining leases on which development for the project will take place were granted before 1994. The extensions to the bore fields are located on miscellaneous licenses granted more recently.
Currently held leases at 31 December 2013 consist of 34 granted mining leases, 17 granted exploration licenses and 18 granted prospecting licenses. Newcrest also has 22 mining lease applications and 5 exploration license applications in progress. Total tenement area is approximately 1,696 km2. Tables 4.1 and 4.2 summarize the details of each of the leases and the licenses held.
Table 4.1 Telfer Tenure Details Lease Lease Type Lease
Status Grant Date Expiry Date Area
(km2) E45/975 E - Exploration License Granted 10/05/1990 9/05/1998 8.30 E45/1070 E - Exploration License Granted 15/08/1991 14/08/1996 4.67 E45/1168 E - Exploration License Granted 6/05/1992 5/05/1999 25.20 E45/1705 E - Exploration License Granted 13/08/1996 12/08/2001 5.60 E45/1957 E - Exploration License Granted 24/08/1998 23/08/2003 2.80 E45/2448 E - Exploration License Granted 11/10/2006 10/10/2013 81.20 E45/2727 E - Exploration License Granted 12/07/2010 11/07/2015 22.40 E45/2930 E - Exploration License Granted 4/07/2008 3/07/2018 2.80 E45/2931 E - Exploration License Granted 4/07/2008 3/07/2018 5.60 E45/2932 E - Exploration License Granted 4/07/2008 3/07/2018 134.40 E45/2962 E - Exploration License Granted 6/01/2009 5/01/2014 53.20 E45/2963 E - Exploration License Granted 19/01/2009 18/01/2014 128.80 E45/3100 E - Exploration License Granted 9/06/2009 8/06/2014 98.00 E45/3254 E - Exploration License Granted 9/06/2009 8/06/2014 89.60 E45/3255 E - Exploration License Granted 9/06/2009 8/06/2014 2.80 E45/3261 E - Exploration License Granted 27/05/2009 26/05/2014 64.40 E45/3384 E - Exploration License Granted 8/02/2011 7/02/2016 5.60 E45/3425 E - Exploration License Application - - 103.60 E45/3447 E - Exploration License Application - - 103.60 G45/1 G - General Purpose Lease Granted 18/12/1982 17/12/2024 2.00 E45/4112 E - Exploration License Application - - 47.60 E45/4302 E - Exploration License Application - - 16.80 E45/4303 E - Exploration License Application - - 58.80 G45/2 G - General Purpose Lease Granted 18/12/1982 17/12/2024 2.00 G45/3 G - General Purpose Lease Granted 18/12/1982 17/12/2024 2.00 G45/4 G - General Purpose Lease Granted 18/12/1982 17/12/2024 1.00 L45/3 L - Miscellaneous License Granted 12/01/1983 17/12/2024 1.00 L45/68 L - Miscellaneous License Granted 20/12/1991 19/12/2016 0.04 L45/69 L - Miscellaneous License Granted 20/12/1991 19/12/2016 0.12 L45/73 L - Miscellaneous License Granted 24/07/1992 23/07/2017 0.13 L45/79 L - Miscellaneous License Granted 19/08/1994 18/08/2014 0.14

14 Newcrest Mining - Telfer Property Report - 31 December 2013
Lease Lease Type Lease Status
Grant Date Expiry Date Area (km2)
L45/80 L - Miscellaneous License Granted 19/08/1994 18/08/2014 0.03 L45/99 L - Miscellaneous License Granted 23/08/2000 22/08/2021 0.23 L45/100 L - Miscellaneous License Granted 28/07/2000 27/07/2021 18.91 L45/101 L - Miscellaneous License Granted 20/07/2001 19/07/2022 13.15 L45/104 L - Miscellaneous License Granted 19/02/2001 18/02/2022 0.59 L45/106 L - Miscellaneous License Granted 15/06/2001 14/06/2022 45.45 L45/107 L - Miscellaneous License Granted 15/06/2001 14/06/2022 25.00 L45/110 L - Miscellaneous License Granted 23/10/2003 22/10/2024 66.11 L45/139 L - Miscellaneous License Granted 19/08/2004 18/08/2025 2.43 L45/165 L - Miscellaneous License Granted 20/03/2008 19/03/2029 1.25 M45/6 M - Mining Lease Granted 18/12/1982 17/12/2024 10.00 M45/7 M - Mining Lease Granted 18/12/1982 17/12/2024 10.00 M45/8 M - Mining Lease Granted 18/12/1982 17/12/2024 10.00 M45/9 M - Mining Lease Granted 18/12/1982 17/12/2024 4.50 M45/10 M - Mining Lease Granted 18/12/1982 17/12/2024 10.00 M45/11 M - Mining Lease Granted 18/12/1982 17/12/2024 10.00 M45/33 M - Mining Lease Granted 22/08/1984 21/08/2026 10.00 M45/203 M - Mining Lease Granted 4/02/1986 3/02/2028 9.99 M45/204 M - Mining Lease Granted 4/02/1986 3/02/2028 9.99 M45/205 M - Mining Lease Granted 4/02/1986 3/02/2028 10.00 M45/206 M - Mining Lease Granted 4/02/1986 3/02/2028 10.00 M45/207 M - Mining Lease Granted 4/02/1986 3/02/2028 10.00 M45/208 M - Mining Lease Granted 4/02/1986 3/02/2028 10.00 M45/209 M - Mining Lease Granted 4/02/1986 3/02/2028 10.00 M45/210 M - Mining Lease Granted 4/02/1986 3/02/2028 7.50 M45/211 M - Mining Lease Granted 4/02/1986 3/02/2028 10.00 M45/247 M - Mining Lease Granted 19/05/1987 18/05/2029 9.00 M45/248 M - Mining Lease Granted 19/05/1987 18/05/2029 6.00 M45/249 M - Mining Lease Granted 5/06/1987 4/06/2029 9.48 M45/364 M - Mining Lease Granted 19/05/1988 18/05/2030 5.26 M45/399 M - Mining Lease Granted 17/01/1989 16/01/2031 10.00 M45/400 M - Mining Lease Granted 17/01/1989 16/01/2031 10.00 M45/532 M - Mining Lease Granted 4/06/1992 3/06/2034 10.00 M45/533 M - Mining Lease Granted 4/06/1992 3/06/2034 10.00 M45/576 M - Mining Lease Granted 3/06/1993 2/06/2014 9.96 M45/580 M - Mining Lease Granted 10/08/1993 9/08/2014 10.00 M45/581 M - Mining Lease Granted 10/08/1993 9/08/2014 10.00 M45/612 M - Mining Lease Granted 26/07/1994 25/07/2015 4.37 M45/620 M - Mining Lease Granted 23/11/1994 22/11/2015 9.99 M45/621 M - Mining Lease Granted 23/11/1994 22/11/2015 7.60 M45/622 M - Mining Lease Granted 23/11/1994 22/11/2015 7.40 M45/631 M - Mining Lease Granted 23/11/1994 22/11/2015 9.85 M45/632 M - Mining Lease Granted 23/11/1994 22/11/2015 9.41 M45/633 M - Mining Lease Granted 23/11/1994 22/11/2015 6.31 M45/709 M - Mining Lease Application - - 9.50 M45/710 M - Mining Lease Application - - 9.35
15 Newcrest Mining - Telfer Property Report - 31 December 2013
Lease Lease Type Lease Status
Grant Date Expiry Date Area (km2)
M45/720 M - Mining Lease Application - - 10.00 M45/721 M - Mining Lease Application - - 9.99 M45/722 M - Mining Lease Application - - 9.93 M45/737 M - Mining Lease Application - - 0.06 M45/738 M - Mining Lease Application - - 2.55 M45/739 M - Mining Lease Application - - 2.07 M45/763 M - Mining Lease Application - - 10.00 M45/764 M - Mining Lease Application - - 9.98 M45/765 M - Mining Lease Application - - 9.98 M45/772 M - Mining Lease Application - - 4.65 M45/775 M - Mining Lease Application - - 6.49 M45/835 M - Mining Lease Application - - 8.73 M45/858 M - Mining Lease Application - - 6.25 M45/859 M - Mining Lease Application - - 0.53 M45/860 M - Mining Lease Application - - 7.72 M45/861 M - Mining Lease Application - - 7.90 M45/862 M - Mining Lease Application - - 0.90 M45/920 M - Mining Lease Application - - 0.50 M45/931 M - Mining Lease Application - - 0.80 M45/994 M - Mining Lease Application - - 1.22 P45/2596 P - Prospecting License Granted 16/01/2009 15/01/2017 0.17 P45/2597 P - Prospecting License Granted 16/01/2009 15/01/2017 0.51 P45/2681 P - Prospecting License Granted 30/01/2009 29/01/2017 0.07 P45/2698 P - Prospecting License Granted 19/06/2009 18/06/2017 0.46 P45/2699 P - Prospecting License Granted 19/06/2009 18/06/2017 1.82 P45/2848 P - Prospecting License Granted 7/08/2013 6/08/2017 0.24 P45/2849 P - Prospecting License Granted 7/08/2013 6/08/2017 0.28 P45/2850 P - Prospecting License Granted 7/08/2013 6/08/2017 0.19 P45/2851 P - Prospecting License Granted 7/08/2013 6/08/2017 0.38 P45/2852 P - Prospecting License Granted 7/08/2013 6/08/2017 1.93 P45/2853 P - Prospecting License Granted 7/08/2013 6/08/2017 1.91 P45/2854 P - Prospecting License Granted 7/08/2013 6/08/2017 1.96 P45/2855 P - Prospecting License Granted 7/08/2013 6/08/2017 0.08 P45/2856 P - Prospecting License Granted 7/08/2013 6/08/2017 0.04 P45/2857 P - Prospecting License Granted 7/08/2013 6/08/2017 0.11 P45/2858 P - Prospecting License Granted 7/08/2013 6/08/2017 0.11 P45/2859 P - Prospecting License Granted 7/08/2013 6/08/2017 0.29 P45/2860 P - Prospecting License Application - - 1.83 P45/2861 P - Prospecting License Granted 7/08/2013 6/08/2017 1.02
Total 1,696.44
Total Granted 1,235.12
Total Applications 461.32

16 Newcrest Mining - Telfer Property Report - 31 December 2013
Table 4.2 Telfer Details of Licence Holders Lease Holder % Holder %
E45/975 Newcrest Mining Limited 100 - - E45/1070 Newcrest Mining Limited 100 - - E45/1168 Newcrest Mining Limited 100 - - E45/1705 Newcrest Mining Limited 100 - - E45/1957 Newcrest Mining Limited 70 Newcrest Operations Limited 30 E45/2448 Westwin Investments Pty Ltd 100 - - E45/2727 Acebell Holdings Pty Ltd 100 - - E45/2930 Newcrest Mining Limited 70 Newcrest Operations Limited 30 E45/2931 Newcrest Mining Limited 70 Newcrest Operations Limited 30 E45/2932 Newcrest Mining Limited 100 - - E45/2962 Newcrest Operations Limited 100 - - E45/2963 Newcrest Operations Limited 100 - - E45/3100 Newcrest Operations Limited 100 - - E45/3254 Newcrest Operations Limited 100 - - E45/3255 Newcrest Operations Limited 100 - - E45/3261 Newcrest Operations Limited 100 - - E45/3384 Newcrest Operations Limited 100 - - E45/3425 Newcrest Operations Limited 100 - - E45/3447 Newcrest Operations Limited 100 - - E45/4112 Newcrest Operations Limited 100 - - E45/4302 Newcrest Operations Limited 100 - - E45/4303 Newcrest Operations Limited 100 - - G45/1 Newmont Pty Ltd 70 Newcrest Operations Limited 30 G45/2 Newmont Pty Ltd 70 Newcrest Operations Limited 30 G45/3 Newmont Pty Ltd 70 Newcrest Operations Limited 30 G45/4 Newmont Pty Ltd 70 Newcrest Operations Limited 30 L45/3 Newmont Pty Ltd 70 Newcrest Operations Limited 30 L45/68 Newcrest Mining Limited 100 - - L45/69 Newmont Pty Ltd 70 Newcrest Operations Limited 30 L45/73 Newcrest Mining Limited 100 - - L45/79 Newcrest Mining Limited 100 - - L45/80 Newcrest Mining Limited 100 - - L45/99 Newcrest Mining Limited 100 - - L45/100 Newcrest Mining Limited 100 - - L45/101 Newcrest Mining Limited 100 - - L45/104 Newcrest Mining Limited 100 - - L45/106 Newcrest Mining Limited 100 - - L45/107 Newcrest Mining Limited 100 - - L45/110 Newcrest Mining Limited 100 - - L45/139 Newcrest Mining Limited 100 - - L45/165 Newcrest Operations Limited 100 - - M45/6 Newmont Pty Ltd 70 Newcrest Operations Limited 30 M45/7 Newmont Pty Ltd 70 Newcrest Operations Limited 30 M45/8 Newmont Pty Ltd 70 Newcrest Operations Limited 30 M45/9 Newmont Pty Ltd 70 Newcrest Operations Limited 30 M45/10 Newmont Pty Ltd 70 Newcrest Operations Limited 30

17 Newcrest Mining - Telfer Property Report - 31 December 2013
Lease Holder % Holder % M45/11 Newmont Pty Ltd 70 Newcrest Operations Limited 30 M45/33 Newmont Pty Ltd 70 Newcrest Operations Limited 30 M45/203 Newmont Pty Ltd 70 Newcrest Operations Limited 30 M45/204 Newmont Pty Ltd 70 Newcrest Operations Limited 30 M45/205 Newmont Pty Ltd 70 Newcrest Operations Limited 30 M45/206 Newmont Pty Ltd 70 Newcrest Operations Limited 30 M45/207 Newmont Pty Ltd 70 Newcrest Operations Limited 30 M45/208 Newmont Pty Ltd 70 Newcrest Operations Limited 30 M45/209 Newmont Pty Ltd 70 Newcrest Operations Limited 30 M45/210 Newmont Pty Ltd 70 Newcrest Operations Limited 30 M45/211 Newmont Pty Ltd 70 Newcrest Operations Limited 30 M45/247 Newcrest Mining Limited 70 Newcrest Operations Limited 30 M45/248 Newcrest Mining Limited 70 Newcrest Operations Limited 30 M45/249 Newmont Pty Ltd 70 Newcrest Operations Limited 30 M45/364 Newcrest Mining Limited 70 Newcrest Operations Limited 30 M45/399 Newcrest Mining Limited 100 - - M45/400 Newcrest Mining Limited 100 - - M45/532 Newcrest Mining Limited 100 - - M45/533 Newcrest Mining Limited 100 - - M45/576 Newcrest Mining Limited 100 - - M45/580 Newcrest Mining Limited 100 - - M45/581 Newcrest Mining Limited 100 - - M45/612 Newcrest Mining Limited 100 - - M45/620 Newcrest Mining Limited 100 - - M45/621 Newcrest Mining Limited 100 - - M45/622 Newcrest Mining Limited 100 - - M45/631 Newcrest Mining Limited 100 - - M45/632 Newcrest Mining Limited 100 - - M45/633 Newcrest Mining Limited 100 - - M45/709 Newcrest Mining Limited 70 Newcrest Operations Limited 30 M45/710 Newcrest Mining Limited 70 Newcrest Operations Limited 30 M45/720 Newcrest Mining Limited 100 - - M45/721 Newcrest Mining Limited 100 - - M45/722 Newcrest Mining Limited 100 - - M45/737 Newcrest Mining Limited 100 - - M45/738 Newcrest Mining Limited 100 - - M45/739 Newcrest Mining Limited 100 - - M45/763 Newcrest Mining Limited 100 - - M45/764 Newcrest Mining Limited 100 - - M45/765 Newcrest Mining Limited 100 - - M45/772 Newcrest Mining Limited 70 Newcrest Operations Limited 30 M45/775 Newcrest Mining Limited 70 Newcrest Operations Limited 30 M45/835 Newcrest Mining Limited 100 - - M45/858 Newcrest Mining Limited 100 - - M45/859 Newcrest Mining Limited 100 - - M45/860 Newcrest Mining Limited 100 - - M45/861 Newcrest Mining Limited 100 - -

18 Newcrest Mining - Telfer Property Report - 31 December 2013
Lease Holder % Holder % M45/862 Newcrest Mining Limited 100 - - M45/920 Newcrest Mining Limited 100 - - M45/931 Newcrest Mining Limited 100 - - M45/994 Newcrest Mining Limited 70 Newcrest Operations Limited 30 P45/2596 Newcrest Mining Limited 70 Newcrest Operations Limited 30 P45/2597 Newcrest Mining Limited 70 Newcrest Operations Limited 30 P45/2681 Newcrest Operations Limited 100 - - P45/2698 Newcrest Operations Limited 100 - - P45/2699 Newcrest Operations Limited 100 - - P45/2848 Newcrest Operations Limited 100 - - P45/2849 Newcrest Operations Limited 100 - - P45/2850 Newcrest Operations Limited 100 - - P45/2851 Newcrest Operations Limited 100 - - P45/2852 Newcrest Operations Limited 100 - - P45/2853 Newcrest Operations Limited 100 - - P45/2854 Newcrest Operations Limited 100 - - P45/2855 Newcrest Operations Limited 100 - - P45/2856 Newcrest Operations Limited 100 - - P45/2857 Newcrest Operations Limited 100 - - P45/2858 Newcrest Operations Limited 100 - - P45/2859 Newcrest Operations Limited 100 - - P45/2860 Newcrest Operations Limited 100 - - P45/2861 Newcrest Operations Limited 100 - -
4.3 Relevant Agreements
4.3.1 Westwin Option Agreement
Westwin Investments Pty Ltd granted Newcrest an option to purchase E45/2448 for $1M and a 1.5% NSR royalty. An option payment of $20,000 per year is payable. The option is due to expire in November 2014. This agreement does not relate to producing tenements.
4.3.2 Acebell Option Agreement
Acebell Holdings Pty Ltd granted Newcrest an option to purchase E45/2727 for $500,000 and a 1.5% NSR royalty. Option payments of $10,000 on satisfaction of the conditions precedent, $15,000 one year thereafter and $20,000 the following year are payable. The option is due to expire in March 2014 and negotiations are continuing to extend this option agreement. This agreement does not relate to producing tenements.
4.3.3 Cape Lambert Withdrawal and Royalty Agreement
Cape Lambert Iron Ore Ltd agreed to withdraw a prior mining tenement application in favour of an application by Newcrest Operations Limited (E45/3100). Consideration for withdrawing the application is an annual exploration payment of $10,000 and a royalty of 1.5% NSR in the event of mineral production from the tenement area. This agreement does not relate to producing tenements.

19 Newcrest Mining - Telfer Property Report - 31 December 2013
4.3.4 Martu Agreements
Agreements were in place with the holders of native title in respect of Telfer for the purposes of the Telfer expansion project (2002-2005). There are current negotiations with the holders of native title to seek to put in place a comprehensive agreement to support future operations at Telfer.
4.4 Royalties Payable
4.4.1 Mount Isa Mines Limited
The royalty is in favour of Mount Isa Mines Limited. In respect of gold, it is $10/oz and in respect of minerals (other than gold) it is 2% of the NSR. This agreement does not relate to producing tenements.
4.4.2 Mineral Commodities Limited
The royalty is in favour of Minerals Commodities Limited. In respect of gold it is $10/oz and in respect of minerals (other than gold) it is 1.5% of the NSR. This agreement does not relate to producing tenements.
4.5 Environmental Liabilities
The Department of Mines & Petroleum in Western Australia holds a total of $33,894,900 as unconditional performance bonds.

20 Newcrest Mining - Telfer Property Report - 31 December 2013
5 ACCESSIBILITY, CLIMATE, LOCAL RESOURCES, INFRASTRUCTURE AND PHYSIOGRAPHY
5.1 Accessibility
5.1.1 Road
Road access to the Telfer site consists of public roads vested in Main Roads Western Australia and the Shire of East Pilbara along with a section of private roadway owned and maintained by the Telfer Mining Operations. Road transport to and from Telfer generally focuses on the approximately 450km route to Port Hedland for heavy haulage of copper-gold concentrates and import of consumables to the mine site.
A secondary route is available to the south through Newman and ultimately Perth.
5.1.2 Air Strip
Telfer is located approximately 1,300km from Perth via air travel and the site is serviced by a Newcrest-owned dedicated all-weather air strip capable of handling small to medium sized aircraft. The site is a fly-in fly-out (FIFO) operation serviced by personnel living in Perth and other centres with regular flights as the primary means of access to the site. The airstrip also facilitates urgent supply access for mission critical items and emergency recovery capabilities via the Royal Flying Doctor Service.
5.2 Climate
The climate of the region is characterized by hot summers (January average daily temperatures exceed 40°C) and warm winters (July average daily temperatures exceed 10°C). Rainfall is strongly seasonal and occurs between December and March and is usually associated with remnant cyclones and thunderstorm activity. Average annual rainfall is 366mm and average annual evaporation is 4160 mm.
5.3 Local Resources
The remote Telfer mine site is located in a sparsely populated area at the edge of the Great Sandy Desert. Seasonal conditions vary between arid and semi-arid, with vegetation cover being limited to sparse drought-tolerant low ground cover. These environmental conditions essentially offer little value to the requirements of an active mine site, which in turn necessitates the importation of the vast majority of materials and personnel to operate the site.
5.4 Infrastructure
5.4.1 Water Supply
Telfer mine site relies on abstraction of groundwater from a series of proximately located bores for both raw and potable water requirements. Current abstraction rates average approximately 57Ml/d from an installed total bore field peak capacity of 80Ml/d.
Non-potable applications of the abstracted water include the mine processing circuits, dust suppression, wash down and fire fighting. Treated potable water is supplied to the camp facilities and strategically located personnel access points throughout the mining project.

21 Newcrest Mining - Telfer Property Report - 31 December 2013
5.4.2 Electricity Generation
There are currently two permanent power stations at Telfer. The Primary Power Station (PPS) comprises three GE LM6000 gas turbines and the Secondary Power Station (SPS) comprises eight diesel generators. The PPS was originally designed to operate in an N+1 configuration, that is, two duty and one standby. As the power demand has increased since commissioning of the PPS, there are currently 12 approximately 1MW Aggreko rental gas engines supplementing the LM6000s. The SPS is available as a backup.
The rated output of each gas turbine in normal mode is 43MW, but can be operated at 47MW in SPRINT mode. This provides a maximum rating of installed permanent power generation at Telfer of approximately150MW.
5.4.3 Gas Supply
The volume of feed gas required to supply the electrical generation gas turbine plant was impractical to transport to site by road or rail. Therefore, a dedicated, purpose built 450km natural gas pipeline was installed to feed natural gas from Port Hedland to the Telfer site. Newcrest has contracted pipeline capacity of 26TJ/day.
The pipeline is operated by APA Group for sole supply of gas to the Telfer and Nifty mines. Gas is supplied under contract by Santos and Apache Energy. The contract is valid for supply to December 2019.
5.4.4 Port Facilities
Copper-gold concentrate produced from the Telfer site is exported to customers, mainly in East Asia, via the Port Hedland harbour facilities. The substantial municipal port facilities at Port Hedland cater for the export of various mineral types from around the Pilbara region.
Telfer mineral concentrates are transferred from road transportation to storage and onto ship via a dedicated facility owned by the Port Hedland Port Authority.
5.4.5 Mining Camp
Telfer was historically operated as a live-in township of dedicated mine workers and support staff prior to the suspension of operations in 2000. Today the site is designated as a FIFO operation with a work force of approximately 1,100 full time equivalent (FTE) staff and contractors. The accommodation facilities on site comprise a total of 1,733 rooms. Numerous rosters are in place for these personnel.
The original permanent camp was converted to provide transient accommodation under the FIFO arrangements.
5.4.6 Auxiliary Infrastructure
Operation of a large scale mine in a remote locality requires the site to be largely self-sufficient. Specific items of infrastructure are required to supply, maintain and service the requirements of machinery and personnel. Therefore, numerous items of significant infrastructure are located and maintained as part of the ongoing Telfer mining operations. Items include fuel storage, laboratory, workshops, stores buildings, lay-down areas, effluent disposal systems and administration offices.

22 Newcrest Mining - Telfer Property Report - 31 December 2013
6 HISTORY
6.1 Discovery
The Bureau of Mineral Resources (Australian Geological Survey organization) first geologically mapped the Telfer district in 1959. Gold and copper mineralization was not identified during this mapping.
Prospectors and exploration companies targeted the Telfer district in the late 1960s and early 1970s as a copper province.
In 1971, Day Dawn Minerals NL undertook a regional sampling program in the district under the direction of R Thompson. Anomalous copper and gold values were returned from gossanous outcrops that were sampled at Main Dome (Tyrwhitt, 1995).
6.2 Telfer Gold Mine Development History
6.2.1 Introduction
From the recognition of gold-bearing gossans in 1971 and the commencement of mining activities in 1977 up to the suspension of operations in 2000, Telfer Gold Mine produced almost 6Moz of gold.
Five million ounces of gold were produced from the oxidized and leached cap of a large gold-copper system using open pit mining methods, and almost 1Moz came from sulphide ore produced using underground mining methods to extract high grade mineralization. Prior to suspension of operations in late 2000, the annual gold production from both the open pit and underground operations was approximately 300koz.
6.2.2 Oxide Mining
An intensive exploration and resource drilling program was undertaken by Newmont Pty Ltd from 1972 to 1975. This program defined an open pit reserve of 3.8Mt @ 9.6 g/t Au containing in excess of 1Moz of contained gold (Turner, 1982) mainly comprising oxide ore from the Middle Vale Reef (MVR).
In 1975, BHP Gold bought into the project with 30% ownership as a consequence of the foreign ownership legislation introduced by the Australian Federal Government at the time. Newmont and BHP Gold subsequently merged their Australian assets to form Newcrest Mining Limited in 1990.
Mining commenced during 1975 at Main Dome and reached full production of 0.5 Mtpa in 1977. Mineral Resources and Mineral Reserves were maintained at 2Moz and 1Moz of contained gold respectively in the early part of Telfer's mine life (Chamberlain, 1990).
Initially, ore processing was by milling, cyanidation and Merrill-Crowe type gold recovery. During the 1980s, the potential was recognized for a large, low grade oxide resource in Main Dome and to the northwest in West Dome. This resulted in the introduction of a mill expansion in 1986 to increase crushing and grinding capacity, including conversion from Merrill-Crowe type gold recovery to a carbon in leach (CIL) circuit.
Further extensive metallurgical testwork led to the establishment of a dump leach operation which commenced in 1988, with an initial processing rate of 4Mtpa. Dump leach feed cut-off

23 Newcrest Mining - Telfer Property Report - 31 December 2013
grades were gradually lowered during the 1990s to allow an increase to the mill feed ore head grade. By the late 1990s, Telfer was treating:
• 2.5Mtpa of high grade oxide ore through the mill and CIL circuit
• 15Mtpa of low grade oxide ores by dump leaching.
6.2.3 Sulphide Reef Mining
In 1989, a sulphide flotation circuit was established to process MVR supergene-sulphide ore, initially from open pit sources and in 1990, from underground. This circuit utilized bulk flotation to recover both copper and gold into a concentrate of saleable grade.
Exploration programs during the 1990s successfully delineated additional reefs on the eastern flank of Main Dome. These reefs, which include the M10, M12 and M30, were mined using narrow vein underground mining methods.
By the late 1990s, Telfer was treating 0.3Mtpa of sulphide ore through sequential flotation to produce copper concentrates for off-site treatment and pyrite concentrate for gold recovery by intensive cyanidation and CIL treatment.
6.2.4 High Cyanide Soluble Copper Mining
Prior to 2000, open pit mining had been largely confined to the production of oxide ore. The majority of the open pit mining focused on areas with cyanide soluble copper levels of less than 400ppm to provide ore amenable to conventional cyanide leach processing and dump leaching.
However, during 2000, open pit production was becoming constrained by a combination of increasing stockwork sulphide mineralization and high cyanide soluble copper material, neither of which could be economically processed through the existing treatment plant or dump leach operation.
The increase in open pit copper grades in the feed to CIL and dump leach impacted adversely on cyanide costs, copper and cyanide concentrations in tailings and gold bullion quality. A Sulphidization, Acidification, Recovery, Treatment (SART) facility was installed and commissioned shortly before operations were suspended in late 2000. The SART plant was introduced for copper and cyanide recovery from the leach liquors from the plant resulting in improvement of both treatment economics and the environmental quality of the plant tailings.
6.2.5 Telfer Main Dome Underground (Deeps)
The I30 quartz reef was discovered in 1991 using surface diamond drilling as part of an exploration program to test for potential gold and copper mineralization within the Main Dome at 1000m below surface (mbs). A mining feasibility study was completed in 1995 which focused on the extraction of the I30 quartz reef using narrow vein reef mining methods. Based upon the recommendations from this study and Board approval, the I30 Decline access was subsequently established and reached the M50 Reef in July 1997.
The I30 Decline was halted in 1997 based on the results of the Telfer Gold Mine Strategic Review which identified a series of mining risks not previously identified in the earlier feasibility study. These risks related to insufficient drilling of the eastern limb of the I30 quartz reef and also the poor ground conditions being experienced in the MVR reef.

24 Newcrest Mining - Telfer Property Report - 31 December 2013
A conceptual study was established in early 1998 to review the mining potential of the I30 Quartz Reef and associated high grade reefs. This study was designated the I Series Project (ISP). The ISP Prefeasibility Study defined the existence of gold and copper mineralization on the eastern limb of the I30 Quartz Reef as well as an additional eight hanging wall reefs and three footwall reefs. Underground mining studies defined cut and fill and room and pillar on the western flank of the I30 Quartz Reef, up-hole retreat mining method in the vertical limb of the I30 Quartz Reef and the Telfer M-Reef, long hole stoping method on the moderate dipping I30 Quartz Reef east flank mineralization. Evaluation of underground haulage options identified truck haulage via a decline as the most viable option for the reserve of 1Mt @ 15.6 g/t Au and 2.6% Cu. Evaluation of the ore treatment options recommended modification of the flotation circuit of the existing sulphide treatment plant to accommodate the increased underground reserve.
The resource definition activities from the ISP Prefeasibility Study identified the potential for a large tonnage lower gold and copper grade stockwork surrounding the I30 Quartz Reef. This material was referred to as the Helmsman conceptual resource and formed the basis of the underground Telfer resource assessed in the Feasibility Study commissioned in 2000 and completed in September 2002. This feasibility study designs and recommendations were adopted and formed the basis for the modern operations.
6.3 Historic Mineral Resources
Historic Mineral Resources are not reported here as are available in Newcrest annual reports.
6.4 Summary
A summary of the project history through to the completion of the current feasibility study and commencement of current operations is shown in Table 6.1.

25 Newcrest Mining - Telfer Property Report - 31 December 2013
Table 6.1 Summary of Project History Date Stage Event
1971 - Telfer orebody discovered
1975 - Newmont Australia and BHP Gold commence initial project development
1977 - First production from initial project
1986 - Mill expansion and conversion to CIL circuit
1988 - Dump Leach operation established
1989 - Sulphide Flotation Circuit established for sulphide MVR processing
1990 - Newmont Australia and BHP Gold merge to form Newcrest
1991 - I30 Quartz Reef first discovered
1994 - Trial of underground M-Reef processing
1995 - Pyrite Leach Circuit commissioned for M-Reef processing
1995 - Initial Feasibility Study on the I30 Quartz Reef - start of the I30 decline development
July 1997 - Telfer strategic review - shut down of the I30 decline development
1998 - Conceptual study on the I30 Quartz Reef and associated reefs. ISP Prefeasibility Study approved
2000 - SART plant commissioned to process high CNSCu ore
2000 - Initial project placed on care and maintenance
Aug 2000 1 Feasibility Study stage 1 approved for the Telfer Open Pit and Telfer Deeps
Apr 2001 1 Feasibility Study stage 1 extension approved
Aug 2001 - Decline access established to the I30 reef system
Jul 2001 2 Feasibility Study stages 2 to 5 approved
Sep 2002 4 Feasibility Study completed
Feb 2005 - Gold production from current two train plant configuration commences

26 Newcrest Mining - Telfer Property Report - 31 December 2013
7 GEOLOGICAL SETTING AND MINERALIZATION
Telfer is located within the north-western exposure of the Palaeoproterozoic to Neoproterozoic Paterson Orogen (formerly Paterson Province). The Paterson Orogen includes the Palaeoproterozoic Rudall Complex, Neoproterozoic Yeneena Supergroup (Throssell Range and Lamil Groups), and the Neoproterozoic Tarcunyah Group of the northwest Officer Basin (Figure 7.1). The Yeneena Supergroup hosts the Telfer Mining District and consists of a 9km thick sequence of marine sedimentary rocks that unconformably overlie the Palaeoproterozoic Rudall Complex.
Figure 7.1 Telfer Regional Geology
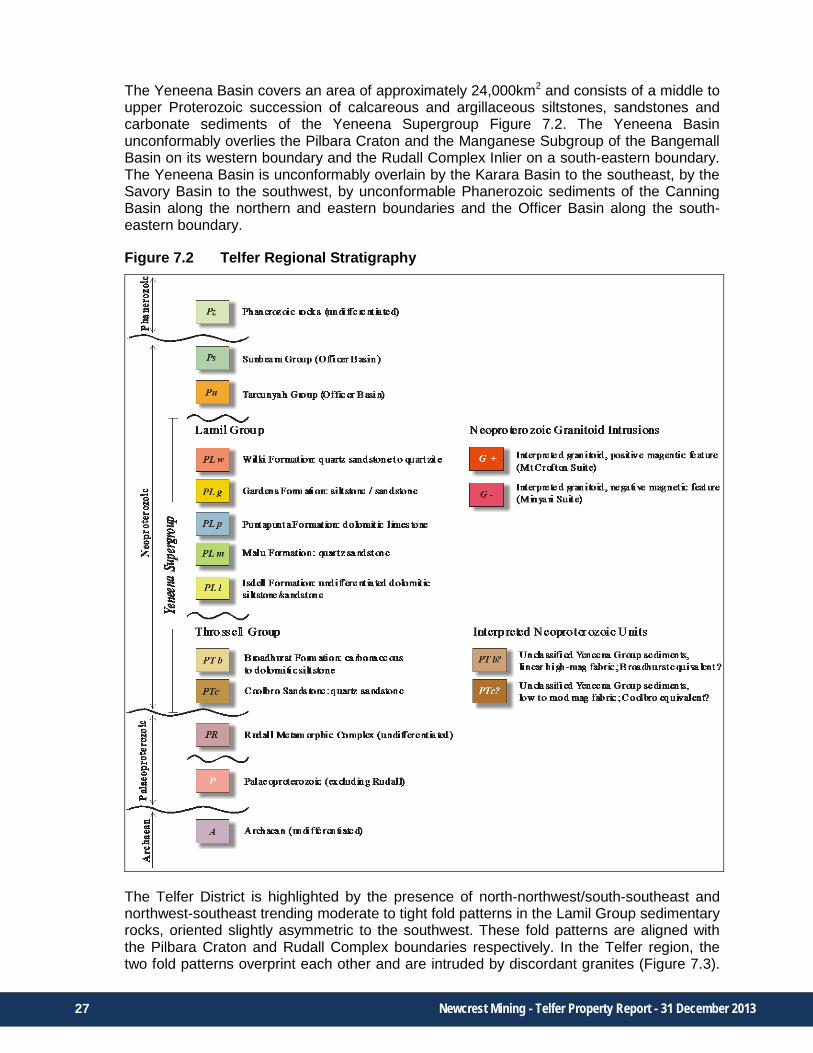
27 Newcrest Mining - Telfer Property Report - 31 December 2013
The Yeneena Basin covers an area of approximately 24,000km2 and consists of a middle to upper Proterozoic succession of calcareous and argillaceous siltstones, sandstones and carbonate sediments of the Yeneena Supergroup Figure 7.2. The Yeneena Basin unconformably overlies the Pilbara Craton and the Manganese Subgroup of the Bangemall Basin on its western boundary and the Rudall Complex Inlier on a south-eastern boundary. The Yeneena Basin is unconformably overlain by the Karara Basin to the southeast, by the Savory Basin to the southwest, by unconformable Phanerozoic sediments of the Canning Basin along the northern and eastern boundaries and the Officer Basin along the south-eastern boundary.
Figure 7.2 Telfer Regional Stratigraphy
The Telfer District is highlighted by the presence of north-northwest/south-southeast and northwest-southeast trending moderate to tight fold patterns in the Lamil Group sedimentary rocks, oriented slightly asymmetric to the southwest. These fold patterns are aligned with the Pilbara Craton and Rudall Complex boundaries respectively. In the Telfer region, the two fold patterns overprint each other and are intruded by discordant granites (Figure 7.3).
28 Newcrest Mining - Telfer Property Report - 31 December 2013
The interference of these fold patterns in the Lamil Group rocks formed doubly plunging domal structures characteristic of the Telfer district. Domes vary from tight (e.g. Tims Dome) to open and rounded (e.g. Telfer and 17 Mile Hill Domes).
The Paterson Province contains two suites of Neoproterozoic granitic intrusions that have a close spatial and possibly genetic relationship to mineralization in the Telfer district. Intrusions are subdivided into two granite trends, the Mount Crofton to Minyari Granite trend, and the Wilki to O'Callaghans Granite trend, based upon petrographic and major element geochemical studies. These intrusions were emplaced episodically over a prolonged period ranging from approximately 600 to 650 million years.
Figure 7.3 Telfer Regional Geology
Mineral Resources reported for the Telfer mining centre consist of:
• open pit stockwork and reef mineralization in Telfer Main Dome and West Dome;
• stockwork and reef mineralization mined underground in the sub-level cave (SLC) mining operation;
• stockwork mineralization in the vertical stockwork corridor (VSC) below the SLC;
• poly-metallic skarn mineralization at O'Callaghans (Figure 7.4);
• lode, vein and stockwork mineralization at Camp Dome (Figure 7.3).

29 Newcrest Mining - Telfer Property Report - 31 December 2013
Figure 7.4 Location of O'Callaghans and Camp Dome
7.1 Telfer
7.1.1 Geology
Gold and copper mineralization at Telfer consists of stratiform reefs and stockworks hosted by sedimentary rocks of the Malu Formation of the Lamil Group. The Lamil Group comprises relatively weakly deformed and metamorphosed Proterozoic sediment units northeast of the Camel-Tabletop Fault. The important attributes of the Lamil Group are the presence of abundant carbonate units, and weakly developed penetrative deformation.
Two very different aged granitoid suites are present in the Telfer region.
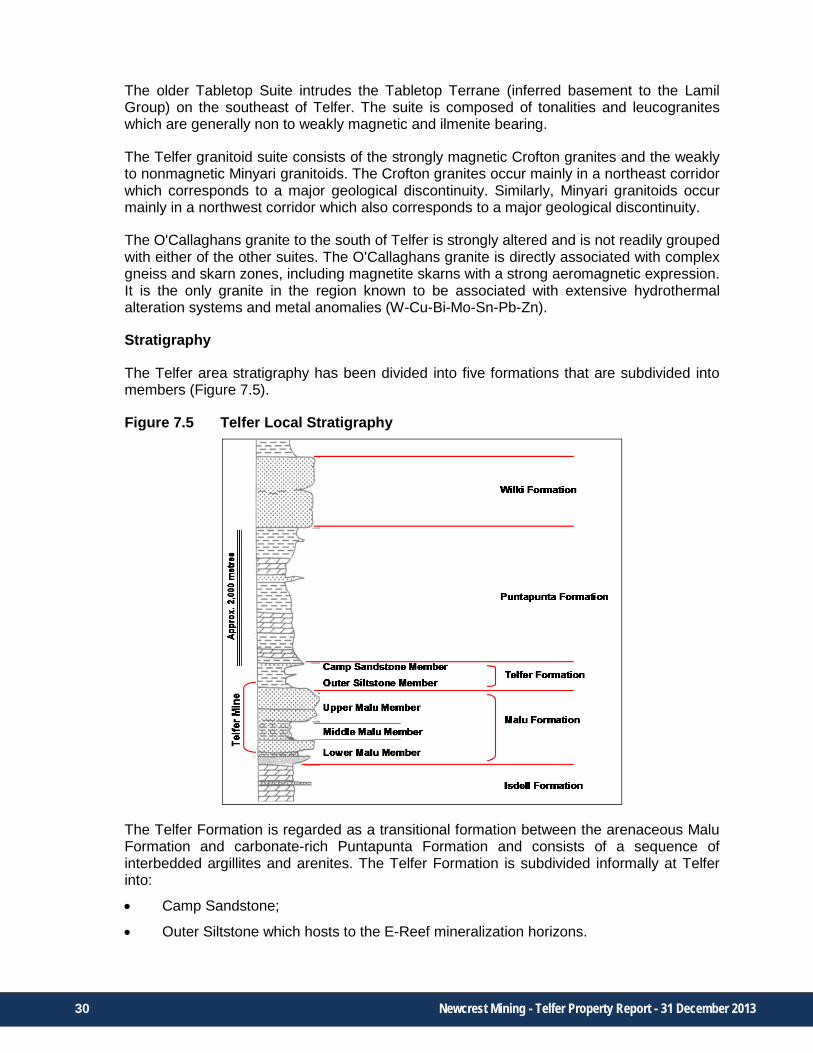
30 Newcrest Mining - Telfer Property Report - 31 December 2013
The older Tabletop Suite intrudes the Tabletop Terrane (inferred basement to the Lamil Group) on the southeast of Telfer. The suite is composed of tonalities and leucogranites which are generally non to weakly magnetic and ilmenite bearing.
The Telfer granitoid suite consists of the strongly magnetic Crofton granites and the weakly to nonmagnetic Minyari granitoids. The Crofton granites occur mainly in a northeast corridor which corresponds to a major geological discontinuity. Similarly, Minyari granitoids occur mainly in a northwest corridor which also corresponds to a major geological discontinuity.
The O'Callaghans granite to the south of Telfer is strongly altered and is not readily grouped with either of the other suites. The O'Callaghans granite is directly associated with complex gneiss and skarn zones, including magnetite skarns with a strong aeromagnetic expression. It is the only granite in the region known to be associated with extensive hydrothermal alteration systems and metal anomalies (W-Cu-Bi-Mo-Sn-Pb-Zn).
Stratigraphy
The Telfer area stratigraphy has been divided into five formations that are subdivided into members (Figure 7.5).
Figure 7.5 Telfer Local Stratigraphy
The Telfer Formation is regarded as a transitional formation between the arenaceous Malu Formation and carbonate-rich Puntapunta Formation and consists of a sequence of interbedded argillites and arenites. The Telfer Formation is subdivided informally at Telfer into:
• Camp Sandstone;
• Outer Siltstone which hosts to the E-Reef mineralization horizons.
31 Newcrest Mining - Telfer Property Report - 31 December 2013
The Malu Formation conformably overlies the Isdell Formation and consists of a massive to thickly bedded, metamorphosed, fine to medium grained quartzite and quartz sandstone with occasional thin interbeds of siltstone and mudstone. This is the host for mineralization in the M-Reefs and stockwork domains and is subdivided into:
• Rim Sandstone.
• Median Sandstone.
• Middle Vale Siltstone which hosts the Middle Vale Reef.
• Footwall Sandstone which hosts extensive footwall stockwork and disseminated pyrite mineralization.
• Lower Vale Siltstone hosts to localized reef mineralization;
• Upper Malu Quartzite Member laminated siltstones preferentially host the M-Reefs which include the M10, M12, M20, M28, M30, M35, M40, M45, M50, M55 and M60 Reefs;
• Middle Malu Member including Lower Limey Unit and I30 Reef;
• Lower Malu Quartzite Member.
The Isdell Formation is the stratigraphically lowest formation in the north-eastern zone of the Yeneena Basin and is a poorly sorted, mixed carbonate and clastic sequence. The formation comprises various types of dolomite ranging from fine grained, laminated to clastic and stromatolitic varieties. To date this formation has not been intersected in the deepest drilling at Telfer.
Structure
The topography at the Telfer mine site is dominated by two large scale asymmetric dome structures with steep west dipping axial planes (Figure 7.6). Main Dome is located in the southeast portion of the mine and is exposed over a strike distance of 3km north-south and 2km east-west before plunging under transported cover. West Dome forms the topographical high in the northwest quadrant of the mine and has similar dimensions to Main Dome. Both fold structures have shallow to moderately dipping western limbs and moderate to steep dipping eastern limbs.

32 Newcrest Mining - Telfer Property Report - 31 December 2013
Figure 7.6 Telfer Pre-Mining Structural and Stratigraphic Setting
Five monocline-anticline structures were mapped in surface and underground exposures and logged in drill holes in Main Dome and West Dome. These strike north-south and are typically up to 1km in strike length and 50m to 200m wide. They form double plunging structures with axial planes orientated 35º to 50º to the west. The monocline/anticline structures commence and terminate as open fold structures, whilst the central portions of the monocline/anticlines typically have steep east limbs which in some areas are overturned. The I30 monocline is the best defined of these structures, having been intersected in underground development and diamond drill holes. These structures have a close spatial relationship to the location of economic gold-copper mineralization within both the Open Pit and Telfer Underground.
Several fault sets were identified by drill hole logging and geological mapping. They include:
• West shallow to moderate dipping fault systems, semi-parallel to the monocline-anticline fold structure;
• Northwest moderate dipping fault set;
• Southwest moderate dipping fault set;
• Northeast striking fault set (Graben Fault set);
• East-west striking near vertical fracture set (Leader Hill vein set).
7.1.2 Mineralization
Mineral Resources reported for the Telfer mining centre consist of:
• open pit stockwork and reef mineralization in Telfer Main Dome and West Dome;
• stockwork and reef mineralization mined underground in the Telfer Underground SLC mining operation;

33 Newcrest Mining - Telfer Property Report - 31 December 2013
• stockwork mineralization in the VSC below the SLC.
Mineralization within the Telfer deposit is controlled by structure and lithology. Several styles of mineralization were recognized, namely narrow high-grade reefs, pod-like mineralized bodies, sheeted vein-sets and large areas of low grade stockwork mineralization, with the latter forming the majority of the sulphide resource (Figure 7.7). The primary mineralization was overprinted by surface weathering processes.
Figure 7.7 Oblique Schematic View Looking North showing Key Mineralized Systems
The sulphide mineralization is characterized by fresh sulphides, predominantly pyrite and chalcopyrite. The main copper minerals listed in order of occurrence are chalcopyrite, chalcocite and bornite with minor cobaltite and nickel-sulphide. Primary gold generally occurs as free grains, on sulphide boundaries and to a minor degree with silica grains.
Primary gold mineralization is typically associated with pyrite/chalcopyrite sulphides and quartz/dolomite gangue. There is a correlation between vein frequency and gold grade.
Weathering locally modified the mineralization, to depths typically up to 200m, with the boundary between oxide and primary mineralization being irregular. The weathering profile produced local areas of supergene enrichment where the copper to sulphur ratio is characteristically higher. Supergene minerals include gold with limonite/goethite, malachite and chrysocolla in the depleted oxide zone, giving way to chalcocite, pyrite, digenite, covellite, tenorite and cuprite at depth in primary mineralization. The copper to sulphur ratio decreases with depth below the supergene zones. Copper is, in general, more mobile in these supergene area zones than gold. The depth of oxidation is closely related to the structural framework and typically exists to approximately 200m below surface, although local areas show oxidation down faults in excess of 500m below surface.

34 Newcrest Mining - Telfer Property Report - 31 December 2013
The primary controls on narrow vein reefs, stockwork veining and breccia formation are listed below in order of importance:
• stratigraphy;
• north-south monocline-anticline folds;
• west dipping thrust faults;
• conjugate fault corridor;
• northeast striking, northwest dipping corridor boundaries;
• northwest striking, southwest dipping corridor boundaries;
• east-west vertical structures.
Reef Mineralization
The highest concentration of gold and copper grades occurs within bedding sub-parallel reef systems. In Main Dome a total of 21 reef structures were identified from drill hole data or mapping of surface and underground exposures within the Open Pit Mineral Resource, and include 10 E-Reefs within the Outer Siltstones, the MVR within the Middle Vale Siltstone and the M10 to M50 series of reefs within the Malu Formation. The primary characteristics of the reef systems are:
• broadly concordant to lithological boundaries;
• laterally extensive (greater than 1km) both along strike and dip;
• true thickness of 0.1m to 1.2m, averaging between 0.3m and 0.7m;
• high relative nugget effect;
• variable dip varying from flat at the crest of Main Dome to about 40º on the eastern flank of Main Dome;
• gold grade is typically high but variable: 5 g/t Au to 50 g/t Au;
• copper grade ranges between 0.2% Cu and 1.5% Cu.
Characteristics of the dominant Main Dome reefs are outlined below.
Middle Vale Reef (MVR) is the most extensive of the M-Reefs and was mined in open cut workings in Main Dome and West Dome as well as in underground development on the eastern flank of Main Dome. The MVR lies semi-parallel to bedding within the Middle Vale Siltstone, generally close to the hanging wall of the Footwall Sandstone. It has an average thickness of 1m and ranges up to 3m. The MVR is an auriferous quartz-pyrite-chalcopyrite reef or its oxidized equivalent.
M10 and M12 reefs were intersected in underground development and drilling and extend more than 2km north-south and more than 500m down dip in the eastern flank of Main Dome. The thickness of the reefs ranges from 0.1m to 2m, typically 0.45m thick in areas mined by underground development. The M10 reef occurs 100 m stratigraphically below the MVR and 12m above the M12 reef. The reefs consist of silica and pink, grey and white dolomite. Sulphide minerals are mainly pyrite and chalcopyrite oxidized to chalcocite, digenite, bornite, covellite and native copper in the transition zone.
M35 reef lies 200m stratigraphically below the M10 reef and occurs as a discontinuous reef in a strongly sheared sandstone and siltstone zone up to 2m thick. High gold grades are

35 Newcrest Mining - Telfer Property Report - 31 December 2013
found within the sheared zone with or without typical reef mineralogy being present. In areas where a typical reef mineral assemblage is present (silica-dolomite-sulphide), gold grades range between 43 g/t Au and 144 g/t Au.
M40 reef lies 250m stratigraphically below the M10 reef and 50m above the M50 reef and is typically 0.2m to 0.6m in thickness. Gold grades vary from 5 g/t Au to 80 g/t Au, with an average grade of 16 g/t Au. It is irregularly developed within a heavily dolomitized sandstone/siltstone layer known as the Upper Limey Unit which has undergone strong carbonate alteration.
M45 reef is typically 2m thick and forms either a sericite-pyrite shear plane or reef with similar mineralogy to the middle unit of the M50 reef sequence. The structure was only identified in the eastern flank of Main Dome and occurs 25m stratigraphically below the M40 and 25m above the M50 reef. Gold and copper grades are typically less than 10 g/t Au and 1% Cu respectively.
M50 reef occurs 300m stratigraphically below the M10 reef and is composed of three visually distinguishable units. The upper unit is formed from black, fine to medium grained carbonaceous siltstone with disseminated sulphides, fine white dolomite veins, and pyrite-chalcopyrite veins. The unit has a thickness from 0.1m to 0.4m with a true average thickness of 0.2m. Gold grades range from 3 g/t Au in fresh rock to 6.4 g/t Au in oxidized areas. The middle unit of the M50 reef is consists of typical reef mineral assemblages and ranges from 0.1m to 2m in thickness. There is an abundance of primary chalcocite in this reef, with highest concentrates around the Graben Fault, which cross cuts the M50 reef. Gold grades range between 5 g/t Au and 94 g/t Au and average 34.6 g/t Au in fresh rock. The lowest unit of the M50 reef system comprises a 0.2m to 0.5m thick calcareous sandstone.
I30 Quartz Reef is a stratabound quartz-carbonate-sulphide vein that occurs approximately 900m to 1000m below surface at the contact of the Middle Malu Member and the Lower Limey Unit (LLU). It contributes a significant proportion of the gold and copper in the Telfer Deeps SLC Mineral Resource. Drilling delineated the I30 Quartz Reef over an area of 875m (north-south) by 160m (east-west) in the southeast corner of Main Dome. The geometry of the I30 Quartz Reef is controlled by the intersection of the I30 monocline fold structure, a north-south trending reverse fault and a near vertical north-east trending fault corridor. The quartz reef has a maximum true thickness of 10m in the hinge of the I30 Monocline, and thins to a true thickness of 0.5m on the flanks of the fold structure. The I30 Quartz Reef mineralization is characterized by a gangue of quartz, grey, white and pink dolomite, calcite and rare siderite. The dominant sulphide minerals are pyrite and chalcopyrite.
Stockwork Mineralization
Stockwork mineralization is characterized by narrow, often discontinuous veins that crosscut stratigraphy. Large domains of stockwork mineralization were defined in the open pits and also within the Telfer Deeps and Vertical Stockwork Corridor Mineral Resources. Stockwork mineralization is best developed in the axial zones of Main Dome and West Dome and is discordant to lithological boundaries, although some stratigraphic units have more abundant stockworks than others and vein intensity within stockwork can be greater adjacent to reefs. Stockworks are laterally extensive, between 0.1km to 1.5km scale and the geometry of the stockwork zones is related to structure and stratigraphy.
Stockwork mineralization can also include areas of breccia dominated by quartz, carbonate and sulphides.

36 Newcrest Mining - Telfer Property Report - 31 December 2013
7.2 O'Callaghans
The O'Callaghans poly-metallic deposit is located approximately 10km south of the Telfer Gold Mine.
7.2.1 Geology
The O'Callaghans deposit lies at the contact between the Proterozoic Puntapunta Formation and the O'Callaghans granite. The Puntapunta Formation conformably lies between the Wilki Formation and the Telfer Formation, and considered to be outer carbonate shelf deposits consisting of well-bedded, clastic dolomite and limestone, with lesser amounts of calcareous sandstone and siltstone. The O'Callaghans granite was identified at around 350m below surface based on diamond drilling intercepts and geophysical surveys. Drilling defined a zone of poly-metallic skarn mineralization up to 60 m thick above the granite/limestone contact.
The O'Callaghans granite is variably altered and is not readily grouped with other regional granitic suites. The O'Callaghans granite is directly associated with complex skarn zones, including pyrite/pyrrhotite/magnetite skarns with a strong magnetic expression. It is the only granite known to be associated with extensive hydrothermal alteration systems and metal anomalies (W-Cu-Bi-Mo-Sn-Pb-Zn).
Folded Puntapunta Formation sedimentary rocks appear to be overprinted by variable metamorphic alteration. Sulphide mineralization related to high temperature metasomatic skarn formation is consistent with a rapid onset of amphibolite facies contact metamorphic alteration of the host rocks (tremolite/hornblende + biotite). This forms an irregular metamorphic contact aureole above the O'Callaghans granite stock and is a valuable visual aid in recognizing onset and distribution of sulphide mineralization. These relationships are shown schematically in Figure 7.8.
Figure 7.8 Schematic Cross Section of O'Callaghans Skarn Deposit

37 Newcrest Mining - Telfer Property Report - 31 December 2013
The skarn mineralization and metamorphic aureole overlies a massive, sub-horizontal, poorly mineralized, quartz flooded zone, which in turn overlies weakly foliated granite. Contact with the granite is relatively sharp.
7.2.2 Mineralization
The O'Callaghans deposit is a polymetallic skarn deposit located at the contact between limestone of the Puntapunta Formation and an intrusive granite. The main skarn is identified as calc-silicate rock containing more than 10% sulphides generally surrounded by a halo of calc-silicates with less than 10% sulphides.
Tungsten, copper, zinc and lead are considered potentially economically extractable. However elevated levels of molybdenum and silver are also present. Tungsten-bearing minerals include both scheelite and wolframite. Gold is not present in economically significant amounts. Elevated levels of fluorine are also recorded. Metal zoning is identified within the overall skarn with two areas of elevated zinc and lead broadly associated with a tungsten mineral species change from scheelite to wolframite.
7.3 Camp Dome
Camp Dome is located 20km by road north of the Telfer mine site. Access is via the main Telfer to Port Hedland road then northeast along the existing tracks.
7.3.1 Geology
The Camp Dome copper deposit is interpreted to be located in the Middle Malu Member to Lower Malu Member of the Malu Formation folded into a composite dome structure in a similar stratigraphic and structural setting as the deposits at the Telfer Gold Mine.
Camp Dome is hosted by Middle to Lower Malu Member of the Malu Formation estimated to be in excess of 500m thick. The Lower Malu Member is a competent, thickly bedded (up to 10m) to faintly laminated, fine to medium grained siliceous turbidite quartz sandstone, with minor interbedded siltstone and carbonate sandstone units. Dark, carbonaceous siltstone/shale units occur towards the base and top of the member. The Lower Malu Member is interpreted to have been deposited as a prograding turbidite fan, with the presence of carbonaceous shale suggesting a deep marine environment.
Near surface alteration in the central Camp Dome area is characterized by strong pervasive quartz and white mica, with or without iron oxides (after sulphides), with zones of intense silicification associated with quartz veining. At depth, strong phyllic and potassic alteration and contact metamorphic textures are recorded. Petrologic descriptions include alteration assemblages of biotite, potassic feldspar, muscovite, carbonate (calcite, dolomite), sulphides, tourmaline and rutile overprinting the sandstones and pelites.
Deep weathering is present over the Camp Dome area typically with complete oxidation to 80m to 100m below surface and partial oxidation noted up to 250m below surface. The deep weathering of primary sulphides is interpreted to have resulted in the copper-enrichment blanket at the oxidation interface.
The complex domal structure comprises 17 Mile Hill Dome and two subsidiary domes (Camp Dome and Pajero Dome). Camp Dome is within a doubly plunging anticline forming a large northwest trending open fold with similar characteristics to Telfer Dome.
38 Newcrest Mining - Telfer Property Report - 31 December 2013
7.3.2 Mineralization
The Camp Dome mineralization is a satellite copper-only deposit with quartz/sulphide veins hosted in folded sedimentary rocks. Weathering of primary mineralization resulted in a chalcocite-rich and associated secondary copper blanket at the oxidation boundary. No significant gold grades were intersected in drill holes.
Mineralization at Camp Dome is interpreted to occur in two forms:
1. Primary mineralization associated with high sulphide consisting of quartz/pyrite/pyrrhotite/chalcopyrite/scheelite veins, breccias and stockworks. The main zone of primary mineralization occurs on the western limb of the axial position of Camp Dome and dips at approximately 30º to the southeast along the strike of the fold axis.
2. Secondary supergene copper formed at the weathering boundary beneath a near-surface leach horizon. The secondary copper mineralization was confirmed at depths typically between 55m and 120m, although locally more widely distributed. Chalcocite is the dominant secondary copper mineral, with minor malachite at the top of the supergene profile. Subordinate chrysocolla and native copper was recorded. The top of the supergene blanket is typically located at the base of strong oxidation, with moderately oxidized rocks hosting the bulk of secondary copper mineralization.
The supergene zone extends approximately 1000m along the direction of the fold axis of Camp Dome and approximately 750m normal to the axial plane. Thickness ranges from a few metres up to 54m.

39 Newcrest Mining - Telfer Property Report - 31 December 2013
8 DEPOSIT TYPES
Mineral Resources reported for the Telfer mining centre consist of:
• Open pit stockwork and reef mineralization in Telfer Main Dome and West Dome;
• Stockwork and reef mineralization mined underground in the SLC operation and selective reef mining;
• Stockwork mineralization in the VSC below the SLC;
• Poly-metallic skarn mineralization at O'Callaghans;
• Lode, vein and stockwork mineralization at Camp Dome and Telfer Satellites (a group of deposits peripheral to the mine).
8.1 Telfer
Gold and copper mineralization at Telfer is hosted within stratiform reefs and stockwork domains in Proterozoic metasediments. Mineralization is controlled by structure and lithology with narrow high-grade stratiform reefs, pod-like mineralized bodies, sheeted vein-sets and large areas of low-grade stockwork mineralization. The primary mineralization was overprinted by surface weathering processes.
The sulphide mineralization is characterized by fresh sulphides, predominantly pyrite and chalcopyrite. Primary gold mineralization is typically associated with pyrite/chalcopyrite sulphides and quartz/dolomite gangue. There is a correlation between vein frequency and gold grade.
The highest concentration of gold and copper occurs within bedding sub-parallel reef systems. The primary characteristics of the reef systems are:
• Broadly concordant to lithological boundaries;
• Laterally extensive (greater than 1km) both along strike and dip;
• True thickness of 0.1m to 1.2m, averaging between 0.3m and 0.7m;
• High relative nugget effect;
• Variable dip varying from flat at the crest of Main Dome to about 40º on the eastern flank of Main Dome;
• Gold grade is typically high but variable: 5 g/t Au to 50 g/t Au;
• Copper grade ranges between 0.2% Cu and 1.5% Cu.
8.2 O'Callaghans
The O'Callaghans deposit is a polymetallic skarn deposit located at the contact between limestone of the Puntapunta Formation and an intrusive granite. The Main Skarn is identified as calc-silicate rock containing more than 10% sulphides generally surrounded by a halo of calc-silicates with less than 10% sulphides.
Tungsten, copper, zinc and lead are considered potentially economically extractable however elevated molybdenum and silver are also present. Tungsten-bearing minerals include both scheelite and wolframite. Gold is not present in economically significant amounts. Elevated levels of fluorine are also recorded. Metal zoning was identified within

40 Newcrest Mining - Telfer Property Report - 31 December 2013
the overall skarn with two areas of elevated zinc and lead broadly associated with a tungsten mineral species change from scheelite to wolframite.
8.3 Camp Dome
The Camp Dome mineralization is a copper-only deposit with quartz/sulphide veins hosted in folded sedimentary rocks. Weathering of primary mineralization resulted in a chalcocite-rich and associated secondary copper blanket at the oxidation boundary. No significant gold grades were intersected in drill holes.

41 Newcrest Mining - Telfer Property Report - 31 December 2013
9 EXPLORATION
9.1 Telfer
The Bureau of Mineral Resources (Australian Geological Survey organization) first geologically mapped the Telfer district in 1959. Gold and copper mineralization was not identified during this mapping. The Telfer district was targeted as a copper province in the late 1960s and early 1970s.
In 1971, Day Dawn Minerals NL undertook a regional sampling program in the district under the direction of R. Thompson. Anomalous copper and gold values were returned from gossanous outcrops that were sampled in Main Dome. An intensive exploration and resource drilling program was undertaken by Newmont Pty Ltd from 1972 to 1975. Mining of oxide MVR reef commenced during 1975 and reached full production in 1977.
Ongoing exploration identified the potential for a large, low grade oxide Mineral Resource in Main Dome and to the northwest in West Dome. This resulted in the introduction of a mill expansion in 1986 and establishment of a dump leach operation which commenced in 1988.
Further exploration of the supergene and sulphide part of the Main Dome MVR reef led to the development in 1989 of a sulphide flotation circuit initially to treat high grade open pit sulphides and subsequently sulphides mined from underground.
Exploration during the 1990s delineated additional reefs on the eastern flank of Main Dome. These reefs, which include the M10, M12 and M30, were mined using narrow vein underground mining methods.
Deep exploration drilling in 1991 lead to the discovery the I30 Quartz Reef and associated stockwork mineralization. Initial plans involved selective mining of the I30 reef but identification of subsidiary reefs and associated stockworks indicated that a large tonnage lower gold and copper grade scenario centred on the I30 Quartz Reef was possible.
Low grade open pit mining had been restricted to oxide material that could be treated on the dump leach. Drilling targeted at Main Dome reefs intersected low grade sulphide mineralization and exploration and resource definition drilling from 2000 to 2002 was targeted at identifying a large tonnage low grade copper gold Mineral Resource that could be treated in a large scale sulphide floatation plant.
9.2 O'Callaghans
Geophysical exploration between 1972 and 1983 identified the presence of a granitoid in the O'Callaghans area. A high resolution ground magnetics survey was carried out over several airborne magnetic anomalies during 1984. Seven diamond drill holes were completed in 1985 to test a discrete magnetic anomalies for possible skarn mineralization associated with the granitoid. The drilling, together with deflation lag sampling and mapping, confirmed the presence of a zoned system of poly-metallic skarn mineralization above the granitoid.
A grid of reverse circulation drill holes during the 1980s and 1990s failed to intersect the skarn mineralization, although one deep drill hole in 1987 to the northwest of the main skarn intersected the granitoid contact. One diamond drill hole was drilled during 1991 that intersected thin skarn mineralization.

42 Newcrest Mining - Telfer Property Report - 31 December 2013
Nineteen diamond drill holes were completed during 2008 to further test the extent of skarn mineralization and to infill the grid to 200 m in the main mineralized area. During 2009 and 2010, 157 diamond drill holes were completed to infill the grid to 100m centres over the main mineralization.
A Mineral Resource was first reported in 2009 and revised in 2010 and has not been updated since.
9.3 Camp Dome
The 17 Mile Hill Dome adjacent to Camp Dome, originally pegged by Carr Boyd Minerals in 1973, was explored under a number of joint ventures. Supergene copper mineralization was first intersected at Seventeen Mile Hill in the mid-1980s. Drilling through 1989 to 1992 indicated supergene copper mineralization however the absence of gold anomalism resulted in the prospect being downgraded and no further work being undertaken before the tenure was surrendered in 1998.
During April 2008, new high-resolution airborne magnetic data was collected over the project, which delineated a magnetic target. Reverse circulation drilling in 2009 confirmed the presence of a supergene copper blanket, returning anomalous copper grades associated with chalcocite, malachite ±chalcopyrite and diamond drilling has intersected sulphide lode mineralisation below weathering.

43 Newcrest Mining - Telfer Property Report - 31 December 2013
10 DRILLING
10.1 Drilling Programmes
Resource definition drilling at Telfer comprises a combination of reverse circulation and diamond drilling completed over years of mining operations. Pre-1998 drilling mainly affects areas that were mined prior to the restart of mining in 2003. Prefeasibility and Feasibility Study drilling was used for the 2002 Telfer Feasibility Study and part of the area covered by this drilling has been mined since 2003.
Drill hole data available for 2013 Mineral Resource estimates is largely based on Prefeasibility and Feasibility Study drilling but includes additional resource definition drilling, and reverse circulation grade control drilling conducted during the period January 2003 to December 2013 (refer Figure 10.1 and Figure 10.2 with drill traces overlain on the resource block model). Grade control drilling was used to create reference models to validate the resource estimates.
During the prefeasibility and feasibility study, Main Dome was drilled to a nominal 25m x 25m spacing in the area of most mineralization (10500mN to 11500mN) down to the M12 reef horizon. The drill hole spacing decreases beyond this depth. Table 10.1 lists the drilling completed in Main Dome (including both open pit and underground drilling).
Figure 10.1 Cross Section 11300N through Main Dome (Open pit & UG)

44 Newcrest Mining - Telfer Property Report - 31 December 2013
Table 10.1 Main Dome Drilling up to December 2013 Period Program Type Metres Number
Pre 1998 Grade Control RC 60,559 4,280
Resource Definition Surface RC 227,977 3,253
and Exploration Surface DDH 77,048 613
Underground DDH 52,851 241
Total
418,434 8,146
Prefeasibility Grade Control RC 23,230 1,779 January 1998 to September 1999 Resource Definition Surface RC 48,126 341
and Exploration Surface DDH 11,521 89
Underground DDH 7,394 46
Geotech Surface DDH 704 1
Total
90,975 2,209
Feasibility Study Stage 1 Grade Control RC 7,614 1,190 October 1999 to July 2000 Resource Definition Surface RC 110,199 862
and Exploration Underground RC 3,030 44
Underground DDH 8,403 36
Total
129,246 2,124
Feasibility Study Stage 2 Geotech Surface RC 980 7 August 2000 to December 2002
Surface DDH 3,748 8
Underground DDH 40 2
Total
4,768 17
January 2003 to December 2013
Grade Control Geotech Resource Definition and Exploration
RC Surface DDH Underground DDH Surface RC Underground DDH
957 3550 2437
757 3274
343 20 6 5
19 Total 10975 393
Figure 10.2 Cross Section 11300N through West Dome (Open pit)

45 Newcrest Mining - Telfer Property Report - 31 December 2013
West Dome is covered by drill hole spacing of nominally 25m x 25m down to the base of the Footwall Sandstone in the southern part of West Dome and to the base of the Outer Siltstone in the northern part of West Dome. Outside of these areas the resource development drilling spacing is highly variable but broadly spaced at 50m x 50m and 100m x 100m. Additional exploration, resource definition and reverse circulation grade control drilling from January 2003 to December 2013 are also included Table 10.2 which lists the drilling available for West Dome for the 2013 Mineral Resource estimates.
Table 10.2 West Dome Drilling up to December 2013 Period Program Type Metres Number
Pre 1998 Grade Control RC 36,683 1,349
Resource Definition Surface RC 228,200 2,678
and Exploration Surface DDH 32,191 245
Total
297,073 5,237
Prefeasibility Grade Control RC 30,521 1,821 January 1998 to September 1999 Resource Definition Surface RC 10,250 81
and Exploration Surface DDH 6,458 34
Total
47,229 1,930
Feasibility Study Stage 1 Resource Definition Surface RC 18,379 161 October 1999 to July 2000 and Exploration
Total
129,246 2,124 Feasibility Study Stage 2 Geotech Surface DDH 309 1 August 2000 to December 2002
January 2003 to December 2013
Resource Definition and Exploration
Surface RC Surface DDH
5083
49498
50
87 Total 54581 137
Drilling from surface identified mineralization in Telfer Deeps (now known as the Telfer Main Dome Underground). In addition, drilling from underground specifically targeted this mineralization for prefeasibility and feasibility studies. Table 10.3 lists the drilling available for Telfer Main Dome Underground for the 2013 Telfer mineral resource estimate and includes drilling conducted during the period January 2003 to December 2013 which was available for the Telfer Main Dome Underground Mineral Resource estimate.
Table 10.3 Telfer Main Dome Underground Drilling up to December 2013 Period Program Type Metres Number
Existing and Pre-Feasibility Resource Definition Underground DDH 24,135 119
and Exploration
Feasibility Study Stage 1 Deeps Infill Surface DDH 5,660 27
Bulk Sampling Drilling Surface DDH 2,184 26
Development Underground DDH 759 23
Feasibility Study Stage 2 Geotech Underground DDH 702 5 January 2003 to December 2013
Resource Definition and Exploration
Surface DDH Underground DDH
3353 73781
2 218

46 Newcrest Mining - Telfer Property Report - 31 December 2013
Figure 10.3 Telfer Drill Location Plan
Telfer drill location plan is shown in Figure 10.3

47 Newcrest Mining - Telfer Property Report - 31 December 2013
Drilling procedures changed over the history of the Telfer deposit. Drilling at any time in the past used protocols and certified reference materials (CRMs) in line with industry practice at the time. Early diamond drilling tended to be NQ diameter but more recent drilling was HQ diameter unless reduction was necessary to complete a drill hole. Early reverse circulation drilling used crossover subs with face sampling hammers used for more recent drilling.
All drilling completed as part of the 2002 Telfer Feasibility Study followed the drilling protocols outlined below. Unless stated otherwise, all subsequent drilling and sampling has followed the same or very similar protocols.
A local grid covers the whole of the Telfer mine area (Telfer Mine Grid 2002). It is oriented with grid north at 44º west of magnetic north.
The Telfer natural surface topography is based on surface surveys prior to the commencement of mining. Topographic surveys of the pits were completed on a monthly basis during mining, with an aerial survey carried out once a year to pick up the surrounding stockpiles, waste dumps, leach pads and tailings dams. The natural surface is used, together with the current pit topographic survey, to deplete the Mineral Resource estimate for surface mining, remove any surface dumps or tailings dams and deplete areas that are backfilled.
10.2 Survey Control
Surface drilling rigs were positioned using surveyed collar pegs and lined up using compass lines. The dip of each hole was established using an inclinometer. Drill hole collars were surveyed by mine surveyors on completion of the drill hole.
Several different down hole survey methods were utilized at Telfer at different times. These included:
• Down hole electronic multi-shot camera;
• Eastman single shot camera;
• Gyroscopic;
• Miniature Multi-shot Tool (MMT);
• Tropari.
For prefeasibility and feasibility study drilling, diamond and reverse circulation drill holes were surveyed using a down hole gyroscopic surveying tool during drilling. Where holes were shallower than 50º and the gyroscopic tool could not operate efficiently, an MMT was used. Diamond drill holes were also surveyed approximately every 30m during drilling using a single shot Eastman camera.
At drill hole completion, each hole was fully surveyed, with readings taken at 10m intervals using the gyroscopic tool, or if shallower than 50o, using the MMT.
Underground drill rigs were positioned using string lines between the fore and back sights with an inclinometer to align the rig mast at the correct dip angle. Collar locations were surveyed prior to and after drilling by underground mine surveyors.
All diamond drill holes were down hole surveyed every 25m during drilling using a single shot Eastman camera. On completion, holes were down hole surveyed using an MMT.

48 Newcrest Mining - Telfer Property Report - 31 December 2013
10.3 Geological Logging
Diamond and reverse circulation drill holes were geologically logged for lithology, alteration, mineralization, veining, vein percent and structure. Logging information was recorded and validated prior to merging into the database. All drill core was photographed, either using conventional slide film or a digital camera, prior to cutting the core for sampling.
10.4 Sampling Procedures
Reverse Circulation
For prefeasibility and feasibility study drilling, sampling used riffle splitters, field split duplicates, inclusion of certified reference materials and coarse blanks, as well as quality assurance testing of components of the process to provide confidence in the location and representivity of the sample.
Reverse circulation drilling samples were collected at 1 m spacing through a 1:8 riffle splitter attached to the drill rig cyclone. The splitter produced a bulk reject that was bagged (numbered) into plastic bags and stored temporarily for reference and logging. A primary split of 2kg to 5kg was achieved through the 1/8 chute. All of the primary assay sample was collected into a calico bag and placed inside the bulk reject plastic bag for identification.
Some early reverse circulation drilling was sampled at 0.5m intervals and grade control drilling associated with defining reefs reduced the sample interval to 0.5m through the reef zone. Areas within the Telfer pits that were generally being defined for dump leach feed were drilled and sampled at 2m down hole intervals.
Once fully sampled, the entire hole was collected and barcoded (numbered). Barcoding involves attaching plastic tags with a barcode and number to the calico bag. The process was established with a series of checks to ensure that all samples were collected and all appropriate barcodes attached to bags. The barcoded calico bags were collected and delivered to the analytical laboratory in Telfer.
Diamond Drilling
The sampling of diamond drill core follows a detailed protocol to maximize sampling precision. The geologist logging the core defines all sample intervals. Mineralized and important lithological contacts are not crossed by sample intervals. The geologist also allocates the assay type. All reef and suspected high grade samples are submitted for screen fire assay gold and an expanded multi-element suite. All other core is submitted for fire assay gold and selected multi-elements.
Most prefeasibility and feasibility diamond drilling was HQ3 but before 1998 NQ diameter was more common. Most diamond drill core is sampled as half-core, with the exception of geotechnical samples, which were sampled as whole core. Minimum and maximum sample sizes are 20cm and 1m respectively. The samples were collected into the specified intervals, barcoded and submitted to the Telfer laboratory for sample preparation.
All drilling, sampling and assaying protocols for the Telfer Main Dome Underground follow the same procedures as those used for the open pit. All data was subjected to systematic QAQC and validation processes prior to estimation. Typical sample length for diamond samples is 1m down hole.

49 Newcrest Mining - Telfer Property Report - 31 December 2013
11 SAMPLE PREPARATION, ANALYSES AND SECURITY
11.1 Historical Sample Preparation, Analysis and Security
Telfer has a long history of exploration, resource development and grade control drilling in a variety of deposits on the Telfer property.
Historical assay quality control protocols in place prior to 1998 reflect common industry practices at that time, but protocols were subsequently revised for prefeasibility and feasibility study drilling between 1998 and 2002, in line with changes in industry standard practices. Pre-1998 practices showed no evidence of significant quality control issues, based on repetition of the results of drilling post 1998.
The data from 1998 to 2002 (prefeasibility and feasibility study data) received on certified reference materials, blanks and field split duplicates occasionally show some issues on a batch basis. These issues are reported monthly. In general the data provides confidence in assay results. Rare examples of sample swapping, invalid grades or batch bias are recognized and corrections made.
Second laboratory check analysis was conducted. The copper data shows a much higher precision than gold for the same pulps. The gold precision is low due in part to the difficulty of producing an homogenous sample because of the grinding characteristics of gold in sample preparation. There was minimal bias between the two laboratories for gold (-0.8%) and copper (0.5%).
Three Mineral Resource estimates (VSC, O'Callaghans and Camp Dome) rely on drill hole data collected after the 2002 feasibility study and up to December 2011. Routine assay quality control protocols were in place for these drilling programmes.
For VSC, several commercial laboratories were used. For gold assays overall bias ranged from -5.3% to +1.1% for gold and -5.8% to +2.9% for copper depending on the laboratory used compared to the certified reference materials. All of the gold second laboratory checks show that there are no major differences between the pairs of laboratories used. There are minor differences and low bias but these are within the individual sample precision bounds.
For O’Callaghans polymetallic deposit overall biases compared to certified reference material was -1.5% for tungsten, +0.5% for copper, +0.2% for lead and +1.2% for zinc. The bias for tungsten against the Canadian wolframite primary CRM is -5.5% and the lead and zinc biases against the highest grade base metal CRM are -1.1% and +2.0% respectively. Generally there appears to be no significant QAQC issues at O’Callaghans other than a possible 5% low-bias in wolframite-bearing samples.
Camp Dome copper deposit analysis was performed at a both commercial and Newcrest laboratories. Pulp duplicate analysis indicated 68% better than 10% AMPRD and a one standard deviation precision of 3.6% for pairs averaging 200 ppm Cu or greater.
In the Qualified Person’s opinion the QAQC data indicates the historical (prior to 2011) sample preparation, security and analytical procedures have been adequate and results independently verified and as such the data is deemed acceptable input into the Mineral Resource estimate.

50 Newcrest Mining - Telfer Property Report - 31 December 2013
The sample preparation, analysis and security have essentially remained unchanged since December 2011. That is laboratories and analytical methods and QAQC protocols (insertion of certified reference materials (5%) and blanks (2.5%), and the collection of at least one form of coarse duplicate (5%) and one form of pulp duplicate (5%) and monthly QAQC reporting). Additional QAQC protocols since December 2011 include despatching a representative suite of samples every one to two months to Perth for independent analysis by a second laboratory. Security, data storage, verification and validation procedures remain unchanged.
A complete description of the historical sample preparation, analysis and security of Telfer (up to and including 2011) is contained in the “Technical Report on the Telfer Property in Western Australia, Australia” 31 December 2011 and available on the Newcrest website at www.newcrest.com.au and also available at www.sedar.com.
This section of the technical report summarizes sample preparation, analysis and security and QAQC for data acquired in period January 2011 to December 2013 from three main projects areas:
• Main Dome open pit and underground;
• West Dome open pit and deep exploration; and
• Telfer Satellites is a group of prospects peripheral to the mine (primarily Camp Dome). The bulk of the Telfer Satellites work in the past couple of years has been at Camp Dome.
There has been no new resource drilling on the O’Callaghans project.
11.2 Sample Preparation and Analyses
The Telfer laboratory processes the samples through a drying, crushing, and pulverizing process to produce a pulped product with the minimum standard of 90% passing 75μm. The pulverizers utilized are Labtechnics LM5. The pulp packet is dispatched via air freight to commercial laboratories for analysis.
Samples from reef and high grade stockwork mineralization are submitted for assay according to the BZ protocol (Figure 11.1). The BZ suite includes a screen fire assay for gold. The use of screen fire assays for all reef and high grade material is based on the view that the technique reduces the impact of coarse gold on the precision of the assay. Data produced during feasibility show that screen fire assays have better precision but have no bias relative to normal fire assay gold. All other samples are submitted for assay according to the AY protocol (Figure 11.2).

51 Newcrest Mining - Telfer Property Report - 31 December 2013
Figure 11.1 BZ Assay Protocol

52 Newcrest Mining - Telfer Property Report - 31 December 2013
Figure 11.2 AY Assay Protocol
A separate sample preparation and assay protocol was developed for the O'Callaghans skarn mineralization. Most drilling in mineralization is diamond drilling and half core samples are submitted to the laboratory and prepared using the protocol outlined in Figure 11.3. Analyses in mineralization are carried out using inductively coupled plasma mass spectrometry (ICP-MS).

53 Newcrest Mining - Telfer Property Report - 31 December 2013
Figure 11.3 O'Callaghans Assay Protocol
11.3 Sample Security
The security of samples is controlled by tracking samples from drill rig to database.
Reverse circulation and diamond core drill holes samples are collected and barcoded (numbered) by complete drill hole. Barcoding involves attaching plastic tags with a barcode and number to the calico bag. The process was established with a series of checks to ensure that all samples were collected and all appropriate barcodes attached to bags. The barcoded calico bags are collected and delivered to the analytical laboratory in Telfer.
The drill hole information is stored in a commercial SQL geological database. The collection of data from initial establishment of collar locations and drill hole naming through to logging and assaying are controlled to minimize the risk of importing incorrect or duplicated information. The systems have automatic validation checks, with all data validation overseen by senior geologist on site with independent verification undertaken by corporate

54 Newcrest Mining - Telfer Property Report - 31 December 2013
resource personnel prior to modelling. The database data import routines and validation is controlled by corporate database personnel. Assay results were merged electronically.
A detailed validation process is applied to all data entering the drill hole database. The validation process is multi-staged, requiring input from geologists, surveyors, assay laboratories and down hole surveyors if applicable. All variations from expected values are returned by the database administration for approval by supervising personnel.
All samples recorded as missing are coded and checks are carried out for overlaps or gaps in the samples. This procedure allows for sample tracking at all points of the handling and analytical process. Details of all sample movement are recorded in a database table. Dates, drill hole identification numbers, sample ranges, and the analytical suite requested are recorded with the dispatch of samples to analytical services. Any discrepancies logged on receipt of samples by the analytical services providers are validated.
11.4 Main Dome QAQC
11.4.1 Certified Reference Materials
A matrix-matched certified reference material (CRM) is inserted into a batch of samples with a frequency of about 5%. All of the CRMs in use here and elsewhere at Telfer were prepared by a commercial provider between 1999 and 2003. The CRMs cover a wide range of concentrations from background to extremely high grade. They have been certified for a variety of elements beyond the gold and copper discussed here. The CRMs are supplied in small envelopes holding 60g to 100g so are not blind to the laboratory, although the laboratory does not know the identity of the individual standard.
There have been 2039 gold CRMs inserted in Main Dome area in period from January 2011 to December 2013. These give a bias of 0% (figure 11-4) over the entirety of the 2011, 2012 and 2013 calendar years.
Figure 11.4 Gold Z-Scores from Main Dome January 2011 to December 2013

55 Newcrest Mining - Telfer Property Report - 31 December 2013
Outlying values, particularly negative values, were very common early in the period but have since become rare events. The red moving average has been near constant at 0 for most of the review period.
Copper CRMs (figure 11-5) shows a similar pattern to gold with many outliers and otherwise imprecise data at the start of the period followed by a period of high quality data, then a brief period of slightly more outliers and then precise and reasonably accurate data for the remainder of the period under review. The median bias for the entire period was +1.5%, a figure which had been maintained steadily for the last 1000 CRMs. Prior to that period bias peaked at about 3.5% and had a minimum of around -1.5%.
Figure 11.5 Copper Z-Scores from Main Dome January 2011 to December 2013
Coarse blanks are included in all jobs and go through the same sample preparation and analysis steps as the routine samples. The main purpose of a coarse blank is to reveal any evidence of contamination during sample preparation, should it be occurring. They also serve a worthwhile purpose in providing assurance that the order of samples has not been swapped. Only two of 1406 blanks reported gold above the error threshold of 0.3 ppm. Copper blanks were similarly consistent.
11.4.2 Coarse Duplicates and Pulp Replicates
Coarse duplicates are collected to assess how representative the sample taken for pulverising is of the material crushed. There were over 550 coarse duplicates collected and analysed for gold (figure 11-6). Coarse duplicates have not been analysed for any other elements. The calculated precision was 34.0%, somewhat higher than desirable. After removing the low grade samples (gold concentration less than 20 x detection limit) the precision was calculated to be 27.6%, slightly the upper target level of 25%.

56 Newcrest Mining - Telfer Property Report - 31 December 2013
Figure 11.6 Main Dome Gold in Coarse Duplicates
0.001
0.01
0.1
1
10
0.001 0.01 0.1 1 10
Dup
licat
e Re
sult
(g/t
Au)
Original Result (g/t Au)
Telfer Main Dome Gold in Coarse Duplicates
AuCD
X=Y
Pulp replicates are second samples taken from the same Kraft envelope as the primary sample. They are used to assess whether the sample taken from the envelope is representative of the envelope’s contents. The target level for gold in pulp replicates is 10% at more than 10 times the detection limit. For other elements it is generally 8%. There are almost 4500 pulp replicates (figure 11-7) in the dataset and they have been analysed only for gold.
Figure 11.7 Main Dome Gold in Pulp Replicates
0.001
0.01
0.1
1
10
100
0.001 0.01 0.1 1 10 100
Repl
icat
e Re
sult
(g/t
Au)
Original Result (g/t Au)
Telfer Main Dome Gold in Pulp Replicates
Au PR
X=Y

57 Newcrest Mining - Telfer Property Report - 31 December 2013
The precision for the set with a pair average of 0.2 g/t or better was 24%, which is outside the target level. Removing obvious outliers improved the precision to 16.1%, which is still outside the target level. The likely causes for this situation is coarse gold present that is not being comminuted during pulverising, leaving the kraft envelope inhomogeneous.
11.4.3 Second Laboratory Checks
Second laboratory checks are also undertaken for both gold and copper.
For gold there were 1642 pairs of assays from Main Dome that were analysed initially by Newcrest Laboratory Services Orange (NLSO) and subsequently by the commercial laboratory Genalysis using method FA50AAS or FA25AAS.
Figure 11.8 Main Dome Gold in Second Laboratory Checks
0.001
0.01
0.1
1
10
100
0.001 0.01 0.1 1 10 100
Gen
alys
is R
esul
t (g/
t Au)
NLSO Result (g/t Au)
Telfer Main Dome Gold in Second Lab Checks
Au
X=Y
Examination of figure 11-8 shows that the two laboratories have similar average results but the spread of results either side of X=Y is greater than expected. There is little doubt that some of the outliers are due to human error, such as mislabelling a sample or pairing the wrong samples, rather than to slight analytical errors. The precision was calculated to be 38% when the samples with gold results less than 20 x detection limit were removed.
There is no systematic disagreement between the laboratories on gold concentration and thus no reason to question the gold results as a whole.
For copper there were 1660 usable copper check analyses carried out by Genalysis following original analysis by NLSO gave a precision figure of 20.7% (figure 11-9) for data pairs with average copper below 50 ppm removed.

58 Newcrest Mining - Telfer Property Report - 31 December 2013
Figure 11.9 Main Dome Copper in Second Laboratory Checks
1
10
100
1000
10000
100000
1000000
1 10 100 1000 10000 100000 1000000
Gen
alys
is R
esul
t (pp
m C
u)
NLSO Result (ppm Cu)
Telfer Main Dome Copper in Second Lab Checks
Cu
X=Y
The comparison between original laboratory and secondary laboratory was good but the spread of outliers was larger than expected. There is no systematic disagreement between the laboratories over copper concentrations and no material flaw in the copper analyses globally.
11.5 West Dome QAQC
11.5.1 Certified Reference Materials (CRMs)
There were 2031 West Dome CRMs analysed for gold between the beginning of 2011 and the end of 2013. Median bias over that period was 0.0%. Examination of figure 11-10 shows that the bias has been relatively steady since late in 2011. Before that the bias was on average lower and cyclic. There are more outliers and 3sd errors than expected.
Early copper analyses used an aqua regia digest whereas more recent analyses have followed a 4-acid attack. The two forms of digest are indicated on figure 11-10 where the aqua regia digest is shown in orange and the 4-acid attack in blue. Bias for the two methods was +0.4% (aqua regia) and -0.3%. The 4 acid digest results have fewer outliers but this could be related more to experience at the laboratory than to any fundamental difference in the methods. Both methods have slightly worse precision than they should have

59 Newcrest Mining - Telfer Property Report - 31 December 2013
Figure 11.10 Gold Z-Scores from West Dome January 2011 to December 2013
-6
-4
-2
0
2
4
6
0 300 600 900 1200 1500 1800 2100
z-sc
ore
instance
Telfer West Dome Gold z-scores 2011-2013 incl
Au
MA51
Figure 11.11 Copper Z-Scores from West Dome January 2011 to December 2013
-10.00
-8.00
-6.00
-4.00
-2.00
0.00
2.00
4.00
6.00
8.00
10.00
0 200 400 600 800 1000 1200 1400 1600
z-sc
ore
instance
Telfer West Dome Copper z-scores 2011-13 incl
Cu (aqua regia)
Cu (four acid)
CuMA101-2a
CuMA101-4a
Coarse blanks are included in all jobs and go through the same sample preparation and analysis steps as the routine samples.
Only one of 1453 blanks analysed for gold failed but the concentration was so high (1.5g/t) that contamination is very unlikely and a swap with another sample or standard seems more likely. Eight aqua regia copper blanks failed with most of the failures were just above the acceptance limit and are not statistically significant.

60 Newcrest Mining - Telfer Property Report - 31 December 2013
11.5.2 Coarse Duplicates and Pulp Replicates
Almost 1200 coarse duplicates, collected from the crusher product, gave 19.9% precision (figure 11.12), below the target maximum of 25% when samples with grades lower than 20 x detection limit were removed (note only 93 samples had grades above 0.2 g/t Au). Coarse duplicates have been analysed for gold only.
Figure 11.12 West Dome Gold in Coarse Duplicates
0.001
0.01
0.1
1
10
0.001 0.01 0.1 1 10
Dup
licat
e Re
sult
(g/t
Au)
Original Result (g/t Au)
Telfer West Dome Gold in Coarse Duplicates
Au
X=Y
Figure 11.13 West Dome Gold in Pulp Replicates
0.001
0.01
0.1
1
10
100
0.001 0.01 0.1 1 10 100
Pulp
Rep
licat
e Re
sult
(g/t
Au)
Original Result (g/t Au)
Telfer West Dome Gold in Pulp Replicates
Au
X=Y

61 Newcrest Mining - Telfer Property Report - 31 December 2013
Of the 4100 pulp replicate analyses for gold (figure 11-13) available, only 455 have a pair average greater than or equal to 20 x detection limit. The precision calculated from this data is 20.1% and approximately 1 in 4 has a relative difference worse than 20%. With low grade samples removed the precision is 20.1%, similar to the coarse duplicates. The duplicate data suggest there is no material issue with the original assays.
11.5.3 Second Laboratory Checks
Approximately 1530 West Dome samples have been sent to commercial laboratory Genalysis in Perth for check assaying for gold and copper. Precision of the gold data set of 150 gold pairs with pair average above 0.2 g/t was acceptable at 22.4%.
Figure 11.14 West Dome Gold in Second Laboratory Checks
0.001
0.01
0.1
1
10
100
0.001 0.01 0.1 1 10 100
Gen
alys
is C
heck
Res
ult (
g/t A
u)
Original Result (g/t Au)
Telfer West Dome Gold in Second Lab Checks
Au
X=Y
Apart from a few outliers as shown in figure 11-14, overall the check grades confirm the original gold grades.
There were two different methods used for copper analysis at NLSO and three different check methods. The three combinations that occurred most often (each more than 400 times) had precision of 13.9%, 13.7% and 10.4% for pair averages greater than 20 x detection limit. This is consistent with the level of precision expected for samples analysed at two different laboratories. Overall the check grades confirm the original copper grades.
Apart from a few outliers as shown in figure 11-15, overall the check grades confirm the original copper grades.

62 Newcrest Mining - Telfer Property Report - 31 December 2013
Figure 11.15 West Dome Copper in Second Laboratory Checks
1
10
100
1000
10000
100000
1 10 100 1000 10000 100000
Gen
alys
is C
heck
Res
ult (
ppm
Cu)
Original Result (ppm Cu)
Telfer West Dome Copper in Second Lab Checks
Series1
X=Y
11.6 Satellite Projects
11.6.1 Certified Reference Materials (CRMs)
There have been over 700 Telfer satellite deposit CRMs analysed for gold in the period January 2011 to December 2013. The gold median bias for the Satellites CRMs is -0.25%. Figure 11-16 shows that the dataset is particularly noisy (especially in the first half of the data). Much of the noise appears to come from mislabelled CRMs, particularly the noise that extends beyond -6 z-score.
Figure 11.16 Gold Z-Scores from Satellites from January 2011 to December 2013

63 Newcrest Mining - Telfer Property Report - 31 December 2013
The 400 copper CRMs show a relatively variable z-score chart and shows evidence of between-batch bias. Median bias is 1% but bias starts the period at close to +4% and drops gradually to about -2% and then climbs again to +2%.
Figure 11.17 Copper Z-Scores from Satellites from January 2011 to December 2013
Of the 600 blanks only one exceeds the upper limit for gold and that by only a small amount. Seven 2-acid digest copper values are above the upper limit, including one that reports over 1.2% instead of less than 50 ppm. All four-acid digest copper results were inside the acceptable limits.
11.6.2 Coarse Duplicates and Pulp Replicates
Duplicate samples or field splits are pairs of samples taken from a structure (e.g. sample mound.) Duplicate samples can be taken from residue cones, sampling cones, stockpiles, outcrop etc. excluding diamond core. For the most part the duplicate samples from this project were collected from reverse circulation percussion drill rigs. None of the 282 duplicate samples returned a result better than 0.2 g/t gold.
Copper precision was 14.1% with grades up to about 480 ppm. The gold pulp replicate precision of 25.1% is acceptable.
11.6.3 Second Laboratory Checks
Approximately 320 samples from the satellite projects were reanalysed at Genalysis in Perth. Gold precision at 20 x detection limit was calculated to be 41.8% but only 16 samples had a pair average better than 0.2 g/t gold however this is not statistically significant.
11.7 Summary of QAQC January 2011 to December 2013
While minor QAQC issues have been identified in all three projects analysed, the QAQC protocols suggest that the original assay data is robust with no evidence of a material issue.
In the Qualified Person’s opinion the data is adequate for the purpose intended. The sample preparation, security, and analytical procedures are of industry standard. As such the data is deemed acceptable input into the Mineral Resource estimate.

64 Newcrest Mining - Telfer Property Report - 31 December 2013
12 DATA VERIFICATION
The Qualified Person has, through examination of internal and public Newcrest documents, personal inspections on site and discussions with other Newcrest personnel, verified the data in this Report and satisfied himself that the data is adequate for the purpose of this Report.

65 Newcrest Mining - Telfer Property Report - 31 December 2013
13 MINERAL PROCESSING AND METALLURGICAL TESTING
Telfer ore is mined from both open pit and underground sources. The gold and copper mineralization, which is hosted within reef and stockwork domains, is defined in three principal sites described as Main Dome, Telfer Underground (SLC) and West Dome. The Telfer sequence is generally oxidized to a depth of up to 200m below surface with sulphide ore beneath, albeit with localized weathering along permeable structures to approximately 500m below surface.
The Main Dome open pit ore comprises dominant chalcocite and lesser chalcopyrite (at the approximate ratio of 80% to 20%) while underground ore is dominant chalcopyrite and lesser chalcocite (again in the approximate ratio of 80% to 20%). Plant feed is made up of approximately 75% open pit and 25% underground ore which translates to an overall feed ratio of approximately 65% chalcocite and 35% chalcopyrite. West Dome ore is of a more variable copper mineralogy, dependent on positioning in the ore body.
Pyrite represents the major sulphide gangue mineral. Sulphide flotation is the principal mechanism utilized for the recovery of gold and copper minerals, although gravity processing is also applied to recover coarse free gold liberated by grinding.
Gold is present as free gold with particle sizes varying from coarse to fine. The finer gold fraction is locked in both the copper and pyrite minerals. Approximately one quarter of gold produced is recovered as coarse free gold from gravity processing. However the majority of the gold is associated with the copper mineralization and is recovered as part of the copper flotation concentrate. Together these products account for approximately 94% of gold production with a further small contribution being extracted from the pyrite mineralization via a cyanide leach process.
The current processing plant at Telfer has been producing since November 2004, such that the metallurgical aspects of the treatment process have largely been defined within the normal vagaries of an operating plant. The copper concentrate typically assays 13% Cu to 19% Cu, although it also contains between 50 g/t Au and 90 g/t Au. Although the copper grade of the concentrate may be low given the primary chalcocite and chalcopyrite mineralization, the gold content provides significant value and represents a major component of the concentrate. The principal diluent in the copper concentrate comprises non-sulphide gangue that is present primarily as a result of entrainment in the froth during flotation.
The sulphide minerals generally respond well to the standard sulphide flotation regime. However because localized weathering can occur at depth along permeable structures, a reduced flotation response can occur on occasions due to ore oxidization.
The copper concentrate is otherwise quite clean by contemporary standards. The ore does contain some cobaltite, an arsenic sulfosalt which is recovered to the copper concentrate within the sulphide flotation regime. Its occurrence in the deposit is monitored and the arsenic level in the ore is controlled by blending to ensure that the arsenic assay in the copper concentrate does exceed contractual limits.

66 Newcrest Mining - Telfer Property Report - 31 December 2013
Historically the majority of the plant production was sourced from the Main Dome and Telfer Underground ores. During 2012 West Dome transitional ore was introduced to the current processing plant on a continuous basis for the first time. West Dome ore is characterised by higher pyrite levels and fine locking of the copper minerals and gold in the pyrite. The flotation response of the West Dome ore is generally similar to that for the Main Dome open pit ore for the principal sulphide mineralization provided that a suitably fine final grind size is applied to liberate the copper minerals, albeit in conjunction also with a more aggressive pyrite depression regime.
The installation of regrind mills (ISAMills) to enhance liberation of the copper sulphide minerals in the West Dome ore as well as additional cleaner flotation capacity (Jameson Cells) has provided a means of maintaining the quality of the copper concentrate.

67 Newcrest Mining - Telfer Property Report - 31 December 2013
14 MINERAL RESOURCE ESTIMATES
Newcrest has reported a Mineral Resource estimate for Telfer as at 31 December 2013. The Mineral Resources have been prepared under the direction of Competent Persons under the JORC Code using accepted industry practice and have been classified and reported in accordance with the JORC Code.
There are no material differences between the definitions of Measured, Indicated and Inferred Mineral Resources under the CIM2 Definition Standards and the equivalent definitions in the JORC Code3.
Mineral Resources reported for the Telfer mining centre consist of:
• open pit stockwork and reef mineralization in Telfer Main Dome and West Dome;
• stockwork and reef mineralization mined underground in the Telfer Main Dome;
• lode, vein and stockwork copper mineralization at Camp Dome;
• poly-metallic skarn mineralization at O'Callaghans; and
• Telfer Satellite deposits.
Table 14.1 lists Telfer gold and copper Mineral Resources at 31 December 2013. Mineral Resources are reported inclusive of Mineral Reserves.
Table 14.1 Telfer Copper and Gold Mineral Resources at 31 December 2013 Tonnes
(Mt) Au
(g/t) Cu (%)
Au (Moz)
Cu (Mt)
Measured Resource Main Dome Stockpiles 24 0.40 0.09 0.3 0.02
Total Measured Resource 24 0.40 0.09 0.3 0.02 Indicated Resources
Main Dome Open Pit 210 0.67 0.09 4.5 0.18 West Dome Open Pit 170 0.66 0.06 3.6 0.10 Telfer Underground 96 1.5 0.33 4.7 0.31 Other Satellite Deposits 0.57 4.2 0.03 0.1 <0.01
Total Indicated Resource 480 0.84 0.12 13 0.59 Inferred Resources
Main Dome Open Pit 2.6 0.56 0.09 0.05 <0.01 West Dome Open Pit 1.1 0.46 0.06 0.02 <0.01 Telfer Underground 53 0.95 0.21 1.6 0.11 Camp Dome 14 - 0.37 - 0.05 Other Satellite Deposits 1.7 2.58 0.08 0.14 <0.01
Total Inferred Resource 73 0.79 0.23 1.8 0.17 Notes: 1. The figures above include those resources converted to reserves
2. Rounding may cause some computational discrepancies 3. Telfer Underground includes SLC, VSC, Western Flanks and M Reef Mineral Resources
Table 14.2 lists the Mineral Resource for the O'Callaghans polymetallic deposit.
2 Canadian National Instrument 43-101. 3 Australasian Code for Reporting of Exploration Results, Mineral Resources and Ore Reserves, The JORC Code 2012,
effective 1 December 2013, Prepared by the Joint Ore Reserves Committee of the Australasian Institute of Mining and Metallurgy, Australian Institute of Geoscientists and Minerals Council of Australia (JORC).

68 Newcrest Mining - Telfer Property Report - 31 December 2013
Table 14.2 O'Callaghans Polymetallic Mineral Resource at 31 December 2013 Tonnes
(Mt) WO3 (%)
Zn (%)
Pb (%)
Cu (%)
Indicated Resource 69 0.34 0.55 0.27 0.29 Inferred Resource 9 0.25 0.15 0.07 0.24
The 31 December 2013 Mineral Resource update has been based on a detailed review completed by Newcrest of all Telfer production sources to take into account Newcrest’s current view of long term metal prices, foreign exchange and cost assumptions, and mining and metallurgy performance to inform cut-off grades and physical mining parameters. This has resulted in the most marginal ounces being removed and this has been reflected in changes to Mineral Resource estimates. The Measured and Indicated Mineral Resources for Telfer as at 31 December 2013 includes a material reduction of approximately 5.2Moz of gold to 13Moz of gold, compared with the 31 December 2012 estimate of 18.2Moz of gold. This reduction has primarily come from West Dome and Main Dome open pit Mineral Resources as a direct result of the review of long term economic assumptions.
The Main Dome and West Dome open pit Mineral Resources are reported inside optimization shells to reflect that part of the resource model for which there are reasonable prospects for eventual economic extraction. A notional spatial constraint using metal prices of US$1,400/oz for gold and US$4.00/lb for copper and an exchange rate of US$0.80:A$1.00 is applied for the purpose of excluding from the Mineral Resource material that does not have a reasonable prospect of eventual economic extraction. The Mineral Resource estimates are reported at a value cut-off based on expected metallurgical treatment options and calculated using US$1,350/oz for gold and US$3.10/lb for copper and an exchange rate US$0.80:A$1.00.
The Camp Dome Mineral Resource is reported within a similar optimization shell with a copper grade cut-off of 0.13% Cu.
Telfer Main Dome Underground (formerly known as Telfer Deeps) is being mined using a non-selective SLC mining method and selective mining on M Reef areas as appropriate. The total volume of the estimate classified as Indicated or Inferred Mineral Resource that is expected to be recovered in an SLC mining operation, including internal dilution, is reported as the Mineral Resource estimate. The expected SLC mined volume is based on a cut-off incorporating SLC mining costs and metallurgical recoveries based on testwork. The selective M Reef Mineral Resources do not include mining dilution.
The O'Callaghans polymetallic Mineral Resource estimate comprises the in situ estimate of the main mineralized horizon where drill hole spacing is sufficient to permit Indicated or Inferred Mineral Resource classification. No grade or economic value cut-off was applied to this volume for reporting, with the exception of a minimum mining height of 5m as there is a reasonable expectation that the main mineralized horizon is available for eventual economic extraction.
14.1 Telfer Main and West Dome Mineral Open Pit Resource Estimate Summary
The Telfer Main Dome Mineral Resource estimate was re-evaluated in 2011. The restart of mining operations at Telfer in 2003 was based on Mineral Resource estimates developed during the Telfer Feasibility Study in 2002. The 2011 estimate followed re-examination of geological controls on grade distribution, evaluation of different estimation methods and

69 Newcrest Mining - Telfer Property Report - 31 December 2013
assessment of recent mining reconciliation up to 2010. For the December 2013 Mineral Resource estimate the same methodology was applied with additional drill holes added into the West Dome area only (approximately ~46 additional reverse circulation drill holes). The purpose of these holes was to provide data to support an improved sulphur estimation to assist with recovery modelling. Main Dome resource estimate remained unchanged from 2011.
The Mineral Resource model for the Telfer open pits is composed of estimates for gold, copper and density. Attributes required for modelling metallurgical recovery and value estimation including cyanide soluble copper, sulphur and rock type. Weathering attributes also included in the model.
The Telfer Reefs (M-Reefs) are geologically relatively uniform in nature in terms of thickness being stratabound. Grade distribution within the reefs is relatively consistent in that the high-grade areas are relatively uniform in the average (high) grades while low grade areas are consistently lower average grades. Grade partitions are used to domain the reefs into high-grade, medium-grade and low-grade domains using an indicator estimation methodology.
The M-Reefs are sampled by diamond core, RC drilling and face samples (where underground development and mining are present). Since sample support is not consistent (core and face samples are based on geological intervals while RC samples are constant 1m lengths), accumulations are used to estimate the metal (grade x vertical height) in a 2D grid, and grades are back calculated by dividing the estimated accumulation by the estimated vertical height. The same accumulation variogram and search neighbourhood are used to estimate both accumulations and vertical heights to ensure consistency problems do not arise.
Underground mining of some of the reefs revealed that in the high-grade domains the diamond and RC samples were negatively biased in relation to the face samples for gold (the diamond and RC samples were under calling gold grades, which was also verified when processing this material though the Telfer process plant). The face samples in the high-grade domains were a closer representation of the reconciled grade. To correct for this bias in the diamond core and RC samples a high-grade (HG) mapping process was developed; (1) face samples were transformed to a Normal Distribution and hermite polynomials were used to construct a continuous Gaussian Distribution; the two products of this process are “Transformation” and “Back-Transformation” functions which can be used to freely move any sample from real space to Gaussian space; (2) diamond and RC samples are also transformed to a Normal Distribution; (3) the face sample Back-Transformation function is then used to back transform the diamond and RC samples to real space with bias adjusted grades. The adjusted gold grades are then used to estimate accumulations and back calculated grades. Areas with no underground sampling but suggesting a possible data bias are designated medium-grade (MG), and approximately 50% of the HG bias adjustments is applied. Whilst it is acknowledged that the MG transformation values are somewhat arbitrary, it is also considered that there is a strong possibility that mineralised material adjacent to the high-grade domains will exhibit some component of positive bias. It is estimated that the MG transformation contributes approximately 2-3% of the total M-Reef metal content. No transform was applied to the low-grade (LG) areas. Modest top-cuts were applied to gold and copper grades to remove obvious outliers before transformation.
All M-Reef estimates are on parent blocks of 12.5m x 12.5m projected onto a horizontal plane using 2D accumulations. The metal for each of the blocks is mapped to its corresponding centroid in 3D space, and then divided by the height of the 3D blocks to back calculate a 3D grade; this process is to ensure that volumetric differences between 3D

70 Newcrest Mining - Telfer Property Report - 31 December 2013
modelled wireframe volumes (on a block by block basis) and estimated vertical widths from accumulation do not contribute to any metal biases.
The stockwork gold mineralisation is highly positively skewed with Coefficient of Variation of between 1.9 and 3.8. Additionally, a significant proportion of the metal is contained in a disproportionate number of high-grade samples. Ordinary Kriging (OK) has been demonstrated to be sub-optimal for estimating such highly variable material. Multiple Indicator Kriging (MIK) is considered best suited for this type of mineralisation. Gold and copper were estimated using MIK. The type of MIK is the e-type estimate; that is directly estimating the model blocks with the average grade of the cumulative indicator distribution.
The indicator thresholds were selected such that each bin has a consistent balance of number of samples and the quantity of metal. The first 5 grade cut-offs are selected to correspond as practically as possible with the 15th, 30th, 45th, 60th and 75th percentile of the composite distribution. Higher grade bins are added in approximate steps of 15% of the de-clustered metal contribution. Indicator variography was then undertaken on gold and copper ensuring that nuggets increased and ranges decreased consistently in modelling progressively higher cut-offs; this minimizes order relational problems in the MIK estimates. MIK bin grades were assigned de-clustered average grade of the samples in each bin, except for the top bin which was assigned the de-clustered median grade.
Sulphur, arsenic and cobalt estimates were also undertaken due to their importance when managing concentrate quality. In the past, assays for sulphur, arsenic and cobalt have been conducted on a selective basis. Workable correlations exist between gold, copper, sulphur, arsenic and cobalt. Regressions are used to “estimate” sulphur, arsenic and cobalt values in the composite database, allowing ordinary kriging to be used to estimate the values into the block model.
The block sizes in the resource model are 6.25m x 6.25m x 4m for the selective reef areas and 12.5m x 12.5m x 12m for the bulk stockwork. The individual reef seam models are re-blocked to 6.25m x 6.25m x 4m and combined with the stockwork model to create the final resource model. All modelling and estimations are done in commercially available software supplemented with specialised algorithms coded within the package as required.
A volume of approximately 200 million tonnes was selected for the ground truth model (GTM) in Main Dome. This volume has been extensively sampled using closed spaced RC grade control and production blast holes. The GTM is considered to be an accurate estimate (it is insensitive to estimation technique due to being totally data driven) for benchmarking the resource model with wide spaced drilling within a common volume. The estimation parameters for the Main Dome resource model were refined such that the grade-tonnage curves for the models matched closely. These learnings from the refinements were applied to West Dome resource estimates.
The Main Dome Mineral Resource model is composed of estimates for gold, copper and density. Attributes required for metallurgical recovery and value estimation including cyanide soluble copper, sulphur, rock type and weathering are also included in the model.
The data used for the 2011 Mineral Resource estimate is largely the same as that used in the 2002 Telfer Feasibility Study. Drilling between 2002 and 2010 largely consisted of grade control reverse circulation (RC) drilling and grade control sampling of blast holes in areas already mined that provide little additional data for the Mineral Resource estimate. These data were used to develop a GTM for areas mined between 2003 and 2010 as a means of assessing geological control on grade estimation and evaluation of estimation methods and to test the veracity of the modelling used to develop the 2011 resource estimate. As a result of the evaluation of boundary analysis, diffusion testing and visual analysis, gold and

71 Newcrest Mining - Telfer Property Report - 31 December 2013
copper grade domains that were used in the 2002 Mineral Resource estimate were discarded, as were a number of data calibrations that had been applied to adjust for drill hole type and data spacing. Refer to Figures 14.1 and 14.2 for examples cross sections.
A complete technical description of the Mineral Resource estimation of Telfer for Main Dome and West Dome open pits is contained in the “Technical Report on the Telfer Property in Western Australia, Australia” 31 December 2011 available on the Newcrest website at www.newcrest.com.au and also at www.sedar.com.
Figure 14.1 Cross Section 13000N through West Dome Open Pit
Figure 14.2 Cross Section 11300N through West Dome Open Pit

72 Newcrest Mining - Telfer Property Report - 31 December 2013
14.2 Telfer Underground Mineral Resource Estimate
The gold and copper mineralization in Telfer Main Dome Underground occurs as narrow vein reefs which are sub-parallel to stratigraphy, stockworks which are largely discordant to stratigraphy and as mineralization associated with crosscutting structures. All mineralization styles have similar mineralogy comprising a quartz-dolomite-sulphide assemblage. Higher gold and copper grades are associated with reefs, crosscutting structures and areas of intense pyrite and chalcopyrite vein and replacement style mineralization.
The Main Dome Mineral Resource is centred on mineralisation currently being mined in the Main Dome Pit and Underground Areas. The primary underground mining method is sub level caving (SLC) with a subordinate component of more selective stoping of high grade M Reefs.
The 2013 Telfer Main Dome Underground Model Re-estimation described in this report is based on the information from approximately 10,500 resource definition drill holes, variously collared at both surface and underground, which have produced approximately 44,400 down hole composites. These holes are from all periods of operations up to mid-2013 and comprise Sub-level Cave (SLC), Vertical Stockwork Corridor, Western Flanks and selective M Reefs. Previously these resources were modelled and estimated separately but the 2013 underground mineral resource estimate is based on an integrated geological interpretation.
Final Mineral Resource estimation parameters were selected based on knowledge gained from the re-estimation of the Main Dome Open Pit Resource Area in 2011 and subsequent reconciliation performance.
The Telfer Main Dome Underground Mineral Resource model comprises estimates for gold, copper, sulphur, arsenic, cobalt and in-situ density. Six “bulk” domains and five reefs were estimated within the Main Dome Underground model. Multiple Indicator Kriging (MIK) was used to estimate stockwork-type gold and copper mineralisation, in four of the bulk domains. Ordinary Kriging (OK) was used for gold and copper estimation in all five reef domains, and in two of the bulk domains that are reef-like in character. OK, in conjunction with linear regression, was used to estimate sulphur, arsenic and cobalt in all of the domains.
The resource was classified on the basis of estimation confidence and economic potential.
14.2.1 Geology Model
In August 2013, Newcrest undertook a full re-estimation of the resource model underpinning the Telfer Underground Mineral Resource and Mineral Reserve. The re-estimation extends from the base of the open pit portion of the Telfer Main Dome project (at 12m below the M50 Reef) down to 3700mRL.
The re-estimation includes the M-Reef horizons (from M60 downward), the A Reefs, B30 Reef, LLU (including the I30 Reef), Oakover Vein, Vertical Stockwork Corridor (VSC) and intervening Stockwork mineralisation (see Figure 14.3). The A Reefs were bundled into an “A Reef Block”, inclusive of inter-reef stockwork-type mineralisation, in order to simplify the estimation of this portion of the deposit. Given that the method of mining is SLC, with very limited scope for selectivity, this was considered to be a reasonable compromise. The B30 and M-Reefs were estimated using single intercept composites whilst the remaining “bulk” domains were estimated using 4m down hole composites. Grades were estimated for gold, copper, sulphur, arsenic and cobalt.

73 Newcrest Mining - Telfer Property Report - 31 December 2013
Figure 14.3 The reef domains (red) and bulk domains estimated (E-W section looking north at 11300mN).
The geological model was revised by Newcrest geologists in preparation for the re-estimation work and was used to define the estimation domains. In addition to the constraining geological units described above, boundary testing resulted in the separation of the Stockwork domain into Upper and Lower portions for estimation, with the Middle Malu-Lower Limey Unit boundary being the divide. The gold and copper grade transition across this boundary was considered to be a hard boundary for estimation.
To mitigate the problems associated with the high nugget nature of some of the bulk domains (Stockwork Upper, Stockwork Lower, VSC and A-Reef Block), a non-linear estimation technique, Multiple Indicator Kriging (MIK), was used. This method had previously been implemented in the Telfer Main Dome Open Pit model (Cube, 2011) and was found to reconcile well when compared to the close-spaced grade control production data.
The more tabular estimation domains (LLU, Oakover, M-Reefs and B30) were estimated using Ordinary Kriging (OK).

74 Newcrest Mining - Telfer Property Report - 31 December 2013
14.2.2 Drill Data and Compositing
Drill data used for the 2013 resource estimate included resource definition diamond drilling, underground diamond drilling and resource definition reverse circulation drilling.
Grade composites were generated using the available resource definition drill data and the 3-D wireframes from the geological model. Many of the wireframe volumes overlap, reflecting the overprinting nature of various mineralising events at Telfer. The following priority sequence for mineralisation was implemented, with domains higher on the list being deemed to be dominant over those lower down the list:
1. B30 and M-Reefs – single intercepts conforming to distance between hangingwall and footwall surfaces. Wireframe models are not always snapped to intercepts – wireframe boundaries are smoothed.
2. LLU – 4m downhole composites;
3. VSC– 4m downhole composites;
4. Oakover– 4m downhole composites;
5. A-Reef Block– 4m downhole composites;
6. General Stockwork–4m downhole composites.
Table 14.3 Wireframes for Geological Model Vulcan Wireframe File Name Description
TEU_cube_12m_below_m50_strat.00t Top of model surface situated 12m below the M50 reef; separates the Telfer Main Dome UG model (this study) from the Telfer Main
Dome Open Pit Model
TEU_UMM-MMM_201309.00t DTM stratigraphic surface separating the Upper Malu from the Middle Malu
TEU_MMM-LLU_201309.00t DTM stratigraphic surface separating the Middle Malu from the Lower Limey Unit
teu_rf_m60_hw_fw_201308.00t M60 reef hangingwall and footwall DTM surfaces
teu_rf_m65_hw_fw_201308.00t M65 reef hangingwall and footwall DTM surfaces
teu_rf_m68_hw_fw_201308.00t M68 reef hangingwall and footwall DTM surfaces
teu_rf_m70_hw_fw_201308.00t M70 reef hangingwall and footwall DTM surfaces
TEU_Rf_B30_HWFW_201308.00t B30 reef hangingwall and footwall DTM surfaces
TEU_LLU_FWHW_201308.00t Closed solid wireframe representing the LLU estimation domain
TEU_VSC_STK_201309.00t Closed solid wireframe representing the VSC estimation domain
TEU_NDV-Oakover_201307.00t Closed solid wireframe representing the Oakover estimation domain
TEU_A-Reef_Block_201308.00t Closed solid wireframe representing the A Reef Block estimation domain
14.2.3 Bulk Domain Grade Modelling
The bulk domains in this study were defined as the VSC, A Reef Block, Stockwork, Oakover, and LLU. The latter two estimation domains, although possessing a reef-like morphology, were considered to be thick enough to estimate using a 3-D approach and 4m down hole composites (as opposed to using single intercepts). The vast majority of grade

75 Newcrest Mining - Telfer Property Report - 31 December 2013
estimation work for the bulk domains was undertaken using commercially available software.
Boundary contact analysis for gold and copper grade was performed on the following domains:
1. A Reef Block versus LLU;
2. A Reef Block versus Stockwork;
3. A Reef Block versus VSC;
4. VSC versus Stockwork;
5. VSC versus Oakover;
6. VSC versus LLU;
7. LLU versus Stockwork;
8. Upper Malu versus Middle Malu (test within the Stockwork);
9. Middle Malu versus Volume below Middle Malu/Lower Limey Unit (test within the Stockwork).
The boundary analyses for both elements reveal that the majority of the domain boundaries resulting from the geological review are hard. The only notable exception to this was the A Reef versus VSC boundary and the Upper Malu versus Middle Malu boundary within the Stockwork. Since the A Reef Block includes a large volume of stockwork-type material mixed with a small volume contribution from the thin reefs within, its grade tenor is similar to that of the VSC, which essentially represents a relatively intense vein stockwork – however, the two domains have differing structural controls and orientations.
A distinct hard boundary was detected within the Stockwork at the boundary between the Middle Malu and Lower Limey Unit which is situated immediately below the Middle Malu. On the basis of this evidence, it was decided to subdivide the Stockwork into Upper and Lower portions using this contact surface.
Diffusion tests were conducted in the massive bulk domains (VSC, A Reef Block and Stockwork). Grade is considered to be diffusive when, under translation from low to high grade areas, passes through an area of intermediate grade. If the grade transitions are sudden and unrelated to the distance of translation, the model is of the “mosaic” type. The MIK method is theoretically more suited to mosaic conditions. A good test of diffusion is to plot a matrix of cross indicator variograms divided by indicator variograms. The cross variogram of two grade indicators is divided by the variogram of the indicator at the lower of the two cut-offs. The structured portion of the quotient plot is indicative of the distance over which the grade is diffusive when transitioning across the higher cut-off boundary.
The diffusion tests demonstrate that although there is only some diffusive behaviour in the three domains under investigation, the range of this diffusivity is generally no more than 10m. This, along with the knowledge that MIK performed well in the Stockwork above the M50 reef (Main Dome open pit resource model), when applied to wide spaced resource definition drilling, resulted in the decision to use MIK to estimate grade in the bulk domains.

76 Newcrest Mining - Telfer Property Report - 31 December 2013
Visual analysis of the composited gold grades confirms the nature of the boundaries tested quantitatively above. In the gross sense, the strong structural control exerted by the Main Dome axial plane and Monocline axial plane, and particularly their intersection lineation, is clearly observed in the spatial distribution of gold (Figure 14.4). The VSC mineralisation conforms strongly to these structures, as does the intensity of mineralisation within the LLU and A Reef Block. Another visually observable phenomenon is the greater mineralisation intensity in the Stockwork Lower immediately below the LLU domain. This enhanced mineralisation is spatially associated with the overlying high grade LLU domain.
Figure 14.4 The reef and bulk domains estimated
Note: E-W section looking north at 11300mN with composite gold grades overlaid (to 150m either side of section).
Exploratory data analysis was undertaken on the bulk domains with a statistical summary, by bulk domain, of the combined DDH and RC 4m composite data for gold, copper, sulphur, arsenic and cobalt (Table 14.4 and figure 14.5 are examples of gold statistics). It is clearly evident from summary statistics and log-probability plots that the VSC, Stockwork and A Reef have a highly variable gold distribution, with coefficient of variation (CoV) varying between 3.17 and 4.44. The Oakover and LLU domains have somewhat lower CoV’s of 2.24 and 1.79, respectively, due to their more homogeneous mineralisation style, but are still considered to be highly variable. The bulk domain copper, sulphur, arsenic and cobalt grade data also reflect a generally high level of variability.

77 Newcrest Mining - Telfer Property Report - 31 December 2013
Table 14.4 Basic statistics for gold grade (ppm) for all bulk domains (undeclustered)
Domain LLU VSC Oakover A Reefs Stwk Upper Stwk Lower Estcode 4400 6000 7000 3000 1130 1170
N 1 105 5 868 365 5 565 13 248 17 792 Min 0.01 0.01 0.01 0.01 0.01 0.01 Max 98.91 125.89 45.11 54.92 24.87 68.83
Mean 5.73 1.24 1.70 0.63 0.14 0.37 Median 2.08 0.29 0.47 0.11 0.04 0.05 Std Dev 10.28 4.10 3.81 1.98 0.55 1.65
Coeff Var 1.79 3.30 2.24 3.17 4.00 4.44
Figure 14.5 Log-probability plot for composite gold grade, per bulk domain
Ordinary Kriging is considered to be sub-optimal for estimating such highly variable material without the need for aggressive top-cuts, due to the potential over-representation of the extreme end of the data distribution. A non-linear method such as Multiple Indicator Kriging (MIK) is likely to be better suited for dealing with these highly variable data sets. As a consequence, it was decided to use MIK to estimate gold and copper grade in the VSC, A Reef Block, Stockwork Upper and Stockwork Lower domains. Due to the generally lower variability and lower data count, it was decided to use OK in the LLU for gold and copper estimation in the Oakover domains.
Multi-element assaying, inclusive of sulphur, arsenic and cobalt, only became routine at Telfer since 1999. For this reason, a significant proportion of the drill holes used in this study only contain selective information for these three elements. Visual inspection of the composite values shows that sulphur values are generally relatively high where selective sampling has taken place, suggesting that multi-element analyses prior to 1999 were conducted on the basis of observing significant sulphides in the core. The extent of selective sampling is particularly problematic in the A Reef Block and Stockwork Upper domains, where just 49% and 33% respectively, as a proportion of the gold assays, were assayed for sulphur. It was therefore decided to use a combination of OK and linear regression methods to calculate estimates for sulphur, arsenic and cobalt in the bulk estimation domains.

78 Newcrest Mining - Telfer Property Report - 31 December 2013
Gold and Copper Estimation – Multiple Indicator Kriged Domains
As previously mentioned, MIK was implemented for gold and copper estimation in the VSC, A Reef Block, Stockwork Upper and Stockwork Lower domains. The following process and philosophy was followed to define indicator cut-off grades for MIK estimation:
1. For the lower portion of the grade distribution, no more than 15% to 20% of the samples were allowed to fall within any given grade bin.
2. The cumulative metal distribution for samples was calculated by sorting the composites from lowest to highest grade and then cumulatively summing the sample grades and expressing as a percentage. No more than approximately 10% of the metal contribution was allowed to fall into any given grade bin.
3. A cumulative distribution function (cdf), based on the grade sample data, was plotted on a graphically, using very small steps for high resolution.
4. Bin statistics were calculated and examined, with special attention being paid to the ratio of the mean to the median in each bin.
Table 14.5 Example Indicator variogram models used in the MIK estimation of gold grade for the VSC domain.
Indicator Nugget
Spherical 1 Spherical 2 Isatis Rotation (Mathematician)
sill major (m)
semi (m)
minor (m) sill major
(m) semi (m)
minor (m) Az Ay Ax
Au >= 0.05 0.117 0.391 35 20 8 0.492 800 250 30 -90 0 65
Au >= 0.15 0.250 0.333 35 20 8 0.417 450 200 30 -90 0 65
Au >= 0.3 0.320 0.340 30 15 8 0.340 275 125 30 -90 0 65
Au >= 0.6 0.383 0.447 20 15 8 0.170 200 115 28 -90 0 65
Au >= 1 0.505 0.354 20 15 8 0.141 150 90 20 -90 0 65
Au >= 1.5 0.545 0.303 15 10 8 0.152 125 85 20 -90 0 65
Au >= 2.5 0.583 0.250 15 10 8 0.167 100 70 15 -90 0 65
Au >= 3.5 0.632 0.195 15 10 8 0.172 80 55 15 -90 0 65
Au >= 5 0.645 0.161 15 10 8 0.194 75 55 15 -90 0 65
Au >= 7.5 0.658 0.132 15 10 8 0.211 65 55 15 -90 0 65
Au >= 10 0.714 0.107 15 10 8 0.179 50 50 15 -90 0 65
Au >= 20 0.789 0.105 10 10 8 0.105 50 50 15 -90 0 65
Au >= 25 0.791 0.104 10 10 8 0.104 50 50 15 -90 0 65
An example of indicator variogram model used for VSC domain is shown in Table 14.5.
The local rotation functionality provided by software provider was used during MIK estimation to define the search neighborhoods. For each target block, a unique rotation can be set and used to control both the variogram model and search neighbourhood rotation.
The search neighbourhood parameters used for MIK are summarised in Table 14.6 below.

79 Newcrest Mining - Telfer Property Report - 31 December 2013
Table 14.6 Search neighbourhood parameters for MIK estimation of gold and copper grade in the bulk domains.
Domain Element
Block Discretisation Min
Samp Max Samp
Search Radii (m) Isatis Rotation (Mathematician)
x y z major semi minor Az Ay Ax VSC Au 5 5 3 12 40 330 160 50
Dynamic rotation applied to variogram model and search ellipsoid
A Reef Block Au 5 5 3 12 40 330 160 50
Stwk Upper Au 5 5 3 12 40 330 160 50
Stwk Lower Au 5 5 3 12 40 330 160 50
VSC Cu 5 5 3 12 40 410 190 50
A Reef Block Cu 5 5 3 12 40 410 190 50
Stwk Upper Cu 5 5 3 12 40 410 190 50
Stwk Lower Cu 5 5 3 12 40 410 190 50
Gold and Copper Estimation – Ordinary Kriged Domains
Gold and copper grades for the LLU and Oakover domains were estimated using Ordinary Kriging (OK). The Oakover gold grade was capped at 20ppm, on the basis of the shape of the grade distribution and spatial considerations. Gold grade for LLU was left uncapped as was copper grade for both Oakover and LLU.
Gold and copper variogram models were generated by transforming the data to Gaussian space and back-transforming the resulting variogram model to raw space, as no robust experimental variography could be obtained in raw space alone. The modelled back-transformed variogram parameters are summarised in Table 14.7.
Table 14.7 Variogram models used in the OK estimation of gold and copper grade for the LLU and Oakover domains.
Element (Domain) Nugget
Spherical 1 Spherical 2 Isatis Rotation (Mathematician)
sill major (m)
semi (m)
minor (m) sill major
(m) semi (m)
minor (m) Az Ay Ax
Au (LLU) 0.568 0.231 20 20 20 0.202 220 220 220
Isotropic
Cu (LLU) 0.603 0.178 20 20 20 0.219 220 220 220
Au (Oakover) 0.621 0.168 20 20 20 0.211 130 130 130
Cu (Oakover) 0.516 0.242 20 20 20 0.242 200 200 200
The variogram and search neighbourhood parameters were dynamically varied for the LLU estimation runs, based on the same stratigraphy-parallel rotations described in Section 3.9.7.3. The Oakover, being a tabular shape had the search orientation set at a constant AZ = 0; AY = -45; AX = 0 under the Mathematician convention. Full search neighbourhood parameters are displayed in Table 14.8.

80 Newcrest Mining - Telfer Property Report - 31 December 2013
Table 14.8 Search neighbourhood parameters for OK estimation of gold and copper grade in the LLU and Oakover bulk domains.
Domain Element Block Discretisation Min
Samp Max
Samp Search Radii (m) Isatis Rotation
(Mathematician)
x y z major semi minor Az Ay Ax
LLU Au 5 5 3 3 24 500 375 100 Dynamic rotation applied to variogram and search
ellipsoid LLU Cu 5 5 3 3 24 500 375 100
Oakover Au 5 5 3 3 24 500 500 100 0 -45 0
Oakover Cu 5 5 3 3 24 500 500 100 0 -45 0
Sulphur, Arsenic and Cobalt Estimation
As previously noted, selective sampling for sulphur, arsenic and cobalt was undertaken prior to 1999. This is of particular significance in the Stockwork Upper and A Reef Block domains, where the degree of selective sampling is relatively high. It was decided to use a combination of OK and linear regression to calculate grade estimates for these three elements.
Grade caps were implemented for estimation of sulphur, arsenic and cobalt. These caps were chosen primarily on the basis of identification of outlier values in the grade distributions. Note that no grade caps were considered necessary in the LLU domain.
Table 14.9 Grade caps implemented for bulk domains during the OK estimation of sulphur, arsenic and cobalt grade
Domain Element Grade Cap Units
VSC S 30 wt%
VSC As 2000 Ppm
VSC Co 2000 Ppm
Oakover S 30 wt%
Oakover As 2000 Ppm
Oakover Co 1000 Ppm
A Reef Block S 30 wt%
A Reef Block As 4000 Ppm
A Reef Block Co 3000 Ppm
Stwk Upper S 30 wt%
Stwk Upper As 2000 Ppm
Stwk Upper Co 2000 Ppm
Stwk Lower S 30 wt%
Stwk Lower As 3000 Ppm
Stwk Lower Co 2000 Ppm
Sulphur, arsenic and cobalt variogram models were generated by transforming the data to Gaussian space and back-transforming the resulting variogram model to raw space, as no robust experimental variography could be obtained in raw space alone. The same domain specific variogram and search rotation strategies for the MIK and OK estimation of gold and copper were applied during the OK estimation of sulphur, arsenic and cobalt.

81 Newcrest Mining - Telfer Property Report - 31 December 2013
Blocks estimated by OK and having a Slope of Regression (SoR) greater than or equal to 0.8 were selected as having been robustly estimated for sulphur, arsenic and cobalt. Those blocks not considered robust were designated for estimation using a linear regression approach. This involved replacement of any block estimates generated by OK but having a SoR less than 0.8.
Since gold and copper are the only two grade variables not to suffer from the problem of selective sampling, regression on one or both of these variables is the only meaningful option. With the exception of the Stockwork Lower, it is evident that:
1. Sulphur estimates are significantly better correlated with copper than with gold.
2. The correlation between sulphur and copper is better than between arsenic and copper or between cobalt and copper.
The scatter plots also show that that there are at least two sulphur populations. One of these is reasonably well correlated with copper and therefore most likely a reflection of the presence of copper sulphides such as chalcopyrite. The other population shows no relation to copper at all and is probably indicative of variable pyrite enrichment not associated with the mineralisation. The relationship between sulphur and copper is therefore only weak to moderate, but appears to be the best candidate for a regression of sulphur.
Table 14.10 summarizes the linear regression equations used to estimate sulphur as a function of copper for blocks where slope of regression was less than 0.8.
Table 14.10 The linear regression equations used to estimate sulphur as a function of copper
Regression Equation Applied To: S = 11.827 * Cu Stwk Lower, Stwk Upper, A Reef Block S = 6.077 * Cu VSC S = 8.593 * Cu Oakover S = 8.072 * Cu LLU
Sulphur is observed to be moderately to well correlated with both arsenic and cobalt and as such arsenic and cobalt used linear regression as a function of sulphur for blocks where the slope of regression was less than 0.8.
Table 14.11 and Table 14.12 summaries the linear regression equations used to estimate arsenic and cobalt respectively as a function of sulphur for blocks where slope of regression was less than 0.8.
Table 14.11 The linear regression equations used to estimate arsenic as a function of sulphur
Regression Equation Applied To: As = 32.095 * S Stwk Lower, Stwk Upper, A Reef Block As = 29.411 * S VSC As = 47.130 * S Oakover As = 59.026 * S LLU

82 Newcrest Mining - Telfer Property Report - 31 December 2013
Table 14.12 The linear regression equations used to estimate cobalt as a function of sulphur
Regression Equation Applied To: Co = 21.323 * S Stwk Lower, Stwk Upper, A Reef Block Co = 36.995 * S VSC Co = 25.070 * S Oakover Co = 34.296 * S LLU
It is noted that the regressed estimates for sulphur, arsenic and cobalt are of lower confidence than gold or copper and are primarily used for concentrate quality predictions and not directly for Mineral Resource or Mineral Reserve estimates.
14.2.4 Reef Grade Modelling
The Main Dome underground reef domains have been defined on the basis of geological, mineralisation and structural information. The following reefs were estimated: B30, M60, M65, M68 and M70.
Exploratory data analysis was undertaken on the reef domains with a statistical summary, by reef domain, of the combined DDH and RC intercept data for gold, copper, sulphur, arsenic, cobalt and intercept length. (Table 14.13 and figure 14.6 are examples of gold statistics). It is clearly evident from summary statistics and log-probability plots that the reef domains have highly variable gold and copper distributions, with CoV’s varying between 1.58 and 2.68 for gold and between 1.97 and 2.41 for copper. The sulphur, arsenic and cobalt grade data reflect a somewhat lower level of variability.
Table 14.13 Basic statistics for gold grade (ppm) and intercept length (m) for all reef domains
Domain B30 M60 M65 M68 M70 Estcode 430 260 265 268 270
Variable Au (ppm)
Length Au (m)
Au (ppm)
Length Au (m)
Au (ppm)
Length Au (m)
Au (ppm)
Length Au (m)
Au (ppm)
Length Au (m)
N 123 123 98 98 96 96 83 83 113 113 Min 0.005 0.05 0.005 0.05 0.005 0.10 0.005 0.05 0.005 0.10 Max 34.87 10.00 58.50 3.86 52.95 6.00 45.00 1.75 17.00 2.80
Mean 3.39 1.89 4.80 0.59 2.74 0.67 2.14 0.65 1.38 0.57 Median 1.77 1.55 0.70 0.38 0.52 0.45 0.29 0.60 0.56 0.43 Std Dev 5.35 1.38 9.14 0.54 6.49 0.73 5.74 0.36 2.66 0.49
Coeff Var 1.58 0.73 1.91 0.91 2.37 1.09 2.68 0.55 1.93 0.85

83 Newcrest Mining - Telfer Property Report - 31 December 2013
Figure 14.6 Log-probability plot for composite gold grade, per bulk domain
An assessment of the difference between a 2-D estimation methodology and a length-weighted conventional 3-D OK estimation methodology was undertaken on the gold variable of the B30 domain. The 2-D methodology uses an estimate of the metal accumulation in conjunction with a secondary estimate of the vertical reef thickness to appropriately account for composite data of varying length. The length-weighting methodology accounts for the varying vertical widths in a single pass. There is little difference between the two estimated outcomes evident across all cut offs. On the basis of the tests undertaken on gold in the B30 domain, length-weighted OK was selected as the preferred methodology for all reef estimates.
Gold and Copper Estimation – Ordinary Kriged Domains
No grade caps were implemented for the reef intercept data. Gold and copper variogram models were generated by transforming the data to Gaussian space and back-transforming the resulting variogram model to raw space, as no robust experimental variography could be obtained in raw space alone. The modelled variogram parameters are summarised in Table 14.14.
Gold and copper grades were estimated using the Vulcan implementation of projection unfolding technique (Tetra Modelling). This process uses two designated surfaces to guide the orientation and the extent of the vertical component of the search ellipse. A pair of surfaces for each reef domain was created by copying the applicable hanging and footwall surfaces down and up by 10m, or, in the case of the B30 domain, 20m. The strength of the vertical anisotropy is variable and is determined during the estimation process, based on an initial proportion value of the distance between the two surfaces at the block centroid position. Table 14.15 shows the search radii and initial proportion value defined for the estimation of gold and copper.

84 Newcrest Mining - Telfer Property Report - 31 December 2013
Table 14.14 Variogram, models for the estimation of gold and copper grade in the reef estimation domains
Element (Domain) Nugget
Spherical 1 Spherical 2 Isatis Rotation (Mathematician)
sill major (m)
semi (m)
minor (m) sill major
(m) semi (m)
minor (m) Az Ay Ax
Au (B30) 0.197 0.218 25 25 25 0.585 210 210 210
Isotropic
Cu (B30) 0.380 0.299 30 30 30 0.321 250 250 250
Au x VW (B30) 0.169 0.198 25 25 25 0.633 210 210 210
Cu x VW (B30) 0.443 0.252 30 30 30 0.305 290 290 290
Au (M60) 0.402 0.298 30 30 30 0.300 230 230 230
Cu (M60) 0.461 0.270 30 30 30 0.270 275 275 275
Au (M65) 0.453 0.175 30 30 30 0.372 190 190 190
Cu (M65) 0.383 0.358 25 25 25 0.259 75 75 75
Au (M68) 0.397 0.164 30 30 30 0.439 235 235 235
Cu (M68) 0.410 0.265 25 25 25 0.325 240 240 240
Au (M70) 0.383 0.311 20 20 20 0.306 140 140 140
Cu (M70) 0.345 0.319 30 30 30 0.336 290 290 290
Table 14.15 Search parameters for OK Tetra Modelling of gold and copper grade in the reef domains
Domain Element Azimuth Plunge Dip Search Radii Minor Proportion
Value major semi
B30 Au 350 0 0 450 450 0.4
B30 Cu 350 0 0 450 450 0.4
M60 Au 350 0 0 300 300 0.4
M60 Cu 350 0 0 300 300 0.4
M65 Au 350 0 0 350 350 0.4
M65 Cu 350 0 0 350 350 0.4
M68 Au 350 0 0 250 250 0.4
M68 Cu 350 0 0 250 250 0.4
M70 Au 350 0 0 350 350 0.4
M70 Cu 350 0 0 350 350 0.4
A total metal sum was calculated for each block in the seam model. The Vulcan seam model was regularised to 12.5mE x 12.5mN x 12mRL and reef proportions were calculated as part of this process. The metal for each reef in each regular block was summed. The proportion and metal attributes were exported to a csv format file, which was then loaded into Isatis. The reef block grades were back-calculated in Isatis by dividing the imported metal by the product of the reef proportion and the regular block volume.

85 Newcrest Mining - Telfer Property Report - 31 December 2013
Sulphur, Arsenic and Cobalt Estimation
Sulphur, arsenic and cobalt variogram models were generated in raw space for B30 and M70. No robust experimental variography could be obtained for M60, M65 and M68. It was decided to apply the M70 variogram models to M60, M65 and M68. The modelled variogram parameters are summarised in Table 14.16.
Table 14.16 Variogram, models for the estimation of sulphur, arsenic and cobalt grade in reef domains
Element (Domain) Nugget
Spherical 1 Spherical 2 Isatis Rotation (Mathematician)
sill major (m)
semi (m)
minor (m) sill major
(m) semi (m)
minor (m) Az Ay Ax
S (B30) 0.162 0.284 60 60 60 0.554 125 125 125
Isotropic
As (B30 0.200 0.243 80 80 80 0.557 140 140 140 Co (B30) 0.192 0.242 80 80 80 0.567 140 140 140 S (M70) 0.373 0.627 45 45 45 - - - -
As (M70) 0.293 0.707 50 50 50 - - - - Co (M70) 0.249 0.751 45 45 45 - - -
Sulphur, arsenic and cobalt grades were estimated using the Vulcan implementation of projection unfolding technique. Table 14.17 shows the search radii and initial proportion value defined for the estimation of sulphur, arsenic and cobalt.
Table 14.17 Search parameters for OK Tetra Modelling of sulphur, arsenic and cobalt grade in the reef domains
Domain Attribute Azimuth Plunge Dip Search Radii Minor Proportion
Value major semi
B30 As 350 0 0 600 600 0.4
B30 S 350 0 0 650 650 0.4
B30 Co 350 0 0 600 600 0.4
M60 As 350 0 0 400 400 0.4
M60 S 350 0 0 400 400 0.4
M60 Co 350 0 0 400 400 0.4
M65 As 350 0 0 500 500 0.4
M65 S 350 0 0 500 500 0.4
M65 Co 350 0 0 500 500 0.4
M68 As 350 0 0 400 400 0.4
M68 S 350 0 0 400 400 0.4
M68 Co 350 0 0 400 400 0.4
M70 As 350 0 0 350 350 0.4
M70 S 350 0 0 350 350 0.4
M70 Co 350 0 0 350 350 0.4
A block discretisation setting of 5 x 5 x 1 (X x Y x Z) and a minimum of 2 and maximum of 15 composite data were used.

86 Newcrest Mining - Telfer Property Report - 31 December 2013
Consistent with the bulk domains blocks estimated by OK and having a Slope of Regression greater than or equal to 0.8 were selected as having been robustly estimated for sulphur, arsenic and cobalt. Those blocks not considered robust were designated for estimation using a linear regression approach. This included replacement of any block estimates generated by OK but having a SoR less than 0.8.
Since both gold and copper are the only two variables not to suffer from the problem of selective sampling, it was decided that regression on one or both of these variables is the only reasonable option. It is evident that:
1. The M70 results are of limited use – the negative correlations between sulphur and copper, as well as arsenic and copper are clearly unreasonable and probably due to a paucity of robustly estimated block data. M70 was therefore not granted further consideration.
2. For B30, sulphur estimates are significantly better correlated with copper than with gold.
3. The correlation between sulphur and copper is better than between arsenic and copper or between cobalt and copper.
As for the bulk domains, the scatter plots show at least two sulphur populations. The relationship between sulphur and copper is therefore only weak to moderate, but appears to be the best candidate for a regression of sulphur.
Sulphur is observed to be moderately to well correlated with both arsenic and cobalt.
Table 14.18 summarizes the linear equations used to estimate sulphur as a function of copper. Table 14.19 summarizes the linear regression equations used to estimate arsenic and cobalt respectively as a function of sulphur for blocks. All regressions apply to blocks where slope of regression was less than 0.8.
Table 14.18 The linear regression equation used to estimate sulphur as a function of copper
Regression Equation Applied To: S = 17.732 * Cu B30, M60, M65, M68, M70
Table 14.19 The linear regression equation used to estimate arsenic and cobalt as functions of sulphur
Regression Equation Applied To: As = 76.605 * S B30, M60, M65, M68, M70 Co = 68.191 * S B30, M60, M65, M68, M70
As was the case for the bulk domains, it should be clearly understood that the regressed estimates in the reefs for sulphur, arsenic and cobalt are of lower confidence than gold or copper and are primarily used for concentrate quality predictions and not directly for Mineral Resource or Mineral Reserves.

87 Newcrest Mining - Telfer Property Report - 31 December 2013
14.2.5 Density Modelling
Density samples were flagged by estimation domain using Surpac and subsequent density estimation was implemented in Isatis.
Basic statistics for density were evaluated and are shown in Table 14.20. Mean density broadly corresponds with the gold and copper grade tenor of the estimation domain, as would be expected since the presence of sulphides and mineralisation are correlated to some degree. The reef domains, LLU and Oakover show greater density variability than the remainder of the bulk domains. However, the density variability in all the domains is generally very low with CoV’s ranging between 0.03 and 0.14. It is clear that the reef domains and LLU show evidence of bimodality, which is probably a reflection of highly variable sulphide content, with massive sulphide development in places. The difference between the statistics with and without length-weighting was checked and is considered to be immaterial.
The following decisions were taken with respect to estimation methodology, based on the results of the exploratory data analysis:
1. Global mean densities were assigned to the Oakover, VSC, A Reef Block and Stockwork Upper and Lower domains due to their unimodal nature and/or relatively low variability.
2. Density estimates for all of the reef domains and the LLU would be calculated using OK.
Table 14.20 Basic statistics for density data, by domain, with no length-weighting applied
Estimation Domain B30 M60 M65 M68 M70 LLU Oakover VSC A
Reefs Stwk Upper
Stwk Lower
N 94 35 34 42 39 2 190 1 031 11 331 7 621 11 635 8 316
Min 2.69 2.36 2.72 2.65 2.63 2.34 2.39 2.00 2.17 2.31 2.29
Max 3.95 3.61 4.62 3.63 3.93 5.26 5.17 4.11 4.83 6.24 4.63
Mean 3.11 3.07 3.05 2.91 3.00 3.24 2.90 2.80 2.83 2.77 2.82 Trim Mean
(95th Perc.)
3.10 3.07 3.02 2.90 3.00 3.23 2.79 2.87 2.81 2.77 2.81
Std Dev 0.33 0.30 0.43 0.25 0.33 0.47 0.30 0.12 0.15 0.09 0.15
Coeff Var 0.11 0.10 0.14 0.09 0.11 0.14 0.10 0.04 0.05 0.03 0.05
10th Perc. 2.77 2.73 2.76 2.68 2.69 2.78 2.73 2.72 2.73 2.70 2.72
95th Perc. 3.69 3.53 3.94 3.45 3.78 4.07 3.47 2.97 3.03 2.89 3.03
Assigned block densities for some of the bulk domains are as listed in Table 14.21. The A Reef Block, Oakover and Stockwork Upper domains were assigned the length-weighted, 95th percentile trimmed sample mean values. The VSC and Stockwork Lower domains were assigned length-weighted, untrimmed sample mean values.

88 Newcrest Mining - Telfer Property Report - 31 December 2013
Table 14.21 Constant density values assigned to bulk domains Domain Assigned Density Value (t/m3)
Stockwork Upper 2.77 Stockwork Lower 2.81
VSC 2.80 Oakover 2.85
A reef Block 2.81
Density was estimated for all reef domains and the LLU bulk domain using OK. Density sample values were capped to the 95th percentile for the LLU and M65 domains, resulting in top cap values of 4.07t/m3 and 3.94t/m3, respectively. A single variogram model, obtained from the LLU domain, was used to estimate density for all reef domains and the LLU domain as robust variography could not be obtained directly for reefs due to a paucity of data points.
Unique neighbourhoods, whereby all data points were used in the estimation of each block, were used for the reef domains. This approach is feasible where the number of data points is not too great to make inversion of the kriging matrix impossible. In the case of the LLU domain, a standard moving neighbourhood was used. The use of a relatively small moving neighbourhood for the LLU domain meant that a number of blocks were not estimated, in areas distal to the available density data points. The uninformed blocks were assigned a constant value of 3.23t/m3, which represents the mean of the LLU data trimmed to the 95th percentile.
14.2.6 Final Model Construction and Validation
The grade and density estimates for all reef domains and bulk domains, were combined into single grade and density values for each 12.5mE x 12.5mN x 12mRL block.
Grade estimates were combined according to the following process:
1. A combined bulk domain grade zbulk was calculated by tonnage-weighting of the individual bulk domain grade estimates.
2. A combined reef domain grade zreef was calculated by tonnage-weighting of the individual reef domain grade estimates.
3. A final, combined grade estimate per block was calculated according to the following formula:
zfinal = ((zbulk * tonnesbulkfin)+ (zreef * tonnesreef)) / (tonnesbulkfin + tonnesreef)
A series of model validations was undertaken on both bulk and reef domains.
Check estimates for gold and copper grade were run using OK for those domains estimated with MIK (Stockwork Upper, Stockwork Lower, A Reef Block and VSC). Similarly, moving average check estimates were run for gold and copper for the remaining two domains (LLU and Oakover).
Check estimates for sulphur, arsenic and cobalt were run using the moving average method. Check estimates for the LLU and Oakover domains were also run in Vulcan, using

89 Newcrest Mining - Telfer Property Report - 31 December 2013
OK and the Tetra modelling approach. Globally, the Isatis OK estimates for grade (those used to compile the resource) compare very well to the Vulcan results.
The most reliable comparison method is that between the main estimates and check estimates. With the exception of sulphur in the Stockwork Lower domain, the agreement between main and check estimate global means is within 10%, and often much better than that. The MIK gold and copper main estimates are generally higher in grade than the check OK estimates in the relevant bulk domains. This is believed to be because of the effect of the grade caps used for the OK check estimates. It is evident in the LLU and Oakover domains, where the OK main estimate and moving average check estimate both using the same capped sample values, that the gold and copper grade comparisons are more balanced.
Swath plots were generated for all elements estimated, per bulk domain. For gold and copper, swath plots were generated in northing, easting and RL directions. For sulphur, arsenic and cobalt, only those blocks considered to be robustly estimated (SoR >= 0.8) were plotted, with the swath plots limited to northing slices.
The swath plots generally demonstrate that the estimates honour the conditioning sample data well. For gold and copper grade, the previously discussed difference between the MIK main estimates and OK check estimates, due to grade capping in the OK check estimates, is clearly visible – this is most marked in the two Stockwork sub-domains, a fact which is also reflected in the global statistics reviewed in the previous section. While the estimates generally follow the plots of sample grades quite closely, there are places where they depart from one another even for declustered samples. This generally occurs in areas where sample clustering and/or estimation volume effects are evident and cannot be satisfactorily accounted for by cell declustering of the samples.
The plot of sulphur OK main estimates versus sulphur moving average check estimates in the Stockwork Lower domain shows that the area of major difference is south of 11200N, where there is a relatively high degree of selective sampling for sulphur.
The bulk domain estimates were checked visually by viewing the estimates and sample grades in 3-D and in 2-D sections. In all cases, the estimates were seen to be satisfactorily honouring the data.
For the reef estimates a series of random checks were undertaken to ensure that the gold and copper metal was calculated correctly, in Vulcan, per block in the seam model. Swath plots were generated for all elements estimated, per bulk domain. For gold and copper, swath plots were generated in northing, easting and RL directions. For sulphur, arsenic and cobalt, only those blocks considered to be robustly estimated (SoR >= 0.8) were plotted with the swath plots limited to northing slices.
Agreement between the sample data (vertical width-weighted) and the vertical width-weighted OK estimates is observed to be good throughout. It is clear from the swath plots that the estimates for the reef domains have honoured the sample data.
The vast bulk of the model volume was informed by the assignment of constant density values. These assignments were validated by visual inspection, as were the OK density estimates for the reef domains and the LLU domain. In all cases, the estimates were observed to be honouring the sample data.

90 Newcrest Mining - Telfer Property Report - 31 December 2013
On balance, the grade and density estimates are considered to be sound, and there is sufficient evidence that the sample data have been honoured.
14.2.7 Resource Classification
The combined grade and density estimates were reviewed as a Vulcan block model. As part of this review, Newcrest undertook the classification of the Mineral Resource. The following process was followed:
1. A Vulcan shell, delimiting the volume where the kriging SoR for gold grade was greater than 0.7, was created.
2. The value algorithm for economic blocks, using Newcrest price assumptions, was run and all economic blocks were flagged in the block model.
3. The previous classification and SLC footprint were displayed on screen.
4. The combination of points 1, 2, and 3 were used to visually interpret the Indicated Mineral Resource volume, which was wireframed for the mineable shapes.
5. All remaining blocks which were flagged as being economic were classified as Inferred.
The Mineral Resource classification is considered appropriate for the resource estimate.
Figure 14.7 Cross Section 11300N through Main Dome UG
91 Newcrest Mining - Telfer Property Report - 31 December 2013
14.3 Comparison to Previous Mineral Resource Estimate
Newcrest has reported a Mineral Resource estimate for Telfer as at 31 December 2013. Newcrest has completed a detailed review of all production sources to take into account Newcrest’s current view of long term metal price, foreign exchange and cost assumptions, and mining and metallurgy performance to inform cut-off grades and physical mining parameters.
This has resulted in the most marginal ounces being removed and these are reflected in changes to Mineral Resources. The Measured and Indicated Mineral Resources for Telfer as at 31 December 2013 includes a material reduction of approximately 5.2Moz of gold to 13Moz of gold, compared with the 31 December 2012 estimate of 18.2Moz of gold. This reduction has primarily come from West Dome and Main Dome open pit Mineral Resources as a direct result of the review of long term economic assumptions.
14.4 Factors Affecting Mineral Resource Estimate
Telfer Gold Mine is an established operation with a long history to support development of plans to exploit the available Mineral Resource estimate.
The Mineral Resource estimates are based on long term capital and operating costs assumptions based on the current operating cost base modified for changing activity levels and reasonable cost base reductions over the life of the mine. Any material change in long term cost base or metal price assumptions may impact the Mineral Resource estimate.

92 Newcrest Mining - Telfer Property Report - 31 December 2013
15 MINERAL RESERVE ESTIMATES
15.1 Introduction
The 31 December 2013 Mineral Reserve update has been based on a detailed review completed by Newcrest of all Telfer production sources to take into account Newcrest’s current view of long term metal price, foreign exchange and cost assumptions, and mining and metallurgy performance to inform cut-off grades and physical mining parameters. This has resulted in the most marginal ounces being removed and this has been reflected in changes to Mineral Reserve estimates. The Mineral Reserves for Telfer as at 31 December 2013 includes a material reduction of approximately 5.3Moz of gold to 5.6Moz of gold, compared with the 31 December 2012 estimate of 10.9Moz of gold. This reduction has primarily come from the West Dome and Main Dome open pit Mineral Reserves.
The Mineral Reserve estimates reported in this release have been prepared under the direction of a Qualified Person, as defined in NI 43-101, using accepted industry practice and have been classified in accordance with the JORC Code. Except as described below, there are no material differences between the definitions of Proven and Probable Mineral Reserves under the applicable definitions adopted by the Canadian Institute of Mining, Metallurgy and Petroleum (the “CIM Definition Standards”) and the corresponding equivalent definitions in the JORC Code for Proved and Probable Ore Reserves.
It is noted that under the CIM Definition Standards, the completion of a pre-feasibility study is the minimum prerequisite for the conversion of Mineral Resources to Mineral Reserves. The JORC Code 2012, which came into effect on 1 December 2013, prescribes completion of a pre-feasibility study as a minimum prerequisite to declare an Ore Reserve (the JORC equivalent of a Mineral Reserve); however this requirement of the JORC Code does not come into effect until 1 December 2014.
A pre-feasibility study within the meaning of the CIM Definition Standards has not yet been completed in respect of Telfer Underground Vertical Stockwork Corridor (VSC) and O’Callaghans deposits and these have therefore been excluded from the Mineral Reserve estimates.
The Mineral Reserves at Telfer comprise:
• Main Dome open pit Mineral Reserve;
• West Dome open pit Mineral Reserve;
• Telfer UG Sublevel Cave underground Mineral Reserve;
• Telfer UG Western Flanks underground Mineral Reserve;
• Telfer UG M Reef underground Mineral Reserve.
The quoted Main Dome open pit Mineral Reserve includes surface stockpile reserves originating from all mining areas of the Telfer operations. The SLC, Western Flanks and M Reef are collectively known as Telfer Main Dome Underground (formerly Telfer Deeps). The Mineral Reserves were prepared under the direction of the Qualified Person, Mr Colin Moorhead, using accepted industry practice and were classified and reported as at 31 December 2013 in accordance with the NI43-101 Reporting standards.

93 Newcrest Mining - Telfer Property Report - 31 December 2013
15.2 Mineral Reserve Assumptions
15.2.1 Commodity Prices and Exchange Rates
The following assumptions were used to prepare the December 2013 Mineral Reserve estimates:
• Gold Price US$1250/oz
• Copper Price US$2.70/lb
• Exchange rate A$1.00 = US$0.80.
15.2.2 Cost Estimates
Mining costs and pit optimizations used in the 2013 Mineral Reserve estimate have been updated since the previous Mineral Reserve estimate. The Mineral Reserves include mineralization which, when delivered to the pit rim or mine portals, contains metal with a recovered value greater than the cost of all subsequent processes including the fixed cost of operating those processes.
The mine design that supports the Mineral Reserves has been based on the LOM plan developed specifically for mineral reserve reporting. Operating cost estimates used in the preparation of the Mineral Reserves mine design have been developed from the same LOM plan. Mining costs are developed from first principles using assumed unit costs that reflect actual mine performance. Haul truck productivity assumptions are estimated for each origin and destination combination. Drill and blast costs reflect the different physical properties of all ore and waste materials.
15.3 Telfer Main Dome Open Pit Mineral Reserve
The Telfer Main Dome open pit is currently the major source of ore production within the Telfer operations. The regional geology of the Main Dome is characterized by deep weathering of the surface mineralized reef formation which reduced the copper content of the ore, overlying a less weathered ore with higher proportions of copper associated with the gold.
Mine production from the Main Dome open pit in the year to June 2013 was reported to be 12Mt of ore for a total movement of 64Mt of material. The current LOM schedule supporting the Mineral Reserve assumes Main Dome mining continuing until 2024. Production activity focus alternates between Main Dome and the adjoining West Dome open pit during this time period.
The Telfer Main Dome Mineral Reserve as at 31 December 2013 is shown in Table 15.1. The majority of the Mineral Reserve is classified as Probable and was converted from the Indicated Mineral Resources using appropriate modifying factors. The minor portion of Proven Mineral Reserve reflects stockpiled ore awaiting treatment.

94 Newcrest Mining - Telfer Property Report - 31 December 2013
Table 15.1 Telfer Main Dome Open Pit Mineral Reserve Estimate at 31 December 2013
Mineral Reserve
Classification
Mt Gold
(g/t)
Copper
(%)
Gold
(Moz)
Copper
(Mt) Proven 24 0.40 0.09 0.3 0.02 Probable 74 0.95 0.10 2.3 0.08 Total 98 0.81 0.10 2.6 0.10
Note: Rounding may cause some computational discrepancies
A specific cut-off grade was not used in estimating the Mineral Reserves. Rather each block within the resource model is assigned a value based on an estimate of its potential net commercial value. Net values are calculated on a payable metal basis taking into account metal prices, metallurgical recoveries, processing costs and realization costs, but excluding mining costs that are common to both ore and waste mining.
Mineralization is classified according to the Telfer Geomet Profit Algorithm (GPA) which incorporates assumptions about assigning process route to derive the net revenue available from any given resource model block. This methodology leads to a profit balance, breakeven type selection of high grade ore, low grade ore, mineralized waste or waste based upon a block's resulting net value.
The resource models were depleted to the estimated end of December 2013 survey surface. All material within the zone of influence of the underground SLC was allocated as waste so that it was excluded from the open pit estimate.
The preparation of Mineral Reserve estimates for Telfer Main Dome follows industry standard processes:
• Input assumptions are collated and signed off.
• Pit optimization is run with Whittle software to generate a range of pit shells at different gold prices.
• Pit shells are selected that generate the maximum discounted value.
• Selected pit shells are used as the basis for final limits and phase designs. The final limits pit design is based on the revenue factor 1.0 pit shell.
• Final limit and phase pit designs are interrogated for tonnes and grades applying appropriate cut off values, and exported to mine scheduling software.
• Mine scheduling and financial modeling confirms a practical and economical mine schedule.
• Mineral Reserves are generated from Indicated Resources within the final pit limits.
15.4 Telfer West Dome Open Pit Mineral Reserve
The Telfer West Dome open pit reserve is located approximately 3km northwest of the existing Main Dome open pit (refer Figure 15.1). The West Dome pits are currently on care and maintenance with mining activity focusing on Main Dome. West Dome had been mined

95 Newcrest Mining - Telfer Property Report - 31 December 2013
for the previous two years up until July 2013. Mine production from the West Dome open pit in the year to June 2013 was reported to be 19Mt of ore for a total movement of 25Mt of material.
Figure 15.1 Telfer West Dome Location Relative to Main Dome and Telfer Deeps
Main Dome
West Dome
Main Dome Underground
West Dome open pit reserve has generally similar geological and metallurgical characteristics to the Main Dome open pit reserve, albeit with more sulphur and more complexity of the copper occurrence. The current LOM schedule supporting the Mineral Reserve assumes production recommencing from West Dome in 2015 and continuing until 2020.
The Telfer West Dome Mineral Reserve as at 31 December 2013 is shown in the Table 15.2. The whole of the Mineral Reserve is classified as Probable based upon derivation from the Indicated Mineral Resources.
Table 15.2 Telfer West Dome Open Pit Mineral Reserve Estimate at 31 December 2013
Reserve Classification
Mt Gold (g/t)
Copper (%)
Gold (Moz)
Copper (Mt)
Proven - - - - - Probable 73 0.68 0.06 1.6 0.04 Subtotal 73 0.68 0.06 1.6 0.04
Note: Rounding may cause some computational discrepancies
The reserve modelling methodology adopted for the West Dome Mineral Reserve is similar to that undertaken with the Main Dome Mineral Reserve, with each block within the orebody model being assigned a value based on an estimate of its potential net commercial value. Net values are calculated on a payable metal basis taking into account metal prices, metallurgical recoveries, processing costs and realization costs but excluding mining costs that are common to both ore and waste mining.

96 Newcrest Mining - Telfer Property Report - 31 December 2013
Mineralization is classified according to the Telfer Simplified Profit Algorithm (SPA) which incorporates assumptions about assigning process route to derive the net revenue available from any given resource model block. This methodology leads to a profit balance, breakeven type selection of high grade ore, low grade ore, mineralized waste or waste based upon a block's resulting net value.
The resource models were depleted to the end of December 2013 survey surface.
The preparation of Mineral Reserve estimates for Telfer West Dome is consistent with Main Dome and follows industry standard processes:
• Input assumptions are collated and signed off.
• Pit optimization is run with Whittle software to generate a range of pit shells at different gold prices.
• Pit shells are selected that generate the maximum discounted value.
• Selected pit shells are used as the basis for final limits and phase designs. The final limits pit design is based on the revenue factor 1.0 pit shell.
• Final limit and phase pit designs are interrogated for tonnes and grades applying appropriate cut off values, and exported to mine scheduling software.
• Mine scheduling and financial modeling confirms a practical and economical mine schedule.
• Mineral Reserves are generated from Indicated Resources within the final pit limits.
15.5 Telfer Main Dome Underground Mineral Reserves
The Telfer Main Dome Mineral Reserves comprise the bulk mining areas of Sub-level Cave (SLC), Western Flanks and selective mining areas of M Reefs.
15.5.1 Telfer UG SLC Mineral Reserve
The Telfer SLC underground mine is located beneath the operating Main Dome open pit. The SLC extracts the high grade mineralized reef system with surrounding low grade stockworks.
The SLC commenced production in 2006 and currently supplies approximately 5.5Mtpa of ore to the Telfer processing facility via an underground crusher, shaft hoisting system and overland conveyer. The current LOM schedule supporting the Mineral Reserve assumes production from the SLC continuing until 2018.
The Telfer SLC Mineral Reserve as at 31 December 2013 is shown in Table 15.3. The Mineral Reserve is classified as Probable and is derived solely from Indicated Mineral Resources. The Mineral Reserve estimate is based on the block model used to report the December 2013 Mineral Resource for Telfer Underground.

97 Newcrest Mining - Telfer Property Report - 31 December 2013
Table 15.3 Telfer UG SLC Mineral Reserve Estimate at 31 December 2013 Reserve
Classification Mt Gold
(g/t) Copper
(%) Gold (Moz)
Copper (Mt)
Proven - - - - - Probable 17 0.91 0.23 0.5 0.04 Subtotal 17 0.91 0.23 0.5 0.04
The reserve process utilises the SLC estimation process developed by Newcrest and referred to as the Newcrest sub-level cave optimiser (NSO). The Mineral Reserve is classified using a net value, rather than cut-off grade to take into account the contributions of gold and copper. This value has been calculated using the revenue minus the cost of transport, treatment and refining costs and royalty as well as considering the site operating costs used for cut off determination. The site operating costs include incremental mining cost, processing cost, relevant site General and Administration costs and relevant sustaining capital costs.
The NSO was developed internally by Newcrest and subjected to external review. This model applies the concepts of recovering ore over multiple extraction levels and estimating the dilution entering the ore flow. The model is based on full scale cave marker trials, takes into consideration the actual drawn tonnages from overlying drawpoints and is calibrated using production reconciliation data.
Material is classified as ore or waste based on its net value, rather than a cut-off grade, to account for the contributions of both gold and copper. The cut-off value used in the Mineral Reserve estimate includes mining cost, processing cost and combined site general and administration costs applicable sustaining capital costs.
Figure 15.2 shows the remaining LOM design for the Telfer Deeps SLC.
Figure 15.2 Telfer UG SLC remaining Life of Mine Design - Isometric View
15.5.2 Telfer UG Western Flanks Mineral Reserve
The Telfer UG Western Flanks (WF) underground mining area is located adjacent to the operating Sub Level Cave (SLC) on the western side located beneath the current operational Main Dome Open Pit within the Telfer Gold Mine Operations. The Western

98 Newcrest Mining - Telfer Property Report - 31 December 2013
Flanks comprise a series of high grade veins and a reef horizon. The latest resource model considers additional drilling information and is now modelled to suit a bulk mining method and is considered an extension to current SLC mine operations.
As yet, there has been no production from the Western Flanks area.
The Telfer UG Western Flanks Mineral Reserve as at 31 December 2013 is shown in Table 15.4. The Mineral Reserve is classified as Probable and is derived solely from Indicated Mineral Resources. The Mineral Reserve estimate is based on the block model used to report the December 2013 Mineral Resource for Telfer.
Table 15.4 Telfer Deeps Western Flanks Mineral Reserve Estimate at 31 December 2013
Reserve Classification
Mt Gold (g/t)
Copper (%)
Gold (Moz)
Copper (Mt)
Proven - - - - - Probable 15 0.98 0.16 0.5 0.03 Subtotal 15 0.98 0.16 0.5 0.03
Material is classified as ore or waste based on its net value, rather than a cut-off grade, to account for the contributions of both gold and copper. The cut-off value used in the Mineral Reserve estimate includes mining cost, processing cost and combined site general and administration costs applicable sustaining capital costs.
Figure 15.3 shows the Telfer UG Western Flanks in relation to the existing Telfer UG SLC development, pictured at the top of the figure. The Lower Limey Unit zone is shown in blue and the Oakover Unit zone is shown in brown.

99 Newcrest Mining - Telfer Property Report - 31 December 2013
Figure 15.3 Plan View showing Telfer UG Western Flanks
500 metres
Mine GridNorth
500 metres
Mine GridNorth
15.5.3 Telfer UG M Reef Mineral Reserve
The Telfer UG M Reefs underground mine is located beneath the current operational Main Dome Open Pit within the Telfer Gold Mine Operations with economic zones comprising M30, M35, M40 and M50 Reefs. Gold and copper mineralisation is in the largely structurally controlled reefs, veins and stock works hosted by sedimentary rocks of the Proterozoic age. Mining of the M Reefs recommenced in July 2009 having previously been mined in the 1990s. M35 is currently the only producing reef, with M50 under development and M30 & M40 due to commence development during 2014.
The Telfer UG M Reefs Mineral Reserve as at 31 December 2013 is shown in Table 15.5. The Mineral Reserve is classified as Probable and is derived solely from Indicated Mineral Resources. The Mineral Reserve estimate is based on the block model used to report the December 2013 Mineral Resource for Telfer.

100 Newcrest Mining - Telfer Property Report - 31 December 2013
Table 15.5 Telfer UG M50 Reef Mineral Reserve Estimate at 31 December 2013 Reserve
Classification Mt Gold
(g/t) Copper
(%) Gold (Moz)
Copper (Mt)
Proven - - - - - Probable 4 3.4 0.25 0.5 0.01 Subtotal 4 3.4 0.25 0.5 0.01
Material is classified as ore or waste based on its net value, rather than a cut-off grade, to account for the contributions of both gold and copper. The cut-off value used in the Mineral Reserve estimate includes mining cost, processing cost and combined site general and administration costs applicable sustaining capital costs.
Figure 15.4 Typical Cross Section through M Reefs
15.6 Comparison to Previous Mineral Reserve Estimate
Newcrest has reported a Mineral Reserve estimate for Telfer as at 31 December 2013. Newcrest has completed a detailed review of all production sources to take into account Newcrest’s current view of long term metal price, foreign exchange and cost assumptions, and mining and metallurgy performance to inform cut-off grades and physical mining parameters.
This has resulted in the most marginal ounces being removed and this is reflected in changes to Mineral Reserves. The Mineral Reserves for Telfer as at 31 December 2013 includes a material reduction of approximately 5.3Moz of gold to 5.6Moz of gold, compared with the 31 December 2012 estimate of 10.9Moz of gold. This reduction has primarily come from the West Dome and Main Dome open pit Mineral Reserves as a direct result of the review of long term economic assumptions.

101 Newcrest Mining - Telfer Property Report - 31 December 2013
15.6.1 Factors Affecting the Mineral Reserve Estimates
The relevant factors that could materially affect the Telfer Mineral Reserve include:
• Operating cost assumptions;
• Resource model confidence;
• Mining assumptions;
• Metallurgical assumptions.
Capital and operating costs have been determined based on the current operating cost base modified for changing activity levels and reasonable cost base reductions over the life of the mine. Ore dilution and recovery loss is specifically accounted for in this resource modelling process and no additional mining dilution or recovery factors are applied to the Telfer Open Pit Mineral Reserve estimate. This assumption is supported by the actual reconciliation between resource model and mill performance at Telfer to date being within an acceptable uncertainty range for the style of mineralisation under consideration. All metallurgical assumptions and potential geo-metallurgical paths are based on actual performance of the current processing operations which includes processing of ore sources included in the Mineral Reserve. Sensitivity analysis was conducted on the key input parameters of cost base, head grade and recovery and found to be robust.
The Main Dome open pit operation incorporates an active cave zone from the Telfer Deeps Sub Level Cave (SLC) operation within the pit limits. Situated on the western side of the Main Dome operations, the cave zone represents an area within the Mineral Reserve model that has either ‘subsided’ or has the potential to subside within the planned operation of the Telfer Deeps SLC. This area has therefore been excluded from the Mineral Reserve estimate due to the diluted nature of the material within its influence and is considered a conservative approach. No other factors are considered significant enough to materially affect the Mineral Reserve estimate.
Additional underground Mineral Reserve potential is from the Vertical Stockwork Corridor Mineral Resource. A PFS level study is currently underway to confirm the economic viability of the VSC and is expected to be completed by 1 December 2014. The planned mining method for the Telfer VSC is a continuation of the Telfer UG Sub Level Cave (SLC) with the key difference being the transition to longitudinal SLC layout as the resource narrows at depth.
Additional Mineral Reserve potential also exists from the polymetallic underground deposit at O’Callaghans which is also subject to PFS level studies expected to be completed by 1 December 2014.

102 Newcrest Mining - Telfer Property Report - 31 December 2013
16 MINING METHODS
16.1 Telfer Main Dome and West Dome Open Pit
Mining methods at Main Dome and West Dome are the same. Current mining activities at the Telfer open pits are completed via conventional truck and shovel operations, standard waste rock dumps and stockpiling and reclaim of lower grade ore. An excavator configured load fleet is utilised to selectively extract ore material from a total twelve metre design bench height via three 4m high ‘flitches’. The 4m ‘flitches’ are used in order to help reduce ore dilution and loss. Bulk waste is stripped via two 6m ‘flitches’. Productivities, availabilities and utilisations used within the production schedule have been based on current performance.
The current mining fleet employed within the Telfer open pit includes:
• 2 x CAT 6060 excavators;
• 2 x Caterpillar 994 class front end loaders;
• Up to 32 x Caterpillar 793 class rigid body off-highway dump trucks; and
• Various ancillary equipment (drills, dozers, graders, etc.)
Open pit operations within the Main and West Dome pits have traditionally focused on the selective extraction of the ore material within the Mineral Reserve through the use of the sites excavator fleet. This configuration of this equipment, and selective ore mining approach adopted for ore mining, has led to the use of 12m benches comprising of three 4 m ‘flitches’.
Reef and adjacent waste, as well as the edges of stockwork ore, are selectively mined, while broad areas of stock work ore and waste are bulk mined. Some near-surface oxidised stock work is dump leached and this is bulk mined. All other ore is fed to the processing plant and is referred to as direct float ore. Direct float ore will be hauled to the ROM and normally direct tipped into the two gyratory crushers, but with allowance for stockpiling and rehandling a percentage of the direct float ore on the ROM pad. Dump leach ore is dumped for leaching on existing leach pads to the west of Main Dome and to the east of West Dome. Waste will be used for tailings storage facility construction or delivered to a dump south of the Main Dome pit and west of the West Dome pit. Of the total waste to be mined, 20% has been identified as potentially acid-forming and will continue to be segregated into confined cells within the waste dump and enveloped with non-acid-forming waste.
Ore and waste zones are all blasted on standard pattern spacing with 12m benches irrespective of the subsequent mining method being either a selective approach utilizing the excavator flitch extraction or a bulk shovel/loader configuration. However, blast drill hole diameter and explosive powder factors are adjusted to account for the varying mining methods. All blast hole drilling is undertaken with either hammer or rotary drill rigs depending upon the required hole size and material strength.
Geological and geotechnical conditions are complex and a number of batter failures, and in some cases multiple batter failures, have occurred. The pit has an extensive array of sensing equipment providing real time monitoring of pit wall stability. Mining practices include standoff periods after blasting against a high-wall and installation of wall reinforcement in places. Feedback from failure back analysis informs future pit slope design parameters for pit optimization and design.

103 Newcrest Mining - Telfer Property Report - 31 December 2013
16.2 Telfer Main Dome Underground
16.2.1 Telfer UG Sub-level Cave (SLC)
The Telfer UG SLC is being mined using the SLC method. SLC involves the development of a series of parallel cross-cuts through the orebody in a regular geometrical pattern. Ore is progressively withdrawn from drawpoints in the crosscuts. As material is loaded from a drawpoint, the ore progressively mixes with material from higher levels in the cave. Once a predetermined draw tonnage is loaded from the drawpoint, loading ceases and the next ring is fired. As the process continues the rock overlying the mining footprint progressively caves, as does the rock immediately adjacent to the caved area.
Loaded ore is tipped down an ore pass system to the haulage level where it is trucked to the underground crushing station. A hoisting shaft facilitates transport of ore to surface, from a hoist depth of approximately 1,100m.
A decline provides access for the transport of personnel and materials from a portal entry in the open pit to the base of the underground mine.
All major infrastructure is in place to service the current mine plan. Development is well in advance of the current production horizons with all main orebody access points in place. Production level development is currently being carried out on the penultimate planned production level.
The mine design follows an established geometry employed since production commenced in 2006. As the design and operation of the Telfer UG SLC are mature there is minimal risk associated with the mining method and design used in the preparation of the Mineral Reserve estimate.
16.2.2 Telfer UG Western Flanks
The planned mining method for the Western Flanks (WF) is a flat-dipping modified Sub Level Cave (SLC). The mining process at Telfer UG SLC and Western Flanks SLC are essential the same with the key difference being the flat dipping nature of the Western Flanks resource requiring a series of steps in the SLC layout as shown in Figure 16.1. This modification impacts the draw rate and mining recovery assumptions and the planned Western Flanks assumption are appropriately adjusted relative to the Telfer UG SLC cave draw assumptions.
It is planned that material mined from the Western Flanks will be extracted by trucking a short distance to the existing 1,100m hoisting shaft facility where it will then be hoisted to surface. The Western Flanks will also be serviced by the existing single portal entry for transport of material and men into the mine.

104 Newcrest Mining - Telfer Property Report - 31 December 2013
Figure 16.1 Western Flanks Proposed Mine Layout - Isometric View
16.2.3 Telfer UG M Reefs Selective Mining
The mining method for extraction of M Reef resources is narrow vein, shallow dipping sub-level open stoping (SLOS). Electric scraping is employed to recover blasted material due to the shallow dip of the orebody. The extraction design incorporates a 1.1m slot rise that establishes each stope, with a 5 m wide square rib pillar between adjacent stopes. The slot rises are excavated as a blasted whinze rise. Where geotechnical considerations allow, intermediate rib pillars are incorporated to facilitate maximum extraction.
A minimum mining width of 1.8m was used to estimate planned dilution. All dilution material was assumed to have zero grade and a density of 2.7 t/m3.
Ore recovery was estimated for each stope based on its dip. The recovery factor is estimated using the formula (2 x Reef Dip in degrees + 10). Hence where the stope dips at 45º or steeper, all diluted material was deemed recoverable (2 x 45 + 10 = 100%), whereas for a reef dip of 30º, the recovery of diluted stope material was estimated at 70% (2 x 30 + 10 = 70%).
M Reef material is trucked to a surface stockpile in the vicinity of the portal. The open pit mining fleet rehandles the material to ROM stockpiles.

105 Newcrest Mining - Telfer Property Report - 31 December 2013
17 RECOVERY METHODS
Processing operations at Telfer initially commenced in 1977 as a gold leach operation that treated the oxidized ore near the surface of the deposit. A flotation plant was added in 1991 to separately process copper ore from the deeper zones in the deposit. Site operations were suspended in 2000 when the level of cyanide soluble copper in the gold ore essentially caused its processing to be uneconomic.
A subsequent feasibility study that was completed in November 2002 identified an optimum strategy for processing a combination of open pit and underground ore through a single treatment route. The rationale of this project assessment focused on maximizing the value that might be obtained from both the copper and the gold in the ore to generate a gold-bearing copper concentrate as well as gold doré. A new treatment plant was constructed on-site and commissioned in late 2004. Two products are generated, namely gold doré and a gold bearing copper concentrate, with approximately 25% of the Telfer gold production reporting to the doré and the balance reporting in the copper concentrate as based upon the average production statistics over the past five years.
Minor amounts of oxide ore are scheduled for processing in a dump leach operation as an adjunct to the main treatment route, with the dump leach output being incorporated within the overall gold doré production total.
The feed ore for the Telfer treatment plant is sourced from both open pit and underground mining operations. Owing to the range of ore types with differing mineralization of both gold and copper, together with variation in ore hardness, the treatment flowsheet is relatively complex. Two parallel process trains have been incorporated through the grinding and flotation circuits in the treatment plant which has a nominal throughput capacity of 20Mtpa of ore. In practice however, the throughput rate generally varies between 17Mtpa and 23Mtpa depending upon the ore characteristics. There is a general operating strategy to blend ore on the coarse ore stockpile in order to control the feed to the treatment plant in terms of the ore grade and hardness.
The general flowsheet schematic for each of the two parallel process lines is illustrated in Figure 17.1 from which the overall complexity of the treatment process may be noted. The circuit was designed to maximize the recovery of the value minerals, starting with a flash flotation and gravity recovery section within the grinding circuit intended to capture the coarse free copper and gold mineralization that is liberated early in the process route. The milled product from the grinding stage passes to the copper flotation circuit where the residual copper is recovered, together with a proportion of the gold that is associated with the copper minerals as well as a proportion of liberated gold. Approximately 5% of the gold in the ore is within the pyrite mineralization which reports to the copper circuit tailings. Tailings from the copper circuit are therefore processed through the pyrite flotation circuit from which the recovered pyrite concentrate is processed through a cyanidation leach circuit for final gold extraction. The gold is extracted from the leach liquor by means of adsorption onto activated carbon followed by stripping and electrowinning.

106 Newcrest Mining - Telfer Property Report - 31 December 2013
Figure 17.1 Telfer Treatment Plant - Basic Process Flow
The gold production from the overall Telfer operation for the past seven years is summarized in Table 17.1 where the distribution of the recovered gold between the different processing sequences can be seen.
Table 17.1 Telfer Gold Production Production
Year Ounces Distribution of Recovered Gold
(%) Gravity Dump Pyrite Conc. Total Gravity Dump Pyrite Conc. Total
2012-2013 128,411 30,718 16,681 349,690 525,500 24.4 5.8 3.2 66.5 100 2011-2012 138,074 17,491 20,855 636,696 540,115 25.6 3.2 3.9 67.3 100 2010-2011 165,070 5,508 27,048 423,668 621,291 26.6 0.9 4.4 68.2 100 2009-2010 189,789 6,966 35,509 456,646 688,909 27.5 1.0 5.2 66.3 100 2008-2009 161,573 19,604 24,390 423,540 629,108 25.7 3.1 3.9 67.3 100 2007-2008 150,606 32,583 24,349 382,677 590,217 25.5 5.5 4.1 64.8 100 2006-2007 168,504 34,109 31,866 392,601 627,077 26.9 5.4 5.1 62.6 100
The general production statistics for the treatment plant operation are summarized in Table 17.2 covering the eight year period since plant startup. It will be noted that the production output in terms of tonnes of copper and ounces of gold are consistent with increased proportions of West Dome transitional ore being processed in 2012 and 2013, with acceptable recoveries achieved through the installation of new regrind mills and cleaner cell installations. In the current financial year, the processing plant is treating Main Dome open pit ore again (Stage 4 Cutback) and gold recoveries are back to historic levels.

107 Newcrest Mining - Telfer Property Report - 31 December 2013
Table 17.2 Telfer Production Statistics Produc'n
Year Tonnes Milled
Feed Grade Conc. Grade Rec Cu (%)
Gold Recovery (%) Production
% Cu g/t Au % Cu g/t Au Grav. Flot'n Pyrite Leach
Total t Cu oz Au**
2012-2013 2011-2012 2010-2011
21,542,552 21,485,162 22,748,595
0.17 0.19 0.18
1.00 0.95 1.01
15.9 16.1 16.8
50.3 58.3 68.8
74.2 76.9 79.2
18.7 20.9 22.4
50.3 55.4 57.3
2.7 3.2 3.7
71.7 79.4 81.7
26,453 31,235 32,078
525,500 540,115 621,291
2009-2010 21,894,106 0.19 1.10 16.9 69.0 84.7 24.5 69.0 4.6 88.1 34,815 688,909
2008-2009 18,788,116 0.20 1.14 17.2 68.7 87.0 23.6 61.4 3.2 88.2 32,905 629,108
2007-2008 18,267,273 0.20 1.13 19.0 84.3 73.3 22.3 57.4 3.8 83.5 26,771 590,217
2006-2007 20,571,935 0.21 1.16 20.5 90.5 65.1 21.8 50.7 4.4 76.9 27,820 627,077
2005-2006* 20,620,359 0.28 1.18 25.5 97.9 66.2 19.0 60.0 2.6 81.6 37,775 639,607 * Excludes commissioning production from underground of 10,409 oz gold and 599 t copper **Includes dump leach.
Contemporary processing techniques and current day technology are utilized throughout the operation. The equipment is maintained to a high standard, consistent with good operating practice. With the plant having been constructed in 2004, the process equipment is modern, with individual items being generally of a large size as appropriate to the 20.5 Mtpa ore treatment rate that was averaged over the eight years since plant startup as noted in the production data reported in Table 17.2. Assessment of de-bottlenecking opportunities continues as a means of increasing the product output. The dual train nature of the plant design allows for duplication of equipment items and minimization of the necessary spare parts inventory.
Overall, the process plant is considered to be well managed and maintained according to contemporary operating standards.
108 Newcrest Mining - Telfer Property Report - 31 December 2013
18 PROJECT INFRASTRUCTURE
18.1 Access Roads
Roads used to access Telfer consist of public roads vested in Main Roads Western Australia and the Shire of East Pilbara and a private road owned and maintained by the Telfer Gold Mine. Road transport to and from Telfer generally focuses on either Port Hedland or Newman, with Port Hedland being of primary interest with respect to export of concentrates and import of consumables to the mine.
18.2 Tailings Management
The existing tailings storage facility 7 (TSF7) located at the Telfer Gold Mine, is described as an integrated waste landform in that the tailings storage is surrounded by a mine waste dump where the inner compacted embankment is constructed against, and supported by, the existing mine waste dump. TSF7 is approximately 2.5km in diameter. The embankment will be raised in 3m lifts using upstream construction methods to a final design height of approximately 60m.
18.3 Water Supply
Telfer mine site relies on abstraction of groundwater for its water supply to support various applications during operation. The water quality is segregated into two main types being raw and potable water. Telfer has five operating raw water borefields and three potable water borefields with hundreds of monitoring bores.
The raw water supply is derived from a network of 54 operating raw water production bores, located in five borefields, with an installed capacity of 80.1Ml/d. The current water delivery is approximately 57Ml/d.
The potable water supply is derived from six operating potable water supply production bores, located in three borefields, with an installed capacity of 6Ml/d.
An additional 2Ml/d of groundwater is derived from groundwater inflows reporting to the Telfer Underground operations. This water is of poor quality and is suitable for dust suppression purposes only.
The total annual abstraction from all water sources has a daily average of 57Ml/d, which can vary mainly depending on ore processing needs. Newcrest holds an abstraction license to take water from all of these bores.
18.4 Power Supply
There are currently two permanent power stations at Telfer. The Primary Power Station (PPS) comprises three GE LM6000 gas turbines and the Secondary Power Station (SPS) comprises eight diesel generators. The PPS was originally designed to operate in an N+1 configuration, that is, two duty and one standby. As the power demand has increased since commissioning of the PPS, there are currently 12 approximately 1MW Aggreko rental gas engines supplementing the LM6000s. The SPS is available as a backup.
The rated output of each gas turbine in normal mode is 43MW, but can be operated at 47MW in SPRINT mode. This provides a maximum rating of installed permanent power generation at Telfer of approximately150MW.

109 Newcrest Mining - Telfer Property Report - 31 December 2013
18.5 Gas Supply
Natural gas is transported from the Western Australian coast to Telfer via a 450 km purpose-built pipeline operated by APA Group. Gas is supplied under contract by Santos and Apache Energy. The contract is valid for supply to December 2019.
The supply pipeline for Telfer is illustrated in Figure 18.1.
Figure 18.1 Natural Gas Supply Network
The gas supply and transport network involves multiple supply points and utilizes capacity in multiple pipelines. Newcrest has contracted pipeline capacity of 26TJ/day.
18.6 Port Facilities
Concentrates produced at Telfer are exported from the port of Port Hedland. The substantial municipal port facilities at Port Hedland cater for the export of various mineral types from around the Pilbara region.
Newcrest established concentrate storage and ship loading facilities at the port. The operation of these facilities is contracted to a logistics contractor.
18.7 Other Site Infrastructure
The Telfer Operation includes a range of supporting infrastructure typical of a large remote mine site. The range of facilities includes an all-weather airstrip, accommodation and messing facilities, fuel storage facility, laboratory, workshops, stores building and lay-down areas, effluent disposal systems and administration offices.

110 Newcrest Mining - Telfer Property Report - 31 December 2013
19 MARKET STUDIES AND CONTRACTS
19.1 Newcrest Concentrate Characteristics
The Telfer copper concentrate typically assays 13% to 19% Cu. The gold-in-concentrate grade is estimated to assay between 50 g/t Au and 90 g/t Au. The concentrate contains arsenic which is controlled by blending to ensure the levels stay within levels acceptable to destination smelters.
19.2 Transport and Storage
Concentrate from Telfer is transported by road to Port Hedland. The concentrate is unloaded at Port Hedland and stored in an enclosed concentrate storage facility. The storage facility infrastructure is owned by Newcrest and is constructed on land under long term lease to Newcrest from the Port Hedland Port Authority. Concentrate shipments are made in parcels of approximately10,000wmt in most instances.
Newcrest seeks long-term contracts with reputable ship owners and/or operators to mitigate exposure to volatility in shipping charges, otherwise shipments are made on spot vessel charters.
The precious metal grades of Telfer concentrates are deemed high by industry standards, making these concentrates attractive to smelters that are efficient in their recovery of precious metals. This means that a large proportion of the gold and silver entering the smelting circuit should be recovered through in-house precious metals recovery facilities after the copper cathode production stage. For those smelters without such facilities, the tank-house slimes containing precious metals must be on-sold to a third party for refining, for which a commercial penalty may be incurred.
19.3 Newcrest Concentrate Destination Smelters
Telfer concentrate competes with concentrates from a number of large mines in the Asia-Pacific region, including Grasberg, Batu Hijau, Boddington and Ok Tedi. Telfer's geographical location provides a competitive advantage in terms of freight costs and delivery time to Asian markets compared to suppliers from Europe, Africa and the Americas.
Newcrest has long term relationships with most regional smelters in Japan and Korea and well as with certain smelters in China. Newcrest also has contracts with merchants in Switzerland and Singapore. Telfer concentrate sales contracts are currently in place with smelters in Japan, Korea, China and the Philippines. Two long-term contracts are also in place with merchants. Spot sales will also take place from time to time depending on product availability and market conditions.
19.4 Concentrate Treatment and Copper Refining Charges
For standard grade for copper concentrates (22% to 30% Cu), direct mine-smelter treatment charges over the past ten years have varied from US$45/t to US$92/t of concentrate, and refining charges from US¢4.5/lb to US¢9.2/lb payable Cu. These terms are for long term frame contracts between major producers and Asian smelters. The treatment and refining charges attributable to Telfer concentrates will vary according to the specification of the material sold and may, from time to time, exceed the above parameters.

111 Newcrest Mining - Telfer Property Report - 31 December 2013
19.5 Precious Metal Terms and Refining Charges
The quantity of gold payable by the smelter can vary widely. However, for smelters in Japan and Korea, a fairly standard scale of gold metal deductions has emerged over the years. This scale varies from no gold payable if the gold content is below 1 g/t, up to 97% to 97.5% of the gold payable if the gold content exceeds 20 g/t in the concentrate.
For very high gold contents of 50 g/t to 90 g/t, payable gold can be as high as 98.5%, as seen for some Newcrest concentrate sales. Contents in excess of 40 g/t to 50 g/t can reasonably expect to attract a payable rate of 97.5% to 98.00% of analytical gold content.
The level of refining charge is extremely important for high gold concentrates and this may be as high as US$8.00 per payable oz gold. Over the last 10 years, the refining charge for gold in Newcrest's long term contracts ranged from ~US$4.00/oz to ~US$6.00/oz.
19.6 Weighing, Sampling and Moisture Determination and Assays and Analyses
Weighing, sampling and moisture determination (WSMD) for provisional invoice purposes takes place at Port Hedland for shipments to all destinations. Generally, WSMD on shipments to Chinese and Indian smelters for final invoice purposes also takes place at Port Hedland. For smelters in the Philippines, Japan and Korea, WSMD for final invoice purposes is undertaken at the ports of discharge.
This differentiation between ports of discharge and receiving smelters is common in the market due to a lack of veracity in the accuracy of measurements and procedures at some ports of discharge. Where WSMD for final invoice purposes is undertaken at the port of loading, it is typical for a weight franchise of 0.10% to 0.25% to be deducted from the shipment weight (in favour of the buyer).
19.7 Doré
Gold doré bars contain approximately 70% to 90% gold with the balance as other precious metals such as silver, with a small amount of waste. The doré produced at Telfer is security transported by air freight from the mine site to a refinery for further processing.
The doré bars are smelted and refined to gold bars of 99.99% purity and silver bars. The refined silver is usually credited to the refiner to offset the refining cost or sold on the open market.
Within the Asia-Pacific region, there are a number of acceptable refineries which have the capacity to refine doré; in the West Australian Mint refinery (WAM) in Perth, WA, W.C Heraeus – Precious Metals in Hong Kong, Logam Mulia in Indonesia and new refineries in India as well as a number of established refineries in Europe and the Middle-East. Currently WAM in Perth is the preferred refiner.
19.8 Marketing Resources
Newcrest's Marketing & Freight Department is based in Melbourne, Australia. Transactions are executed using the MineMan system and revenue and costs are recorded in the overall accounting system SAP. Marketing intelligence is currently sourced from Wood Mackenzie, Platt’s and Metal Bulletin. Other publications are also considered from time to time.

112 Newcrest Mining - Telfer Property Report - 31 December 2013
20 ENVIRONMENTAL STUDIES, PERMITTING AND SOCIAL OR COMMUNITY IMPACT
20.1 Overview
Telfer is a relatively large (total disturbance more than 4,000 ha) and complex operation, but is not confronted by environmental or community challenges likely to significantly constrain current and future operations. This reflects its remote, desert location and an absence of significant biodiversity and conservation issues, together with a proven history for responsible environmental management. Sound relationships have been developed with the indigenous traditional landowners (Martu), who hold one of the largest Native Title Determinations in Australia over Telfer and its associated tenements.
Statutory environmental approvals are obtained and environmental performance is reported to regulators through standard protocols for assessment of monitoring results. Compliance is supported by the ongoing implementation of environmental management plans to manage key risks.
Some mine waste is potentially acid forming, but this material is effectively managed through progressive encapsulation in purpose-designed waste stockpiles. Moreover, the low rainfall climate further reduces the risk of Acid and Metalliferous Drainage (AMD). Acid drainage from PAF tailings is a small risk in the medium term but is an important consideration for long term mine plans and closure planning
Terrestrial ecosystems carry few rare or otherwise conservation-sensitive species, and ground disturbance is carried out in accordance with government issued clearing permits, based on detailed flora and fauna assessments. An ongoing program of stygofauna and troglofauna (groundwater and cave dwelling fauna) continues to demonstrate the low probability of the project having significant impacts on the local and regional subterranean ecosystems.
Water supply from regional groundwater systems involves total abstractions significantly smaller than licensed amount of 29.7Gl per annum, and the lack of other potential users of this resource makes socio-political concerns about resource allocation an improbable occurrence.
A closure plan was developed in 2010 for Telfer and is scheduled to be updated in 2014.
Opportunities to utilise the mining fleet have been taken into consideration during closure option analysis. However, the availability of the fleet for closure activities is dependent on mine plans to maximise ore recovery. Engineering options for appropriate rehabilitation of tailings storage facilities is also a key component of closure planning.
20.2 Individual Environmental Issues
20.2.1 Environmental Approvals
Statutory approvals under the Western Australian Environmental Protection Act (EP Act) provide the umbrella approval for the project. These approvals are reflected in Ministerial Approvals (issued by the Minister for the Environment - Nos. 605 and 606). The approvals include both environmental commitments made by Newcrest and conditions applied by the Minister acting primarily on the recommendations of the Environmental Protection Authority (EPA), which coordinated detailed assessment by government agencies of potential
113 Newcrest Mining - Telfer Property Report - 31 December 2013
environmental impacts and proponent-proposed management plans to manage those impacts.
Performance against Ministerial Approval conditions is reported on a regular basis and reviewed by government. No significant non-compliance has occurred.
Beneath the EP Act approval are secondary permits and licenses. An EP Act license (to operate), issued by the Department of Environment Regulation (DER) contains environmental performance conditions which are being met without significant non-compliance.
DER, or the Department of Mines and Petroleum (DMP) on authority delegated by DER, also issues clearing permits as required. These permits are assessed on the basis of flora and fauna studies conducted by Telfer, against a local and regional conservation-estate background.
The project is also governed through approval of mining proposals which are approved by the DMP under the Mining Act. This approval has a strong focus on closure and rehabilitation, as well as other technical mining-environmental issues, and can only be obtained after satisfaction of EP Act requirements; it is in that sense secondary to the EP Act approval.
Licenses to abstract groundwater are issued by the Department of Water (DoW), and subject to regular review of performance, especially in terms of quantitative and qualitative impacts on the local and regional water resource. No significant negative impacts are reported, in fact, the volume of groundwater abstracted by Telfer is well below the licensed volume.
Other, minor licenses and permits (dangerous goods, poisons, etc.) are obtained and managed on a routine basis.
20.2.2 Management of Acid Forming Waste
On a life-of-mine basis, approximately 20% of mine waste is PAF. While the desert environment minimizes the risk of significant generation of acid drainage, the PAF material is managed on an ongoing basis to mitigate the potential for future liabilities. As part of the mine plans, PAF material is delivered to specific stockpiles with non-acid forming (NAF) and acid-consuming (AC) waste. Monitoring to date has shown no evidence of significant generation of AMD.
The PAF material is placed on a separately drained base of NAF/AC material. The ultimate depth of NAF/AC cover is guided by ongoing studies aimed at facilitating construction of engineered 'store-and-release' covers which allow infiltrated rainfall to be evaporated from the cover soil and/or transpired by the vegetation established on the stockpiles, thereby avoiding passage of sufficient water and oxygen into the stockpile core to oxidize the sulphides in the PAF material and produce AMD.
Some tailings are also PAF, but the risk of generation of acid drainage from tailings has been assessed as low and long term management of tailings is the subject of ongoing studies allied with those described above for PAF mine waste.
114 Newcrest Mining - Telfer Property Report - 31 December 2013
20.2.3 Water Supply and Management
Telfer's water supply is sourced from local groundwater with decant return from the TSF offsetting the demand to some extent. Groundwater is abstracted in accordance with a license issued by DoW and involves annual reporting of volumes used, impacts on groundwater levels and assessment of chemical quality. With no other potential users of significant quantities of groundwater in this sparsely populated area, reduced access to this resource is assessed as low.
No significant impacts on groundwater levels and quality have been measured. Changes that do occur generally reflect irregular recharge from low frequency but high volume rainfall events associated with the passage of tropical cyclones or the rain bearing depressions into which those cyclones transform during passage inland from the Pilbara coast.
The aquifers around Telfer are confined and have little connection to local regional aquifers.
Groundwater monitoring around operational areas, especially the TSF, show no significant negative impacts on quality to date. Should such impacts develop, interception and use in the process of contaminated groundwater would protect the broader environment. After decommissioning, the groundwater mound beneath the TSF will naturally subside, decreasing the risk of long term, broad scale impacts.
20.2.4 Closure and Rehabilitation
The Closure Plan for Telfer is reviewed and updated to meet regulatory and corporate requirements on an on-going basis. Ongoing studies to support closure planning include landform stability and the design of 'store-and-release' covers to ensure long term isolation of PAF material from water and oxygen ingress that could produce AMD. Kinetic (column leaching) studies of PAF material (mine waste, tailings and dump leach material) are also conducted as required, to more accurately define the potential risk of AMD and design of control measures. Landform studies centre on replication of locally occurring mesas as the basic design for structures, especially waste stockpiles. The mesa model involves steep slopes at the top of the structure, decreasing downslope to create a concave batter. Studies on natural mesas identify size distribution of surface rocks and other soil components with downslope distance, to provide requisite landform stability. Other studies identify the abundance and diversity of plant species on natural local landforms.
Trials were conducted to assess the stability against erosion of different surface treatments clearly demonstrating that mixing blocky sandstone/quartzite material (greater than 100mm diameter) with topsoil (rock mulch) provides superior stability, and thus superior plant establishment, compared with topsoil treatment alone. However, the processes for practical application of this methodology as part of long term landform designs are still being considered along with alternative options (e.g. spreading blocky material as an armour, especially on the steeper upper slopes of constructed mesas, either with topsoil underneath, or without topsoil and allow weathering to provide niche habitats for plant establishment over time).
A closure plan was developed in 2010. The 2010 closure cost estimate was developed, based on detailed work programs and unit costs typical of the regional industry. The closure plan is scheduled for update in 2014. The current plan was based on detailed designs for different areas (waste stockpiles, TSFs, dump leach pads, process area, etc.) and realistic unit costs for the various closure and rehabilitation activities required. This estimate was based on the assumption that the current mining fleet would be used to construct 'store-
115 Newcrest Mining - Telfer Property Report - 31 December 2013
and-release' covers and rock-topsoil armour covers. Updates to the plan would assess the validity of this assumption and consider whether alterative options for construction of covers may be required.
The mine rehabilitation and restoration provision for the Newcrest Group at 30 June 2013 was A$317M.
20.2.5 Community and Social Issues
The Traditional Owners of the land where Telfer is located are known collectively as the Martu people and they have been granted a native Title Determination over a very large area of land (only slightly smaller than NSW) which completely encompasses the Telfer tenements. The original Telfer tenements were established prior to 1994 and are therefore held to have extinguished Native Title, but some of the more recent tenements granted, and areas of potential future interest, will be subject to the Right To Negotiate provisions of the Native Title Act.
Agreements were in place with the Martu people in respect of Telfer for the purposes of the Telfer expansion project (2002-2005). There are current negotiations underway to seek to put in place a comprehensive agreement to support future operations at Telfer.
20.2.6 Other Environmental Issues
Compliance with statutory requirements for occupational health and safety generally ensures that environmental noise standards for potential impacts on offsite receptors are easily met. Moreover, the location of the accommodation centre, remote from the mine and plant area, and the absence of near neighbours, eliminates amenity impacts.
Air quality is not considered to be a major environmental hazard. Fugitive dust is controlled using spray-equipped trucks on high traffic areas. Natural gas is used to generate most of the site's power requirements.
Spills and incidents are tracked as part of regular environmental reporting to the regulator and corporate. Where incidents or spills occur they are remediated and prevention measures applied.
The landfill facility is managed as part of ongoing operations related to the large FIFO population of employees at Telfer. An electric fence has been installed around the facility to prevent access by dingoes (wild dogs) and this is supplemented by a near daily backfilling of waste material as required by licence conditions. Telfer operates programs aimed at workforce awareness of dingo ecology and discourages activities which would foster population growth (e.g. feeding) and ingress into inhabited areas.

116 Newcrest Mining - Telfer Property Report - 31 December 2013
21 CAPITAL AND OPERATING COSTS
Production and operating costs for Telfer for FY2011 to FY2013 are set out in Table 21.1. The Newcrest financial year closes on 30 June each year.
Table 21.1 Historical Production and Costs per Ounce of Gold Produced Telfer Unit 2011 2012 2013
Gold Production oz 621,291 540,114 525,500
Mine A$/oz 492 820 951
Mill A$/oz 346 408 476
Administration and Others A$/oz 138 179 191
Third Party Smelting Refining and Transportation A$/oz 103 127 114
Royalties A$/oz 56 61 56
By Product Credits A$/oz -463 -472 -387
Waste Stripping and Ore Inventory Adjustments A$/oz 2 -339 -377
Cash Cost A$/oz 674 783 1,022
Depreciation and Amortization A$/oz 291 333 389
Total Cost A$/oz 965 1,116 1,411
Telfer actual production and operating costs for FY2013 are shown in Table 21.2.
Table 21.2 Telfer Operations Gold and Copper Production, FY 2013*
Telfer Unit FY13 Actual Gold Production koz 525 Copper Production kt 26 Total Site Cash Costs A$M 850 Waste Stripping and Ore Inventory A$M -198 Third Party Smelting, Refining and Transporting A$M 60 Royalty A$M 29 Depreciation A$/oz 389
*Costs included in table exclude applicable by-product credits.
Capital expenditure for FY2011 to FY2013 is set out in Table 21.3.
Table 21.3 Telfer Operations Historical Capital Expenditure Telfer FY 2011 Actual
A$M FY 2012 Actual
A$M FY 2013 Actual
A$M Site Expenditure* 66.5 96.3 83.4 Major Projects 10.0 138.2 114.9 Total Capital Expenditure 76.5 234.5 198.3
*Site expenditure excludes capital relating to production stripping activity

117 Newcrest Mining - Telfer Property Report - 31 December 2013
FY2014 cost and capital guidance for Telfer, as released 12 August 2013, is shown in Table 21.4.
Table 21.4 Telfer Operations FY 2014 Cost and Capital Guidance
Telfer Unit FY14 Guidance Cash cost (including by-product credits) 1 A$M 490-540 On-site exploration expenditure A$M 10-11 Production Waste stripping A$M 20-25 Sustaining capital A$M 60-70 Corporate, rehabilitation, other A$M 11-17 All-in sustaining cost A$M 590-660 Production Waste Stripping2 A$M 20-25 Sustaining Capital2 A$M 60-70 Projects and development capital A$M - Total capital expenditure A$M 80-90
1 Costs assume AUD:USD 0.96, copper price US$3.30/lb, silver price US$22.0/oz 2 Duplicated above under All-in sustaining costs and under Capital expenditure

118 Newcrest Mining - Telfer Property Report - 31 December 2013
22 ECONOMIC ANALYSIS
Telfer is an established mining operation with both underground and open pit mining operations.
In the reporting year to June 2013, the Newcrest realized gold price was A$1,550/oz and copper price was A$3.38/lb. Telfer's cash cost of production for the same period was A$1,022/oz after applying copper credits.
As a producing issuer Newcrest is not required to provide an economic analysis as provided in Item 22 of NI 43-101 Form 1.

119 Newcrest Mining - Telfer Property Report - 31 December 2013
23 ADJACENT PROPERTIES
Properties adjacent to Newcrest's Telfer tenements have no material impact on Telfer's Mineral Resources or Mineral Reserves.

120 Newcrest Mining - Telfer Property Report - 31 December 2013
24 OTHER RELEVANT DATA AND INFORMATION
No additional data or information is required to make the Report understandable and not misleading.

121 Newcrest Mining - Telfer Property Report - 31 December 2013
25 INTERPRETATION AND CONCLUSIONS
Telfer Gold Mine is an established operation with a long history to support development of plans to exploit the available Mineral Resources.
Factors that may have a material impact on the Telfer Gold Mine include those discussed in the risks section of Newcrest’s annual operating and performance review which forms part of Newcrest’s Full Year Financial Results for the year ended 30 June 2013, which can be found on its website at www.newcrest.com.au and at www.sedar.com.
122 Newcrest Mining - Telfer Property Report - 31 December 2013
26 RECOMMENDATIONS
Telfer is an established mining operation with Mineral Reserves sufficient for an extended mine life. In view of the nature of Telfer's mining operations and the substantial Mineral Reserve inventory, no significant recommendations are included.

123 Newcrest Mining - Telfer Property Report - 31 December 2013
27 REFERENCES
AMC Consultants (Canada) Ltd 31 December 2011 Technical Report on the Telfer Property, Western Australia, Australia. NI43-101 Technical Report.
AMC Consultants Pty Ltd, June 2012: Telfer Strategic Review.
Beck Engineering, July, 2013: CONCEPTUAL ANALYSIS OF A FLAT DIPPING SLC concept for the Western Flank.
Bennelongia 2009: Stygofauna Monitoring report.
Chamberlain, 1990 (page 22)
Department of Environmental and Conservation 2007: Licence issued under Environmental Protection Act 1986.
Department of Mines and Petroleum 2009: Inspection Report (letter to Newcrest dated 23 June 2009.
Excel file: West Dome Bulk Sample Metallurgical Results 2011.
GHD Pty Ltd, October 2011, "Power Generation and Distribution Expansion Options, Phase 2 Options Assessment Report", Draft Internal Report
Minister for the Environment and Heritage 2002: Implementation approval statement No. 605 issued 1 October 2002.
Minister for the Environment and Heritage 2002: Implementation approval statement No. 606 issued 1 October 2002.
MWH 2010: Annual Borefield Monitoring Review 2009-2010 GWL No. 150758(9).
Newcrest Mining Limited (Aug 13) 2012/13 Full Year Financial Results Presentation. Greg Robinson (Managing Director and CEO) and Gerard Bond (Finance Director and CFO)
Newcrest Mining Limited (Jul 13) June 2013 Quarterly Report, www.newcrest.com.au
Newcrest Mining Limited (Jul 12) June 2013 Quarterly Report, www.newcrest.com.au
Newcrest Mining Limited (Sep 13) 2013 Annual Report, www.newcrest.com.au
Newcrest Capital Expenditure Reconciliation (SAP), FY13, FY12, FY11
Newcrest 2004: Telfer Operations - Waste Dump Management Plan TP-REP-10-MN-0014_A
Newcrest 2007: Telfer Operations - Acid & Metalliferous Drainage: Encapsulation & Monitoring Procedure E10-02 15 PRO_2.
Newcrest 2009: Telfer Operations - Subterranean Fauna Management Plan (2009-2013) E08-01 19 PLA_3.
Newcrest 2010: Annual Environment Report 1 July 2009 – 30 June 2010 700-600-EN-REP-0026
Newcrest 2010: Telfer Operations - Port Hedland Copper Concentrate Facility Annual EMP Audit Report 2011 E26 108 REP.

124 Newcrest Mining - Telfer Property Report - 31 December 2013
Newcrest 2011: Bonds Status (internal report).
Newcrest Mining Limited. 2010, O'Callaghans Concept Study Progress Update, September 2010, Newcrest Mining Limited unpublished report.
Newcrest Mining Limited. 2013, Telfer Main Dome Underground Area Mineral Resource Re-Estimate, Internal Newcrest Mining Limited Report.
Newcrest Mining Limited. 2014, Telfer Deeps MR December 2013 Ore Reserves L1 L2 Report, AUS TEL MRF OR 12-13, Newcrest Mining Limited unpublished report.
Newcrest Mining Limited. 2014, Telfer Deeps SLC December 2013 Ore Reserves L1 L2 Report, AUS TEL SLC OR 12-13, Newcrest Mining Limited unpublished report.
Newcrest Mining Limited. 2014, Telfer Deeps VSC December 2013 Ore Reserves L1 L2 Report, AUS TEL VSC OR 12-13, Newcrest Mining Limited unpublished report.
Newcrest Mining Limited. 2014, Telfer Deeps EXT to SLC December 2013 Ore Reserves L1 L2 Report, AUS TEL WFL OR 12-13, Newcrest Mining Limited unpublished report.
Newcrest Mining Limited. 2014, TEL OP December 2013 JORC Code 2012 edition level 1 and 2 Report and Table 1 Report , AUS TEL MDO/WDO OR 12-13, Newcrest Mining Limited unpublished report.
Site_Weekly_Info_-_FY13_-_TEL_-_Rev_0.xlsx
Newcrest Mining Limited. August 2011, "Full Year Results 2010 – 2011" Presentation by Greg Robinson (Newcrest MD and CEO)
Newcrest Mining Limited. Camp Dome Mineral Resource Estimate Telfer Gold Mine, Western Australia. September 2011. Internal Newcrest Mining Limited Report
Newcrest Mining Limited. O'Callaghans Mineral Resources and Ore Reserves Report 2010. Internal Newcrest Mining Limited Report
Newcrest Mining Limited. Stratagem 2011: Telfer Optimization Project and O'Callaghan's/Trotman's Project Approvals Strategy
Newcrest Mining Limited. Telfer Gold Mine 2010: Closure Cost Assessment 2010 (internal report).
Newcrest Mining Limited. Telfer Main Dome Open Pit Area Mineral Resource Estimate Telfer Gold Mine, Western Australia. September 2011. Internal Newcrest Mining Limited Report
Newcrest Mining Limited. Telfer Project Feasibility Study, Nov 2002, Internal Newcrest Mining Limited Report
Newcrest Mining Limited. Telfer Underground External to SLC Mineral Resource. July 2011. Internal Newcrest Mining Limited Report
Newcrest Mining Limited. Telfer Vertical Stockwork Corridor Mineral Resources Report 31 July 2011. Internal Newcrest Mining Limited Report
Newcrest Mining Limited. Telfer West Dome Open Pit Area Mineral Resource Estimate Telfer Gold Mine, Western Australia. September 2011. Internal Newcrest Mining Limited Report

125 Newcrest Mining - Telfer Property Report - 31 December 2013
pdf file: Monthly Telfer Operations Report June 10
pdf file: Monthly Telfer Operations Report June 11 XLIT
pdf file: Telfer Ore Processing Costs
pdf file: Telfer Ore Processing Historical FY Results – Data
Tyrwhitt 1995 (page 22).

126 Newcrest Mining - Telfer Property Report - 31 December 2013
28 QUALIFIED PERSON’S CERTIFICATE
Colin Moorhead Newcrest Mining Limited Level 8, 600 St Kilda Road MELBOURNE VIC 3004
I, Colin Moorhead, BSc, FAusIMM, do hereby certify that I am Executive General Manager, Minerals, employed by Newcrest Mining Limited.
1. I am a graduate of the University of Melbourne and hold a Bachelor of Science (Hons.) in Geology with a geophysics major.
2. I am a Fellow of the Australasian Institute of Mining and Metallurgy.
3. I have worked as a geologist for a total of 27 years since my graduation from university. My relevant experience includes 18 years fulfilling the roles of exploration geologist, mine geologist, geology manager and technical services manager at Newcrest's Australian open pit and underground mining operations, two years as geology manager at Newcrest's Indonesian mining operation, two years as General Manager Technical Services responsible for technical excellence and resources and reserves governance and six years in the role of Executive General Manager, Minerals responsible for exploration, mine geology and resources and reserves governance throughout Newcrest.
4. I have read the definition of "Qualified Person" set out in National Instrument 43- 101 (NI 43-101) and certify that by reason of my education, affiliation with a professional association (as defined in NI 43-101) and past relevant work experience, I fulfil the requirements to be a "Qualified Person" for the purposes of NI 43-101.
5. I am responsible for the preparation of the Technical Report titled Technical Report on the Telfer Property, dated 31 December 2013. I visited the Telfer Project between 13 and 14 January 2014.
6. I have had prior involvement with the property that is the subject of the Report. This involvement is via my role as Executive General Manager, Minerals with Newcrest between 2008 and present, as well as fulfilling the roles of Mine Geologist, Supervisor Underground Geology, Superintendent Open Pit Geology and Chief Geologist at Telfer Gold Mine between 1991 and 1997.
7. I am not independent of the issuer applying all of the tests in Section 1.5 of National Instrument 43-101.
8. I have read National Instrument 43-101 and Form 43-101F1, and the Report has been prepared in compliance with that instrument and form.
9. As of the effective date of the Report, to the best of my information, knowledge and belief, the part(s) of the Report for which I am responsible contains all scientific and technical information that is required to be disclosed to make the Report not misleading.
31 December 2013
Original signed by
Colin Moorhead