“Achieving E-Quality in the ICT Sector” UNIFEM/Cisco Gender Initiative
Upload
neil-lawrenceCategory
view
214download
1
1
UNIFEM I Project
Portrait of Gender, Race and Ethnicity
Guatemala
Country
Report
Diana Sawyer (Coordinator)Luana GoveiaRicardo Martini

The Portrait of Gender, Race and Ethnicity in Selected Latin American Countries: a comparative study for
Brazil, Bolivia, Guatemala and Paraguay project is the result of a partnership between the United Nations
Development Fund for Women (UNIFEM) and Cono Sur and the International Policy Centre for Inclusive Growth
(IPC-IG).
2
UNIFEM I Project

It is a descriptive work depicting the life condition of specific
population groups in four Latin American countries defined by
ethnicity, sex and urban or rural place of residence.
3
WHAT ARE THE PORTRAITS ABOUT?

- To show the levels of inequality that some groups such as women,
indigenous, afro-descendants, and rural population experience in the
selected countries;
- To emphasizes the socio economic differentials among those
groups without seeking for an explanation of the disadvantages of one
group in relation to the other but to picture the inequalities and to
provide inputs for more in-depths studies in further researches
focused on gender, race/ethnicity and inequality.
4
OBJECTIVES OF THE PORTRAITS

- Introduction- Historical and Population Background;-Socio-Economic Indicators:
- Composition and Socio-Economic Differentials of the Households (Household Arrangements and Socio Economic Conditions, the Quality of the Houses and the Sanitary Infrastructure, and the Household Durable Goods and Digital Exclusion); - Socio-Economic Differentials of Individuals (Health and Social Security, Education, Labor Market, Domestic Labor, and Poverty and Inequality of Income Distribution);
- Appendix 01: Concepts and Definitions;- Appendix 02: Methodological Considerations;- Appendix 03: List of Tables.
5
STRUCTURE OF THE PORTRAITS

6
PORTRAITS Project
GUATEMALA COUNTRY REPORT
SOURCE OF THE SOCIO-ECONOMIC INDICATORS: ENCOVI 2006. AUTHORS’ CALCULATION.SOURCE OF THE POPULATION BACKGROUND: CENSO NACIONAL DE POBLACIÓN Y DE HABITACIÓN.
1950, 1964, 1973, 1981, 1994, 2002, 2006. AUTHORS’ CALCULATION.

The historical background contextualizes the roots of current
inequality in the Guatemalan society as the current lack of
economic opportunities and consequently the higher levels of
poverty found in the indigenous population have a close link with
historical patterns of exclusion in this country.
7
HISTORY

The Peace Agreements were signed in December 1996 and
represented the end of 36 years of Civil War. More than the end of
the war the agreements constituted a turning point in the path of the
development in Guatemala as they aimed not only to officially end
the armed conflict, but to reverse the country’s historically
exclusionary pattern of development.
However, all the acknowledgments and achievements about the
vulnerable and marginal situation of some social groups as well the
high incidence of poverty in the country are not being enough to
effectively deal with the problems due to the lack of institutional
capacities of the state to fulfill all the provisions of the agreements.
8
HISTORY

-The urbanization rate has been increasing since 1950. In the last
Census year (2002), the rate was 46% and the estimate for 2006 is
48%;
- The urban population grew at an average rate of 3.9% in the period
1950 to 2006 and the rural population average growth rate was 2%;
- The high dependency rate of the indigenous and rural areas residents,
96% and 103% respectively, indicates that there is a lack of indigenous
young adults. Those facts point toward a high rate of indigenous adult
mortality and outmigration.
9
POPULATION
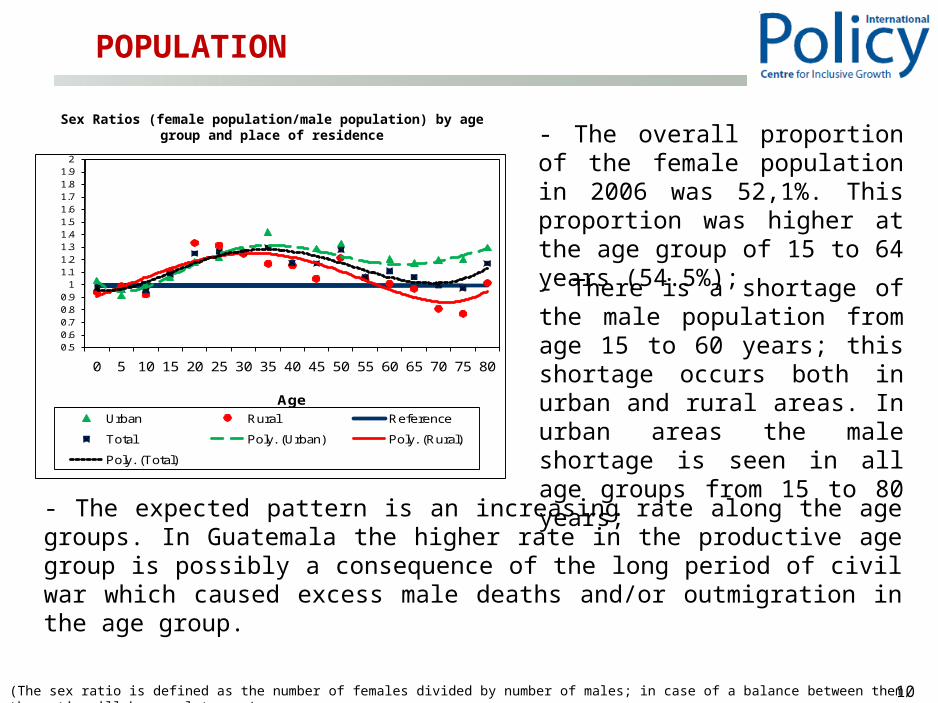
- There is a shortage of the male population from age 15 to 60 years; this shortage occurs both in urban and rural areas. In urban areas the male shortage is seen in all age groups from 15 to 80 years;
10
POPULATION
0.50.60.70.80.9
11.11.21.31.41.51.61.71.81.9
2
0 5 10 15 20 25 30 35 40 45 50 55 60 65 70 75 80
Age Urban Rural Reference
Total Poly. (Urban) Poly. (Rural)
Poly. (Total)
Sex Ratios (female population/male population) by age group and place of residence - The overall proportion of the
female population in 2006 was 52,1%. This proportion was higher at the age group of 15 to 64 years (54.5%);
- The expected pattern is an increasing rate along the age groups. In Guatemala the higher rate in the productive age group is possibly a consequence of the long period of civil war which caused excess male deaths and/or outmigration in the age group.
(The sex ratio is defined as the number of females divided by number of males; in case of a balance between them, the ratio will be equal to one) .

11
POPULATION
- The population of Guatemala in 2002 was young, 41% with ages between 0 and 14 years; 54% between 15 and 64; and 5% above 64 years. That age composition reflects directly in dependency rates;- The figures for rural areas residents clearly indicate the reduced size of the population in economically productive ages vis a vis the high proportion of children predominantly in the rural places, possibly due to the higher mortality of the young adults combined with outmigration.
Age Group
Sex Ethnic Group Place of Residence Total Population
Male Female Non-indigenous Indigenous Urban Rural0-14 50.9% 49.1% 58.8% 41.2% 41.9% 58.1% 100.0% 5,380,225
15-59 45.5% 54.5% 63.6% 36.4% 52.6% 47.4% 100.0% 6,990,970 65+ 48.9% 51.1% 65.1% 34.9% 51.9% 48.1% 100.0% 616,633
Total 47.9% 52.1% 61.7% 38.3% 48.1% 51.9% 100.0% 12,987,828
Age Group
Sex Ethnic Group Place of ResidenceTotal
Male Female Non-indigenous Indigenous Urban Rural
0-14 2,737,458 2,642,767 3,163,490 2,216,735 2,254,316 3,125,910 5,380,226
15-64 3,181,963 3,809,007 4,448,506 2,542,464 3,676,004 3,314,966 6,990,970 65+ 301,411 315,223 401,679 214,954 320,259 296,375 616,634
Total 6,220,832 6,766,997 8,014,691 4,973,138 6,250,578 6,737,251 12,987,829
Dependency Ratio 95.5% 77.7% 80.1% 95.6% 70.0% 103.2% 85.8%Child Dependency Ratio 86.0% 69.4% 71.1% 87.2% 61.3% 94.3% 77.0%Aged Dependency Ratio 9.5% 8.3% 9.0% 8.5% 8.7% 8.9% 8.8%
Population estimates and dependency ratios by sex, ethnic group, place of residence and age groups
Sex, ethnic and place of residence composition by age group

POPULATION
- The population pyramids are typical of a population with high natality and high
mortality in the past with no evidence of substantive decline of the fertility;
- There is a clear shortage of men older than 15 years, especially in the
productive age group of 15 to 64 years old;
- The pattern does not differ for urban and rural population, although the high
natality and the shortage of adult males are more accentuated in the rural area.12
Population composition by age and sex and place of residence.
Total Population
Urban Residence Rural Residence

13
POPULATION
-The sex ration by age group confirms for both indigenous and non-indigenous population the shortage of male population;
- For the indigenous population the shortage is clearly at the economically productive age and for the non-indigenous population it extends to the older ages.
50%
60%
70%
80%
90%
100%
110%
120%
130%
140%
150%
160%
170%
180%
190%
200%
0 5 10 15 20 25 30 35 40 45 50 55 60 65 70 75 80
Age Non-Indigenous IndigenousReference Poly. (Non-Indigenous)Poly. (Indigenous)
Sex Ratio by 5 year age groups and ethnic group

14
POPULATION
- 38.4% of the population self-identified as indigenous;- Historically, there is a considerable loss on representativeness of the indigenous population in Guatemala;- Regarding the spatial distribution rural areas are considered as the indigenous population’s place of residence: 67% of the indigenous population lived in rural area, whereas 42% of the non-indigenous did so;- The ethnic composition of urban and rural areas was 74% and 50% of non-indigenous respectively.
Place of Residence
Ethnic Group Non-
Indigenous
Column Percent
Indigenou
s Column Percent Total
Column Percent
Urban 4,619,186 58%
1,631,392 33%
6,250,578 48%
Row percent 74% 26% 100%
Rural 3,394,490 42%
3,342,761 67%
6,737,251 52%
Row percent 50% 50% 100%
Total 8,013,676 100%
4,974,153 100%
12,987,829 100%
Row percent 62% 38% 100%
Population by ethnic group and place of residence

- The population pyramids for indigenous and non-indigenous people are quite similar;- The pattern of sex and age distribution for the non-indigenous and indigenous population has a typical configuration of high past mortality and fertility rates;- The indigenous population pattern indicates high mortality and fertility with no indication of a substantial decline in the latter;- High adult mortality and possibly combined with outmigration are reasonable hypothesis.
15
POPULATION
Indigenous Population
Non-indigenous Population

-The total fertility rate for Guatemala was 3.4 children per woman. The non-indigenous women fertility was estimated at 3.0 and at 4.6 for indigenous women, which means 53% higher fertility the indigenous;
- The probability of death from birth to the age of five years for indigenous children was estimated at 71 deaths per 1000 live births, which corresponded to a rate 55% higher than for the non-indigenous estimate of 46. The overall rate for both groups was 57.
16
POPULATION
Ethnic Group Total Fertility RateChild Mortality Rate by
1000
Indigenous 4,6 71
Non-Indigenous 3,0 46
Total 3,4 57
Indigenous/Non-indigenous 1.53 1.55
Total Fertility Rates and Child Mortality Rates (probability of death from birth to the age five) by ethnic group
(Total fertility rate can be interpreted as the number of children a woman will have at the end of the reproductive age, under the assumption of no woman mortality in the period).

- The number of estimated households in 2006 was of 2,651,249 of them 77.4% was headed by a male, 64.5% by non indigenous and 53.7% were located in urban areas. - 63.6% of the households were composed by a couple with children headed by a male (the most prevalent arrangement), followed by households headed by a female with children and without a husband (17,4%);- The tendency was to have higher number of households headed by non indigenous and located in urban areas. 17
SOCIO-ECONOMIC INDICATORS: HOUSEHOLDS
A) COMPOSITION OF THE HOUSEHOLDS
Head of Household's Sex and Household Type
Ethnicity and Place of ResidenceIndigenous Non-indigenous Total
Urban Rural Total Urban Rural Total Urban Rural TotalMale
With wife and children 9.0% 16.1% 25.2% 22.7% 15.7% 38.4% 31.8% 31.8% 63.6%With wife and no children 0.6% 1.4% 2.0% 3.8% 2.0% 5.8% 4.5% 3.3% 7.8%Without wife with children 0.3% 0.3% 0.6% 1.0% 0.5% 1.5% 1.2% 0.8% 2.0%Without wife no children 0.6% 0.5% 1.1% 1.9% 1.0% 2.9% 2.5% 1.5% 4.0%
Total 10.5% 18.3% 28.8% 29.4% 19.1% 48.5% 40.0% 37.4% 77.4%Female 0.0% 0.0% 0.0% 0.0% 0.0% 0.0% 0.0% 0.0% 0.0%
With husband and children 0.1% 0.1% 0.2% 0.5% 0.3% 0.7% 0.6% 0.3% 0.9%With husband and no
children 0.0% 0.0% 0.0% 0.1% 0.1% 0.1% 0.1% 0.1% 0.2%Without husband with
children 2.3% 3.2% 5.5% 7.9% 3.9% 11.8% 10.2% 7.1% 17.3%Without husband no children 0.5% 0.5% 1.0% 2.4% 1.0% 3.3% 2.9% 1.5% 4.3%
Total 2.9% 3.8% 6.6% 10.9% 5.2% 16.0% 13.7% 8.9% 22.6%TOTAL 13.4% 22.1% 35.5% 40.3% 24.2% 64.5% 53.7% 46.3% 100.0%
Type of household by sex of the head, ethnic group of the head and location of the household

-The average years of schooling attained by the heads of the households were of 4.58 years;- The most educated was the male, non indigenous who lived in urban areas with the wife and children (8.05 years) whereas the least educated head was the single, indigenous female with children who lived in rural areas (0.0);- The general tendency was a higher education for heads of households located in urban areas as compared to their counterparts of the rural areas The non indigenous heads were more educated than their correspondent indigenous and the same pattern for the males head of the households.
18
SOCIO-ECONOMIC INDICATORS: HOUSEHOLDS
A) COMPOSITION OF THE HOUSEHOLDS
Head of Household's Sex and Household Type
Ethnicity and Place of Residence
Indigenous Non-indigenous Total
Urban Rural Total Urban Rural Total Urban Rural TotalMale
With wife and children 4.44 2.18 2.99 8.05 3.29 6.11 7.02 2.72 4.87With wife and no children 3.16 1.19 2.14 7.07 2.53 5.53 6.50 1.98 4.57Without wife with children 2.19 0.98 2.20 6.95 1.43 5.11 5.92 1.25 4.07Without wife no children 4.72 1.90 3.10 7.36 1.59 5.43 6.75 1.69 4.88
Total 4.32 2.08 2.89 7.84 3.07 5.97 6.91 2.59 4.82Female
With husband and children 2.61 0.67 1.83 4.56 1.47 3.48 4.24 1.31 3.19With husband and no children 0.00 0.00 0.00 7.56 0.91 4.37 6.56 0.84 3.91Without husband with children 2.01 0.83 1.32 6.22 2.51 5.00 5.28 1.76 3.84Without husband no children 3.34 0.60 1.96 5.23 1.35 4.12 4.91 1.09 3.63
Total 2.25 0.80 1.43 5.94 2.23 4.74 5.17 1.62 3.77TOTAL 3.88 1.86 2.62 7.33 2.89 5.66 6.47 2.40 4.58
Average year of schooling by household head's sex, ethnic group, place of residence and household type

- To assess the overall pattern of the level of education, the probabilities of the years of schooling of the household heads were adjusted by means of an ordinal logit model with the family arrangements, head’s sex, ethnic group and the place of the household as independent variables;
- The baseline group is composed by households headed by a non indigenous male with 17 years of more of schooling located in the urban area;
- Up to the level of 3 years of schooling those households headed by females, indigenous and located in rural areas were higher than the baseline curve e.g. the probability that a head had no year of schooling was about 80% higher than a household in the baseline. From that level on, the probability of those households are always below the baseline. As for the household arrangements there is no much difference in the probabilities of years of schooling among the arrangements.
19
SOCIO-ECONOMIC INDICATORS: HOUSEHOLDS
A) COMPOSITION OF THE HOUSEHOLDSAdjusted probabilities of years of schooling of the head of the
household by sex, ethnic group and place of residence
Adjusted probabilities of years of schooling of the head of the household by type of arrangements

-The higher the level of the income the higher is the inequality between female and male heads, between indigenous and non indigenous head and between rural and urban areas of location.
20
SOCIO-ECONOMIC INDICATORS: HOUSEHOLDS
A) COMPOSITION OF THE HOUSEHOLDS
Head of Household's Sex and Household Type
Ethnicity and Place of Residence
Indigenous Non-indigenous Total
Urban Rural Total Urban Rural Total Urban Rural TotalMale
With wife and children 8676.94 4214.15 5816.18 20039.82 8525.95 15345.49 16811.22 6338.56 11574.47
With wife and no children 10291.47 4889.83 6637.07 30342.29 12596.38 24301.25 27416.03 9443.21 19736.72Without wife with children 9419.08 5391.25 7214.76 40314.49 7928.03 29496.95 33602.99 6911.29 23037.43
Without wife no children 17097.34 8395.10 13071.95 32295.83 13512.07 26020.69 28766.83 11764.08 22491.14Total 9261.08 4399.26 6174.28 22838.97 9181.73 17469.92 19262.39 6839.27 13258.70Female
With husband and children 8188.09 7704.68 7993.56 19853.29 5326.41 14789.96 17954.71 5793.90 13601.55With husband and no children 9600.00 1067.63 6873.56 52029.96 15003.65 34256.34 46424.08 14002.04 31402.86Without husband with
children 7859.10 4726.57 6024.16 16440.85 7367.70 13453.64 14535.03 6175.78 11104.94
Without husband no children 10865.56 4949.02 7880.59 21920.34 14740.14 19869.40 20028.40 11366.08 17119.17Total 8395.37 4801.01 6351.75 18037.58 8728.49 15036.68 16028.75 7072.51 12496.72TOTAL 9076.34 4467.77 6207.42 21545.66 9085.16 16865.96 18436.49 6884.23 13086.18
Average annual per capita income (in GTQ) by sex and ethnic group of the head and location of the household

- The average annual per capita income of the Guatemalan
households was of 13,086 GTQ;
- Male or non-indigenous headed household had higher income than
female or indigenous household, so did the households located in
urban areas;
- The highest average income is for households located in urban areas
headed by a female non indigenous who lived with husband and no
children (GTQ 52,030.00) .The lowest was for those households from
rural areas headed by a female indigenous who lived with husband
and no children (GTQ 1,068.00).
21
SOCIO-ECONOMIC INDICATORS: HOUSEHOLDS
A) COMPOSITION OF THE HOUSEHOLDS

- To identify how the household head’s sex, ethnic group, place of residence and household arrangements affects different levels on income, a multiple quartile regression was performed to adjust the data;
- Households with female indigenous heads and rural always have a negative participation in all the quartiles of the conditional per capita income distribution;
- The higher the level of the income the higher is the inequality between female and male heads, between indigenous and non indigenous head and between rural and urban areas of location.
22
SOCIO-ECONOMIC INDICATORS: HOUSEHOLDS
A) COMPOSITION OF THE HOUSEHOLDS
The influence of head of the household sex and ethnic group, place of residence and household arrangements on Quartiles of the annual per capita income
q25With spouse and children -784.2 239.8 -3.27 0.00 -1254.3 -314.1With spouse and no children -22.6 268.8 -0.08 0.93 -549.5 504.4No spouse with children 0.9 267.7 0.00 1.00 -523.9 525.7Female -536.0 217.7 -2.46 0.01 -962.6 -109.4Indigenous -1416.0 77.1 -18.37 0.00 -1567.1 -1264.9Rural -2629.4 77.5 -33.93 0.00 -2781.4 -2477.5Const 6216.0 242.8 25.60 0.00 5740.1 6691.9q50With spouse and children -3312.3 323.8 -10.23 0.00 -3947.0 -2677.6With spouse and no children -1572.8 411.1 -3.83 0.00 -2378.6 -767.0No spouse with children -1524.0 378.9 -4.02 0.00 -2266.7 -781.3Female -1432.8 499.5 -2.87 0.00 -2411.9 -453.7Indigenous -2712.3 113.7 -23.86 0.00 -2935.1 -2489.5Rural -4327.2 167.6 -25.81 0.00 -4655.8 -3998.6Const 12912.3 319.8 40.38 0.00 12285.5 13539.1q75With spouse and children -6724.4 592.7 -11.34 0.00 -7886.3 -5562.5With spouse and no children -3411.6 630.4 -5.41 0.00 -4647.1 -2176.0No spouse with children -4106.2 769.1 -5.34 0.00 -5613.7 -2598.7Female -2659.8 756.5 -3.52 0.00 -4142.6 -1177.0Indigenous -4822.3 229.6 -21.01 0.00 -5272.2 -4372.3Rural -7804.2 307.7 -25.36 0.00 -8407.4 -7201.0Const 24000.0 623.0 38.52 0.00 22778.9 25221.1
Interval]Quartil of the annual per capita
income and Independent VariablesBootstrap
Std DevCoef. t P>t [95% Conf.
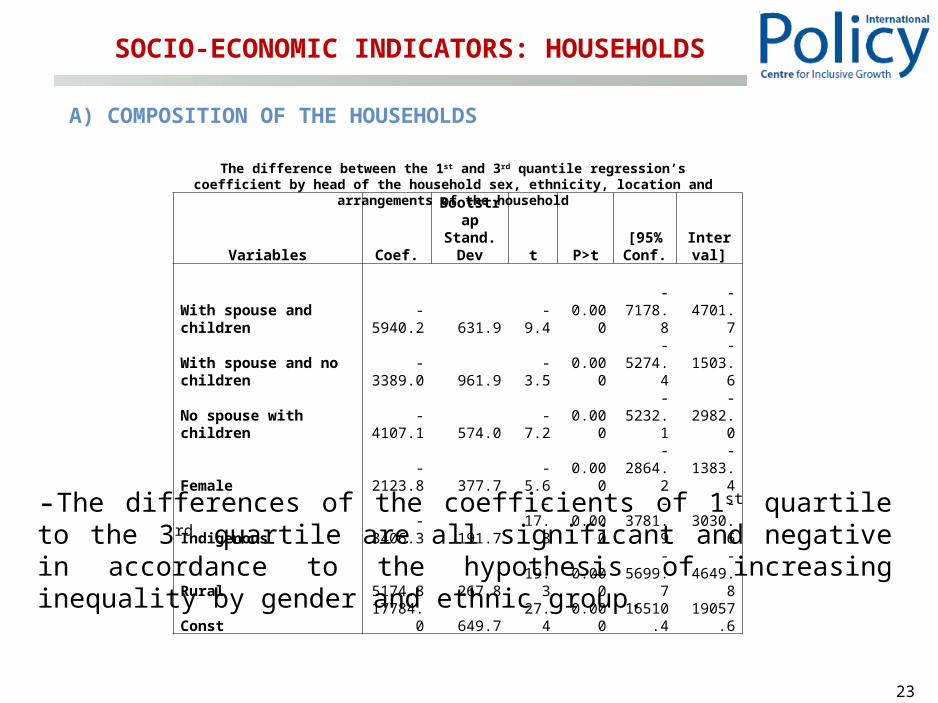
-The differences of the coefficients of 1st quartile to the 3rd quartile are all significant and negative in accordance to the hypothesis of increasing inequality by gender and ethnic group.
23
SOCIO-ECONOMIC INDICATORS: HOUSEHOLDS
A) COMPOSITION OF THE HOUSEHOLDS
Variables Coef.
Bootstrap Stand.
Dev t P>t[95% Conf.
Interval]
With spouse and children -5940.2 631.9 -9.4 0.000 -7178.8 -4701.7With spouse and no children -3389.0 961.9 -3.5 0.000 -5274.4 -1503.6No spouse with children -4107.1 574.0 -7.2 0.000 -5232.1 -2982.0Female -2123.8 377.7 -5.6 0.000 -2864.2 -1383.4Indigenous -3406.3 191.7 -17.8 0.000 -3781.9 -3030.6Rural -5174.8 267.8 -19.3 0.000 -5699.7 -4649.8
Const 17784.0 649.7 27.4 0.00016510.
4 19057.6
The difference between the 1st and 3rd quantile regression’s coefficient by head of the household sex, ethnicity, location and arrangements of the household

-The proportion of poor households was of 47% with a wide range among the groups under study.
- This proportion was higher for those located in rural areas (69%), and for those headed by indigenous (70%);
- There was no clear pattern across the household arrangements nor there was by the sex of the head.
24
SOCIO-ECONOMIC INDICATORS: HOUSEHOLDS
A) COMPOSITION OF THE HOUSEHOLDS
Head of the Household's Sex and Household Arrangement
Ethnic Group and Place of ResidenceIndigenous Non-indigenous Total
Urban Rural Total Urban Rural Total Urban Rural TotalMale
With wife with children 52% 83% 72% 21% 60% 37% 30% 72% 51%With wife and no children 53% 82% 72% 15% 45% 25% 21% 60% 38%No wife with children 54% 67% 61% 13% 49% 25% 22% 57% 36%No wife no children 39% 63% 50% 17% 36% 24% 22% 45% 31%
Total 52% 82% 71% 20% 57% 34% 28% 69% 48%Female
With partner with children 54% 56% 55% 12% 73% 34% 19% 70% 37%
With partner no children 0% 100% 32% 11% 7% 9% 10% 14% 12%
No partner with children 56% 80% 70% 23% 63% 36% 30% 71% 47%No partner no children 49% 82% 65% 21% 49% 29% 26% 61% 37%
Total 54% 80% 69% 22% 61% 34% 28% 69% 44%TOTAL 52% 82% 70% 20% 58% 34% 28% 69% 47%
Proportion of poor households (annual per capita income less than GTQ 6,574.00) by household arrangement and location by head’s sex and ethnic group
- The poverty line adopted in this monograph was of GTQ 6,574.00. This value corresponds to the line estimated by the World Bank using the 2000 and 2006 ENCOVI with consumption data.

- To better understand the role of the sex of the head in the number of poor households, data were modeled by a Poisson Regression Model;
- After controlling for other variables in the model, it was possible to discern the effect of the sex of the head in the proportion of poor households. The proportion of poor households when headed by women was 17% higher than those headed by men, when headed by indigenous the correspondent effect was of 69%;
- The higher effect was from the rural location of the household, in those, the proportion of poor households was 115% higher than those in urban areas.
25
SOCIO-ECONOMIC INDICATORS: HOUSEHOLDS
A) COMPOSITION OF THE HOUSEHOLDS
Variables
Ratio of Rates of Prop of Poor
HouseholdsLinearized St. Error T P>t
[95% Conf. Interval
With partner and children 1.31 0.11 3.1800 0.0020 1.11 1.55
With partner and no children 1.08 0.10 0.9200 0.3570 0.91 1.29
No partner with children 1.15 0.09 1.6800 0.0940 0.98 1.35
Rural 2.15 0.11 14.3500 0.0000 1.94 2.39
Female Head 1.17 0.07 2.4400 0.0150 1.03 1.32
Indigenous Head 1.69 0.07 13.6200 0.0000 1.57 1.82
Ratio of rates of poverty between explanatory variables and baseline (household arrangement and location; head’s sex and ethnic group).

26
SOCIO-ECONOMIC INDICATORS: HOUSEHOLDS
B) THE QUALITY OF THE HOUSES AND THE SANITARY INFRASTRUCTURE
Sex and Poverty
Ethnicity and Place of ResidenceIndigenous Non-indigenous Total
Urban Rural Total Urban Rural Total Urban Rural TotalMale
Poor 94.0% 74.3% 79.6% 91.9% 83.0% 86.1% 92.9% 78.0% 82.5%Non-Poor 96.2% 86.0% 92.2% 97.1% 89.4% 95.1% 96.9% 88.4% 94.5%
Total 95.1% 76.4% 83.2% 96.1% 85.7% 92.0% 95.8% 81.2% 88.7%Female
Poor 93.1% 83.2% 86.6% 91.4% 84.7% 87.6% 92.1% 84.0% 87.1%Non-Poor 91.8% 84.9% 89.3% 96.0% 87.9% 94.5% 95.5% 87.1% 93.6%
Total 92.5% 83.6% 87.4% 95.0% 86.0% 92.1% 94.5% 85.0% 90.7%TOTAL
Poor 93.8% 75.8% 80.8% 91.8% 83.4% 86.5% 92.7% 79.1% 83.5%Non-Poor 95.3% 85.8% 91.6% 96.8% 89.1% 94.9% 96.5% 88.1% 94.3%
Total 94.5% 77.7% 84.0% 95.8% 85.8% 92.0% 95.5% 81.9% 89.2%
Proportion of households with adequate water supply by state of poverty, head of the household sex and ethnic group and location of residence
- The water supply of a residence is considered adequate if there is an inside or outside plumbing, a public water fountain or an artesian well.- As expected the proportion of adequate water is lower for poor families than for non-poor, the same pattern holds across categories of sex and ethnic group of the head, and for the location of the households.- The differential over the head of the household’s sex is less perceptible.

-The proportion of households with adequate water supply is 89%;
with adequate sanitation is 47%; adequate garbage disposal is
35%; and 15% with more than five people sleeping in the same
bedroom;
- After combining those five components with the index of
adequacy of the house construction material (floor, wall and roof) in
one housing quality index, 27% of the households are considered
adequate; and 15.5% are considered of bad quality and
inadequate.
27
SOCIO-ECONOMIC INDICATORS: HOUSEHOLDS
B) THE QUALITY OF THE HOUSES AND THE SANITARY INFRASTRUCTURE
(In order to assess the quality of the houses, an index was calculated using information on adequacy of the sanitary (water source, sanitation, garbage
disposal) infrastructure, of the house building material (roof, wall and floor) and of crowdness (person/bedroom) ). The index is in the Report.

- A house is considered with adequate sanitation if it is non-odor and is connected to a drainage system or a patent concrete cesspit;- There is a high differential in that proportion between urban and rural area, the pattern holds across head of the household’s ethnic and sex group and state of poverty;- The rate of adequacy is higher for households headed by non-indigenous than for those headed by indigenous person. The household headed by women had a better rate of adequacy .
28
SOCIO-ECONOMIC INDICATORS: HOUSEHOLDS
B) THE QUALITY OF THE HOUSES AND THE SANITARY INFRASTRUCTURE
Sex and Poverty
Ethnicity and Place of ResidenceIndigenous Non-indigenous Total
Urban Rural Total Urban Rural Total Urban Rural TotalMale
Poor 45.5% 6.2% 16.7% 58.5% 10.9% 27.4% 52.2% 8.2% 21.5%Non-Poor 73.6% 23.3% 53.8% 84.5% 32.7% 71.2% 82.6% 30.0% 67.6%
Total 59.1% 9.3% 27.5% 79.4% 20.2% 56.1% 74.0% 14.9% 45.4%Female
Poor 51.2% 7.2% 22.2% 68.4% 15.1% 37.9% 61.5% 11.2% 30.8%Non-Poor 72.3% 20.6% 53.4% 85.0% 35.3% 75.4% 83.3% 31.3% 71.8%
Total 60.8% 9.9% 31.8% 81.4% 23.1% 62.6% 77.1% 17.5% 53.6%TOTAL
Poor 46.8% 6.4% 17.7% 61.3% 11.8% 30.0% 54.6% 8.8% 23.5%Non-Poor 73.3% 22.8% 53.7% 84.6% 33.2% 72.3% 82.8% 30.2% 68.6%
Total 59.5% 9.4% 28.3% 79.9% 20.8% 57.7% 74.8% 15.4% 47.3%
Proportion of households with adequate sanitation by state of poverty, head of the household sex and ethnic group and location of residence

- Only 35% of Guatemalan households have access to public or private garbage disposal systems;
- The lowest rate of adequacy was for the poor household, located in rural area and headed by indigenous men and the highest was for the non-poor, urban, non-indigenous and female heads.
29
SOCIO-ECONOMIC INDICATORS: HOUSEHOLDS
B) THE QUALITY OF THE HOUSES AND THE SANITARY INFRASTRUCTURE
Sex and Poverty
Ethnicity and Place of ResidenceIndigenous Non-indigenous Total
Urban Rural Total Urban Rural Total Urban Rural TotalMale
Poor 20.1% 0.9% 6.0% 34.2% 2.5% 13.5% 27.4% 1.6% 9.4%Non-Poor 49.5% 10.4% 34.1% 75.4% 14.9% 59.9% 70.8% 13.6% 54.5%
Total 34.4% 2.6% 14.2% 67.3% 7.8% 43.9% 58.6% 5.3% 32.8%Female
Poor 26.6% 1.6% 10.1% 46.4% 3.2% 21.7% 38.5% 2.4% 16.4%Non-Poor 51.7% 4.2% 34.3% 79.9% 20.3% 68.4% 76.2% 15.9% 62.8%
Total 38.1% 2.2% 17.6% 72.7% 9.9% 52.4% 65.4% 6.6% 42.3%TOTAL
Poor 21.6% 1.0% 6.8% 37.7% 2.6% 15.5% 30.3% 1.7% 10.9%Non-Poor 49.9% 9.3% 34.2% 76.6% 16.0% 62.0% 72.2% 14.1% 56.5%
Total 35.2% 2.6% 14.9% 68.7% 8.2% 46.0% 60.4% 5.5% 35.0%
Proportion of households with adequate garbage disposal by state of poverty, head of the household sex and ethnic group and location of residence

- In order to assess the quality of the houses, an index was calculated using information on adequacy of the sanitary infrastructure (water source, sanitation, garbage disposal), the house building material (roof, wall and floor) and of crowdness (person/bedroom). The adequacy of the house materials were set according to their potential of providing shelter and closure.
- The construction of the Index of Housing Quality (IHQ) followed 4 steps:
30
SOCIO-ECONOMIC INDICATORS: HOUSEHOLDS
B) THE QUALITY OF THE HOUSES AND THE SANITARY INFRASTRUCTURE
1) Classifying the variables according to adequacy and crowdness;
2) Categorizing the households according to: i. adequate; ii. one inadequate, iii. two inadequate and iv. all inadequate, for sanitary infrastructure and house construction material;
3) Classification of the households according to the combination of the infrastructure and material;
4) Refining the classification by a combination of 3) with crowdness.

31
SOCIO-ECONOMIC INDICATORS: HOUSEHOLDS
B) THE QUALITY OF THE HOUSES AND THE SANITARY INFRASTRUCTURE
External wall material
Adequate: block, adobe, wood, metallic foil, brick, concrete Inadequate: wattle and daub, stick, pole, other
Roof material
Adequate: tile, asbestos, cement, Inadequate: thatch or palm leaves, other
Floor material
Adequate: cement, cement brick, ceramic brick, mud brick, wood, parquet Inadequate: earth, other.
Sanitary Infrastructure
House construction material
AdequateOne Inadequate
Two Inadequate All inadequate
Adequate Adequate Fair Regular Regular One Inadequate Fair Fair Regular Regular
Two Inadequate Regular Regular Bad Bad
All inadequate Regular Regular Bad Inadequate
Criteria for household classification according to the level of adequacy of the sanitary infrastructure and house construction material
Sanitary Infrastructure and House Construction Material
<= 5 person/bedroom > 5 person/bedroom
Adequate Adequate Fair
Fair Fair Regular
Regular Regular Bad
Bad Bad Inadequate
Inadequate Inadequate Inadequate
Criteria for household classification according to the categories of the House Quality Index

32
SOCIO-ECONOMIC INDICATORS: HOUSEHOLDS
B) THE QUALITY OF THE HOUSES AND THE SANITARY INFRASTRUCTURE
- Distribution of the Guatemalan houses by the indicator of their quality:
Quality of the house Proportions
Adequate 27.8%
Fair 21.0%
Regular 35.7%
Bad 13.0%
Inadequate 2.5%
Total 100.0%
N. Households 2,653,000
Distribution of the houses by the indicator of their quality
- To better assess the differentials regarding the quality of the house among households, a multinomial logit regression was adjusted to a model with dependent variable as the house quality categories and independent variables as: the type of household arrangements, head of the household by sex and ethnicity and location of the house.
- The model considered the regular quality of the house as the base.

33
SOCIO-ECONOMIC INDICATORS: HOUSEHOLDS
B) THE QUALITY OF THE HOUSES AND THE SANITARY INFRASTRUCTURE
House QualityRelative
Risk Ratio
Linearized St. Error t P>t [95% Conf.
Interval]
Adequate
Indigenous head 0.189 0.033 -9.530 0.000 0.134 0.266
Rural residence 0.019 0.005 -15.350 0.000 0.012 0.032
Female Head 1.393 0.243 1.900 0.057 0.990 1.960
Head + Partner + Children 1.127 0.206 0.650 0.514 0.787 1.612
Head + Partner 1.193 0.280 0.750 0.453 0.752 1.891
Head + Children 0.894 0.162 -0.620 0.538 0.627 1.276Fair
Indigenous head 0.526 0.061 -5.500 0.000 0.418 0.662
Rural residence 0.149 0.019 -15.260 0.000 0.116 0.190
Female Head 1.444 0.193 2.750 0.006 1.111 1.876
Head + Partner + Children 1.303 0.198 1.750 0.081 0.968 1.754
Head + Partner 1.429 0.256 1.990 0.046 1.006 2.032
Head + Children 0.949 0.143 -0.350 0.726 0.706 1.275Bad
Indigenous head 1.427 0.124 4.070 0.000 1.202 1.693
Rural residence 2.094 0.229 6.750 0.000 1.690 2.596
Female Head 1.110 0.230 0.500 0.614 0.739 1.667
Head + Partner + Children 3.397 0.878 4.730 0.000 2.046 5.640
Head + Partner 1.118 0.337 0.370 0.711 0.619 2.018
Head + Children 1.766 0.420 2.390 0.017 1.108 2.815Inadequate
Indigenous head 2.217 0.605 2.920 0.004 1.298 3.786
Rural residence 6.058 2.187 4.990 0.000 2.983 12.300
Female Head 0.701 0.330 -0.750 0.451 0.278 1.768
Head + Partner + Children 7.487 3.986 3.780 0.000 2.634 21.281
Head + Partner 0.337 0.341 -1.070 0.283 0.046 2.459
Head + Children 4.269 2.360 2.630 0.009 1.443 12.629
- The correspondent relative risk of having an adequate house instead of a regular house is higher for female heads, non-indigenous heads and houses located in urban areas;
- The differentials for the type of households did not show statistical significance;
- The relative risks of non-adequate houses as compared to the regular houses was higher for households headed by indigenous than non-indigenous; higher for households located in the rural areas than those in the urban areas;
- The quality of the houses was not statistically different by sex of the head of the household;
- Those households composed by the head, partner and children and those composed by head and children (no partner) had higher risk of having houses of inadequate quality.
Relative Risk Ratio (RRR), standard error, t and p value and 95% confidence interval of the RRR, adjusted by a
multinomial logit regression.

- In decreasing order, durable goods more present in households are
television (69%), stove (57%), fridge or freezer (39%), telephone (19%,
with a higher prevalence of cell phones - 55%), and washing machine
(9%).
-Beyond been the most common durable good in country households,
television have the lowest differentials of ownership by ethnicity and
area of placing of the home;
- The ownership of stove and telephone present the highest
differentials between rural and urban households;
- The ownership of refrigerator presents the highest differentials
between the ethnicity of the household’s head.34
SOCIO-ECONOMIC INDICATORS: HOUSEHOLDS
C) HOUSEHOLD DURABLE GOODS AND DIGITAL EXCLUSION

There are clearly three distinctive patterns: 1) hyperbolic pattern - a concentration of households at the lower end of the curve and dropping very
fast as the number of durable goods increase. This is the case for rural indigenous headed households, 50-60% have zero goods and no more than 10% hold two or more goods;
2) parabolic pattern – a low proportion of households at lower end of the curve, increasing rapidly to a maximum and then decreasing slowly towards the higher end. The urban non-indigenous-headed households, present this patterns, with maximum in three goods;
3) Linear pattern. There is a high proportion of households in the lower end of the distribution and the curve decline monotonically as the number of goods increase. This is the case of urban indigenous and rural non-indigenous. 35
SOCIO-ECONOMIC INDICATORS: HOUSEHOLDS
C) HOUSEHOLD DURABLE GOODS AND DIGITAL EXCLUSIONProportion (by 100) of households with number of durable goods owned by the
location of the household, sex and ethnic group of the head

- Digital exclusion is very high: Only 11% of the households possess computer and 2% have access to Internet;
- Computer and Internet access is more common in urban non-indigenous-headed households;- Access to Internet in rural and indigenous-headed households is null. In countryside, it can be related to
low telecommunications infra-structure;- In the other hand, the ownership of cellular telephone is much more common between households of every
social group, especially between urban non-indigenous headed homes. So, it can be concluded that in Guatemala most families receive their information via television and communicate mainly using cell phones.
36
SOCIO-ECONOMIC INDICATORS: HOUSEHOLDS
C) HOUSEHOLD DURABLE GOODS AND DIGITAL EXCLUSION
Proportion of households (by 100) who own computer, internet and cell phone by location of the household, sex and ethnic group of the head

- Only 50% of children receive all vaccines (BCG, Antipolio, DPT ,
Sarampiom and Measles), available before 2005. That exclusion was
higher for rural and urban indigenous children, especially girls;
- 97% of the children were vaccinated with at least one of those
vaccines;
- The coverage of the four vaccines was higher for those living in
urban areas, non-indigenous and males.
37
SOCIO-ECONOMIC INDICATORS: INDIVIDUALS
D) HEALTH AND SOCIAL SECURITY

- Most Guatemalan women have never done the Papanicolaou Exam, and no more than 18% did it last year. Exclusion is higher between indigenous women, even higher than for rural inhabitants (where health services supply is lower);
- In life just 36% of women aged 15 to 49 did the Papanicolaou. The women residing in urban areas and the non-indigenous had higher prevalence.
38
SOCIO-ECONOMIC INDICATORS: INDIVIDUALS
D) HEALTH AND SOCIAL SECURITY
Proportion of women (by 100) in the age of 15 to 49 years who had Papanicolau Test, by the period of the test, ethnicity and place of
residence

39
SOCIO-ECONOMIC INDICATORS: INDIVIDUALS
D) HEALTH AND SOCIAL SECURITY
Total Population with Health Insurance
- Most of Guatemalan population (85%) do not have any access to any kind of health insurance;

40
SOCIO-ECONOMIC INDICATORS: INDIVIDUALS
D) HEALTH AND SOCIAL SECURITY
Disaggregated Population with Health Insurance
- Exclusion is higher for rural areas than for urban ones as well as for women and indigenous than for men and non-indigenous;
- Private health insurance coverage between rural people and over all indigenous is basically null. In the case of indigenous people living in urban places they are more covered with health insurance than the rural ones.

41
SOCIO-ECONOMIC INDICATORS: INDIVIDUALS
D) HEALTH AND SOCIAL SECURITY
- Annual medical and health expenditures are higher for urban population, women and non-indigenous, with the highest rate for women non-indigenous urban;
- The health expenditures of women non-indigenous urban were higher (10%) than those for any other group, especially indigenous female headed household in urban areas (5%);
- The total health expenditure of the households had an average of 8% of the total household income;
Health Expenditure Annually

- The population aged 60 years or more who receive retirement
pension was 13%;
- The highest figure was for men non-indigenous living urban
areas (30%) and the lowest for women indigenous living in the
rural areas (1%);
- There is a clear picture of very low coverage of social security in
the country.
42
SOCIO-ECONOMIC INDICATORS: INDIVIDUALS
D) HEALTH AND SOCIAL SECURITY

- The gaps in the access to education is higher in terms of rural/urban (with lower access to rural areas) than in terms of ethnicity (non-indigenous with the better figures). Gender presents the lower inequality and normally men present the better figures;- For lower age groups the difference diminishes and years of schooling increase, especially below the age of 15 years, which shows a recent raise in the access to basic education for all in this country.
43
SOCIO-ECONOMIC INDICATORS: INDIVIDUALS
D) EDUCATION
Average Years of Schooling Attended by Age Group, Sex, Ethnicity and Place of Residence

- Just the minority of population is currently attending Higher Education. This is the level of education that presents the higher inequality in the access besides being the one in which there is more inequality among the groups of population; Secondary Education is the level that presents the higher inequality in the access among the categories of the population.
44
SOCIO-ECONOMIC INDICATORS: INDIVIDUALS
D) EDUCATIONEnrollment Rates of Population Sub Groups- Differentiated by Sex, Ethnicity, and Place of
Residence, from Pre-School to Higher Education
- The majority of population is currently attending Primary Education, Irrespective of gender, ethnicity, or place of residence, which shows the tendency to the universalization of basic education;

-The highest illiteracy rate is found among women indigenous living in rural areas with 60 years or over (95.3% of illiteracy). - Among the younger generation illiteracy is lower;- The variation in the illiteracy rate is directly proportional to the age: younger one is, more access to education she or he has with less difference in relation to sex, ethnicity and place of residence.
45
SOCIO-ECONOMIC INDICATORS: INDIVIDUALS
D) EDUCATION
Illiteracy Rates in Population Aged 10 or Older, Differentiated by Age Group, Sex, Ethnicity and Place of Residence
-The greatest inequalities in the illiteracy rates are in terms of ethnicity and place of residence with the indigenous and rural population experiencing the highest rates;

-The high levels of age grade distortions and the low levels of enrollment ratios for primary and secondary education, the latter in particular, can show a great instability in the path through these levels of education and a progressive school evasion.
46
SOCIO-ECONOMIC INDICATORS: INDIVIDUALS
D) EDUCATIONEnrollment Ratio in Primary and Secondary Education by
Sex, Ethnicity and Place of ResidenceAge-grade Distortion in Primary and Secondary Education
by Sex, Ethnicity and Place of Residence
- Enrollment Ratio in primary and secondary education corresponds to all persons enrolled in these levels of schooling to the total population of the age group that national regulation in Guatemala dictates should be enrolled at those levels;
- Age-grade distortion means children over-aged (two years or more) for attending respective schooling grade (as defined by the national education system) to the total enrolled children in the respective grade;

- The EAP corresponds to half of the population. The major inequality is in relation to gender and there is a prevalence of men;- Place of residence and gender are more determinants than ethnicity in the EAP rate with the prevalence of urban and male population.
47
SOCIO-ECONOMIC INDICATORS: INDIVIDUALS
E) LABOR MARKET
Economic Active Population Age 16 Years or Older by Sex, Ethnicity and Place of Residence

- The overall unemployment rate is low. This is due to the high incidence of informal jobs;- The incidence of unemployment is higher in urban areas and for non-indigenous than in rural areas and for indigenous.
48
SOCIO-ECONOMIC INDICATORS: INDIVIDUALS
E) LABOR MARKET
Unemployed Population Age 16 or Older by Sex, Ethnicity and Place of Residence

- The majority of the population is employee and self-employed. This figure has a close link with the high informality of the occupations found in the economy of the country;- Women, especially those from rural areas, present the highest participation in the “others” activities, which shows women in a central role within uncategorized job positions.
49
SOCIO-ECONOMIC INDICATORS: INDIVIDUALS
E) LABOR MARKET
Distribution of Population by Employment Position and Place of Residence

- The majority of population is concentrated in the commercial and agricultural sectors;- The “other” sector of the economy concentrates a great amount of the working population. This sector reinforces the informal pace of the economy;-Women, especially those from urban areas, present the highest participation in the “other” sector, which shows women in a central role within uncategorized sector of jobs.
50
SOCIO-ECONOMIC INDICATORS: INDIVIDUALS
E) LABOR MARKET
Distribution of Population by Employment Sector and Place of Residence

51
SOCIO-ECONOMIC INDICATORS: INDIVIDUALS
E) LABOR MARKET
Average Years of Schooling Attended by the Economic Active Population by Age Group, Sex and Ethnicity
- The overall average years of schooling of the EAP is low;
- For EAP among younger population there is less inequality between sexes and more qualified women entering into the labor market;
- The worst educational situation is for women indigenous.

52
SOCIO-ECONOMIC INDICATORS: INDIVIDUALS
E) LABOR MARKET
Working Condition of Occupied Population by Sex and Ethnicity
- The great majority of population is in the informal condition of employment;
- For the informality ethnicity accounts much more than gender as the greatest concentration is among indigenous population.

53
SOCIO-ECONOMIC INDICATORS: INDIVIDUALS
F) DOMESTIC LABOR
- The majority of domestic workers of total occupied population are
women (8.6%), non-indigenous (4%), and live in urban areas (4.3%);
- Among the women that work in more than 1 domicile (5%) the majority
is located in urban areas;
- The majority of female domestic workers fall into the age group 26-44
(32.8%), in which there is a prevalence of the indigenous living in urban
places (42.5%);
- The average years of schooling of a domestic worker is 3.27 years.
The figure is higher for non-indigenous (3.62 years), compared to
indigenous (2.29 years). There is no significant difference between
urban and rural areas.

54
SOCIO-ECONOMIC INDICATORS: INDIVIDUALS
F) DOMESTIC LABOR
-The average monthly income of the domestic worker is 1,080.51 GTQ. It means the monthly wage plus non-wage benefits such as housing, transport, food, and others. These benefits correspond to half of the average total income of these workers as the wage is 544.16 GTQ per month and the benefits are 536.35 GTQ, as specified in the table.
Salary 544.16
Extra Hours 0.00
Comissions 0.00
Bono 14 13.52
Aguinaldo 13.65
Deferred 0.00
Vacancy Bonus 0.00
Other Benefits 0.49
Clothes 1.32
Vacancy Work 1.22
Alimentation 362.39
Housing 66.07
Transport 4.21
Other Gains 73.23
Agriculture Gains 0.24
TOTAL 1080.51
Average Monthly Income of Female Domestic Workers
- The average monthly income of the total occupied population was 644.33 GTQ. And the minimum wage was 1,559.00 GTQ per month.

55
SOCIO-ECONOMIC INDICATORS: INDIVIDUALS
F) DOMESTIC LABOR
Average Monthly Income of Female Domestic Workers by Ethnicity and Place of Residence
-Domestic workers have monthly earnings that are close to the minimum wage and twice as much compared to the overall monthly income of the population;
-The indigenous living in rural areas have the lowest monthly averages.
Average Monthly Wage of Female Domestic Workers by Ethnicity and Place of Residence

56
SOCIO-ECONOMIC INDICATORS: INDIVIDUALS
F) DOMESTIC LABOR
Distribution of Female Domestic Workers by Working Hours, Place of Residence and Ethnicity
- Around 60% of the domestic labors work more than 40 hours per week, the majority is non-indigenous living in urban places.
Distribution of Female Domestic Workers by Working Hours
- In urban areas, a higher percentage of non-indigenous work more than 40 hours a week compared to indigenous domestic workers. In rural areas, this difference is a slightly lower.

- Non-indigenous men from urban areas are in better income conditions with average individual earnings of 21,157.99 GTQ;- The lowest income figure is for indigenous female from rural areas with an average of 1,118.74 GTQ per year;
57
SOCIO-ECONOMIC INDICATORS: INDIVIDUALS
G) POVERTY AND INEQUALITY OF INCOME DISTRIBUTION
Average Individual Income from Main Income Source per Year by Sex, Ethnicity and Place of Residence
-There is a great inequality of income distribution among the different groups of people;- Place of residence and ethnicity are respectively determinants on average individual income;- The lower income clearly shows the disadvantageous situation for women, indigenous population and people living in rural areas.

Average Income from Main Income Source per Year by Employment Position, Place of Residence, Sex and Ethnicity
58
SOCIO-ECONOMIC INDICATORS: INDIVIDUALS
G) POVERTY AND INEQUALITY OF INCOME DISTRIBUTION
- Employer is the job position with the highest earnings for all groups of people, with a much better figure for men non-indigenous from urban places, and except for female indigenous rural;- Public servants are workers with a good average income and there is less inequality among those that pertain to different categories of population;- Domestic workers, rural self-employed and rural employees are the employment types with lower earnings for all groups.

Average Income from Main Income Source per Year by Sector of Employment, Place of Residence, Sex and Ethnicity
59
SOCIO-ECONOMIC INDICATORS: INDIVIDUALS
G) POVERTY AND INEQUALITY OF INCOME DISTRIBUTION
-Agriculture is the sector of employment that pays worse while public administration is the sector with higher earnings for all groups;- Women non-indigenous living in urban areas present the highest earnings than other groups for public administration and construction;- Commerce, industry and other are sectors of employment with greater inequality of earnings for all groups: \place of residence, ethnicity and sex are respectively the determinants of earnings;- Women indigenous and non-indigenous receive much lower earnings than men in rural commerce, industry and other.

Proportion of Population by Per Capita Income Deciles by Sex, Ethnicity and Place of Residence
60
SOCIO-ECONOMIC INDICATORS: INDIVIDUALS
G) POVERTY AND INEQUALITY OF INCOME DISTRIBUTION
- Indigenous and rural populations are concentrated in lower deciles which shows they are proportionately poorer than non-indigenous and urban populations.

61
SOCIO-ECONOMIC INDICATORS: INDIVIDUALS
G) POVERTY AND INEQUALITY OF INCOME DISTRIBUTION
- The absence of income source is mainly determined by sex as much more women age 16 or older do not have own income compared to men.
Proportion of Population Age 16 or Older Without Own IncomeProportion of Married Women without Own Income by
Ethnicity and Place of Residence
- Half of the married women do not have own income. The higher incidence of the absence of own income is for indigenous rural and the lowest is for non-indigenous urban. Place of residence is a stronger determinant than ethnicity for some woman being dependent of income of her husband.

62
SOCIO-ECONOMIC INDICATORS: INDIVIDUALS
G) POVERTY AND INEQUALITY OF INCOME DISTRIBUTION
Gini Coefficient by Sex, Ethnicity and Place of Residence Theil Coefficient by Sex, Ethnicity and Place of Residence
- The highest inequality is seen for ethnicity as non-indigenous presents a higher Gini index of 0.548 than indigenous with a figure of 0.498.
- The highest inequality is also seen between non-indigenous and indigenous populations. The former presents an index of 0.640 and the latter presents 0.471.
- The Gini and Theil show that income distribution is more uniform within groups (urban, rural, non-indigenous and indigenous) than total. Indigenous group face the less unequal income distribution, although they are the poorer group, alongside with rural population.

63
SOCIO-ECONOMIC INDICATORS: INDIVIDUALS
G) POVERTY AND INEQUALITY OF INCOME DISTRIBUTION
Proportion of Poor and Extremely Poor Population by Household Average per Capita Income by Sex, Ethnicity and Place of Residence
- Prevalence of poor population (54.5%) compared to the extremely poor (28.7%);
- The group that presents the highest poverty incidence is indigenous from rural areas (84.5% poor and 57.0% extremely poor), and the lowest is seen inside the non-indigenous living in urban areas (24%% poor and 6% extremely poor).

Muchas Gracias!
64
UNIFEM I Project
INTERNATIONAL POLICY CENTRE FOR INCLUSIVE GROWTH (IPC-IG)(UNDP AFFILIATE)
WEBSITE ADDRESS: WWW.IPC-UNDP.ORG
DIANA SAWYER (COORDINATOR): [email protected] GOVEIA (ASSOCIATE RESEARCHER): [email protected]
RICARDO MARTINI (ASSOCIATE RESEARCHER): [email protected]