documents.worldbank.orgdocuments.worldbank.org/curated/en/837521468038083782/... · Web viewWORLD...
100
WORLD BANK REIMBURSABLE TECHNICAL ASSISTANCE ITIDA ICT INDICATORS AND IMPLICATIONS FOR METHODS FOR ASSESSING SOCIOECONOMIC IMPACT OF ICT FINAL REPORT VOLUME 1 OF 2 69727
Transcript of documents.worldbank.orgdocuments.worldbank.org/curated/en/837521468038083782/... · Web viewWORLD...

WORLD BANK
REIMBURSABLE TECHNICAL ASSISTANCE
ITIDA
ICT INDICATORS AND IMPLICATIONS FORMETHODS FOR ASSESSING SOCIOECONOMIC IMPACT OF ICT
FINAL REPORT
VOLUME 1 OF 2
WORLD BANK
69727

TABLE OF CONTENTS
Volume 1
I. Summary of Recommendations...............................................................................3II. Introduction & Background.....................................................................................4III. Indicator Types: Input, Activities, Output, Outcome and Impact...........................7
A. What are Impact Indicators?....................................................................................7B. Constraints of Impact Indicators............................................................................10
IV. Overview of ICT Data and Institutional Setup in Egypt.......................................13A. ICT Data, Categories and Methodologies.............................................................13B. Institutional Arrangements....................................................................................14
V. ICT Data Categories and Methodologies Used by Major International Indices and Reports & Egypt’s Performance in Them.............................................................16
A. Introduction...........................................................................................................16B. Networked Readiness Index (WEF and INSEAD)................................................20C. E-government Readiness Index (UNPAN)............................................................24D. Digital Opportunity Index (ITU) and ICT Opportunity Index (ITU)...................29E. Knowledge Assessment Methodology (KAM).....................................................35F. E-Readiness Rankings (EIU).................................................................................45G. World Bank ICT At-A-Glance Tables...................................................................49H. Core ICT Indicators...............................................................................................51
VI. Mapping and Gap Analysis...................................................................................53A. Introduction...........................................................................................................53B. Data Categories......................................................................................................54C. Sample Outcome and Impact Indicators for Egypt................................................59
VII. Recommendations.................................................................................................64A. Data Categories......................................................................................................64B. Designing Surveys.................................................................................................64C. International Indices..............................................................................................66D. Institutional /Capacity-Building............................................................................67
VIII. Implications for Socio-Economic Impact Analyses..............................................69IX. Bibliography..........................................................................................................72
Volume 2 - Annexes

I. Summary of Recommendations
WB/ITIDA RTA ICT IndicatorsCONFIDENTIAL Final Report
3
Data Categories
Establish centralized and coordinated data reporting and verification with international indices.
Establish working relationships with international reporting indices to ensure timely dialogue and capacity building
Create distinct uses of data – one to measure information society (essentially feeds into international reporting and ranking); another to measure socioeconomic impact (essentially feeds into Egyptian policy making processes)
While the official statistical process should be retained, consideration should be given to introducing more flexible, adaptable and scalable approaches to data gathering.
Consider simplifying sampling and using a composite index
Include indicators (from the gap analysis) that are currently not being used and consider disseminating locally produced context indicators
Include survey-based indicators (from the gap analysis)
Institutional Arrangements - Establishment of an inter-institutional “steering committee” is
recommended in order to implement harmonization and data sharing processes. The adoption of
standardized and normalized technical formats of data, common or interlinked databases,
harmonized data storage and eventually, networked access to a common database, are also
recommended.
International Indices – Related to the recommendations under data categories, Egypt may
need to tailor its data gathering results and processing, including introducing comparative, locally
produced survey-based indicators (on which many of the international indices rely) to address the
individual needs of the different indices to improve its rankings in these indices. A detailed review
of specific actions that could be considered with respect to each index is contained in chapter V.
Training - Training and capacity building in these areas will be helpful in monitoring global
best practice and developments in this dynamic area. However, because of the unique requirements
of Egypt in this area, it may be that a tailor-made training program would be best suited to meet
these specific needs. Some suggested training opportunities are contained in Annex 7.

II. Introduction & Background
This report is being delivered pursuant to the agreement (Agreement) between the Ministry of Communications and Information Technology of the Arab Republic of Egypt (MCIT) and the World Bank (Bank) for the provision by the Bank of technical assistance (RTA) to MCIT and certain of its affiliates. One of those affiliates is the Information Technology Industry Development Authority (ITIDA).
When it comes to designing and implementing ICT policies, the availability of proper indicators is key to efficiency and effectiveness. This has recently been recognized by the international community, which, through the Tunis Agenda of the World Summit on Information Society, stressed that “Appropriate indicators and benchmarking, including community connectivity indicators, should clarify the magnitude of the digital divide, in both its domestic and international dimensions, and keep it under regular assessment, and track global progress in the use of ICTs to achieve internationally agreed development goals and objectives, including the Millennium Development Goals. … The development of ICT indicators is important for measuring the digital divide. ”1
Basic, standard ICT indicators are widely known and used. For sector data, they include (a) Fixed lines per 100 inhabitants, (b) Mobile subscribers per 100 inhabitants, and (c) Internet users per 100 inhabitants. For project-level data, (i.e., to measure success in an e-Business Registry project), relevant indicators would be (a) the initial investment (project budget), (b) the number of unique visitors on the e-BR site once launched, (c) the number of downloaded forms.
However, the indicators should go further, and should help policymakers also to
measure how well the sector or projects are performing,
provide an assessment over time on the status of a project, program, or policy,
promote credibility and public confidence by reporting on the results of programs,
1 http://www.itu.int/wsis/docs2/tunis/off/6rev1.pdf, See para 113.WB/ITIDA RTA ICT IndicatorsCONFIDENTIAL Final Report
4

Provide in-depth information about public sector performance
Help formulate and justify budget requests
Identify potentially promising programs or practices for duplication or scalability
For policy makers, decision makers and stakeholders, such indicators are particularly important in at least three areas:
• Strategy: in order to provide realistic objectives for national policies, it is of utmost importance to have a quantified assessment of where the national economy stands (be it in terms of e-readiness, infrastructure, regulatory environment, potential for the development of the locals ICT sector, or usage, etc..), and how it compares to similar, neighboring and best practice economies;
• Monitoring and evaluation: once activities have been launched to enhance the way in which the national economy can benefit from information technologies and changes related to the so-called information revolution, their implementation must be tracked and monitored; accountability and transparency in such execution will be a key ingredient of success;
• Visibility and international recognition: efforts made locally to improve a country’s performance as an information and/or knowledge economy need to be supported by local energies and enthusiasm; this may not happen in the absence of outside recognition of the efforts made by local entities, private and public. The same visibility and international recognition may prove invaluable when it comes to attracting foreign investment and/or foreign partners in efforts to develop information services locally.
The proposals in this report are made with a view towards facilitating the use of such data by policy makers and regulators in connection with the evolution of the information society in Egypt. The report recognizes a dual-purpose objective –
WB/ITIDA RTA ICT IndicatorsCONFIDENTIAL Final Report
5
If you don’t measure results, you can’t tell success from failure
If you can’t see success, you can’t reward it
If you can’t reward success, you are probably rewarding failure
If you can’t see success, you can’t learn from it
If you can’t recognize failure,

discussing (on the one hand) that international indices accurately reflect the situation “on-the-ground” in Egypt while also addressing (on the other hand) that such indicators support the general development objectives of Egypt, and in particular the role that ICTs have in investment, economic growth and education in Egypt, and Egypt’s international trade. It is expected that the findings and recommendations contained in this report will form an appropriate foundation for assessing the “Socioeconomic Impact” of ICT in Egypt in later phases of the RTA.
Thus, this report is composed of the following sections: (i) a discussion of indicator types, in particular impact indicators and their constraints; (ii) an overview of the institutional setup of ICT data in Egypt; (iii) ICT data categories and methodologies used by major international indices and reports, including an analysis of Egypt’s strong and weak results in the indices; (iv) a mapping and gap analysis between the indices’ indicators and those currently collected by Egypt; (v) a set of recommendations for Egypt and (vi) implications of this work with respect to analyzing the socioeconomic impact of ICTs on investment, trade, growth and education in Egypt.
The report is based on primarily desk research and interviews conducted with ITIDA and other relevant institutions involved in gathering and use of ICT data in Egypt, including the Central Agency for Public Mobilization and Statistics (CAPMAS), the General Authority for Investment and Free Zones (GAFI) and MCIT over three missions in September 2006, March 2007 and September 2007, as well as various correspondence and video conferences with ITIDA.
WB/ITIDA RTA ICT IndicatorsCONFIDENTIAL Final Report
6

III. Indicator Types: Input, Activities, Output, Outcome and Impact
“Process” indicators are usually used to assess a project or a policy reform. These permit data analysts to
Describe the problem or situation before the intervention Benchmark activities and immediate outputs Collect data on inputs, activities, and immediate outputs Report systematically on provision of inputs Report systematically on production of outputs Link directly to a discrete intervention (or series of interventions) Provide information on administrative, implementation, and management issues
as opposed to broader development effectiveness issues.2
However, process indicators are not well-suited for a results-based assessment, which require “impact” indicators. These permit data analysts to
Use baseline data to describe the problem or situation before the interventions Collect data on outputs and how and whether they contribute toward achievement
of outcomes Include indicators for medium-term or long-term outcomes Focus on perceptions of change among stakeholders Report systematically with more qualitative and quantitative information on the
progress toward outcomes Are done in conjunction with strategic partners Capture information on success or failure of the partnership strategy in achieving
desired outcomes.
A. What are Impact Indicators?
At the top of the typical strategy pyramid is the policy or vision that the strategy ultimately attempts to fulfill (see Figure 1 below).
Figure 1: Impact Indicators Measure the Policy Goals at the Top of a Policy Pyramid
2 Adapted from Fukuda-Parr, Lopes, and Malik 2002, p. 11WB/ITIDA RTA ICT IndicatorsCONFIDENTIAL Final Report
7

Source: Adamali, Lanvin, Schware, M&E Toolkit for E-Strategies, 2005
Impact indicators measure that policy goal. They are generally development-focused indicators, pertaining to the country’s economy and society as a whole. They need not be ICT indicators.
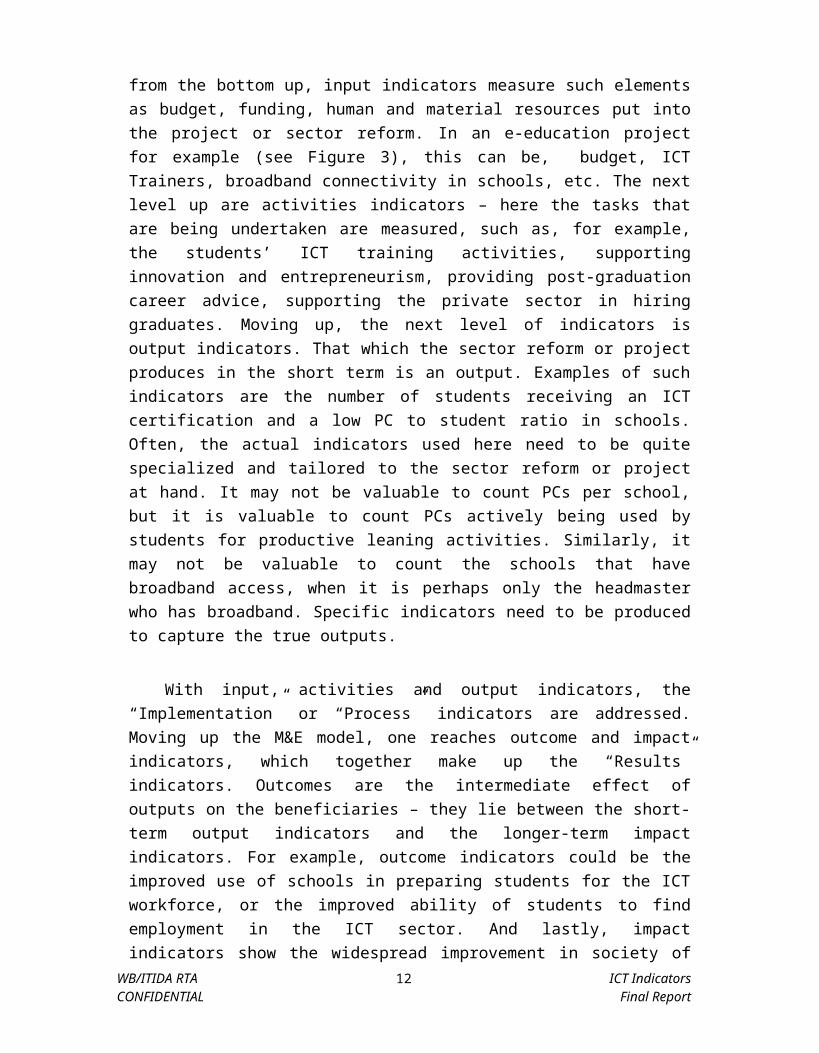
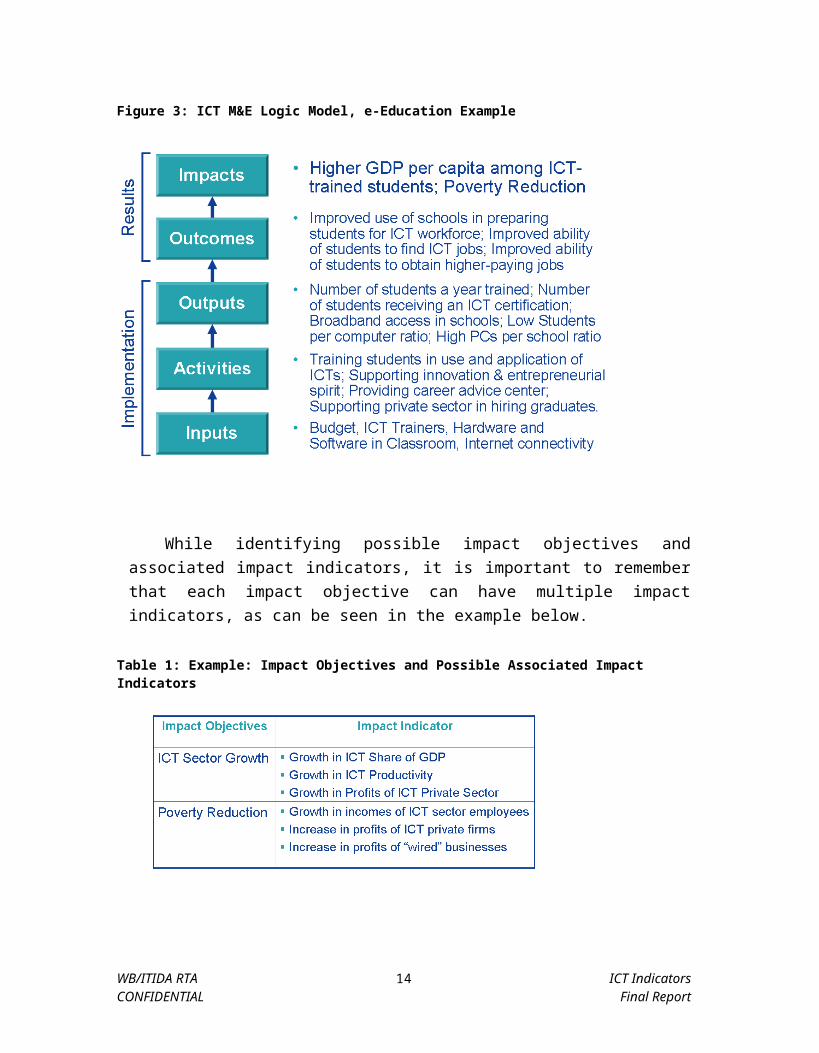
Below is a generic M&E Logic Model that illustrates the definitions of the various indicator types. Working from the bottom up, input indicators measure such elements as budget, funding, human and material resources put into the project or sector reform. In an e-education project for example (see Figure 3), this can be, budget, ICT Trainers, broadband connectivity in schools, etc. The next level up are activities indicators – here the tasks that are being undertaken are measured, such as, for example, the students’ ICT training activities, supporting innovation and entrepreneurism, providing post-graduation career advice, supporting the private sector in hiring graduates. Moving up, the next level of indicators is output indicators. That which the sector reform or project produces in the short term is an output. Examples of such indicators are the number of students receiving an ICT certification and a low PC to student ratio in schools. Often, the actual indicators used here need to be quite specialized and tailored to the sector reform or project at hand. It may not be valuable to count PCs per school, but it is valuable to count PCs actively being used by students for productive leaning activities. Similarly, it may not be valuable to count the schools that have broadband access, when it is perhaps only the headmaster who has broadband. Specific indicators need to be produced to capture the true outputs.
WB/ITIDA RTA ICT IndicatorsCONFIDENTIAL Final Report
8

With input, activities and output indicators, the “Implementation” or “Process” indicators are addressed. Moving up the M&E model, one reaches outcome and impact indicators, which together make up the “Results” indicators. Outcomes are the intermediate effect of outputs on the beneficiaries – they lie between the short-term output indicators and the longer-term impact indicators. For example, outcome indicators could be the improved use of schools in preparing students for the ICT workforce, or the improved ability of students to find employment in the ICT sector. And lastly, impact indicators show the widespread improvement in society of the reform or project. Examples include higher GNI per capita and poverty reduction among ICT-trained graduates.
Figure 2: M&E Logic Model
Below is the M&E Logic Model as applied to the ICT sector, and specifically to an example of an e-education project. All indicators are meant to be general examples only, and are not exhaustive.
WB/ITIDA RTA ICT IndicatorsCONFIDENTIAL Final Report
9

Figure 3: ICT M&E Logic Model, e-Education Example
While identifying possible impact objectives and associated impact indicators, it is important to remember that each impact objective can have multiple impact indicators, as can be seen in the example below.
Table 1: Example: Impact Objectives and Possible Associated Impact Indicators
B. Constraints of Impact Indicators
But higher-level impact indicators also have certain limitations. Time horizons are long; impact indicators often show change after a considerable time lag. “Results” may
WB/ITIDA RTA ICT IndicatorsCONFIDENTIAL Final Report
10

only be known years after the reform has been undertaken. Positive changes may be of limited concern as conditions have changed over time. Due to the time delay, such indicators are seldom monitored on a regular basis.3
In addition, establishing causality is difficult using impact indicators. Changes in impact indicators are likely to be influenced by interventions undertaken as a part of a larger e-strategy, but almost certainly not as a result of specific interventions alone. Therefore, establishing causality between an e-strategy’s interventions and the changes in an impact indicator is difficult. For example, ICT’s contribution to GDP growth is clearly driven by a vast array of factors, of which the ICT services sector may be just one.
Outcome indicators therefore may be of greater utility to policymakers. As is seen in the model above, outcome indicators measure the intermediate impact of a reform and lie between immediate outputs & long-term impact of a reform. The analogies in the figure 4, below, show the between outcomes and impact.
Figure 4: Analogies of Outcome and Impact Indicators
3 Zall Kusek and Rist, 2004WB/ITIDA RTA ICT IndicatorsCONFIDENTIAL Final Report
11
In order to obtain more causality analysis, outcome indicators are needed. Some examples of different ICT outcome objectives and associated indicators are below.
Table 2: Example: Outcome Objectives and Associated Outcome Indicators
WB/ITIDA RTA ICT IndicatorsCONFIDENTIAL Final Report
12

IV. Overview of ICT Data and Institutional Setup in Egypt
A. ICT Data, Categories and Methodologies
Categories for which ICT data are currently collected in Egypt are listed in Annex 1. Data is collected according to a survey. 4 The sampling used by CAPMAS derives from the broader Egyptian Information Society Indicators Project (Project) between MCIT, ITIDA, the National Telecommunications Regulatory Authority (NTRA) and CAPMAS. Data are published by MCIT.5 The sampling covers the 27 governates of Egypt and is comprised of the following samples:
Sectors Samples
Household 21, 000 households
Governmental sector 350 governmental bodies
Public sector 4212 entities
Private sector 3296 entities
IT companies 668 companies
IT clubs 1498 clubs6
Internet cafes 7816 cafes
Graduates of information technology
12 governmental universities25 governmental Technical institutions2 non – governmental colleges3 non – governmental educational institutions22 Labor universities10 private universities (includes 55 colleges)103 private institutions.Pre-university Data are collected at the governorates level (including private education).
4 A sample survey form is included in Annex 2.5 An Example of the monthly indicators published by MCIT may be found in Annex 3.6 IT Clubs are government-sponsored entities offering Internet access, ICT and IT training and related services.WB/ITIDA RTA ICT IndicatorsCONFIDENTIAL Final Report
13
B. Institutional Arrangements
In Egypt, the statistical agency, CAPMAS, is the primary governmental agency charged with data gathering.7 CAPMAS is responsible for conducting national surveys for ICT usage in Egypt according to a joint protocol agreement with the MCIT. CAPMAS performs its functions on behalf of MCIT, Ministry of Administrative Development, Ministry of Education and Ministry of Trade and Industry, conducts all surveys and data entry. Line ministries analyze data in connection with their data gathering in the ICT area, CAPMAS gathers data using eight questionnaires, one each for Households, Education (including universities and secondary schools and including public, private and religious schools), Health, Public Sector institutions, Private Sector (IT companies), and Internet Cafes, and government IT Clubs. Household samples are gathered every three months. Every three months 21,000 families are sampled. Private Sector, Internet Cafes and IT Clubs are done a sampling basis every six months. Education, Health and the Public Sector are done annually. Other applications and sector-specific data gathering are conducted by CAPMAS.8 CAPMAS has been gathering data in this manner for just over a year, and will make adjustments to its gathering methodology in future rounds of data gathering. CAPMAS provides ex ante quality assurance through the structure of its surveys, including the numbers of households surveyed, the timing of the surveys and the geographic diversity of the survey. It provides ex post quality assurance through inter-ministerial review of the findings.
The National Telecommunication Regulatory Authority (NTRA) is responsible for producing statistics from licensed mobile and Internet operators, as required by law and the terms of the operators’ licenses. GAFI produces ICT investment data (see Box 1).
7 Other agencies have some data gathering responsibilities attendant to the performance of their functions. One of these, for example is the General Authority for Investment and Free Zones (GAFI) (http://www.gafinet.org/ ), which has registration and regulatory responsibilities for certain investment companies in Egypt, and gathers limited data on the companies it is responsible for regulating. See, Box 1, below.8 MCIT also works with on sectoral studies with other ministries. For example, MCIT works with the Ministry of Education on measuring how students access computers. The data for that work is gathered by CAPMAS.WB/ITIDA RTA ICT IndicatorsCONFIDENTIAL Final Report
14

With this variety of data sources, the current institutional approaches to data collection will merit further consideration in order to ensure that an accurate picture of the ICT sector emerges in Egypt and that reliable data area available to all parties. In particular, capacity building and empowering of the inter-institutional steering committee is recommended, so that it can champion the harmonization and data sharing processes. The adoption of standardized and normalized technical formats of data, common or interlinked databases, harmonized data storage and eventually, networked access to a common database, are also strongly recommended.
WB/ITIDA RTA ICT IndicatorsCONFIDENTIAL Final Report
MCIT has established an intra-ministerial steering committee that deals with matters related to ICT indicators and socio-economic impact of ICT. It has also recently constituted a specialized office within MCIT focusing on these issues. ITIDA, also a member of the intra-ministerial steering committee, has certain accountabilities to the IT and ICT industry with respect to indicators.
Additionally, the private sector owns data related to ICT as well.
15
Box 1 GAFI – Another source of data relevant to Investment
One example worth noting is with respect to data gathering issues related to impact on investment. A primary source of information about investment in ICT should be the database/registry maintained by GAFI. GAFI has certain responsibilities with respect to registration of joint stock companies and limited liability companies created under Law 159 of 1981 (Companies Law) as well as under Law 8 (Investment Law) that establishes “free zones”. GAFI maintains a registry of businesses it under its mandate, having merged with the Companies Authority in 2001. There are a number of issues with respect to using data from GAFI’s registry to measure the impact of ICT on investment. First, GAFI’s register is not a complete register of all firms potentially acting in the ICT space. There may be firms (either in the informal sector or that are not corporations under the companies law or that are not captured by the Investment Law) that are acting in the sector. For example, GAFI has records for about 45,000 entities, while GAFI estimates that there are about 2 million commercial entities in Egypt. Second, GAFI’s database is not complete with respect to investments made in the sector – it only requires the issued capital, while the Commercial Registry records paid-in capital. Third, there are different requirements for data required of entities providing information under the Companies Law and for entities providing data under the Investment Law. Accordingly, the range of registration requirements makes it difficult to gather sufficient data to accurately measure the impact on investment over time.

V. ICT Data Categories and Methodologies Used by Major International Indices and Reports & Egypt’s Performance in Them
A. Introduction There is a range of public and private indexes and reports that provide access to key
ICT data accompanied by useful analysis. This section covers the indicators used in the following indexes and reports:
1. Network Readiness Index (NRI) developed initially by the World Economic Forum and Harvard University and currently monitored by the World Economic Forum and INSEAD;
2. Digital Opportunity Index (DOI) developed by the International Telecommunications Union (ITU);
3. ICT Opportunity Index (ICT-OI) developed by the International Telecommunications Union (ITU);
4. e-Government Readiness Index developed by the United Nations Public Administration Network (UNPAN);
5. Knowledge Assessment Methodology (KAM) developed by the World Bank Institute (WBI); and
6. e-Readiness Rankings developed by the Economist Intelligence Unit (EIU).
Two indicators lists are also included in the study. They do not provide any ranking at this time, but are of interest due to their selection of a core list of ICT indicators.
1. ICT At-A-Glance Tables (ICT AAG) are produced annually by the World Bank as apart of the Information and Communications for Development report.
2. Core ICT Indicators List (C-ICT-I) was compiled by the Partnership for Measuring ICT for Development.
WB/ITIDA RTA ICT IndicatorsCONFIDENTIAL Final Report
16

Table 3: Comparative Metadata on Indices
Year Countries Indicators Type SourcesNRI (WEF) 2006-7 122 84 Quantitative
and anecdotalITU, WEF
ICT-OI (ITU) 2006 183 10 Quantitative ITUDOI (ITU) 2006 181 11 Quantitative ITUe-Gov (UNPAN)
2008 192 28 Quantitative and Survey
ITU, WDI, UNDP, UNPAN, web survey
KAM (WBI) 2007 140 83 Quantitative WDI, WEF, IMD, UNDP, UNCTAD, USPTO +
e-Readiness (EIU)
2007 69 Nearly 100 Quantitative EIU, Pyramid, WB, WITSA, ISPs
ICT at-a-Glance
2007 144 34 Quantitative and Qualitative
ITU, ITU Reg, WDI
Core ICT 2005 0 41 Quantitative ITU, Surveys
Strengths and Constraints of Indices
The indexes, related tools and reports have different strengths and constraints. The NRI provides the ability to drill down from the overall index to component indices, sub-indices and eventually to individual indicators, to locate areas of comparative strength or weakness in a country’s ICT performance. Also, in addition to the standard ICT series, it also includes useful survey-based indicators that are unavailable elsewhere. The DOI provides an exceptionally broad country coverage - ranking 181 economies – but uses the fewest, most targeted and commonly available ICT indicators. The e-Government Readiness ranking, which at 191 countries has the broadest coverage among the indices studied, also uses some of the standard ICT indicators, and supplements them with e-Government specific data resulting from UNPAN’s own analysis. The KAM provides access to a wide range of data, some of which are not ICT-specific, but contextual to the knowledge economy and ICT-enabling environment overall. It also
offers useful online graphing and analytical tools. The e-Readiness Rankings feature more indicators than countries – analyzing a chosen set of countries in detail.
In most cases, however, indices give only a truncated and imperfect vision of a
WB/ITIDA RTA ICT IndicatorsCONFIDENTIAL Final Report
17

country’s reform efforts, for the following main reasons:
(a) To be internationally comparable, indices need to offer a rather high level of commonality and aggregation (low granularity);
(b) Ranking countries suggests aggregating indicators of different nature, such as output, outcome and impact indicators;
(c) There is often a 2+ year lag time between the publication year and the year of the data employed – meaning that a 2007 publication is mostly based on 2005 data, but in some cases, data can be three or four years old. Most indexes provide the “picture of two years ago” rather than that of today, thus they do not reflect most recent initiatives, investments or successes; this is particularly detrimental in the case of a sector in which technologies, practices and approaches change so rapidly;
(d) The majority of the indicators track change at higher levels of ICT policymaking – relating to strategic priorities (outcomes) and policy goals (impact). The individual initiatives and actions undertaken as part of ICT strategy implementation in individual countries will in time coalesce to show up as change in these indicators. However, there is likely to be a substantial time lag before such changes appear. For example, privatization of a state-run telecommunications enterprise is likely to lead to higher teledensity levels, but only after a number of years. Therefore, data required to monitor and evaluate ICT strategies will not adequately be available in these indexes or through other cross-country sources. This is particularly so for indicators that are required to track and reflect progress made at lower levels of the strategy pyramid – such as on specific initiatives. Such indicators are in large part determined by how the chosen initiatives are designed, and will be unique to many countries and their own approaches to ICT development. Separate Monitoring and Evaluation (M&E) efforts will be needed to track results in them; and
(e) Many indices do not make their underlying data available in full or re-usable formats. Whereas the KAM offers impressive online charting and graphing tools, the NRI, UNPAN and EIU indices provide the data in hard copy tables only. Independent data manipulation is not possible.
WB/ITIDA RTA ICT IndicatorsCONFIDENTIAL Final Report
18

Box 2: Summary Description of the International Indices Considered
1. The Network Readiness Index (NRI) measures the degree of preparation of a nation or community to participate in and benefit from ICT developments. The NRI is composed of three component indexes which assess the environment for ICT offered by a country or community, the readiness of the community's key stakeholders (individuals, business and governments), and the usage of ICT among these stakeholders. Currently, 122 countries are covered. Since it was first launched in 2001, The Global Information Technology Report has become a valuable and unique benchmarking tool to determine national ICT strengths and weaknesses, and to evaluate progress. It also highlights the continuing importance of ICT application and development for economic growth. http://www.weforum.org/gitr
2. The International Telecommunications Union’s (ITU) Digital Opportunity Index (DOI) is based on internationally-agreed ICT indicators for measuring the Information Society: the 11 core ICT indicators agreed by the Partnership on Measuring ICT for development, grouped in 3 clusters: opportunity, infrastructure and utilization. The DOI has been compiled for 181 economies for a period of three years from 2004-2006. A longer time series exists for 62 leading economies for the period 2000-2006.. http://www.itu.int/osg/spu/statistics/DOI/index.phtml
3. The International Telecommunications Union (ITU) ICT Opportunity Index (ICT-OI) provides measurement across 183 economies, relies on ten indicators that help measure ICT networks, education and skills, uptake and intensity of the use of ICT. For analytical purposes, economies are grouped into four categories, ranging from high to low ICT Opportunities. Apart from cross-country comparisons, the index’s methodology highlights relative movements from 2001 to 2005. A comparison of annual average growth rates shows which countries are making progress and how fast. http://www.itu.int/ITU-D/ict/publications/ict-oi/2007/index.html
4. The United Nations Public Administration Network (UNPAN) E-government Readiness Index is a composite measurement of the capacity and willingness of countries to use e-government for ICT-led development. E-government Readiness Index comprises of the Web measure index, the Telecommunication Infrastructure index and the Human Capital index. Along with an assessment of the website development patterns in a country, it incorporates access indicators, such as infrastructure and educational levels, to reflect how a country is using information technologies to promote access and inclusion. The index assesses a country’s use of internet for provision of information, products and services, its level of telecommunications and its human capital infrastructure development level.
www.unpan.org/egovkb/global_reports/08report.htm
5. The Knowledge Assessment Methodology (KAM) is an interactive benchmarking tool created by the World Bank Institute’s Knowledge for Development Program to help countries identify the challenges and opportunities they face in making the transition to the knowledge-based economy. The KAM consists of 83 structural and qualitative variables for 140 countries to measure their performance on the four Knowledge Economy (KE) pillars: Economic Incentive and Institutional Regime, Education, Innovation, and Information and Communications Technologies. Variables are normalized on a scale of zero to ten relative to other countries in the comparison group. www.worldbank.org/kam
5. The Economist Intelligence Unit’s (EIU) E-readiness Rankings is an annual e-readiness ranking of the word's largest economies since 2000. Currently 69 countries are assessed on their ability to promote and support digital business and information and communications technology (ICT) services. A country's e-readiness is a measure of its e-business environment, a collection of factors that indicate how amenable a market is to Internet-based opportunities. The ranking allows governments to gauge the success of their technology initiatives against those of other countries. It also provides companies that wish to invest in online operations with an overview of the world's most promising investment locations. The rankings are produced in co-operation with the IBM Institute for Business Value. . http://www.eiu.com/site_info.asp?info_name=eiu_2007_e_readiness_rankings
WB/ITIDA RTA ICT IndicatorsCONFIDENTIAL Final Report
19

Box 3: Summary Description of the Core ICT Indicator Sets
The World Bank ICT At-A-Glance (AAG) Country Tables present the most recent country-specific ICT data drawn from many sources. Country tables for 144 economies show the most recent available national data on key indicators of ICT development. The data enable assessment and comparison both over time and across economies to assess ICT capacity, performance, progress and opportunities. http://go.worldbank.org/FDTYJVBR60
The Partnership on Measuring ICT for Development’s Core ICT Indicators List was presented by the Partnership and adopted by participants at the WSIS Thematic Meeting on Measuring the Information Society (Geneva, February 2005). The core list contains four sets of indicators: (i) ICT infrastructure and access (ii) access to, and use of, ICT by households and individuals (iii) use of ICT by businesses and (iv) ICT sector and trade in ICT goods. The principal objective of the list is to help countries which are developing ICT surveys, or adding ICT questions to existing collections, to produce internationally comparable data. The list is not mandatory - countries will always have to respond to national policy needs, which may be only partially covered by the core list. The Core ICT Indicators may be found in Annex 4. http://www.itu.int/ITU-D/ict/partnership/material/set_core_ICT_indicators.pdf
In the following sections (B. – H.), the indices and reports surveyed in this report are described in more detail, and Egypt’s performance in each is assessed.9
B. Networked Readiness Index (WEF and INSEAD) The Networked readiness Index (NRI) measures the degree of preparation of a
nation or community to participate in and benefit from information and communication technologies (ICT) development. It is composed of three component indices which assess the:
environment for ICT offered by a country or community; readiness of the community's key stakeholders (individuals, business and
governments); usage of ICT among these stakeholders.
The NRI has three premises – (a) There are three important stakeholders to consider in the development of ICT: individuals, businesses, and governments; (b) There is a general macroeconomic and regulatory environment for ICT in which the stakeholders play out their respective roles; and (c) The degree of usage of ICT by (and the impact of ICT on) the three stakeholders is linked to their degrees of readiness (or capability) to use and benefit from ICT.
9Also, presentations made by the World Bank at a Workshop in Cairo in September 2007 are
reproduced in Annex 5. WB/ITIDA RTA ICT IndicatorsCONFIDENTIAL Final Report
20

The NRI is part of the Global Information Technology Report (GITR), developed by INSEAD, WEF and the World Bank’s infoDev program. The most recent version of the NRI covers 122 countries, comprising a mix of 84 quantitative and qualitative indicators. The NRI has been compiled for the past four years, covering an increasing number of countries (77 in 2001, 88 in 2002, 102 in 2003 and 104 in 2004). For countries for which data is missing, reasonable estimates are developed based on a variety of techniques including regression analysis (using other variables that are highly correlated to the missing variable) or clustering techniques (estimating data based on country groups of a similar GDP per capita).
The structure of the GITR has changed since its inception. The first year focused on network usage and enabling factors, and it also looked at variables of access, policy, society and the economy. The focus has shifted in the previous two years’ reports to put more emphasis on key stakeholders of ICT development. These stakeholders are represented by Individuals, Businesses and Government, which influence ICT development in the three dimensions of Environment, Readiness and Usage.
NRI Components and Sub-indices
This index starts with a set of over 84 ICT-related variables, divided among 9 sub-indexes. A number of these variables are based on the WEF Global Survey and their capacity to represent a country depends from the rate of response as well as by the sample chosen to circulate the survey. In the composition of the NRI some of these variables were eliminated on the basis of the number of countries for which data was available. The main sources used are three: World Economic Forum, World Bank and
WB/ITIDA RTA ICT IndicatorsCONFIDENTIAL Final Report
21

ITU.
Strengths and Constraints
This highly regarded index provides the ability to drill down from the overall index to component indices, sub-indices and eventually to individual indicators, to locate areas of comparative strength or weakness in a country’s ICT performance.
It includes survey-based indicators that are unavailable elsewhere, provide useful new data and have only one year lag time. However – the survey is weighed heavily and may not be fully representative of the facts on the ground in the country context. For example, in Egypt, the 100 firms surveyed may be too few for the large ICT private sector made up of mostly SMEs, they are too large (large international firms need to be supplemented with smaller local SMEs) and are mostly telecom firms, not the more appropriate IT firms. Direct discussions with the publishers of the survey may be required to, if possible, adapt the survey to the realities on the Egyptian ground.
Egypt’s Performance in the NRI
Egypt’s rankings in the NRI are summarized below. As can be seen in the top three rows, in the overall ranking, Egypt decreased in the relative terms between 2005 to 2006 from position 63 to 77, or from the 55% (just below mid-point) to the 63% percentile. The NRI suggests that Egypt’s positioning relative to all countries surveyed has gotten slightly worse.
Over Time Egypt Percentile10
NRI Overall 2006-2007 (out of 122) 77 63%
NRI Overall 2005-2006 (out of 115) 63 55%
NRI Overall 2004-2005 (out of 104) 57 55%
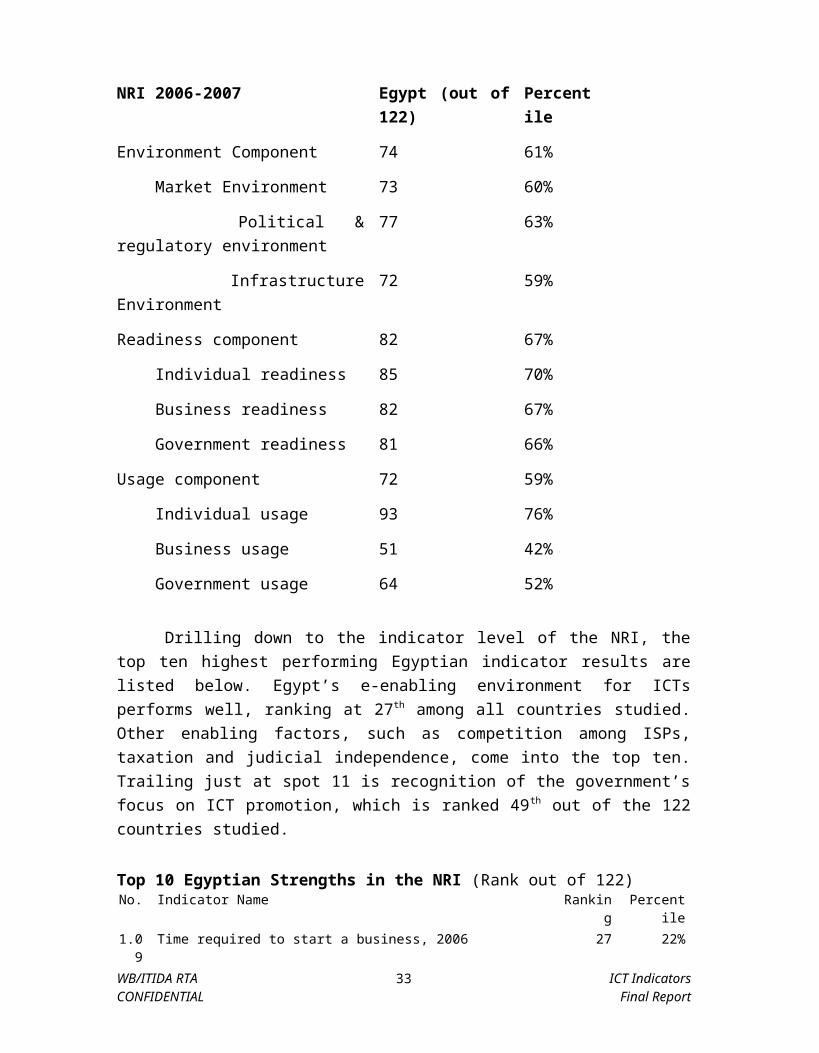
Egypt’s results in the NRI sub-indices are summarized below. It scores best on Individual Business Usage, Government Usage, and less well on Individual Usage and Individual Readiness.
10 For ease of interpretation, a simple percentile measure was introduced. The lower the percentile positioning among 100, the better the result, and conversely, the higher the percentile positioning among 100, the worse the results.WB/ITIDA RTA ICT IndicatorsCONFIDENTIAL Final Report
22

NRI 2006-2007 Egypt (out of 122) Percentile
Environment Component 74 61%
Market Environment 73 60%
Political & regulatory environment 77 63%
Infrastructure Environment 72 59%
Readiness component 82 67%
Individual readiness 85 70%
Business readiness 82 67%
Government readiness 81 66%
Usage component 72 59%
Individual usage 93 76%
Business usage 51 42%
Government usage 64 52%
Drilling down to the indicator level of the NRI, the top ten highest performing Egyptian indicator results are listed below. Egypt’s e-enabling environment for ICTs performs well, ranking at 27th among all countries studied. Other enabling factors, such as competition among ISPs, taxation and judicial independence, come into the top ten. Trailing just at spot 11 is recognition of the government’s focus on ICT promotion, which is ranked 49th out of the 122 countries studied.
Top 10 Egyptian Strengths in the NRI (Rank out of 122)No. Indicator Name Ranking Percentile
1.09 Time required to start a business, 2006 27 22%2.07 Quality of competition in the ISP sector, 2006 35 29%1.08 Extent and effect of taxation, 2006 36 30%5.09 Computer, communications and other service imports, 2004 36 30%8.05 Availability of mobile telephones 37 30%2.03 Judicial Independence 39 32%3.05 Availability of scientists and engineers, 2006 40 33%8.04 Availability of new telephone lines, 2006 43 35%8.01 Prevalence of foreign technology licensing, 2006 45 37%5.07 Business monthly telephone subscription 47 39%9.01 Government success in ICT promotion, 2006 49 40%
WB/ITIDA RTA ICT IndicatorsCONFIDENTIAL Final Report
23

The bottom 10 performing Egyptian indicator results are listed below. While top ten indicators, above, include good availability of scientists and engineers, the quality of public schools, the educational system, the scientific research institutions and the university-industry collaboration are all ranked very low, below. Further education-related indicators are also round out the bottom twenty Egyptian indicators.
Bottom 10 Egyptian Weaknesses in the NRI (Rank out of 122)Indicator Name Ranking Percentile
2.08 No. of procedures to enforce a contract, 2006 113 93%4.03 Quality of public schools, 2006 112 92%2.09 Time to enforce a contract, 2006 108 89%3.03 Internet hosts, 2004 106 87%4.02 Quality of the educational system, 2006 103 84%5.06 Business telephone connection charge, 2005 101 83%1.12 Freedom of the Press 99 81%4.06 Residential telephone connection charge, 2005 97 80%5.04 Company spending on R&D, 2006 97 80%3.06 Quality of scientific research institutions, 2006 94 77%5.05 University-Industry Research Collaboration, 2006 93 76%
C. E-government Readiness Index (UNPAN)11
The United Nations e-Government Survey 2008 presents a comparative assessment of the 192 United Nations Member States’ response to the ever-pressing demands of citizens and businesses for quality government services and products. The Survey evaluates the application of information and communication technologies by governments. The aims to which these technologies are put to use vary, but include: better access and delivery of services to citizens, improved interaction with citizens and business, and the empowerment of citizens through access to information. Overall, they result in a more effective and efficient government in general.
The 2008 Survey is slightly different from previous surveys, as it incorporates more information about the demand side of ‘government to citizen’ interactions (G to C). It also includes some aspects of ‘government to business’ interactions (G to B), as well as the issue of e-government leadership.
The e-government Readiness Index is a composite index comprising the Web measure index, the Telecommunication Infrastructure index and the Human Capital index.
11 Information on this section is taken from UNPAN, e-Government Readiness Report 2008.WB/ITIDA RTA ICT IndicatorsCONFIDENTIAL Final Report
24

The web measure index is based upon a five-stage model, which builds upon the previous levels of sophistication of a Member State’s online presence. As a country migrates upwards through the various stages, it is ranked higher in the web measure index. All of the 192 Member States were assessed in 2007. The web measure survey assessments were based on a questionnaire, which allocated a binary value to the indicator based on the presence/absence of specific electronic facilities/services available. The primary site was the national portal or the official government home page of the Member States. Where no official portals were available, other governmental sites were assessed. The Survey assessed the same number of functionalities of the same or similar sites in each country to ensure consistency. In keeping with its conceptual framework of human development, these are the Ministries/Departments of Health, Education, Social Welfare, Labour and Finance, which are representative of the government services citizens require most. Each ministerial site was assessed on the basis of the same set of questions. This assessment of online services was conducted in October and November of 2007. All the sites were checked several times during those months before the data was validated in order to capture the most recent information and services from these sites. The web measure index provides Member States with a comparative ranking on their ability to deliver online services to their citizens.
The telecommunication infrastructure index 2008 is a composite index of five primary indices relating to a country’s infrastructure capacity as they relate to the delivery of e-Government services. These are:
o Internet Users /100 persons
o PCs /100 persons
o Main Telephones Lines /100 persons
o Cellular telephones /100 persons
o Broad banding /100 persons
Each index represents 20 per cent of the overall telecommunication infrastructure index. The source of the telecommunication infrastructure data obtained for each Member State is the United Nations International Telecommunication Union (ITU).
WB/ITIDA RTA ICT IndicatorsCONFIDENTIAL Final Report
25

The human capital index is a composite of the adult literacy rate and the combined primary, secondary and tertiary gross enrolment ratio, with two thirds weight given to the adult literacy rate and one third to the gross enrolment ratio. The data for the adult literacy rate and the gross enrolment ratio was drawn primarily from the United Nations Educational, Scientific and Cultural Organization (UNESCO). This was supplemented with data from the UNDP Human Development Report.
In total, 21 citizens’ informative and participatory services and facilities were assessed across 189 countries, in instances in which these services and facilities were online and where data was available. Questions were grouped under three categories: e-information, e-consultation and e-decision-making. Each country was assessed on a scale of 0-4.35 The index was constructed by standardizing the scores.
o E-Information - The government website offers information on the list of elected officials, government structure, policies and programmes, points of contact, budget, laws and regulations and other information of public interest. Information is disseminated through a number of online tools such as: community networks, blogs, web forums, text messages (micro democracy), newsgroups and e-mail lists.
o E-Consultation - The government website provides the tools necessary for e-consultation. It allows citizens to set the agenda for the debate through e-petitioning. The government ensures that its elected officials have a website to communicate directly with their constituents. It maintains an archive of their discussions and provides feedback to citizens.
o E-Decision-Making - The government is willing to take into account the e-inputs of citizens into the decisionmaking process. The government informs its citizens on what decisions have been taken based on the consultation process.
To continue scoring well on UNPAN’s e-Readiness index, Egypt needs to carefully consider which e-Government and e-Participation websites and services are used by UNPAN for its Web Measure and e-Participation indices, and significantly improve those sites.
WB/ITIDA RTA ICT IndicatorsCONFIDENTIAL Final Report
26

Strengths and Constraints
The UNPAN e-Government Readiness ranking has, at 192 countries, the broadest coverage among the indices studied.
It uses some standard sectoral ICT indicators, but supplements these with an e-Government specific data resulting from UNPAN’s own Web Measure Survey, which are unique and unavailable elsewhere.
Egypt’s Performance in the UNPAN Index
Egypt has performed notably well in both the 2008 and 2005 e-Government Readiness reports. Excerpts from both reports indicate this, as can be seen below:
Egypt continues to lead the North African region and continues to move up the rankings. It should be noted that Egypt was ranked 140th [sic] in the 2005 survey, moving to 79th in the 2008 Survey. Egypt also scored high in the web measure index (0.6054), ranking 28th globally. Egypt’s national website has downloadable forms, and allows the online submission of forms and payment by credit card, all on a secured link. The national website also provides interaction with PDAs and WAP (wireless application protocol). Egypt has also invested in multimedia with video and audio links on their website. The Ministry of Education of Egypt http://knowledge.moe.gov.eg/arabic/ has improved its website by making it more interactive. Citizens can receive information via e-mail, download registration forms, and see and hear video and audio clips. Source; UNPAN e-Government Readiness Report 2008
WB/ITIDA RTA ICT IndicatorsCONFIDENTIAL Final Report
27

Table 4: e-Government Readiness for North Africa
Egypt’s stellar performance in the UNPAN is based on the index’s inclusion of the considerably weighted e-government web measurement survey. Egypt’s efforts in e-government were noticed and scored high points, and thus resulted in the noticeable increase in ranking.
Table 5: Web Measurement Assessment 2008: The Top 35 Countries
In addition, Egypt’s results compare well when benchmarked against other leading developing countries:
WB/ITIDA RTA ICT IndicatorsCONFIDENTIAL Final Report
28

Table 6: Stages of e-Governemnt 2008: Selected Countries
This 2008 report, then, using 2006 and 2007 data, gives Egypt recognition and credit for its projects in e-Government over the last few years.
D. Digital Opportunity Index (ITU) and ICT Opportunity Index (ITU)12
The DOI (ITU)
The Digital Opportunity Index (DOI) is an e-index based on internationally-agreed ICT indicators. This makes it a valuable tool for benchmarking the Information Society, measuring the digital divide and comparing ICT performance within and across countries.
It has been compiled for 181 economies for a period of three years from 2004-2006. A longer time series for 62 leading economies for the period 2000-2006 is also available. The DOI is based on 11 ICT indicators, grouped in 3 clusters: opportunity, infrastructure and utilization:
Opportunity: in order to participate in the information society, consumers must
12 Materials from this section were collected from the ITU web site on DOI methodology at http://www.itu.int/ITU-D/ict/doi/methodology.html March 2008 and from ITU, World Information Society Report 2007, Chapter 3 on “Digital Opportunity Index.”WB/ITIDA RTA ICT IndicatorsCONFIDENTIAL Final Report
29

have accessibility to ICT service and must be able to afford it. The percentage of the population covered by mobile cellular telephony represents coverage (basic accessibility) while the two tariff indicators, Internet access tariffs as a percentage of per capita income and Mobile cellular tariffs as a percentage of per capita income, reflect affordability.
Infrastructure: includes network indicators such as the proportion of households with a fixed line telephone, mobile cellular subscribers per 100 inhabitants, proportion of households with Internet access at home and mobile Internet subscribers per 100 inhabitants. It also includes the devices that provide the interface between the user and the network; here it is represented by proportion of households with a computer.
Utilization: shows the extent of ICT usage and includes proportion of individuals that used the Internet. Quality reflects a level of access that enables higher degrees of functionality. This provides support for services such as video streaming that can enhance desirable information society applications such as telemedicine, e-government and e-learning. The indicator selected for this category is the ratio of broadband subscribers among Internet subscribers (divided between fixed and mobile).
The DOI uses a subset of the core infrastructure, household and individual access indicators, which are most widely available among countries. This keeps the research manageable and enables the inclusion of a diverse set of countries since the other core indicator sets generally have more limited country coverage at this point in time.13
13 Measuring the Information Society 2007: ICT Opportunity Index and World Telecommunication/ ICT Indicators, ITU, 2007. WB/ITIDA RTA ICT IndicatorsCONFIDENTIAL Final Report
30

Figure 5: Digital Opportunity 2005/2006
Note: The index ranges between 1 and 0, where 1 would be complete digital opportunity.
Source: World Information Society Report 2007: Beyond WSIS.
It also follows the same methodology as the Human Development Index of the United Nations Development Program. The indicators are normalized relative to desirable values or goalposts.
For example, a goalpost of 100 was established for mobile cellular subscribers per 100 inhabitants. Assuming a country had 60 mobile cellular subscribers per 100 inhabitants, then the index value would be 0.6 (60/100). Indicators are weighted within their groups and then the groups are averaged to arrive at the value.
Table 7: Structure of the DOI 2006
DOI Structure
Category / indicator GoalpostWeight within
category (%)
Opportunity
Percentage of population covered by mobile cellular telephony100 33
Mobile cellular tariffs as a percentage of per capita income0 33
Internet access tariffs as a percentage of per capita income0 33
WB/ITIDA RTA ICT IndicatorsCONFIDENTIAL Final Report
31

Infrastructure
Proportion of households with a fixed line telephone 100 20
Mobile cellular subscribers per 100 inhabitants100 20
Proportion of households with Internet access at home100 20
Mobile Internet subscribers per 100 inhabitants100 20
Proportion of households with a computers 100 20
Utilization
Internet users per 100 inhabitants100 33
Ratio of (Fixed) Broadband Internet subscribers to total Internet subscribers100 33
Ratio of (Mobile) Broadband Internet subscribers to mobile Internet subscribers100 33
Note: The indicator is divided by the goalpost to obtain the sub index value. The weighted value is obtained by multiplying the sub index by the weight shown in this table. The Digital Opportunity Index is calculated by averaging the three category scores.
Egypt’s Performance in the DOI Index 2006
With a score of 0.41, and a rank of 91 out of, Egypt is placed in the “Economies with Medium DOI scores (0.30-0.49) – Rounded growth” category, along with other developing giants such as Brazil, Indonesia and China (see the 10 countries ranked above and below Egypt in the Table below).
Medium-DOI countries, and Egypt included, have high average “Opportunity” due to good mobile coverage and relatively low prices. What distinguishes this group from the low-DOI economies is that their “Infrastructure” and “Utilization” of advanced technologies are growing, but are only at levels of around a third of those achieved by high-DOI economies.14
Table 8: Egypt in the DOI
14 ITU, World Information Society Report 2007, Chapter 3 on “Digital Opportunity Index”WB/ITIDA RTA ICT IndicatorsCONFIDENTIAL Final Report
32
Rank Country DOI Score81 Oman 0.4482 Thailand 0.4383 Algeria 0.4284 Belize 0.4285 Dominican Republic 0.4286 South Africa 0.4287 Tunisia 0.4188 Georgia 0.4189 Panama 0.4190 Ukraine 0.4191 Egypt 0.4192 Tonga 0.4193 Lebanon 0.4094 Kazakhstan 0.4095 El Salvador 0.4096 Peru 0.4097 Ecuador 0.4098 Palestine 0.4099 Fiji 0.39100 Botswana 0.38101 Azerbaijan 0.38
3.1b: Digital Opportunity Index 2005/06 – WorldSource: ITU/UNCTAD/KADO Digital Opportunity Platform
The ICT-OI (ITU)15
The ITU’s ICT Opportunity Index (ICT-OI) is based on a list of indicators and methodology to track the digital divide by measuring the relative difference in ICT Opportunity levels among economies and over time. The different sub-indices allow countries to further identify their specific weaknesses and strengths.
The 2007 index, which provides measurement across 183 economies, relies on ten indicators that help measure ICT networks, education and skills, uptake and intensity of the use of ICT. For analytical purposes, economies are grouped into four categories, ranging from high to low ICT Opportunities. Apart from cross-country comparisons, the index’s methodology highlights relative movements from 2001 to 2005. A comparison of annual average growth rates shows which countries are making progress and how fast.
15 Materials for this section were collected from the ITU website on the ICT-DOI, particularly at http://www.itu.int/ITU-D/ict/publications/ict-oi/2007/index.html and the ITU, Measuring the Information Society 2007 report.WB/ITIDA RTA ICT IndicatorsCONFIDENTIAL Final Report
33

The four sub-indices are composed of the following indicators:
Network index: fixed telephone lines per 100 inhabitants, mobile cellular subscribers per 100 inhabitants, and international internet bandwidth (kbps per inhabitant).
Skills index: adult literacy rate, and gross school enrolment rates. Uptake index: computers per 100 inhabitants, Internet users per 100 inhabitants and proportion of households with a TV.
Intensity index: total broadband internet subscribers per 100 inhabitants, international outgoing telephone traffic (minutes) per capita.
Figure 6: ICT-DOI Index
The 2007 ICT-OI is the result of the merger of the ITU’s Digital Access Index (DAI) and Orbicom’s Monitoring the Digital Divide/Infostate. The conceptual framework has been modified since it was last published in 2005.
Egypt’s Performance
As in the previous year of the ICT-OI, Egypt does well in the “Skills” sub-index (with a score of 91.2; see figure below) – which however is based on non-ICT-related education indicators such as literacy and school enrolment. It performs roughly the same on the Networks, Uptake and Intensity sub-indices (76, 72 and 78 respectively). Its score on the ICT-DOI could advance through progress and improved results in the segments of fixed line infrastructure, international internet bandwidth, Internet users, PCs per inhabitants, broadband subscribers and international outgoing telephone traffic.
WB/ITIDA RTA ICT IndicatorsCONFIDENTIAL Final Report
34

Table 9: Egypt in the ICT-OI16
Economy NETWORKS
index
SKILLSindex
UPTAKEindex
INTENSITYindex
ICT-OI value
Average
annual growth
rate 2001-2005
MEDIUM Score Group AVERAGE (63 economies)
103.6 110.1 98.5 100.65 101.22
49.19
Georgia 93.3 121.3 75.4 77.84 90.28 44.61 Iran (I.R.) 76.8 98.4 117.4 73.11 89.74 44.16 Palestine 78.4 122.7 81.5 81.27 89.33 35.66 Mongolia 58.3 123.4 111.2 73.82 87.68 56.32 Armenia 69.6 118.0 92.8 76.17 87.30 69.29 Kazakhstan 98.9 131.5 55.1 73.90 85.32 52.73 Azerbaijan 83.0 108.5 74.9 73.42 83.90 68.12 Tonga 87.1 110.6 43.0 101.69 80.54 87.46 Morocco 73.1 68.8 78.5 101.15 79.50 57.95 Albania 91.8 108.9 53.9 73.29 79.25 57.49 Egypt 75.9 91.2 71.5 77.97 78.82 51.89 Philippines 64.9 114.2 67.8 76.73 78.81 26.87 Cape Verde 75.0 65.7 89.7 82.53 77.70 29.37 Paraguay 64.7 107.7 68.5 75.82 77.59 28.39 Viet Nam 71.0 96.6 62.7 80.37 76.66 76.19 Syria 71.7 94.0 68.8 73.90 76.53 82.59 Algeria 79.9 94.6 45.4 94.83 75.55 107.84 Namibia 64.0 87.9 68.4 76.91 73.74 25.65 Micronesia 62.3 110.6 55.7 76.73 73.67 178.63 Bolivia 67.7 117.3 47.2 76.80 73.24 24.40 Guatemala 84.5 79.1 48.2 84.96 72.34 43.81
E. Knowledge Assessment Methodology (KAM)
1. Data Categories and Methodology17
The application of knowledge – as manifested in areas such as entrepreneurship and innovation, research and development, software and design, and in people’s education and skills levels – is now recognized to be one of the key sources of growth
16 Full data results are available at http://www.itu.int/ITU-D/ict/publications/ict-oi/2007/material/table1.html#upper .17 For details on the KAM methodology, please refer to Derek H. C. Chen and Carl J. Dahlman, The Knowledge Economy, the KAM Methodology and World Bank Operations, October 2005, available at http://siteresources.worldbank.org/KFDLP/Resources/KAM_Paper_WP.pdf .WB/ITIDA RTA ICT IndicatorsCONFIDENTIAL Final Report
35

in the global economy. Countries such as Korea, Malaysia, Finland, China and Chile illustrate the rapid progress that can be made over relatively short periods of time by pursuing coherent strategic approaches to building their country’s capabilities to create, access, and use knowledge.
The transition to becoming a knowledge economy requires long-term strategies that focus on developing the four KE pillars. Initially this means that countries need to understand their strengths and weaknesses, and then act upon them to develop appropriate policies and investments to give direction to their ambitions and mechanisms to enable the policy makers and leaders to monitor progress against the set of goals.
To facilitate this transition process, the World Bank Institute’s Knowledge for Development (K4D) Program has developed the Knowledge Assessment Methodology (KAM - www.worldbank.org/kam ), which is an Internet-based tool that provides a basic assessment of countries’ and regions’ readiness for the knowledge economy. The KAM is a user-friendly interactive diagnostic and benchmarking tool that is designed to help client countries understand their strengths and weaknesses by comparing themselves with neighbors, competitors, or other countries that they may wish to emulate based on the four KE pillars. The KAM is therefore useful for identifying problems and opportunities that a country may face, and where it may need to focus policy attention or future investments, with respect to making the transition to the knowledge economy. The unique strength of the KAM lies in its cross-sectoral approach that allows a holistic view of the wide spectrum of factors relevant to the knowledge economy.
The KAM uses 83 structural and qualitative variables. The comparison is undertaken for a group of 140 countries, which includes most of the OECD economies and more than 90 developing countries. To allow for a flexible cross-country comparison, each variable is available in both actual and relative value (normalized on a scale of zero to ten relative to other countries in the comparison group.)
The variables serve as proxies for the four pillars of the Knowledge Economy framework:
An economic and institutional regime to provide incentives for the efficient use of existing and new knowledge and the flourishing of entrepreneurship;
An educated and skilled population to create, share, and use knowledge well;WB/ITIDA RTA ICT IndicatorsCONFIDENTIAL Final Report
36

An efficient innovation system of firms, research centers, universities, consultants and other organizations to tap into the growing stock of global knowledge, assimilate and adapt it to local needs, and create new technology;
Information and communication technology to facilitate the effective creation, dissemination, and processing of information.
Included in the KAM are several variables that track the overall performance of the economy. These variables help to illustrate how well an economy is actually using knowledge for its overall economic and social development.
The KAM offers several pre-set display modes for simple visual representations of a country's Knowledge Economy readiness. A country can be assessed and compared with others on the aggregate performance on each of the KE pillars or the overall Knowledge Economy and Knowledge indexes for 1995 and the most recent available year. The KAM also makes possible customized country analysis and cross-country comparison on the indicators hand-picked by the user. This allows for capturing various aspects of a country's ability to generate, diffuse and apply knowledge for economic development.
Variables are normalized on a scale of zero to ten relative to other countries in a user-selected comparison group.
The KAM also allows derivation of a country’s overall Knowledge Economy Index (KEI) and Knowledge Index (KI) scores. The KEI is an aggregate index that represents the overall level of development of a country or region in the Knowledge Economy. It summarizes performance over the four KE pillars and is constructed as the simple average of the normalized values of the knowledge indicators of the KAM’s basic scorecard (to be discussed below).
The KAM data are available for viewing in six different modes:
1. Basic Scorecard uses fourteen key variables as proxies to benchmark countries on the aforementioned four KE pillars and derives their overall KEI and KI indexes. The scorecard allows comparisons for up to three countries for 1995 and the most recent available year. The basic scorecard can be thus seen as a disaggregated representation of the Knowledge Economy Index.
2. Choose Variables allows selection of any combination of the 83 variables and comparison of up to three countries or regions for the most recent available year.
3. KEI and KI Indexes presents performance scores of all countries on the KEI and KI indexes, as well as on the four KE pillars, in a table format that is enabled for sorting.
WB/ITIDA RTA ICT IndicatorsCONFIDENTIAL Final Report
37

4. Over Time Comparison demonstrates countries’ progress on Knowledge Economy pillars and indexes from 1995 to the most recent year.
5. Cross-Country Comparison allows bar-chart comparison of up to 20 countries on their KEI and KI indexes while demonstrating the relative contribution of different KE pillars to the countries' overall knowledge readiness.
WB/ITIDA RTA ICT IndicatorsCONFIDENTIAL Final Report
38

Box 5 The Key Indicators
The Economic Incentive and Institutional Regime1. Tariff & Non-Tariff Barriers 2. Regulatory Quality3. Rule of Law
Education and Human Resources1. Adult Literacy Rate2. Secondary Enrolment3. Tertiary Enrolment
The Innovation System1. Royalties and license fee Payments and Receipts2. Patent Applications Granted by the US Patent and Trademark Office3. Scientific and Technical Journal Articles
These three variables are available in two forms: scaled by population and in absolute values. Thus, both KE and KIE are also available in "weighted" and "unweighted” forms. In innovation, absolute size of resources matters, as there are strong economies of scale in the production of knowledge and because knowledge is not consumed in its use.
Information and Communication Technology (ICT)
1. Telephones per 1,000 people2. Computers per 1,000 people3. Internet Users per 10,000 people
Source: http://go.worldbank.org/SDDP3I1T40 . Definitions and sources for these indicators are at http://go.worldbank.org/9PM78XYUU0 .
WB/ITIDA RTA ICT IndicatorsCONFIDENTIAL Final Report
39

WB/ITIDA RTA ICT IndicatorsCONFIDENTIAL Final Report
40
Box 6: The KAM Normalization Methodology
The KAM uses variables that are measured in different units and on different scales. To calculate aggregate knowledge economy indexes, as well as to simplify graphic representation of countries’ comparative performance, we bring all the indicators to the same standard of measurement through the process known as normalization. First, countries are ranked in order from “best” to “worst” using their actual scores on each variable. Then, their scores are normalized on a scale of 0 to 10 against all countries in the comparison group. (See the formula below) 10 is the top score for the top performers and 0 the worst for the laggards. The top 10% of performers gets a normalized score between 9 and 10, the second best 10% gets allocated normalized scores between 8 and 9 and so on. In other words, the 0-10 scale ranks the performance of each country on each variable relative to the performance of the other countries in the sample. The default comparison group is “all countries” (140). The country can also be compared to others in the relevant region, Human Development Index group or income category. In this case, the data will be ranked and normalized only against the selected comparison group. A country will get different normalized scores depending on what group it is compared against. The ability to use both the actual and the relative (normalized) results together gives more insight into what is happening in a particular country or variable. For example, a chart may show that a country’s relative position has worsened between 1995 and the most recent period. This means that either country’s absolute performance on the relevant indicator has actually deteriorated or the absolute performance has improved but not by as much as in the comparator countries. These are two quite different situations and it is very important to know which is happening. It merits attention that an economy should not necessarily aim for a perfect score of 10 on all variables and be on the outer edges of the scorecard. Some variables reflect performance; others reflect trade-offs which characterize different development strategies; still others reflect the particular structural characteristics of an economy. The normalization procedure used in the KAM is as follows:
1. The actual data (u) is collected from World Bank datasets and international literature for all the variables and countries.
2. Ranks are allocated to countries based on the absolute values (actual data) that describe each and every one of 83 variables (rank u). Countries with the same performance are allocated the same rank. Therefore, the rank equals 1 for a country that performs the best among the countries in our sample on a particular variable (that is, it has the highest score), the rank equals to 2 for a country that performs second best, and so on.
3. The number of countries with worse rank (Nw) is calculated for each country.
4. The following formula is used in order to normalize the scores for every country on every variable according to their ranking and in relation to the total number of countries in the sample (Nc) with available data:
5. The above formula allocates a normalized score from 0 to 10 for each country.

Strengths and Constraints
The KAM provides access to a wide range of data, some of which are not ICT-specific, but contextual to the knowledge economy and ICT-enabling environment overall. Only one pillar is ICT-specific and offers basic data – the other pillars’ indicators are not directly representative or linked to ICT-related performance. While the KAM does not offer a ranking, it does provide powerful scorecards and impressive online graphing and analytical tools – which are unique among the indices studied.
Egypt’s Performance in KAM
a. Basic Scorecard – Standard Variables
The chart above shows Egypt’s strongest performance (5 out of 10) is on most education measures, rule of law, royalty payments and receipts, and scientific and technical journal articles per million people. It is not performing well on ICT, Adult Literacy or Tariff and Non-Tariff Barrier measures.
WB/ITIDA RTA ICT IndicatorsCONFIDENTIAL Final Report
41

b. Basic Scorecard – KAM Pillars
This second graph reiterates that Egypt’s strongest performance is in the Innovation pillar, followed closely by the Education pillar (in the previous year’s KAM, the order was reversed). However, progress would be advisable in all of these sectors for improved performance.
c. Basic Scorecard –Indexes and Pillars
This third basic scorecard illustrates all of Egypt’s scores between 2.5 to 5.0 out of 10, with ICT and Economic Incentive and Institutional Regime measures trailing behind Innovation measures.
WB/ITIDA RTA ICT IndicatorsCONFIDENTIAL Final Report
42

d. Over Time Comparison
NB: The countries or regions that are plotted below the 45 degree line indicate a regression in their performance throughout time. The countries or regions that are marked above the line signify improvement. The regression may be due to two reasons: the country either actually has lost ground in absolute terms over time, or improved slower then the comparative group.
The time series comparison depicts Egypt’s regression on the KAM index between 1995 to today. It shows that there has been neither a strong improvement nor regression in Egypt. Other countries such as Poland, Chile, and Turkey have performed better over time.
WB/ITIDA RTA ICT IndicatorsCONFIDENTIAL Final Report
43

e. Cross Country Comparison
The cross-country graph allows comparisons between Egypt and any other covered country. Each bar chart shows the aggregate Knowledge Economy Index (KEI) score and the contribution (relative weight) of different Knowledge Economy pillars to the overall country's knowledge readiness. We see that Egypt scores well on its Innovation score and (this is echoed across the various indices) that Egypt performs well on the education score. However, the results indicate that certain improvements (in the “economic regime” and “ICT environment” both as defined by the measures in this index) would improve Egypt’s score in the KEI.
WB/ITIDA RTA ICT IndicatorsCONFIDENTIAL Final Report
44

f. World Map
The World Map provides a color-coded map for the global view of the world’s KE readiness for 1995 and the most recent year.
It shows that Egypt’s performance is on par with other MNA and some Asian countries, ahead of Sub-Saharan countries, but trailing Eastern European states, and other comparators such as Turkey, Jordan, and Tunisia.
WB/ITIDA RTA ICT IndicatorsCONFIDENTIAL Final Report
45

F. E-Readiness Rankings (EIU)18
The Economist Intelligence Unit has published an annual e-readiness ranking of the world’s largest economies since 2000. The ranking model evaluates the technological, economic, political and social assets of 69 countries and their cumulative impact on their respective information economies.
According to EIU, e-readiness is the “state of play” of a country’s information and communications technology (ICT) infrastructure and the ability of its consumers, businesses and governments to use ICT to their benefit. When a country does more online—or, as is increasingly the case, wirelessly—the premise is that its economy can become more transparent and efficient. Our ranking allows governments to gauge the success of their technology initiatives against those of other countries. It also provides companies that wish to invest in online operations with an overview of the world’s most promising investment locations.
The e-readiness rankings are a weighted collection of nearly 100 quantitative and qualitative criteria, organised into six distinct categories measuring the various components of a country’s social, political, economic and of course technological development. The underlying principle behind the rankings is that digital business is at its heart business, and that for digital transactions to be widely adopted and efficient they have to thrive in a holistically supportive environment. E-readiness derives from more than just the number of computers, broadband connections and mobile phones in the country; also critical are citizens’ ability to utilise technology skilfully, the transparency of the business and legal systems, and the extent to which governments encourage the use of digital technologies.
EIU Methodology
The Economist Intelligence Unit’s e-readiness rankings methodology in 2007 has been modified to reflect the current “state of play” in the development of ICT and its application in the economy, as well as the shifting influence of non-technical factors affecting its implementation. It continues to be a holistic, multi-faceted model that attempts to measure the importance that many unique social, economic and technological factors have in determining the direction of e-commerce in a market.
18 A full copy of the report can be found on the EIU website at http://a330.g.akamai.net/7/330/25828/20070420205432/graphics.eiu.com/files/ad_pdfs/2007Ereadiness_Ranking_WP.pdf.WB/ITIDA RTA ICT IndicatorsCONFIDENTIAL Final Report
46

There are nearly 100 separate quantitative and qualitative criteria, which are scored by Economist Intelligence Unit country analysts and organised into six primary categories. These are, in turn, weighted according to their assumed importance as influencing factors. Major data sources include the Economist Intelligence Unit, Pyramid Research, the World Bank and the World Information Technology and Services Alliance (WITSA), among others. In addition, extensive research has been conducted this year to compile service pricing for major Internet service providers (ISPs) in each market, to provide a richer view on the affordability of Internet services.
New ranking criteria have been introduced in the recent 2007 report, and primary categories changed; in addition, several individual criteria have been retired or had their weighting reassessed. Two categories—connectivity and technology infrastructure, and consumer and business adoption—have seen their ranking criteria significantly adjusted to reflect our current beliefs on the importance of high-speed Internet affordability and the availability of digital public services for both individuals and enterprises. The legal environment category has been refined to reflect a more focused look at the specific government frameworks that influence e-adoption, and a new category, government policy and vision, has been added, better to isolate the effect that policy has on determining a country’s overall e-readiness journey. This process is undertaken by an Economist Intelligence Unit analyst panel led by the director of global technology research. These assessments are, in turn, reviewed by senior economists. The six categories (and their weights in the model) and criteria are described below.
1. Connectivity and technology infrastructureWeight in overall score: 20%Category description: Connectivity measures the extent to which individuals and businesses can access mobile networks and the Internet, and their ability to access digital services through means such as digital identity cards. Effective access uses two primary metrics: penetration and affordability. Penetration of each market’s PCs, mobile phone subscriptions, WiFi “hotspots”, overall Internet users and broadband Internet accounts are ranked as a percentage of the total population; this “basket” of connectivity we feel now to be the optimal representation of
the extent to which voice and data services are accessible to a country’s residents. The affordability of the lowest-priced broadband subscription (in the form of DSL), measured as a percentage of the median monthly household income, is used as the overall measure of digital service affordability. The penetration of secure Internet servers in the population is also used as a reference indicator of the extent to which reliable digital transactions can be made in each market. Finally, a new indicator—the commitment of the country to implementing digital identity cards—is also considered as a means of determining how a country’s population
WB/ITIDA RTA ICT IndicatorsCONFIDENTIAL Final Report
47

can access digital commerce and digital government services. Category criteria: Broadband penetration; broadband affordability; mobile-phone penetration; Internet penetration; PC penetration; WiFi hotspot penetration; Internet security; electronic ID.
2. Business environmentWeight in overall score: 15%Category description: In evaluating the general business climate, the Economist Intelligence Unit screens 70 indicators to provide a comprehensive and forward view of each country’s attractiveness as a trading economy and as a destination for business investment in 2007- 11. The criteria cover such factors as the strength of the economy, political stability, taxation, competition policy, the labour market, and openness to trade and investment. The aggregate scores of the individual indicators are grouped into nine categories, shown below. Updated quarterly as part of the Economist Intelligence Unit’s Country Forecasting Service, these rankings offer investors an invaluable comparative index of 82 economies worldwide.Category criteria: Overall political environment; macroeconomic environment; market opportunities; policy toward private enterprise; foreign investment policy; foreign trade and exchange regimes; tax regime; financing; labour market.
3. Social and cultural environmentWeight in overall score: 15%Category description: Literacy and basic education are preconditions to being able to utilize Internet services, but this category also considers a population’s “e-literacy”—its experience using the Internet and its receptivity to it—and the technical skills of the workforce. These technical skills are evaluated by both evidence of the
familiarity a country’s population has with IT applications, and the extent to which its schools and governments provide the education infrastructure to engender it. We have made one change in assessing the latter criterion, switching to the use of UNESCO data on school life expectancy from our earlier reliance on an internal calculation of mean years of schooling. Continued from the previous year is a look at entrepreneurship and innovation levels in each market (the latter measured by the number of patents registered, as recorded by the World Industrial Property Organization), to evaluate how well the society fosters creative business activity that can lead to the creation of intellectual property, new products and industries.Category criteria: Level of education; level of Internet literacy; degree of entrepreneurship; technical skills of workforce; degree of innovation.
4. Legal environmentWeight in overall score: 10%Category description: E-business development depends both on a country’s overall legal framework and specific laws governing Internet use. This category has been refined in 2007 to reflect those legal frameworks that directly affect the use of digital technology to inform, communicate and transact business. Governments need to be forward-thinking in their creation of legal frameworks to cater to Internet commerce, digital rights management and intellectual property protection, but just as importantly they need to create a legal atmosphere that works to minimize abuses and noncompetitive behavior, including provisions covering consumer protection and legal jurisdiction. E-ready countries are those that allow businesses and individuals to move nimbly and freely, where there is little bureaucracy that interferes with the registration of a
WB/ITIDA RTA ICT IndicatorsCONFIDENTIAL Final Report
48

new business, or restricts access to information. Category criteria: Effectiveness of traditional legal framework; laws covering the Internet; level of censorship; ease of registering a new business.
5. Government policy and visionWeight in overall score: 15%Category description: E-ready governments supply their constituents—citizens and organizations—with a clear roadmap for the adoption of technology, and they lead by example in their use of technology to create efficiencies. The Economist Intelligence Unit has created this new category to assess the activities of governments in this area, and their ability to lead their countries towards a digital future. Are governments employing technology to operate and provide public services with less resource investment? Are they spending on ICT to stimulate similar spending in the greater economy? Are “savings” translated into service gains for citizens? Can more people interact with, and receive information from, the government regardless of their own access to technology?Category criteria: Government spend on ICT as a proportion of GDP; digital development strategy; egovernment strategy; online procurement.
6. Consumer and business adoptionWeight in overall score: 25%Category description: If connectivity, societal adoption, and legal and policy environments are necessary enabling platforms for e-readiness, then the actual utilization of digital channels by people and companies is a measure of successful implementation. The Economist Intelligence Unit looks at the amount that businesses and consumers spend on accessing ICT services and their adoption levels of e-commerce.
This year the Economist Intelligence Unit has also re-oriented the category to include analysis of the availability of digital channels for accessing government services.Category criteria: Consumer spending on ICT per capita; level of e-business development; level of online commerce; availability of online public services for citizens and businesses.
WB/ITIDA RTA ICT IndicatorsCONFIDENTIAL Final Report
49

Strengths and Constraints
This index is highly respected in the business community. It features more indicators than countries – nearly 100 indicators for fewer than 100 countries -- analyzing a smaller set of countries in great detail.
However, unlike most of the other indices, the exact indicators and data are not provided in the report or on its web site.
Egypt’s Performance
The EIU 2007 e-Readiness report finds that Egypt’s “sores are … improving … (despite political uncertainty) … due largely to efforts to improve competition and foreign investment policies.” Overall, Egypt has slipped in the ranking by three points; therefore Egypt’s improvements must be on absolute terms, and not relative to other countries.
Overall score
Connectivity and technology
infrastructure
Business environment
Social and cultural
environment
Legal environment
Government policy and
vision
Consumer and
business adoption
Egypt 4.26 2.75 6.04 5.00 4.00 5.10 3.55
2007 rank / 69 2006 rank / 69 Country 2007 e-readiness score (of 10)
2006 score
56 57 China 4.43 4.0257 52 Russia 4.27 4.1458 55 Egypt 4.26 4.3059 58 Ecuador 4.12 3.8860 61 Ukraine 4.02 3.62
G. World Bank ICT At-A-Glance TablesThe World Bank ICT At-A-Glance (AAG) Country Tables19 present the most
recent country-specific ICT data drawn from many sources. Country tables for 144 economies show the most recent available national data on key indicators of ICT development. The data enable assessment and comparison both over time and across economies to assess ICT capacity, performance, progress and opportunities. The data in the tables are categorized into three sections:
19 World Bank Intranet site http://go.worldbank.org/3IY7E77UQ0.WB/ITIDA RTA ICT IndicatorsCONFIDENTIAL Final Report
50

Economic and social context provides a snapshot of the country’s macroeconomic and social environment. (Data Sources: UNDP, UNESCO, United Nations and World Bank)
ICT sector structure provides an overview of regulatory and policy status in the telecommunication sector. (Data Sources: ITU, WEF)
ICT sector performance provides statistical data on the ICT sector with indicators for access, quality, affordability, institutional efficiency and sustainability, and ICT applications. (Data Sources: Global Insight, WITSA, ITU, Netcraft, UNDESA, UNPAN, and World Bank)
In addition to the data point itself, the country is compared to a regional and income-group average.20 Its income classification may vary each year. For operational and analytical purposes, the World Bank’s main criterion for classifying economies is GNI per capita. Every economy is classified as low income, middle income (these are subdivided into lower middle and upper middle), or high income. Note that classification by income does not necessarily reflect development status. Because GNI per capita changes over time, the country composition of income groups may change each year. In 2006, low-income economies were those with a GNI per capita of $825 or less in 2004.Middle-income economies were those with a GNI per capita of more than $826 but less than $10,066. Lower-middle-income and upper-middle-income economies were separated at a GNI per capita of $3,255. High-income economies were those with a GNI per capita of $10,066 or more. 21
On the right-hand side of each AAG country table are four charts. The GNI per Capita chart shows that indicator from 2000 to 2004 for the country
and the region average. The ICT MDG Indicators chart is based on the three ICT indicators selected for
measuring the Millennium Development Goals (MDGs). The three ICT indicators are fixed and mobile subscribers (per 1,000 people), based on MDG indicator 47; personal computers (per 1,000 people), based on MDG indicator 48a; and Internet users (per 1,000 people), based on MDG indicator 48b.
The Price of Call to the United States chart shows the trend of the price of a three-minute, peak-rate telephone call (in U.S. dollars) to the United States between 2000 and 2004 for the country and the region average.
The Total Telecommunications Revenue chart shows the trend of telecommunications revenue as a percentage of GDP from 2000 to 2004 for the country and the region average.
20 The World Bank regional classifications can be viewed at http://go.worldbank.org/K2CKM78CC021 For further information on regional or income-level classifications, see the World Bank’s country classification Web site: http://www.worldbank.org/data/countryclass/countryclass.html.WB/ITIDA RTA ICT IndicatorsCONFIDENTIAL Final Report
51

H. Core ICT Indicators
The core list of ICT1 indicators list is the outcome of an intensive consultation process by the Partnership on Measuring ICT for Development2 with national statistics offices (NSOs). This included a stocktaking exercise through which metadata on the status of official information society statistics were obtained from NSOs worldwide, as well as a series of regional events on core ICT indicators.
The Partnership on Measuring ICT for Development includes the ITU, OECD,
WB/ITIDA RTA ICT IndicatorsCONFIDENTIAL Final Report
52

UNCTAD, UNESCO Institute for Statistics, UNICTTF, Word Bank, UNECA, UNESCWA, UNECLAC, UNESCAP, and EuroStat.
From these processes, a proposal for a core list of ICT indicators was presented by the Partnership, and adopted by participants, at the WSIS Thematic Meeting on Measuring the Information Society (Geneva, February 2005).
The core list contains four sets of indicators: (i) ICT infrastructure and access (ii) access to, and use of, ICT by households and individuals (iii) use of ICT by businesses and (iv) ICT sector and trade in ICT goods. The principal objective of the list is to help countries which are developing ICT surveys, or adding ICT questions to existing collections, to produce internationally comparable data. The list is not mandatory in any sense - countries will always have to respond to national policy needs, which may be only partially covered by the core list. It is also not final and has to evolve with periodic review.
Strengths and Constraints
In the case of households/individuals and businesses, international standards exist (e.g. by ITU, OECD, EuroStat), although indicators are not universally collected. In respect of measuring ICT in governments (e.g. e-Government indicators), there are currently no international standards and little comparable collection work.
The ICT Core Indicators are an international common denominator. Countries should take next steps to devise their outcome and impact indicators, tailored to their local context. Specific indicators depend on the country’s objectives.
A list of the Core ICT indicators, which include community-level, local access indicators, can be found in Annex 4.
WB/ITIDA RTA ICT IndicatorsCONFIDENTIAL Final Report
53

VI.Mapping and Gap Analysis
A. IntroductionThis section identifies the main gaps to be filled between current Egyptian
practice (either in terms of availability or in terms of quality of the data), identifying strategies/approaches to generate the required data. There are a number of obvious problems with remedial measures that flow from a gap analysis. First, each of the indices/reports has its own focus, so attempting to adjust data categories and collection methodologies to each may be impractical. In a sense the indices/reports are imposing in a “top down” fashion on each country the reporting dynamic of that index or report, in an apparently sometimes arbitrary fashion that may not meet the development needs or reflect the “reality on the ground” of any particular country, including Egypt. In addition, the focus of the indices/reports can be a “moving target” – new indices emerge and existing ones evolve (like the DOI) also making it difficult to “keep up”. Finally the lag time involved (between when data are gathered and ultimately reported) compounds the issue. Strategies for attempting to meet the reporting “requirements” of an index implemented in one year, may not demonstrate the results desired, if, for example, in the time after the data was gathered the reporting index changes its focus. Unfortunately, Egypt will have no control over this issue.
However, there are a number of possible approaches to addressing any gaps in the current data categories and methodologies. First, policy makers could assess the data required under each of the different indices and reports and cross-check that with what CAPMAS currently collects, and make any necessary adjustments with CAPMAS. This could be done by inventorying all of the data categories in all of the indices/reports and mapping it against the data categories gathered by CAPMAS, or, one cold start with the CAPMAS indicators and find where each of the indicators is reflected in one or all of the international indices/reports. This approach, however, would be subject to the toxic cocktail of both the “top down” as well as the “moving target” syndromes. Significant resources would have to be devoted to monitoring these matters. Alternatively, policy makers could, on their own and without reference to the indices, determine what aspects of the sector they would like to measure, ensure that those issues are included in CAPMAS’ surveys, and (after having established lines of
WB /ITIDA RTA ICT IndicatorsCONFIDENTIAL Final Report
54
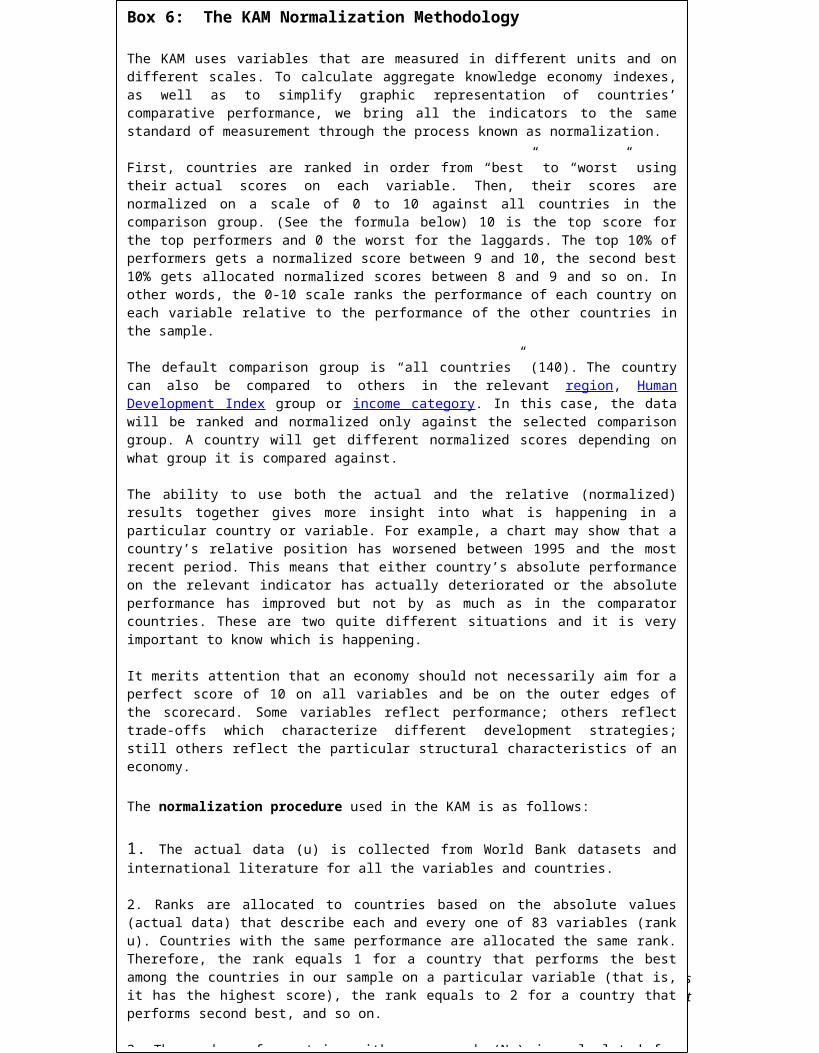
communications with the different indices and reports) work vigilantly with the entities preparing the indices and reports to make sure that Egypt’s “message” gets across in the footnotes.
B. Data Categories
A first effort at the CAPMAS-Indices gap analysis is presented below. A simple comparison between the list of CAPMAS-collected data series (see, Annex 6) and those used in the indices studied was undertaken. Indicators commonly sought for analytical work undertaken by the World Bank22 are also included in italics as areas of possible interest.
First, one can see a disparity in the types of data categories used. CAPMAS’s list uses standard categories largely based on technology, e.g. Telecom Network, Mobile, Traffic, IT, Broadcasting, but then also some contextual categories such as Staff, Tariffs, Quality of Service and Revenues and Investment. There are sections containing indicators on Trade, enterprises and business, however they are not clearly labeled. On the other hand, the indices studied, employ (in addition to standard connectivity and infrastructure categories), categories that delve extensively into the context and environment in which ICT reforms take place. Some examples from the indices are Market Environment, Regulatory Environment, Skills, Uptake, Social and Cultural Environment, Education and Human Resources, and Innovation System. It would be useful for Egypt to restructure its categorization system to include more of these categories and indicators.
The gap analysis in Annex 6 lists all the indicators that are currently not published for Egypt and would be useful for analysis. Egypt should consider including these in its ICT reports. Following are the results of two detailed gap analyses. The first lists indicators contained in major ICT Indices that are not tracked in Egypt. The second lists indicators that derive from surveys not undertaken in Egypt.
Gap Analysis List 1: Indicators of Major ICT indices that are either (a) currently not tracked by Egypt or (b) not disseminated or communicated in a way accessible to ICT index producers
22 For examples of research work commonly undertaken by the World Bank, see www.worldbank.org/ict and click on “Resources”
WB /ITIDA RTA ICT IndicatorsCONFIDENTIAL Final Report
55

Some of the indices use indicators that do not, at first glance, appear to be directly relevant to ICTs. However, they are important to assess the general environment in which ICT reforms take place. With successful ICT reform, the indices’ producers expect to see positive changes in these measures and have therefore taken them into account when analyzing Egypt's performance. In that regard, Egypt could consider disseminating its own locally-produced context-indicators (especially ones known to be used by the indices) to improve its rankings in those indices.
Outcome indicators for all data categories Impact indicators for most categories e-Government indicators (output, outcome and impact indicators) Poverty (% of population below $1 a day) Separate telecommunications regulator Status of main fixed-line operator Level of competition: international long distance Level of competition: mobile Level of competition: Internet service provider Secure Internet servers Domestic Credit to Private Sector as % of GDP Cost to Register a Business as % of GNI Per Capita Days to Start a Business Cost to Enforce a Contract (% of Deb)t Royalty and License Fees Payments (US$ mil. Royalty and License Fees Receipts (US$ mil.) Science and Engineering Enrolment Ratio (%) Total Expenditure for R&D as % of GDP Manuf. Trade as % of GDP Scientific and Technical Journal Articles Scientific and Technical Journal Articles / Mil. People Availability of Venture Capital (1-7) Patents Granted by USPTO Patents Granted by USPTO / Mil. People High-Tech Exports as % of Manuf. Exports Average Years of Schooling Public Spending on Education as % of GDP Prof. and Tech. Workers as % of Labor Force 8th Grade Achievement in Mathematics 8th Grade Achievement in Science Seats in Parliament Held by Women (as % of total) Daily Newspapers per 1,000 People Scientific and Technical Journal Articles Televisions per capita Broadband affordability WiFi hotspot penetration Internet security
WB /ITIDA RTA ICT IndicatorsCONFIDENTIAL Final Report
56

Electronic ID Overall political environment Macroeconomic environment Market opportunities Policy toward private enterprise Foreign investment policy Foreign trade and exchange regimes Tax regime Financing Labor market Level of Internet Literacy Degree of entrepreneurship Technical skills of workforce Degree of innovation Effectiveness of traditional legal framework Laws covering the Internet Level of censorship Ease of registering a new business Digital development strategy E-government strategy Online procurement Consumer spending on ICT per capita Availability of online public services for citizens and businesses Proportion of total business sector workforce involved in the ICT sector Value added in the ICT sector (as a percentage of total business sector value
added) ICT goods imports as a percentage of total imports ICT goods imports as a percentage of total exports Internet hosts per 10,000 inhabitants Lowest cost of broadband
In addition, the indices studied use a large number of survey-based indicators, which are external to the Egyptian collection process but are weighted heavily to determine Egypt’s performance in the rankings. These indicators are listed here below.
Gap Analysis List 2: Indicators of major ICT indices that emanate from surveys not undertaken by Egypt
In reviewing the following indicators (indicators that are used by some indices but are not currently included in surveys undertaken by Egypt), Egypt should carefully consider the expense and effectiveness of attempting to independently gather these data.
WB /ITIDA RTA ICT IndicatorsCONFIDENTIAL Final Report
57

Human Development Index Poverty Index Composite Risk Rating Soundness of Banks Gender Development Index e-Government Readiness Ranking Infrastructure Index Telephone subindex Mobile subindex PC subindex Internet users subindex Online population subindex TV subindex e-Participation Index Human Capital Index - Education UNDP E-government readiness index Tariff & Nontariff Barriers Intellectual Property Protection Intensity of Local Competition Regulatory Quality Rule of Law Government Effectiveness Voice and Accountability Political Stability Control of Corruption Press Freedom (1-100) University-Company Research Collaboration Private Sector Spending on R&D Firm-Level Technology Absorption Value Chain Presence Internet Access in Schools Quality of Science and Math Education Extent of Staff Training Quality of Management Schools Brain Drain Availability of e-Government Services Extent of Business Internet Use Web Measure Index % utilization of e-Gov sites in all 5 Phases % utilization of e-Gov sites -Phase 1 % utilization of e-Gov sites -Phase 2 % utilization of e-Gov sites -Phase 3 % utilization of e-Gov sites -Phase 4 % utilization of e-Gov sites -Phase 5 Availability of venture capital Financial market sophistication Technological readiness
WB /ITIDA RTA ICT IndicatorsCONFIDENTIAL Final Report
58

State of cluster development US utility patents High-tech exports Burden of government regulation Extent and effect of taxation Time required to start a business Number of procedures required to start a business Intensity of local competition Effectiveness of law-making bodies Laws relating to ICT Judicial independence IP protection Efficiency of legal framework Property rights Quality of competition in the ISP sector Number of procedures to enforce a contract Number of days to enforce a contract Quality of math and science education Quality of the educational system Quality of public schools Buyer sophistication Local availability of specialized research and training services Company spending on research and development Local supplier quality Government procurement of advanced technology products Importance of ICT to government's vision of the future Prevalence of foreign technology licensing Firm-level technology absorption Capacity for innovation Availability of new telephone lines Availability of cellular phones Extent of business Internet use Government success in ICT promotion Availability of online services ICT use and government efficiency ICT pervasiveness
C. Sample Outcome and Impact Indicators for EgyptThe following analysis is an example of measuring outcome and impact indicators
based on Egypt’s objectives contained in its 2005 Vision of the Information Society (MCIT). These objectives are expressed in the graphic, below. Each of the seven categories is addressed in turn.
Figure 7: Egypt’s Seven Bridges from the Digital Divide to the Information Society
WB /ITIDA RTA ICT IndicatorsCONFIDENTIAL Final Report
59

WB /ITIDA RTA ICT IndicatorsCONFIDENTIAL Final Report
60

e-Readiness à is defined by Egypt as the provision of easy and affordable access to the opportunities afforded by new technologies. The following indicators are indicative examples of measuring e-Readiness.
e-Learning à is defined by Egypt as the promotion of the use of ICTs in education and developing a new generation who understand and are comfortable with ICTs in their daily lives. The following indicators are indicative examples of measuring e-Learning.
WB /ITIDA RTA ICT IndicatorsCONFIDENTIAL Final Report
61
Outcome Indicators
• Reduction of distance or time traveled to nearest phone
• Increase in localities with Internet
• Reduction of Internet cost basket price as % of GDP p/c
• Reduction of telecom cost basket price as % of GDP p/c
• Increase in population coverage by mobile signal
• Existence of an independent regulatory agency and a strengthened regulatory framework
• Upgrade of infrastructure through private sector investment
Impact Indicators
• Increase in GDP/cap
• Effective competition in sector and sub-sectors
Outcome Indicators• Percentage growth of ICT graduates who find employment in ICT sector• Increase in salary of ICT-certified students • Increased public-private partnership in education• Increase of female students specializing in ICTs • Increase in % of schools with PCs and broadband
Impact Indicators• Increase in GDP p/c• Competitiveness of ICT industry• Increase in innovative entrepreneurship• Joining the “information society”• Upgrade Human Capital in ICT• Long-term employment growth• Reduction of poverty• Higher ranking in UNDP’s HDI

e-Government à is defined by Egypt as the delivery of high-quality public services to the public, where they are and in a format suitable to them. The following indicators are indicative examples of measuring e-Government.
e-Business à is defined by Egypt as the creation of new technology-based firms, improvement of workforce skills, use of e-documents, e-payment to increase employment, new jobs and competitiveness, esp. in e-commerce and e-business. The following indicators are indicative examples of measuring e-Business.
WB /ITIDA RTA ICT IndicatorsCONFIDENTIAL Final Report
62
Outcome Indicators
• Growth in use of e-payment solution for e-commerce
• Rate of private firm’s participation in e-commerce
• Corporate demand at broadband is met
• Proliferation of incubators
• Growth in use of e-signatures
• Growth in FDI
• Private sector is “wired”
Impact Indicators
• Growth of ICT sector contribution to GDP
• Creation of Egypt as a brand for ICT business
• Increase of e-Commerce
• Growth in Total Factor Productivity
• Creation of new jobs in ICT sector
• Increase in firm profitability
Outcome Indicators• Implementation of e-Services that are most in demand by citizens and businesses• Growth of number of transactions on e-government portals• Interoperability among government databases• Effective Use of Public-Private Partnerships
Impact Indicators• Satisfaction with Government Portals (survey) • Cost savings to government, businesses and citizens • Time savings to government, businesses and citizens • Reduction of corruption• Improving services for the poor

e-Health à is defined by Egypt as the provision of better quality of life to citizens and efficient work environment for health care workers. The following indicators are indicative examples of measuring e-Health.
e-Culture à is defined by Egypt as the preservation and provision of worldwide access to Egyptian cultural and historical materials. The following indicators are indicative examples of measuring e-Culture.
ICT Exports à is defined by Egypt as creating an export-oriented ICT industry as a powerful engine for export growth and employment. The following indicators are indicative examples of measuring of ICT exports.
WB /ITIDA RTA ICT IndicatorsCONFIDENTIAL Final Report
63
Outcome Indicators• Increase in number of “networked” and “wired” health• Improved access by rural health staff to pertinent health information• Improved access by doctors to international best practice
Impact Indicators• Improved efficiency for the delivery of Health Services (time, cost)• Improved health of population• Saving lives, curing or preventing illness due with the help of ICTs• Reduction of poverty• Higher ranking in Human Development Index
Outcome Indicators• Growth of ICT service exports• Growth of ICT services as % of GDP • Increase of value-added services
Impact Indicators• Increase in competitiveness• Increase in trade
Outcome Indicators• Growth of transactions on Egyptian cultural portals• Increase in information downloads from Egyptian national archives• Increase in tourism due to “wiredness” of museums and cultural institutions
Impact Indicators• Survey results show that Egypt is a recognized tourism and cultural destination on the Internet • Increase in government revenues due to tourism
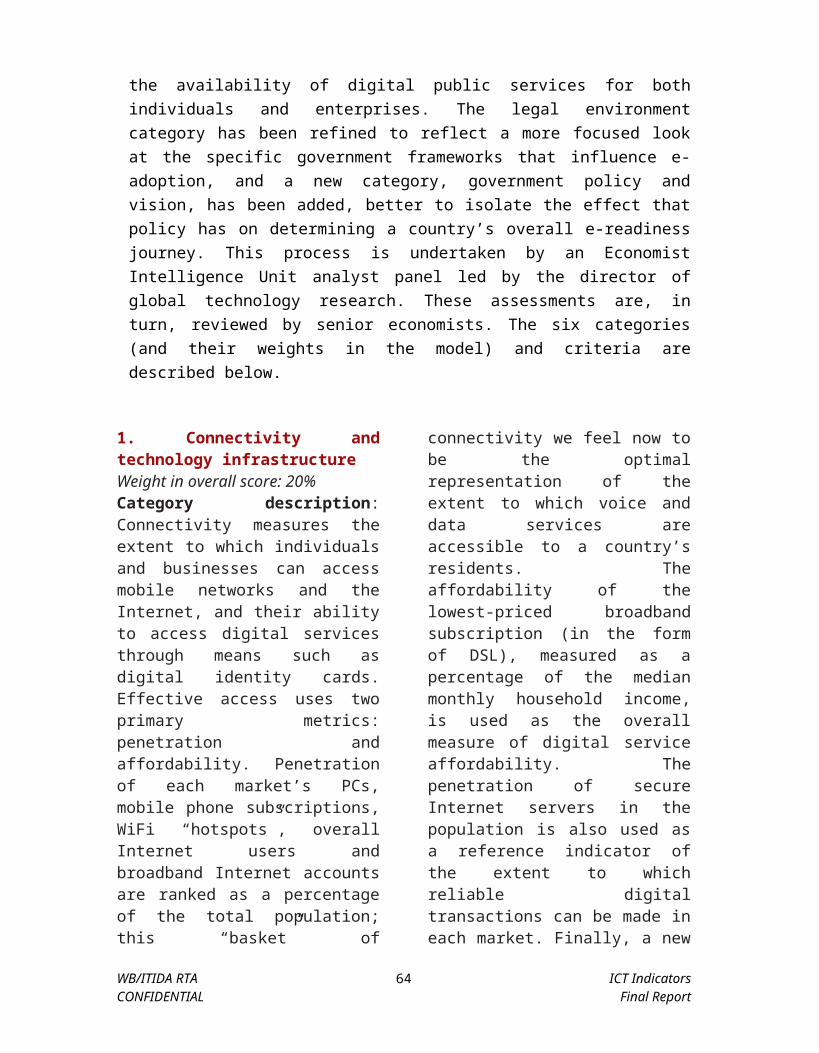
A clear challenge going forward will be balancing data collection and outcome assessment appropriate for national policy development, while at the same time taking into account the various methodologies of international best practices in OECD countries, the EU and other countries.
WB /ITIDA RTA ICT IndicatorsCONFIDENTIAL Final Report
64

VII. Recommendations
This chapter contains detailed recommendations based on the analysis in the preceding chapters. It is expected that many aspects of these recommendations will provide the basis for inputs to a follow-on activity of measuring socio-economic impact of ICTs in Egypt as they relate to GDP, investment, trade and employment.
A. Data Categories As described in chapter V, each of the major international indices and reports has
its own data categories. And while there is divergence among them, there are also common elements. At the same time, Egypt conducts its own data gathering based on its own data categories. In some respects these align with those used in the indices and reports. Recommendations on the gaps between what Egypt does and what is reported in these international sources are dealt with in more detail below (see Chapter VI, above). In order to develop more coherence regarding data categories, Egypt could consider:
Conducting data quality assurance and validity evaluations. For example, the methodologies for CPI and the contributions of ICT to growth need to re-examined and amended. This work is expected to be undertaken as part of the second RTA with the World Bank.
Making ICT Clubs data more comparable. All data on ICT clubs are localized to Egypt and difficult to transpose to an internationally comparable level, since similar clubs may not be available in other countries. Perhaps there is a way to transfer this data to a different statistical unit, such as making it available per Internet user rather than per Internet club, or per Internet user who does not have access at home (if Internet club members do not have access at their residence).
Including, as a basic common denominator, all indicators in the “Core ICT Data” list by the Partnership for Measuring ICT4D would be advisable, and perhaps consider adopting a “composite” index for Egypt.
B. Designing SurveysSurvey design is a complex, resource-intensive exercise. On a general level, the
following recommendations can be made for any country’s ICT surveys.23
For surveys conducted on households and individuals
23 Partnership for the Measurement of ICT4D, Core ICT Indicators, 2005.
WB /ITIDA RTA ICT IndicatorsCONFIDENTIAL Final Report
65

Standalone, Labour Force, Household Expenditure, Population Census and General Social surveys are good vehicles for ICT inclusion
Face-to-face surveys are ideal. Postal and telephone surveys are to be avoided. A 12 month recall period is recommended. Household and individuals recommended to be used as statistical units. For
comparability purposes, the proportional data should be provided in terms of the overall population instead of the active population.
For individuals, Eurostat and OECD cover the age groups of 16-74 in private dwellings.
The minimum classificatory variables for household characteristics should be o with/without children under 16, o household size
The minimum classificatory variables for individual characteristics should be:
o Age (a) 16-24, (b) 25-34, (c) 35-44, (d) 45-54, (e) 55-64, (f) 65-74o Gendero Employment statuso Occupation
For surveys conducted on businesses:
OECD countries conduct dedicated postal surveys of ICT use by businesses. Where this is not possible, countries could add questions to an existing economy-wide or industry survey.
Data can also be captured by personal, face-to-face or telephone interviews, drop-off/call-back (or post-back) surveys. In the future, electronic data capture may be viable – though only few OECD countries are using this method.
The frequency of the survey is preferably annual, if possible. OECD and Eurostat use the “enterprise” as the statistical unit, not the
“establishment.” For a definition of “enterprise,” since there is no single definition in all countries, use of the EU’s definition is recommended. For comparability purposes, the proportional data should be provided in terms of the overall population instead of active population.
Most OECD countries exclude non-employers. The general recommendation is for a minimum size scope of 10 or more employees. As a point of comparison, Eurostat specifies a size cut-off at 10 employees or more. OECD does likewise, although there is a range of cut-offs within OECD (including European) countries. However, in developing countries, SMEs can make up an important part of the business community and their inclusion is desirable. Developing countries are encouraged to include smaller businesses where resources permit.
Scope of ICT Industry:o OECD collects business ICT use data from member countries in the
following industries:24
Manufacturing (ISIC D)
24 ISIC definitions of the ICT industry are expected to be updated in 2007. Since ICT is a dynamic sector, the update should be incorporated into future surveys.
WB /ITIDA RTA ICT IndicatorsCONFIDENTIAL Final Report
66

Construction (ISIC F) Wholesale Trade (ISIC 51-G) Retail Trade (ISIC 52-G) Hotels and Restaurants (ISIC H) Transport, Storage and Communications (ISIC I) Finance and Insurance (ISIC J) Real Estate, Renting and Business Services (ISIC K)
o It is recommended that the minimum industry scope be: ISIC sections D, F, G, H, I and K.
o Developing countries are encouraged to collect data from ISIC sections A, B and C and part of O (covering agriculture, hunting, forestry, fishing and mining, recreational, cultural and sporting activities, and other service activities.
Classificatory variables for businesses:o By number of employees: generally (a) 10-49; (b) 50-249; (c) 250 or
more. For developing countries, category 1-9 could also be added.o By Geographyo By Industry: ISIC D, F, G, H, I, J, Ko By Rural versus Urban
C. International Indices An analysis of the different foci of the international indices shows that Egypt, to
improve its rankings in these indices, may need to adapt not only its policy orientations as reflected in the different ICT data collected, but also tailor its data gathering results and processing to address the individual needs of the different indices. Following is a detailed review of specific actions that could be considered with respect to each index:
NRI: Direct discussions with the publishers of the NRI survey may be needed to adapt the survey to the realities on the ground.
According to the NRI index, Egypt would need to focus policy attention to the Individual and his/her use and readiness for ICTs. Especially Egypt’s educational system requires the attention of policymakers. The quality of public schools, the educational system, the scientific research institutions and the university-industry collaboration are all ranked very low.
e-Government Readiness Index
To continue scoring well on UNPAN’s e-Readiness index, Egypt would benefit from considering which e-Government and e-Participation services are used by UNPAN for its Web Measure and e-Participation indices, and significantly improve the services on those sites, as they weigh heavily into the results.
WB /ITIDA RTA ICT IndicatorsCONFIDENTIAL Final Report
67

DOI and ICT-OI
To perform better in the ITU’s Development Opportunity Index, Egypt could focus on the improvement of results of standard ICT and education indicators. No data issues need to be resolved here.
KAM To perform better on the KAM index, it is recommended to improve results on all the indicators it takes into account, in particular patents granted (a USPTO indicator) as well as “Tariff and Non-Tariff Barriers”. In addition, additional focus should be given to improving of results of standard ICT and education indicators.
e-Readiness Index
Since the exact indicators for this index are not published, it is difficult to provide specific recommendations. However, improvement of results of standard ICT and education indicators would appear to improve performance in this ranking.
D. Institutional /Capacity-Building
This section assesses the capacity-building needs of relevant institutions, individually (e.g. training, equipment) and collectively (e.g. coordination, interoperability).
A harmonized ICT database to house the cleaned survey data collected by CAPMAS, as well as other ICT data collected by different agencies such as MCIT, NTRA, ITIDA, GAFI and line ministries (e.g. Health, Education) and non-governmental players such as academia or private sector associations, would add value to research and analytical efforts. The effort to implement such a database would be led by an inter-agency ICT data steering committee, which already exists in Egypt but may need to be fortified. Data formats would be harmonized, such that agencies can upload their contributions into the database, and interested parties are able to download any data for their analytical use.
Annex 7 contains a list of capacity building opportunities in the areas of ICT and M&E. Not all opportunities focus on the intersection of economic and statistical analysis, M&E and the ICT sector. Most focus on one or two topics of this multifaceted research area, or on a region other than MNA, most notably Asia, where quite a few relevant courses are offered.
In addition to the courses listed Annex, 7 it may be that a customized training
WB /ITIDA RTA ICT IndicatorsCONFIDENTIAL Final Report
68

event prepared for the specific needs of ITIDA and MCIT staff and delivered in Cairo (to maximize the participation rates of staff). There are several options in implementing such a training -- including hiring established consultants to deliver separate modules on their expertise, with Bank experts doing the same. The Bank could also work in cooperation with other international and regional bodies.
The time it takes for formal surveys to be conducted may not be adequate to respond to the needs of policy makers on specific issues as they arise. While the official statistical process should be retained, consideration should be given to introducing more flexible, adaptable and scalable approaches to data gathering. In addition to formal statistical data collection, it may also be useful to consider informal or alternative private sector-provided means of making different assessments. Survey and polling organizations could be used.
WB /ITIDA RTA ICT IndicatorsCONFIDENTIAL Final Report
69

VIII. Implications for Socio-Economic Impact Analyses
This chapter examines the appropriateness of adapting the indicators and methodologies discussed elsewhere in this report to the task of assessing the “Socioeconomic Impact” of ICTs in Egypt.25 For purposes of this report “socioeconomic impact” means and includes the contribution of ICT to GDP, investment (mainly from the private sector), employment and ICT exports. It is understood that, while GDP, trade/exports, investment and employment are only a small portion of what socioeconomic impact studies could cover, they are important measurements because they have been identified by the Government as targets in its current 5-year plan. But measurement of ICT on socioeconomic factors such as contribution to growth, GDP, trade and investment, and the impact of ICTs on employment is also a complex undertaking.
The economic impact of ICT has been the subject of several studies. It is commonly accepted that ICT has a clear impact on economic growth, through higher productivity made possible by the use of information technologies in the economy. At the macro level, there is a strong correlation between the level of development of a country’s information infrastructure and its economic growth.
Links to Economic Growth
An increase of 10mobile phones per 100people boosts GDP growth by 0.6%
A 1% increase in the number of Internet users increases total exports by 4.3%
Countries with better Information Infrastructure have higher GNP per Capita Growth
0
1
2
3
Telecoms SectorUnderdeveloped Given
GDP per Capita
Telecoms SectorAdvanced Given GDP per
Capita
GNP per Capita Growth Rate
GN
P p
er C
apita
G
row
th R
ate
Less DevelopedInformation
Infrastructure
More DevelopedInformation
Infrastructure
1.9%
2.6%
Source: GICT MNA Working Paper (2003)
25 See, also, copy of presentation reproduced in Annex 5 made by the World Bank on this subject at the Workshop held in Cairo in September 2007.
WB /ITIDA RTA ICT IndicatorsCONFIDENTIAL Final Report
70

Labor productivity growth, in particular, has been positively impacted by ICT, as shown by the following cross country assessment.
Sources of Labor Productivity Growth 1995-2000
-4-20246
ICT Investment and ICT Production TFP Other Factors
A seminal work on measuring impact of ICTs demonstrates that there are effects, but that they vary country-to-country and those variable effects in countries are themselves the result of a complex set of endogenous and exogenous factors.26 This study is built on a rigorous literature review but is not based on calculations itself, focusing rather on the relationship between ICTs and growth arising out of capital deepening and total factor productivity (TFP). In that report, it states:
“We can conclude that, based on the foundation of a good institutional and enabling environment, increased ICT production contributes significantly to economic growth, and that increased production of ICTs contributes to output, employment and export earnings while ICT use increases productivity, competitiveness and growth.”27
While the impact of ICT on TFP cannot be conclusively proven, the role of ICT as a driver of key economic variables is corroborated by several studies.28 For example, telecommunications has been identified as a key driver of total investment in developed 26 Qiang & Pitt, Contribution of Information and Communication Technologies to Growth, World Bank Working Paper No. 24, World Bank, 2004.27 Ibid, at 1and 2. The three main methodologies surveyed in the paper for measuring impact of ICTs on growth are growth accounting, sectoral contribution analysis and regression analysis.28 Ibid.
WB /ITIDA RTA ICT IndicatorsCONFIDENTIAL Final Report
71

and developing countries alike. Total investment in telecoms in Sub-Saharan Africa was $13.9bn 2001-2005. To have an idea of the relative importance of telecommunications, in 2003, total investment in telecoms in Sub-Saharan Africa has been 27% of total FDI and 0.8% of GDP. Private sector participation and competitions are the necessary pre-requisites for the development of the telecommunications infrastructure. Studies on firm-level competitiveness prove have compared basic firm variables such as profitability, employment growth and sales growth, and have showed that firms intensively using ICT have better performance on those variables.
The link between ICT and trade has also been the subject of several studies. But beyond the macro approach, studies on impact pm trade, for example, are based on multiple, inter-related sectors. The transmission channels between investment in infrastructure and trade are multiple and affect trade development, trade diversification and trade facilitation. The positive correlation between information infrastructure development and trade exists. A 1% increase in the number of Internet users increases total exports by 4.3%. Again, a correlation between inputs and outcomes is strong, while causation is still subject to discussion.
Finally, ICT has positive benefits in terms of employment creation. One study indicates that about 20% of new jobs in the Balkans were IT-related. The same study also showed that around 45% of additional tax revenues were related to IT.
Recognizing the complexity of the impact measurement undertaking, as well as the limited resources available to do so under this RTA engagement, this report will not attempt to provide an analysis of the socioeconomic impact of ICT. Rather, It is understood that a more robust exercise for measuring socioeconomic impact of ICTs will be the main thrust of a second RTA arrangement that is currently under discussion. Finally, the next issue of the World Bank’s IC4D Report will contain chapters covering (a) impact framework of broadband; (b) measuring the impact of telecom services on trade; (c) role of ICT in sustainable rural poverty reduction; and (d) e-government project impact evaluation.
WB /ITIDA RTA ICT IndicatorsCONFIDENTIAL Final Report
72

IX.Bibliography
Information and Communications for Development: Global Trends and Policies, World Bank.
Adamali, Aref; Lanvin, Bruno, and Schware, Robert, E-strategies Monitoring and Evaluation Toolkit, January 2005
Derek H. C. Chen and Carl J. Dahlman, The Knowledge Economy, the KAM Methodology and World Bank Operations, October 2005, http://siteresources.worldbank.org/KFDLP/Resources/KAM_Paper_WP.pdf.
Economist Intelligence Unit, The e -Readiness Rankings 2007 http://www.eiu.com/site_info.asp?info_name=eiu_2007_e_readiness_rankings
ICT Data Resources, World Bank, www.worldbank.org/ict/resources
International Telecommunication Union (ITU) , ICT Opportunity Index (ICT-OI) 2007 http://www.itu.int/doi
__________, Digital Opportunity Index (ICT-DOI) 2007 http://www.itu.int/osg/spu/statistics/DOI/index.phtml
__________, World Information Society Report 2007, Chapter 3
__________, all websites describing the methodologies and results of DOI and ICT-OI at www.itu.int
Fukuda-Parr, S., Lopes, C. & Malik, K. 2002. Institutional innovations for capacity development. In S. Fukuda-Parr, C. Lopes & K. Malik, eds. Capacity for development - new solutions to old problems.
Keith Mackay, How to Build M&E Systems to Support Better Government, World Bank: 2007. http://www.worldbank.org/oed/ecd/better_government.html
Knowledge Assessment Methodology websites, World Bank http://www.worldbank.org/kam and http://go.worldbank.org/39Z6SV9C80
Measuring the Information Economy, OECD, 2002
Measuring the Information Society 2007: ICT Opportunity Index and World Telecommunication/ICT Indicators, ITU, 2007
Michel Minges, Chapter 6: Tracking ICTs:World Summit on the Information Society Targets, in World Bank, Information and Communications for Development , p. 125 http://go.worldbank.org/PB9HXQQUR0
Partnership on Measuring ICT for Development. Core ICT Indicators, 2005. http://www.itu.int/ITU-D/ict/partnership/material/CoreICTIndicators.pdf
Partnership on Measuring ICT for Development. Measuring ICT: The Global Status of ICT Indicators, 2005. http://www.itu.int/ITU-D/ict/partnership/material/05-42742%20GLOBAL%20ICT.pdf
WB /ITIDA RTA ICT IndicatorsCONFIDENTIAL Final Report
73

Qiang and Pitt, Contribution of Information and Communication Technologies to Growth, World Bank Working Paper No. 24, World Bank, 2004.
United Nations Educational, Scientific and Cultural Organization (UNESCO) Institute for Statistics, ICTs and Education Indicators: Suggested core indicators based on meta-analysis of selected International School Surveys, . http://www.itu.int/ITU-D/ict/partnership/material/ICT_Education_Paper_Nov_.pdf
United Nations Public Administration Network (UNPAN), e-Government Readiness Index 2005 http://www.unpan.org/egovernment5.asp
World Economic Forum (WEF), Network Readiness Index (NRI) -07 http://www.weforum.org/gitr
Zall Kusek, Jody and Rist, Ray, Ten Steps to a Results-Based Monitoring and Evaluation System, World Bank 2004
WB /ITIDA RTA ICT IndicatorsCONFIDENTIAL Final Report
74