transition.fcc.gov · Web viewWhere a census block’s centroid falls inside the study area...
121
Federal Communications Commission DA 12-646 Before the Federal Communications Commission Washington, D.C. 20554 In the Matter of Connect America Fund High-Cost Universal Service Support ) ) ) ) ) WC Docket No. 10-90 WC Docket No. 05-337 ORDER Adopted: April 25, 2012 Released: April 25, 2012 By the Chief, Wireline Competition Bureau: I. INTRODUCTION 1. In the USF/ICC Transformation Order, the Commission comprehensively reformed universal service funding for high-cost, rural areas, adopting fiscally responsible, accountable, incentive-based policies to preserve and advance voice and broadband service while ensuring fairness for consumers who pay into the universal service fund (Fund). 1 As a component of those reforms, the Commission adopted a benchmarking rule intended to moderate the expenses of those rate-of-return carriers with very high costs compared to their similarly situated peers, while further encouraging other rate-of-return carriers to advance broadband deployment. 2 In this order, we adopt the specific 1 See Connect America Fund; A National Broadband Plan for Our Future; Establishing Just and Reasonable Rates for Local Exchange Carriers; High-Cost Universal Service Support; Developing a Unified Intercarrier Compensation Regime; Federal-State Joint Board on Universal Service; Lifeline and Link-Up; Universal Service Reform—Mobility Fund; WC Docket Nos. 10-90, 07-135, 05-337, 03-109, CC Docket Nos. 01-92, 96-45, GN Docket No. 09-51, WT Docket No. 10-208, Report and Order and Further Notice of Proposed Rulemaking, 26 FCC 17663 (2011) (USF/ICC Transformation Order and FNPRM); pets. for review pending sub nom. In re: FCC 11-161, No. 11-9900 (10th Cir. filed Dec. 8, 2011). 2 Id. at 17741-47, paras. 210-26.
Transcript of transition.fcc.gov · Web viewWhere a census block’s centroid falls inside the study area...
Federal Communications Commission DA 12-646
Before theFederal Communications Commission
Washington, D.C. 20554
In the Matter of
Connect America Fund
High-Cost Universal Service Support
)))))
WC Docket No. 10-90
WC Docket No. 05-337
ORDER
Adopted: April 25, 2012 Released: April 25, 2012
By the Chief, Wireline Competition Bureau:
I. INTRODUCTION
1. In the USF/ICC Transformation Order, the Commission comprehensively reformed universal service funding for high-cost, rural areas, adopting fiscally responsible, accountable, incentive-based policies to preserve and advance voice and broadband service while ensuring fairness for consumers who pay into the universal service fund (Fund).1 As a component of those reforms, the Commission adopted a benchmarking rule intended to moderate the expenses of those rate-of-return carriers with very high costs compared to their similarly situated peers, while further encouraging other rate-of-return carriers to advance broadband deployment.2 In this order, we adopt the specific methodology for establishing such limits or “benchmarks” for high cost loop support (HCLS).3
2. The Commission’s benchmark rule responded to problematic incentives and inequitable distribution of support created by the prior rules. Under the prior rules, some carriers with high costs may have had up to 100 percent of their expenditures on loop costs reimbursed from the federal universal service fund. Because, prior to the USF/ICC Transformation Order, these carriers generally faced no overall limits on their expenditures, our rules gave carriers incentives to increase loop costs with little regard to efficiency or the burden on the Fund, and without regard to whether a lesser amount would be sufficient to provide supported services to their customers. Moreover, because HCLS overall is capped, carriers that did take measures to
1 See Connect America Fund; A National Broadband Plan for Our Future; Establishing Just and Reasonable Rates for Local Exchange Carriers; High-Cost Universal Service Support; Developing a Unified Intercarrier Compensation Regime; Federal-State Joint Board on Universal Service; Lifeline and Link-Up; Universal Service Reform—Mobility Fund; WC Docket Nos. 10-90, 07-135, 05-337, 03-109, CC Docket Nos. 01-92, 96-45, GN Docket No. 09-51, WT Docket No. 10-208, Report and Order and Further Notice of Proposed Rulemaking, 26 FCC 17663 (2011) (USF/ICC Transformation Order and FNPRM); pets. for review pending sub nom. In re: FCC 11-161, No. 11-9900 (10th Cir. filed Dec. 8, 2011).2 Id. at 17741-47, paras. 210-26.3 Specifically, the methodology implements the Commission’s rule, adopted in the USF/ICC Transformation Order, to limit reimbursable capital and operating costs for purposes of determining HCLS by using benchmarks for reasonable costs among similarly situated rate-of-return carriers. See id. at 17745, para. 220.

Federal Communications Commission DA 12-646
reduce costs to operate more efficiently lost support to their peers that increased costs.
3. The benchmarking rule adopted by the Commission addresses these problems by, for the first time, placing reasonable overall limits on costs eligible for reimbursement through HCLS and redistributing freed-up HCLS to carriers that stay within these limits to allow for new broadband investment.4 The Commission sought comment on a specific methodology to limit reimbursable capital and operating costs within HCLS and directed the Wireline Competition Bureau (Bureau) to finalize a methodology after receiving public input in response to the proposal.5
4. The methodology we adopt today, which is described in more detail in the attached technical appendix,6 builds on the analysis proposed in the USF/ICC Transformation FNPRM,7 but also includes several changes in response to the comments from two peer reviewers and interested parties and based on further analysis by the Bureau.8 These changes significantly improve the methodology while redistributing funding to a greater number of carriers to support continued broadband investment. We now estimate that support to approximately 100 study areas with very high costs relative to similarly situated peers will be limited, while approximately 500 study areas will receive additional, redistributed support to fund new broadband investment.9
5. In view of the Commission’s intent to “phase in reform with measured but certain transitions,”10 we will phase in the application of these limits. As directed by the Commission, we are providing public notice in Appendix B of this order regarding the updated company-specific capped values that will be used in the HCLS formula. These capped values (which we also refer to as limits or benchmarks) will be used from July 1, 2012 through December 31, 2012,11 in place of an individual company’s actual cost data for those rate-of-return cost companies whose costs exceed the caps.12 While the HCLS benchmarks will be implemented beginning July 1, 2012, we will not reduce support amounts immediately by the full amount as calculated using the benchmarks. Instead, we will reduce support commencing in July 2012 by twenty-five percent of the difference between the support calculated using the study area’s reported cost per loop and the support as limited by the benchmarks, unless that reduction would
4 Id.5 See id. at 17743-47, paras. 214-26, 18059-62, paras. 1079-88, 18285-94, App. H.6 See infra Appendix A.7 See USF/ICC Transformation Order and FNPRM, 26 FCC Rcd at 18059-62, paras. 1079-88, 18285-94, App. H.8 See Letter from Patrick Halley, FCC, to Marlene Dortch, FCC, WC Docket Nos. 10-90, 07-135, 05-337, GN Docket No. 09-51, CC Docket Nos. 01-92, 96-45, 03-109, at Apps. B & C (filed Mar. 9, 2012) (Sanyal Peer Review and Waldon Peer Review, respectively).9 Based on the methodology proposed in the USF/ICC Transformation Order and FNPRM, the Commission estimated that support to 280 rate-of-return cost study areas would be reduced and that 340 rate-of-return cost study areas would receive additional support. USF/ICC Transformation Order and FNPRM, 26 FCC Rcd at 18061, para. 1084. 10 Id. at 17671, para. 11.11 See infra section G for a detailed discussion of how the transition will be implemented. 12 USF/ICC Transformation Order and FNPRM, 26 FCC Rcd at 17744, para. 218. Although the methodology determines capped values only for rate-of-return cost companies, the Commission directed the National Exchange Carrier Association (NECA) to modify the HCLS formula for average schedule companies to reflect the caps derived from the cost company data. See infra para. 10 and note 28.
2
Federal Communications Commission DA 12-646
exceed ten percent of the study area’s support as otherwise would be calculated based on NECA cost data, absent implementation of this rule. Beginning January 1, 2013, we will reduce support by fifty percent of the difference between the support calculated using the study area’s reported cost per loop and the support as limited by the benchmarks in effect for 2013. Beginning January 1, 2014, when we expect to have updated wire center boundaries, as discussed below, we will update the regressions (the coefficients), and support will be limited, in full, by the benchmarks in effect for 2014.13 When fully implemented, we estimate that the roughly 100 study areas that are capped would see approximately $65 million in support reductions, while the roughly 500 study areas that are not capped would receive approximately $55 million in additional support for broadband investment.
II. BACKGROUND
6. In the USF/ICC Transformation Order, the Commission adopted a framework to establish reasonable limits on recovery of capital costs and operating expenses to improve the incentives for rate-of-return carriers to invest prudently and operate efficiently.14 The Commission explained that “under our [previous] rules, a company receives support when its costs are relatively high compared to a national average – without regard to whether a lesser amount would be sufficient to provide supported services to its customers. The [previous] rules fail to create incentives to reduce expenditures; indeed, because of the operation of the overall cap on HCLS, carriers that take prudent measures to cut cost under our [previous] rules may actually lose HCLS support [sic] to carriers that significantly increase their costs in a given year.”15
7. The Commission’s new rule places “limits on the HCLS provided to carriers whose costs are significantly higher than other companies that are similarly situated” and provides that “support will be redistributed to those carriers whose unseparated loop cost is not limited by operation of the benchmark methodology.”16 The Commission found that its “new rule will discourage companies from over-spending relative to their peers” and “provide additional support to those companies that are otherwise at risk of losing HCLS altogether, and would not otherwise be well-positioned to further advance broadband deployment.”17
8. The Commission set forth the parameters of the methodology the Bureau must use to limit payments from HCLS.18 The Commission required the Bureau to compare companies’ costs to those of similarly situated companies; concluded that statistical techniques should be used to determine which companies shall be deemed similarly situated; provided a non-exhaustive list of variables that the Bureau may consider for purposes of this analysis;19 granted the Bureau discretion to determine whether other variables, such as soil type, would improve the regression 13 The Commission directed the Bureau annually to update the regressions. See USF/ICC Transformation Order and FNPRM, 26 FCC Rcd at 17744, para. 218. NECA, OPASTCO, and WTA sought reconsideration on this point. Petition for Reconsideration and Clarification of the National Exchange Carrier Association, Inc.; Organization for the Promotion and Advancement of Small Telecommunications Companies; and Western Telecommunications Alliance, WC Docket No. 10-90, et al., at 10 (filed Dec. 29, 2011). This issue, and other arguments raised in petitions for reconsideration of the requirements adopted in the USF/ICC Transformation Order and FNPRM, will be addressed at a future date by the full Commission.14 See USF/ICC Transformation Order and FNPRM, 26 FCC Rcd at 17744-45, para. 219.15 Id.16 Id. at 17745, para. 220.17 Id.18 See id. at 17744, para. 217.
3

Federal Communications Commission DA 12-646
analysis; and sought comment in the USF/ICC Transformation FNPRM on sources of publicly available soil data.20 The Commission delegated to the Bureau the authority to adopt and implement a methodology within these parameters and to update the methodology as the Bureau gains more experience and additional information.21
9. The methodology proposed in Appendix H to the USF/ICC Transformation FNPRM used quantile regression analyses, NECA cost data, and 2010 Census data to generate a set of limits for each rate-of-return cost company study area.22 The proposal would have limited the values used in eleven of the twenty-six steps in NECA’s Cost Company Loop Cost Algorithm, which is used to calculate the study area’s total unseparated cost per loop, and ultimately its HCLS. The proposed regression-derived limits were set at the 90th percentile of costs for each of the eleven algorithm steps, compared to similarly situated companies for each individual step. A company whose actual costs for a particular algorithm step are above the 90 th percentile would be limited to recovering amounts that correspond to the 90th percentile of cost; i.e., the lesser of the company’s capped algorithm value and the actual value would be inserted into the appropriate algorithm step for purposes of calculating the cost per loop used to determine HCLS. The Commission sought comment on whether the 90th percentile is the appropriate dividing line to disallow recovery of cost, or whether a lower or higher threshold, such as the 85th percentile or the 95th percentile, would be more appropriate.23
III. DISCUSSION
10. In this order, we implement the Commission’s rule to use benchmarks to impose reasonable limits on reimbursable capital and operating costs for rate-of-return carriers for purposes of determining HCLS and adopt the methodology that the Bureau will use to determine carrier-specific benchmarks for rate-of-return cost companies. Consistent with parameters set forth by the Commission, we compare companies’ costs to those of similarly situated companies using statistical techniques to determine which companies shall be deemed similarly situated.24 As described in more detail in the attached technical appendix, we use NECA cost data and quantile regression analyses to generate a capital expense (capex) limit and an operating expense (opex) limit for each rate-of-return cost company study area.25 The regression-derived limits are
19 See id. The variables identified by the Commission were: number of loops, number of housing units (broken out by whether the housing units are in urbanized areas, urbanized clusters, and nonurban areas), as well as geographic measures such as land area, water area, and the number of census blocks (all broken out by urbanized areas, urbanized clusters, and nonurban areas).20 See id. at 17744, para. 217, 18060, para. 1083.21 See id. at 17744, para. 217.22 See id. at 18059-60, para. 1080-82, 18285-94, App. H. Although the Commission found that quantile regression is an appropriate technique to use in setting benchmarks for reimbursable investment and expenses, it invited further comment on alternative statistical techniques. Id. at 18060, para. 1082.23 See id. at 18059-60, para. 1080. 24 These statistical techniques rely on a set of independent variables that control for a company’s costs based on its situation, such as the population density and soil type of the area it serves. Section C below describes the full set of independent variables we are adopting, which is expanded from the proposal in the USF/ICC Transformation Order and FNPRM in response to the record we received.25 See National Exchange Carrier Assoc., Inc., Universal Service Fund Data, NECA’s Study Results, 2010 Report (NECA 2010 USF Data), http://www.fcc.gov/Bureaus/Common_Carrier/Reports/FCC-State_Link/Monitor/usf11r10.zip, available at http://transition.fcc.gov/wcb/iatd/neca.html. We use the NECA data because the Commission determined that the benefits of using data it already collects on a
4

Federal Communications Commission DA 12-646
set at the 90th percentile of costs for capex and opex compared to similarly situated companies.26 The capped values will be used in NECA’s loop cost algorithm in place of an individual company’s actual cost data for those rate-of-return cost companies whose costs exceed the caps, which will result in reduced support amounts for these carriers.27 As directed by the Commission, NECA will modify the HCLS formula for average schedule companies to reflect the caps derived from the cost company data.28 After application of the benchmark methodology, HCLS will be recalculated to account for the additional support available under the overall cap on total HCLS. Additional support will be redistributed to carriers whose loop cost is not limited by the benchmark methodology, and those carriers are required to use the additional support to preserve and advance the availability of modern networks capable of delivering broadband and voice telephony service.29
regular basis outweigh any advantages of an alternative approach. See USF/ICC Transformation Order and FNPRM, 26 FCC Rcd at 17746, para. 224.
When the Commission proposed to establish benchmarks for reimbursable capital and operating costs in February 2011, its proposal was “based significantly on analysis submitted by the Nebraska Rural Independent Companies.” Connect America Fund; A National Broadband Plan for Our Future; Establishing Just and Reasonable Rates for Local Exchange Carriers; High-Cost Universal Service Support; Developing a Unified Intercarrier Compensation Regime; Federal-State Joint Board on Universal Service; Lifeline and Link-Up; WC Docket Nos. 10-90, 07-135, 05-337, 03-109, CC Docket Nos. 01-92, 96-45, GN Docket No. 09-51, Notice of Proposed Rulemaking and Further Notice of Proposed Rulemaking, 26 FCC Rcd 4554, 4624, para. 201 (2011) (footnote omitted) (USF/ICC Transformation NRPM/FNPRM). NRIC had submitted an analysis of capital expenditures and subsequently submitted an analysis of operating expenses.26 Specifically, the 90th percentile of costs compared to similarly situated peers means that, based on data from all the carriers in the analysis, if there were 100 study areas with independent variable values, as adopted in section C below, that were the same as those for the study area in question, 90 of them would be expected to have capex and opex costs equal to or less than the 90th percentile prediction.27 NECA’s HCLS formula, i.e., the 26-step Cost Company Loop Cost Algorithm, is available at http://transition.fcc.gov/wcb/iatd/neca.html. See National Exchange Carrier Assoc., Inc., NECA’s Overview of Universal Service Fund, Submission of 2010 Study Results, App. B (filed Sept. 30, 2011) (NECA 2010 USF Overview), http://www.fcc.gov/Bureaus/Common_Carrier/Reports/FCC-State_Link/Monitor/usf11af.zip.28 USF/ICC Transformation Order and FNPRM, 26 FCC Rcd at 17744, para. 218. Specifically, we direct NECA to file proposed modifications to the average schedule formula within 30 days of the release of this order. 29 Beginning January 1, 2014, carriers unaffected by the benchmark limits will receive additional redistributed support as calculated using a lower adjusted national average cost per loop (NACPL). The lower NACPL will be the NACPL that would be used if total reduced support, as a result of the application of the benchmark methodology, is redistributed to all carriers. Support to carriers affected by the benchmark will be calculated using the NACPL established pursuant to section 36.622 of the Commission’s rules. 47 C.F.R. § 36.622. During the transition periods July 1, 2012 to December 31, 2012 and January 1, 2013 to December 31, 2013, the total amount of HCLS available to study areas not affected by the benchmark methodology will be the capped HCLS, as calculated pursuant to section 36.603(a) of the Commission’s rules, less the total amount to be paid to study areas affected by the benchmark methodology during the transition periods. HCLS paid to the study areas not affected by the benchmark methodology will be calculated using an adjusted NACPL to produce the capped support pursuant to section 36.603(a) of the Commission’s rules. 47 C.F.R. § 36.603(a). See infra section G.
We direct NECA to provide to the Bureau a recalculated NACPL for redistribution and a schedule of HCLS for all carriers for the six-month period of July 1, 2012 to December 31, 2012 within 30 days of the release of this order. Consistent with current practice, the filing NECA makes each October with the
5

Federal Communications Commission DA 12-646
11. The methodology that we adopt builds on the proposed methodology in Appendix H of the USF/ICC Transformation Order and FNPRM,30 but includes some significant improvements based on the many useful comments and ex parte presentations in this proceeding, the comments of two peer reviewers, and further analysis by the Bureau. As in the proposed methodology, we use quantile regression analysis and NECA cost data to generate a set of limits for each rate-of-return cost company study area and use the regression-derived limits in NECA’s formula for calculating loop cost. We modify the proposal, however, by reducing the overall number of regressions from eleven to two: one for capital expenditures and one for operating expenditures. In addition, Commission staff examined and tested additional independent variables that were available from publicly available data sources, placed additional data sources in the record, and updated the methodology to reflect this further analysis. Below, and in the attached technical appendix, we explain these changes to the proposed methodology and respond to other significant issues raised in the record.
A. Number of Regressions
12. The most significant change in methodology is that this analysis generates two caps for each company – a capex limit and an opex limit. The methodology proposed in the FNPRM generated eleven different caps for each company that would have limited the values in eleven of the twenty-six steps in NECA’s loop cost algorithm. Based on our review of the record and further analysis, we conclude that a better approach is to divide a company’s total cost in step twenty-five of the algorithm into its capex and opex components and use two regressions instead of using eleven independent regressions.
13. Commenters took differing views on the appropriate number of regressions. Commenters supporting more aggregation argue that limiting total cost, or separately limiting capital and operating expenses, is a better approach and suggest we use a single regression equation, or at most two equations.31 One peer reviewer also recommended this approach.32 Conversely, some commenters argued that the proposed eleven limits would not have allowed the
Commission shall include NACPL information and the schedule of HCLS for all carriers for the next year.30 USF/ICC Transformation Order and FNPRM, 26 FCC at 18059-62, paras. 1079-88, 18285-94, App. H.31 See, e.g., National Association of State Utility Consumer Advocates (NASUCA) et al. Comments, WC Docket No. 10-90 et al., at 52 (filed Jan. 18, 2012) (NASUCA et al. Comments) (“To avoid the issue of adopting an uneconomical set of inputs, the Commission could estimate only one equation, a total cost equation.”); National Exchange Carrier Association et al. Comments, WC Docket No. 10-90 et al., at App. E, 1 (filed Jan. 18, 2012) (Roger Koenker, “Assessment of Quantile Regression Methods for Estimation of Reimbursable Cost Limits”) (Rural Association Comments) (“A preferable, and simpler, approach would be to develop one conditional quantile model for aggregate costs.”); Nebraska Rural Independent Companies (NRIC) Comments, WC Docket No. 10-90 et al., at 58 (filed Jan. 18, 2012) (NRIC Comments) (“Consolidating the 11 caps into two caps will also improve the reliability of the associated regression studies.”); NRIC Reply Comments, WC Docket No. 10-90 et al., at 6 (filed Feb. 17, 2012) (NRIC Reply Comments) (agreeing with Koenker that “a single cost cap can work as well as or better than the two caps NRIC originally suggested”); Carriers for Progress in Rural America Reply Comments, WC Docket No. 10-90 et al., at 12 (filed Feb. 17, 2012) (proposing “that the Commission’s model be redesigned to maximize carriers’ overall efficiency,” [which] “could be accomplished by reducing the eleven cost categories to just two categories: a limit on capex and a limit on opex.”).32 Sanyal Peer Review at 1 (“By disaggregating the total cost function, and estimating the cost lines separately using quantile regression, and then adding them up, assumes that the quantile of the sums equals the sum of the quantiles. An argument that is similar to the sum of means of a random variable being equal to the mean of the sum. However, this relationship does not hold true for quantile regressions.”).

Federal Communications Commission DA 12-646
algorithm to calculate support as it was intended,33 and proposed that costs be further disaggregated to the underlying cost elements, i.e., “data lines,” that make up each algorithm step.34
14. The choice of how many cost limits to adopt reflects a balancing of considerations. Using a greater number of regressions makes it possible to identify outliers at a granular level, but fails to account for the interrelationships within the cost categories that feed into the twenty-six step algorithm as identified in the record and in the peer review.35 In contrast, using fewer regressions limits the Commission’s ability to identify outliers, but enables carriers to account for the needs of individual networks and recognizes the fact that carriers may have higher costs in one category that may be offset by lower costs in others. 36
15. Balancing these considerations, we conclude that it is appropriate to reduce the number of separate cost caps set from the proposed approach in Appendix H, but to retain separate limits for capex and opex. We are persuaded that limiting eleven separate cost categories could have the effect of overly limiting carriers’ ability to optimize among spending tradeoffs. At the same time, an approach that only limited total cost would provide fewer safeguards against overspending. Capital and operating expenditures reflect fundamentally different measures of business performance. Using two regressions instead of one provides carriers flexibility to manage their operations, while still enabling the Commission to identify
33 See, e.g., Moss Adams et al. Comments, WC Docket No. 10-90 et al., at 16 (filed Jan. 18, 2012) (Moss Adams et al. Comments ) (arguing that the proposed methodology does not allow NECA’s formula for calculating loop cost to calculate support as it was intended because the benchmarks limit algorithm steps in the formula rather than the data lines); Chillicothe Telephone Company Comments, WC Docket No. 10-90 et al., at 7 (filed Jan. 18, 2012) (Chillicothe Comments); Central Texas Comments, WC Docket No. 10-90 et al., at 8- 9, 10 (filed Jan. 18, 2012) (Central Texas Comments). NECA collects cost data from rate-of-return cost companies and the data lines for investments and expenses generally correspond to specific Part 32 accounts or subaccounts. See NECA 2010 USF Overview, http://www.fcc.gov/Bureaus/Common_Carrier/Reports/FCC-State_Link/Monitor/usf11af.zip, App. A (Universal Service Fund: 2011 Data Collection Instructions) available at http://transition.fcc.gov/wcb/iatd/neca.html. 34 See Moss Adams et al. Comments at 16 (noting that “all of the algorithm lines are calculations based on various data lines, so any proposed limitations can also be accomplished by adjusting the data lines”). Although some parties recommend placing limits only on certain cost categories, see, e.g., Accipiter Comments, WC Docket No. 10-90 et al., at 19 (filed Jan. 18, 2012) (Accipiter Comments), using data lines would inevitably increase the number of separate regressions. 35 See, e.g., NRIC Comments, at 12, 55-59; NASUCA et al. Comments at 50 (arguing that the unintended consequences of the proposed methodology would include “large payments to accountants to develop techniques that allow carriers to avoid the constraints and the incentive to adopt an uneconomical set of inputs”); Sanyal Peer Review at 2 (“[I]ndividual cost capping ignores any complementary or substitutability between the various cost components.”).36 See, e.g., Rural Association Comments at App. D, 14 (“By limiting each account separately, without regard to needs of individual networks, the Commission’s method discourages network optimization.”); NASUCA et al. Comments at 51 (arguing that under the proposed methodology “the carrier has an incentive to choose those inputs that allow it to remain under all of the caps, even though a different set of inputs would lead to a lower cost of service, because when the carriers adopts the lower total cost of service inputs it may exceed the cap related to just one of the inputs”); Accipiter Comments at 18 (“[T]he individual cost caps should consider the interplay between different cost categories to avoid penalizing a higher investment in one cost category to produce lower costs in another category.”). Accipiter also argues that we should select fewer individual cost categories subject to limits and only limit cost categories where incentives to overspend may exist. See Accipiter Comments at 19.

Federal Communications Commission DA 12-646
more instances where carriers spend markedly more in either category than their similarly-situated peers.
16. The approach we adopt is also supported by other considerations. In particular, the methodology we adopt simplifies the process of fitting the benchmark computation within the structure of NECA’s loop cost algorithm.37 Instead of potentially limiting values in eleven of the twenty-six steps, we only change the value for companies that exceed the caps in step twenty-five, total unseparated costs.38 Although we divide the components of step twenty-five into capex and opex components for purposes of running two regressions and create separate capex and opex limits, the two components are added together for purposes of calculating total costs, study area cost per loop, and ultimately HCLS.39
B. Defining Capex and Opex
17. As discussed below and in more detail in the technical appendix, we define capex as the plant-related costs in step twenty-five, which include return on capital and depreciation, and define opex as the remaining components that are added in step twenty-five to calculate total costs.40 These revised definitions of capex and opex differ from those used in the proposed methodology in several important ways.
18. The most important revision to the capex definition is the treatment of depreciation in relationship to capital costs. To determine capex limits, the proposed methodology created separate caps for two categories of gross plant (cable and wire facilities, and central office equipment), and for the depreciation and amortization associated with those plant categories.41 In the revised methodology, we define capex as the return on net plant and depreciation.42 Many commenters pointed out that the proposed methodology did not properly account for accumulated depreciation and depreciation expense, and we agree.43 We do not agree, however, with those who argue that depreciation expense should not be included in the regression analysis.44
37 It is important that the methodology fit within this framework because the Commission modified the HCLS mechanism; it did not replace it with a new regime.38 Step twenty-five is the sum of steps thirteen through twenty-four. 39 For companies whose actual capex and/or opex exceed the benchmarks, the capped values will be added in step twenty-five in place of an individual company’s actual cost data. Capex components will be summed into step 25A and opex into step 25B; step 25C becomes the new total unseparated costs. See Appendix A at para. 6.40 As discussed in the technical appendix, for the dependent variables, the regressions use the natural log of the capex components and the natural log of the opex components. See infra Appendix A at paras. 11, 23.41 The proposed methodology created separate caps for steps 1, 2, 17 and 18 of the NECA algorithm. See USF/ICC Transformation Order and FNPRM, 26 FCC at 18288, App. H, para. 15.42 Capex includes the return component for cable and wire facilities category 1 (C&WF) (step 23); the return component for central office equipment category 4.13 (COE) (step 24); depreciation and amortization expense assigned to C&WF (step 17); and depreciation and amortization expense assigned to depreciation assigned to COE (step 18). 43 See, e.g., Moss Adams et al. Comments at 15-18; Rural Association Comments at 67-68, App. D at 9-11; Chillicothe Comments at 6-9; Central Texas Comments at 8- 9, 14-16.44 Some commenters argue that regression should not be used to limit depreciation expense, but suggest an alternative method of limiting depreciation. See, e.g., Moss Adams et al. Comments at 18 (recommending that “regression not be used to limit depreciation expense,” but arguing that “depreciation expense limitations should be computed as the percentage of the limitation of the associated plant investment
8

Federal Communications Commission DA 12-646
Although depreciation is termed an “expense” for regulatory accounting purposes, as the Rural Associations and several other commenters point out, depreciation expense is properly considered as a component of capital costs because it is directly related and calculated as a result of capital investment.45 The proposed methodology would have limited gross plant, but did not adjust the accumulated depreciation or depreciation expense as would have been necessary when gross plant was limited by the benchmark. The method we now adopt includes net plant rather than gross plant, so we appropriately account for accumulated depreciation.46
19. Our revised opex definition includes the remaining components that are summed in step 25 in the NECA algorithm to determine total unseparated costs.47 The proposed methodology excluded three of these – corporate operations expense, operating taxes, and rents – which we now include in determining opex. In the USF/ICC Transformation Order, the Commission revised the formula for limiting recovery of corporate operations expenses for HCLS in section 36.621(a)(4) of the Commission’s rules.48 Because of this separate limitation, the proposed methodology did not create an additional limit for corporate operations expense. Now that we are analyzing all operating costs as a whole, it is appropriate to include corporate operations expense, as well as the other operating expenses, taxes and rents.49 For purposes of this analysis, we will use either a carrier’s actual corporate operations expense or the amount allowable under section 36.621(a)(4), whichever is less. By using the allowable amount, we avoid restricting carriers affected by section 36.621(a)(4) twice for their corporate operations expenses above that limitation.50
multiplied by the depreciation expense”); Chillicothe Comments at 9; Central Texas Comments at 14; Guadalupe Valley Telephone Cooperative Comments, WC Docket No. 10-90 et al., at 5-6 (filed Jan. 18, 2012) (Guadalupe Valley Comments). Another commenter argues that there is no need to limit depreciation expense at all. See NRIC Comments at 59 (“Since depreciation rates are regulated, and investment itself is capped, there is no need to cap depreciation expense.”).45 See, e.g., Moss Adams et al. Comments at 18; Rural Associations Reply Comments, App. B at 3; Letter from Michael R. Romano, NTCA, to Marlene H. Dortch, FCC, WC Docket No. 10-90 et al., at 2 (dated March 23, 2012). 46 Instead of creating separate caps for step 1 (C&WF) and step 2 (COE), the revised methodology includes the return on net plant steps 23 and 24 in the capex regression. The return component for CW&F is calculated in step 23 by adding CW&F in step 1 to CW&F materials and supplies in step 7, subtracting accumulated depreciation assigned to CW&F in step 9, and multiplying that value by the 11.25% authorized rate of return to determine the return component for C&WF. The return component for COE in step 24 is calculated in a similar manner. The revised methodology recognizes that materials and supplies are plant-related capital costs and a component of the return on capital in steps 23 and 24. 47 Opex includes C&WF maintenance (step13), and COE maintenance (step 14); network expenses (steps 15 and 16); corporate operations expense (step 19); operating taxes (step 20); corporate benefits (step 21), and rents (step 22).48 See 47 C.F.R. § 36.621(a)(4); USF/ICC Transformation Order and FNPRM, 26 FCC at 17747-49, paras. 227-33. The Commission also extended the corporate operations limitation to interstate common line support (ICLS). Id.49 For further discussion, see Appendix A at paras. 23, 26-28.50 Most study areas are not affected by the corporate operations expense limitation in section 36.621(a)(4). NRIC argues that, if there were a single cap on total costs, there would be no need to cap a single expense, if total costs remain reasonable. See NRIC Reply Comments at 7-8. As an alternative to eliminating the corporate operations expense limitation, NRIC recommends the approach we take here. See NRIC Reply Comments at 8 n.17. (“Alternatively, even if the Commission decided to retain some kind of separate corporate operations cap, it could still constrain factor AL19, which is corporate operations expense, and the result would flow through automatically into the overall cap calculation for AL26.”).
9

Federal Communications Commission DA 12-646
C. Selection of Independent Variables
20. The revised methodology also includes additional independent variables that were suggested by commenters and one of the peer reviewers, and eliminates some that had been included in the methodology proposed in the USF/ICC Transformation FNPRM, because we found the new variables to be better estimators of cost. In the USF/ICC Transformation FNPRM, the Commission noted that NRIC’s Capital Expenditure Study included variables for frost index, wetlands percentage, soils texture, and road intersections frequency, and invited commenters advocating the inclusion of additional independent variables to identify the data source, completeness, and cost of the additional data, if not publicly available.51 The Commission specifically sought comment on sources of soil data other than the Soil Survey Geographic Database (SSURGO) used in the NRIC study and how to deal with areas where the SSURGO data are missing or incomplete.52 Many commenters suggest additional variables, and Bureau staff examined those for which data were available. The technical appendix describes in more detail the independent variables included in the methodology, those examined but excluded, and those that commenters suggested but that could not be included because the data were either unavailable to the Commission, nonpublic, or could not be generated at the study area level.53 We briefly discuss the variables included in the revised methodology below.
21. The methodology uses cost-driving variables directly where available and proxies that are sufficiently correlated with cost drivers where necessary. For example, the number of loops is a direct measure of a study area’s scale, and the number of road miles is a proxy for total loop length.54 Because most cable follows roads, it is reasonable to believe that the number of road miles in a study area is a good proxy for the cabling required to serve that area.55 Some commenters suggest that the age of plant is an important variable, and we agree.56 Many carriers have recently replaced aging plant with modern communications networks capable of providing voice and broadband service, and those carriers are not similarly situated to carriers with plant that is more fully depreciated. Accordingly, while data on the average age of plant are not readily available, the revised methodology now includes a variable for the percentage of plant that has not yet been depreciated, which is highly correlated with plant age. The revised methodology also includes variables that account for customer dispersion: density (housing units divided by square miles); number of exchanges, which roughly accounts for the population centers in a study 51 See USF/ICC Transformation Order and FNPRM, 26 FCC at 18060-61, para. 1083. 52 See id.; U.S. Department of Agriculture, Natural Resources Conservation Service, Available Soil Survey Data (SSURGO) (2012), available at http://soildatamart.nrcs.usda.gov/ (last visited Apr. 24, 2012).53 As discussed in the technical appendix, the regressions use the natural logs of the independent variables except those that are dummy variables, a pure index, or a percentage. See infra Appendix A at para. 11.54 See infra Appendix A at para. 33. Several commenters argue that some measure of loop length is an important cost driver and suggest that some carriers already provide average loop lengths and other relevant data to the Rural Utilities Service (RUS). See, e.g., Central Texas Comments at 6-7; Chillicothe Comments at 3-4; Accipiter at 26; Moss Adams et al. Comments at 11-12.55 Other proxies for scale used in the methodology are the number of road crossings and the number of commonly-owned study areas in a state. In its Capital Expenditure Study, NRIC predicted that road intersections would slow construction and impose other costs, and Bureau staff concludes this is another good proxy for scale. See NRIC Capital Expenditure Study at 10. In addition, Bureau staff expects that the number of commonly-owned study areas would be a good predictor of costs because some expenses could be shared among study areas. See infra Appendix at paras. 35, 37.56 See, e.g., Accipiter Comments at 5-6, 33-34; Guadalupe Valley Comments at 3-4; Carriers for Progress in Rural America Comments, WC Docket No. 10-90 et al., at 6-7 (filed Jan. 18, 2012); infra Appendix A at para. 38.
10

Federal Communications Commission DA 12-646
area; and portion of households in urbanized clusters or urbanized areas.57
22. In addition, the revised methodology includes several geographic independent variables that Bureau staff developed from various data sources. First, we agree with the many commenters who argue that the proposed methodology should include soils data.58 Bureau staff used the U.S. General Soil Map (STATSGO2) soils database to construct two soil-based variables that are included in the revised methodology: depth of bedrock, and soils difficulty.59 Although the SSURGO database contains a richer set of soil variables and data at a more granular level than STATSGO2, it does not provide data for the entire country. Some commenters argue that we should use the SSURGO data where available and STATSGO2 for the remaining study areas, but we decline to use an approach that treats study areas differently depending on the availability of the data.60 In addition, NRIC’s Capital Expenditure Study includes a frost index developed from the SSURGO data, but this information is not available for all areas in the STATSGO2 database. Several commenters discuss the need for such a frost index.61 As a proxy for this information, Bureau staff developed a climate variable based on the average annual minimum temperature from the U.S. Department of Agriculture’s hardiness index.62
23. We also agree with commenters who emphasized that carriers serving particular areas such as Alaska, Tribal lands, and national parks could face unique challenges. In particular, some commenters suggest that it is more costly to provide service on Tribal lands;63 the methodology now includes an additional independent variable for the percentage of each study area that is a federally-recognized Tribal land.64 In addition, Alaskan commenters argued that Alaska is unique because of its harsh climate and other factors; accordingly, the methodology now includes a variable indicating whether or not the study area is in Alaska.65 Some commenters also argued
57 See infra Appendix A at para. 39-41.58 See, e.g., NRIC Comments at 22-24; Moss Adams Comments et al. at 8; ATC Communications Comments, WC Docket No. 10-90 et al., at 3 (filed Jan. 18, 2012); Chillicothe Comments at 2; Northern Telephone Cooperative Comments, WC Docket No. 10-90 et al., at 3 (filed Jan. 18, 2012) (Northern Telephone Comments); Washington Independent Telecommunications Association et al. Comments, WC Docket No. 10-90 et al., at 4-5 (filed Jan. 17, 2012).59 See Appendix A at paras. 43,45; U.S. Department of Agriculture, Natural Resources Conservation Service, U.S. General Soil Map (STATSGO2) available at http://soils.usda.gov/survey/geography/statsgo (last visited Apr. 24, 2012).60 See NRIC Comments at 24; NASUCA et al. Comments at 46; infra Appendix at paras. 53-54.61 See, e.g., Blooston Rural Broadband Carriers Comments, WC Docket No. 10-90 et al., at 2 (filed Jan. 18, 2012) (Blooston Comments); Interbel Comments, WC Docket No. 10-90 et al., at 10 (filed Jan. 18, 2012) (Interbel Comments); NRIC Comments at 25.62 See infra Appendix A at para. 47; see also U.S. Department of Agriculture, U.S. National Arboretum, Plant Hardiness Zone Map (2012), available at http://www.usna.usda.gov/Hardzone (last visited Apr. 24, 2012).63 See, e.g., Gila River Telecommunications Comments, WC Docket No. 10-90 et al. (filed Jan. 18, 2012); Hopi Telecommunications Comments, WC Docket No. 10-90 et al. (filed Jan. 18, 2012); Mescalero Apache Telecom Comments, WC Docket No. 10-90 et al. (filed Jan. 18, 2012); National Tribal Telecommunications Association Comments, WC Docket No. 10-90 et al. (filed Jan. 18, 2012); Sacred Wind Comments, WC Docket No. 10-90 et al. (filed Jan. 17, 2012); Alexicon Telecommunications Consulting Comments, WC Docket No. 10-90 et al., at 18-19, App. B (filed Jan. 18, 2012) (Alexicon Comments).64 See infra Appendix at para. 49-50.
11
Federal Communications Commission DA 12-646
that it is more difficult to construct and maintain networks in national parks;66 the methodology also now includes an additional independent variable for the percentage of each study area that lies within a national park.67 NRIC’s Operating Expenses Study found that operating expenses were correlated with regions, and Bureau staff tested variables for the four census-based regions: Western, Midwest, Northeast and South.68 The revised methodology also includes the two that were significant: the Midwest and Northeast.
D. Use of Boundary Data
24. All geographic independent variables were rolled up to the study area using Tele Atlas wire center data, which is a widely-used commercially available comprehensive source for this information.69 Several commenters question the accuracy of those boundaries.70 For example, the Rural Associations point to a NECA study that concluded many of the Tele Atlas boundaries “differ quite significantly from actual boundaries.”71 In addition, some companies that argue that their boundaries, and in particular the resulting measure of square miles in their service territories, were inaccurate in the proposed methodology have asked how they could correct errors in the data.72
25. The only comprehensive set of wire center boundaries are those commercially available from companies such as Tele Atlas and GeoResults. There is precedent for using Tele Atlas’ (or a predecessor company’s) boundaries. In particular, the Commission’s hybrid cost proxy model uses a customer location data set that was created using an earlier version of the Tele Atlas boundaries.73
65 See, e.g., Alaska Rural Coalition Comments, WC Docket No. 10-90 et al., at 17-19 (filed Jan. 18, 2012); Copper Valley Telephone Cooperative Comments, WC Docket No. 10-90 et al., at 5-7 (filed Jan. 17, 2012).66 See, e.g., Interbel Comments at 3.67 See infra Appendix at para. 49-50. In the future, if sufficient data become available, we may consider including a variable that would account for all federal lands (i.e., that is not limited to national park lands).68 See NRIC Operating Expense Study at 8; infra Appendix at para. 52.69 TomTom Telecommunications Suite 2011.09 (formerly Tele Atlas North America), Wire Center Premium, for wire center boundary and central office location information. Earlier study area boundary versions were also used to exclude the portions of study areas that were associated with frozen support. 70 See, e.g., Calaveras Telephone Comments, WC Docket No. 10-90 et al., at 6-7(filed Jan. 18, 2012); Eagle Telephone Comments, WC Docket No. 10-90 et al., at 3 (filed Jan. 18, 2012); Moss Adams et al. Comments at 10; Northern Telephone Comments at 2-3; NRIC Comments at 2-29.71 Rural Association Comments, Appendix D at 3-4. (“Of 357 study areas for which NECA has actual boundaries, 144 are not accurate within 5%, and 80 are not even accurate within 20%. A significant number differ by more than 50%, and a few are completely (i.e., 100%) inaccurate.”). Id. See also Joint Comments of NECA, NTCA, OPASTCO, WTA, and the Rural Alliance, WC Docket No. 10-90 et al., at Attach. at 1-3 (filed July 12, 2010) (NECA et al. July 12, 2010 Comments). 72 See, e.g., Letter from Joshua Seidemann, NTCA, to Marlene Dortch, FCC, WC Docket No. 10-90 et al. (filed Mar. 21, 2012).73 Business Location Research was subsequently acquired by Geographic Data Technology, which was acquired by Tele Atlas. See Federal-State Joint Board on Universal Service, Forward-Looking Mechanism for High Cost Support for Non-Rural LECs, CC Docket Nos. 96-45, 97-160, Tenth Report and Order, 14 FCC Rcd 20156, 20181, para. 51 (1999) (Tenth Report and Order), affirmed, Qwest Corp. v. FCC, 258 F.3d 1191 (10th Cir. 2001) (Qwest I). The Commission has also used the TeleAtlas boundaries to create maps of study areas receiving the highest per-line support amounts and the states with the most competitive eligible telecommunications carriers in response to requests from the U.S. House of Representatives,
12

Federal Communications Commission DA 12-646
26. We decline to adopt NRIC’s proposal that we modify study area boundaries before implementing the regression methodology based on publicly available state maps.74 While many states have study area maps available on-line,75 the vast majority of those maps will not allow Commission staff to calculate the information required for the analysis we adopt. Variables like road miles and those related to local soil conditions require having GIS-based boundaries that can be overlaid with other GIS-based data sets (like road networks and databases of soil conditions). It is not practical to derive such information from printed maps, images on websites or PDF files with any accuracy. In addition, it is not clear whether state maps represent authoritative boundaries. Therefore, we do not believe that the proposal by NRIC is a practical means to derive more reliable study area boundary information quickly.76
27. Nevertheless, we recognize concerns remain regarding inaccuracies in this data set, and we adopt a two-part process to address these concerns. First, in the near term, we will provide a streamlined, expedited waiver process for carriers affected by the benchmarks to correct any errors in their study area boundaries. Second, to correct any remaining inaccuracies in the Tele Atlas data set, we will issue a Public Notice to initiate the process of collecting study area boundaries directly from all rate-of-return carriers. The Public Notice will seek comment on data specifications for a data request that the Bureau would issue after receiving input from the public and interested parties. We expect that we will have updated boundary data before we rerun the regression to calculate capex and opex limits that will be used for calculating support for 2014, at which time the limits will apply in full.77
28. In light of the protections we adopt to address errors in the TeleAtlas data, we decline to delay implementation of the benchmarks beyond the 18-month phase-in described below. The Commission anticipated that “HCLS benchmarks will be implemented for support calculations beginning July 2012.”78 In many cases, more accurate boundaries would not change whether or not a particular company is capped or not by the benchmark methodology. And the streamlined, expedited waiver process we adopt to correct boundaries in the near-term will address those specific instances where an inaccurate boundary could result in a company losing more support than it would otherwise.79
Committee on Energy and Commerce. See, e.g., FCC Responses to Requests 5 and 7 (July 27, 2011), available at http://democrats.energycommerce.house.gov/index.php?q=news/bipartisan-energy-and-commerce-leaders-release-information-on-universal-service-fund. 74 See Letter from Cheryl L. Parrino, Parrino Strategic Consulting Group, to Marlene H. Dortch, FCC, WC Docket No. 10-90 et al., Attach. A, at 4 (filed Apr. 13, 2012).75 See id., Attach. B.76 The Rural Associations acknowledge that compiling a new dataset of study area boundaries will require substantial effort because “[v]erifiable studies of documented serving areas of all RLECs would need to be completed to assure that calculations are correct. These studies would involve obtaining maps of study area boundaries for each RLEC, which would need to be digitized to create a workable database of actual study area boundaries.” Rural Association Comments, App. D at 4.77 We emphasize that because we phase in the benchmarks, companies will experience no more than half of the reduction otherwise required by the benchmarks until we have updated boundary data. Phasing in the application of the limits over 18 months helps address concerns about the accuracy of the existing boundary data in the interim period before the limits apply in full. 78 USF/ICC Transformation Order and FNPRM, 26 FCC at 17744, para 216.79 Consistent with existing practice, if such a waiver request is granted and a true-up is required, a carrier’s support amounts will be trued-up back to July 1, 2012.
13

Federal Communications Commission DA 12-646
29. Specifically, any carrier whose actual boundaries are different from the boundaries used by the Bureau in the methodology we adopt today may file a petition for waiver in accordance with section 1.3 of the Commission’s rules.80 To enable the Bureau to determine whether there are special circumstances (i.e., inaccurate boundaries) supporting a waiver, petitioners must provide accurate boundary information in a manner and format that Bureau staff can readily evaluate and process.81 In Appendix C, the Bureau sets forth a template for filing study area maps to help potential petitioners file information efficiently, accurately, and in a manner that will permit the Bureau to evaluate and process the information expeditiously.
30. While potential petitioners may choose to submit boundary information in other formats, the Bureau cautions that information submitted in other formats may require additional processing, and that the processing could introduce errors and/or delay. For example, if petitioners file hard copy maps, those would need to be rectified (stretched) to have a spatial reference, and digitized by Bureau staff. Accordingly, petitioners that do not wish to use the Bureau’s template may wish to consult with Bureau staff in advance of filing boundary information in alternate formats to ensure that the information submitted can be processed quickly.
31. Regardless of how the boundary information is filed, an officer of the company must certify under penalty of perjury that the information provided is accurate. We also emphasize that carriers using this waiver process solely to seek changes to their study area boundaries used in the benchmark methodology are not required to file the financial data and other information required for waivers as set forth in the USF/ICC Transformation Order.82 The financial data and other information set forth in the USF/ICC Transformation Order is relevant for petitions for waiver alleging that “reductions in current support levels would threaten [a carrier’s] financial viability, imperiling service to consumers in the areas they serve.”83 In contrast, when considering whether there are special circumstances and the public interest is served by granting a waiver of the benchmark methodology, we will be focusing on ensuring that accurate data is used to perform the necessary computations, regardless of the extent of support reduction. In addition, carriers using this streamlined, expedited waiver process to make technical corrections to their study area boundaries need not pay the filing fee associated with requests for waiver of Part 36 separations rules.84 With the safeguard provided by this streamlined, expedited waiver process, we conclude it is appropriate to use the Tele Atlas boundaries on an interim basis.
80 Generally, the Commission’s rules may be waived if good cause is shown. 47 C.F.R. § 1.3. The Commission may exercise its discretion to waive a rule where the particular facts make strict compliance inconsistent with the public interest. Northeast Cellular Telephone Co. v. FCC, 897 F.2d 1164, 1166 (D.C. Cir. 1990) (Northeast Cellular). In addition, the Commission may take into account considerations of hardship, equity, or more effective implementation of overall policy on an individual basis. WAIT Radio v. FCC, 418 F.2d 1153, 1159 (D.C. Cir. 1969); Northeast Cellular, 897 F.2d at 1166. Waiver of the Commission’s rules is appropriate only if both (i) special circumstances warrant a deviation from the general rule, and (ii) such deviation will serve the public interest. NetworkIP, LLC v. FCC, 548 F.3d 116, 125-128 (D.C. Cir. 2008); Northeast Cellular, 897 F.2d at 1166. 81 See infra Appendix C.82 USF/ICC Transformation Order and FNPRM, 26 FCC at 17839-42, paras. 539-44.83 Id. at 17839, para. 539.84 See 47 C.F.R. § 1.1105.
14

Federal Communications Commission DA 12-646
E. Use of Quantile Regression and the 90th Percentile Cost Threshold
32. As discussed in the technical appendix, we conclude that quantile regression analysis is the appropriate methodology to use to identify study areas that have capex and opex costs that are much higher than those of their similarly situated peers and to cap their cost recovery at amounts that are no higher than the vast majority of similarly situated study areas.85 We also conclude that we should set the regression-derived limits at the 90th percentile of costs for capex and opex compared to similarly situated companies.
33. Some commenters criticized the use of the 90th percentile, arguing that it was unreasonable because approximately forty percent of study areas in the methodology proposed in the FNPRM would have been subject to limits in one or more of the eleven cost categories used in that analysis.86 On further consideration, we have concluded that the proposed methodology was over-inclusive because a carrier that exceeded the cap in only one category, but had costs well below the caps in the other ten, would have received reduced support. As discussed above, however, we are adopting a revised methodology that relies on aggregated capex and opex caps. Applying the revised methodology with a 90th percentile cap limits reimbursable costs for only fifteen percent of the study areas of cost companies. The net effect is fewer study areas will see reduced support, and more companies will see additional support, due to the distribution of support among HCLS recipients.
34. Accordingly, we do not agree with commenters who argue that we should limit at most those carriers with costs above the 95th percentile.87 Indeed, we note that using the 90th percentile with the modifications adopted today leads to approximately the same number of study areas with capped costs as would have been the case if we were to use the 95th percentile with the Appendix H methodology.88 We conclude that using the 90th percentile as part of the revised methodology appropriately balances the Commission’s twin goals of providing better incentives for carriers to invest prudently and operate more efficiently, and providing additional support to further advance broadband deployment. By providing additional, redistributed HCLS to carriers that do not have the highest costs among similarly situated companies, our budget for high-cost support should enable more broadband deployment than if we continued funding more of the highest cost companies at current levels.
35. In view of the fact that many carriers will receive additional, redistributed HCLS, we take this opportunity to emphasize the obligations that attach to the additional funding. Section 254(e) of the Act requires that this additional funding – like all federal universal service support – be used “only for the provision, maintenance, and upgrading of facilities and services for which the support is intended.”89 Consistent with the USF/ICC Transformation Order, the overarching intent is to preserve and advance the availability of modern networks capable of delivering broadband and voice telephony service.90 Indeed, all rate-of-return carriers are required to
85 See infra Appendix A at paras. 7-10.86 See, e.g., Blooston Comments at 4; Rural Association Comments at 7187 See, e.g., Alexicon Comments at 14-15; NASUCA et al. at 53; NRIC Comments at 51-53.88 Using the methodology proposed in Appendix H of the USF/ICC Transformation Order and FNPRM and the 95th percentile would have limited reimbursable costs for approximately fifteen percent of the study areas – no different than selecting the 90th percentile with the other improvements we adopt today. 89 47 U.S.C. § 254(e).90 See USF/ICC Transformation Order, 26 FCC Rcd at 17670, para. 11, 17681, para. 51, para. 17854, para. 587.
15

Federal Communications Commission DA 12-646
provide broadband upon reasonable request beginning July 1, 2012, as a condition of receiving federal high-cost universal service support.91 Carriers must use their high-cost universal service support – including any additional funding – in compliance with these requirements.
36. We further note that all rate-of-return carriers will be required to file a new build-out plan, which accounts for the new broadband obligations, in 2013.92 Those plans must be updated annually to reflect progress on network improvements and build-out, which should reflect the impact of high-cost universal service support, including any additional funding.93 The Commission will be reviewing those plans and updates, as well as other information provided in the annual section 54.313 reports, to ensure that carriers are complying with their public interest obligations, including their build-out requirements. Further, the progress report on those plans will be part of the factual basis that supports the annual section 54.314 certification by the states or carriers that support is being used for the intended purposes.94
F. Other Issues
37. Retroactivity. We disagree with commenters who assert that applying the benchmarks to limit HCLS payments constitutes retroactive rulemaking.95 A rule does not operate retroactively merely because it is “applied in a case arising from conduct antedating [its] enactment” or “upsets expectations based on prior law.”96 Rather, a rule operates retroactively if it “takes away or impairs vested rights acquired under existing law, or creates a new obligation, imposes a new duty, or attaches a new disability in respect to transactions or considerations already past.”97
38. Here, it cannot fairly be said that the application of these benchmarks will take away or impair a vested right, create a new obligation, impose a new duty, or attach a new disability in respect to the carriers’ previous expenditures. There is no statutory provision or Commission rule that provides companies with a vested right to continue to receive support at particular levels or through the use of a particular methodology.98 Although application of the benchmarks may
91 See id. at 17740, para. 206.92 See id. at 17854, para. 587.93 See id.94 See id. at 17859-61 paras. 607-612.95 See, e.g., GVNW Consulting Comments, WC Docket No. 10-90 et al., at 11-12 (filed Jan. 17, 2012) (“the Commission’s proposal to adopt regression caps is unlawful and constitutes retroactive rulemaking”); Alexicon Comments at 12-14 (“this result is substantially similar to retroactive ratemaking”); Blooston Comments at 3-5 (“retroactive application of the [quantile regression analysis] . . . contravenes well-settled principle [sic] of agency law and precedent”).96 Landgraf v. USI Film Products, 511 U.S. 244, 269-70 (1994).97 Marrie v. SEC, 374 F.3d 1196, 1207 (D.C. Cir. 2004) (quotation omitted); see also Blanco de Belbruno v. Ashcroft, 362 F.3d 272, 283 (4th Cir. 2004) (“to determine whether a regulatory change has retroactive effect, we must determine that a rule ‘attaches new legal consequences to events completed before its enactment’”) (quoting INS v. St. Cyr, 533 U.S. 289, 321 (2001)).98 See USF/ICC Transformation Order, 26 FCC Rcd at 17770-71, para. 293; 47 U.S.C. § 254; see also Rural Cellular Association v. FCC, 588 F.3d 1095, 1103 (D.C. Cir. 2009) (“[the] purpose of universal service is to benefit the customer, not the carrier”) (quotation omitted). We note that the Commission has been seeking comment on whether and how to change the support methodology for rural carriers since 2004, which should have made it evident to those carriers that they are not guaranteed a particular level of support. See Federal-State Joint Board on Universal Service, CC Docket No. 96-45, Order, 19 FCC Rcd
16

Federal Communications Commission DA 12-646
affect the amount of support a carrier receives for expenditures made in 2010 (or before),99 it does not change the legal landscape in which those expenditures were made. Rather, as the Commission observed in the USF/ICC Transformation Order, “section 254 directs the Commission to provide support that is sufficient to achieve universal service goals, [but] that obligation does not create any entitlement or expectation that ETCs will receive any particular level of support or even any support at all.”100
39. Indeed, consistent with the Commission’s focus on service to consumers, the Commission declined to provide any group of companies with a blanket exception from universal service reforms for past investments, recognizing that the current rules were not efficiently serving universal service goals. Providing such exceptions would have made it impossible to reform the system over any reasonable time period. Instead, the Commission established an avenue for companies to demonstrate a need for temporary and/or partial relief from the new rules to ensure its customers do not lose service.101 Moreover, our decision to phase in the application of the limits over 18 months provides a greater opportunity for carriers to make any necessary adjustments.
40. Critically, the revised methodology now includes an independent variable that captures age of plant, further addressing “retroactivity” concerns with respect to capex. Adding this variable raises the cost limits for carriers that have invested recently, by allowing their costs to be judged relative to a peer group of other carriers that have also invested recently. We also note that application of the limits to operating expenses clearly presents no “retroactivity” concerns.
41. Predictability and Sufficiency. We also reject the argument that implementing these benchmarks will undermine the predictability or sufficiency of support.102 At the outset, we note that this general argument effectively seeks reconsideration of the Commission’s policy judgment to adopt a rule imposing limits on capex and opex in the first instance, which is beyond the scope of this order to implement a methodology as directed by the Commission. As the Commission explained in the USF/ICC Transformation Order, the HCLS mechanism operates in fundamentally the same way with or without the benchmarks.103 In both cases, a certain amount of unpredictability exists because a carrier’s support depends in part on a national average that
11538 (2004). Indeed, the Commission’s proposals to reform support for rural carriers have ranged from the modest, targeted reforms adopted in the USF/ICC Transformation Order to more sweeping proposals to auction all high-cost support. See, e.g., Federal-State Joint Board on Universal Service, WC Docket No. 05-337, CC Docket No. 96-45, Notice of Proposed Rulemaking, 23 FCC Rcd 2495 (2008).99 See supra note Error: Reference source not found.100 USF/ICC Transformation Order, 26 FCC Rcd at 17745, para. 221; see also Members of the Peanut Quota Holders Assoc. v. United States, 421 F.3d 1323 (Fed. Cir. 2005), cert. denied, 548 U.S. 904 (2006) (“The government is free to create programs that convey benefits in the form of property, but, unless the statute itself or surrounding circumstances indicate that such conveyances are intended to be irrevocable, the government does not forfeit its right to withdraw those benefits or qualify them as it chooses.”).101 USF/ICC Transformation Order, 26 FCC Rcd at 17745, para. 222; see also id. at 17839-42, paras. 539-44.102 See, e.g., Blue Valley Telecommunications Comments, WC Docket No. 10-90 et al., at 4-5 (filed Jan. 18, 2012); TCA Comments, WC Docket No. 10-90 et al., at 5-6 (filed Feb. 24, 2012); Rural Broadband Alliance Reply Comments, WC Docket No. 10-90 et al., at 14-18 (filed Feb. 17, 2012); Letter from Michael J. Balhoff, Balhoff & Williams, LLC, to Marlene H. Dortch, FCC, WC Docket No. 10-90 et al., at Attach. at 8 (dated April 12, 2012).103 USF/ICC Transformation Order, 26 FCC Rcd at 17745, para. 220.
17

Federal Communications Commission DA 12-646
changes from year to year, and companies “can only estimate whether their expenditures will be reimbursed through HCLS.”104 Moreover, as the Commission has suggested, if anything, support will now be more predictable for most carriers because the new rule discourages companies from exhausting the fund by over-spending relative to their peers.105 The addition of several new independent variables that capture attributes that do not change over time (e.g., depth of bedrock, soils difficulty, the percentage of study area that is a federally-recognized Tribal land, the percentage of each study area that lies within a national park, whether the study area is in the Midwest, Northeast, or Alaska) also improves the predictability of support. In addition, as described below, we will use the same regression coefficients for capex and opex in 2013 as those calculated for 2012, which will provide more certainty as we phase in the application of the limits. Accordingly, commenters’ concerns that support amounts will fluctuate radically from year to year are speculative and unpersuasive.
42. As for sufficiency, the very purpose of the benchmarks is to ensure that carriers as a whole receive a sufficient (but not excessive) amount of HCLS, which is one component of high-cost support. As discussed above, the methodology compares carriers’ costs to those of similarly situated carriers and reduces HCLS only to the extent that a carrier over-spends relative to its peers. Moreover, excess support is redistributed to carriers that otherwise may be at risk of losing HCLS altogether, and may not otherwise be well-positioned to further advance broadband deployment. Thus, the application of benchmarks is not only consistent with the Commission’s interpretation of “sufficient” as requiring that the fund remain “sustainable,” which the D.C. Circuit found to be a reasonable interpretation in Rural Cellular Association v. FCC,106 but it also complies with the stated intent of section 254 that the Commission’s universal service mechanisms should preserve and advance universal service.107
G. Implementation
43. We will implement the limits on costs eligible for reimbursement though HCLS beginning July 1, 2012, but we will not reduce support amounts immediately by the full amount as calculated using the benchmarks. Instead, we will reduce support beginning July 1, 2012 and until December 31, 2012 by twenty-five percent of the difference between the support calculated using the study area’s cost per loop as reported by NECA and the support as limited by the benchmarks, however, the reduction shall not be greater than ten percent of the study area’s HCLS support based on the cost data filed with NECA. Beginning January 1, 2013 and until December 31, 2013, we will reduce support by fifty percent of the difference between the support calculated using the study area’s cost per loop as reported by NECA in October 2012 and the support as limited by the benchmarks in effect for 2013. Beginning January 1, 2014, when we expect to have updated wire center boundaries, as discussed above, we will update the regression coefficients and incorporate the cost data submitted by NECA in October 2013, and support will be limited, in full, by the benchmarks in effect for 2014.
44. By delaying the full impact of the reductions until 2014, we provide companies who would be adversely affected adequate time to make adjustments and, if necessary, demonstrate that a waiver is warranted either to correct inaccurate boundary information and/or “to ensure that
104 Id.105 See id.106 588 F.3d 1095, 1102-1103 (D.C. Cir. 2009). 107 See 47 U.S.C. § 254(b)(5).
18

Federal Communications Commission DA 12-646
consumers in the area continue to receive voice service.”108 For many companies affected by the benchmarks, the initial twenty-five percent phase-in reduction is a small percentage of their total HCLS. For those whose reduction would be more than ten percent of their HCLS based on NECA cost data, we are limiting the reduction to ten percent for the remainder of 2012. Moreover, continuing to limit the impact of support reductions in 2013 provides an additional opportunity for carriers to make further adjustments. On balance, we find that this measured transition strikes a reasonable balance between the goals of promptly making available additional support to those carriers who, under the new rule, will receive redistributed HCLS to further advance broadband deployment and providing an adequate amount of time for carriers that will experience reductions in support to make adjustments.
45. We also take steps to provide more certainty regarding the operation of the limits on capex and opex.109 In particular, to provide carriers with more certainty regarding the impact of the fifty percent phase-in in 2013, we will use the same regression coefficients for capex and opex in 2013 as those calculated for 2012, which enables carriers to estimate their 2013 support now.110 That is, we will not update the regressions, but we will recalculate individual study area caps based on the 2011 cost data filed with NECA, which will be submitted to the Commission in NECA’s annual filing in October 2012. This will allow higher caps for those study areas with significant network investment in 2011.111 By taking into account the 2011 cost data filed with NECA, study areas that may not have qualified for HCLS based on their costs in prior years may be eligible to qualify for HCLS in 2013, thereby providing those study areas with additional support for broadband investment. In addition, study areas whose costs drop below their computed benchmark for 2013 no longer will be considered capped, and therefore will receive support based on their own actual costs and will be eligible to receive redistributed support like other uncapped study areas.
IV. PROCEDURAL MATTERS
A. Paperwork Reduction Act
46. This document does not contain new or modified information collection requirements subject to the Paperwork Reduction Act of 1995 (PRA), Public Law 104-13. In addition, therefore, it does not contain any new or modified information collection burden for small business concerns with fewer than 25 employees, pursuant to the Small Business Paperwork Relief Act of 2002, Public Law 107-198, see 44 U.S.C. 3506(c)(4).
B. Final Regulatory Flexibility Act Certification
47. Final Regulatory Flexibility Certification . The Regulatory Flexibility Act of 1980, as amended (RFA)112 requires that a regulatory flexibility analysis be prepared for rulemaking proceedings, unless the agency certifies that "the rule will not have a significant economic impact
108 USF/ICC Transformation Order and FNPRM, 26 FCC at 17839, para. 539.109 NTCA, for example, expressed concern about “dynamic, year-by-year alteration of the caps.” See Letter from Michael R. Romano, NTCA, to Marlene H. Dortch, FCC, WC Docket No. 10-90 et al., at 1-2 (filed Mar. 23, 2012); Letter from Michael R. Romano, NTCA, to Marlene H. Dortch, FCC, WC Docket No. 10-90 et al., at 1-2 (filed Apr. 2, 2012). 110 In addition, as discussed above, we add several new independent variables that capture attributes that do not change over time thereby improving the predictability of support. See supra section C and para. 41.111 This could allow higher caps for study areas with significant network investment in 2011; for example, if that investment causes the percentage of undepreciated plant to grow.
19

Federal Communications Commission DA 12-646
on a substantial number of small entities."113 The RFA generally defines "small entity" as having the same meaning as the terms "small business," "small organization," and "small governmental jurisdiction."114 In addition, the term "small business" has the same meaning as the term "small business concern" under the Small Business Act.115 A small business concern is one which: (1) is independently owned and operated; (2) is not dominant in its field of operation; and (3) satisfies any additional criteria established by the Small Business Administration (SBA).116
48. This Order implements, but does not otherwise modify, the rule adopted by the Commission in USF/ICC Transformation Order.117 These clarifications do not create any burdens, benefits, or requirements that were not addressed by the Final Regulatory Flexibility Analysis attached to USF/ICC Transformation Order.118 Therefore, we certify that the requirements of this order will not have a significant economic impact on a substantial number of small entities. The Commission will send a copy of the order including a copy of this final certification, in a report to Congress pursuant to the Small Business Regulatory Enforcement Fairness Act of 1996, see 5 U.S.C. § 801(a)(1)(A). In addition, the order and this certification will be sent to the Chief Counsel for Advocacy of the Small Business Administration, and will be published in the Federal Register. See 5 U.S.C. § 605(b).
C. Congressional Review Act
49. The Commission will send a copy of this order to Congress and the Government Accountability Office pursuant to the Congressional Review Act.119
D. Data Quality Act
50. The Commission certifies that it has complied with the Office of Management and Budget Final Information Quality Bulletin for Peer Review, 70 Fed. Reg. 2664 (2005), and the Data Quality Act, Pub. L. No. 106-554 (2001), codified at 44 U.S.C. § 3516 note, with regard to its reliance on influential scientific information in the Report and Order in GN Docket No. 09-191 and WC Docket No. 07-52.120
112 The RFA, see 5 U.S.C. § 601 et seq., has been amended by the Contract With America Advancement Act of 1996, Pub. L. No. 104-121, 110 Stat. 847 (1996) (CWAAA). Title II of the CWAAA is the Small Business Regulatory Enforcement Fairness Act of 1996 (SBREFA).113 5 U.S.C. § 605(b).114 5 U.S.C. § 601(6).115 5 U.S.C. § 601(3) (incorporating by reference the definition of "small business concern" in Small Business Act, 15 U.S.C. § 632). Pursuant to 5 U.S.C. § 601(3), the statutory definition of a small business applies "unless an agency, after consultation with the Office of Advocacy of the Small Business Administration and after opportunity for public comment, establishes one or more definitions of such term which are appropriate to the activities of the agency and publishes such definition(s) in the Federal Register."116 Small Business Act, 15 U.S.C. § 632. 117 See USF/ICC Transformation Order and FNPRM, 26 FCC Rcd at 17742-47, paras. 210-26.118 See id. at 18324-63, App.O.119 See 5 U.S.C. 801(a)(1)(A).120 See Letter from Patrick Halley, FCC, to Marlene Dortch, FCC, WC Docket Nos. 10-90, 07-135, 05-337, GN Docket No. 09-51, CC Docket Nos. 01-92, 96-45, 03-109, at Apps. B & C (dated Mar. 9, 2012).
20

Federal Communications Commission DA 12-646
V. ORDERING CLAUSES
51. Accordingly, IT IS ORDERED, that pursuant to the authority contained in sections 1, 2, 4(i), 201-206, 214, 218-220, 251, 254, and 303(r), and of the Communications Act of 1934, as amended, and section 706 of the Telecommunications Act of 1996, 47 U.S.C. §§ 151, 152, 154(i), 201-206, 214, 218-220, 251, 254, 303(r), 1302, and pursuant to sections 0.91, 0.131, 0.201(d), 0.291, 0.331, 1.3, and 1.427 of the Commission’s rules, 47 C.F.R. §§ 0.91, 0.131, 0.201(d), 0.291, 0.331, 1.3, 1.427 and pursuant to the delegations of authority in paragraphs 210, 217, 226 and 1404 of USF/ICC Transformation Order, 26 FCC Rcd 17663 (2011), that this Order IS ADOPTED, effective thirty (30) days after publication of the text or summary thereof in the Federal Register.
52. IT IS FURTHER ORDERED, that the Commission SHALL SEND a copy of this Order to Congress and the Government Accountability Office pursuant to the Congressional Review Act, see 5 U.S.C. § 801(a)(1)(A).
53. IT IS FURTHER ORDERED, that the Commission’s Consumer and Governmental Affairs Bureau, Reference Information Center, SHALL SEND a copy of this Order, including the Final Regulatory Flexibility Certification, to the Chief Counsel for Advocacy of the Small Business Administration.
FEDERAL COMMUNICATIONS COMMISSION
Sharon E. GillettChiefWireline Competition Bureau
21

Federal Communications Commission DA 12-646
APPENDIX A
Modeling Limits on Reimbursable Operating and Capital Costs
Overview. This appendix describes a methodology for determining carrier-specific limits on High Cost Loop Support (HCLS) payments to rate-of-return cost carriers with very high capital expenses (capex) and operating expenses (opex) relative to their similarly situated peers. Building on the record received in response to the USF/ICC Transformation FNPRM, and the comments of two peer reviewers,121 the methodology adopted today refines the HCLS calculation algorithm proposed in the FNPRM.122 This appendix describes both the econometric process used to establish carrier-specific limits to HCLS payments for rate-of-return cost companies and the implementation process.
54. The methodology described herein provides a detailed and implementable mechanism for examining all rural rate-of-return cost study areas and limiting HCLS payments in those study areas that have costs higher than the vast majority of their similarly-situated peers. We use data from all the rural rate-of-return cost carriers.123 We use quantile regression for parameter estimation rather than ordinary least squares for reasons set forth below. The most significant change in methodology from that described in the FNPRM is that this analysis creates two caps, one each on capex and opex, rather than capping eleven different NECA algorithm steps. Because this methodology builds upon NECA’s existing algorithm for calculating average loop costs, the revised methodology can be implemented quickly and simply.
55. Background . Today, cost companies eligible for HCLS file with NECA annual detailed cost data, pursuant to Part 36, at the study area level reporting their costs in many
121 See Letter from Patrick Halley, FCC, to Marlene Dortch, FCC, WC Docket Nos. 10-90, 07-135, 05-337, GN Docket No. 09-51, CC Docket Nos. 01-92, 96-45, 03-109, at Apps. B & C (dated March 9, 2012) (Sanyal Peer Review and Waldon Peer Review, respectively).122 Connect America Fund; A National Broadband Plan for Our Future; Establishing Just and Reasonable Rates for Local Exchange Carriers; High-Cost Universal Service Support; Developing a Unified Intercarrier Compensation Regime; Federal-State Joint Board on Universal Service; Lifeline and Link-Up; Universal Service Reform—Mobility Fund; WC Docket Nos. 10-90, 07-135, 05-337, 03-109, CC Docket Nos. 01-92, 96-45, GN Docket No. 09-51, WT Docket No. 10-208, Report and Order and Further Notice of Proposed Rulemaking, 26 FCC 17663, 18285-94, App. H (2011) (USF/ICC Transformation Order and FNPRM); pets. for review pending sub nom. In re: FCC 11-161, No. 11-9900 (10th Cir. filed Dec. 8, 2011). 123 The analysis is based on 2010 NECA data. See National Exchange Carrier Assoc., Inc., Universal Service Fund Data, NECA’s Study Results, 2010 Report (NECA 2010 USF Data), http://www.fcc.gov/Bureaus/Common_Carrier/Reports/FCC-State_Link/Monitor/usf11r10.zip, available at http://transition.fcc.gov/wcb/iatd/neca.html. Pursuant to section 54.305 of the Commission’s rules, an acquiring carrier receives support for exchanges acquired from another carrier at the same per-loop support as calculated at the time of transfer. See 47 C.F.R. § 54.305. Rural carriers who incorporate acquired exchanges into an existing study area are required to provide separately the cost data for the acquired exchanges and the pre-acquisition study area. Per operation of Commission rules (47 C.F.R. § 54.305(b)), the support for the acquired portion of the study area is frozen. See National Exchange Carrier Assoc., Inc., NECA’s Overview of Universal Service Fund, Submission of 2010 Study Results, App. F (filed Sept. 30, 2011) (NECA 2010 USF Overview), http://www.fcc.gov/Bureaus/Common_Carrier/Reports/FCC-State_Link/Monitor/usf11af.zip, available at http://transition.fcc.gov/wcb/iatd/neca.html. The costs associated with the acquired portion of these study areas are generally lower because the acquired exchanges were from lower-cost carriers, so it would not be reasonable to add either the lines or the costs associated with those lines into the methodology as they would tend to make other cost company costs look high by comparison.
22

Federal Communications Commission DA 12-646
different cost categories.124 The cost categories are then fed into NECA’s 26-step Cost Company Loop Cost Algorithm.125 The early algorithm steps calculate intermediate values (based on the reported cost categories) and feed into the later algorithm steps. Algorithm step 25, which calculates the carrier’s total unseparated cost for that study area, sums several of the preceding algorithm steps and then feeds into algorithm step 26, which computes the carrier’s total unseparated cost per-loop for that study area by dividing the value for algorithm step 25 by the number loops in the study area.126 HCLS for each study area is then calculated by the Expense Adjustment Algorithm.127 This algorithm ultimately determines HCLS payments based on a study area’s cost per-loop compared to the nationwide average cost per-loop.128
56. Methodology for Imposing Limits. Appendix H of the FNPRM proposed to create 11 caps (four capex caps and seven opex caps).129 Several commenters argued that we should reduce the number of caps because efficient carriers might limit their total expenditures by spending a large amount in one cost category to avoid spending even more money in other categories.130 Additionally, some commenters and one of the peer reviewers suggested the use of a single cap, that is, a single dependent variable in the cost regressions, noting that the 90 th percentile of total cost is not the sum of the 90th percentiles of cost components.131
57. For the reasons described in the HCLS Benchmarks Implementation Order, we conclude that using two caps, one for capex and one for opex, provides the appropriate balance between identifying unusually high costs and providing carriers operational flexibility.132
58. To implement this revised framework, the updated methodology separates algorithm step 25 (Total Unseparated Costs) into total capex and total opex cost components. The current algorithm step 25 sums algorithm steps 13 through 24. As a result of the updated methodology, capex components are now summed into algorithm step 25A and opex components are summed into algorithm step 25B. Consistent with the methodology proposed in Appendix H, a company whose actual costs for algorithm step 25A or algorithm step 25B are above the 90th percentile for that cost, compared to similarly situated companies, would be limited to recovering amounts that correspond to the 90th percentile of capex or opex costs, i.e. the costs that ninety percent of
124 See NECA 2010 USF Overview, App. A, at http://www.fcc.gov/Bureaus/Common_Carrier/Reports/FCC-State_Link/Monitor/usf10af.zip.125 See NECA 2010 USF Overview, App. B, at http://www.fcc.gov/Bureaus/Common_Carrier/Reports/FCC-State_Link/Monitor/usf10af.zip.126 Although NECA labels each algorithm step with a line number, we continue to use the word “step” in our description of the methodology to avoid possible confusion of lines with loops.127 See NECA 2010 USF Overview, App. B, at http://www.fcc.gov/Bureaus/Common_Carrier/Reports/FCC-State_Link/Monitor/usf10af.zip.128 The national average cost per loop used in the HCLS support calculation is set to ensure that total HCLS disbursements stay within the HCLS cap that year rather than the actual average loop cost. See 47 C.F.R. §§ 36.603(a), 36.622. Rural carriers receive support equal to 65 percent of their costs in excess of 115 percent of the NACPL. Additionally, carriers receive support equal to 75 percent for costs in excess of 150 percent of the NACPL. See 47 C.F.R. §§ 36.601-.631.129 USF/ICC Transformation Order and FNPRM, 26 FCC Rcd at 18288-89, App. H, paras. 15-16.130 Accipiter Comments at 19 and NASUCA Comments at 52. Rural Association Comments, App. E, at 6-7 (Koenker). 131 Nebraska Rural Comments/ Rural Associations Comments at App. E, 5 (Koenker); Sanyal Peer Review at 1.132 See supra HCLS Benchmarks Implementation Order at para. 15.
23
Federal Communications Commission DA 12-646
similarly situated companies would be estimated to have by the regression equation.133 Algorithm step 25C becomes the new Total Unseparated Costs by summing algorithm steps 25A and 25B. It then feeds into algorithm step 26 (Study Area Cost per Loop) and the subsequent Expense Adjustment Algorithm as before. We identify the capex and opex components below.
59. Use of Quantile Regression . As proposed in the FNPRM, we use quantile regression to estimate the caps for the capex and opex cost components.134 The goal of the regression methodology is to identify study areas that have capex and opex costs that are much higher than their similarly-situated peers and to cap their cost recovery at amounts that are no higher than the vast majority of similarly-situated study areas. Quantile regression allows us to directly estimate the 90th percentile costs for study areas with given characteristics. The critical values become the capex and opex caps.
60. We conclude that quantile regression is preferable to ordinary least squares for this application. Ordinary least squares regression cannot be used to identify the proper critical values in the tail of the cost distribution without making strong assumptions about the nature of the cost distribution, in particular, that error terms are Gaussian (normally distributed) and homoscedastic.135 In contrast, quantile regression requires no assumptions about the error terms. This is important because the error terms of the ordinary least squares regressions for capex and opex are both heteroscedastic and non-normal.136 While methods exist to estimate corrections for heteroscedasticity and non-normal error terms in ordinary least squares regression, these would require additional computational steps without improving the precision of the quantile estimate.
61. Quantile regression is also more resistant to the presence of outliers than ordinary least squares, which can produce biased parameter estimates when outliers are present.137 Thus, quantile regression parameter estimates are more stable than ordinary least squares parameter estimates if the data include outliers.138 And although ordinary least squares has methods available for dealing with outliers, such as excluding them from the analysis or using dummy variables, these methods generally require an exercise of judgment to identify outliers. Quantile regression largely avoids the need to make such determinations.
62. Another significant advantage of quantile regression is that it allows the independent variables to have different effects on the dependent variable in the different quantiles.139 Thus, for example, as the percentage of a study area that is national parkland increases (holding
133 The term “similarly-situated peers” means that, based on data from all the carriers in the analysis, if there were (hypothetically) 100 study areas with independent variable values that were the same as those with the study area in question, 90 of them would be expected to have capex and opex costs equal to or less than the 90th percentile prediction.
134 Both peer reviewers agreed that quantile regression is the proper tool for this analysis. Waldon Peer Review at 1 and Sanyal Peer Review at 1. See also, Rural Associations Comments at App. E, 7 (Koenker).135 Even though OLS provides unbiased parameter estimates in the presence of heteroscedasticity, the standard errors are not unbiased. Because the standard errors would be required to determine which observations lie above the critical cutoff values, in the presence of problems such as heteroscedasticity, some adjustment to the standard errors would be needed. 136 For the capex model, we ran the regressions using ordinary least squares and performed two tests for heteroscedasticity: the White test and the Breusch-Pagan / Cook-Weisberg test. Both tests clearly rejected the null hypothesis of homoscedasticity with a p-value of less than .0001. Further, the Cameron & Trivedi's decomposition of IM-test shows that the error terms are not normal – the error terms suffer from kurtosis (p-value=0.0051), and skewness (p-value = 0.0017), which are statistically significant. 137 G.S. Madalla, Introduction to Econometrics, 2nd Ed. 88 (1992) (Macmillan Publishing Co).138 Lingxin Hao and Daniel Q. Naiman, Quantile Regression 20 (2007) (Sage Publications).
24

Federal Communications Commission DA 12-646
everything else constant), the size of the study area’s cost increase could differ based on where it falls in the cost distribution of similarly-situated study areas (which quantile it is in). This is not allowed in ordinary least squares, which assumes that the marginal effect is the same on all study areas. Given that we are examining study areas with high costs relative to other study areas conditioned on the independent variables used in the design, this is a helpful property.
63. Use of the Log-Log Specification. As proposed in the FNPRM, we use the log-log specification, and therefore take the natural log of the variables most sensitive to scale effects. For the dependent variables, the capex regression uses the natural log of capex, and the opex regression uses the natural log of opex. We also use the natural logs of all independent variables used in the methodology except those that are dummy variables, a pure index, or a percentage (namely, Climate, Difficulty, PctTribalLand, PctPark, Alaska, MW, and NE).
64. Some commenters and a peer reviewer argued that the Commission failed to demonstrate the need for taking the natural logs for both the dependent and independent variables.140 Additionally, a commenter argued that doing so was appropriate when the dependent variable is known to have a multiplicative relationship, and therefore the regressions should use the variables in levels (i.e., that we should not take the natural log of the variables) or that we should examine cost per loop.141 Another commenter, as well as both peer reviewers, noted that the manner in which zeros are dealt with, even when using quantile regression, can affect the results.142
65. Because our econometric specification is a reduced form, taking the logs of both the dependent and independent variables is acceptable so long as the resulting relationship is linear. We disagree with commenters who suggested that we should leave the variables in levels. Figure 1 shows that the scatter plot of (the level of) opex versus (the level of) the number of loops is not obviously linear. In contrast, Figure 2 displays the scatter plot of the natural log of opex versus the natural log of loops, and shows that the relationship is linear. Further, in a simple ordinary least squares regression of opex on the number of loops and the natural log of the number of loops, both variables are significant. This indicates that the relationship between opex and loops is nonlinear.
66. Further, some commenters argued that we should predict costs per loop and that if we took this approach, density would become an important independent variable.143 Figure 3 shows that opex per loop as a function of density is nonlinear.144 In contrast, Figure 4 shows that the relationship between the natural log of opex and density is linear. Similarly, the graph of capex versus road miles does not appear to be linear, but natural log of capex versus the natural log of road miles does. We thus conclude that the log transformation of the dependent and independent variables that are scale sensitive is the appropriate specification.
140 Nebraska Rural Comments Pages 41-45; NASUCA Comments at 54; Sanyal Peer Review at 3; Waldon Peer Review at 2.141 Nebraska Rural Independent Companies (NRIC) Comments at 42.142 Rural Associations Comments at App. E, 8 (Koenker); Sanyal Peer Review at 3; Waldon Peer Review at 2.143 NRIC Comments at 14-15. 144 This is unsurprising: Chart 2 (page 14) in NRIC’s Capex Study shows a non-linear relationship as well. See Letter from Thomas Moorman, Counsel to Nebraska Rural Independent Companies, to Marlene H. Dortch, Secretary, FCC, WC Docket Nos. 10-90, 05-337, GN Docket No. 09-51, Attach., at 14 (Nebraska Rural Independent Companies’ Capital Expenditure Study: Predicting the Cost of Fiber to the Premise) (dated Jan. 7, 2011) (NRIC’s Capex Study).
25

Federal Communications Commission DA 12-646
67. Finally, the reduction in the number of regressions in the final methodology eliminates the problem of taking the natural log of zero in the dependent variable. Because the final methodology uses two regressions rather than eleven, the values of the dependent variables are never less than or equal to zero, as was the case for many of the values in the algorithm step 8 regression as originally proposed in the FNPRM. Further, none of the independent variables that we use have zero values.145
68. Fit of the Regression Model. Some commenters argued that the regressions in the proposed methodology suffered from low pseudo R-square values, and therefore the proposed methodology should be abandoned.146 Another commenter asserted that alternative models (i.e., those that were based on levels or on cost per loop) were superior to the proposed model because the R-square values were higher when using levels or cost per loop.147
69. We conclude that our revised methodology offers sufficient predictive power. Although the pseudo R-square values in the proposed methodology ranged from 0.2745 to 0.5863, the pseudo R-square values in the revised methodology are .6684 for capex and 0.6234 for opex. We conclude that our final specification has sufficient predictive power to provide a reliable method for setting reasonable limits on carriers’ costs. We also note that because the dependent variables are different, and because we are performing quantile regression rather than ordinary least squares regression – the method proposed by NRIC – we cannot directly compare the pseudo R-square values from our methodology to the R-square values from commenters’ alternative specifications.148
70. Elimination of Independent Variables from Specification . If a variable is significant in either the capex or opex regression, we include it in both regressions. We are cognizant of Dr. Koenker’s comments that in quantile regression (as in ordinary least squares regression), the inclusion of non-significant variables can inflate the variance of the prediction (yet leave the prediction unbiased).149 Nevertheless, we keep variables that are significant in either regression in both regressions because they can have offsetting effects in the regressions. For example, a carrier facing close-to-the-surface bedrock (which would make trenching more difficult than usual) may find it efficient to use an aerial solution rather than to trench through bedrock. The presence of close-to-the-surface bedrock could then lower the carrier’s capex cost but raise its opex cost because cables on poles may be more costly to maintain. Thus, bedrock could raise that carrier’s opex costs but could plausibly lower that carrier’s capex expenditures. If we omitted bedrock from the capex regression, we could be biasing the coefficient values in the regression and therefore biasing the predicted 90th percentile values for capex.
71. Further, we note that unlike the regressions in the proposed methodology, the vast majority of the variables in the updated methodology’s regressions are significant in both
145 In testing land area, housing units and census blocks with breakouts for urbanized areas or urbanized clusters, we used the totals of these variables and the percent that were rural. All study areas have positive values for land area, census blocks and housing units, so we were able to calculate the natural logs for all observations for these variables. Ultimately, however, census blocks and housing units were not included in the final methodology. Also, a peer reviewer noted that when calculating the caps, the methodology as proposed in the FNPRM failed to account for the fact that we added one to all the dependent variables for which we took the natural logs. See Waldon Peer Review at 3. Because we did not need to add 1 to any of the dependent variables in the refined methodology that we now adopt, that situation is impossible here.146 NASUCA Comments at 41, 49. 147 NRIC at 15. 148 W. Greene, Econometric Analysis, 2nd Ed. 54 (1993) (Macmillan Publishing Co).149 Rural Associations Comments at App. E, 7 (Koenker).
26

Federal Communications Commission DA 12-646
regressions. We also note that adding statistically insignificant variables to our regressions do not bias our predictions.150 In light of all these considerations, we therefore believe it is better to include variables that are significant in either of the regressions in both.
72. In its Updated Opex Study, NRIC suggests creating a cap that uses not just the regression coefficients, but also adds a standard deviation to each regression coefficient.151 We decline to do so here. Adding the estimated standard error to the parameter estimates is a non-standard way of creating a confidence interval in the context of quantile regression. In contrast, using the regression quantiles methodology gives a direct unbiased estimate of the 90 th percentile predictions for capex and opex.152
73. Use of Census Block Centroids . Consistent with the methodology set forth in the FNPRM, we determine which census blocks are in each study area by using the census blocks’ centroids. This enables us to generate certain demographic variables for each study area, such as the number of housing units in a study area. Because study area boundaries do not always coincide with census block boundaries, some census blocks will fall into two different study areas. Where a census block’s centroid falls inside the study area boundary, we associate that block with that study area, and if a census block’s centroid falls outside of the study area boundary, we do not.
74. Some commenters suggested that associating census blocks with study areas based on the census block’s centroid can distort population and/or housing unit counts.153 While NRIC argues that such errors do not necessarily cancel each other out, they did not have a material impact on the cost caps in the case of Nebraska.154 We conclude that our approach is reasonable. We could split census blocks that cross study area boundaries into pieces and then assume that end-user locations are spread evenly within census blocks so that we proportionately attribute housing units to study areas. This would increase computational complexity but not necessarily accuracy because end-user locations are not uniformly distributed within census blocks. We further note that the vast majority of study areas have many blocks and therefore such errors would tend to cancel each other out. Of the 726 study areas covered by the updated methodology have 1.1 million census blocks in them, so on average, each study area has about 1,567 census blocks. The smallest number of census blocks in a study area is 26, the 5th percentile is 132, and the 10th percentile is 187. Therefore, the vast majority of study areas would not be affected by this issue. Also, there is only one variable that uses the number of housing units (which is derived from the census blocks in the analysis), the natural log of density (see LnDensity below), so the effect of any error should be small.
75. Dependent Variables . As described above, the dependent variables in the regressions are the natural log of the capex components and the natural log of opex components of algorithm step 25. Below we define capex and opex, but in short, we assign all the constituent parts of
150 On this point Koenker agreed. See id. 151 See Letter from Cheryl L. Parrino, Parrino Strategic Consulting Group, to Marlene H. Dortch, Secretary, FCC, GN Docket No. 09-51, WC Docket Nos. 10-90, 05-337, CC Docket No. 01-92, Attach. 2 at 3-4 (Operating Expense Study Sponsored by the Nebraska Rural Companies: Update to Predicting the Operating Expenses of Rate-of-Return Telecommunications Companies) (dated Sept. 29, 2011) (Updated Opex Study).152 Another option would be to adjust the capex and opex 90th percentile predictions by a standard error. We decline to do this for the same reason we decline to add a standard error to each variable coefficient.153 Accipiter Comments at 14, Moss Adams Comments at 14, NRIC Comments at 30, Nemont Reply Comments at 3.154 NRIC Comments at 30-33.
27

Federal Communications Commission DA 12-646
algorithm step 25, which calculates the carrier’s total unseparated cost for that study area, to either capex or opex. Because we are now aggregating capex costs into a single capex variable, and operational costs into an opex variable, variations in individual capex and opex components are smoothed. This allows us to include data on all elements of capex and opex while still achieving good regression fits.
76. For the purpose of the updated methodology that we adopt today, we define capex to be the plant-related costs in the current algorithm step 25. We thus include the return to capital components, which are algorithm step 23 and algorithm step 24.155 We also include depreciation in capex (algorithm step 17 and algorithm step 18).156 Although accounting textbooks typically define depreciation as an operating expense, they do so because firms need to recognize a periodic charge against earnings to expense the declining value of assets over the estimated life of the assets.157 Because depreciation is inherently tied to the carriers’ asset investment decisions, we assign it to capex. We note that in its Opex Study, NRIC considered depreciation to be sufficiently non-operations-based that NRIC took depreciation out of opex.158 Although some commenters urged us to exclude depreciation from the methodology altogether,159 we disagree for two reasons. First, depreciation is a valid measure of plant that goes beyond the measure of net plant that goes into algorithm steps 23 and 24. Depreciation is a function of not just the amount of gross plant, but also the useful life of the plant that is used, a meaningful measure. Second, by including depreciation, we include all the portions of the existing algorithm step 25.
77. For the purpose of the updated methodology, we define opex to be the remaining components of the current algorithm step 25. We include algorithm steps 13 and 14 in opex because they are maintenance expenses.160 We also include algorithm steps 15 and 16 in opex
155 Specifically, algorithm step 23 is the return component for cable and wire facility Category 1, and algorithm step 24 is the return component for central office equipment Category 4.13. Included in these return components are algorithm steps 7 and 8 (materials and supplies assigned to cable and wire facilities Category 1 and central office equipment category 4.13 respectively), which are plant-related capital costs, and which were erroneously considered to be opex in Appendix H.156 Algorithm step 17 is depreciation and amortization expense assigned to cable and wire facility Category 1. Algorithm step 18 is depreciation and amortization expense assigned to central office equipment Category 4.13.157 See, e.g. Williams, Stanga and Holder, Second Edition, Intermediate Accounting, Harcourt Brace Jovanovich, Inc. [1987] Page 550.158 See Letter from Paul M. Schudel, Counsel to Nebraska Rural Independent Companies, to Marlene H. Dortch, Secretary, FCC, WC Docket Nos. 10-90, 07-135, 05-337, 03-109, GN Docket No. 09-51, CC Docket Nos. 01-92, 96-45, Attach. at 6 (Operating Expense Study Sponsored by the Nebraska Rural Independent Companies and Telegee Alliance of Certified Public Accounting Firms: Predicting the Operating Expenses of Rate-of-Return Telecommunications Companies) (dated May 10, 2011) (NRIC’s Opex Study). The NRIC Capex Study did not use accounting costs, and so it did not directly ascribe depreciation to capex.159 See, e.g., NRIC Comments at 59; Moss Adams et al. Comments at 15-18; Chillicothe Comments at 6-9.160 Algorithm step 13 is cable and wire facilities maintenance and algorithm step 14 is central office equipment maintenance expense assigned to Category 4.13.
28

Federal Communications Commission DA 12-646
because they are network expenses.161 Algorithm step 21 in included in opex because it is corporate benefits.162 Below we discuss in more detail the other algorithm steps included in opex.
78. Algorithm step 19 is corporate operations expense, which is limited in accordance with section 36.621(a)(4) of the Commission’s recently revised rules.163 Although this step is already limited by the updated formula limiting recovery of corporate operations expenses, and was excluded in the methodology as proposed in the FNPRM, we now include it in opex because the goal of the updated methodology is to examine opex in its entirety. Algorithm step 19 uses DL535 and DL550, which are the lesser of the allowable or actual corporate operations expenses, not the unadjusted corporate operations expenses, so a study area that is affected by §36.621(a)(4) is not being affected twice by the higher-than-allowable amount.
79. We similarly include algorithm step 20 (operating taxes) in opex in the revised methodology. Although the methodology proposed in Appendix H excluded step 20, after further consideration, we concluded that taxes are an expense that must be paid, just like other operational expenses.164
80. Finally, we include algorithm step 22 (rents) in opex.165 This step was excluded from the proposed methodology in Appendix H because the regression fit was poor. Because we can now include rents as a part of opex as a whole as opposed to in its own separate category, we include it in the updated methodology.
81. Independent Variable Specification . Our reduced-form regression specification uses as independent variables exogenous factors that we believe affect a study area’s capex and opex. These variables fall into the following categories: scale, age of plant, customer dispersion, and geography.166 Additionally, the independent variables we examined and include in this updated
161 Algorithm step 15 is network support expense plus general support expenses assigned to cable and wire facility Category 1 and central office equipment Category 4.13. Algorithm step 16 is network operations expenses assigned to cable and wire facility Category 1 and central office equipment Category 4.13. These expenses are not capitalized in accordance with FCC Report 43-04 – Report Definition page 24, available at http://transition.fcc.gov/wcb/armis/documents/2007PDFs/4304c07.pdf.162 Specifically, algorithm step 21 is benefits other than corporate operations expense assigned to cable and wire facility Category 1 and central office equipment Category 4.13. 163 Specifically, algorithm step 19 is corporate operations expense assigned to cable and wire facility Category 4.13, which is limited in accordance with §36.621(a)(4).164 We understand that tax rates are beyond a carrier’s control, but so are many other rates and prices, such as prevailing local wage rates or the prices of electricity and copper. We expect carriers relying on universal service support, like providers operating in the market, to make efficient investment and operating decisions in light of these costs, and by estimating the 90th percentile as the basis for the cost caps, we allow providers substantial flexibility to do so without exceeding the caps. Further, were we to have a single cap based on total unseparated costs (algorithm step 25) as some commenters suggest rather than the two existing caps, we would be including taxes. Rural Association Comments, App. E, at 5 (Koenker); Sanyal Peer Review at 1. 165 Specifically, algorithm step 22 is rents assigned to cable and wire facility Category 1 and central office equipment Category 4.13.166 Some commenters stated that some variables in Appendix H were not cost drivers or were not good proxies. Accipiter Comments at 25-26, Moss Adams at 12. This is largely moot because we have mostly eliminated the variables criticized by the commenters, such as the number of census blocks in rural areas, from the final methodology. We also point out that is not necessary to have only cost drivers in the analysis if proxies can be found that are sufficiently correlated with the cost drivers. We used cost-driving variables directly where available and proxies where necessary.
29

Federal Communications Commission DA 12-646
methodology are those that are currently available to the Commission and exist for all study areas in the regression analysis.
82. To the extent that we had the requisite data, we also tested other variables that commenters suggested be included. First we describe the variables we include in the methodology, then the variables that we examined and ultimately excluded, and finally, the variables that commenters suggested but that we could not include in the methodology due to data issues. All geographic independent variables were rolled up to the study area using Tele Atlas study area boundary data.167 We do not include inputs to the production process (such as employees) in the regressions because carriers can choose the amount of these inputs. In other words, carriers with markedly higher costs than their similarly situated peers may be using substantially more of these inputs.168
83. Table 1 and Table 2 respectively show descriptive statistics for and correlations between the variables included in the updated methodology. The regression results are included in Table 3.169
84. Scale. We use several variables to measure scale: the number of loops, road miles, road crossings, and the number of study areas held under common control in the state. All the scale measures we include in the updated methodology are significant in the opex regression and all but LnRoadMiles are significant in the capex regression.170
85. Because the number of loops is a direct measure for the scale of the study area, we include the natural log of the number of loops (LnLoops) in the updated methodology.171 We expect that the amount of plant a carrier must install will be positively correlated with capex and
167 TomTom Telecommunications Suite 2011.09 (formerly Tele Atlas North America). TomTom acquired Tele Atlas and subsequently re-branded the wire center boundary data. Because commenters refer to the earlier brand name, for purposes of this appendix and the accompanying order, we refer to the wire center boundary data as Tele Atlas data. The Tele Atlas wire center boundaries were dissolved to create study area boundaries. Earlier study area boundary versions and other information were also used to exclude the acquired portions of study areas that were associated with frozen support. See Letter from Patrick Halley, FCC, to Marlene Dortch, FCC, WC Docket Nos. 10-90, 07-135, 05-337, GN Docket No. 09-51, CC Docket Nos. 01-92, 96-45, 03-109.168 We thus exclude variables that the updated NRIC Opex study included such as employees and net wireline plant per access line. 169 The data and the code to verify this are available at the following: http://www.fcc.gov/encyclopedia/rate-return-resources.170 For the purpose of the updated methodology, we consider a variable to be significant when the p-value is less than 0.10. While studies often use a cutoff p-value of 0.05, that is generally for statistical inference. Because we are creating predictions, we wish to be somewhat more inclusive to lessen the chance of omitted variable bias, so we therefore used the higher p-value. 171 We calculate LnLoops using the 2010 DL060 loop count in NECA’s October 2011 filing. See NECA 2010 USF Data, http://www.fcc.gov/Bureaus/Common_Carrier/Reports/FCC-State_Link/Monitor/usf11r10.zip, available at http://transition.fcc.gov/wcb/iatd/neca.html. We use DL060 loops because the capex and opex costs we use are associated with all the study area’s loops, not just the supported DL070 loops.
30

Federal Communications Commission DA 12-646
opex costs because more loops require more investment and operations cost.172 LnLoops is statistically significant.
86. We also include the natural log of the number of road miles (LnRoadMiles), which is a proxy for total loop length.173 Several commenters argued that some measure of loop length was an important variable.174 Although some (but not all) cost carriers may report such data to the Department of Agriculture’s Rural Utilities Service (RUS), such data are both incomplete and unavailable to the Bureau. We agree with NRIC that cable generally follows roads, so the number of road miles in a study area should correlate with the cabling required to serve that area.175
87. In its Capital Expenditure Study, NRIC predicted that road intersections would slow fiber construction and impose other costs and found that the number of intersections was a significant predictor of predicted construction costs.176 We agree that the number of such crossings is another good proxy for scale and therefore included the natural log of road crossings (LnRoadCrossings).177
88. The scale variables (LnRoadMiles) and road crossings (LnRoadCrossings) are significant in the opex regression, but have the opposite sign from each other. Only road crossings are significant in the capex regression.
89. Our last scale variable is the number of study areas in the state that are owned by the same holding company or have common control in the state (LnStateSACs).178 We anticipated that this variable would be a good predictor of capex and opex costs because some expenses could be shared among study areas. For capex, study areas that are part of a larger organization
172 Arguably loops are an input to the production process, which as we emphasize above, should be excluded from the independent variable list. Because loops are put in at a customer’s request, however, and because carriers are generally restricted in their ability to refuse such requests pursuant to carrier-of-last-resort obligations, we do not consider loop counts to be a carrier-controlled cost driver like the number of employees.173 For most of the study areas, road miles data come from the ESRI ArcGIS StreetMap (http://gislab.allegheny.edu/Documents/StreeMap_USA.pdf) (ESRI Street Map). Because ESRI Street Map does not include data for Guam and American Samoa, we used Tiger files for these study areas, which because they were generated for Census applications, may be less accurate for transportation applications. The Tiger files are available at the US 2010 Census website: http://www2.census.gov/cgi-bin/shapefiles2009/national-files. Because only two study areas were affected, we concluded that using a separate source data for road miles for these study areas reasonable. We found that the slope on LnRoadMiles and LnRoadCrossings were unaffected by using the Tiger files for Guam and American Samoa.174 See Central Texas at 5 and Accipiter Comments at 26. 175 NRIC Comments at 16.176 NRIC Capex Study at 10. We believe that maintenance costs would also be higher in the presence of additional road crossings because of travel delays and the increased costs associated with the dangers of intersections.177 NRIC reiterated the usefulness of the road crossing data in its comments. NRIC Comments at 25. Note that we calculate road crossings rather than intersections because counting intersections is computationally very burdensome. Two roads that cross at right angles (forming a plus sign) create four crossings. We believe that road crossings is a good proxy for road intersections.178 The holding company/common control ownership information can be found in the Universal Service Monitoring Report, CC Docket No. 98-202, app. (2011) (HC NECA ILEC Support Data - by Study Area.xls), available at http://www.fcc.gov/Bureaus/Common_Carrier/Reports/FCC-State_Link/Monitor/2011_MR_Supplementary_Material.zip. (last visited Feb. 16, 2012)
31
Federal Communications Commission DA 12-646
(i.e., the study area has more commonly-owned study areas in the state) may allow installation crews to be deployed more efficiently. For opex, study areas that are part of a larger organization can share various expenses, especially headquarters-related expenses, which would allow for some specialization among management employees. We found LnStateSACs to be significant for both capex and opex.
90. Age of Plant . Commenters stated that age of plant was an important variable for two reasons: first, because the cost of recent capital investments is higher due to inflation and second, because the return component of capital expenses is calculated on net plant, and recent investment will be depreciated less fully than old plant.179 While the Bureau cannot readily determine the average age of carriers’ plant, the percentage of the plant that has not yet been depreciated (PctUndepPlant) should be highly correlated with plant age: more recently installed plant will be less depreciated.180 Holding all else constant, the less of a carrier’s plant is depreciated (which yields a higher PctUndepPlant), the higher its capex should be. The intuition for the effect of PctUndepPlant on opex is ambiguous. We find that this variable is a strong cost predictor for both capex and opex.
91. Customer Dispersion . We include three variables that account for customer dispersion. Many commenters asserted that density was an important cost predictor, and that their costs are high in part because of the rural areas they serve.181 We therefore expect that density is negatively correlated with both capex and opex costs. Density (LnDensity) is the natural log of the following quotient: number of housing units in the study area divided by the size of the study area in square miles as reported by the Tele Atlas boundaries.182 We find that it is significant in both regressions.183
92. We also include the natural log of the number of exchanges in the study area as a proxy for customer dispersion (LnExchanges). Although the straightforward measure of density calculates the average customer density within the study area, the number of exchanges roughly accounts for the number of population centers within the study area because most population centers will have their own exchanges. The more population centers (holding other factors constant), the higher capex and opex costs will be because more cabling will be required to connect the customers within the study area to each other, and the farther the employees will need to drive to fix any troubles. The variable LnExchanges is significant in both regressions.
93. Our final customer dispersion variable accounts for the portion of households in
179 See, e.g., Accipiter Comments at 5, Guadalupe Comments at 3. In its comments, Carriers for Progress in Rural America (at 6) states that population growth should be added to the model to account for the new plant associated with new neighborhoods. The variables percentage change in undepreciated plant and percentage change in loops account for this. 180 We calculate the percentage of the plant that has yet to be depreciated as 100 * DL220 / DL160 (i.e., 100*net plant/gross plant).181 See, e.g., Guadalupe Valley Comments at 3, Interbel Comments at 10, Moss Adams Comments at 8. 182 See generally, supra note Error: Reference source not found. We also tested LnWtDensity, which accounts for density at the block level. We calculate this by calculating each census block’s density (housing units in the block divided by square miles of the block) and then calculating the weighted average density weighting by the number of housing units in each block. LnWtDensity is the natural log of weighted density. LnWtDensity is not significant.183 Because we are using a log-log model, the natural log of density (the number of housing units divided by square miles) captures the effects of both the size of the study area and the number of housing units. We tested the regressions with the natural log of housing units and the natural log of square miles (but omitting the natural log of density), and the results were very similar.
32
Federal Communications Commission DA 12-646
urban clusters or urbanized areas (PctUrban).184 To the extent that rural carriers also serve urbanized pockets, we would expect their costs to be higher, holding all other variables (including road miles) constant, because wage rates may be higher near urbanized areas. We thus expect PctUrban to be positively correlated to opex, and it is. PctUrban’s effect on capex is less clear: the labor costs associated with trenching are capitalized, so to the extent that labor near urban areas is more expensive, the higher capital costs should be. But capitalized labor is only one of many costs in capex, so the effect may not be strong. PctUrban is positive but not significant in the capex regression.
94. Geography . Commenters suggested the inclusion of several geographically-based variables such as soil type. We agree. When creating many of the indexes for geographic variables, we took into account the location of roads within the study area because cabling generally follows roads.185 For these variables we overlaid road data in the study area with our sources of geographic information and calculated variables that were either percentages, or where appropriate, averages.
95. For example, commenters stated that soil type is an important cost predictor.186 We therefore constructed a soil difficulty index (Difficulty). This index is similar to the index in the NRIC capex study in which soil types were matched with construction difficulty values established for the Commission’s High Cost Proxy Model (HCPM), which the Commission used to calculate high-cost support for non-rural carriers.187 The STATSGO2 database we use lists more soil types than the original STATSGO database, however, so there are many soil types in the STATSGO2 database for which there are no construction difficulty values from the HCPM. NRIC tried several options, but settled on assuming the soil difficulty level to be 1 (the lowest level of difficulty) for those soil types not found in the table.188 Our soil difficulty index builds on the NRIC methodology. When faced with soil types that do not appear on the original HCPM list, we interpolate the difficulty rating based on similar soil types in the HCPM list. We manually associate unmatched soil types from the STATSGO2 data with similar soil texture in the original HCPM table, and used the difficulty rating of the similar soil types in the HCPM list for the new soil type in the STATSGO2 database. The new extended table associates a difficulty rating for all soil types in the STATSGO2 database.189 We then calculated the average soil construction value along the roads in each study area.
96. We find soil difficulty to be a statistically significant predictor in opex. Although NRIC found that soil difficulty was a significant predictor of construction costs, Difficulty is positive in our capex, but not significant.190 Although we also expected soil difficulty to be positive in our capex regression, an alternative hypothesis is that in locations where trenching is unusually expensive, an efficient carrier may install aerial plant (use poles rather than trench). This would involve lower capital costs than trenching, but higher future operations costs. Thus, it is plausible that in the presence of difficult-to-trench soils, carriers experience no obvious change
184 PctUrban is the ratio of the number of housing units in either urbanized clusters or urbanized areas divided by the total number of housing units in the study area. 185 See supra para. 86.186 See, e.g., ATC Comments at 3, Calaveras Comments at 7, Eagle Telephone Comments at 4, Guadalupe Comments at 2.187 NRIC Capex study at 9. 188 See Letter from Thomas J. Moorman, Counsel to Nebraska Rural Independent Companies, to Marlene H. Dortch, FCC, Attach. (dated Jan.27, 2012).189 This table is available at http://www.fcc.gov/encyclopedia/rate-return-resources.190 NRIC Capex Study at 18.
33
Federal Communications Commission DA 12-646
in capex or, in some circumstances possibly even reduced capex costs.
97. Because NRIC suggested that we account for close-to-the-surface bedrock, we calculated the percentage of road miles within each study area where bedrock was within 36 inches of the surface (PctBedrock36).191 The NRIC capex study found that predicted construction costs were positively associated with close-to-the-surface bedrock, so we might expect that the coefficient on PctBedrock36 should be positive in the capex regression.192
98. We find that close-to-the-surface bedrock is significant in the opex regression, but that it is not significant in the capex regression. This result could occur for the same reasons as for soil construction difficulty above or because the construction difficulty of bedrock has already been captured by the soil difficulty variable.
99. Pointing to the NRIC Capex study, which suggested that construction costs are higher in areas where the ground is frozen more often, several commenters argued that the regressions should include a frost index.193 The frost index in the NRIC capex study uses of the number of frost-free days from the SSURGO data. Unfortunately, this information is not available for all areas in the STATSGO2 database. We believe that the USDA’s hardiness index is a useful proxy for this information, and we use it to create a simple index called Climate that is based on the average annual minimum temperature.194 The lower the minimum temperature, the more days the ground is likely to be frozen. The higher the index, the fewer frost-free days the study area would have. Based on the comments in the record, we expected this variable to be negatively correlated with capex (the higher the index, the more frost-free days the area should have, so construction costs should be lower).
100. The Climate variable (Climate) is positive and has low p-values in the regressions, which means that it is unlikely to be a spurious result. However, it is positively correlated with capex and opex.
101. Commenters also stated that it is more difficult to construct and maintain networks on tribal lands and in national parks because of permitting and similar issues,195 so we include two additional variables: (1) the percentage of each study area that is a federally-recognized Tribal land (PctTribalLand),196 and (2) the percentage of each study area that lies within a national park (PctParkLand).197
102. The coefficient for the percentage of the study area that is tribal land
191 The NRIC Capex Study found that predicted construction costs were positively associated with close-to-the-surface bedrock (Capex Study at 17), and in its comments, NRIC suggested including bedrock information (NRIC Comments at 24). 192 NRIC Capex Study at 17. NRIC did not include bedrock in its final regression, however. 193 Blooston Comments at 2, Interbel Comments at 10, Nebraska Rural Comments at 21.194 The hardiness index uses the zone numbers in the 2012 USDA Plant Hardiness Zone Map (available at http://www.usna.usda.gov/Hardzone/). The index increments by 0.5 for each zone, so Zone 1A is 1.0, zone 1B is 1.5, Zone 2A is 2, Zone 2B is 2.5, etc. This table is available at http://www.fcc.gov/encyclopedia/rate-return-resources. The Climate index is the average of the index along the roads in the study area. We also think that the variable climate controls for the length of the construction season that Moss Adams suggested (Moss Adams Comments at 12).195 Interbel Comments at 3, New Mexico Exchange Carrier Group at 14-15. 196 Tribal land information is available from the US Census Bureau at http://www.census.gov/cgi-bin/geo/shapefiles2010/main.197 National Park data are available at http://www.bts.gov/publications/national_transportation_atlas_database/2011/.
34

Federal Communications Commission DA 12-646
(PctTribalLand) is positive for both capex and opex regressions, but is significant in only the opex regression. The percentage of the study area that is national park land (PctParkLand) is positive and significant in both regressions. As can be seen in Table 1, most of the study areas do not contain either tribal or national park land, and it may be a simple lack of data that causes a lack of significance for PctTribalLand in the capex regression. Nonetheless, we agree that both capex and opex costs could be higher in the presence of these factors, so we include them in the model.
103. Finally, based on comments in the record that certain areas of the country face unique circumstances, we tested several regional variables. Alaskan commenters suggested that Alaska was unique because of its harsh climate and other factors.198 We therefore added the dummy variable Alaska to the regressions, which equals 1 for the 17 study areas in Alaska and zero elsewhere.
104. We also include regional dummies because in its Original Opex study NRIC found that opex costs were correlated with regions.199 Although NRIC did not include region dummy variables in the regression, instead opting to use 2005 median home value, which it also used in its Updated Opex Study, we include region in our updated methodology. We tested the four census-based regions: Western (West), Midwest (Midwest), Northeast (Northeast) and South (South). We found that Midwest and Northeast were each significant in at least one regression, so we include them.
105. Use of Soil Database Information . Our source for soil data is the U.S. General Soil Map (STATSGO2) soils database. We selected STATSGO2 as a data source because it provides data for the entire country. The Soil Survey Geographic Database (SSURGO) soils data from the Natural Resource Conservation Service (NRCS) that the Nebraska Rural Independent Companies capex study used to generate soil, frost and wetland variables is an attractive database because it contains a richer set of soil variables and contains data at a smaller granular area than the STATSGO2 database. Unfortunately, as can be seen from the graph on page 23 of the NRIC comments, not only do the SSURGO data not cover Guam or American Samoa, and much of Alaska, but there are also numerous other holes in the data in many states. Thus, there are many study areas in Alaska where there is no SSURGO data and even some conterminous United States study areas such as the West Kentucky Rural Telephone Coop (Study Area Code 260421) where there is virtually no SSURGO spatial data. We therefore could not apply the results of a SSURGO-based model to these companies because the needed data would be missing. We conclude, therefore, that it is not practical to use the SSURGO data at this time.
106. Two commenters argue that we should use the SSURGO data for study areas covered by it and use STATSGO2 for the remaining study areas.200 We have concerns about this approach for several reasons, and ultimately decline to do so. In particular, the commenters’ proposed approach would mean that those study areas for which the SSURGO data are not universally available would be treated inconsistently with those for which the SSURGO are universally available. In addition, it would be challenging to combine the two data sets for those study areas where we have only some SSURGO data. Given these problems, we conclude that the implementation and fairness benefits of a nationally uniform approach based on STATS2GO outweigh the benefits of using SSURGO data for a subset of areas.201 We discuss below the elements of the STATSGO2 data we use.
198 See Alaska Rural Coalition Comments at 17-19; Copper Valley Comments at 5-7.199 NRIC found that cost was strongly related to region in its Original Opex Study (p 8) but did not include it in its regression, and in its Updated Opex Study used the 2005 median home values in its regression (p 3).200 NRIC Comments at 24 and NASUCA Comments at 46.
35

Federal Communications Commission DA 12-646
107. Independent Variables Tested But Not Used in the Model . Based on commenters’ suggestions and the analysis proposed in Appendix H, we tested several additional variables that were ultimately excluded from the final model because they were not significant for either capex or opex.202
108. In its Capex Study, NRIC found that rain frequency increased construction cost per household.203 Following NRIC’s model, we used the Samson weather station data, and for each study area, calculated the average number of days per year with greater than 0.5 inches of rainfall (DaysAbvPt5).204 We found DaysAbvPt5 was not significant in either regression.
109. We also tested the average slope in study areas (slope) using data in the STATSGO2 database.205 Our hypothesis was that the steeper the slope, the more difficult it would be to build and maintain cabling. The coefficient on slope was insignificant (i.e., statistically indistinguishable from zero) in both regressions and therefore dropped from the model.
110. We similarly tested the percentage of the study area that was water (PctWater), but we did not include it in the updated model because it was insignificant in both regressions. This is unsurprising. The proposed model included PctWater to account for the fact that cabling may have to be run around bodies of water, but the updated model accounts for the number of road miles (as a proxy for loop length), so the additional cabling associated with routing around water has already been accounted for.
111. We tested the percentage of road miles where the water table was within 36 inches of the surface (PctWaterTable36).206 We found the variable PctWaterTable36 to be weakly significant in opex, but it had an implausible negative sign in both the capex and opex regressions. Because of the sign issue and because inclusion of the variable does not markedly improve the fit, we exclude it from the model so as not to lower the cap for study areas with high water tables.
112. Accipiter suggested adding the percentage change in loops (PctLoopChange) to account for study areas that are growing, because growing carriers “are prone to have unique cost structures.”207 We believe thet PctUndepPlant proxies for this, but out of an abundance of caution, we tested PctLoopChange, but found that it was insignificant, suggesting that PctUndepPlant is proxying for the unique cost structures that Accipiter is concerned about.208
201 We note that the Commission’s hybrid cost proxy model, which was used to estimate forward-looking costs for the non-rural high-cost support mechanism, uses an earlier version of the STATSGO2. 202 We include these variables in the data that we posted on the web so that others can verify our results.203 NRIC Capex Study at 17.204 For those study areas with one station, the value (for the number of days per year with greater than 0.5 inches of rainfall) for that station was used. For those study areas with more than one station, the average of the values was used. For those study areas without a station, the nearest station was used. For those study areas that were non-conterminous, each polygon (i.e., piece) of the study area was treated as its own study area (for calculating the rainfall statistic), and then the weighted mean value across all the study area’s polygons was calculated using the polygon’s square miles as the weight.205 We calculated the average of the absolute value of slope along the road segments in the study area.206 The locations of close-to-the-surface water table within 36 inches of the surface come from the STATSGO2 database. 207 Accipiter Comments at 23-24. 208 We calculated PctLoopChange as the percentage change of DL060 loop count between 2009 and 2010. For the observations that converted from being average schedule to cost companies (and therefore we did
36

Federal Communications Commission DA 12-646
113. Based on NRIC’s updated opex regression, we tested statewide median house values,209 but found them to be insignificant.210 This is unsurprising because statewide values include mostly urban houses. Our regional independent variables, however, helped capture the intended effect.
114. We also tested the natural log of the number of stream crossings (LnStreamCross), which could increase construction costs in the same way that road crossings do. We found LnStreamCross to be significant and negative in opex, but insignificant in capex. Because the coefficient was an implausible sign in the opex regression without an offsetting plausible coefficient in the other regressions, we omitted LnStreamCross from both regressions.211
115. The proposed model also included the number of census blocks in the study area.212 Although the natural log of the total number of census blocks (LnBlocks) was weakly significant in the opex regression, it was not significant in the capex regression. Although we generally included variables that were significant in at least one regression in both regressions, we omitted census blocks from the updated model regressions for two reasons. First, commenters did not think that the number of blocks was a good proxy for density.213 Also, we are now accounting for customer dispersion and density directly through independent variables LnRoadMiles, LnRoadCrossings and LnDensity.
116. Unavailable Independent Variables. Several carriers suggested additional variables to the regression analysis, but we were unable to include them because the data were either unavailable to the Commission, nonpublic, or we could not generate data at the study area level. We recognize that some of the unavailable variables could be significant if they could be included, but given the other enhancements made to the regressions described herein, we conclude that the methodology is adequate to identify cost outliers among similarly situated companies.
117. The NRIC capex study postulated that the presence of wetlands would increase construction costs because of need for additional “approvals and specialized techniques.”214 It found that wetlands were positively correlated with increased predicted construction costs. As NRIC points out, however, wetlands data are not available for Colorado, Wisconsin and Montana. Since our objective is to develop a methodology that applies equally to all cost carriers, we could not include wetlands data in the updated methodology.215
not have DL060 loop counts for the prior year), we instead used the percentage change in DL070 loops, which we believe is an excellent proxy for the percentage change in DL060 loops.
209 NRIC’s intent in including house values was to proxy for local “cost of living differences.” NRIC Updated Opex Study at 3.210 See http://www.census.gov/hhes/www/housing/census/historic/values.html211 U.S. Department of the Interior, U.S. Geological Survey, National Hydrography Dataset, last visited Feb. 1, 2012, available at http://nhd.usgs.gov/index.html. As we did with road crossings data, we intersected stream data with roads to find the number of stream crossings in the study area.212 USF/ICC Transformation Order and FNPRM, 26 FCC Rcd at 182, App. H, para 24. In the proposed methodology, the number of blocks was broken out by whether they were in urbanized areas, urbanized clusters or nonurban (rural) areas.213 Accipiter Comments at 25-26, Moss Adams at 12.214 NRIC Capex study at 10.215 In its Capex Study, NRIC uses SSURGO data to create proxies for wetlands data where it does not exist, but because SSURGO data does not cover the entire country and we are therefore not able to use it, we could not create that proxy.
37

Federal Communications Commission DA 12-646
118. Similarly, commenters suggested the following additional variables that, if not already proxied in the model, could not be used because they were unavailable to the Commission, nonpublic, or data could not be generated at the study area level: age of investment;216 broadband speed capability;217 cable route miles or cable sheath miles;218 status as carrier of last resort;219 copper versus fiber networks;220 cost of living and labor costs;221 environmental; legal and regulatory costs;222 loop length/average loop length;223 right of way costs and vacant lots;224 and weather patterns.225
119. One commenter argues that the Bureau’s methodology should include variables that are not universally available and that it is better to comprehensively study a representative sample of study areas and apply the results to the wider population of study areas.226 The commenter does not specify, however, how the Bureau could apply that knowledge to study areas for which the information is unavailable.
216 Interbel Comments at 10. Study areas submit a variety of information on plant, but we cannot calculate the age of investment from it. Investment age, however, is proxied by PctUndepPlant.217 Guadalupe Comments at 3. While the Bureau has access to carriers’ FCC Form 477 filings, which contain broadband speed information for each filer, many carriers file their Form 477 at the holding company level within a state rather than at the study area code level, so matching up the Form 477 filings with the study area code would be challenging in some cases. Additionally, the data are nonpublic, and therefore they could not be published for others trying to replicate the regression results. 218 Guadalupe Comments at 3. Some, but not all, rate-of-return cost carriers report this information to RUS, but there is no universally-available source of cable sheath or route miles. Cable mileage is proxied by LnRoadMiles.219 Guadalupe Comments at 5 and Washington Independent Tel comments at 5. We do not have a source for which states require study areas to be carriers of last resort. Further, the obligations imposed on a carrier of last resort can vary by state.220 Carriers for Progress Comments at 7. We are unaware of a source for this information. 221 Guadalupe and Moss Adams suggested labor costs. Guadalupe Comments at 3; Moss Adams Comments at 8. We do not have cost of living or labor rate data with sufficient geographic granularity to create a meaningful index. We note that cost of living and labor rates in rural areas may be less than in urban areas, so we expect that statewide data would not be helpful. We tested this assumption by including statewide median house values in the regression, but the variable was not significant. Our regressions instead use regional variables to proxy for such variations in labor costs.222 Carriers for Progress Comments at 8. We are not aware of a direct source for such information; instead, we use the regional, PctParkLand and PctTribalLand variables to proxy for such costs. We considered using dummy variables for individual states, but that would significantly benefit the study areas in those states that had few study areas in the regression, because any inefficiency of that carrier would be picked up by the dummy variable.223 Central Tex Comments at 7, Midvale Tel Comments at 5, and Washington Independent Tel Comments at 3. Some, but not all, rate-of-return cost carriers report this information to RUS, but there is no universally available source of average loop length. Our regressions use LnRoadMiles to proxy for loop length.224 Guadalupe Valley Comments at 3. We are unaware of sources of data for these variables. Our PctParkLand and PctTribalLand variables proxy for right-of-way costs.225 Moss Adams Comments at 12. Because weather covers so many things, such as wind, temperature, rainfall and other attributes, we could not address such a vague suggestion. Above, we discuss the weather features that we include in the updated methodology: temperature and rainfall. 226 NRIC Comments at 19-20.
38

Federal Communications Commission DA 12-646
Implementation. For each study area, the regressions will be used to generate the 90th percentile predicted values for both the natural log of capex and the natural log of opex. These values will then be converted back to “levels” by using the inverse of the natural log function.
The lower of the study area’s original algorithm step 25A and the level of the predicted 90th percentile capex value will be retained in algorithm step 25A. Similarly, the lower of the study area’s original algorithm step 25B and level of the predicted 90th percentile opex value will be retained in algorithm step 25B. These values will then be summed in algorithm step 25C, which will feed into algorithm step 26.
39
Federal Communications Commission DA 12-646
Table 1Descriptive Statistics For The Raw Data
Variable N MeanStd
Dev. Min10th Pctile Median
90th Pctile Max
LnCapex 726 13.78 1.27 9.01 12.15 13.83 15.41 16.93LnOpex 726 14.11 1.03 10.29 12.75 14.16 15.38 17.03LnLoops 726 7.81 1.20 3.00 6.33 7.88 9.28 11.18LnRoadMiles 726 6.55 1.34 1.88 4.86 6.45 8.43 10.53LnRoadCrossings 726 8.00 1.23 4.64 6.42 7.94 9.64 11.46LnStateSACs 726 0.36 0.63 0.00 0.00 0.00 1.39 3.04PctUndepPlant 726 33.85 14.81 -6.26 16.87 31.96 53.36 88.63LnDensity 726 2.01 1.59 -4.27 -0.10 2.23 3.73 7.02LnExchanges 726 1.18 0.98 0.00 0.00 1.10 2.48 4.33PctBedrock36 726 0.06 0.14 0.00 0.00 0.00 0.22 0.89Difficulty 726 1.06 0.19 1.00 1.00 1.00 1.16 2.81Climate 726 6.20 1.59 1.67 4.37 6.00 8.46 12.65PctTribalLand 726 9.03 24.81 0.00 0.00 0.00 28.11 100.00PctParkLand 726 0.64 3.86 0.00 0.00 0.00 0.02 47.81PctUrban 726 9.17 19.46 0.00 0.00 0.00 37.40 95.38Alaska 726 0.02 0.15 0.00 0.00 0.00 0.00 1.00Midwest 726 0.41 0.49 0.00 0.00 0.00 1.00 1.00Northeast 726 0.08 0.27 0.00 0.00 0.00 0.00 1.00
40
Table 2Correlation Coefficients
Ln Ln Ln LnRoad LnRoad LnState PctUnDep Ln Ln Pct Pct Pct PctVariable Opex Capex Loops Miles Crossings SACs Plant Density Exhanges Bedrock36 Difficulty Climate TribalLand ParkLand Urban Alaska Midwest NortheastLnOpex 1.00 0.88 0.87 0.58 0.70 -0.12 0.04 0.13 0.60 0.05 0.11 0.25 0.08 0.04 0.28 0.03 -0.19 -0.10LnCapex 0.88 1.00 0.80 0.59 0.69 -0.14 0.32 0.09 0.60 0.06 0.11 0.15 0.05 0.02 0.23 -0.03 -0.08 -0.17LnLoops 0.87 0.80 1.00 0.52 0.67 0.03 -0.13 0.34 0.58 -0.05 0.08 0.14 0.00 -0.02 0.35 -0.03 -0.13 0.04LnRoadMiles 0.58 0.59 0.52 1.00 0.94 -0.13 -0.01 -0.51 0.79 0.07 0.13 -0.05 0.04 0.06 -0.06 -0.02 -0.13 -0.22LnRoadCrossings 0.70 0.69 0.67 0.94 1.00 -0.12 -0.04 -0.26 0.76 0.06 0.14 0.09 0.03 -0.02 0.10 -0.10 -0.15 -0.21LnStateSACs -0.12 -0.14 0.03 -0.13 -0.12 1.00 -0.26 0.16 -0.08 -0.05 0.05 -0.17 -0.07 -0.01 0.05 -0.04 0.12 0.13PctUnDepPlant 0.04 0.32 -0.13 -0.01 -0.04 -0.26 1.00 -0.10 -0.04 0.08 -0.01 -0.07 0.01 0.01 -0.02 0.00 0.15 -0.19LnDensity 0.13 0.09 0.34 -0.51 -0.26 0.16 -0.10 1.00 -0.32 -0.15 -0.05 0.26 -0.12 -0.26 0.39 -0.38 0.06 0.25LnExchanges 0.60 0.60 0.58 0.79 0.76 -0.08 -0.04 -0.32 1.00 -0.01 0.11 -0.11 0.11 0.08 -0.09 0.09 0.00 -0.09PctBedrock36 0.05 0.06 -0.05 0.07 0.06 -0.05 0.08 -0.15 -0.01 1.00 0.13 0.17 0.17 0.12 -0.01 0.07 -0.22 -0.02Difficulty 0.11 0.11 0.08 0.13 0.14 0.05 -0.01 -0.05 0.11 0.13 1.00 0.11 0.19 -0.01 -0.01 -0.05 -0.10 -0.08Climate 0.25 0.15 0.14 -0.05 0.09 -0.17 -0.07 0.26 -0.11 0.17 0.11 1.00 0.06 -0.09 0.22 -0.22 -0.53 -0.18PctTribalLand 0.08 0.05 0.00 0.04 0.03 -0.07 0.01 -0.12 0.11 0.17 0.19 0.06 1.00 0.04 -0.02 0.16 -0.18 -0.10PctParkLand 0.04 0.02 -0.02 0.06 -0.02 -0.01 0.01 -0.26 0.08 0.12 -0.01 -0.09 0.04 1.00 0.00 0.44 -0.12 0.00PctUrban 0.28 0.23 0.35 -0.06 0.10 0.05 -0.02 0.39 -0.09 -0.01 -0.01 0.22 -0.02 0.00 1.00 0.01 -0.05 -0.01Alaska 0.03 -0.03 -0.03 -0.02 -0.10 -0.04 0.00 -0.38 0.09 0.07 -0.05 -0.22 0.16 0.44 0.01 1.00 -0.13 -0.05Midwest -0.19 -0.08 -0.13 -0.13 -0.15 0.12 0.15 0.06 0.00 -0.22 -0.10 -0.53 -0.18 -0.12 -0.05 -0.13 1.00 -0.24Northeast -0.10 -0.17 0.04 -0.22 -0.21 0.13 -0.19 0.25 -0.09 -0.02 -0.08 -0.18 -0.10 0.00 -0.01 -0.05 -0.24 1.00

Federal Communications Commission DA 12-646
Table 3 Capex (LnCapex) Regression
Variable Coef. Std. Err. t P>|t|LnLoops 0.788 0.071 11.15 0.00 *LnRoadMiles -0.208 0.136 -1.53 0.13 LnRoadCrossings 0.240 0.091 2.64 0.01 *LnStateSACs -0.070 0.043 -1.65 0.10 *PctUndepPlant 0.031 0.002 18.39 0.00 *LnDensity -0.158 0.072 -2.20 0.03 *LnExchanges 0.118 0.061 1.94 0.05 *PctBedrock36 -0.072 0.156 -0.46 0.64 Difficulty 0.118 0.087 1.36 0.17 Climate 0.089 0.030 2.99 0.00 *PctTribalLand 0.0005 0.001 0.47 0.64 PctParkLand 0.018 0.005 3.71 0.00 *PctUrban 0.001 0.002 0.34 0.73 Alaska -0.6223 0.337 -1.85 0.07 *Midwest 0.092 0.091 1.01 0.31 Northeast -0.309 0.124 -2.49 0.01 *Constant 6.039 0.416 14.51 0.00 *
N = 726 Pseudo R2 = .6684
Notes:
An * indicates significance at the 0.10 level.
P-values are based on Wald statistics.
Values are rounded. More precise coefficient values are posted at http://www.fcc.gov/encyclopedia/rate-return-resources.
42

43
Federal Communications Commission DA 12-646
120.
Table 3 (contd.)
Opex (LnOpex) Regression
Variable Coef. Std. Err. t P>|t|LnLoops 0.596 0.037 15.97 0.00 *LnRoadMiles -0.247 0.086 -2.87 0.00 *LnRoadCrossings 0.272 0.081 3.37 0.00 *LnStateSACs -0.078 0.035 -2.22 0.03 *PctUndepPlant 0.008 0.001 6.47 0.00 *LnDensity -0.128 0.034 -3.72 0.00 *LnExchanges 0.125 0.032 3.94 0.00 *PctBedrock36 0.279 0.098 2.84 0.01 *Difficulty 0.114 0.057 2.02 0.04 *Climate 0.135 0.020 6.91 0.00 *PctTribalLand 0.002 0.001 2.79 0.01 *PctParkLand 0.006 0.004 1.65 0.10 *PctUrban 0.002 0.001 2.52 0.01 *Alaska 0.299 0.155 1.92 0.06 *Midwest 0.134 0.063 2.13 0.03 *Northeast 0.015 0.085 0.18 0.86Constant 8.198 0.255 32.21 0.00 *
N = 726 Pseudo R2 = 0.6234
Notes:
An * indicates significance at the 0.10 level.
P-values are based on Wald statistics.
Values are rounded. More precise coefficient values are posted at http://www.fcc.gov/encyclopedia/rate-return-resources.
43

44
Federal Communications Commission DA 12-646
121. Figure 1
Opex vs. Loops
0
5
10
15
20
25
30
0 10000 20000 30000 40000 50000 60000 70000 80000Loops
Ope
x (m
illio
ns)
Figure 2
Natural Log of Opex vs. Natural Log of Loops
0
2
4
6
8
10
12
14
16
18
0 2 4 6 8 10 12Natural Log of Loops
Nat
ural
Log
of O
pex
44

45
Federal Communications Commission DA 12-646
Figure 3
Opex per Loop vs. Density
0
2000
4000
6000
8000
10000
12000
0 200 400 600 800 1000 1200Density
Ope
x pe
r L
oop
Figure 4
Natural Log of Opex vs. Natural Log of Density
0
2
4
6
8
10
12
14
16
18
-6 -4 -2 0 2 4 6 8
Natural Log of Density
Nat
ural
Log
of O
pex
45

Federal Communications Commission DA 12-646
APPENDIX B
Quantile Regression Cost Per Loop (CPL)
Study Area Name SAC State LoopsCurrent
CPL
Current Capex CPL
90% Capex CPL
Estimate
Current Opex CPL
90% Opex CPL
Estimate
CPL used to
Determine Support
3-RIVERS TEL COOP 482255 MT 17,970 $905 $490 $536 $416 $426 $905ACCIPITER DBA ZONA 452191 AZ 520 $6,707 $4,134 $3,810 $2,574 $3,202 $6,383ACE TEL ASSN-IA 351346 IA 3,997 $534 $225 $386 $308 $631 $534ACE TEL ASSN-MN 361346 MN 9,833 $688 $350 $913 $338 $590 $688ACE TEL OF MICHIGAN 310704 MI 4,370 $673 $303 $591 $369 $583 $673ADAK TEL UTILITY 610989 AK 147 $12,739 $3,265 $3,265 $9,474 $9,474 $12,739AGATE MUTUAL TEL CO 462178 CO 113 $4,530 $1,457 $4,109 $3,073 $3,549 $4,530ALASKA TEL CO 613017 AK 3,737 $815 $262 $630 $552 $1,415 $815ALBANY MUTUAL ASSN 361347 MN 3,336 $825 $490 $944 $335 $630 $825ALBION TEL CO-ATC 472213 ID 3,853 $1,374 $537 $881 $837 $889 $1,374ALENCO COMMUNICATION 442090 TX 1,888 $2,129 $881 $1,345 $1,248 $1,893 $2,129ALHAMBRA-GRANTFORK 340978 IL 1,042 $657 $270 $593 $387 $1,070 $657ALL WEST COMM.-WY 512290 WY 293 $906 $437 $823 $468 $1,584 $906ALL WEST COMM-UT 502288 UT 4,572 $783 $457 $454 $326 $525 $780ALLBAND COMM COOP 310542 MI 163 $8,283 $4,945 $5,972 $3,338 $3,338 $8,283ALLENDALE TEL CO 310669 MI 3,842 $558 $294 $310 $265 $531 $558ALLIANCE-SPLITROCK 391657 SD 7,212 $785 $504 $744 $280 $539 $785ALMA COMM. CO. 421860 MO 342 $2,186 $1,093 $2,280 $1,093 $2,141 $2,186ALMA TEL CO 220344 GA 6,090 $426 $84 $337 $342 $678 $426ALPINE COMM. 351106 IA 5,168 $630 $313 $505 $317 $576 $630AMELIA TEL CORP 190217 VA 5,095 $533 $226 $253 $307 $389 $533AMERICAN SAMOA 673900 AS 9,884 $410 $161 $933 $249 $1,728 $410ARAPAHOE TEL CO 371516 NE 1,989 $1,102 $379 $637 $723 $1,028 $1,102ARCTIC SLOPE TEL 613001 AK 2,518 $1,417 $341 $341 $1,076 $877 $1,218ARDMORE TEL CO 290280 TN 7,745 $434 $234 $307 $199 $495 $434ARIZONA TELEPHONE CO 452171 AZ 2,967 $622 $296 $642 $326 $1,257 $622ARKANSAS TEL CO 401692 AR 6,938 $379 $160 $335 $219 $547 $379
46

47
Federal Communications Commission DA 12-646
Study Area Name SAC State LoopsCurrent
CPL
Current Capex CPL
90% Capex CPL
Estimate
Current Opex CPL
90% Opex CPL
Estimate
CPL used to
Determine Support
ARKWEST COMM., INC. 401734 AR 4,384 $972 $392 $581 $580 $813 $972ARLINGTON TEL CO 371517 NE 927 $805 $250 $395 $555 $770 $805ARMSTRONG OF WV 200256 WV 2,702 $632 $174 $381 $457 $565 $632ARMSTRONG TEL CO-NY 150071 NY 2,800 $754 $240 $308 $515 $601 $754ARMSTRONG TEL CO-PA 170189 PA 1,441 $973 $351 $261 $622 $665 $882ARMSTRONG TEL OF MD 180216 MD 5,905 $546 $174 $281 $371 $469 $546ARMSTRONG TEL. CO. 200267 WV 4,423 $748 $266 $422 $482 $573 $748ARROWHEAD COMM CORP 361374 MN 569 $668 $311 $311 $357 $857 $668ARVIG TEL CO 361350 MN 11,482 $526 $193 $304 $333 $312 $505ASOTIN TEL - OR 532404 OR 120 $901 $160 $712 $740 $2,639 $901ASOTIN TEL - WA 522404 WA 1,157 $729 $379 $547 $350 $1,014 $729ATLANTIC MEMBERSHIP 230468 NC 37,985 $390 $186 $480 $204 $373 $390ATLAS TEL CO 431966 OK 1,147 $864 $305 $574 $559 $1,311 $864AYRSHIRE FARMERS MUT 351105 IA 254 $1,353 $676 $1,015 $677 $1,910 $1,353BACA VALLEY TEL CO 492259 NM 662 $2,959 $1,381 $1,308 $1,577 $1,920 $2,885BADGER TELECOM, INC. 330844 WI 5,275 $584 $229 $245 $356 $344 $573BALLARD RURAL COOP 260396 KY 5,273 $756 $421 $759 $334 $747 $756BARNARDSVILLE TEL CO 230469 NC 1,094 $772 $346 $411 $426 $748 $772BAY SPRINGS TEL CO 280446 MS 9,000 $992 $415 $463 $577 $632 $992BEAR LAKE COMM 503032 UT 784 $906 $283 $400 $623 $782 $906BEAVER CREEK COOP 532359 OR 3,652 $614 $220 $505 $394 $728 $614BEEHIVE TEL CO - NV 552284 NV 124 $2,615 $992 $1,832 $1,623 $4,061 $2,615BEEHIVE TEL CO - UT 502284 UT 930 $3,026 $1,797 $2,969 $1,228 $2,554 $3,026BEK COMM. COOP. 381604 ND 6,381 $1,337 $933 $1,206 $403 $784 $1,337BENKELMAN TEL CO 372455 NE 1,175 $1,717 $753 $755 $964 $1,056 $1,717BERNARD TEL CO INC 351110 IA 472 $1,380 $680 $1,049 $700 $1,416 $1,380BETTLES TEL CO INC 613002 AK 208 $447 $156 $306 $290 $1,542 $447BIG BEND TEL CO INC 442039 TX 5,602 $3,648 $1,643 $1,920 $2,006 $2,006 $3,648BIJOU TEL COOP ASSOC 462181 CO 1,151 $1,289 $441 $1,064 $847 $1,055 $1,289BIXBY TEL CO 431969 OK 6,908 $1,145 $447 $451 $698 $698 $1,145BLACK EARTH TEL CO 330849 WI 1,168 $707 $293 $466 $414 $692 $707
47
48
Federal Communications Commission DA 12-646
Study Area Name SAC State LoopsCurrent
CPL
Current Capex CPL
90% Capex CPL
Estimate
Current Opex CPL
90% Opex CPL
Estimate
CPL used to
Determine Support
BLACKFOOT TEL - BTC 482235 MT 6,765 $989 $485 $826 $504 $631 $989BLACKFOOT TEL - CFT 483308 MT 8,084 $806 $417 $841 $389 $609 $806BLANCA TEL CO 462182 CO 986 $2,675 $1,043 $1,320 $1,632 $1,304 $2,347BLOOMER TEL CO 330850 WI 2,950 $840 $522 $553 $318 $593 $840BLOOMINGDALE HOME 320742 IN 498 $1,433 $206 $902 $1,227 $1,337 $1,433BLOOMINGDALE TEL CO 310679 MI 1,524 $720 $215 $377 $505 $687 $720BLOSSOM TEL CO 442038 TX 984 $1,304 $671 $581 $633 $1,143 $1,214BLOUNTSVILLE TEL CO 250282 AL 3,104 $626 $192 $245 $434 $546 $626BLUE EARTH VALLEY 361358 MN 5,604 $600 $196 $431 $404 $525 $600BLUE RIDGE TEL CO 220346 GA 10,315 $772 $364 $480 $408 $478 $772BLUE VALLEY TELE-COM 411746 KS 2,662 $3,417 $1,999 $1,512 $1,419 $1,203 $2,714BLUFFTON TEL. CO. 240512 SC 21,067 $884 $373 $663 $511 $466 $839BORDER TO BORDER 442073 TX 96 $15,868 $7,813 $5,207 $8,055 $6,972 $12,179BPS Tel. Co. 420463 MO 2,919 $671 $244 $787 $427 $1,063 $671BRANTLEY TEL CO 220347 GA 4,793 $1,306 $672 $940 $634 $914 $1,306BRAZORIA TEL CO 442040 TX 4,600 $1,243 $627 $627 $616 $916 $1,243BRAZOS TEL COOP INC 442041 TX 4,599 $708 $192 $731 $515 $1,160 $708BRETTON WOODS TEL CO 120038 NH 643 $558 $148 $319 $410 $872 $558BRIDGEWATER TEL CO 361362 MN 5,834 $814 $393 $393 $420 $421 $814BRISTOL BAY TEL COOP 613003 AK 1,543 $1,269 $348 $636 $921 $2,047 $1,269BRUCE TEL CO - MS 280447 MS 2,321 $859 $323 $391 $536 $791 $859BRUCE TEL CO, INC 330855 WI 1,420 $464 $216 $328 $248 $614 $464BUGGS ISLAND COOP 190219 VA 3,989 $518 $244 $428 $274 $633 $518BULLOCH COUNTY RURAL 220348 GA 8,941 $748 $490 $625 $258 $657 $748BUSH-TEL INC. 613004 AK 956 $1,052 $295 $387 $756 $1,429 $1,052BUTLER TEL CO 250284 AL 6,549 $552 $214 $329 $338 $601 $552CALAVERAS TEL CO 542301 CA 3,929 $1,360 $609 $731 $751 $1,020 $1,360CALHOUN CITY TEL CO 280448 MS 2,839 $407 $59 $240 $348 $678 $407CAL-ORE TELEPHONE CO 542311 CA 2,139 $1,021 $379 $785 $642 $1,112 $1,021CAMBRIDGE TEL CO 472215 ID 1,788 $1,277 $752 $1,184 $525 $1,164 $1,277CAMBRIDGE TEL CO -NE 371526 NE 1,148 $1,611 $630 $1,820 $981 $1,397 $1,611
48

49
Federal Communications Commission DA 12-646
Study Area Name SAC State LoopsCurrent
CPL
Current Capex CPL
90% Capex CPL
Estimate
Current Opex CPL
90% Opex CPL
Estimate
CPL used to
Determine Support
CAMDEN TEL & TEL CO 220351 GA 17,840 $480 $232 $354 $248 $454 $480CAMERON TEL CO - LA 270425 LA 5,440 $1,457 $481 $574 $976 $976 $1,457CAMERON TEL CO TEXAS 440425 TX 608 $1,196 $353 $705 $844 $1,840 $1,196CAMPTI-PLEASANT HILL 270426 LA 2,058 $1,012 $367 $537 $645 $1,065 $1,012CANADIAN VALLEY TEL 431974 OK 1,120 $1,359 $489 $579 $870 $1,390 $1,359CANBY TEL ASSN 532362 OR 9,571 $514 $217 $431 $297 $534 $514CAP ROCK TEL COOP 442046 TX 4,396 $786 $309 $1,121 $477 $1,317 $786CARNEGIE TEL CO INC 431976 OK 1,268 $1,075 $323 $663 $752 $1,311 $1,075CARR TEL CO 310683 MI 1,342 $630 $228 $547 $402 $821 $630CASCADE UTIL INC 532371 OR 7,753 $614 $261 $656 $353 $717 $614CASS TEL CO 340984 IL 2,061 $744 $120 $559 $624 $931 $744CENTRAL ARKANSAS TEL 401697 AR 2,602 $931 $394 $456 $538 $738 $931CENTRAL MONTANA 483310 MT 7,317 $1,289 $729 $944 $560 $603 $1,289CENTRAL OKLAHOMA TEL 431977 OK 2,372 $1,616 $879 $1,097 $736 $1,385 $1,616CENTRAL STATE TEL CO 330859 WI 8,371 $586 $244 $271 $342 $342 $586CENTRAL TEXAS CO-OP 442052 TX 6,562 $1,471 $991 $695 $480 $1,063 $1,175CENTRAL UTAH TEL INC 502277 UT 1,615 $846 $383 $809 $463 $981 $846CHAMPLAIN TEL CO 150077 NY 4,227 $563 $130 $266 $433 $438 $563CHARITON VALLEY TEL 421864 MO 6,415 $1,999 $855 $1,326 $1,144 $928 $1,783CHATHAM TEL CO - MI 310685 MI 2,363 $604 $249 $422 $355 $668 $604CHAZY & WESTPORT 150079 NY 2,959 $504 $207 $239 $297 $507 $504CHEQUAMEGON COM COOP 330860 WI 8,914 $1,044 $625 $755 $419 $570 $1,044CHEROKEE TEL CO 431979 OK 3,829 $760 $355 $965 $405 $1,222 $760CHEYENNE RIVER SIOUX 391647 SD 3,053 $1,097 $590 $1,348 $507 $1,332 $1,097CHIBARDUN TEL COOP 330861 WI 4,660 $1,277 $867 $709 $410 $588 $1,119CHICKAMAUGA TEL CORP 220354 GA 5,106 $640 $288 $391 $352 $624 $640CHICKASAW TEL CO 431980 OK 6,753 $1,518 $342 $610 $1,176 $962 $1,305CHRISTENSEN COMM CO 361425 MN 1,300 $501 $97 $323 $404 $683 $501CHUGWATER TEL CO 512289 WY 166 $1,254 $223 $803 $1,030 $1,929 $1,254CHURCHILL-CC COMM. 552349 NV 10,295 $873 $437 $1,099 $436 $789 $873CIMARRON TEL CO 431982 OK 6,538 $1,078 $438 $639 $640 $953 $1,078
49

50
Federal Communications Commission DA 12-646
Study Area Name SAC State LoopsCurrent
CPL
Current Capex CPL
90% Capex CPL
Estimate
Current Opex CPL
90% Opex CPL
Estimate
CPL used to
Determine Support
CITIZENS HAMMOND NY 150081 NY 1,133 $1,093 $428 $428 $665 $870 $1,093CITIZENS MUTUAL TEL 351129 IA 3,382 $959 $594 $950 $365 $851 $959CITIZENS TEL CO 230473 NC 17,455 $703 $335 $392 $368 $378 $703CITIZENS TEL CO - GA 220355 GA 3,574 $586 $162 $377 $424 $818 $586CITIZENS TEL CO - MO 421865 MO 3,492 $840 $291 $844 $549 $861 $840CITIZENS TEL COOP-WI 330863 WI 1,988 $1,383 $810 $943 $573 $755 $1,383CLARA CITY TEL EXCH 361370 MN 1,349 $622 $186 $380 $435 $683 $622CLARENCE TEL CO 351130 IA 641 $1,559 $1,121 $1,641 $438 $1,356 $1,559CLARKS TELECOM CO. 371531 NE 716 $2,064 $1,304 $3,644 $760 $1,929 $2,064CLAY DBA ENDEAVOR 320753 IN 10,136 $940 $519 $915 $421 $596 $940CLEAR CREEK MUTUAL 532363 OR 2,930 $730 $244 $469 $487 $769 $730CLEAR LAKE INDEPEND 351132 IA 4,883 $897 $458 $417 $439 $538 $856CLEVELAND COUNTY TEL 401698 AR 2,702 $602 $225 $353 $378 $768 $602COCHRANE COOP TEL CO 330866 WI 1,019 $2,018 $1,277 $2,011 $741 $1,327 $2,018COLEMAN COUNTY CO-OP 442057 TX 1,896 $1,730 $911 $1,421 $818 $1,784 $1,730COLO TEL CO 351134 IA 594 $1,878 $1,311 $1,420 $567 $1,340 $1,878COLORADO VALLEY TEL 442059 TX 6,286 $946 $483 $550 $464 $839 $946COLTON TEL CO 532364 OR 1,013 $1,367 $497 $953 $870 $1,245 $1,367COLUMBUS TELEPHONE 411756 KS 1,793 $1,156 $545 $729 $611 $1,105 $1,156COMM 1 NETWORK 351262 IA 535 $1,642 $1,079 $1,653 $563 $1,587 $1,642COMM CORP OF INDIANA 320776 IN 9,644 $548 $261 $276 $287 $357 $548COMM CORP OF MI 310672 MI 3,424 $498 $201 $294 $296 $528 $498COMMUNITY TEL CO 442061 TX 1,470 $1,063 $276 $863 $788 $1,533 $1,063COMSOUTH TELECOMM 220369 GA 4,075 $638 $212 $389 $426 $725 $638CONCORD TEL EXCHANGE 290559 TN 14,991 $819 $451 $279 $368 $347 $626CONNEAUT TEL CO 300606 OH 5,066 $745 $434 $478 $311 $647 $745CONSOLIDATED TEL CO 371532 NE 2,576 $1,484 $502 $983 $983 $1,074 $1,484CONSOLIDATED TELCOM 381607 ND 7,103 $1,312 $756 $1,041 $556 $788 $1,312CONSOLIDATED TELECOM 371562 NE 940 $1,244 $344 $1,463 $900 $1,367 $1,244CONTINENTAL OF OHIO 300607 OH 2,092 $385 $110 $273 $275 $634 $385COOP TEL EXCHANGE 351303 IA 613 $1,442 $910 $1,864 $533 $1,546 $1,442
50

51
Federal Communications Commission DA 12-646
Study Area Name SAC State LoopsCurrent
CPL
Current Capex CPL
90% Capex CPL
Estimate
Current Opex CPL
90% Opex CPL
Estimate
CPL used to
Determine Support
COPPER VALLEY TEL 613006 AK 4,538 $2,876 $1,627 $1,627 $1,250 $1,250 $2,876CORDOVA TEL COOP 613007 AK 1,711 $1,821 $822 $896 $999 $2,345 $1,821COUNCIL GROVE TEL CO 411758 KS 1,835 $2,352 $1,561 $2,079 $791 $1,175 $2,352COZAD TEL CO 371534 NE 1,893 $1,268 $405 $432 $863 $808 $1,213CRAW-KAN TEL COOP 411818 KS 11,291 $913 $530 $647 $382 $726 $913CROCKETT TEL CO 290561 TN 3,191 $517 $213 $362 $304 $619 $517CROSS TEL CO 431985 OK 7,613 $1,088 $425 $425 $664 $765 $1,088CROWN POINT TEL CORP 150085 NY 827 $1,080 $344 $370 $736 $800 $1,080CUMBY TEL COOP INC 442065 TX 736 $903 $305 $701 $598 $1,301 $903CUNNINGHAM TEL CO 411761 KS 1,085 $2,279 $1,251 $1,371 $1,029 $1,652 $2,279CURTIS TEL CO 371536 NE 593 $1,418 $464 $533 $953 $989 $1,418CUSTER TEL COOP 472218 ID 2,312 $1,676 $1,004 $902 $672 $903 $1,574DAKOTA CENTRAL COOP 381610 ND 4,187 $1,231 $712 $1,112 $520 $840 $1,231DALTON TEL CO, INC 371537 NE 903 $1,626 $780 $719 $847 $1,258 $1,566DARIEN TEL CO 220358 GA 4,878 $1,191 $411 $584 $780 $836 $1,191DAVIESS-MARTIN/RTC 320759 IN 3,063 $1,300 $711 $1,074 $589 $941 $1,300DECATUR TEL CO INC 401699 AR 884 $557 $203 $371 $355 $1,015 $557DEERFIELD FARMERS 310691 MI 1,907 $1,137 $309 $452 $829 $754 $1,063DEKALB TEL COOP 290562 TN 16,778 $526 $233 $535 $293 $517 $526DELHI TEL CO 150088 NY 3,693 $712 $330 $386 $382 $454 $712DELL TEL CO-OP - NM 492066 NM 497 $2,658 $1,196 $1,464 $1,462 $3,116 $2,658DELL TEL. CO-OP - TX 442066 TX 794 $6,594 $3,729 $2,162 $2,864 $2,837 $4,999DELTA COUNTY TEL CO 462184 CO 8,467 $499 $214 $392 $284 $491 $499DELTA TEL CO 280452 MS 3,180 $816 $186 $496 $630 $881 $816DEPOSIT TEL CO 150089 NY 6,775 $397 $122 $200 $275 $356 $397DICKEY RURAL COOP 381611 ND 7,707 $1,136 $632 $1,215 $503 $762 $1,136DILLER TEL CO 371540 NE 795 $1,932 $663 $1,065 $1,269 $1,466 $1,932DIRECT COMM-ROCKLAND 472232 ID 1,068 $1,319 $602 $827 $717 $1,181 $1,319DIRECTCOMM-CEDAR VAL 500758 UT 2,591 $1,108 $632 $1,613 $476 $1,008 $1,108DOBSON TEL CO 431988 OK 3,464 $2,095 $915 $703 $1,180 $1,156 $1,859DRENTHE TEL CO 310692 MI 590 $857 $454 $669 $402 $1,018 $857
51

52
Federal Communications Commission DA 12-646
Study Area Name SAC State LoopsCurrent
CPL
Current Capex CPL
90% Capex CPL
Estimate
Current Opex CPL
90% Opex CPL
Estimate
CPL used to
Determine Support
DUBOIS TEL EXCHANGE 512291 WY 2,325 $1,182 $559 $819 $623 $942 $1,182DUCOR TELEPHONE CO 542313 CA 1,157 $1,691 $680 $1,866 $1,010 $2,278 $1,691DUNKIRK & FREDONIA 150091 NY 5,875 $247 $66 $149 $182 $399 $247DUO COUNTY TEL COOP 260401 KY 11,327 $899 $438 $506 $461 $469 $899EAGLE TEL SYSTEMS 532369 OR 425 $1,600 $484 $869 $1,116 $1,474 $1,600EAGLE VALLEY TEL CO 361383 MN 607 $351 $76 $280 $276 $755 $351EAST ASCENSION TEL 270429 LA 29,375 $1,334 $498 $330 $836 $438 $768EAST BUCHANAN COOP 351156 IA 1,455 $750 $394 $539 $356 $876 $750EAST OTTER TAIL TEL 361385 MN 15,320 $634 $325 $315 $309 $298 $614EASTERN NEBRASKA TEL 371542 NE 2,757 $442 $137 $381 $305 $727 $442EASTERN SLOPE RURAL 462186 CO 4,211 $861 $386 $650 $475 $771 $861EASTEX TEL COOP INC 442068 TX 24,639 $977 $403 $628 $574 $588 $977EASTON TEL CO 361384 MN 882 $1,125 $238 $585 $888 $900 $1,125ECKLES TEL CO 361386 MN 3,854 $671 $226 $472 $445 $496 $671EDWARDS TEL CO 150092 NY 1,801 $757 $285 $189 $472 $485 $662EGYPTIAN COOP ASSN 341003 IL 2,848 $876 $356 $544 $521 $909 $876ELECTRA TELEPHONE CO 442069 TX 1,250 $946 $195 $496 $751 $1,254 $946ELIZABETH TEL CO 270430 LA 2,685 $1,774 $676 $963 $1,098 $1,096 $1,772ELKHART TEL CO INC 411764 KS 1,361 $2,705 $664 $794 $2,041 $1,168 $1,832ELLIJAY TEL CO 220360 GA 12,428 $768 $320 $420 $448 $470 $768ELLINGTON TEL CO 421874 MO 1,853 $1,249 $464 $1,114 $785 $1,232 $1,249ELSIE COMM., INC. 371518 NE 178 $1,660 $608 $699 $1,051 $1,805 $1,660EMILY COOP TEL CO 361387 MN 1,223 $1,830 $1,250 $1,507 $580 $888 $1,830EMPIRE TEL CORP 150093 NY 5,646 $439 $214 $321 $225 $510 $439EMRY dba EMRY TELCOM 502278 UT 4,271 $486 $160 $693 $326 $942 $486ENMR TEL COOP INC-NM 492262 NM 10,086 $1,205 $659 $856 $546 $899 $1,205ENMR TEL COOP-TX 442262 TX 681 $647 $330 $920 $317 $1,632 $647ETEX TEL COOP INC 442070 TX 12,099 $1,222 $461 $496 $760 $585 $1,046ETS TEL. CO., INC. 442091 TX 12,974 $666 $386 $528 $279 $466 $666FARMERS MUTUAL COOP 351169 IA 442 $1,272 $808 $1,888 $463 $1,680 $1,272FARMERS MUTUAL TEL 300612 OH 422 $461 $80 $709 $381 $1,295 $461
52

53
Federal Communications Commission DA 12-646
Study Area Name SAC State LoopsCurrent
CPL
Current Capex CPL
90% Capex CPL
Estimate
Current Opex CPL
90% Opex CPL
Estimate
CPL used to
Determine Support
FARMERS MUTUAL TEL 351172 IA 1,900 $1,195 $658 $912 $538 $923 $1,195FARMERS MUTUAL TEL 351174 IA 950 $1,170 $505 $953 $665 $1,131 $1,170FARMERS MUTUAL TEL 361389 MN 998 $1,570 $955 $2,210 $615 $1,419 $1,570FARMERS MUTUAL TEL 472221 ID 2,912 $530 $230 $509 $300 $714 $530FARMERS TEL CO - CO 462188 CO 488 $1,533 $668 $981 $866 $1,436 $1,533FARMERS TEL COOP 240520 SC 44,895 $870 $457 $513 $414 $419 $870FARMERS TELECOM COOP 250290 AL 14,819 $752 $337 $661 $415 $481 $752FELTON TEL CO. INC. 361391 MN 598 $732 $362 $543 $370 $1,027 $732FIDELITY TEL CO 421882 MO 13,552 $495 $187 $434 $308 $510 $495FILER MUTUAL TEL -ID 472220 ID 1,687 $1,119 $567 $1,107 $553 $1,063 $1,119FILER MUTUAL TEL -NV 552220 NV 537 $283 $152 $1,080 $131 $1,601 $283FISHERS ISLAND TEL 150095 NY 983 $505 $104 $568 $401 $1,116 $505FIVE AREA TEL CO-OP 442071 TX 5,317 $962 $482 $936 $480 $1,047 $962FLAT ROCK TEL CO-OP 341012 IL 520 $425 $119 $494 $306 $1,313 $425FOOTHILLS RURAL COOP 260406 KY 14,396 $1,016 $574 $741 $442 $486 $1,016FORESTHILL-SEBASTIAN 542318 CA 2,801 $1,479 $626 $1,302 $854 $1,069 $1,479FORT MILL TEL CO 240521 SC 21,384 $600 $260 $343 $340 $340 $600FORT MOJAVE TEL, INC 452200 AZ 1,014 $1,370 $555 $1,093 $815 $2,185 $1,370FRANKLIN TEL CO - MS 280454 MS 7,090 $1,301 $572 $581 $729 $759 $1,301FULTON TEL CO 280455 MS 6,972 $618 $332 $457 $285 $558 $618GANADO TELEPHONE CO 442076 TX 2,536 $1,496 $646 $1,228 $850 $1,400 $1,496GARDEN VALLEY TEL CO 361395 MN 14,135 $682 $364 $842 $318 $529 $682GEORGETOWN TEL CO 280456 MS 276 $3,081 $1,199 $621 $1,882 $1,882 $2,503GERMANTOWN TEL CO 150097 NY 2,416 $497 $75 $255 $422 $524 $497GERVAIS TELEPHONE CO 532373 OR 777 $1,037 $400 $1,003 $637 $1,686 $1,037GILA RIVER TELECOM. 452179 AZ 3,641 $2,683 $1,343 $2,062 $1,339 $1,818 $2,683GLENWOOD TEL CO 220365 GA 733 $1,342 $454 $656 $888 $1,434 $1,342GLENWOOD TEL MEMBER 371553 NE 2,147 $1,829 $894 $845 $935 $945 $1,780GOLDEN BELT TEL ASSN 411777 KS 5,059 $1,626 $871 $889 $755 $978 $1,626GOLDEN WEST TELECOM 391659 SD 13,393 $1,205 $645 $963 $561 $710 $1,205GOLDEN WEST-KADOKA 391667 SD 454 $565 $177 $553 $388 $1,313 $565
53

54
Federal Communications Commission DA 12-646
Study Area Name SAC State LoopsCurrent
CPL
Current Capex CPL
90% Capex CPL
Estimate
Current Opex CPL
90% Opex CPL
Estimate
CPL used to
Determine Support
GOLDEN WEST-VIVIAN 391686 SD 15,972 $828 $517 $699 $311 $551 $828GOODMAN TEL CO 421886 MO 1,494 $1,396 $704 $1,090 $692 $1,346 $1,396GORHAM TEL CO 411778 KS 273 $2,876 $1,533 $3,123 $1,343 $3,170 $2,876GRAFTON TEL CO 341020 IL 834 $552 $164 $649 $387 $1,110 $552GRANADA TEL CO 361399 MN 172 $478 $158 $312 $320 $1,243 $478GRANBY TEL & TEL -MA 110036 MA 2,277 $207 $89 $238 $118 $624 $207GRANBY TEL CO - MO 421887 MO 2,151 $1,321 $577 $1,097 $744 $1,010 $1,321GRAND RIVER MUT-IA 351888 IA 6,262 $429 $194 $498 $234 $686 $429GRAND RIVER MUT-MO 421888 MO 12,335 $873 $532 $873 $342 $674 $873GRAND TEL CO INC 431994 OK 3,251 $1,287 $612 $631 $674 $1,138 $1,287GRANITE STATE TEL 120039 NH 8,006 $515 $227 $230 $288 $412 $515GREAT PLAINS COMMUN 371577 NE 25,547 $591 $213 $673 $378 $527 $591GREEN HILLS TEL CORP 421890 MO 3,231 $1,425 $783 $1,309 $642 $1,200 $1,425GRIDLEY TEL CO 341023 IL 1,214 $1,073 $330 $542 $743 $888 $1,073GRISWOLD CO-OP TEL 351195 IA 1,712 $690 $348 $578 $343 $887 $690GTA TELECOM, LLC 663800 GU 48,142 $578 $338 $466 $240 $857 $578GUADALUPE VALLEY TEL 442083 TX 37,936 $773 $469 $576 $305 $486 $773H & B COMMUNICATIONS 411781 KS 816 $1,034 $429 $959 $605 $1,565 $1,034HAMPDEN TEL CO 100010 ME 2,401 $526 $165 $202 $361 $428 $526HANCOCK TEL CO 150099 NY 1,550 $526 $89 $268 $438 $641 $526HANCOCK TELECOM 320775 IN 6,098 $1,385 $796 $708 $589 $604 $1,297HAPPY VALLEY TEL CO 542321 CA 3,011 $469 $67 $309 $402 $787 $469HARDY TELECOM 200259 WV 3,646 $665 $330 $439 $335 $545 $665HARGRAY TEL CO 240523 SC 35,827 $490 $146 $216 $344 $344 $490HARRISONVILLE TEL CO 341026 IL 16,334 $707 $304 $545 $403 $557 $707HART TEL CO 220368 GA 7,045 $590 $104 $231 $486 $477 $581HARTINGTON TEL CO 371556 NE 1,329 $1,337 $514 $1,146 $823 $1,015 $1,337HARTLAND & ST ALBANS 100011 ME 3,183 $421 $89 $144 $332 $347 $421HARTMAN TEL EXCH INC 371557 NE 463 $2,799 $808 $1,536 $1,991 $2,021 $2,799HAT ISLAND TEL CO 522417 WA 75 $599 $204 $1,075 $394 $3,076 $599HAVILAND TEL CO 411780 KS 3,179 $1,736 $812 $874 $924 $1,076 $1,736
54

55
Federal Communications Commission DA 12-646
Study Area Name SAC State LoopsCurrent
CPL
Current Capex CPL
90% Capex CPL
Estimate
Current Opex CPL
90% Opex CPL
Estimate
CPL used to
Determine Support
HAXTUN TEL CO 462190 CO 1,347 $865 $228 $563 $636 $939 $865HAYNEVILLE TEL CO 250299 AL 2,129 $665 $252 $720 $414 $1,221 $665HEART OF IOWA COMM. 351297 IA 2,080 $1,913 $1,198 $1,198 $715 $1,105 $1,913HEARTLND-HICKORYTECH 351096 IA 8,828 $255 $48 $258 $207 $462 $255HELIX TEL CO. 532376 OR 253 $1,627 $551 $1,196 $1,076 $2,580 $1,627HEMINGFORD COOP TEL 371558 NE 742 $2,159 $985 $984 $1,173 $1,282 $2,158HENDERSON CO-OP TEL 371559 NE 876 $1,154 $526 $978 $629 $1,152 $1,154HERSHEY COOP TEL CO 371561 NE 631 $1,123 $524 $696 $600 $1,127 $1,123HIAWATHA TEL CO 310713 MI 5,310 $659 $230 $578 $428 $660 $659HILL COUNTRY CO-OP 442086 TX 15,174 $1,050 $590 $976 $460 $934 $1,050HILLSBORO TEL CO 330892 WI 1,468 $680 $324 $574 $356 $745 $680HINTON TEL CO 431995 OK 2,898 $1,012 $406 $937 $606 $1,199 $1,012HOLWAY TEL CO 421929 MO 456 $580 $188 $650 $392 $1,384 $580HOME TEL CO 240527 SC 20,094 $558 $238 $387 $320 $499 $558HOME TEL CO 411782 KS 1,712 $2,016 $663 $1,209 $1,352 $1,345 $2,008HOME TEL CO-ST JACOB 341032 IL 1,017 $2,577 $763 $776 $1,814 $1,122 $1,885HOME TELEPHONE CO 532377 OR 692 $451 $101 $476 $350 $1,366 $451HOOD CANAL TEL CO 522419 WA 1,004 $1,045 $208 $288 $837 $966 $1,045HOPI TELECOMM, INC. 450815 AZ 1,731 $985 $438 $1,463 $547 $1,702 $985HOPPER TELECOMM. CO. 250300 AL 2,980 $1,351 $463 $316 $889 $610 $927HORNITOS TEL CO 542322 CA 592 $654 $184 $665 $470 $1,772 $654HORRY TEL COOP 240528 SC 71,027 $506 $315 $366 $192 $323 $506HOT SPRINGS TEL CO 482241 MT 874 $935 $140 $693 $796 $1,252 $935HUMBOLDT TEL CO 553304 NV 966 $2,181 $927 $2,108 $1,254 $2,054 $2,181HUMPHREY'S COUNTY 290566 TN 1,534 $449 $162 $307 $287 $654 $449IAMO TEL CO - IA 351206 IA 334 $514 $195 $619 $319 $1,611 $514IAMO TEL CO - MO 421206 MO 853 $614 $222 $727 $392 $1,332 $614INDIANHEAD TEL CO 330936 WI 1,997 $522 $249 $280 $273 $553 $522INDUSTRY TEL CO 442093 TX 2,275 $1,178 $547 $798 $631 $1,086 $1,178INLAND TEL CO -WA 522423 WA 2,484 $898 $260 $764 $638 $982 $898INLAND TEL-ID 472423 ID 346 $1,394 $422 $1,034 $972 $2,343 $1,394
55
56
Federal Communications Commission DA 12-646
Study Area Name SAC State LoopsCurrent
CPL
Current Capex CPL
90% Capex CPL
Estimate
Current Opex CPL
90% Opex CPL
Estimate
CPL used to
Determine Support
INTERBEL TEL COOP 482242 MT 2,331 $1,614 $853 $861 $761 $750 $1,603INTER-COMMUNITY TEL 381616 ND 2,231 $751 $199 $449 $552 $806 $751INTERIOR TEL CO INC 613011 AK 4,404 $1,087 $256 $299 $830 $1,264 $1,087INTERSTATE 35 TEL CO 351209 IA 1,075 $1,277 $675 $1,013 $602 $1,041 $1,277INTERSTATE TELECOMM. 391654 SD 12,549 $826 $507 $791 $319 $539 $826ISLAND TEL CO 100007 ME 635 $458 $119 $329 $339 $1,130 $458ISLAND TEL CO 310677 MI 1,153 $470 $193 $353 $278 $742 $470ITS TELECOMM. SYS. 210331 FL 2,980 $1,414 $332 $691 $1,083 $1,180 $1,414J. B. N. TEL CO INC 411785 KS 2,141 $891 $294 $505 $597 $1,012 $891JEFFERSON TEL CO -SD 391666 SD 414 $1,494 $181 $491 $1,313 $1,147 $1,328JOHNSON TEL CO 361410 MN 1,771 $1,041 $483 $582 $558 $793 $1,041K & M TEL CO, INC 371565 NE 599 $910 $238 $687 $672 $1,274 $910KALAMA TEL CO 522426 WA 2,667 $841 $352 $340 $489 $655 $829KALONA COOP TEL CO 351214 IA 1,824 $891 $478 $985 $413 $860 $891KANOKLA TEL ASSN-KS 411788 KS 1,837 $2,830 $1,494 $1,123 $1,336 $1,405 $2,458KANOKLA TEL ASSN-OK 431788 OK 1,003 $2,671 $1,554 $1,919 $1,117 $1,916 $2,671KAPLAN TEL CO 270432 LA 3,768 $956 $324 $711 $632 $1,096 $956KASSON & MANTORVILLE 361412 MN 4,027 $652 $343 $723 $309 $680 $652KEARSARGE TEL CO 120045 NH 7,481 $476 $170 $177 $306 $366 $476KENNEBEC TEL CO 391668 SD 734 $2,258 $872 $1,064 $1,386 $1,385 $2,258KERMAN TEL-SEBASTIAN 542324 CA 6,002 $1,061 $364 $645 $697 $718 $1,061KETCHIKAN PUBLIC UT 613013 AK 6,790 $958 $289 $423 $668 $1,698 $958KEYSTONE-ARTHUR TEL 371567 NE 445 $1,773 $286 $476 $1,488 $1,357 $1,643KINGDOM TELEPHONE CO 421901 MO 4,873 $824 $454 $824 $371 $756 $824KNOLOGY - VALLEY 220371 GA 8,984 $262 $51 $402 $210 $778 $262KNOLOGY COMM TEL 391652 SD 4,393 $589 $223 $387 $366 $638 $589KNOLOGY TOTAL COMM 250295 AL 3,591 $622 $89 $412 $533 $863 $622LA HARPE TEL CO 341043 IL 828 $1,681 $658 $824 $1,023 $1,240 $1,681LA HARPE TEL CO INC 411791 KS 318 $3,912 $1,416 $2,426 $2,496 $2,356 $3,771LA JICARITA RURAL 492263 NM 1,979 $1,360 $543 $672 $817 $938 $1,360LA VALLE TEL COOP 330899 WI 1,599 $987 $444 $687 $543 $827 $987
56

57
Federal Communications Commission DA 12-646
Study Area Name SAC State LoopsCurrent
CPL
Current Capex CPL
90% Capex CPL
Estimate
Current Opex CPL
90% Opex CPL
Estimate
CPL used to
Determine Support
LA WARD TEL EXCHANGE 442103 TX 884 $1,607 $600 $1,370 $1,007 $1,983 $1,607LACKAWAXEN TELECOM 170177 PA 2,730 $346 $59 $209 $286 $523 $346LAFOURCHE TEL CO 270433 LA 10,312 $481 $50 $326 $431 $849 $481LAKE LIVINGSTON TEL 442104 TX 816 $2,412 $695 $823 $1,716 $1,529 $2,224LAKESIDE TEL. CO. 280457 MS 274 $1,759 $60 $442 $1,698 $1,698 $1,759LANCASTER TEL CO 240531 SC 18,327 $449 $100 $279 $349 $409 $449LAVACA TEL CO-AR 401704 AR 1,194 $1,793 $751 $974 $1,042 $1,060 $1,793LAVACA TEL CO-OK 431704 OK 1,076 $1,567 $659 $919 $908 $1,433 $1,567LEACO RURAL TEL COOP 492264 NM 1,711 $2,204 $1,096 $1,266 $1,109 $1,604 $2,204LEAF RIVER TEL CO 341045 IL 401 $1,929 $736 $807 $1,192 $1,333 $1,929LEMONWEIR VALLEY TEL 330900 WI 2,840 $1,105 $626 $635 $479 $651 $1,105LENNON TEL CO 310708 MI 925 $1,059 $174 $390 $885 $957 $1,059LE-RU TELEPHONE CO 421908 MO 1,409 $1,558 $651 $656 $907 $1,221 $1,558LESLIE COUNTY TEL CO 260411 KY 8,282 $567 $177 $253 $390 $434 $567LEWIS RIVER TEL CO 522427 WA 5,232 $483 $164 $434 $319 $690 $483LIGONIER TEL CO 320783 IN 1,540 $1,345 $539 $1,267 $806 $1,125 $1,345LINCOLN CTY TEL SYS 552351 NV 2,360 $603 $293 $1,441 $310 $1,483 $603LINCOLN TEL CO INC 482244 MT 983 $637 $259 $574 $379 $885 $637LINCOLNVILLE NETWRKS 100003 ME 11,486 $272 $80 $216 $192 $384 $272LIPAN TEL CO 442105 TX 1,435 $1,815 $753 $953 $1,062 $1,764 $1,815LISMORE COOP TEL CO 361419 MN 312 $1,293 $808 $3,583 $485 $2,096 $1,293LITTLE MIAMI COMM. 300613 OH 1,961 $597 $247 $312 $350 $632 $597LOGAN TEL. COOP. INC 260413 KY 5,783 $1,071 $657 $688 $414 $624 $1,071LONSDALE TEL CO 361422 MN 1,567 $1,571 $992 $906 $579 $777 $1,484LOST NATION-ELWOOD 351229 IA 555 $1,728 $775 $1,556 $953 $1,496 $1,728LUCK TEL CO 330902 WI 1,931 $793 $357 $485 $436 $599 $793LUDLOW TEL CO 140058 VT 4,100 $367 $130 $130 $238 $338 $367MADISON COUNTY TEL 401709 AR 3,418 $879 $286 $473 $593 $765 $879MADISON TEL CO 341049 IL 1,455 $1,589 $302 $621 $1,287 $1,057 $1,359MADISON TEL., LLC 411801 KS 546 $1,644 $532 $576 $1,112 $1,603 $1,644MAHANOY & MAHANTANGO 170183 PA 3,252 $459 $166 $178 $293 $525 $459
57

58
Federal Communications Commission DA 12-646
Study Area Name SAC State LoopsCurrent
CPL
Current Capex CPL
90% Capex CPL
Estimate
Current Opex CPL
90% Opex CPL
Estimate
CPL used to
Determine Support
MARGARETVILLE TEL CO 150104 NY 3,378 $332 $109 $185 $223 $445 $332MARK TWAIN RURAL TEL 421914 MO 3,709 $1,087 $549 $581 $538 $832 $1,087MARQUETTE-ADAMS COOP 330908 WI 3,268 $1,480 $957 $830 $523 $697 $1,353MASHELL TELECOM INC 522431 WA 3,329 $766 $125 $310 $642 $661 $766MATANUSKA TEL ASSOC 613015 AK 46,802 $821 $430 $327 $391 $506 $719MCCLELLANVILLE TEL 240533 SC 1,478 $996 $337 $443 $659 $1,034 $996MCCLURE TEL CO 300598 OH 582 $1,974 $879 $1,368 $1,095 $1,417 $1,974MCDONALD COUNTY TEL 421912 MO 3,529 $1,239 $511 $756 $728 $1,046 $1,239MCDONOUGH TEL COOP 341047 IL 3,592 $1,324 $608 $907 $716 $906 $1,324MCLOUD TEL CO 432006 OK 7,038 $1,088 $422 $422 $666 $666 $1,088MCNABB TEL CO 341048 IL 386 $476 $127 $491 $349 $1,289 $476MCTA, INC. 123321 NH 9,131 $377 $145 $151 $232 $311 $377MEDICINE PARK TEL CO 432008 OK 676 $2,078 $646 $1,479 $1,432 $2,295 $2,078MERCHANTS & FARMERS 320788 IN 415 $711 $176 $429 $535 $1,047 $711MERRIMACK COUNTY TEL 120047 NH 6,499 $404 $150 $193 $254 $392 $404MESCALERO APACHE 491231 NM 1,151 $2,908 $1,002 $1,081 $1,906 $1,809 $2,811MID CENTURY TEL COOP 341054 IL 3,977 $741 $458 $1,049 $283 $959 $741MID MAINE TELECOM 103315 ME 4,185 $498 $156 $121 $342 $339 $460MID STATE TEL CO 361433 MN 5,827 $503 $229 $363 $274 $460 $503MID-AMERICA TEL INC 432010 OK 1,261 $849 $418 $609 $431 $1,542 $849MIDDLEBURGH TEL CO 150105 NY 5,848 $284 $69 $207 $215 $422 $284MID-MISSOURI TEL CO 421917 MO 3,437 $1,296 $498 $583 $798 $897 $1,296MID-PLAINS RURAL TEL 442112 TX 2,796 $1,071 $474 $1,324 $597 $1,396 $1,071MID-RIVERS TEL COOP 482246 MT 10,042 $774 $359 $527 $415 $559 $774MIDSTATE COMM., INC. 391670 SD 4,315 $959 $664 $1,314 $295 $952 $959MIDSTATE TEL CO 381617 ND 1,870 $1,018 $419 $876 $599 $826 $1,018MIDVALE TEL EXCH INC 472226 ID 957 $1,609 $538 $1,116 $1,071 $1,472 $1,609MIDVALE-AZ 452226 AZ 1,226 $3,118 $1,377 $2,170 $1,740 $1,976 $3,118MIDWAY TEL CO 310711 MI 703 $998 $344 $813 $654 $1,194 $998MIDWAY TEL CO 330909 WI 7,154 $444 $152 $220 $292 $291 $443MILLER TEL CO - MO 421920 MO 819 $991 $271 $524 $720 $1,131 $991
58

59
Federal Communications Commission DA 12-646
Study Area Name SAC State LoopsCurrent
CPL
Current Capex CPL
90% Capex CPL
Estimate
Current Opex CPL
90% Opex CPL
Estimate
CPL used to
Determine Support
MILLINGTON TEL CO 290571 TN 20,820 $435 $144 $353 $292 $430 $435MILLRY TEL CO 250304 AL 6,056 $724 $256 $513 $468 $712 $724MILLTOWN MUTUAL TEL 330910 WI 2,137 $931 $390 $481 $541 $567 $931MINBURN TELECOMM. 351158 IA 701 $777 $367 $886 $410 $1,091 $777MOAPA VALLEY TEL CO. 552353 NV 3,302 $374 $141 $1,011 $233 $1,528 $374MOKAN DIAL INC-KS 411807 KS 3,227 $949 $300 $431 $649 $762 $949MOKAN DIAL INC-MO 421807 MO 688 $961 $366 $577 $595 $1,109 $961MOLALLA TEL CO. 532383 OR 4,822 $1,192 $586 $858 $605 $792 $1,192MON-CRE TEL COOP 250305 AL 2,445 $1,143 $508 $465 $635 $760 $1,100MONITOR COOP TEL 532384 OR 555 $1,478 $593 $910 $885 $1,566 $1,478MONON TEL CO 320790 IN 947 $1,556 $544 $729 $1,011 $1,101 $1,556MONROE TELEPHONE CO. 532385 OR 884 $1,215 $473 $793 $741 $1,375 $1,215MONTROSE MUTUAL TEL 341058 IL 1,423 $479 $113 $581 $365 $1,054 $479MOULTRIE INDEPENDENT 341060 IL 569 $710 $149 $650 $561 $1,314 $710MOUND BAYOU TEL & CO 280462 MS 690 $1,083 $559 $1,475 $524 $1,910 $1,083MOUNDRIDGE TEL CO 411808 KS 2,417 $1,078 $484 $484 $595 $824 $1,078MOUNDVILLE TEL CO 250307 AL 1,346 $888 $394 $695 $494 $1,082 $888MOUNT HOREB TEL CO 330916 WI 3,728 $602 $324 $247 $278 $541 $525MOUNTAIN RURAL COOP 260414 KY 14,989 $557 $279 $769 $278 $493 $557MT VERNON TEL CO 330917 WI 10,537 $682 $264 $368 $418 $357 $621MUENSTER DBA NORTEX 442116 TX 3,826 $1,264 $594 $731 $671 $976 $1,264MUKLUK TEL CO INC 613016 AK 1,361 $1,044 $217 $507 $828 $1,273 $1,044MUTUAL TEL CO 351252 IA 4,218 $651 $396 $632 $255 $548 $651MUTUAL TEL CO 411809 KS 437 $3,778 $1,657 $2,302 $2,120 $2,199 $3,778NATIONAL OF ALABAMA 250286 AL 1,665 $813 $343 $583 $470 $1,048 $813NE MISSOURI RURAL 421931 MO 6,843 $1,102 $648 $789 $454 $733 $1,102NEBRASKA CENTRAL TEL 371574 NE 6,319 $667 $299 $583 $368 $732 $667NEHALEM TELECOMM. 532387 OR 2,814 $520 $168 $620 $352 $869 $520NELSON TEL COOP 330918 WI 3,691 $1,170 $718 $684 $451 $644 $1,135NELSON-BALL GROUND 220375 GA 6,690 $553 $233 $390 $319 $545 $553NEMONT TEL COOP - ND 382247 ND 212 $3,294 $2,733 $4,638 $561 $3,370 $3,294
59

60
Federal Communications Commission DA 12-646
Study Area Name SAC State LoopsCurrent
CPL
Current Capex CPL
90% Capex CPL
Estimate
Current Opex CPL
90% Opex CPL
Estimate
CPL used to
Determine Support
NEMONT TEL COOP-MT 482247 MT 11,196 $1,037 $452 $888 $585 $613 $1,037NEW CASTLE TEL. CO. 193029 VA 2,110 $500 $203 $357 $297 $684 $500NEW FLORENCE TEL CO 421927 MO 387 $1,035 $160 $580 $875 $1,453 $1,035NEW HOPE TEL COOP 250308 AL 4,960 $1,187 $777 $1,056 $411 $806 $1,187NEW LONDON TEL CO 421928 MO 747 $563 $198 $435 $365 $978 $563NEW PARIS TEL INC 320797 IN 1,727 $645 $117 $358 $529 $713 $645NEW ULM TELECOM, INC 361442 MN 10,727 $390 $159 $218 $232 $336 $390NEWPORT TEL CO 150107 NY 2,987 $478 $165 $220 $313 $464 $478NIAGARA TEL CO 330920 WI 3,601 $704 $298 $399 $406 $547 $704NICHOLVILLE TEL CO 150108 NY 1,590 $648 $131 $221 $517 $525 $648NORTH ARKANSAS TEL 401713 AR 6,111 $917 $382 $390 $535 $693 $917NORTH CENTRAL COOP 290573 TN 19,553 $794 $456 $636 $337 $449 $794NORTH DAKOTA TEL CO 381447 ND 13,946 $640 $306 $529 $334 $521 $640NORTH PENN TEL CO 170192 PA 4,900 $685 $263 $285 $421 $487 $685NORTH STATE TEL CO. 532388 OR 473 $4,196 $2,279 $2,718 $1,917 $2,211 $4,196NORTHEAST FLORIDA 210335 FL 7,424 $748 $187 $359 $561 $633 $748NORTHEAST LOUISIANA 270435 LA 643 $1,525 $523 $1,102 $1,002 $1,793 $1,525NORTHEAST NEBRASKA 371576 NE 6,126 $772 $509 $1,311 $263 $853 $772NORTHERN TEL COOP 482248 MT 1,536 $1,173 $565 $781 $608 $1,052 $1,173NORTHFIELD TEL CO 140061 VT 2,436 $334 $99 $111 $235 $398 $334NORTHWESTERN INDIANA 320800 IN 9,877 $456 $142 $302 $314 $463 $456NOXAPATER TEL CO 280461 MS 776 $1,398 $130 $431 $1,268 $1,124 $1,254NUCLA-NATURITA TEL 462193 CO 1,589 $773 $352 $942 $421 $1,297 $773NUNN TEL CO 462194 CO 559 $3,140 $1,718 $1,561 $1,422 $1,360 $2,920NUSHAGAK ELEC & TEL 613018 AK 2,114 $1,157 $365 $426 $792 $1,416 $1,157OGDEN TEL CO 310714 MI 320 $977 $325 $695 $652 $1,445 $977OKLAHOMA COMM SYSTEM 431984 OK 13,988 $605 $244 $265 $361 $513 $605OKLAHOMA TEL & TEL 432013 OK 1,498 $1,362 $293 $632 $1,069 $1,415 $1,362OKLAHOMA WESTERN TEL 432014 OK 2,577 $681 $329 $492 $352 $1,182 $681ONEIDA COUNTY RURAL 150111 NY 2,315 $434 $177 $241 $257 $487 $434ONEIDA TEL EXCHANGE 341066 IL 472 $469 $154 $680 $315 $1,287 $469
60

61
Federal Communications Commission DA 12-646
Study Area Name SAC State LoopsCurrent
CPL
Current Capex CPL
90% Capex CPL
Estimate
Current Opex CPL
90% Opex CPL
Estimate
CPL used to
Determine Support
ONTARIO TEL CO, INC. 150112 NY 2,628 $790 $292 $475 $499 $688 $790ONTONAGON COUNTY TEL 310717 MI 3,325 $561 $187 $569 $374 $660 $561ORCHARD FARM TEL CO 421934 MO 641 $478 $177 $428 $301 $1,015 $478OREGON FARMERS MUT 421935 MO 1,019 $662 $207 $483 $455 $893 $662OREGON TEL CORP 532389 OR 1,558 $2,434 $1,418 $2,423 $1,016 $1,499 $2,434OREGON-IDAHO UTIL. 532390 OR 638 $2,986 $1,265 $1,646 $1,721 $2,083 $2,986ORISKANY FALLS TEL 150114 NY 434 $580 $211 $492 $370 $898 $580OSAKIS TEL CO 361448 MN 1,486 $812 $504 $498 $308 $554 $806OTZ TEL COOPERATIVE 613019 AK 2,950 $1,090 $409 $1,231 $681 $1,775 $1,090OXFORD WEST TEL CO 100002 ME 5,734 $467 $95 $190 $372 $372 $467Ozark Tel. Co. 421866 MO 2,127 $1,103 $560 $718 $544 $1,090 $1,103PANHANDLE TEL COOP 432016 OK 13,384 $1,118 $670 $722 $448 $710 $1,118PARTNER COMM. COOP. 351187 IA 891 $1,621 $858 $1,373 $763 $1,388 $1,621PATTERSONVILLE TEL 150116 NY 905 $506 $117 $163 $388 $704 $506PAUL BUNYAN RURAL 361451 MN 11,704 $1,005 $619 $810 $386 $525 $1,005PBT TELECOM, INC. 240539 SC 12,672 $1,052 $475 $443 $577 $509 $951PEETZ COOP TEL CO 462196 CO 227 $1,547 $614 $907 $933 $1,910 $1,547PEMBROKE TEL CO 220376 GA 3,334 $1,079 $433 $577 $646 $850 $1,079PENASCO VALLEY TEL 492270 NM 2,916 $2,075 $1,201 $1,388 $874 $1,586 $2,075PEND OREILLE TEL. 522418 WA 1,827 $675 $114 $367 $561 $815 $675PENINSULA TEL CO -MI 310720 MI 1,112 $350 $75 $245 $275 $747 $350PEOPLES RURAL COOP 260415 KY 7,700 $1,011 $445 $821 $566 $555 $1,000PEOPLES TEL CO 250314 AL 12,413 $728 $279 $372 $449 $472 $728PEOPLES TEL CO 290576 TN 4,425 $658 $336 $407 $322 $594 $658PEOPLES TEL CO - MN 361453 MN 1,689 $768 $372 $272 $396 $546 $668PEOPLES TEL CO. - OR 532391 OR 1,092 $1,292 $562 $1,499 $730 $1,403 $1,292PEOPLES TEL COOP -TX 442130 TX 11,701 $914 $399 $816 $515 $711 $914PEOPLES TELECOM LLC 411814 KS 1,303 $1,841 $758 $630 $1,083 $1,031 $1,661PERKINSVILLE TEL CO 140062 VT 801 $275 $67 $100 $208 $536 $275PERRY-SPENCER RURAL 320807 IN 5,307 $888 $412 $885 $476 $826 $888PHILLIPS COUNTY TEL 462197 CO 1,674 $1,451 $780 $1,337 $671 $973 $1,451
61

62
Federal Communications Commission DA 12-646
Study Area Name SAC State LoopsCurrent
CPL
Current Capex CPL
90% Capex CPL
Estimate
Current Opex CPL
90% Opex CPL
Estimate
CPL used to
Determine Support
PIEDMONT RURAL COOP 240538 SC 10,708 $842 $483 $365 $359 $527 $724PIGEON TEL CO 310721 MI 2,595 $1,018 $308 $457 $710 $699 $1,007PINE BELT TEL CO 250315 AL 2,324 $1,294 $687 $981 $607 $1,079 $1,294PINE ISLAND TEL CO 361454 MN 2,771 $590 $341 $325 $249 $492 $574PINE TEL SYSTEM INC. 532392 OR 902 $4,411 $3,043 $2,203 $1,368 $1,519 $3,570PINE TELEPHONE CO 432017 OK 4,998 $618 $283 $700 $335 $1,035 $618PINELAND TEL COOP 220377 GA 10,502 $893 $656 $910 $237 $790 $893PINNACLES TEL CO 542346 CA 253 $2,790 $904 $1,093 $1,886 $3,251 $2,790PIONEER TEL ASSN INC 411817 KS 12,304 $808 $371 $444 $436 $651 $808PIONEER TEL CO 522437 WA 725 $1,365 $831 $1,045 $534 $1,377 $1,365PIONEER TEL COOP 532393 OR 12,644 $786 $392 $674 $394 $784 $786PIONEER TEL COOP INC 432018 OK 46,095 $531 $212 $695 $318 $550 $531PLAINS COOP TEL ASSN 462199 CO 1,222 $2,002 $816 $987 $1,186 $1,320 $2,002PLAINVIEW TEL CO 371582 NE 979 $1,740 $796 $1,574 $944 $1,203 $1,740PLANT TEL. CO. 220379 GA 7,268 $735 $288 $528 $447 $747 $735PLANTERS RURAL COOP 220378 GA 7,450 $1,283 $850 $945 $434 $793 $1,283POKA-LAMBRO TEL COOP 442131 TX 2,401 $974 $343 $903 $631 $1,479 $974POLAR COMM MUT AID 381630 ND 7,758 $559 $280 $604 $279 $548 $559PORT BYRON TEL CO 150118 NY 2,371 $537 $190 $250 $348 $550 $537POTLATCH TEL CO INC 472230 ID 1,762 $478 $192 $399 $285 $823 $478POTTAWATOMIE TEL CO 432020 OK 2,188 $1,516 $557 $595 $959 $1,200 $1,516PRAIRIE GROVE TEL CO 401718 AR 8,086 $959 $430 $394 $529 $529 $922PRICE COUNTY TEL CO 330937 WI 4,143 $456 $260 $283 $196 $416 $456PROJECT MUTUAL TEL 472231 ID 5,871 $627 $295 $727 $332 $753 $627PROJECT TEL CO 482250 MT 4,633 $1,036 $385 $884 $650 $782 $1,036PUBLIC SERVICE TEL 220381 GA 9,097 $1,169 $481 $466 $688 $631 $1,097PULASKI-WHITE RURAL 320813 IN 1,318 $985 $335 $669 $650 $955 $985QUINCY TEL CO-FL DIV 210338 FL 10,326 $513 $202 $365 $311 $605 $513QUINCY TEL CO-GA DIV 220338 GA 575 $646 $283 $530 $362 $1,326 $646RADCLIFFE TEL CO 351277 IA 452 $950 $507 $1,269 $443 $1,437 $950RAGLAND TEL CO 250316 AL 1,014 $1,759 $576 $715 $1,183 $1,217 $1,759
62
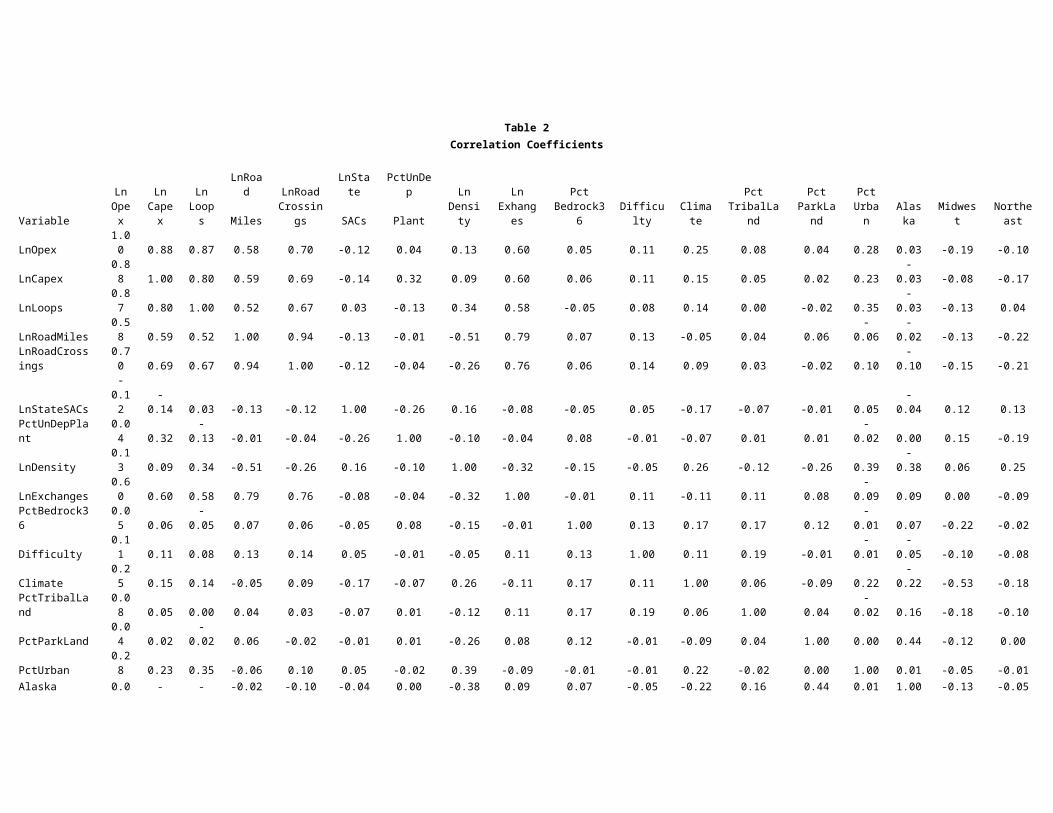
63
Federal Communications Commission DA 12-646
Study Area Name SAC State LoopsCurrent
CPL
Current Capex CPL
90% Capex CPL
Estimate
Current Opex CPL
90% Opex CPL
Estimate
CPL used to
Determine Support
RAINBOW TELECOM 411820 KS 1,692 $3,021 $2,019 $2,323 $1,002 $1,581 $3,021RANGE TEL COOP - WY 512251 WY 14,862 $908 $497 $516 $411 $514 $908RANGE TEL COOP-MT 482251 MT 4,319 $738 $275 $494 $462 $696 $738RED RIVER RURAL TEL 381631 ND 3,509 $1,056 $631 $1,230 $425 $862 $1,056RESERVATION TEL COOP 381632 ND 6,629 $1,060 $519 $1,129 $541 $789 $1,060RESERVE TEL CO 270438 LA 3,779 $562 $148 $298 $414 $909 $562RICE BELT TEL CO 401721 AR 704 $1,615 $282 $1,523 $1,333 $1,886 $1,615RICHLAND-GRANT COOP 330942 WI 2,342 $1,081 $620 $869 $461 $850 $1,081RICHMOND TEL CO 110037 MA 939 $444 $80 $309 $365 $813 $444RICO TEL CO 462201 CO 152 $569 $268 $1,741 $301 $2,346 $569RINGGOLD TEL CO 220382 GA 10,089 $623 $289 $329 $334 $445 $623RIO VIRGIN TEL CO 552356 NV 9,519 $436 $244 $852 $192 $794 $436RIVIERA TEL CO INC 442134 TX 1,184 $1,988 $433 $1,492 $1,555 $2,325 $1,988ROANOKE & BOTETOURT 190249 VA 8,498 $665 $282 $599 $383 $569 $665ROANOKE TEL CO 250317 AL 4,033 $609 $239 $590 $370 $748 $609ROBERTS COUNTY COOP 391674 SD 1,827 $1,049 $581 $748 $469 $1,123 $1,049ROCHESTER TEL CO 320815 IN 5,625 $785 $406 $500 $378 $569 $785ROCK COUNTY TEL CO 371586 NE 835 $460 $34 $369 $426 $947 $460ROCK HILL TEL CO 240542 SC 39,493 $321 $105 $232 $216 $279 $321ROGGEN TEL COOP CO 462202 CO 228 $1,985 $913 $1,223 $1,072 $1,709 $1,985ROOME TELECOMM INC 532375 OR 527 $721 $214 $560 $506 $1,557 $721ROOSEVELT CNTY RURAL 492272 NM 1,522 $1,427 $609 $1,370 $818 $1,625 $1,427RURAL TEL CO - ID 472233 ID 684 $2,530 $1,088 $1,849 $1,442 $2,107 $2,530RURAL TEL CO - NV 552233 NV 893 $1,267 $428 $1,110 $839 $1,511 $1,267RURAL TEL SERVICE CO 411826 KS 8,164 $2,545 $893 $712 $1,652 $835 $1,546RYE TELEPHONE CO 462203 CO 2,280 $1,799 $772 $970 $1,027 $1,179 $1,799S & A TEL CO INC 411829 KS 702 $2,252 $805 $564 $1,447 $1,307 $1,871S & T TEL COOP ASSN 411827 KS 2,455 $2,449 $1,087 $795 $1,363 $1,166 $1,961S. CENTRAL TEL - KS 411831 KS 1,528 $2,627 $1,245 $1,341 $1,382 $1,586 $2,627S. CENTRAL TEL - OK 431831 OK 297 $5,443 $1,818 $1,646 $3,625 $2,359 $4,004SACRED WIND 493403 NM 2,600 $3,182 $1,877 $2,082 $1,306 $1,507 $3,182
63

64
Federal Communications Commission DA 12-646
Study Area Name SAC State LoopsCurrent
CPL
Current Capex CPL
90% Capex CPL
Estimate
Current Opex CPL
90% Opex CPL
Estimate
CPL used to
Determine Support
SADDLEBACK COMM CO 457991 AZ 1,041 $2,554 $1,146 $2,948 $1,409 $2,877 $2,554SALINA-SPAVINAW TEL 432022 OK 6,344 $619 $209 $367 $410 $826 $619SALUDA MOUNTAIN TEL 230498 NC 1,461 $673 $297 $549 $375 $851 $673SAN CARLOS APACHE 452169 AZ 2,529 $1,503 $820 $1,983 $683 $1,708 $1,503SANDWICH ISLES COMM. 623021 HI 2,334 $9,278 $5,742 $2,263 $3,536 $3,536 $5,798SANTA ROSA TEL COOP 442141 TX 1,872 $1,277 $497 $1,194 $780 $1,674 $1,277SANTEL COMM. COOP. 391676 SD 4,447 $903 $551 $688 $352 $739 $903SCIO MUTUAL TEL ASSN 532397 OR 1,598 $1,781 $1,117 $1,002 $663 $1,173 $1,665SCOTT COUNTY COOP 190248 VA 5,952 $874 $393 $965 $481 $703 $874SCOTT COUNTY TEL CO 403031 AR 130 $1,684 $429 $739 $1,256 $2,560 $1,684SE INDIANA RURAL 320819 IN 4,157 $1,203 $597 $790 $606 $702 $1,203SE NEBRASKA COMM INC 371591 NE 3,113 $1,029 $349 $544 $680 $825 $1,029SE TEL OF WISCONSIN 330952 WI 5,724 $505 $208 $235 $297 $421 $505SENECA TEL CO 421945 MO 2,796 $993 $499 $893 $494 $927 $993SHAWNEE TEL. CO. 341025 IL 3,626 $1,804 $725 $1,100 $1,079 $1,045 $1,771SHELL ROCK COMM 351295 IA 836 $685 $444 $1,302 $241 $1,128 $685SHIAWASSEE TEL CO 310726 MI 4,440 $543 $227 $326 $317 $548 $543SHIDLER TEL CO 432023 OK 728 $2,886 $1,575 $2,061 $1,311 $3,172 $2,886SIERRA TELEPHONE CO 542338 CA 20,806 $842 $370 $400 $472 $487 $842SILVER STAR TEL- ID 472295 ID 3,992 $1,749 $671 $513 $1,078 $609 $1,122SILVER STAR TEL-WY 512295 WY 2,664 $1,239 $458 $604 $780 $701 $1,159SIREN TEL CO, INC 330949 WI 2,249 $922 $476 $751 $446 $648 $922SKYLINE TELECOM CO. 520581 WA 30 $12,290 $6,303 $6,592 $5,986 $8,034 $12,290SKYLINE TELECOM, INC 521402 WA 140 $1,250 $359 $919 $891 $2,257 $1,250SLEDGE TEL CO 280466 MS 369 $2,192 $1,288 $1,893 $905 $2,079 $2,192SLEEPY EYE TEL CO 361483 MN 4,878 $421 $216 $282 $204 $465 $421SMART CITY TEL LLC 210330 FL 9,751 $616 $186 $295 $430 $533 $616SMITHVILLE COMM. 320818 IN 24,750 $1,377 $703 $835 $674 $486 $1,189SOMERSET TEL CO 100024 ME 9,475 $446 $115 $164 $331 $318 $433SOUTH ARKANSAS TEL 401702 AR 3,041 $1,024 $373 $517 $652 $893 $1,024SOUTH CENTRAL RURAL 260418 KY 25,845 $802 $482 $442 $320 $404 $763
64

65
Federal Communications Commission DA 12-646
Study Area Name SAC State LoopsCurrent
CPL
Current Capex CPL
90% Capex CPL
Estimate
Current Opex CPL
90% Opex CPL
Estimate
CPL used to
Determine Support
SOUTH CENTRAL UTAH 502286 UT 11,732 $614 $321 $618 $293 $658 $614SOUTH PARK TEL. CO. 462195 CO 167 $6,116 $2,087 $1,197 $4,029 $2,160 $3,357SOUTH PLAINS TEL 442143 TX 4,104 $760 $321 $871 $439 $1,053 $760SOUTH SLOPE COOP TEL 351298 IA 9,956 $671 $394 $666 $277 $476 $671SOUTHEAST MS TEL CO 283301 MS 2,997 $846 $386 $364 $460 $790 $824SOUTHERN KANSAS TEL 411833 KS 3,986 $1,794 $746 $696 $1,048 $1,048 $1,744SOUTHERN MONTANA TEL 482254 MT 947 $2,902 $1,692 $2,045 $1,210 $1,486 $2,902SOUTHWEST TEXAS TEL 442135 TX 4,213 $1,439 $874 $1,225 $566 $1,536 $1,439SOUTHWESTERN TEL CO 452174 AZ 3,302 $675 $307 $714 $368 $1,220 $675SPRING GROVE COMM. 361485 MN 1,236 $1,152 $821 $2,007 $331 $1,108 $1,152SPRING VALLEY TEL CO 330953 WI 1,065 $1,441 $816 $826 $626 $856 $1,441SPRINGPORT TEL CO 310728 MI 1,380 $651 $220 $493 $431 $714 $651SPRUCE KNOB SENECA 200257 WV 1,166 $1,537 $931 $1,268 $607 $970 $1,537ST JOHN TEL CO 522442 WA 587 $3,411 $2,277 $2,362 $1,134 $1,717 $3,411ST STEPHEN TEL CO 240544 SC 3,857 $582 $229 $328 $353 $690 $582STANTON TELECOM INC. 371592 NE 1,089 $2,073 $844 $1,353 $1,229 $1,186 $2,030STAR MEMBERSHIP CORP 230502 NC 16,205 $628 $323 $687 $305 $524 $628STAR TEL CO 270441 LA 3,210 $1,340 $110 $381 $1,229 $966 $1,076STAYTON COOP TEL CO 532399 OR 5,712 $841 $480 $849 $361 $806 $841STEELVILLE TEL EXCH 421949 MO 4,211 $1,265 $547 $748 $718 $777 $1,265STOCKBRIDGE & SHERWD 330954 WI 2,287 $607 $287 $313 $321 $525 $607STOCKHOLM-STRANDBURG 391679 SD 597 $764 $409 $557 $355 $1,193 $764STOUTLAND TEL CO 421951 MO 1,268 $725 $278 $353 $448 $762 $725STRASBURG TEL CO 462207 CO 1,534 $677 $312 $434 $366 $590 $677STRATFORD MUTUAL TEL 351305 IA 553 $1,385 $736 $1,358 $650 $1,403 $1,385SUGAR VALLEY TEL CO 170206 PA 1,035 $555 $215 $244 $341 $737 $555SUMMIT TEL & TEL -AK 613028 AK 252 $3,906 $1,324 $1,607 $2,581 $2,683 $3,906SUNMAN TELECOMM CORP 320825 IN 4,355 $894 $309 $498 $585 $591 $894SUREWEST TEL. 542334 CA 58,058 $542 $268 $249 $274 $342 $523SW ARKANSAS TEL COOP 401724 AR 5,103 $1,243 $647 $805 $596 $901 $1,243SW OKLAHOMA TEL CO 432025 OK 647 $634 $102 $634 $532 $1,975 $634
65

66
Federal Communications Commission DA 12-646
Study Area Name SAC State LoopsCurrent
CPL
Current Capex CPL
90% Capex CPL
Estimate
Current Opex CPL
90% Opex CPL
Estimate
CPL used to
Determine Support
SWISHER TEL CO 351304 IA 748 $858 $783 $1,219 $75 $1,144 $858SYCAMORE TEL CO 300658 OH 1,529 $351 $88 $337 $263 $826 $351TABLE TOP TEL CO 453334 AZ 3,993 $1,405 $767 $1,423 $638 $1,448 $1,405TATUM TEL CO 442150 TX 909 $777 $171 $510 $606 $1,159 $777TAYLOR TEL CO-OP INC 442151 TX 6,173 $886 $466 $975 $419 $1,145 $886TELLICO TEL CO 290578 TN 8,160 $466 $205 $304 $261 $495 $466TENINO TELEPHONE CO 522446 WA 3,181 $976 $383 $353 $593 $685 $946TENNESSEE TEL CO 290575 TN 47,085 $517 $253 $285 $264 $302 $517TENNEY TEL CO 330958 WI 1,031 $542 $216 $382 $327 $642 $542TERRAL TEL CO 432029 OK 215 $5,077 $1,837 $1,151 $3,240 $2,761 $3,912THE BLAIR TEL CO 371524 NE 6,597 $573 $185 $283 $388 $456 $573THE CHAMPAIGN TEL CO 300594 OH 7,103 $659 $272 $311 $387 $492 $659THE CHILLICOTHE TEL 300597 OH 22,252 $900 $390 $371 $509 $386 $757THE NOVA TEL CO 300644 OH 970 $1,225 $258 $464 $967 $819 $1,078THE PONDEROSA TEL CO 542332 CA 8,435 $1,718 $865 $1,144 $853 $1,095 $1,718THE SISKIYOU TEL CO 542339 CA 4,417 $1,993 $1,116 $1,761 $878 $1,175 $1,993THREE RIVER TELCO 371525 NE 1,193 $1,547 $798 $1,279 $749 $1,447 $1,547TOHONO O'ODHAM UTIL. 452173 AZ 3,803 $1,135 $634 $1,145 $501 $1,073 $1,135TOLEDO TELEPHONE CO 522447 WA 1,912 $1,343 $639 $669 $704 $971 $1,343TOPSHAM TEL CO 140068 VT 1,598 $1,178 $437 $587 $742 $645 $1,081TOTAH COMMUNICATIONS 412030 KS 1,019 $1,679 $654 $930 $1,024 $1,916 $1,679TOTAH COMMUNICATIONS 432030 OK 1,818 $1,089 $461 $851 $628 $1,564 $1,089TOTELCOM COMM. 442060 TX 4,126 $742 $156 $476 $587 $891 $742TOWNSHIP TEL CO 150129 NY 2,588 $709 $319 $256 $390 $496 $647TRANS-CASCADES TEL 532378 OR 214 $1,633 $334 $728 $1,299 $2,552 $1,633TRI COUNTY TEL ASSN 512296 WY 5,903 $1,677 $652 $679 $1,026 $693 $1,345TRIANGLE TEL COOP 482257 MT 10,337 $1,324 $918 $1,737 $406 $695 $1,324TRI-COUNTY COMM COOP 330960 WI 3,444 $987 $481 $566 $506 $636 $987TRI-COUNTY TEL ASSN 411839 KS 2,849 $2,022 $1,054 $846 $968 $1,049 $1,814TRI-COUNTY TEL CO-AR 401726 AR 5,863 $1,035 $359 $361 $676 $676 $1,035TRUMANSBURG TEL CO. 150131 NY 4,451 $692 $296 $312 $396 $538 $692
66

67
Federal Communications Commission DA 12-646
Study Area Name SAC State LoopsCurrent
CPL
Current Capex CPL
90% Capex CPL
Estimate
Current Opex CPL
90% Opex CPL
Estimate
CPL used to
Determine Support
TULAROSA BASIN TEL. 492265 NM 4,036 $1,508 $800 $992 $707 $1,033 $1,508TWIN LAKES TEL COOP 290579 TN 33,878 $581 $342 $600 $239 $421 $581TWIN VALLEY TEL INC 411840 KS 1,931 $1,213 $548 $824 $664 $1,289 $1,213TWIN VALLEY-ULEN TEL 361491 MN 3,114 $787 $452 $495 $335 $606 $787UBTA-UBET/STRATA 502287 UT 3,302 $1,192 $419 $524 $773 $992 $1,192UNION RIVER TEL CO 100027 ME 1,211 $1,438 $710 $710 $728 $833 $1,438UNION TEL CO 120049 NH 5,320 $332 $113 $246 $219 $456 $332UNION TEL CO 330962 WI 3,875 $777 $412 $436 $366 $554 $777UNION TELEPHONE CO 512297 WY 6,031 $501 $228 $733 $273 $759 $501UNITED FARMERS TEL 351316 IA 547 $1,249 $685 $1,970 $564 $1,553 $1,249UNITED TEL ASSN 411841 KS 4,767 $1,439 $751 $739 $688 $927 $1,427UNITED TEL MUTUAL 381636 ND 10,082 $677 $386 $556 $291 $493 $677UNITED UTILITIES INC 613023 AK 6,673 $749 $182 $500 $567 $1,015 $749UNITEL, INC. 100029 ME 4,001 $597 $186 $240 $411 $448 $597UPPER PENINSULA TEL 310732 MI 5,012 $868 $447 $706 $421 $719 $868UTC OF TN 290581 TN 12,996 $832 $548 $669 $284 $635 $832UTELCO, INC 330963 WI 12,453 $392 $157 $230 $235 $337 $392VALLEY TEL COOP - NM 492176 NM 1,150 $2,461 $1,608 $2,271 $853 $2,255 $2,461VALLEY TEL CO-OP -TX 442159 TX 5,765 $1,979 $1,037 $1,612 $942 $1,520 $1,979VALLEY TEL COOP-AZ 452176 AZ 5,983 $1,745 $1,026 $1,524 $719 $1,233 $1,745VALLEY TELECOMM. 391685 SD 3,190 $1,476 $892 $1,139 $584 $911 $1,476VALLIANT TEL CO 432032 OK 1,654 $953 $389 $654 $564 $1,318 $953VENTURE COMM. COOP 391680 SD 10,226 $958 $650 $765 $308 $613 $958VERMONT TEL. CO-VT 147332 VT 17,646 $569 $187 $187 $382 $311 $499VERNON TEL CO 150133 NY 1,758 $386 $165 $323 $221 $573 $386VERNON TEL COOP 330966 WI 6,409 $612 $259 $510 $353 $546 $612VOLCANO TEL CO 542343 CA 10,145 $777 $368 $458 $409 $608 $777W. RIVER TELECOM. 381637 ND 14,324 $652 $369 $766 $283 $580 $652W. WISCONSIN TELCOM 330971 WI 6,053 $1,290 $773 $775 $516 $546 $1,290WABASH TEL COOP, INC 341088 IL 4,243 $787 $394 $701 $393 $887 $787WAITSFIELD/FAYSTON 140069 VT 18,643 $538 $200 $211 $338 $284 $484
67

68
Federal Communications Commission DA 12-646
Study Area Name SAC State LoopsCurrent
CPL
Current Capex CPL
90% Capex CPL
Estimate
Current Opex CPL
90% Opex CPL
Estimate
CPL used to
Determine Support
WALDRON TEL CO 310734 MI 481 $1,051 $296 $465 $755 $1,043 $1,051WALNUT HILL TEL CO 401729 AR 4,351 $1,202 $274 $359 $928 $800 $1,074WALNUT TEL CO, INC 351326 IA 682 $812 $387 $1,108 $425 $1,188 $812WAMEGO TEL CO INC 411845 KS 4,672 $634 $251 $513 $383 $752 $634WARREN TEL CO 100031 ME 1,226 $574 $156 $189 $418 $550 $574WARWICK VALLEY-NJ 160135 NJ 5,688 $412 $183 $351 $230 $785 $412WARWICK VALLEY-NY 150135 NY 9,336 $390 $192 $213 $198 $447 $390WASHINGTON CTY RURAL 320834 IN 2,752 $751 $446 $634 $305 $672 $751WAUNETA TEL CO 371597 NE 606 $1,998 $879 $584 $1,119 $1,109 $1,693WAVERLY HALL, LLC 220392 GA 1,310 $905 $297 $711 $609 $1,121 $905WEBB-DICKENS TEL 351327 IA 337 $2,488 $911 $2,012 $1,577 $1,828 $2,488WEBSTER-CALHOUN COOP 351328 IA 4,117 $1,441 $1,064 $1,745 $377 $991 $1,441WELLMAN COOP TEL 351329 IA 1,211 $760 $427 $723 $333 $922 $760WEST CAROLINA RURAL 240550 SC 10,740 $1,804 $1,349 $1,190 $456 $802 $1,646WEST CENTRAL TEL 361501 MN 3,502 $1,575 $1,013 $1,190 $562 $715 $1,575WEST KENTUCKY RURAL 260421 KY 13,946 $926 $481 $528 $445 $515 $926WEST LIBERTY TEL CO 351332 IA 3,257 $830 $489 $894 $341 $815 $830WEST PENOBSCOT TEL 100034 ME 2,055 $363 $61 $140 $301 $408 $363WEST RIVER COOP 391689 SD 3,420 $1,856 $1,269 $1,188 $587 $1,007 $1,775WEST SIDE TEL-WV 200277 WV 2,340 $593 $177 $335 $416 $652 $593WEST TENNESSEE TEL 290583 TN 3,255 $557 $248 $407 $309 $674 $557WEST TEXAS RURAL TEL 442166 TX 1,895 $1,338 $203 $656 $1,135 $1,307 $1,338WESTERN NEW MEXICO 492268 NM 6,217 $1,236 $478 $478 $757 $794 $1,236WESTERN WAHKIAKUM 522451 WA 1,100 $2,022 $873 $749 $1,148 $1,378 $1,897WES-TEX TEL CO-OP 442168 TX 2,255 $1,187 $429 $1,515 $758 $1,816 $1,187WESTGATE dba WEAVTEL 520580 WA 20 $16,069 $6,404 $5,807 $9,666 $7,834 $13,641WHEAT STATE TEL, INC 411847 KS 1,916 $1,096 $386 $501 $710 $1,033 $1,096WHIDBEY TEL CO. 522452 WA 11,919 $560 $279 $301 $281 $420 $560WIGGINS TEL ASSOC 462209 CO 1,511 $2,266 $1,468 $2,378 $799 $1,290 $2,266WILKES MEMBERSHIP 230510 NC 9,723 $986 $636 $636 $349 $480 $986WILKES TEL & ELC CO 220394 GA 9,354 $513 $211 $498 $303 $647 $513
68

69
Federal Communications Commission DA 12-646
Study Area Name SAC State LoopsCurrent
CPL
Current Capex CPL
90% Capex CPL
Estimate
Current Opex CPL
90% Opex CPL
Estimate
CPL used to
Determine Support
WILLISTON TEL CO 240551 SC 3,979 $587 $220 $260 $367 $590 $587WILSON TEL CO INC 411849 KS 1,803 $2,031 $730 $1,002 $1,300 $1,361 $2,031WILTON TEL CO - NH 120050 NH 2,589 $417 $134 $218 $283 $473 $417WINN TEL CO 310737 MI 648 $723 $102 $268 $621 $856 $723WINNEBAGO COOP-IA 351337 IA 5,567 $930 $614 $861 $316 $745 $930WINNEBAGO COOP-MN 361337 MN 680 $779 $615 $591 $164 $1,107 $755WINTERHAVEN TEL. CO. 542323 CA 994 $801 $206 $511 $595 $1,779 $801WITTENBERG TEL CO 330973 WI 2,083 $672 $276 $389 $396 $606 $672WOLVERINE TEL CO 310738 MI 7,398 $383 $136 $237 $247 $375 $383WOOD COUNTY TEL CO 330974 WI 17,391 $571 $255 $255 $316 $343 $571WOODHULL TEL CO 341091 IL 577 $681 $296 $693 $384 $1,179 $681WOODSTOCK TEL CO 361510 MN 1,152 $1,555 $657 $1,204 $898 $1,208 $1,555WYANDOTTE TEL CO 432034 OK 625 $712 $355 $403 $358 $1,475 $712XIT RURAL TEL CO-OP 442170 TX 1,280 $2,355 $1,450 $1,450 $905 $1,753 $2,355YELCOT TEL CO INC 401733 AR 2,698 $904 $402 $587 $502 $882 $904YUKON TEL CO INC 613025 AK 481 $648 $120 $399 $528 $1,655 $648ZENDA TEL COMPANY 411852 KS 162 $1,383 $50 $682 $1,333 $2,473 $1,383
69
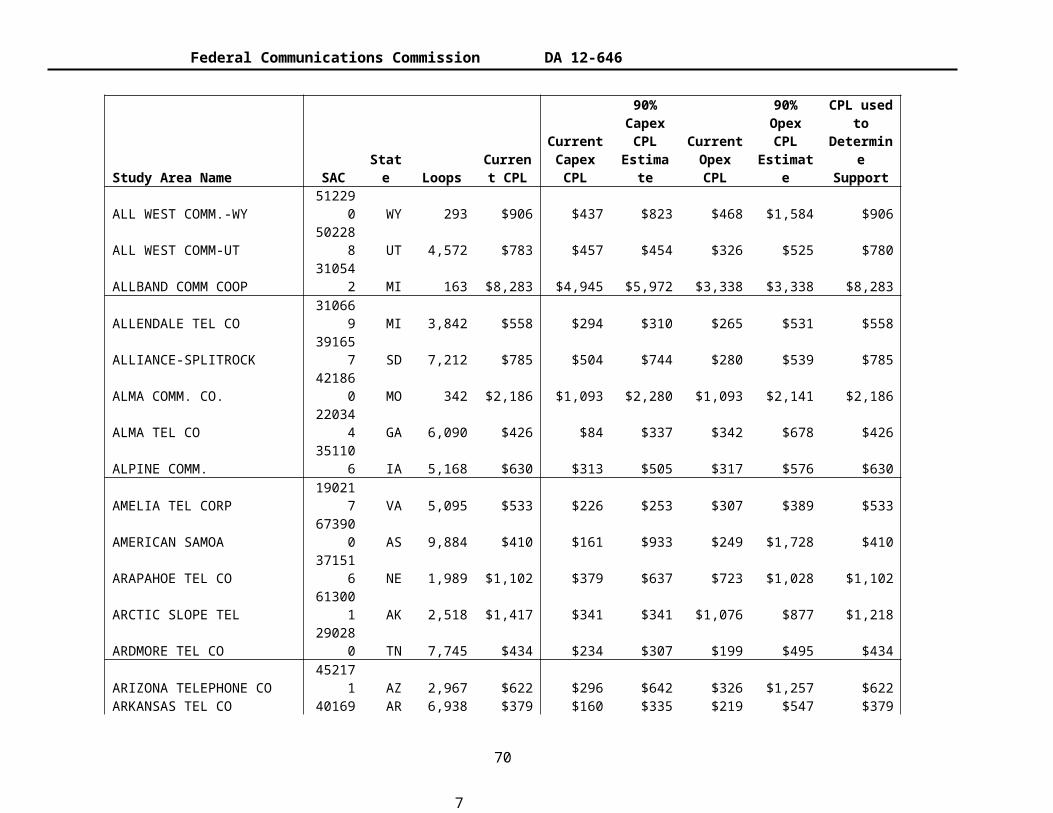
Federal Communications Commission DA 12-646
APPENDIX C
Specification for Study Area Boundary Submission
I. General
Carriers may submit study area maps if they believe that the boundaries used by the FCC are not representative. Maps must be submitted in ESRI compatible shapefile format such that each shapefile represents a single study area. The shapefile must contain one data record for each exchange that constitutes the study area. Each exchange should be represented as a closed, non-overlapping polygon with the associated data fields described below. Submitted boundaries must be accompanied by metadata or a plain text “readme” file containing the information listed below.
Since shapefiles typically consist of 3 to 9 individual files, the shapefile for the study area should be submitted as a single, zipped file containing all the component files. The shapefile and encapsulating zip file names must contain the company name and the 6-digit study area code. Shapefile and readme file templates are available at http://www.fcc.gov/encyclopedia/rate-return-resources.
Materials must be sent by hand or messenger delivery. All filings must be addressed to the Commission’s Secretary, Office of the Secretary, Federal Communications Commission. Attention: Lorenzo Miller, 202-418-0846 or John Emmett, 202-418-0386.
Hand-delivered or messenger-delivered paper filings for the Commission’s Secretary must be delivered to FCC Headquarters at 445 12th St., SW, Room TW-A325, Washington, DC 20554. The filing hours are 8:00 a.m. to 7:00 p.m. All hand deliveries must be held together with rubber bands or fasteners. Any envelopes and boxes must be disposed of before entering the building.
Note that submitted boundaries are public data and may be used in published FCC documents and webpages.
II. Shapefile
A shapefile template is available at http://www.fcc.gov/encyclopedia/rate-return-resources. Submitted shapefiles must:
A. contain one closed, non-overlapping polygon for each exchange in the study areaB. have associated with each exchange polygon the following identifying data fields:
1. OCN – NECA-assigned operating company number as in the LERG2. Company Name3. Exchange Name4. CLLI Code5. Study Area Code6. FRN (please use the FRN used for the 477 filing in the state)
C. have an assigned projection w/accompanying .prj fileD. use unprojected (geographic) WGS84 geographic coordinate systemE. have a minimum horizontal accuracy of +/- 40 feet or less, conforming to 1:24K national
mapping standardsF. be submitted as a WinZip archive with a name containing the company name and study area code
(e.g., CompanyName_123456.zip).
70

Federal Communications Commission DA 12-646
III. Readme File
A readme file template is available at http://www.fcc.gov/encyclopedia/rate-return-resources. The readme file accompanying submitted boundaries must be submitted as a plain text file with a name containing the relevant study area code (e.g., ReadMe_123456.txt). The readme file must contain the following information:
A. Contact person nameB. Contact person addressC. Contact person phone numberD. Contact person email addressE. Date created/revisedF. Methodology – process steps to create the dataG. Certification statement including the name and contact information for the certifying company
officer.
71