economics.rice.edu · Web viewThere has been an evident trans-Atlantic divide on climate policies...
74
WORKING DRAFT. NOT FOR ATTRIBUTION. Revealing Climate Change Opinions through Investment Behavior: Evidence from Fukushima Zhen Lei * Anastasia Shcherbakova † October 2014 Abstract: In this study we present a novel research approach to obtaining behavior-based evidence of regional climate change attitudes, using the 2011 Fukushima nuclear plant incident as a natural experiment. Our approach allows us to produce the first non-survey-based empirical evidence of a trans- Atlantic divide in public opinion on the environment and climate change, and an estimate of the relative monetary value that investors assign to fossil-based and renewable energy. This value is based on the perceived potential of these fuel types to substitute for nuclear generation in the aftermath of the Fukushima crisis. We carry out an event study to examine differences in abnormal returns of coal and renewable energy companies on European and American stock exchanges. We find that investors trading on U.S. markets exhibit a significantly more favorable perception of the profitability of coal stocks (generating a $4.2 billion increase in cumulative coal * Leone Family Department of Energy and Mineral Engineering, Penn State Univeristy † Naveen Jindal School of Management, University of Texas at Dallas 1
-
Upload
trinhduong -
Category
Documents
-
view
213 -
download
0
Transcript of economics.rice.edu · Web viewThere has been an evident trans-Atlantic divide on climate policies...

WORKING DRAFT. NOT FOR ATTRIBUTION.
Revealing Climate Change Opinions through Investment Behavior: Evidence from
Fukushima
Zhen Lei*
Anastasia Shcherbakova†
October 2014
Abstract: In this study we present a novel research approach to obtaining behavior-based evidence of regional climate change attitudes, using the 2011 Fukushima nuclear plant incident as a natural experiment. Our approach allows us to produce the first non-survey-based empirical evidence of a trans-Atlantic divide in public opinion on the environment and climate change, and an estimate of the relative monetary value that investors assign to fossil-based and renewable energy. This value is based on the perceived potential of these fuel types to substitute for nuclear generation in the aftermath of the Fukushima crisis. We carry out an event study to examine differences in abnormal returns of coal and renewable energy companies on European and American stock exchanges. We find that investors trading on U.S. markets exhibit a significantly more favorable perception of the profitability of coal stocks (generating a $4.2 billion increase in cumulative coal market capitalization), while investors trading on European exchanges display a more favorable perception about the profitability of renewable energy stocks (adding over $3 billion to cumulative renewable market capitalization).
Key words: Climate Change, Public Opinion, Event Study, Financial Markets, Stock Returns, Fukushima
* Leone Family Department of Energy and Mineral Engineering, Penn State Univeristy† Naveen Jindal School of Management, University of Texas at Dallas
1

1. Introduction
There has been an evident trans-Atlantic divide on climate policies in the United
States and Europe. Europe has set an ambitious emissions reduction target under the
Kyoto Protocol, implemented multiple policies and measures including cap-and-trade to
achieve that target, and played an important role in post-Kyoto international negotiations.
U.S. legislators, by contrast, failed to support the Kyoto Protocol, often questioned the
basic science of climate change, and failed in 2010 to enact a climate bill to launch a cap-
and-trade scheme to curtail carbon emissions (Carlarne, 2006; Schmidt & Haifly 2012;
Skjærseth, Bang and Schreurs, 2013).
Such a trans-Atlantic divide on climate policy has been, at least in part,
attributable to a reported difference in public opinion on climate change between the
United States and Europe. For example, surveys conducted in 2009 by the Pew Research
Center and the World Bank show that 44 percent of U.S. respondents believed at that
time that global warming was a very serious problem. A much higher percentage of
respondents in France (68 percent) and Germany (60 percent) agreed with this statement.
Only 46 percent of U.S. respondents thought climate change would harm people in their
country now or within 10 years, whereas 67 percent of respondents in France believed so
(Brechin and Bhandari, 2011).‡
Surveys and opinion polls presently constitute the primary method of obtaining
individuals’ views on climate change and other environmental concerns (Brechin and
‡ The Brechin and Bhandari (2011) study only looks at relative differences in surveyed opinions that the authors compile from multiple polls. Although the authors convey that substantial differences in responses exist, they do not carry out any statistical tests to evaluate these differences.
2
Bhandari, 2011; Lachapelle et al., 2012; Lorenzoni and Pidgeon, 2006). However, the
political and emotional charge that fuels the debate on climate change makes obtaining
accurate and honest views on such subjects rather challenging. While useful, public
opinion polls give us only a relatively simple—and often general—sense of how people
feel about a certain issue. Moreover, self-reported opinions have been found to
misrepresent individuals’ true beliefs and corresponding actions (Podsakoff et al., 2003).
For instance, survey-based studies appear to lead to a paradox that “Americans seem
concerned about global warming, yet view it as less important than nearly all other
national or environmental issues” (Leiserowitz, 2006).
This paper takes a novel approach to understanding individuals’ true attitudes
toward climate change by directly observing actions that people take when presented with
a potential energy and environmental crisis—actions that reveal their perceptions of how
grave environmental and climate change concerns are. Being able to observe what
people do in response to a challenge, rather than what they say, provides more
compelling evidence of one’s understanding of said challenge, especially when observed
actions are tied to monetary outcomes.
More specifically, we examine behavior of investors in U.S. and European
financial markets during the unfolding of the Fukushima crisis that reflects their
perceptions about future profitability of various energy assets (i.e. stocks of fossil fuels
and renewable energy). Our approach exploits an intuitive link between people’s attitudes
toward the concept of climate change and their relative perceptions for the profitability
prospects of different energy sources. Survey-based studies have found that people more
3
concerned about climate change tend to have a more optimistic and positive evaluation of
renewable energy than of fossil fuels.§ This implies that an individual’s level of
environmental and climate concern likely frames his assessment of the relative future
profitability of various energy types. We draw on this link to gauge potential regional
differences in climate change attitudes through actual investing behavior of financial
market participants in the United States and Europe. These participants are mostly local
investors, as established by the home country bias literature.**
We also address an important challenge of differentiating investor perceptions of
the global profit potential of specific energy types on one hand from investor
expectations about local policy response to the Fukushima crisis on the other. The
former would be based on global profit expectations and thus provide evidence of
investor’s environmental biases. The latter may have nothing to do with one’s
environmental attitudes, as it would impact investment decisions through only local profit
expectations.
We use Japan’s Fukushima nuclear power crisis of March 2011 as a natural
experiment, and base our study on stock market data from the time period encompassing
this event. We apply event study methodology to these data to investigate how investors
§ For example, analysis of a large British public attitude survey by Spence et al. (2010) finds that both concerns about climate change and general environmental concerns are linked with a positive evaluation of renewables.** The home country bias, a result that investors’ equity portfolios tend to remain heavily concentrated in their domestic stock markets, has been studied for decades and remains one of the most important puzzles in international finance. The vast majority of investors does not hold foreign securities or invests only a small portion of total assets in foreign stocks, despite a relatively low correlation between stock returns of various countries and the potential benefit from international diversification. See, for example, French and Poterba (1991), Abreu, Mendes and Santos (2011), and Grinblatt and Keloharju (1991).
4

in U.S. and European financial markets, with potentially different attitudes toward
climate change and the environment, envisioned the worldwide response to the nuclear
crisis. ††
As emergency workers struggled to contain the scale of the Fukushima crisis in its
initial days, public support for nuclear power weakened noticeably and the prospects of
nuclear power worldwide dimmed.‡‡ A decline in nuclear generation without an offsetting
reduction in energy demand implies a need for compensating generation from other
energy sources.
The anticipated shift in the global generation portfolio led investors to rebalance
their energy asset holdings. We argue that the rebalancing was done in a manner
consistent with investor perceptions of how the world would respond to the nuclear crisis
(that is, their expectations about which energy type would become the most likely
substitute for nuclear generation). The increase in demand for the products and services
of these energy companies would make them more profitable and therefore more
†† Event study methodology has been widely used in finance and economics literature (Fama, 1965). There are studies that apply the event study methodology and other empirical approaches to evaluate the effect of the Fukushima crisis on financial returns of energy firms in a single region. They find that nuclear utilities (particularly Japanese utilities in the affected area and those operating nuclear power plants) suffered a severe decline in returns and a significant increase in systematic risk (Kawashima & Takeda 2012), while European nuclear and renewable sectors experienced short downward and upward returns adjustments, respectively (Ferstl et al. 2011).‡‡ Most notably, Germany committed to phase nuclear capacity out of its energy portfolio completely by the year 2022, and China halted nuclear projects due to safety uncertainty. Many other nations followed suit with safety checks and delays of new nuclear project approvals (Joskow & Parsons, 2012). In retrospect, the negative impact of the Fukushima crisis on nuclear power may have been exaggerated. Duffy (2011) notes that a global nuclear renaissance was unlikely prior to the Fukushima incident and Joskow & Parsons (2012) argue that the actual effect of Fukushima is unlikely to result in as drastic a reduction on nuclear capabilities as has been widely conceived.
5

attractive to investors.§§ Because the actions we observe have direct financial outcomes,
our approach provides evidence that reflects the relative monetary value that investors
assign to fossil-based and renewable energy in the immediate aftermath of the Fukushima
crisis.
Our results indicate that investment behavior does indeed reflect investors’
environmental perceptions. We observe positive financial effects accruing to a portfolio
of global coal companies traded on U.S. markets, on the order of 8.6 percent in excess
returns or $4.2 billion in market capitalization, but not to those listed on European
exchanges. By contrast, European exchange data reveal larger positive outcomes for a
portfolio of global renewable energy companies than was observed on U.S. exchanges.
Over the same time period, renewable stocks traded on European markets earned total
excess returns of 13.8 percent (or over $3 billion in market capitalization), while
renewable companies listed on U.S. exchanges gained only 3.8 percent in excess returns
(which translates to about $1.7 billion in market capitalization). These results suggest that
investors active on U.S. exchanges were more skeptical of climate change and perceived
more optimistic prospects for coal energy, relative to investors active on European
exchanges. European investors, on the other hand, were likely to be more concerned
about the effects of climate change and thus formed a more favorable profitability
expectation for renewable energy.
To the best of our knowledge, this is the first study to estimate the difference in §§ An investor’s objective is to maximize the return on his investment, given some risk tolerance. Following the Fukushima nuclear crisis, an investor would rebalance her asset portfolio toward those financial assets she believes will be more profitable in the future. For energy stocks, this implies companies associated with that energy type that is most likely to make up for a reduction in nuclear generation.
6
monetary value placed by investors on coal and renewable energy assets in the United
States and Europe, as reflected by their prospects in the aftermath of the Fukushima
crisis. Having a quantitative assessment of investors’ environmental perceptions is
important because it leads to creation of more realistic and effective environmental
strategies. For instance, no matter how much U.S. environmental regulators favor
renewable generation, they will not be able to encourage capital flows to renewable
sources if investors don’t foresee high profitability potential for renewable energy and
technology companies. Since investors’ capital allocation decisions over time feed into
firm and industry profitability, then actions taken by owners of capital implicitly
determine which government policies stand to succeed or fail.
This study is also the first to examine actual behavior, rather than opinions
reported to surveyors and polling organizations, to provide empirical evidence on the
trans-Atlantic difference in public environmental and climate change opinions. It is worth
noting that because financial investors comprise a significant but partial share of any
country’s adult population, our results reflect environmental attitudes among a subsample
of the general populace.*** However, provided that behavior-based evidence is more
*** In 2011 (the year on which our analysis focuses), households held approximately 37 percent of the total value of U.S. equities directly, while institutional investors owned 63 percent. In addition to direct holdings, households also participated in equity markets indirectly through mutual funds (44 percent of all U.S. households) and pension funds (69 percent) (see Investment Company Institute’s 2014 Investment Company Fact Book, available at http://www.ici.org/pdf/2012_factbook.pdf, and table L.213 of the Federal Reserve Statistical Release Z.1, available at http://www.federalreserve.gov/releases/z1/current/annuals/a2005-2013.pdf).Participation in the stock market is usually skewed toward higher education and income levels. In 2013, nearly 52 percent of all U.S. adults participated in equity markets either directly or indirectly. Among college graduates participation rate was 77 percent and among adults with incomes of at least $75,000 it was 80 percent (see Gallup and Pew Research Center’s numbers here: http://www.gallup.com/poll/162353/stock-ownership-stays-record-low.aspx and here:
7
compelling than evidence drawn from population surveys and opinion polls, our approach
presents a good complement to the survey-based approach. Our regional approach can
also be scaled down and used to evaluate country-level differences in public attitudes
toward climate change.†††
The paper is organized as follows: in the next section we provide a sketch of our
research framework and hypotheses, as well as the econometric specification used in our
main empirical analysis; Section 3 provides details about our data sources and
stratification methods for data samples; Section 4 presents a discussion of our empirical
results; and Section 5 concludes with some policy implications.
2. Research Framework
2.1 Global profitability prospects vs. local policy response
One challenge we face in this study is in distinguishing between investors’
perceptions of global energy profitability and their expectations about local policy
response to the Fukushima crisis. On one hand, investors form profitability expectations
based on their understanding of the global response to the crisis, which survey-based
evidence suggests is framed by their environmental attitudes (Spence et al., 2010). On the
other hand, investors’ expectations about how domestic policymakers will respond to the
Fukushima crisis will also affect investment decisions by changing the relative profit
http://www.pewresearch.org/fact-tank/2013/11/18/dow-soars-but-only-about-half-of-americans-will-benefit/).††† Country-level analysis has also been popular in the survey/opinion poll literature. Lachapelle, Borick and Rabe (2012), for example, use telephone surveys administered in the United States and Canada to compare public attitude toward climate science and climate policy between the two nations.
8

potential of various energy firms locally. To make sure that we are observing activity
driven by global profit perceptions, we restrict our data sample to publicly traded
electricity fuel source companies, namely producers of coal and renewable energy
technologies, that sell their products or have operations in multiple global markets, and
calculate outcomes based on sampled stocks’ trading and operating regions.‡‡‡
In contrast to companies operating solely in the United States or European Union,
the overall profitability of energy firms with such global operations is determined by
multiple markets (including both the United States and European Union) and is thus not
fully dependent (and in some cases, not at all dependent) on the region in which the stock
shares of these firms are traded. This means that implementation of local policies
favoring a single type of energy source would have a muted effect on profit potential of
firms dealing in that specific energy type. This allows us to rule out local policy
expectations as the main cause of any differences observed in local stock market
outcomes. We hypothesize that such differences, if observed, would instead be driven by
investors’ perceptions about global profitability prospects of certain energy sources,
which reveal their intrinsic attitudes toward climate change.
‡‡‡ We focus on coal and renewable energy for two reasons. The first is that these two sources of electricity constitute a sharp contrast in terms of environmental impacts and carbon emissions. The second is that it is feasible to identify publically listed and globally operating firms that either mine coal or manufacture renewable technologies. We exclude results for natural gas—another important source of electricity generation—from the main discussion due to several ambiguities associated with it. Natural gas is cleaner than coal, but still emits carbon dioxide and other pollutants. It is also difficult to identify a sizable group of firms that focus solely on natural gas production; major gas companies also produce oil, and provide midstream services. For robustness purposes, we identify and analyze a sample of natural gas producers and midstream/service companies. We present their results in Appendix B.
9

Let us provide some support for the above hypothesis through a simple example.
China MingYang Wind Power Group and XinJiang Goldwind Science & Technology
Company are two prominent Chinese wind turbine manufacturers. MingYang Wind
Power is traded on NASDAQ in the United States, while XinJiang Goldwind is traded on
Germany’s Frankfurt Stock Exchange. Both companies sell and install wind turbines in
China, United States, Europe, and other global markets. If, in response to the Fukushima
crisis, European governments decided to boost support for renewable energy projects but
the U.S. government did not, the impact on the economic prospects of MingYang would
not necessarily be worse than on XinJiang, because both firms have sales in the U.S and
in Europe. Therefore, assuming that investors in the United States and Europe are
sophisticated, have equal access to information and make rational assessments about
firms’ future profit potential, the demand for and prices of these two companies’ stocks,
determined by their global potential for future profitability, should not vary from one
regional exchange to another. However, if investors in the United States are in general
more skeptical about climate change, they may on average have a more optimistic view
about the prospect of coal-fired electricity as a viable substitute for nuclear energy in both
the United States and Europe, relative to their European counterparts. Hence, investors’
demand for MingYang stock in U.S. markets might be lower than that for XinJiang stock
in European markets, consistent with investors’ translation of expected global response
into profitability expectations.
One might also be concerned about the presence of naïve investors. If investors do
not understand well the global nature of the sampled companies, they may simply assume
that companies whose stocks are listed on their regional exchanges mainly operate within 10
their region. Such investors would then base profitability expectations for various energy
stocks on their anticipated domestic policy response to the Fukushima crisis, and
rebalance their energy investments accordingly. However, our data sample contains
energy stocks that have global operations and are traded on multiple exchanges around
the world. The naïve assumption would then lead an investor to give equal treatment to
all stocks within the same energy category and thereby assign inappropriate profitability
expectations to stocks of companies that have financial and physical presence in several
regions around the world. To account for this possibility, we carry out separate analyses
on securities that are listed on financial markets of only one geographic region, and those
cross-listed in both regions. If naïve investors dominate and both cross-listed and region-
specific stocks are given equal treatment, we should observe no difference in returns
outcomes among these two categories of stocks.
Finally, there is also the possibility that a global company may nevertheless do the
majority of its business in a single region, which may drive its decision to list its shares
on the local market. In this case, stock market responses to the Fukushima crisis in
different regions could still reflect investors’ expectations about domestic policies in the
aftermath of the crisis, rather than their profitability expectations for certain fuel types
that are influenced by environmental opinions. To check this, we refine our sample
further by focusing only on those companies that have major operations outside of their
listing region (see footnote 18). Focusing only on companies with major operations
outside of their listing region would lend further support to the hypothesis that investors’
responses to the crisis reflect their attitudes toward climate change and their global profit
expectations for certain energy types.11

2.2 Event study methodology
The importance of correctly identifying the event day and length of the event
window has been highlighted and addressed in event study literature.§§§ Our task of
defining the event day is simplified by the fact that the earthquake that struck northern
Japan, being a natural disaster, was in all likelihood unexpected. We confirm the
accuracy of this event day by referencing the Fukushima Nuclear Accident Update Log,
in which the International Atomic Energy Agency (IAEA) recorded all Fukushima
developments. The first IAEA Fukushima Nuclear Log update concerning problems at
the nuclear plant was issued at 21:10 GMT on Friday, March 11, 2011. This corresponds
to 16:10 Eastern Standard Time (10 minutes after the closing bell at NYSE and
NASDAQ) and 22:10 Central European Time (well after trading stopped at all European
markets).**** We define the event day (day 0) as March 11, 2011 for both U.S.- and
European-listed securities and include one trading week of pre-earthquake data in our
event window to illustrate any diversions in financial trends in the earthquake’s
aftermath.
§§§ Hillmer & Yu (1979) and Chang & Chen (1989) examine the speed with which new information is incorporated into stock prices, providing evidence that temporary arbitrage opportunities do exist in financial markets. Binder (1998) and Kothari & Warner (2006) present evidence that mis-specifying the event day or the length of the event window often leads to incorrect estimates of the effect of new information or low statistical power of significance tests. Krivin et al. (2003) suggest several empirical methods of more accurately defining the proper event window length.**** As shown in Table 1, since U.S. and European stock markets were closed at the time of the earthquake, there were no significant changes in trading activity of U.S. investors on the day of the earthquake (trading day 0, column (3)) in response to the first news of the Fukushima event. Although the coefficient estimate on nuclear firms is positive (0.97), it is not statistically significant. Investors were not able to respond to the news until the following Monday, March 14th.
12

We then proceed to define an appropriate event window—the relevant time frame
during which the Fukushima crisis affected stock market outcomes. Our data includes
three trading weeks of post-earthquake observations, since we are interested in short-term
market response to the Fukushima crisis, for which investor perceptions and instincts
play important roles.†††† We use post-earthquake data to construct two measures of stock
responses, abnormal stock turnover and abnormal stock returns, to determine the timing
and duration of investor activities following the earthquake.
Estimating event window length based on media announcements
Pinpointing an accurate length of an event window is more difficult than
specifying an event day. One classic approach is a review of prominent media
publications like the Wall Street Journal, The New York Times, and others.‡‡‡‡ Such
review generally gives a good indication of when and for how long new information was
considered to be of importance, but can in some cases prove to be insufficiently precise in
defining the event window. We attempt to improve upon this by employing two
alternative methods to define the relevant time frame. In the first variation we refine the
usual approach by narrowing our review to only those information updates that appeared
on the IAEA Fukushima Update Log. The Log suggests that the most severe concerns
revealed themselves within the first seven to 10 days after the earthquake.§§§§ This leads †††† Also note that long-horizon event studies could have some significant drawbacks, such as increased potential to misspecify the normal return generating process and reduced ability to detect abnormalities in financial performance (Kothari & Warner, 2006).‡‡‡‡ See, for example, Brown & Warner (1980), McWilliams & Siegel (1997), and Swanson (2011). Indeed, a quote on page 249 of Brown & Warner (1980) reflects how important such publications are: “…even if the researcher doing an event study has a strong comparative advantage at improving existing methods, a good use of his time is still in reading old issues of the Wall Street Journal…”§§§§ A complete list of news stories and sources is available from the authors.
13

us to define a maximum of 15 trading days for the event window length in order to
account for any second-order effects of the earthquake and residual responses by
investors.
Estimating event window length based on stock turnover
In our second approach of identifying the proper length of the even window, we
allow data on trading activity to suggest the appropriate cutoff, rather than imposing any
arbitrary limits (a method employed in Krivin et al., 2003). More specifically, we use
daily turnover information (the portion of a company’s total existing shares traded on a
given day) on the New York Stock Exchange to determine statistically significant
abnormalities in trading patterns. A significant change in a stock’s trading activity is a
signal that investors’ perception of that stock’s future profitability has changed. We
expect that abnormal trading volumes post-Fukushima will persist until all significant
new information is absorbed by financial markets, after which stock turnover should
return to its normal levels. The details of this approach are described below.
To account for intra-day correlation of outcomes among firms specializing in the
same energy source, we aggregate firms in each of the three fuel source categories
(nuclear, coal and renewables) into portfolios. We then construct a daily portfolio
turnover variable. This is done by calculating the ratio between each portfolio’s trading
volume on any given day (the sum of volumes across all firms within a portfolio) and the
number of its shares outstanding on that day (Eq. 1).
14
, (1)
where refers to the turnover of portfolio p on day t; is the traded volume of
stock i (assigned to portfolio p) on day t; is the total number of shares outstanding
of stock i on day t; and is the total number of firms included in portfolio p. We calculate
market-level turnover similarly to portfolio-level turnover, substituting NYSE-wide trading
volumes and shares outstanding for firm-level data.
We then estimate the market model for “normal” daily turnover at the portfolio level
(normal turnoverp,t) using 2010 data, conditioning on daily market-level turnover ( )
as in Eq. 2. The estimated residuals, εp,t , of Eq. 2 serve as the reference (or normal) pre-
earthquake daily abnormalities in turnover, and their standard deviation serves as the population
standard deviation under the null hypothesis that there is no effect of the Fukushima crisis on
stock turnover.
(2)
We apply estimated parameter coefficients of α0 and α1 of Eq. 2 to generate
theoretical “normal” daily portfolio turnover in the days following the earthquake, and
subtract this from actual observed turnover to generate the resulting abnormalities
(abnormal turnoverp,t) for the days following the earthquake (Eq. 3).
(3)15
We evaluate statistical significance of each daily post-earthquake abnormality in
stock turnover using z-statistics and their corresponding critical values, constructed from
abnormal turnover of the year 2010 (Eq. 4).
z = (abnormal turnoverp,t≥0) / σ(abnormal turnoverp,t∈2010) (4)
The results of turnover analysis are shown in Figure 1 and Table 1, both
presenting the daily turnover abnormalities for all available post-earthquake data for each
of the three different portfolios of energy firms. Daily abnormal turnover is statistically
significant (see Table 1) during the first three, four, and seven trading days after the
earthquake for coal, renewable and nuclear portfolios, respectively, which is consistent
with the event timeline suggested by the IAEA Fukushima Log. These results suggest
that the majority of new event-related information was incorporated into financial
markets during the first calendar week of the incident, though residual trading
abnormalities persisted into the second week.
Based on this turnover evidence, we expect that the majority of abnormalities in
stock returns, to which we turn next, will occur within three to seven trading days
following the earthquake. For robustness purposes, we calculate and present results for
the full 14-day post-event data sample.
Estimating the effect of Fukushima on energy stock returns
Our main outcome of interest is the return abnormalities accruing to securities of
each type of energy firm in the U.S. and European markets. Our returns analysis follows
the same approach as the examination of turnover described above. To improve the
16

efficiency of our estimates, we carry out all estimation at the portfolio level, using value-
weighted portfolio returns, , to account for firms of varying size, as in Eq. 5:
, (5)
where is the daily return of security i on day t, and is the security-specific weight, set
equal to the market capitalization of the company on the previous day (calculated as the product
of the previous day’s stock price, pricei,t-1, and number of stock shares outstanding, outstandingi,t-
1).
We estimate the normal value-weighted returns trend for each industry portfolio p
in each region, the United States and Europe, via the market model, utilizing year 2010
data (Eq. 6).
(6)
As before, we subtract estimated normal portfolio returns from observed pre- and
post-earthquake portfolio returns, generating daily abnormalities. We then calculate the
population standard deviation of abnormal returns for each region and portfolio using
abnormal returns of the year 2010, and construct a set of daily post-event z-statistics to
determine the statistical significance of daily abnormal returns of each energy portfolio
after the onset of the Fukushima crisis, in each of the two regions examined.
We repeat the estimation procedure on abnormal returns for subsamples of cross-
listed and region-specific firms, and for region-specific firms with major operations in
17

and outside of the listing region (see last paragraph of section 3.2 for more details).
3. Data
3.1 Analytic sample
Our data sample covers the time period between January 4, 2010 and March 31,
2011, and comes from three primary sources. The first is the Center for Research in
Security Prices (CRSP) database, from which we extract daily observations on nine
companies with nuclear operations, four global nuclear stock indices, 15 coal firms, and
42 renewable energy (solar and wind) companies listed on three U.S. Stock
Exchanges.*****,††††† These data include each company’s identifying characteristics, listing
status, industrial classification code, primary exchange, number of trades, trade volumes,
closing price, shares outstanding, and returns, as well as the value-weighted return of the
exchange.
We supplement these data with daily aggregate observations on New York Stock
Exchange’s (NYSE) shares, number of trades, and dollar volume of trades for the same
time period. ‡‡‡‡‡
Our third data source, the Bloomberg database, provides European stock market
data on seven coal and 40 renewable energy (solar and wind) companies listed on ten
***** The global nuclear stock indices are exchange-traded funds (ETF) composed primarily of electrical utilities with nuclear generating assets, nuclear generation equipment manufacturers, and uranium miners.††††† The New York Stock Exchange (NYSE), NYSE Amex, and NASDAQ are included. The full sample of companies was extracted using relevant SIC codes, then narrowed down to producers with international sales and operations by reviewing each company’s annual reports.‡‡‡‡‡ These data can be downloaded from www.nyxdata.com .
18
exchanges in six countries.§§§§§ Among the variables included in this dataset are
companies’ identifying characteristics, industry classification, primary listing exchange,
number of trades, trade volumes, closing price, and level and percent returns. For a
complete list of all firms included in this study, please refer to Tables A1 through A3 in
Appendix A.
3.2 Sample stratification
Cross-listed and region-specific firms
The first refinement of our data entails dividing our sample of firms into two
groups. The first is those stocks that were traded on both U.S. and European exchanges at
the time of the crisis (cross-listed firms). The second group is those stocks whose listing
was unique to only one region (region-specific firms). The main hypothesis behind this
sub-analysis is that firms that are traded in both regions are likely subject to arbitrage.
Consider investors tracking energy stock prices in both U.S. and European markets.
Suppose these investors notice that the price of a cross-listed coal stock increases on U.S.
exchanges but not on European exchanges. This would make the stock traded on
European exchanges appear to be underpriced relative to its U.S. counterpart, and
encourage traders to buy shares in European markets, in turn reducing the regional price
gap. Firms traded in only one region will be less likely to be subject to such arbitrage
activities and will thus reflect perceptions of local investors more accurately. If there
exist significant differences in investors’ attitudes toward climate change and profit
§§§§§ European exchanges included in analysis are Euro Comp and the stock markets of Germany (Berlin, Frankfurt, Munich, and Stuttgart), Belgium (Brussels), the United Kingdom (London), Spain (Madrid), Italy (Milan), and France (Paris).
19

expectations toward certain energy sources, we would be more likely to see a difference
in returns outcomes among region-specific energy firms than among cross-listed
securities.
Moreover, this refined methodology allows us to test the extent to which naïve
investors dominate financial markets. As discussed earlier, naïve investors assume that
companies whose stocks are listed on their regional exchanges mainly operate within
their region. This leads naïve investors to treat all stocks within the same energy category
equally, and suggests that any observed changes in returns of a category of energy stocks
should be similar for every stock within a category, without regard for each company’s
actual location of operational and financial presence. This test of the dominance of naïve
investors is important because such investors make it difficult to distinguish between
market outcomes driven by expectations about local policies and expectations about
global profitability, rooted in sophisticated investors’ attitudes toward the environment
and climate change.
Major operations relative to listing region
In our second refinement, we divide region-specific firms into those whose main
operations occur within the listing region and those that have major operations outside of
the region in which their stock shares are traded.****** This affords us a more robust test
****** In order to determine whether or not a company has major operations outside of its listing region, we examined the websites and financial reports of all region-specific companies in our data sample. Those companies that prominently mentioned regions of operation that lay outside of their listing region were categorized as having major operations outside the listing region. For example, Peabody Energy and Arch Coal are among the top coal companies in the U.S. Both trade on the New York Stock Exchange, but paint a different picture about their global presence in their operating statements. Peabody Energy lists its operations in “US mining, Australia mining, Peabody in China, Peabody in India, Peabody in Indonesia and Peabody in Mongolia.”
20

of the differences between investors’ global profit expectations (which are framed by
their environmental opinions) and their local policy expectations. For example, if
renewable energy companies traded on European exchanges that have major operations
in the United States see abnormally high returns, it would suggest that European investors
act more on their preferences for renewable energy than on their expectation of European
policy response to the Fukushima crisis. Such a result would thus provide evidence in
favor of our principal hypothesis of global profit-driven investment behavior, which, we
argue, is informed by investors’ own environmental attitudes.
4. Results
Our main results are contained in Figures 2 and 3 and Tables 2 through 4. In
order to give the reader a more intuitive sense of the full effect of the Fukushima crisis on
returns outcomes, Figures 2 and 3 display a cumulative sum of abnormal returns over
time for coal and renewable portfolios, respectively. To supplement the discussion that
follows, Tables 2 and 3 provide daily abnormal returns figures and their respective z-
statistics, from which the Figures were derived.
Our results indicate that investment behavior does reflect investors’
environmental attitudes. We observe positive financial effects accruing to a portfolio of
global coal companies traded on U.S. markets, on the order of $4.2 billion, but not to
those listed on European exchanges. Relatively inexpensive coal-fired power plants
cause more pollution and carbon emissions per kilowatt-hour (kWh) of electricity than
Arch Coal writes that, along with its subsidiaries, it has “a leading position in every major U.S. coal basin, with mining complexes in Wyoming, Colorado, Illinois, West Virginia, Kentucky, Virginia and Maryland.”
21

nuclear power, natural gas, and renewables. A stronger positive response toward coal
generation by investors active on U.S. exchanges suggests that, relative to investors
active on European exchanges, those active on U.S. exchanges were more skeptical of
climate change and had a more optimistic assessment of the potential of coal-based
power to replace nuclear generation in the aftermath of the Fukushima crisis.
Figure 2 exhibits cumulative abnormal returns of coal securities traded on U.S.
and European financial exchanges.†††††† Following the earthquake at trading day 0, we
can see that the paths of the two regions’ abnormal returns diverge, with U.S.-listed coal
firms accruing excess gains and European coal companies incurring slight earnings
losses. This diversion in trends suggests that U.S. and European investors’ perception of
coal companies’ post-Fukushima profit potential differed significantly. Columns (1) and
(2) of Table 2 show the daily abnormal returns for these coal stocks. Excess gains of
U.S.-listed coal companies are higher than excess gains of their European counterparts.
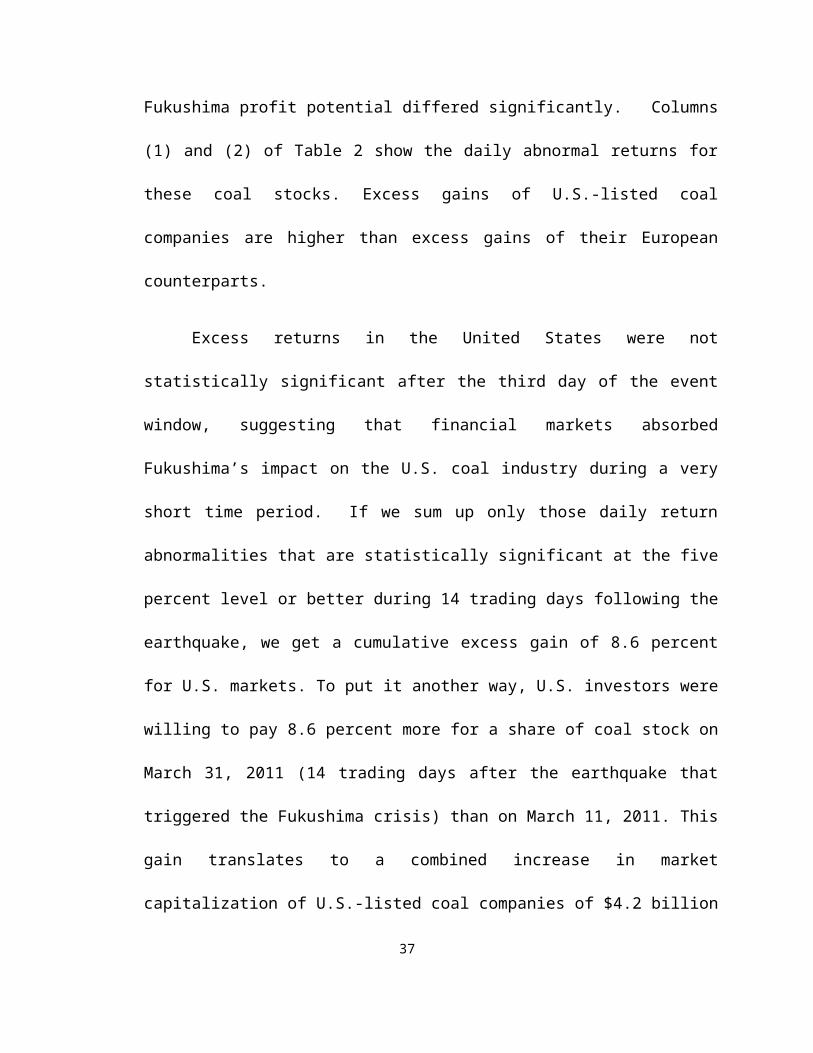
Excess returns in the United States were not statistically significant after the third
day of the event window, suggesting that financial markets absorbed Fukushima’s impact
on the U.S. coal industry during a very short time period. If we sum up only those daily
return abnormalities that are statistically significant at the five percent level or better
during 14 trading days following the earthquake, we get a cumulative excess gain of 8.6
percent for U.S. markets. To put it another way, U.S. investors were willing to pay 8.6
percent more for a share of coal stock on March 31, 2011 (14 trading days after the
earthquake that triggered the Fukushima crisis) than on March 11, 2011. This gain
translates to a combined increase in market capitalization of U.S.-listed coal companies †††††† Due to data limitations, there are no cross-listed coal firms in our sample.
22

of $4.2 billion over the course of just three days.‡‡‡‡‡‡
Restricting the sample further to only those coal companies that have major
operations outside of their listing region, we see that the results remain qualitatively
similar, and somewhat more pronounced in magnitude (see panel (b) of Figure 2 and
columns (3) and (4) of Table 2). This supports the notion that local policy expectations
were not the driving force behind investors’ response to the Fukushima crisis.
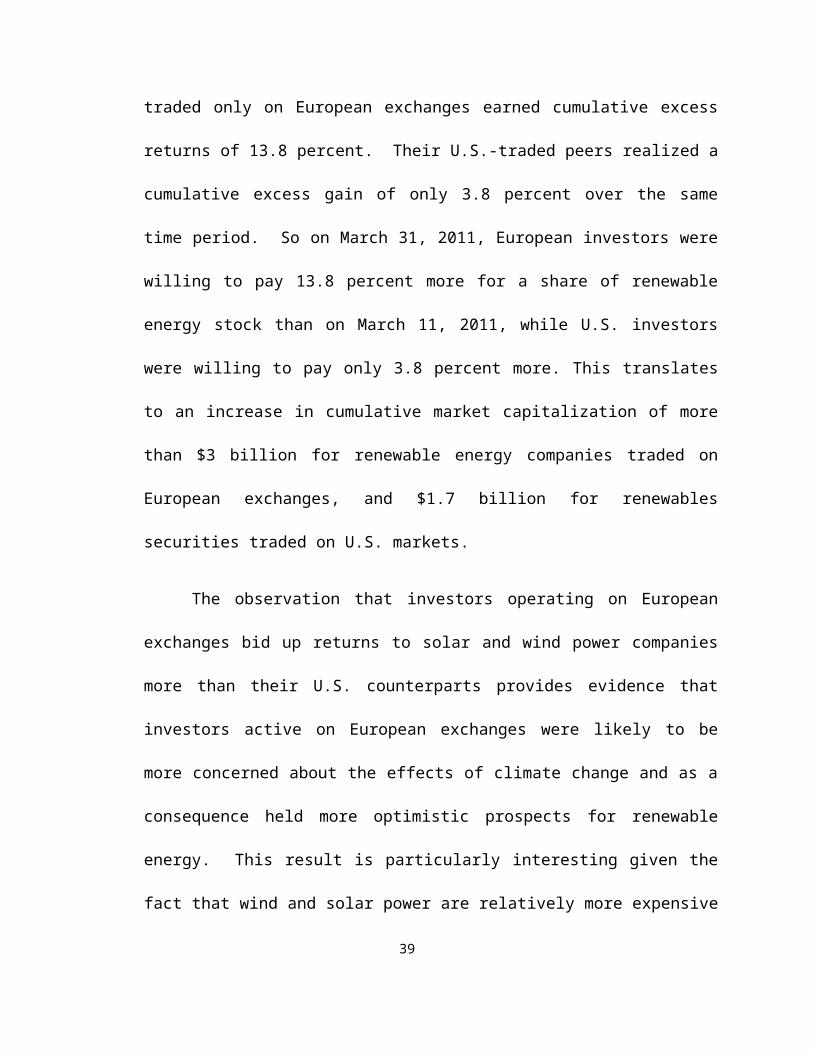
By contrast, European exchange data reveal larger positive outcomes for a
portfolio of global renewable energy companies, when compared to the stock price boost
realized by U.S.-listed renewable firms (see Figure 3 and Table 3). Adding up
statistically significant abnormalities over 14 post-earthquake trading days, we find that
renewable firms traded only on European exchanges earned cumulative excess returns of
13.8 percent. Their U.S.-traded peers realized a cumulative excess gain of only 3.8
percent over the same time period. So on March 31, 2011, European investors were
willing to pay 13.8 percent more for a share of renewable energy stock than on March 11,
2011, while U.S. investors were willing to pay only 3.8 percent more. This translates to
an increase in cumulative market capitalization of more than $3 billion for renewable
energy companies traded on European exchanges, and $1.7 billion for renewables
securities traded on U.S. markets.
The observation that investors operating on European exchanges bid up returns to
‡‡‡‡‡‡ We calculate the statistically significant increase in aggregate market capitalization of coal and renewable companies contained in our sample as follows. First, we take the aggregate event-day (day 0) market capitalization of all coal or renewable energy companies listed on a specific region. We then multiply this aggregate market capitalization by the statistically significant cumulative abnormal return observed in that region over 14 subsequent trading days.
23
solar and wind power companies more than their U.S. counterparts provides evidence that
investors active on European exchanges were likely to be more concerned about the
effects of climate change and as a consequence held more optimistic prospects for
renewable energy. This result is particularly interesting given the fact that wind and solar
power are relatively more expensive to produce (compared to coal-based electricity), less
reliable due to their non-dispatchable characteristics, and require more technological
innovation.
Refining our analysis by regional presence, we see that positive abnormalities in
returns of global renewable energy companies traded only on European exchanges
(region-specific companies) were twice as large in magnitude as those accrued by
renewables stocks traded only on U.S. markets. This difference is even more exaggerated
among firms the majority of whose operations occur outside of their listing region—
further evidence in favor of the environmental perception hypothesis.
Cross-listed renewable energy stocks demonstrated no difference in return
abnormalities, suggesting some arbitrage activity among investors in the two regions.
This result serves as evidence against the scenario of a naïve investor acting on
expectations of domestic policy changes. Naïve investors, in anticipation of a more
favorable policy response toward renewable energy in Europe following the crisis, would
have had a higher demand for all renewable energy stocks traded in Europe, even those
that may also have been traded elsewhere in the world. Since we do not observe a rise in
relative value of cross-listed renewable stocks, we are able to corroborate the idea that it
is global profit expectations stemming from climate change attitudes, and not local policy
24

expectations, that drive observed regional differences in responses to the Fukushima
crisis.
Finally, as shown in Table 4, U.S.-traded firms and mutual fund indexes with
significant exposure to nuclear activities amassed statistically significant losses over the
first two days following the Japanese earthquake, confirming investors’ pessimism
toward nuclear power as a consequence of the crisis. The magnitude of these losses was
more substantial for global nuclear indexes that experienced an initial two-day loss of
16.6 percent, followed by a 7.5 percent upward correction on days five and six, and
another loss of 4.2 percent on days 11 and 12. The majority of firms included in the first
nuclear sample (column (1) of Table 4) are electricity generators and nuclear operations
do not comprise the entirety of their business. Thus, return movements of the nuclear
ETF indexes (column (2) of Table 4) are likely to be more representative of the
Fukushima incident’s financial implications for the global nuclear industry.
5. Conclusion
In this paper we provide a novel approach to investigating the trans-Atlantic difference in
public opinion on climate change and the environment, using financial investors’ actions, rather
than self-reported opinions. We exploit the link between people’s attitudes toward climate
change and their profitability perceptions of certain energy sources and use the 2011 Fukushima
crisis as a natural experiment to evaluate responses of U.S. and European investors to a shifting
view of nuclear power. We analyze return abnormalities to stocks of energy companies that
operate in multiple global markets. We also narrow our sample to companies with major
operations outside of their listing region, whose expected profitability would not be determined
25
by a local policy response to the Fukushima crisis. Our results uncover a more optimistic
perception about coal firms among investors trading on U.S. markets, and more favorable views
of renewable energies among investors trading on European exchanges.
As concerns about nuclear power grew during the crisis, investors active on U.S.
exchanges perceived coal to be the most likely substitute for the coming dearth of nuclear
generation. This perception meant that demand for coal assets, and therefore coal stocks,
would rise and thus generate excess returns for global coal producers. Coal companies
traded on U.S. stock exchanges realized cumulative excess returns of 8.6 percent,
equivalent to a $4.2 billion increase in their combined market capitalization. Coal stocks
traded on European exchanges, by contrast, realized no excess returns. Investors trading
on European markets, on the other hand, perceived renewable energy companies as the
most viable replacement for nuclear generation. They thus bid up demand for renewable
stocks enough to generate excess returns of 13.8 percent – 10 percentage points higher
than for similar firms traded on U.S. markets. This translates to an aggregate increase in
the value of these firms of over $3 billion – nearly double the $1.7 billion increase in
aggregate value of renewable securities traded on U.S. exchanges. These results hold
even for companies with the majority of operations outside of their listing region and
suggest that investors on European exchanges at that time valued the incremental
potential of renewables to contribute to power generation in a post-Fukushima world
more than investors on U.S. exchanges did.
This study provides the first quantified financial evidence that reflects relative
climate change attitudes among investors in the two examined regions, manifested by
their observed investing actions. It is worth noting that because European investors
26

transact on U.S. exchanges and vice versa, the difference we observe in responses of
financial markets in the United States and in Europe could underestimate the difference
in views about climate change and perceptions about energy assets between the two
groups of investors. Additionally, investors may have used the Fukushima crisis to seek
out arbitrage opportunities. The arbitrage effect would attenuate our coefficient estimates
further.§§§§§§ Even with all these potential attenuations, however, our results validate and
supplement opinion polls administered to the general public. The quantification of
investors’ environmental sentiment is a helpful step in delineating regional climate
attitudes.
References
Abreu, Margarida, Victor Mendes and Joao A.C. Santos, “Home Country Bias: Does Domestic
Experience Help Investors Enter Foreign Markets?” Journal of Banking & Finance,
2011, 35, 2330-2340.
§§§§§§ Consider a hypothetical U.S. investor tracking energy stock prices in both U.S. and European markets at the same time. He would notice that coal stocks listed on European exchanges were becoming relatively cheaper than coal stocks listed on U.S. exchanges. This would make European coal assets appear to be underpriced relative to U.S. coal assets and encourage our investor to buy stock shares of European coal producers. This would raise the demand for European-listed coal stocks and increase their returns, thereby reducing the returns gap between coal stocks traded in the United States and Europe.
27

Affleck-Graves, J., Callahan, C., and Ramanan, R., “Detecting Abnormal Bid-Ask Spread: A
Comparison of Event Study Methods,” Review of Quantitative Finance and Accounting,
2004, Vol. 14(1), pp. 45-65.
Aktar, I. “A comparison of the effects of the Chernobyl and Three Mile Island nuclear accidents
on the U.S. electric utility industry,” Sosyoekonomi 2005(2): 11-24.
Binder, John J., “The Event Study Methodology Since 1969,” Review of Quantitative Finance
and Accounting, Vol. 11(1998), pp. 111-117.
Brechin, Steven R. and Bhandari, Medani, “Perceptions of Climate Change Worldwide,” WIREs
Clim Change, 2011, 2, 871-885. Doi: 10.1002/wcc.146.
Carlarne, Cinnamon, “Climate Change Policies an Ocean Apart: EU & US Climate Change
Policies Compared,” Penn State Environmental Law Review, 2006, 14(3), 435-482.
Chang, S. J. and Son-Nan Chen, “Stock-Price Adjustment to Earnings and Dividend Surprises,”
Quarterly Review of Economics and Business, Vol. 29(1), 1989, pp. 68-81.
Davis, L., “Prospects for U.S. Nuclear Power After Fukushima,” Journal of Economic
Perspectives, 26(1), pp. 49-66, 2012.
Duffy, R., “Déjà vu all over again: climate change and the prospects for a nuclear power
renaissance,” Environmental Politics, Vol. 20(5), September 2011, pp. 668-686.
Fama, Eugene F. "The Behavior of Stock Market Prices." Journal of Business, 38(1): 34–105,
January 1965.
Fama, E., Fisher, L., Jensen, M.C., Roll, R, “The adjustment of stock prices to new information,”
International Economic Review, 10(1):1 – 21, 1969.28

Ferstl, R., Uta, S., Wimmer, M., “The effect of the Japan 2011 disaster on nuclear and alternative
energy stocks worldwise: an event study,” SSRN Working Paper Series, May 2011.
Fields, M.A., Janjigian, V, “The effect of Chernobyl on electric-utility stock prices,” Journal of
Business Research, 18:81-87, 1989.
French, Kenneth and James Poterba, "Investor Diversification and International Equity Markets".
American Economic Review Vol. 81(2): 222–226, 1991.
Gilani, I.S., Shahid, R., “Japan Earthquake Jolts Global Views on Nuclear Energy,” Findings
from a Global Snap Poll in 47 countries by WIN-Gallup International, April 15, 2011.
Grinblatt, Mark and Matti Keloharju, “How Distance, Language, and Culture Influence
Stockholdings and Trades,” The Journal of Finance 56(3), pp. 1053-1073, June 2001.
Hillmer, S.C. and P.L. Yu “The Market Speed of Adjustment to New Information,” Journal of
Financial Economics, Vol. 7(4), pp. 321-345, 1979.
Joskow, P. and Parsons, J., “The Future of Nuclear Power after Fukushima,” Economics of
Energy and Environmental Policy 1(2):99-113, January 2012.
Kalra, R., Henderson, G. V. Jr., Raines, G.A., “Effects of the Chernobyl nuclear accident on
utility share prices,” Quarterly Journal of Business and Economics 32(2):52-77, 1993.
Kawashima, S. and Takeda, F., “The Effect of the Fukushima Nuclear Accident on Stock Prices
of Electric Power Utilities,” (January 11, 2012). Available at SSRN:
http://ssrn.com/abstract=1983138 or http://dx.doi.org/10.2139/ssrn.1983138
Kothari, S.P., and Warner, Jerold B., “Econometrics of Event Studies,” Handbook of Corporate
Finance: Empirical Corporate Finance, Volume 1, Chapter 1, pp. 3-36, B. Espen Eckbo
(ed.), Elsevier/North-Holland, Oxford, United Kingdom, 2007.29

Krivin, D., Patton, R., Rose, E., Tabak, D., “Determination of the Appropriate Event Window
Length in Individual Stock Event Studies,” November 4, 2003, NERA Economic
Consulting Working Paper Series.
Lachapelle, Erick, Christopher P. Borick and Barry Rabe, “Public Attitudes toward Climate
Science and Climate Policy in Federal Systems: Canada and the United States
Compared,” Review of Policy Research, 2012, 29 (3), 334-357.
Leiserowitz, Anthony, “Climate Change Risk Perception and Policy Preferences: the Role of
Affect, Imagery, and Values,” Climatic Change, 2006, 77, 45-72.
Lorenzoni, Irene, Nick F. Pidgeon, “Public Views on Climate Change: European and USA
Perspective,” Climatic Change, 2006, 77, 73-95.
McWilliams, Abagail and Donald Siegel, “Event Studies in Management Research: Theoretical
and Empirical Issues,” The Academy of Management Journal, Vol. 40(3), pp. 626-657,
1997.
Podsakoff, Philip M.; MacKenzie, Scott B.; Lee, Jeong-Yeon; Podsakoff, Nathan P., “Common
method biases in behavioral research: A critical review of the literature and
recommended remedies.” Journal of Applied Psychology 88(Oct 2003): 879-903.
Sandeep Nabar and K. K. Boonlert‐U‐Thai (2007) Earnings Management, Investor Protection,
and National Culture. Journal of International Accounting Research: Fall, Vol. 6, No. 2,
pp. 35-54.
Schmidt, J. and Haifly, A., “Delivering on renewable energy around the world: how do key
countries stack up?” Energy Facts, National Resources Defense Council, May 2012.
Available at http://www.nrdc.org/energy/files/delivering-renewable-energy.pdf.
30
Skjærseth, Jon B, Bang, Guri and Schreurs, Miranda A, “Explaining Growing Climate Policy
Differences Between the European Union and the United States,” Global Environmental
Politics, 2013, 13(4), 61-80.
Spence, Alexa, Wouter Poortinga, Nick Pidgeon and Irene Lorenzoni, “Public perceptions of
energy choices: The influence of beliefs about climate change and the environment”,
Energy and Environment, 2010, 21(5). pp. 385-407.
Swanson, Eric T., “Let’s Twist Again: A High-Frequency Event-Study Analysis of Operation
Twist and Its Implications for QE2,” Brookings Papers on Economic Activity, pp. 151-
188, Spring 2011.
U.S. Energy Information Administration, “U.S. Natural Gas Wellhead Price Data,” 2013,
http://www.eia.gov/dnav/ng/hist/n9190us3m.htm.
Wittneben, B., “The impact of the Fukushima nuclear accident on European energy policy,”
Environmental Science and Policy 15(2012), pp. 1-3.
31

Figure 1: Daily abnormal turnover of U.S.-listed securities, by portfolio
-10
0
10
20
30
40
50Coal
Trading day
Dai
ly a
bnor
mal
turn
over
, %
-10-505
10152025
Renewables
Trading day
Dai
ly a
bnor
mal
turn
over
, %
-4-202468
10Nuclear
Trading day
Dai
ly a
bnor
mal
turn
over
, %
Figure 2: Cumulative abnormal returns of coal firms
-0.125
-0.075
-0.025
0.025
0.075
0.125
a) Region-specific coal firms
EU CoalUS CoalTrading day
Cum
ulati
ve a
bnor
mal
retu
rn
-0.125
-0.075
-0.025
0.025
0.075
0.125
b) Region-specific coal firms with major operations outside listing region
EU CoalUS CoalTrading day
Cum
ulati
ve a
bnor
mal
retu
rn
Figure 3: Cumulative abnormal returns of renewable firms
-5 -3 -1 1 3 5 7 9 11 13
-0.1
-0.05
-2.77555756156289E-17
0.05
0.1
0.15
0.2a) All renewable firms
EU RenewablesUS Renewables
Trading day
Cum
ulati
ve a
bnor
mal
retu
rn
-0.1
0
0.1
0.2b) Cross-listed renewable firms
EU RenewablesUS Renewables
Trading day
Cum
ulati
ve a
bnor
mal
retu
rn
-0.1
0
0.1
0.2c) Region-specific renewable firms
EU RenewablesUS Renewables
Trading day
Cum
ulati
ve a
bnor
mal
retu
rn
-0.1
-0.05
0
0.05
0.1
0.15
0.2
d) Region-specific renewable firms with main operatins outside listing
region
EU RenewablesUS Renewables
Trading day
Cum
ulati
ve a
bnor
mal
retu
rn
32

Table 1: Daily abnormal turnover of U.S.-listed securities, by portfolio
(1) (2) (3)Trading day Coal Renewables Nuclear firms
-5 11.602 1.232 -0.667(1.36) (0.218) -(0.372)
-4 15.002 * 6.919 0.419(1.758) (1.224) (0.234)
-3 1.501 4.353 -0.563(0.176) (0.77) -(0.314)
-2 9.656 7.174 0.444(1.132) (1.269) (0.247)
-1 19.737 ** 12.552 ** 1.673(2.313) (2.221) (0.932)
0 10.650 9.954 * 0.970(1.248) (1.761) (0.541)
1 17.699 ** 15.910 *** 8.080 ***(2.075) (2.815) (4.503)
2 14.404 * 21.980 *** 6.529 ***(1.688) (3.889) (3.638)
3 40.249 *** 14.623 *** 6.303 ***(4.718) (2.587) (3.513)
4 17.134 ** 5.763 3.699 **(2.008) (1.02) (2.062)
5 30.950 *** 5.883 2.149(3.628) (1.041) (1.197)
6 7.700 -2.749 -0.776(0.902) -(0.486) -(0.433)
7 18.294 ** -4.016 -0.162(2.144) -(0.71) -(0.09)
8 11.236 -2.398 -2.225(1.317) -(0.424) -(1.24)
9 15.397 * -0.030 -2.151(1.805) -(0.005) -(1.199)
10 2.555 -5.428 -2.359(0.3) -(0.96) -(1.315)
11 -3.989 1.891 -2.235-(0.468) (0.335) -(1.245)
12 -2.398 -0.489 -1.477-(0.281) -(0.087) -(0.823)
13 0.508 -1.918 -1.454(0.06) -(0.339) -(0.81)
14 0.056 -2.759 0.332(0.007) -(0.488) (0.185)
Note: z-statistics in parentheses. H0: the Fukushima crisis had no effect on daily stock turnover of publically traded energy companies. Significance levels: * 10%, ** 5%, *** 1%.
33

Table 2: Daily abnormal returns, COAL FIRMS
All firms, all of which are also region-specific firms
Region-specific firms with major operations outside of
the listing region(1) (2) (3) (4)
Trading day U.S. Europe U.S. Europe-5 0.015 0.019 0.010 0.006
(1.06) (0.985) (0.661) (0.188)-4 0.001 -0.006 0.001 -0.009
(0.057) (-0.307) (0.066) -(0.280)-3 -0.019 0.002 -0.022 -0.009
(-1.287) (0.111) -(1.380) -(0.282)-2 -0.030** -0.006 -0.031* -0.007
(-2.088) (-0.295) -(1.942) -(0.206)-1 -0.019 -0.010 -0.024 -0.012
(-1.326) (-0.530) -(1.512) -(0.370)0 0.006 -0.013 0.012 -0.008
(0.388) (-0.675) (0.788) -(0.240)1 0.038 *** -0.011 0.043 *** -0.025
(2.644) (-0.601) (2.749) -(0.775)2 0.018 -0.023 0.016 -0.027
(1.232) (-1.198) (1.019) -(0.859)3 0.048 *** 0.0001 0.066 *** 0.003
(3.293) (0.004) (4.187) (0.10)4 0.014 -0.007 0.014 -0.012
(0.964) (-0.380) (0.921) -(0.394)5 -0.010 0.015 -0.008 0.009
(-0.705) (0.781) -(0.485) (0.290)6 -0.020 -0.022 -0.018 -0.004
(-1.386) (-1.174) -(1.158) -(0.122)7 0.013 0.018 0.001 -0.001
(0.869) (0.958) (0.050) -(0.026)8 0.018 0.014 0.022 0.000
(1.254) (0.751) (1.370) (0.008)9 -0.012 -0.025 -0.017 -0.013
(-0.832) (-1.320) -(1.053) -(0.417)10 -0.004 -0.001 -0.004 -0.005
(-0.282) (-0.062) -(0.258) -(0.170)11 -0.011 -0.005 -0.017 -0.004
(-0.765) (-0.274) -(1.106) -(0.122)12 -0.009 -0.006 0.000 -0.007
(-0.621) (-0.311) (0.016) -(0.222)13 -0.008 -0.006 -0.006 0.006
(-0.521) (-0.321) -(0.392) (0.202)14 0.002 0.017 -0.003 0.033
(0.106) (0.899) -(0.216) (1.054)
34
Note: z-statistics in parentheses. H0: the Fukushima crisis had no effect on daily returns of publically traded energy companies. Significance levels: * 10%, ** 5%, *** 1%.
35
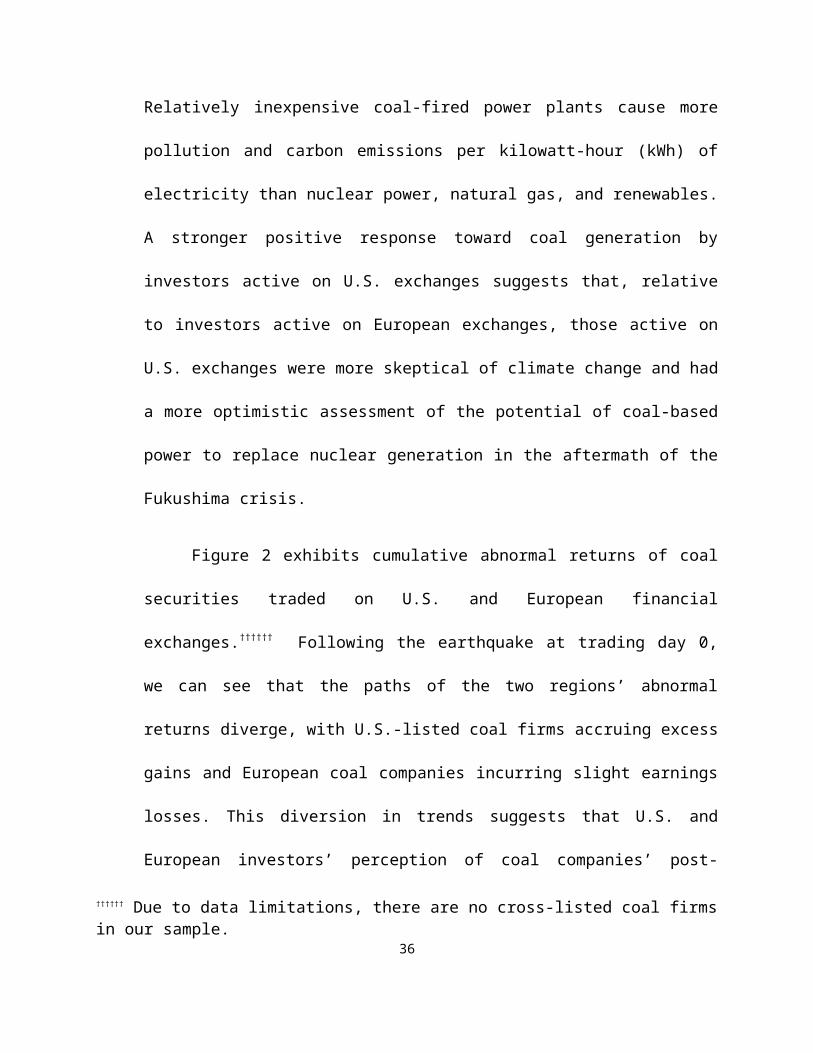
Table 3: Daily abnormal returns, RENEWABLE FIRMS
All Firms Cross-Listed firms Region-specific firms Region-specific firms with major operations outside of
the listing region(1) (2) (3) (4) (5) (6) (7) (8)
Trading day U.S. Europe U.S. Europe U.S. Europe U.S. Europe-5 0.002 0.010 0.006 0.004 0.001 0.016 0.001 0.013
(0.267) (0.819) (0.414) (0.222) (0.072) (1.003) (0.094) (0.533)-4 -0.016 -0.013 -0.012 -0.019 -0.017** -0.007 -0.024 *** 0.000
(-1.736) (-1.044) (-0.790) (-1.185) (-2.111) (-0.453) -(2.724) -(0.017)-3 -0.012 -0.002 -0.005 -0.0003 -0.015* -0.005 -0.018 ** 0.000
(-1.339) (-0.186) (-0.313) (-0.019) (-1.888) (-0.293) -(2.045) -(0.007)-2 -0.011 0.005 -0.001 -0.003 -0.016* 0.012 -0.017 * 0.003
(-1.260) (0.404) (-0.048) (-0.218) (-1.993) (0.8) -(1.948) (0.109)-1 0.001 -0.008 0.00001 -0.007 0.001 -0.009 0.000 -0.016
(0.091) (-0.640) (0.001) (-0.453) (0.145) (-0.576) -(0.053) -(0.694)0 -0.008 -0.004 -0.011 -0.0003 -0.007 -0.007 -0.003 -0.008
(-0.893) (-0.305) (-0.703) (-0.021) (-0.831) (-0.479) -(0.372) -(0.360)1 0.026 *** 0.050 *** 0.037 ** 0.032 ** 0.020 ** 0.067 *** 0.015 * 0.070 ***
(2.860) (4.147) (2.459) (2.019) (2.462) (4.311) (1.676) (2.974)2 0.034 *** 0.068 *** 0.067 *** 0.070 *** 0.018 ** 0.066 *** 0.019 ** 0.112 ***
(3.850) (5.621) (4.498) (4.379) (2.233) (4.220) (2.146) (4.750)3 -0.002 0.008 0.002 0.007 -0.004 0.008 -0.006 -0.001
(-0.198) (0.649) (0.155) (0.434) (-0.477) (0.509) -(0.678) -(0.024)4 -0.005 -0.006 -0.017 -0.011 0.0002 -0.001 0.003 0.001
(-0.614) (-0.493) (-1.106) (-0.706) (0.027) (-0.049) (0.374) (0.030)5 -0.011 -0.014 -0.021 -0.038** -0.006 0.009 -0.010 -0.002
(-1.280) (-1.139) (-1.436) (-2.376) (-0.778) (0.559) -(1.169) -(0.086)6 -0.003 -0.021 * -0.010 -0.005 0.001 -0.035** 0.003 -0.034
(-0.318) (-1.718) (-0.645) (-0.307) (0.066) (-2.263) (0.347) -(1.426)7 -0.003 -0.005 -0.002 -0.007 -0.004 -0.004 -0.004 -0.023
(-0.368) (-0.444) (-0.102) (-0.446) (-0.514) (-0.272) -(0.421) -(0.989)8 0.005 0.009 0.005 0.010 0.005 0.007 0.006 0.000
(0.541) (0.708) (0.302) (0.643) (0.606) (0.424) (0.642) -(0.006)9 0.003 -0.003 -0.003 -0.006 0.006 -0.001 0.006 -0.007
(0.350) (-0.272) (-0.207) (-0.383) (0.757) (-0.050) (0.680) -(0.305)10 -0.004 0.002 -0.003 -0.000003 -0.004 0.003 -0.004 -0.007
(-0.426) (0.145) (-0.199) (-0.0002) (-0.520) (0.189) -(0.441) -(0.293)11 0.013 0.031 ** 0.016 0.021 0.012 0.040 *** 0.014 0.038
(1.475) (2.572) (1.036) (1.307) (1.468) (2.588) (1.633) (1.613)12 0.003 -0.004 0.004 0.006 0.003 -0.014 0.005 -0.011
(0.367) (-0.347) (0.269) (0.392) (0.353) (-0.898) (0.576) -(0.447)13 -0.006 -0.004 -0.010 -0.015 -0.004 0.006 -0.003 0.003
(-0.685) (-0.357) (-0.685) (-0.963) (-0.503) (0.364) -(0.352) (0.143)14 0.005 0.014 0.018 0.015 -0.002 0.013 -0.001 0.003
(0.548) (1.170) (1.225) (0.918) (-0.215) (0.862) -(0.104) (0.124)
36
Note: z-statistics in parentheses. H0: the Fukushima crisis had no effect on daily returns of publically traded energy companies. Significance levels: * 10%, ** 5%, *** 1%
37

Table 4: Daily abnormal returns, NUCLEAR PORFTOLIOS
(1) (2)Nuclear FIRMS Nuclear INDICES
Trading day U.S. U.S.-5 0.0003 0.001
(0.051) (0.101)-4 0.011 ** -0.009
(1.966) (-1.210)-3 0.004 -0.009
(0.775) (-1.214)-2 0.014 ** -0.002
(2.430) (-0.203)-1 0.004 -0.011
(0.788) (-1.488)0 -0.001 -0.007
(-0.232) (-0.917)1 -0.010 * -0.126 ***
(-1.854) (-16.476)2 -0.014 ** -0.040 ***
(-2.478) (-5.265)3 -0.009 -0.008
(-1.623) (-1.009)4 -0.008 0.014 *
(-1.505) (1.855)5 -0.001 0.043 ***
(-0.126) (5.651)6 0.001 0.032 ***
(0.253) (4.176)7 0.007 -0.002
(1.195) (-0.202)8 -0.002 -0.007
(-0.377) (-0.896)9 -0.002 -0.008
(-0.287) (-1.048)10 -0.003 -0.006
(-0.584) (-0.849)11 -0.001 -0.025 ***
(-0.249) (-3.325)12 0.006 -0.017 **
(1.048) (-2.264)13 0.006 0.010
(1.153) (1.259)14 -0.004 -0.007
(-0.678) (-0.963)Note: z-statistics in parentheses. H0: the Fukushima crisis had no effect on daily returns of publically traded nuclear companies. Significance levels: * 10%, ** 5%, *** 1%.
38
Appendix A: List of firms included in the study
Table A1: Nuclear energy firms included in empirical analysis
U.S. – PORTFOLIO 1: NUCLEAR FIRMS U.S. – PORTFOLIO 2: NUCLEAR INDICESCONSTELLATION ENERGY GROUP INC GLOBAL X FUNDS
DOMINION RESOURCES INC ISHARES S&P GLOBAL NUCLEAR ENERGY INDEX
DUKE ENERGY CORP MARKET VECTORS URANIUIM+NUCLEAR ENERGY ETF
ENERGY SOLUTIONS INC POWERSHARES GLOBAL NUCLEAR ENERGY ETF
ENTERGY CORP
EXELON CORP
NEXTERA ENERGY INC
PROGRESS ENERGY INC
SOUTHERN CO
Table A2: Coal firms included in empirical analysis
U.S. EUROPEALLIANCE HOLDINGS ^ ATLANTIC COAL PLC
ALLIANCE RESOURCE PARTNERS ^ BISICHI MINING PLC
ALPHA NATURAL RESOURCES INC ^ GCM RESOURCES PLC
ARCH COAL INC ^ NCONDEZI COAL CO
CLOUD PEAK ENERGY INC NEW WORLD RESOURCES PLC
INTERNATIONAL COAL GROUP INC ^ STRATEGIC NATURAL RESOURCES
JAMES RIVER COAL CO UK COAL PLC
MASSEY ENERGY CO
OXFORD RESOURCE PARTNERS
PATRIOT COAL CORP
^ PEABODY ENERGY CORP
PENN VIRGINIA RESOURCE PARTNERS
RHINO RESOURCE PARTNERS
WESTMORELAND COAL CO
^ YANZHOU COAL MINING CO LTD
^ Indicates firms with major operations outside the listing region.
39

Table A3: Renewable energy firms included in empirical analysis
U.S. EUROPE^ A POWER ENERGY GENERATION SYS LT ^ HANWHA SOLARONE CO LTD # AEROVIRONMENT INC # MICREL INC
^ ADVANCED ENERGY INDUSTRIES INC ^ HEXCEL CORP ALEO SOLAR AG # POWER ONE INC
# AEROVIRONMENT INC HOKU CORP # AMTECH SYSTEMS INC POWERBAGS AG
# AMTECH SYSTEMS INC # IDACORP INC ^ ARISE TECHNOLOGIES CORP ^ POWERFILM INC
^ APPLIED MATERIALS INC ^ ITRON INC # BTU INTERNATIONAL INC PV CRYSTALOX SOLAR
# BTU INTERNATIONAL INC ^ J A SOLAR HOLDINGS CO LTD # CANADIAN SOLAR INC ^ RENEWABLE ENERGY CORP
BEACON POWER CORP # JINPAN INTERNATIONAL LTD # CAPSTONE TURBINE CORP ROTH & RAU AG
CVD EQUIPMENT CORP # LDK SOLAR CO LTD # CLEANTECH SOLUTIONS INTL ^ SOLAR ENERGY INITIATIVE
# CANADIAN SOLAR INC MEMC ELECTRONIC MATERIALS # CYPRESS SEMICONDUCTOR CORP ^ SOLAR ENERTECH CORP
# CAPSTONE TURBINE CORP # MAGNETEK INC DAY4 ENERGY INC ^ SOLAR POWER INC
^ CHINA MING YANG WIND POWER GRP # MAXWELL TECHNOLOGIES INC # DAYSTAR TECHNOLOGIES INC ^ SOLAR THIN FILMS INC
^ CHINA SUNERGY CO LTD # MICREL INC ^ ENTECH SOLAR INC SOLAR2 AG
^ CHINA WIND SYSTEMS INC ^ NATIONAL SEMICONDUCTOR CORP # EVERGREEN SOLAR INC # SPIRE CORP
# CLEANTECH SOLUTIONS INTL # POWER ONE INC # FIRST SOLAR INC # SPX CORP
# CYPRESS SEMICONDUCTOR CORP ^ RENESOLA LTD ^ GT ADVANCED TECHNOLOGIES INC # SUNPOWER CORP
# DAYSTAR TECHNOLOGIES INC # SPIRE CORP ^ HANSEN TRANSMISSIONS INT ^ TIMMINCO LTD
ENERGY CONVERSION DEVICES INC # SPX CORP # IDACORP INC ULTIMA NETWORKS PLC
^ ENTEGRIS INC # SUNPOWER CORP # JINPAN INTERNATIONAL LTD VESTAS WIND SYSTEMS
# EVERGREEN SOLAR INC ^ SUNTECH POWER HOLDINGS CO # LDK SOLAR CO LTD ^ XINJIANG GOLDWIND SCIENCE & TECHNOLOGY
# FIRST SOLAR INC ^ TRINA SOLAR LIMITED # MAGNETEK INC
GT SOLAR INTERNATIONAL ^ YINGLI GREEN ENERGY HLDG CO # MAXWELL TECHNOLOGIES INC
# Indicates cross-listed firms (i.e. those listed on both U.S. and European exchanges).^ Indicates firms with major operations outside the listing region.
40

Appendix B: Analysis of Natural Gas Firms
It is difficult to identify publically listed and globally operating firms that focus solely on
natural gas production due to the co-production relationship of petroleum and natural gas, which
leads to a difficulty in decomposing these companies’ stock outcomes into petroleum- and
natural gas-driven components. Moreover, the supply chain of natural gas is complex and there
are many other types of midstream companies present in gas markets that specialize in field
services and construction and operation of pipeline infrastructure. Here, we use Yahoo Finance
and Google Finance to supplement CRSP and Bloomberg data with daily information on prices
and volumes of 20 natural gas companies traded in the United States (five natural gas producers
and 15 midstream firms) and 37 natural gas companies traded on European exchanges (13
producers and 24 midstream companies). Additionally, we collect quarterly data on the number
of shares outstanding for all natural gas firms in the sample from YCharts’ historical database.
We exclude oil and gas majors from our analysis because of the above confounding effect.
Natural gas firms contained in our sample are listed in Table B2.
We replicate the analysis described in Section 2 of this manuscript for natural gas
portfolios and present results in Figure B1 and Table B1 below. From Figure B1, it appears that
U.S.-listed natural gas firms fared better than European-listed natural gas companies. However,
if we add up the daily return abnormalities that are statistically significant at the 5 percent level
or better during the 14 trading days following the earthquake, the combined magnitude of all
statistically significant abnormalities in U.S. and European markets is 1.6 and 0.1 percent,
respectively, which is rather negligible. In the United States, an abundance of economically
recoverable shale gas reserves has driven prices to record low levels, and it is surprising that we
do not observe U.S. investors rallying behind natural gas as the favored future source of energy.
One possible explanation is that U.S. natural gas prices began to decline in late 2008 (U.S. EIA),
and so U.S. financial markets likely absorbed the appeal of low-priced natural gas for electricity
generation well before the 2011 Fukushima incident. European markets, however, have long
remained dependent on pipeline supplies from Russia and the Middle East, as well as on more
expensive LNG deliveries from the Middle East and South East Asia. These sources are costly
in both political and economic terms, so investors in Europe might in general hold a less
optimistic view about natural gas-based electricity.
41

Figure B1: Cumulative abnormal returns of natural gas firms
-0.1
-0.08
-0.06
-0.04
-0.02
0
0.02a) All Natural Gas Firms
EU Natural GasUS Natural Gas
Trading day
Cum
ulati
ve a
bnor
mal
retu
rn
-0.1
-0.08
-0.06
-0.04
-0.02
0
0.02b) Cross-Listed Natural Gas Firms
EU Natural GasUS Natural Gas
Trading dayCu
mul
ative
abn
orm
al re
turn
-0.1
-0.08
-0.06
-0.04
-0.02
0
0.02c) Region-Specific Natural Gas Firms
EU Natural Gas
Trading day
Cum
ulati
ve a
bnor
mal
retu
rn
-0.1
-0.08
-0.06
-0.04
-0.02
0
0.02
d) Region-specific natural gas firms with major operations outside listing region
EU Natural Gas
Trading day
Cum
ulati
ve a
bnor
mal
retu
rn
42

Table B1: Daily abnormal returns, NATURAL GAS FIRMS
All Firms Cross-Listed firms Region-specific firms Region-specific firms with major operations outside of the listing
region(1) (2) (3) (4) (5) (6) (7) (8)
Trading day U.S. Europe U.S. Europe U.S. Europe U.S. Europe-5 0.005 0.003 0.005 -0.005 - 0.003 - -0.015
(0.768) (0.264) (0.768) (-0.403) (0.294) -(0.934)-4 0.002 -0.002 0.002 -0.006 - -0.002 - -0.012
(0.405) (-0.245) (0.406) (-0.526) (-0.216) -(0.777)-3 -0.009 0.003 -0.009 -0.001 - 0.003 - -0.001
(-1.573) (0.286) (-1.572) (-0.119) (0.300) -(0.089)-2 -0.008 0.002 -0.008 -0.001 - 0.002 - 0.003
(-1.351) (0.198) (-1.350) (-0.118) (0.210) (0.164)-1 0.002 0.005 0.002 -0.005 - 0.006 - 0.006
(0.311) (0.509) (0.313) (-0.392) (0.540) (0.412)0 -0.001 -0.014 -0.001 -0.015 - -0.014 - -0.015
(-0.216) (-1.427) (-0.216) (-1.325) (-1.374) -(0.963)1 0.001 -0.013 0.001 -0.005 - -0.014 - 0.023
(0.128) (-1.329) (0.128) (-0.406) (-1.326) (1.438)2 -0.003 -0.0001 -0.003 -0.007 - 0.0002 - -0.022
(-0.506) (-0.013) (-0.505) (-0.580) (0.018) -(1.402)3 0.016 *** -0.004 0.016 *** -0.007 - -0.004 - -0.007
(2.647) (-0.421) (2.646) (-0.558) (-0.397) -(0.449)4 0.007 -0.009 0.007 -0.001 - -0.009 - 0.002
(1.215) (-0.874) (1.214) (-0.104) (-0.876) (0.102)5 -0.002 0.023 ** -0.002 0.001 - 0.024 ** - 0.004
(-0.281) (2.250) (-0.281) (0.059) (2.292) (0.249)6 0.003 -0.011 0.003 -0.002 - -0.011 - 0.005
(0.472) (-1.041) (0.470) (-0.167) (-1.043) (0.317)7 0.001 -0.004 0.001 0.010 - -0.004 - -0.002
(0.186) (-0.349) (0.186) (0.897) (-0.403) -(0.113)8 -0.006 -0.022** -0.006 0.0002 - -0.023 ** - -0.014
(-0.955) (-2.199) (-0.954) (0.021) (-2.235) -(0.883)9 -0.002 0.007 -0.002 -0.0002 - 0.007 - -0.005
(-0.260) (0.664) (-0.261) (-0.015) (0.683) -(0.293)10 0.003 -0.002 0.003 0.003 - -0.002 - 0.004
(0.571) (-0.214) (0.571) (0.234) (-0.230) (0.231)11 -0.006 0.003 -0.006 0.015 - 0.003 - -0.041 ***
(-1.012) (0.326) (-1.011) (1.283) (0.259) -(2.628)12 -0.009 -0.002 -0.009 -0.016 - -0.001 - 0.013
(-1.522) (-0.204) (-1.521) (-1.388) (-0.124) (0.841)13 0.003 0.017 * 0.003 0.002 - 0.018 * - 0.015
(0.581) (1.648) (0.580) (0.141) (1.674) (0.984)14 0.003 -0.015 0.003 0.001 - -0.015 - 0.005
(0.569) (-1.449) (0.568) (0.101) (-1.477) (0.343)43

Note: z-statistics in parentheses. H0: the Fukushima crisis had no effect on daily returns of publically traded energy companies. Significance levels: * 10%, ** 5%, *** 1%.
Table B2: Natural gas firms included in empirical analysis
U.S. EUROPE# ATLAS PIPELINE PARTNERS L P ^* AJ LUCAS GROUP LTD
# BOARDWALK PIPELINE PARTNERS LP # ATLAS PIPIELINE PARTNERS LP
# CENTERPOINT ENERGY INC # BOARDWALK PIPELINE PARTNERS LP
# CHENIERE ENERGY PARTNERS L P ^ CANADINA UTILITIES LTD
# CHESAPEAKE MIDSTREAM PARTNERS LP # CENTERNPOINT EENERGY INC
# COPANO ENERGY L L C * CENTRICA PLC
# CRESTWOOD MIDSTREAM PARTNERS L P # CHENIERE ENERGY PARTNERS LP
# DCP MIDSTREAM PARTNERS L P # CHESAPEAKE MIDSTREAM PARTNERS LP
#* EL PASO CORP # COPANO ENERGY LLC
# ENERGY TRANSFER PARTNERS L P # CRESTWOOD MIDSTREAM PARTNERS LP
#* ONEOK INC # DCP MIDSTREAM PARTNERS LP
# ONEOK PARTNERS L P #* EL PASO CORP
#* QUESTAR CORP ENAGAS SA
# REGENCY ENERGY PARTNERS LP ^ ENERGY TRANSFER EQUITY LP
# SOUTHERN UNION CO # ENERGY TRANSFER PARTNERS LP
# SPECTRA ENERGY CORP FLUXYS
# TARGA RESOURCES PARTNERS LP ^ GAIL INDIA LTD
#* TRANSPORTADORA DE GAS DEL SUR SA GAS NATURAL SDG
# WESTERN GAS PARTNERS LP * GAS PLUS
#* WILLIAMS COS * GASOL PLC
# WILLIAMS PARTNERS L P ^ GREKA DRILLING LTD
LATVIJAS GAZE
* LIQUEFIED NATURAL GAS
#* ONEOK INC
# ONEOK PARTNERS LP
#* QUESTAR CORP
^# REGENCY ENERGY PARTNERS LP
# SOUTHERN UNION CO
# SPECTRA ENERGY CORP
# TARGA RESOURCES PARTNERS LP
#* TRANSPORTADORA DE GAS DEL SUR SA
^# WESTERN GAS PARTNERS LP
#* WILLIAMS COMPANIES
# WILLIAMS PARTNERS LP
* Indicates natural gas producers; non-starred entries denote midstream service firms in natural gas sector.# Indicates cross-listed firms (i.e. those listed on both U.S. and European exchanges).^ Indicates firms with major operations outside the listing region.
44