· Web viewStates derive their revenue primarily from sales and excise taxes and personal income...
39
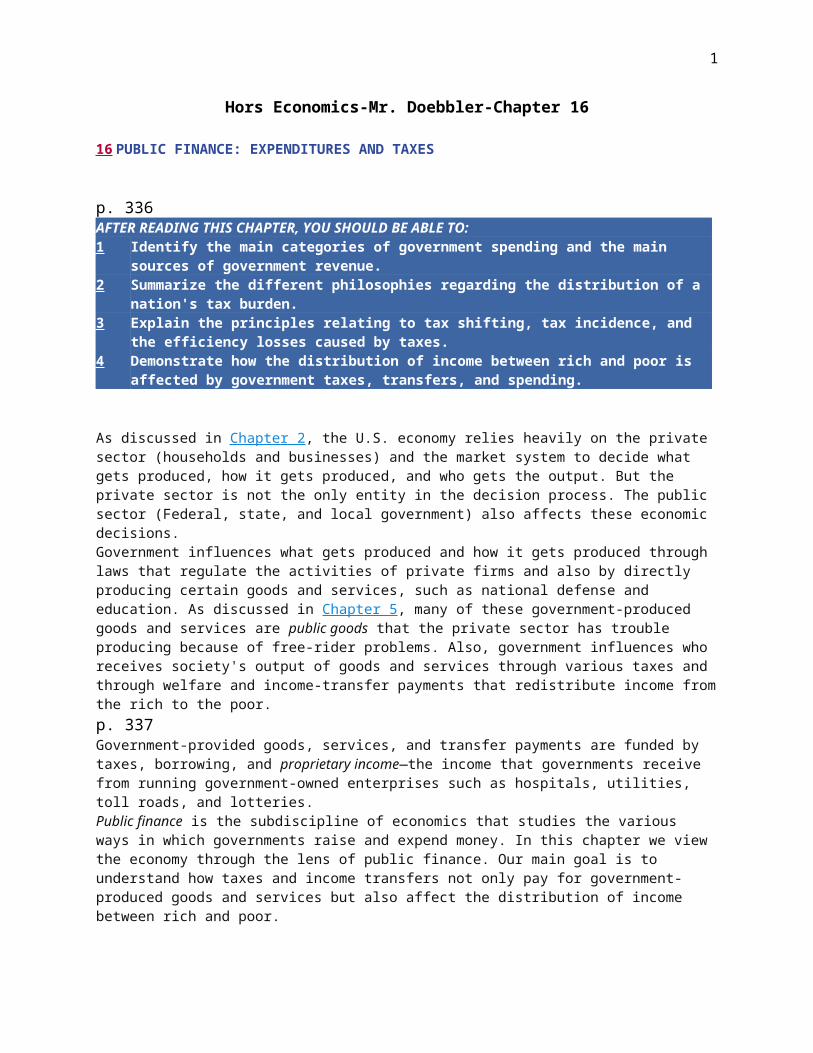
1 Hors Economics-Mr. Doebbler-Chapter 16 16 PUBLIC FINANCE: EXPENDITURES AND TAXES p. 336 AFTER READING THIS CHAPTER, YOU SHOULD BE ABLE TO: 1 Identify the main categories of government spending and the main sources of government revenue. 2 Summarize the different philosophies regarding the distribution of a nation's tax burden. 3 Explain the principles relating to tax shifting, tax incidence, and the efficiency losses caused by taxes. 4 Demonstrate how the distribution of income between rich and poor is affected by government taxes, transfers, and spending. As discussed in Chapter 2 , the U.S. economy relies heavily on the private sector (households and businesses) and the market system to decide what gets produced, how it gets produced, and who gets the output. But the private sector is not the only entity in the decision process. The public sector (Federal, state, and local government) also affects these economic decisions. Government influences what gets produced and how it gets produced through laws that regulate the activities of private firms and also by directly producing certain goods and services, such as national defense and education. As discussed in Chapter 5 , many of these government-produced goods and services are public goods that the private sector has trouble producing because of free-rider problems. Also, government influences who receives society's output of goods and services through various taxes and through welfare and income-transfer payments that redistribute income from the rich to the poor. p. 337 Government-provided goods, services, and transfer payments are funded by taxes, borrowing, and proprietary income—the income that governments receive from running government-owned enterprises such as hospitals, utilities, toll roads, and lotteries. Public finance is the subdiscipline of economics that studies the various ways in which governments raise and expend money. In this chapter we view the economy through the lens of public finance. Our main goal is to understand how taxes and income transfers not only pay for government- produced goods and services but also affect the distribution of income between rich and poor.
Transcript of · Web viewStates derive their revenue primarily from sales and excise taxes and personal income...
1
Hors Economics-Mr. Doebbler-Chapter 16
16 PUBLIC FINANCE: EXPENDITURES AND TAXES
p. 336AFTER READING THIS CHAPTER, YOU SHOULD BE ABLE TO:1 Identify the main categories of government spending and the main sources of
government revenue.2 Summarize the different philosophies regarding the distribution of a nation's tax
burden.3 Explain the principles relating to tax shifting, tax incidence, and the efficiency losses
caused by taxes.4 Demonstrate how the distribution of income between rich and poor is affected by
government taxes, transfers, and spending.
As discussed in Chapter 2, the U.S. economy relies heavily on the private sector (households and businesses) and the market system to decide what gets produced, how it gets produced, and who gets the output. But the private sector is not the only entity in the decision process. The public sector (Federal, state, and local government) also affects these economic decisions.Government influences what gets produced and how it gets produced through laws that regulate the activities of private firms and also by directly producing certain goods and services, such as national defense and education. As discussed in Chapter 5, many of these government-produced goods and services are public goods that the private sector has trouble producing because of free-rider problems. Also, government influences who receives society's output of goods and services through various taxes and through welfare and income-transfer payments that redistribute income from the rich to the poor.p. 337Government-provided goods, services, and transfer payments are funded by taxes, borrowing, and proprietary income—the income that governments receive from running government-owned enterprises such as hospitals, utilities, toll roads, and lotteries.Public finance is the subdiscipline of economics that studies the various ways in which governments raise and expend money. In this chapter we view the economy through the lens of public finance. Our main goal is to understand how taxes and income transfers not only pay for government-produced goods and services but also affect the distribution of income between rich and poor.
SummaryThe funds used to pay for government purchases and transfers come from taxes, proprietary income, and borrowing. The ability to borrow allows governments to maintain high spending during economic downturns, but government borrowing when the economy is doing well may “crowd out” private-sector investment.Government purchases exhaust (use up or absorb) resources; transfer payments do not. Government purchases have declined from about 22 percent of domestic output in 1960 to 20 percent today. Transfer payments, however, have grown rapidly. As a percentage of GDP, total government spending (purchases plus transfers) now stands at about 35 percent, up from 27 percent in 1960.The main categories of Federal spending are pensions and income security, national defense,

2
health, and interest on the public debt; Federal revenues come primarily from personal income taxes, payroll taxes, and corporate income taxes.States derive their revenue primarily from sales and excise taxes and personal income taxes; major state expenditures go to education, public welfare, health and hospitals, and highways. Local communities derive most of their revenue from property taxes; education is their most important expenditure. State and local tax revenues are supplemented by sizable revenue grants from the Federal government.Slightly over half of state and local government employees work in education. Just over half of Federal government employees work for either the postal service or in national defense.The benefits-received principle of taxation states that those who receive the benefits of goods and services provided by government should pay the taxes required to finance them. The ability-to-pay principle states that those who have greater income should be taxed more, absolutely and relatively, than those who have less income.The Federal personal income tax is progressive. The corporate income tax is roughly proportional. General sales, excise, payroll, and property taxes are regressive.Excise taxes affect supply and therefore equilibrium price and quantity. The more inelastic the demand for a product, the greater is the portion of an excise tax that is borne by consumers. The greater the inelasticity of supply, the larger is the portion of the tax that is borne by the seller.Taxation involves the loss of some output whose marginal benefit exceeds its marginal cost. The more elastic the supply and demand curves, the greater is the efficiency loss (or deadweight loss) resulting from a particular tax.
10. Some taxes are borne by those taxed; other taxes are shifted to someone else. The income tax, the payroll tax levied on workers, and the corporate income tax (in the short run) are borne by those taxed. In contrast, sales taxes are shifted to consumers, part of the payroll tax levied on employers is shifted to workers, and, in the long run, part of the corporate income tax is shifted to workers. Specific excise taxes may or may not be shifted to consumers, depending on the elasticities of demand and supply. Property taxes on owner-occupied property are borne by the owner; those on rental property are borne by tenants.
p. 355
11. The Federal tax structure is progressive; the state and local tax structure is regressive; and the overall tax structure is progressive.
12. As discussed in the Last Word, the overall tax-spending system in the United States redistributes significant amounts of income from high-income individuals to low-income individuals. Because of the highly progressive Federal income tax, the overall tax system is progressive. In addition, spending flows disproportionately to those with lower incomes, so that the tax collections from the rich are redistributed to the poor rather than being recycled back to the rich.
Government and the Circular FlowIn Figure 16.1 we integrate government into the circular flow model first shown in Figure 2.2. Here flows (1) through (4) are the same as the corresponding flows in that figure. Flows (1) and (2) show business expenditures for the resources provided by households. These expenditures are costs to businesses but represent wage, rent, interest, and profit income to households. Flows (3) and (4) show household expenditures for the goods and services produced by businesses.

3
FIGURE 16.1 Government within the circular flow diagram.
Government buys products from the product market and employs resources from the resource market to provide goods and services to households and businesses. Government finances its expenditures through the net taxes (taxes minus transfer payments) it receives from households and businesses.
p. 338
Now consider what happens when we add government. Flows (5) through (8) illustrate that government makes purchases in both product and resource markets. Flows (5) and (6) represent government purchases of such products as paper, computers, and military hardware from private businesses. Flows (7) and (8) represent government purchases of resources. The Federal government employs and pays salaries to members of Congress, the armed forces, Justice Department lawyers, meat inspectors, and so on. State and local governments hire and pay teachers, bus drivers, police, and firefighters. The Federal government might also lease or purchase land to expand a military base and a city might buy land on which to build a new elementary school.
Government then provides goods and services to both households and businesses, as shown by flows (9) and (10). Governments rely on three revenue sources to finance those goods and services: taxes, borrowing, and the proprietary income generated by government-run or government-sponsored businesses like public utilities and state lotteries. These revenues flowing from households and businesses to government are included in flows (11) and (12), which are labeled as “net taxes” for two reasons. First, the vast majority of the money raised by these three revenue sources comes from taxes; thus, it is sensible to have these labels refer to taxes. Second, the labels

4
refer to net taxes to indicate that they also include “taxes in reverse” in the form of transfer payments to households and subsidies to businesses. Thus, flow (11) entails various subsidies to farmers, shipbuilders, and airlines as well as income, sales, and excise taxes paid by businesses to government. Most subsidies to business are “concealed” in the form of low-interest loans, loan guarantees, tax concessions, or public facilities provided at prices below their cost. Similarly, flow (12) includes not only taxes (personal income taxes, payroll taxes) collected by government from households but also transfer payments made by government to households. These include welfare payments and Social Security benefits.
Government FinanceHow large is the U.S. public sector? What are the main expenditure categories of Federal, state, and local governments? How are these expenditures financed?
Government Purchases and TransfersWe can get an idea of the size of government's economic role by examining government purchases of goods and services and government transfer payments. There is a significant difference between these two kinds of outlays:
Government purchases Expenditures by government for goods and services that government consumes
in providing public goods and for public capital that has a long lifetime; the expenditures of all governments
in the economy for those final goods and services. are exhaustive; the products purchased directly
absorb (require the use of) resources and are part of the domestic output. For example, the purchase of a missile absorbs the labor of physicists and engineers along with steel, explosives, and a host of other inputs.
Transfer payments A payment of money (or goods and services) by a government to a household or firm
for which the payer receives no good or service directly in return. are nonexhaustive; they do not directly
absorb resources or create output. Social Security benefits, welfare payments, veterans' benefits, and unemployment compensation are examples of transfer payments. Their key characteristic is that recipients make no current contribution to domestic output in return for them.Federal, state, and local governments spent $4989 billion (roughly $5 trillion) in 2009. Of that total, government purchases were $2855 billion and government transfers were $2134 billion.Figure 16.2 shows these amounts as percentages of U.S. domestic output for 2009 and compares them to percentages for 1960. Government purchases have declined from about 22 to 20 percent of output since 1960. But transfer payments have tripled as a percentage of output—from 5 percent in 1960 to about 15 percent in 2009. Relative to U.S. output, total government spending is thus higher today than it was 49 years earlier. This means that the tax revenues required to finance government expenditures are also higher. Today, government spending and the tax revenues needed to finance it are about 35 percent of U.S. output.
FIGURE 16.2Government purchases, transfers, and total spending as percentages of U.S. output, 1960 and 2009.

5
Government purchases have declined as a percentage of U.S. output since 1960. Transfer payments, however, have increased by more than this drop, raising total government spending (purchases plus transfers) from 27 percent of U.S. GDP in 1960 to about 35 percent today.Source: Compiled from Bureau of Economic Analysis data, www.bea.gov.
In 2010 the so-called Tax Freedom Day in the United States was April 9. On that day the average worker had earned enough (from the start of the year) to pay his or her share of the taxes required to finance government spending for the year. Tax Freedom Day arrives even later in several other countries, as implied in Global Perspective 16.1.p. 339
GLOBAL PERSPECTIVE 16.1
Total Tax Revenue as a Percentage of Total Output, Selected Nations, 2008 *
A nation's “tax burden” is its tax revenue from all levels of government as a percentage of its total output (GDP). Among the world's industrialized nations, the United States has a very moderate tax burden.

6
* Includes government nontax revenue from fees, charges, fines and sales of government property.Source: OECD database, Revenue Statistics 1965–2008, 2009, OECD, accessed May 10, 2010.
Government RevenuesThe funds used to pay for government purchases and transfers come from three sources: taxes, proprietary income, and funds that are borrowed by selling bonds to the public.
Government Borrowing and Deficit SpendingThe ability to borrow allows a government to spend more in a given time period than it collects in tax revenues and proprietary income during that period. This flexibility is useful during an economic downturn because a government can use borrowed funds to maintain high levels of spending on goods, services, and transfer payments even if tax revenues and proprietary income are falling due to the slowing economy.
Any money borrowed by a government, however, is money that cannot be put to other uses. During an economic downturn, this opportunity cost is likely to be small because any funds that the government does not borrow are likely to sit idle and unused by other parties due to the lack of economic activity during the downturn. But if the government borrows when the economy is doing well, many economists worry that the opportunity cost may be high. In particular, the government's borrowing may “crowd out” private-sector investment. As an example, a billion dollars borrowed and spent by the Federal government on roads is a billion dollars that was not lent to private companies to fund the expansion of factories or the development of new technologies.
Government spending that is financed by borrowing is often referred to as deficit spending,because a government's budget is said to be “in deficit” if the government's spending in a given time period exceeds the money that it collects from taxes and proprietary income during that period.
Federal FinanceNow let's look separately at each of the Federal, state, and local units of government in the United States and compare their expenditures and taxes. Figure 16.3 tells the story for the Federal government.p. 340

7
FIGURE 16.3 Federal expenditures and tax revenues, 2009.
Federal expenditures are dominated by spending for pensions and income security, health, and national defense. A full 85 percent of Federal tax revenue is derived from just two sources: the personal income tax and payroll taxes. The $1417 billion difference between expenditures and revenues reflects a budget deficit.Source: U.S. Treasury, Combined Statement of Receipts, Outlays, and Balances, 2009, fms.treas.gov.

8
Federal ExpendituresFour areas of Federal spending stand out: (1) pensions and income security, (2) national defense, (3) health, and (4) interest on the public debt. The pensions and income securitycategory includes the many income-maintenance programs for the aged, persons with disabilities or handicaps, the unemployed, the retired, and families with no breadwinner. This category—dominated by the $683 billion pension portion of the Social Security program—accounts for 35 percent of total Federal expenditures. National defense accounts for about 19 percent of the Federal budget, underscoring the high cost of military preparedness. Health reflects the cost of government health programs for the retired (Medicare) and poor (Medicaid). Interest on the public debt accounts for 5 percent of Federal spending.Federal Tax RevenuesThe revenue side of Figure 16.3 shows that the personal income tax, payroll taxes, and the corporate income tax are the largest revenue sources, accounting respectively for 43, 42, and 7 cents of each dollar collected.
Personal Income Tax The personal income tax A tax levied on the taxable income of individuals,
households, and unincorporated firms. is the kingpin of the Federal tax system and merits special
comment. This tax is levied on taxable income, that is, on the incomes of households and unincorporated businesses after certain exemptions ($3650 for each household member) and deductions (business expenses, charitable contributions, home mortgage interest payments, certain state and local taxes) are taken into account.The Federal personal income tax is a progressive tax, meaning that people with higher incomes pay a larger percentage of their incomes as taxes than do people with lower incomes. The progressivity is achieved by applying higher tax rates to successive layers or brackets of income.Columns 1 and 2 in Table 16.1 show the mechanics of the income tax for a married couple filing a joint return in 2010. Note that a 10 percent tax rate applies to all taxable income up to $16,750 and a 15 percent rate applies to additional income up to $68,000. The rates on additional layers of income then go up to 25, 28, 33, and 35 percent.
TABLE 16.1 Federal Personal Income Tax Rates, 2010*
*For a married couple filing a joint return.

9
The tax rates shown in column 2 in Table 16.1 are marginal tax rates. A marginal tax rate The tax
rate paid on an additional dollar of income. is the rate at which the tax is paid on each additional unit
of taxable income. Thus, if a couple's taxable income is $80,000, they will pay the marginal rate of 10 percent on each dollar from $1 to $16,750, 15 percent on each dollar from $16,751 to $68,000, and 25 percent on each dollar from $68,001 to $80,000. You should confirm that their total income tax is $12,362.The marginal tax rates in column 2 overstate the personal income tax bite because the rising rates in that column apply only to the income within each successive tax bracket. To get a better idea of the
tax burden, we must consider average tax rates. The average tax rate Total tax paid divided by total
taxable income or some other base (such as total income) against which to compare the amount of tax paid.
Expressed as a percentage. is the total tax paid divided by total taxable income. The couple in our
previous example is in the 25 percent tax bracket because they pay a top marginal tax rate of 25 percent on the highest dollar of their income. But their average tax rate is 15 percent (= $12,362/$80,000).
WORKED PROBLEMS
W 16.1Taxes and progressivity
p. 341
As we will discuss in more detail shortly, a tax whose average rate rises as income increases is said to be a progressive tax because it claims both a progressively larger absolute amount of income as well as a progressively larger proportion of income as income rises. Thus we can say that the Federal personal income tax is progressive.
Payroll Taxes Social Security contributions are payroll taxes A tax levied on employers of labor
equal to a percentage of all or part of the wages and salaries paid by them and on employees equal to a
percentage of all or part of the wages and salaries received by them. —taxes based on wages and
salaries—used to finance two compulsory Federal programs for retired workers: Social Security (an income-enhancement program) and Medicare (which pays for medical services). Employers and employees pay these taxes equally. In 2010, employees and employers each paid 7.65 percent on the first $106,800 of an employee's annual earnings and 1.45 percent on all additional earnings.Corporate Income Tax The Federal government also taxes corporate income. The corporate income tax A tax levied on the net income (accounting profit) of corporations. is levied on a corporation's
profit—the difference between its total revenue and its total expenses. For almost all corporations, the tax rate is 35 percent.
Excise Taxes Taxes on commodities or on purchases take the form of sales and excise taxes A
tax levied on the cost (at retail) of a broad group of products. A tax levied on the production of a specific
product or on the quantity of the product purchased. .The two differ primarily in terms of coverage.
Sales taxes fall on a wide range of products, whereas excises are levied individually on a small, select list of commodities. An additional difference is that sales taxes are calculated as a percentage

10
of the price paid for a product, whereas excise taxes are levied on a per-unit basis—for example, $2 per pack of cigarettes or $.50 per gallon of gasoline.As Figure 16.3 suggests, the Federal government collects excise taxes of various rates (on the sale of such commodities as alcoholic beverages, tobacco, and gasoline) but does not levy a general sales tax; sales taxes are, however, the primary revenue source of most state governments.
Local, State, and Federal EmploymentIn 2008, U.S. governments (local, state, and Federal) employed about 19.4 million workers, or about 13 percent of the U.S. labor force. Figure 16.6 shows the percentages of these government employees assigned to different tasks at both the Federal level and the state and local level.
FIGURE 16.6 Job functions of state and local employees and Federal employees, 2008.

11
A majority of state and local workers are employed in education. Federal employment is dominated by the postal service and national defense, which together employ just over half of Federal employees.Source: U.S. Census Bureau, State and Local Government Employment and Payroll Data, by State and Function, and Federal Government Employment by Function, www.census.gov.
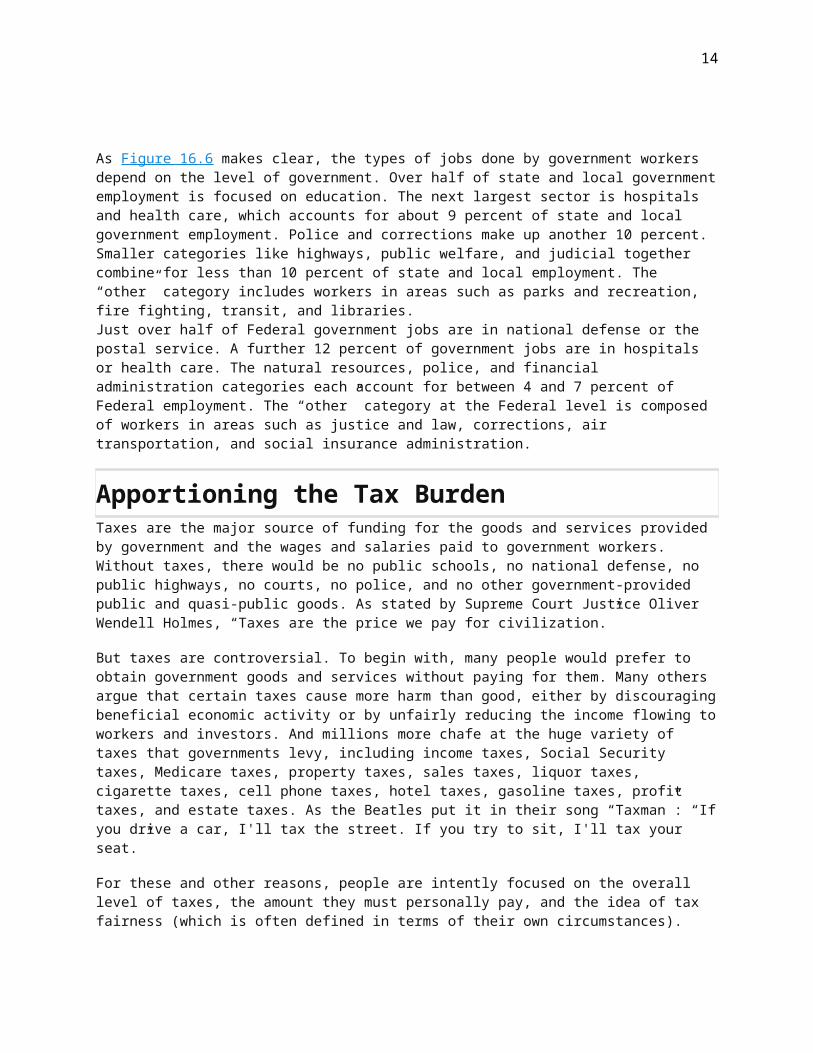
As Figure 16.6 makes clear, the types of jobs done by government workers depend on the level of government. Over half of state and local government employment is focused on education. The next largest sector is hospitals and health care, which accounts for about 9 percent of state and local government employment. Police and corrections make up another 10 percent. Smaller categories like highways, public welfare, and judicial together combine for less than 10 percent of state and local employment. The “other” category includes workers in areas such as parks and recreation, fire fighting, transit, and libraries.Just over half of Federal government jobs are in national defense or the postal service. A further 12 percent of government jobs are in hospitals or health care. The natural resources, police, and financial administration categories each account for between 4 and 7 percent of Federal employment. The “other” category at the Federal level is composed of workers in areas such as justice and law, corrections, air transportation, and social insurance administration.
Apportioning the Tax BurdenTaxes are the major source of funding for the goods and services provided by government and the wages and salaries paid to government workers. Without taxes, there would be no public schools, no national defense, no public highways, no courts, no police, and no other government-provided public and quasi-public goods. As stated by Supreme Court Justice Oliver Wendell Holmes, “Taxes are the price we pay for civilization.”
But taxes are controversial. To begin with, many people would prefer to obtain government goods and services without paying for them. Many others argue that certain taxes cause more harm than good, either by discouraging beneficial economic activity or by unfairly reducing the income flowing

12
to workers and investors. And millions more chafe at the huge variety of taxes that governments levy, including income taxes, Social Security taxes, Medicare taxes, property taxes, sales taxes, liquor taxes, cigarette taxes, cell phone taxes, hotel taxes, gasoline taxes, profit taxes, and estate taxes. As the Beatles put it in their song “Taxman”: “If you drive a car, I'll tax the street. If you try to sit, I'll tax your seat.”
For these and other reasons, people are intently focused on the overall level of taxes, the amount they must personally pay, and the idea of tax fairness (which is often defined in terms of their own circumstances).
The public's attention to taxes has spurred public finance economists to undertake considerable research into the size, distribution, and impact of the total costs that taxes impose on society—the so-called tax burden. Their investigations reveal with reasonable clarity both the size of the tax burden as well as how it is apportioned across the income distribution.
Whether you consider their findings to be good news or bad news, however, depends significantly on your opinion about the fairest way to allocate taxes and the tax burden. So before turning to their findings, let's first discuss some of the major philosophical viewpoints regarding taxation.
Benefits Received versus Ability to PayTwo basic philosophies coexist on how the economy's tax burden should be apportioned.
Benefits-Received Principle The benefits-received principle The idea that those who receive the
benefits of goods and services provided by government should pay the taxes required to finance them. of
taxation asserts that households should purchase the goods and services of government in the same way they buy other commodities. Those who benefit most from government-supplied goods or services should pay the taxes necessary to finance them. A few public goods are now financed on this basis. For example, money collected as gasoline taxes is typically used to finance highway construction and repairs. Thus people who benefit from good roads pay the cost of those roads. Difficulties immediately arise, however, when we consider widespread application of the benefits-received principle:
How will the government determine the benefits that individual households and businesses receive from national defense, education, the court system, and police and fire protection? Recall from Chapter 5 that public goods are characterized by nonrivalry and nonexcludability. So benefits from public goods are especially widespread and diffuse. Even in the seemingly straightforward case of highway financing it is difficult to measure benefits. Good roads benefit owners of cars in different degrees. But others also benefit. For example, businesses benefit because good roads bring them workers and customers.
The benefits-received principle cannot logically be applied to income redistribution programs. It would be absurd and self-defeating to ask poor families to pay the taxes needed to finance their welfare payments. It would also be self-defeating to tax only unemployed workers to finance the unemployment benefits they receive.
Ability-to-Pay Principle The ability-to-pay principle The idea that those who have greater income
(or wealth) should pay a greater proportion of it as taxes than those who have less income (or wealth). of
taxation asserts that the tax burden should be apportioned according to taxpayers' income and wealth. In practice, this means that individuals and businesses with larger incomes should pay more taxes in both absolute and relative terms than those with smaller incomes.

13
In justifying the ability-to-pay principle, proponents contend that each additional dollar of income received by a household yields a smaller amount of satisfaction or marginal utility when it is spent. Because consumers act rationally, the first dollars of income received in any time period will be spent on high-urgency goods that yield the greatest marginal utility. Successive dollars of income will go for less urgently needed goods and finally for trivial goods and services. This means that a dollar taken through taxes from a poor person who has few dollars represents a greater utility sacrifice than a dollar taken through taxes from a rich person who has many dollars. To balance the sacrifices that taxes impose on income receivers, taxes should be apportioned according to the amount of income a taxpayer receives.
p. 345
This argument is appealing, but application problems arise here too. Although we might agree that the household earning $100,000 per year has a greater ability to pay taxes than a household receiving $10,000, we don't know exactly how much more ability to pay the first family has. Should the wealthier family pay the same percentage of its larger income, and hence a larger absolute amount, as taxes? Or should it be made to pay a larger percentage of its income as taxes? And how much larger should that percentage be? Who is to decide?There is no scientific way of making utility comparisons among individuals and thus of measuring someone's relative ability to pay taxes. That is the main problem. In practice, the solution hinges on guesswork, the tax views of the political party in power, expediency, and how urgently the government needs revenue.
Progressive, Proportional, and Regressive TaxesAny discussion of taxation leads ultimately to the question of tax rates. Taxes are classified as progressive, proportional, or regressive, depending on the relationship between average tax rates and taxpayer incomes. We focus on incomes because all taxes—whether on income, a product, a building, or a parcel of land—are ultimately paid out of someone's income.
A tax is progressive A tax whose average tax rate increases as the taxpayer's income increases and
decreases as the taxpayer's income decreases. if its average rate increases as income increases.
Such a tax claims not only a larger absolute (dollar) amount but also a larger percentage of income as income increases.
A tax is regressive A tax whose average tax rate decreases as the taxpayer's income increases and
increases as the taxpayer's income decreases. if its average rate declines as income increases. Such
a tax takes a smaller proportion of income as income increases. A regressive tax may or may not take a larger absolute amount of income as income increases. (You may want to derive an example to substantiate this fact.)
A tax is proportional A tax whose average tax rate remains constant as the taxpayer's income increases
or decreases. if its average rate remains the same regardless of the size of income. Proportional
income taxes are often referred to as flat taxes or flat-rate taxes because their average rates do not vary with (are flat with respect to) income levels.We can illustrate these ideas with the personal income tax. Suppose tax rates are such that a household pays 10 percent of its income in taxes regardless of the size of its income. This is aproportional income tax. Now suppose the rate structure is such that a household with an annual taxable income of less than $10,000 pays 5 percent in income taxes; a household with an income of $10,000 to $20,000 pays 10 percent; one with a $20,000 to $30,000 income pays 15 percent; and so forth. This is a progressive income tax. Finally, suppose the rate declines as taxable income rises:
14
You pay 15 percent if you earn less than $10,000; 10 percent if you earn $10,000 to $20,000; 5 percent if you earn $20,000 to $30,000; and so forth. This is a regressive income tax.In general, progressive taxes are those that fall relatively more heavily on people with high incomes; regressive taxes are those that fall relatively more heavily on the poor.
Applications Let's examine the progressivity, or regressivity, of several taxes.Personal Income Tax As noted earlier, the Federal personal income tax is progressive, with marginal tax rates (those assessed on additional income) ranging from 10 to 35 percent in 2010. Rules that allow individuals to deduct from income interest on home mortgages and property taxes and that exempt interest on state and local bonds from taxation tend to make the tax less progressive than these marginal rates suggest. Nevertheless, average tax rates rise with income.Sales Taxes At first thought, a general sales tax with, for example, a 5 percent rate would seem to be proportional. But in fact it is regressive with respect to income. A larger portion of a low-income person's income is exposed to the tax than is the case for a high-income person; the rich pay no tax on the part of income that is saved, whereas the poor are unable to save. Example: “Low-income” Smith has an income of $15,000 and spends it all. “High-income” Jones has an income of $300,000 but spends only $200,000 and saves the rest. Assuming a 5 percent sales tax applies to all expenditures of each individual, we find that Smith pays $750 (5 percent of $15,000) in sales taxes and Jones pays $10,000 (5 percent of $200,000). But Smith pays $750/$15,000, or 5 percent of income as sales taxes while Jones pays $10,000/$300,000, or 3.3 percent of income. The general sales tax therefore is regressive.Corporate Income Tax The Federal corporate income tax is essentially a proportional tax with a flat 35 percent tax rate. In the short run, the corporate owners (shareholders) bear the tax through lower dividends and share values. In the long run, workers may bear some of the tax since it reduces the return on investment and therefore slows capital accumulation. It also causes corporations to relocate to other countries that have lower tax rates. With less capital per worker, U.S. labor productivity may decline and wages may fall. To the extent this happens, the corporate income tax may be somewhat regressive.p. 346
Payroll Taxes Payroll taxes are taxes levied upon wages and salaries by certain states as well as by the Federal government. The Federal payroll tax is known as the FICA tax after the Federal Insurance Contributions Act, which mandated one payroll tax to fund the Social Security program and another to fund the Medicare program.Both taxes are split equally between employer and employee. Thus, the 12.4 percent Social Security tax is split in half, with 6.2 percent paid by employees and an additional 6.2 percent paid by employers. In the same way, the 2.9 percent Medicare tax is also split in half, with 1.45 percent paid by employees and 1.45 percent paid by employers.
Crucially, however, only the Medicare tax applies to all wage and salary income without limit. The Social Security tax, by contrast, is “capped,” meaning that it applies only up to a certain limit, or cap. In 2010, the cap was $106,800.
The fact that the Social Security tax applies only on income below the cap implies that the FICA tax is regressive. To see this, consider a person with $106,800 in wage income. He would pay $8170.20, or 7.65 percent (= 6.2 percent + 1.45 percent) of his wages in FICA taxes. By contrast, someone with twice that income, or $213,600, would pay $9718.80 (= $8170.20 on the first $106,800 + $1548.60 on the second $106,800), which is only 4.6 percent of his wage income. Thus the average FICA tax falls as income rises, thereby confirming that the FICA tax is regressive.
But payroll taxes are even more regressive than suggested by this example because they only apply to wage and salary income. People earning high incomes tend to derive a higher percentage of their

15
total incomes from nonwage sources like rents and dividends than do people who have incomes below the $106,800 cap on which Social Security taxes are paid. Thus, if our individual with the $213,600 of wage income also received $213,600 of nonwage income, his $9718.80 of FICA tax would be only 2.2 percent of his total income of $427,200.
Property Taxes Most economists conclude that property taxes on buildings are regressive for the same reasons as are sales taxes. First, property owners add the tax to the rents that tenants are charged. Second, property taxes, as a percentage of income, are higher for low-income families than for high-income families because the poor must spend a larger proportion of their incomes for housing.
CONSIDER THIS …

16
The VAT: A Very Alluring Tax?
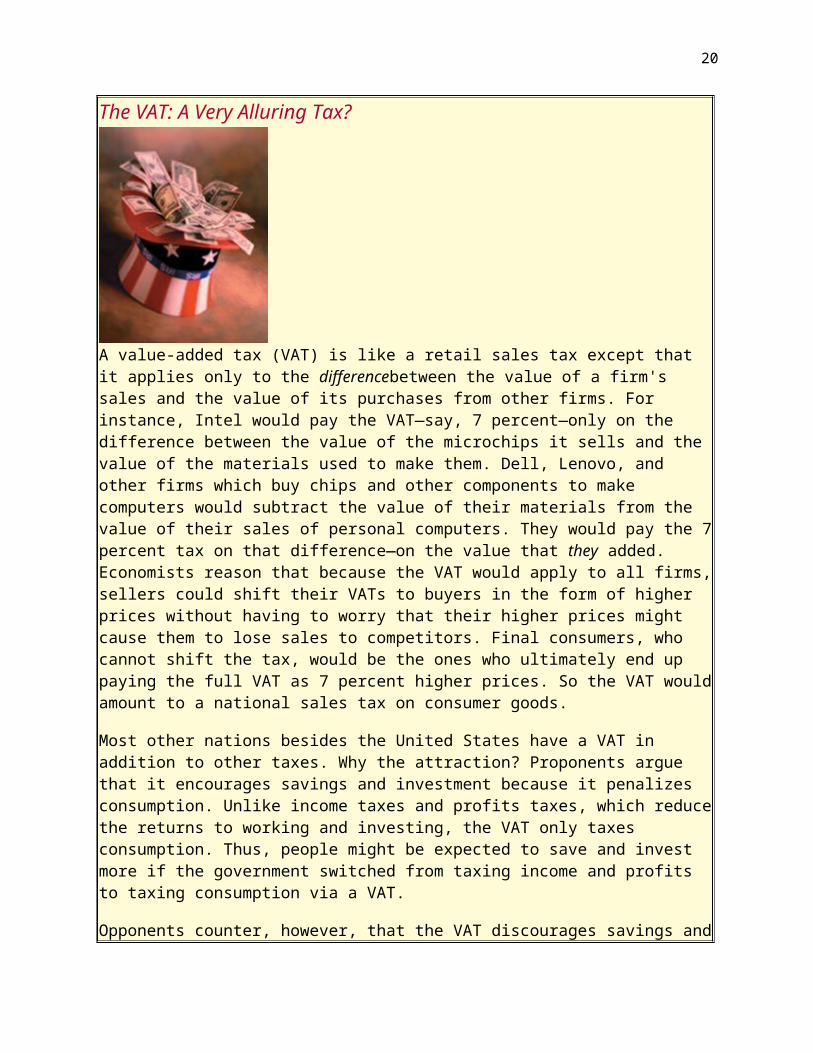
A value-added tax (VAT) is like a retail sales tax except that it applies only to the differencebetween the value of a firm's sales and the value of its purchases from other firms. For instance, Intel would pay the VAT—say, 7 percent—only on the difference between the value of the microchips it sells and the value of the materials used to make them. Dell, Lenovo, and other firms which buy chips and other components to make computers would subtract the value of their materials from the value of their sales of personal computers. They would pay the 7 percent tax on that difference—on the value that they added.Economists reason that because the VAT would apply to all firms, sellers could shift their VATs to buyers in the form of higher prices without having to worry that their higher prices might cause them to lose sales to competitors. Final consumers, who cannot shift the tax, would be the ones who ultimately end up paying the full VAT as 7 percent higher prices. So the VAT would amount to a national sales tax on consumer goods.
Most other nations besides the United States have a VAT in addition to other taxes. Why the attraction? Proponents argue that it encourages savings and investment because it penalizes consumption. Unlike income taxes and profits taxes, which reduce the returns to working and investing, the VAT only taxes consumption. Thus, people might be expected to save and invest more if the government switched from taxing income and profits to taxing consumption via a VAT.
Opponents counter, however, that the VAT discourages savings and investment just as much as do income and profit taxes because the whole point of working hard, saving, and investing is the ability to reward yourself in the future with increased consumption. By making consumption more expensive, the VAT reduces this future reward. Also, because VATs are regressive, opponents argue that VATs lead to higher and more progressive income taxes as governments try to use the progressivity of income taxes to counter the regressivity of the VAT. Finally, critics note that the VAT is deeply buried within product prices and therefore is ahidden tax. Such taxes are usually easier to increase than other taxes and therefore can result in excessively large government.
17
Tax Incidence and Efficiency Lossp. 347
Determining whether a particular tax is progressive, proportional, or regressive is complicated because those on whom taxes are levied do not always pay the taxes. This is true because some or all of the value of the tax may be passed on to others. We therefore need an understanding oftax incidence The degree to which a tax falls on a particular person or group. , the degree to which a tax
falls on a particular person or group. The tools of elasticity of supply and demand will help. Let's focus on a hypothetical excise tax levied on wine producers. Do the producers really pay this tax, or is some fraction of the tax shifted to wine consumers?Elasticity and Tax IncidenceIn Figure 16.7, S and D represent the pretax market for a certain domestic wine; the no-tax equilibrium price and quantity are $8 per bottle and 15 million bottles. Suppose that government levies an excise tax of $2 per bottle at the winery. Who will actually pay this tax?
FIGURE 16.7 The incidence of an excise tax.
An excise tax of a specified amount (here, $2 per unit) shifts the supply curve upward by the amount of the tax per unit: the vertical distance between S and St. This results in a higher price (here, $9) to consumers and a lower after-tax price (here, $7) to producers. Thus consumers and producers share the burden of the tax in some proportion (here, equally at $1 per unit).

18
Division of Burden Since the government imposes the tax on the sellers (suppliers), we can view the tax as an addition to the marginal cost of the product. Now sellers must get $2 more for each bottle to receive the same per-unit profit they were getting before the tax. While sellers are willing to offer, for example, 5 million bottles of untaxed wine at $4 per bottle, they must now receive $6 per bottle (= $4 + $2 tax) to offer the same 5 million bottles. The tax shifts the supply curve upward (leftward) as shown in Figure 16.7, where St is the “after-tax” supply curve.The after-tax equilibrium price is $9 per bottle, whereas the before-tax equilibrium price was $8. So, in this case, consumers pay half the $2 tax as a higher price; producers pay the other half in the form of a lower after-tax per-unit revenue. That is, after remitting the $2 tax per unit to government, producers receive $7 per bottle, or $1 less than the $8 before-tax price. So, in this case, consumers and producers share the burden of the tax equally: Half of the $2 per bottle tax is shifted to consumers in the form of a higher price and half is paid by producers.
INTERACTIVE GRAPHS
G 16.1Tax incidence
Note also that the equilibrium quantity declines because of the tax levy and the higher price that it imposes on consumers. In Figure 16.7 that decline in quantity is from 15 million bottles to 12.5 million bottles per month.Elasticities If the elasticities of demand and supply were different from those shown in Figure 16.7, the incidence of tax would also be different. Two generalizations are relevant.With a specific supply, the more inelastic the demand for the product, the larger is the portion of the tax shifted to consumers. To verify this, sketch graphically the extreme cases in which demand is perfectly elastic and perfectly inelastic. In the first case, the incidence of the tax is entirely on sellers; in the second, the tax is shifted entirely to consumers.
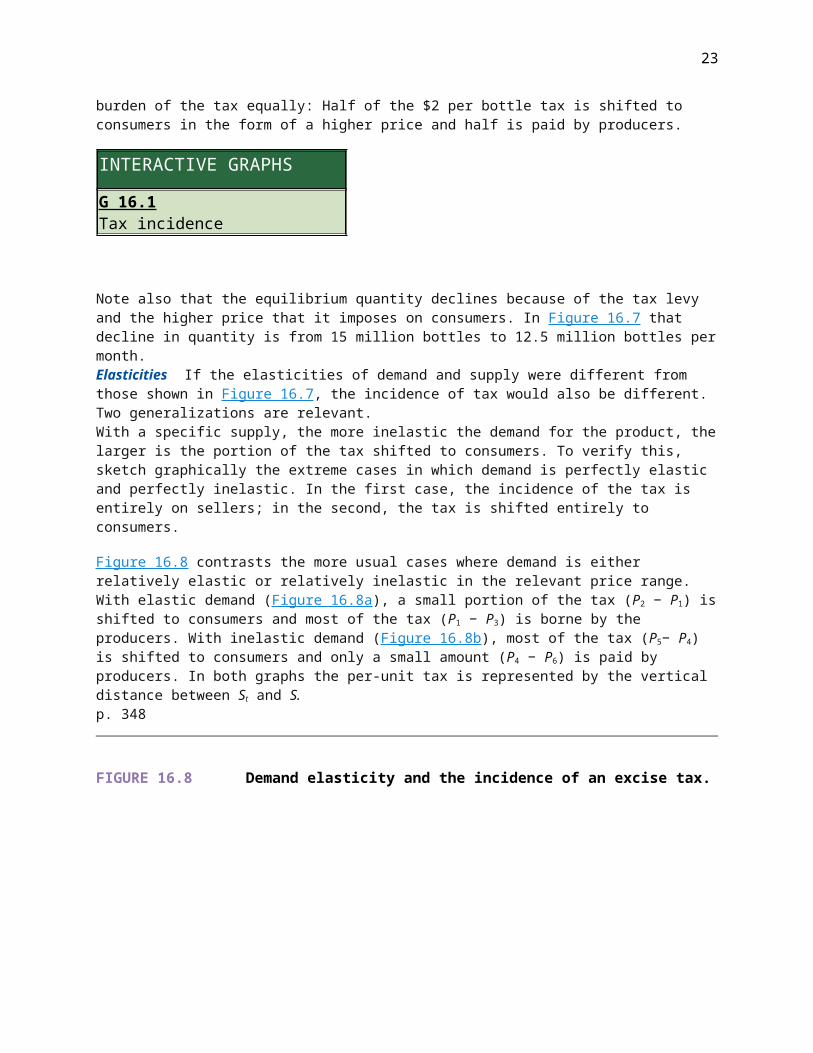
Figure 16.8 contrasts the more usual cases where demand is either relatively elastic or relatively inelastic in the relevant price range. With elastic demand (Figure 16.8a), a small portion of the tax (P2 − P1) is shifted to consumers and most of the tax (P1 − P3) is borne by the producers. With inelastic demand (Figure 16.8b), most of the tax (P5− P4) is shifted to consumers and only a small amount (P4 − P6) is paid by producers. In both graphs the per-unit tax is represented by the vertical distance between St and S.p. 348
FIGURE 16.8 Demand elasticity and the incidence of an excise tax.
19
(a) If demand is elastic in the relevant price range, price rises modestly (P1 to P2) when an excise tax is levied. Hence, the producers bear most of the tax burden. (b) If demand is inelastic, the price increases substantially (P4 to P5) and most of the tax is borne by consumers.
Note also that the decline in equilibrium quantity (from Q1 to Q2 in Figure 16.8a and from Q4 toQ5 in Figure 16.8b) is smaller when demand is more inelastic. This is the basis of our previous applications of the elasticity concept to taxation in earlier chapters: Revenue-seeking legislatures place heavy excise taxes on liquor, cigarettes, automobile tires, telephone service, and other products whose demand is thought to be inelastic. Since demand for these products is relatively inelastic, the tax does not reduce sales by much, so the tax revenue stays high.The second generalization is that, with a specific demand, the more inelastic the supply, the larger is the portion of the tax borne by producers. When supply is elastic (Figure 16.9a), consumers bear most of the tax (P2 − P1) while producers bear only a small portion (P1 − P3) themselves. But where supply is inelastic (Figure 16.9b), the reverse is true: The major portion of the tax (P4 − P6) falls on sellers, and a relatively small amount (P5 − P4) is shifted to buyers. The equilibrium quantity also declines less with an inelastic supply than it does with an elastic supply.
FIGURE 16.9 Supply elasticity and the incidence of an excise tax.
20
(a) With elastic supply, an excise tax results in a large price increase (P1 to P2) and the tax is therefore paid mainly by consumers. (b) If supply is inelastic, the price rise is small (P4 to P5) and sellers bear most of the tax.
Gold is an example of a product with an inelastic supply and therefore one where the burden of an excise tax (such as an extraction tax) would mainly fall on producers. On the other hand, because the supply of baseballs is relatively elastic, producers would pass on to consumers much of an excise tax on baseballs.
Efficiency Loss of a TaxWe just observed that producers and consumers typically each bear part of an excise tax levied on producers. Let's now look more closely at the overall economic effect of the excise tax. Consider Figure 16.10, which is identical to Figure 16.7 but contains the additional detail we need for our discussion.p. 349
FIGURE 16.10 Efficiency loss (or deadweight loss) of a tax.

21
The levy of a $2 tax per bottle of wine increases the price per bottle from $8 to $9 and reduces the equilibrium quantity from 15 million to 12.5 million. Tax revenue to the government is $25 million (areaefac). The efficiency loss of the tax arises from the 2.5 million decline in output; the amount of that loss is shown as triangle abc.
Tax Revenues In our example, a $2 excise tax on wine increases its market price from $8 to $9 per bottle and reduces the equilibrium quantity from 15 million bottles to 12.5 million. Government tax revenue is $25 million (=$2 × 12.5 million bottles), an amount shown as the rectangle efac inFigure 16.10. The elasticities of supply and demand in this case are such that consumers and producers each pay half this total amount, or $12.5 million apiece (= $1 × 12.5 million bottles). The government uses this $25 million of tax revenue to provide public goods and services. So this transfer of dollars from consumers and producers to government involves no loss of well-being to society.Efficiency Loss The $2 tax on wine does more than require consumers and producers to pay $25 million of taxes; it also reduces the equilibrium amount of wine produced and consumed by 2.5 million bottles. The fact that consumers and producers demanded and supplied 2.5 million more bottles of wine before the tax means that those 2.5 million bottles provided benefits in excess of their production costs. This is clear from the following analysis.Segment ab of demand curve D in Figure 16.10 indicates the willingness to pay—the marginal benefit—associated with each of the 2.5 million bottles consumed before (but not after) the tax. Segment cb of supply curve S reflects the marginal cost of each of the bottles of wine. For all but the very last one of these 2.5 million bottles, the marginal benefit (shown by a point on ab) exceeds the marginal cost (shown by a point on cb). Not producing these 2.5 million bottles of wine reduces well-being by an amount represented by the triangle abc. The area of this triangle identifies
the efficiency loss of the tax The loss of net benefits to society because a tax reduces the production
and consumption of a taxed good below the level of allocative efficiency. Also called the deadweight loss of

22
the tax. (also called the deadweight loss of the tax). This loss is society's sacrifice of net benefit,
because the tax reduces production and consumption of the product below their levels of economic efficiency, where marginal benefit and marginal cost are equal.Role of Elasticities Most taxes create some degree of efficiency loss, but just how much depends on the supply and demand elasticities. Glancing back at Figure 16.8, we see that the efficiency loss area abc is greater in Figure 16.8a, where demand is relatively elastic, than inFigure 16.8b, where demand is relatively inelastic. Similarly, area abc is greater in Figure 16.9athan in Figure 16.8b, indicating a larger efficiency loss where supply is more elastic. Other things equal, the greater the elasticities of supply and demand, the greater the efficiency loss of a particular tax.Two taxes yielding equal revenues do not necessarily impose equal costs on society. The government must keep this fact in mind in designing a tax system to finance beneficial public goods and services. In general, it should minimize the efficiency loss of the tax system in raising any specific dollar amount of tax revenue.
Qualifications We must acknowledge, however, that other tax goals may be as important as, or even more important than, minimizing efficiency losses from taxes. Here are two examples:
Redistributive goals Government may wish to impose progressive taxes as a way to redistribute income. The 10 percent excise tax the Federal government placed on selected luxuries in 1990 was an example. Because the demand for luxuries is elastic, substantial efficiency losses from this tax were to be expected. However, Congress apparently concluded that the benefits from the redistribution effects of the tax would exceed the efficiency losses.Ironically, in 1993 Congress repealed the luxury taxes on personal airplanes and yachts, mainly because the taxes had reduced quantity demanded so much that widespread layoffs of workers were occurring in those industries. But the 10 percent tax on luxury automobiles remained in place until it expired in 2003.
Reducing negative externalities Our analysis of the efficiency loss of a tax assumes no negative externalities arising from either the production or consumption of the product in question. Where such spillover costs occur, an excise tax on producers might actually improve allocative efficiency by reducing output and thus lessening the negative externality. For example, the $2 excise tax on wine in our example might be part of a broader set of excise taxes on alcoholic beverages. The government may have concluded that the consumption of these beverages produces certain negative externalities. Therefore, it might have purposely levied this $2 tax to shift the market supply curve in Figure 16.10 to increase the price of wine, decrease alcohol consumption, and reduce the amount of resources devoted to wine.p. 350
Excise taxes that are intended to reduce the production and consumption of products with negative externalities are sometimes referred to as sin taxes. This name captures the idea that governments are motivated to impose these taxes to discourage activities that are perceived to be harmful or sinful. Excise taxes on cigarettes and alcohol in particular are commonly referred to as sin taxes.
Probable Incidence of U.S. TaxesLet's look now at the probable incidence of each of the major sources of tax revenue in the United States.
23
Personal Income TaxThe incidence of the personal income tax generally is on the individual because there is little chance for shifting it. For every dollar paid to the tax, individuals have one less dollar in their pocketbooks. The same ordinarily holds true for inheritance taxes.
Payroll TaxesAs discussed earlier, employees and employers in 2010 each paid 7.65 percent in FICA taxes on a worker's annual earnings up to the 2010 Social Security cap of $106,800 and then 1.45 percent on any additional earnings.Workers bear the full burden of their half of the Social Security and Medicare payroll taxes. As is true for the income tax, they cannot shift the payroll taxes that they pay to anyone else.
But what about the other half of the FICA tax that is levied on employers? Who pays that? The consensus view is that part of the employers' half of the FICA tax gets shifted to workers in the form of lower before-tax wages. By making it more costly to hire workers, the payroll tax reduces the demand for labor relative to supply. That reduces the market wages that employers pay workers. In a sense, employers “collect” some of the payroll tax they owe from their workers.
Corporate Income TaxIn the short run, the incidence of the corporate income tax falls on the company's stockholders (owners), who bear the burden of the tax through lower dividends or smaller amounts of retained corporate earnings. Here is why. A firm currently charging the profit-maximizing price and producing the profit-maximizing output will have no reason to change product price, output, or wages when a tax on corporate income (profit) is imposed. The price and output combination yielding the greatest profit before the tax will still yield the greatest profit after a fixed percentage of the firm's profit is removed by a corporate income tax. So, the company's stockholders will not be able to shift the tax to consumers or workers.
As previously indicated, the situation may be different in the long run. Workers, in general, may bear a significant part of the corporate income tax in the form of lower wage growth. Because it reduces the return on investment, the corporate income tax may slow the accumulation of capital (plant and equipment). It also may prompt some U.S. firms to relocate abroad in countries that have lower corporate tax rates. In either case, the tax may slow the growth of U.S. labor productivity, which depends on American workers having access to more and better equipment. We know from Figure 13.1 that the growth of labor productivity is the main reason labor demand grows over time. If the corporate income tax reduces the growth of labor productivity, then labor demand and wages my rise less rapidly. In this indirect way—and over long periods of time—workers may bear part of the corporate income tax.p. 351
Sales and Excise TaxesA sales tax is a general excise tax levied on a full range of consumer goods and services, whereas a specific excise tax is one levied only on a particular product. Sales taxes are usually transparent to the buyer, whereas excise taxes are often “hidden” in the price of the product. But whether they are hidden or clearly visible, both are often partly or largely shifted to consumers through higher equilibrium product prices (as in Figure 16.7 through 16.9). Sales taxes and excise taxes may get shifted to different extents, however. Because a sales tax covers a much wider range of products than an excise tax, there is little chance for consumers to avoid the price boosts that sales taxes entail. They cannot reallocate their expenditures to untaxed, lower-priced products. Therefore, sales taxes tend to be shifted in their entirety from producers to consumers.Excise taxes, however, fall on a select list of goods. Therefore, the possibility of consumers turning to substitute goods and services is greater. An excise tax on theater tickets that does not apply to

24
other types of entertainment might be difficult to pass on to consumers via price increases. Why? The answer is provided in Figure 16.8a, where demand is elastic. A price boost to cover the excise tax on theater tickets might cause consumers to substitute alternative types of entertainment. The higher price would reduce sales so much that a seller would be better off to bear all, or a large portion of, the excise tax.With other products, modest price increases to cover taxes may have smaller effects on sales. The excise taxes on gasoline, cigarettes, and alcoholic beverages provide examples. Here consumers have few good substitute products to which they can turn as prices rise. For these goods, the seller is better able to shift nearly all the excise tax to consumers. Example: Prices of cigarettes have gone up nearly in lockstep with the recent, substantial increases in excise taxes on cigarettes.
As indicated in Global Perspective 16.2, the United States depends less on sales and excise taxes for tax revenue than do several other nations.Property TaxesMany property taxes are borne by the property owner because there is no other party to whom they can be shifted. This is typically true for taxes on land, personal property, and owner-occupied residences. Even when land is sold, the property tax is not likely to be shifted. The buyer will understand that future taxes will have to be paid on it, and this expected taxation would be reflected in the price the buyer is willing to offer for the land.
GLOBAL PERSPECTIVE 16.2
Taxes on General Consumption as a Percentage of GDP, Selected NationsA number of advanced industrial nations rely much more heavily on consumption taxes—sales taxes, specific excise taxes, and value-added taxes—than does the United States. A value-added tax, which the United States does not have, applies only to the difference between the value of a firm's sales and the value of its purchases from other firms. As a percentage of GDP, the highest tax rates on consumption are in countries that have value-added taxes.
Source: Organization for Economic Cooperation and Development, OECD Stat Extracts, stats.oecd.org.

25
Taxes on rented and business property are a different story. Taxes on rented property can be, and usually are, shifted wholly or in part from the owner to the tenant by the process of boosting the rent. Business property taxes are treated as a business cost and are taken into account in establishing product price; hence such taxes are ordinarily shifted to the firm's customers.
Table 16.2 (on the following page) summarizes this discussion of the shifting and incidence of taxes.p. 352
TABLE 16.2 The Probable Incidence of Taxes
LAST
Word Taxation and Spending: Redistribution versus RecyclingMany Think of Taxes as the Best Way to Level the Income Distribution, but the Real Action Is in Expenditures.Modern governments face substantial political pressure to ensure a fair distribution of society's economic benefits. In most people's minds, this boils down to taxing the rich more than the poor, which is why there is such a focus on whether particular taxes are progressive or regressive.
But taxing the rich cannot by itself alter the income distribution. One other thing is needed: The taxes taken from the rich have to flow to the poor. In particular, they have to be spent on goods, services, and programs that are used mostly by the poor rather than on goods, services, and programs that are used mostly by the rich. If government doesn't do this, the tax revenues of the rich will simply be recycled back to the rich rather than being redistributed to the poor.
Until recently, however, economists had only patchy evidence about whether our system of taxation and spending actually redistributes income from the rich to the poor. The problem was that the U.S. government only publishes statistics on whether the rich are being taxed more than the poor. It does not publish statistics on who receives most of its spending.
Fortunately, two economists from the nonpartisan Tax Foundation took it upon themselves to

26
calculate those statistics. By combining data on government spending with household questionnaire responses in which people report what goods and services they consume, economists Andrew Chamberlain and Gerald Prante obtained the first reliable estimates of whether the government transfers significant amounts of income from the rich to the poor.*
As it turns out, the government does transfer an enormous amount of income from those with high incomes to those with low incomes. Not only do people with high incomes pay a much larger fraction of their incomes in taxes, it is also the case that the majority of that money gets transferred to the poor because government spending is indeed concentrated on programs that are used more by the poor than by the rich. These include welfare, subsidized health care, public education, and jobs programs. The poor also benefit from government-provided public goods that are available to everyone on an equal basis—things like public roads, clean drinking water, national defense, and so on.p. 353
The size and impact of the income transfers from rich to poor are most clearly understood by looking at the nearby figure, which groups the 133 million households living in the United States in 2004 into one of five equally sized groups (or quintiles) on the basis of household income. The quintiles are labeled Bottom 20 Percent, Second 20 Percent, Third 20 Percent, Fourth 20 Percent, and Top 20 Percent. The yellow and blue bars above each quintile show, respectively, how much in taxes its members paid on average and how much in government spending they received on average during 2004.

27
The first thing to notice is how much more money the poor received in government spending than they paid in taxes that year. A comparison of the yellow and blue bars for the bottom quintile reveals that the poorest households received $31,185 (=$35,510 in government spending − $4,325 in taxes) more in government spending than they paid in taxes in 2004. By contrast, households in the top 20 percent of the income distribution paid $48,449 more in taxes than they received in government spending that year.
This $48,449 per-household excess paid by households in the top quintile plus the $8091 per-household excess paid by the households in the second-highest quintile provided the money that allowed the members of the lower three quintiles to receive more in government spending than they paid in taxes. In total, the transfers from the top two quintiles to the bottom three quintiles amounted to more than $1 trillion in 2004, or about 10 percent of all income earned by households that year.
The authors also found that the average tax rates paid by the five quintiles were, respectively, 13 percent for the bottom quintile, 23.2 percent for the second quintile, 28.2 percent for the third quintile, 31.3 percent for the fourth quintile, and 34.5 percent for the top quintile. Thus, the overall tax system is highly progressive (due to the Federal income tax) despite many individual taxes being quite regressive.
But, more significantly, the spending made possible by taxing the rich more than the poor disproportionately flows back to the poor rather than being recycled to the rich. In fact, households in the top quintile receive back only 41 cents in government spending for each dollar they pay in taxes—which means that the remaining 59 cents are channeled to poorer households.
28
*Andrew Chamberlain and Gerald Prante, “Who Pays Taxes and Who Receives Government Spending? An Analysis of Federal, State and Local Tax and Spending Distributions, 1991–2004,” Tax Foundation Working Paper No. 1, 2007.
The U.S. Tax StructureIs the overall U.S. tax structure—Federal, state, and local taxes combined—progressive, proportional, or regressive? The question is difficult to answer. Estimates of the distribution of the total tax burden depend on the extent to which the various taxes are shifted to others, and who bears the burden is subject to dispute. But the majority view of economists who study taxes is as follows:
The Federal tax system is progressive. Overall, higher-income groups pay larger percentages of their income as Federal taxes than do lower-income groups. Although Federal payroll taxes and excise taxes are regressive, the Federal income tax is sufficiently progressive to make the overall Federal tax system progressive. About one-third of Federal income tax filers owe no tax at all. In fact, because of fully refundable tax credits designed to reduce poverty and promote work, millions of households receive tax rebates even though their income tax bill is zero. Most of the Federal income tax is paid by higher-income taxpayers. In 2007 (the latest year for which data have been compiled), the top 1 percent of income-tax filers paid 39.5 percent of the Federal income tax; the top 5 percent paid 61.0 percent of the tax.The overall progressivity of the Federal tax system is confirmed by comparing effective (average) tax rates, which are found by dividing the total of Federal income, payroll, and excise taxes paid at various income levels by the total incomes earned by the people at those various income levels. In 2007, the 20 percent of the households with the lowest income paid an effective tax rate of 4.0 percent. The 20 percent of households with the highest income paid a 25.1 percent rate. The top 10 percent paid a 26.7 percent rate; the top 1 percent, a 29.5 percent rate.2
p. 354
The state and local tax structures are largely regressive. As a percentage of income, property taxes and sales taxes fall as income rises. Also, state income taxes are generally less progressive than the Federal income tax.
The overall U.S. tax system is progressive. Higher-income people carry a substantially larger tax burden, as a percentage of their income, than do lower-income people, as discussed in this chapter's Last Word.This chapter's Last Word also points out that the income tax system cannot be relied upon by itself to substantially alter the distribution of income, because the government might choose to spend the taxes collected from the rich to pay for things that are used more by the rich than the poor. In actual fact, however, this does not happen in the United States, because the government uses a large portion of the tax revenues collected from the rich to make income transfer payments to the poor and to pay for the provision of goods and services that are utilized more by the poor than the rich. The transfer payments by themselves are so large that they almost quadruple the incomes of the poorest fifth of U.S. households. Thus, the combined tax-transfer system levels the income distribution by much more than the tax system does on its own.2Average Federal Tax Rates in 2007, Congressional Budget Office, June2010.

29
Terms and ConceptsGovernment purchases, transfer payments, personal income tax, marginal tax rate, average tax rate, payroll taxes, corporate income tax, sales and excise taxes, property taxes, benefits-received principle, ability-to-pay principle, progressive tax, regressive tax, tax incidence, efficiency loss of a tax.
Questions
Use a circular flow diagram to show how the allocation of resources and the distribution of income are affected by each of the following government actions. LO1The construction of a new high school.A 2-percentage-point reduction of the corporate income tax.An expansion of preschool programs for disadvantaged children.The levying of an excise tax on polluters.What do economists mean when they say government purchases are “exhaustive” expenditures whereas government transfer payments are “nonexhaustive” expenditures? Cite an example of a government purchase and a government transfer payment. LO1What is the most important source of revenue and the major type of expenditure at the Federal level? At the state level? At the local level? LO1Distinguish between the benefits-received and the ability-to-pay principles of taxation. Which philosophy is more evident in our present tax structure? Justify your answer. To which principle of taxation do you subscribe? Why? LO2What is meant by a progressive tax? A regressive tax? A proportional tax? Comment on the progressivity or regressivity of each of the following taxes, indicating in each case where you think the tax incidence lies: (a) the Federal personal income tax, (b) a 4 percent state general sales tax, (c) a Federal excise tax on automobile tires, (d) a municipal property tax on real estate, (e) the Federal corporate income tax, (f) the portion of the payroll tax levied on employers. LO3What is the tax incidence of an excise tax when demand is highly inelastic? Highly elastic? What effect does the elasticity of supply have on the incidence of an excise tax? What is the efficiency loss of a tax, and how does it relate to elasticity of demand and supply? LO3Given the inelasticity of cigarette demand, discuss an excise tax on cigarettes in terms of efficiency loss and tax incidence. LO3ADVANCED ANALYSIS Suppose the equation for the demand curve for some product X is P = 8 − .6Q and the supply curve is P = 2 + .4Q. What are the equilibrium price and quantity? Now suppose an excise tax is imposed on X such that the new supply equation is P = 4 + .4Q. How much tax revenue will this excise tax yield the government? Graph the curves, and label the area of the graph that represents the tax collection “TC” and the area that represents the efficiency loss of the tax “EL.” Briefly explain why area EL is the efficiency loss of the tax but TC is not. LO3Is it possible for a country with a regressive tax system to have a tax-spending system that transfers resources from the rich to the poor? LO4
10. LAST WORD Does a progressive tax system by itself guarantee that resources will be redistributed from the rich to the poor? Explain. Is the tax system in the United States

30
progressive, regressive, or proportional? Does the tax-spending system in the United States redistribute resources from higher-income earners to lower-income earners?
Problemsp. 356
Suppose a tax is such that an individual with an income of $10,000 pays $2000 of tax, a person with an income of $20,000 pays $3000 of tax, a person with an income of $30,000 pays $4000 of tax, and so forth. What is each person's average tax rate? Is this tax regressive, proportional, or progressive? LO3Suppose in Fiscalville there is no tax on the first $10,000 of income, but a 20 percent tax on earnings between $10,000 and $20,000 and a 30 percent tax on income between $20,000 and $30,000. Any income above $30,000 is taxed at 40 percent. If your income is $50,000, how much will you pay in taxes? Determine your marginal and average tax rates. Is this a progressive tax? LO3For tax purposes, “gross income” is all the money a person receives in a given year from any source. But income taxes are levied on “taxable income” rather than gross income. The difference between the two is the result of many exemptions and deductions. To see how they work, suppose you made $50,000 last year in wages, $10,000 from investments, and were given $5000 as a gift by your grandmother. Also assume that you are a single parent with one small child living with you. LO3What is your gross income?Gifts of up to $13,000 per year from any person are not counted as taxable income. Also, the “personal exemption” allows you to reduce your taxable income by $3650 for each member of your household. Given these exemptions, what is your taxable income?Next, assume you paid $700 in interest on your student loans last year, put $2000 into a health savings account (HSA), and deposited $4000 into an individual retirement account (IRA). These expenditures are all tax exempt, meaning that any money spent on them reduces taxable income dollar-for-dollar. Knowing that fact, what is now your taxable income?Next, you can either take the so-called standard deduction or apply for itemized deductions (which involve a lot of tedious paperwork). You opt for the standard deduction that allows you as head of your household to exempt another $8500 from your taxable income. Taking that into account, what is your taxable income?Apply the tax rates shown in Table 16.1 to your taxable income. How much Federal tax will you owe? What is the marginal tax rate that applies to your last dollar of taxable income?As the parent of a dependent child, you qualify for the government's $1000 per-child “tax credit.” Like all tax credits, this $1000 credit “pays” for $1000 of whatever amount of tax you owe. Given this credit, how much money will you actually have to pay in taxes? Using that actual amount, what is your average tax rate relative to your taxable income? What about your average tax rate relative to your gross income?