engineeringdigest.orgengineeringdigest.org/wp-content/uploads/2018/10/4-mech-1.docx · Web...
12
ISSN 2455-7579 International Journal of Scientific Research and Innovations XVI (2018)35-43 DESIGN, ANALYSIS AND OPTIMIZATION OF ROLL CAGE OF ATV Sivasubramaniam R 1 , Jobin Joseph 1 , Balasubramanian A 1 , Ashwin R R 1 , Ashwath N 1 ,Dinesh P 1 , Pradeep Kumar AR 1 1 Department of Mechanical Engineering, Dhanalakshmi College of Engineering, Chennai, 601301 Abstract-The objective of our work is to reduce the wall thickness of the roll cage pipe to a smaller size where we can get good weight reduction and it also increases the efficiency of the vehicle. By adding some members to roll cage, the deformation can be decreased to a smaller value that increase the usage of the vehicle and it also increases the safety parameters of the roll cage.Initially, keeping the voluminous list of available parts in mind, we initiated the work to achieve the best standardized as well as optimized design possible. SOLIDWORKS 16 was the CAD software used for designing and ANSYS 14.5 was used to analyse the design based on various aspects such as different impact tests. The frame is subjected to the various static loads encountered during front, rear, side, roll-over and torsional impact. The frame should be stiff enough to react against all the loads acting on it with apt strength to weight ratio.Factor of safety of above 1 was set which gave a conservative design. The optimization process is done after completion of design of[1,7] the roll cage. It is done for various thickness of the pipes which give the result between the deformation and stress distributed in it. The graphical representation is done with parameter like thickness vs deformation (graph 1) and thickness vs stress induced (graph 2) in the roll cage for specific load acting factor. On having the suitable design of the roll cage and its optimised result, we are able toselect the suitable method of fabrication and welding method. 35
Transcript of engineeringdigest.orgengineeringdigest.org/wp-content/uploads/2018/10/4-mech-1.docx · Web...

ISSN 2455-7579
International Journal of Scientific Research and Innovations XVI (2018)35-43
DESIGN, ANALYSIS AND OPTIMIZATION OF ROLL CAGE OF ATV
Sivasubramaniam R1, Jobin Joseph1, Balasubramanian A1, Ashwin R R1, Ashwath N1,Dinesh P1, Pradeep Kumar AR1
1Department of Mechanical Engineering, Dhanalakshmi College of Engineering, Chennai, 601301
Abstract-The objective of our work is to reduce the wall thickness of the roll cage pipe to a smaller size where we can get good weight reduction and it also increases the efficiency of the vehicle. By adding some members to roll cage, the deformation can be decreased to a smaller value that increase the usage of the vehicle and it also increases the safety parameters of the roll cage.Initially, keeping the voluminous list of available parts in mind, we initiated the work to achieve the best standardized as well as optimized design possible. SOLIDWORKS 16 was the CAD software used for designing and ANSYS 14.5 was used to analyse the design based on various aspects such as different impact tests. The frame is subjected to the various static loads encountered during front, rear, side, roll-over and torsional impact. The frame should be stiff enough to react against all the loads acting on it with apt strength to weight ratio.Factor of safety of above 1 was set which gave a conservative design. The optimization process is done after completion of design of[1,7] the roll cage. It is done for various thickness of the pipes which give the result between the deformation and stress distributed in it. The graphical representation is done with parameter like thickness vs deformation (graph 1) and thickness vs stress induced (graph 2) in the roll cage for specific load acting factor. On having the suitable design of the roll cage and its optimised result, we are able toselect the suitable method of fabrication and welding method.
Keywords:Design, Analysis, Selection, Optimization, Parameter, Graph, Result
--------------------------------------------------------------------------------------------------------------------------------
35

ISSN 2455-7579
International Journal of Scientific Research and Innovations XVI (2018)35-43
Design Methodology
Design of any component is consists of three major principles:
1. Optimization 2. Safety 3. Comfort
The first objective of the roll cage is to provide a 3-D protected space around the driver that will keep the driver safe. Its next moves are to provide reliable mounting locations for components,low in cost, be appealing, and low in weight. These objectives were met by choosing a roll cage material that has good strength and also weighs less giving us an advantage in weight reduction. A roll cage of low cost was provided through material selection and with more continuous members of pipe with bends which is better than a lot of members with welded together to reduction of its manufacturing costs. The modelling of the roll cage structure is done by using pro-e software. This design is checked by Finite Element Analysis. We have aimed on each point of roll cage to improve the performance of vehicle without failure of roll cage. We began the task of designing by conducting extensive research of ATV roll cage through finite element analysis.
Selection of Material
The material selected for our design, analysis and optimize of roll cage is AISI 4130 [1,11,13].Alloy steels are designated by
AISI four-digit numbers. They are more responsive to mechanical and heat treatments than carbon steels. They comprise different types of steels with compositions which exceed the limitations of B, C, Mn, Mo, Ni, Si, Cr, and Va
in the carbon steels. AISI 4130 alloy steel is consist ofmolybdenumandchromium as agents ofstrengthening. It has low carbon content, and hence it can be welded easily.
Table 1: Material Composition
Test Parameters Specified Values Observation
Carbon(C) 0.28-0.33 0.296Silicon(Si) 0.15-0.30 0.271
Manganese(Mn) 0.40-0.60 0.577Phosphorus(P) 0.035 max 0.020
Sulphur(S) 0.040 max 0.009Chromium(Cr) 0.80-1.10 0.916
Molybdenum(Mo) 0.15-0.25 0.181
Roll Cage Design
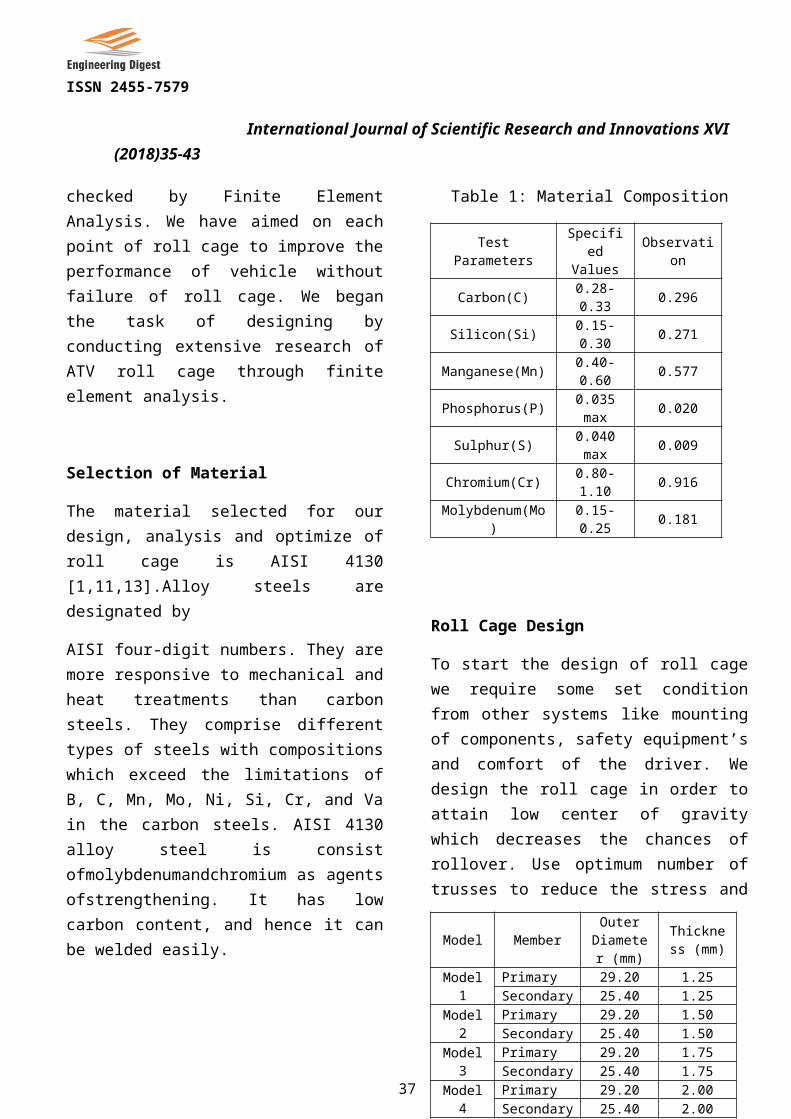
To start the design of roll cage we require some set condition from other systems like mounting of components, safety equipment’s and comfort of the driver. We design the roll cage in order to attain low center of gravity which decreases the chances of rollover. Use optimum number of trusses to reduce the stress and weight. The mounts should be welded direct to the roll cage and the 3D image was shown in fig.1
36
Model MemberOuter
Diameter (mm)
Thickness (mm)
Model 1 Primary 29.20 1.25Secondary 25.40 1.25
Model 2 Primary 29.20 1.50Secondary 25.40 1.50
Model 3 Primary 29.20 1.75Secondary 25.40 1.75
Model 4 Primary 29.20 2.00Secondary 25.40 2.00
ISSN 2455-7579
International Journal of Scientific Research and Innovations XVI (2018)35-43
Figure 1: Roll Cage
The primary member are the main members where major load acts. And the other members are made called secondary members.
Table 2: Roll cage Dimension
Finite Element Analysis The optimization of the roll cage will be done with the help of FEA. The different impact tests which are analyzed are Front impact, side impact, roll over and rear impact[4,5]. For each impact test the G force calculation is found individually where we can get the values by using formulas. In each impact test we are calculating the total deformation and equivalent stress where the values are taken for the graphical representation and comparison. The values are taken are compared with other models where we can easily identified the better model of the roll cage[5,8].Total Deformation : It is the vectors sum all directional displacements of the systems.Equivalent Stress : It is related to the principal stresses and a part of the maximum equivalent stress failure theory used to predict yielding in a ductile material[13].
For our work, we have chosen the MODEL 2 as our analysis component where we find our advantage and
our development in it and other models are same procedure and there values has been tabulated below.
Front impact For front impact the load is applied on the front most members and the fixed member is last member. The ATV is moving at the top speed of 60 km/hr. The front impact analysis image was shown in fig.2 and fig.3.G force calculation Initial velocity =60 km/hr Finial velocity =0 km/hr Impact time =0.13 s From the law of motion,
a = 53.06 m/s2
G force = ; G force =5.5gThis mean total weight multiplied by 5.5
Figure 2: Total deformation-Front impact-M2
37
ISSN 2455-7579
International Journal of Scientific Research and Innovations XVI (2018)35-43
Figure 3:Equivalent stress-Front impact-M2
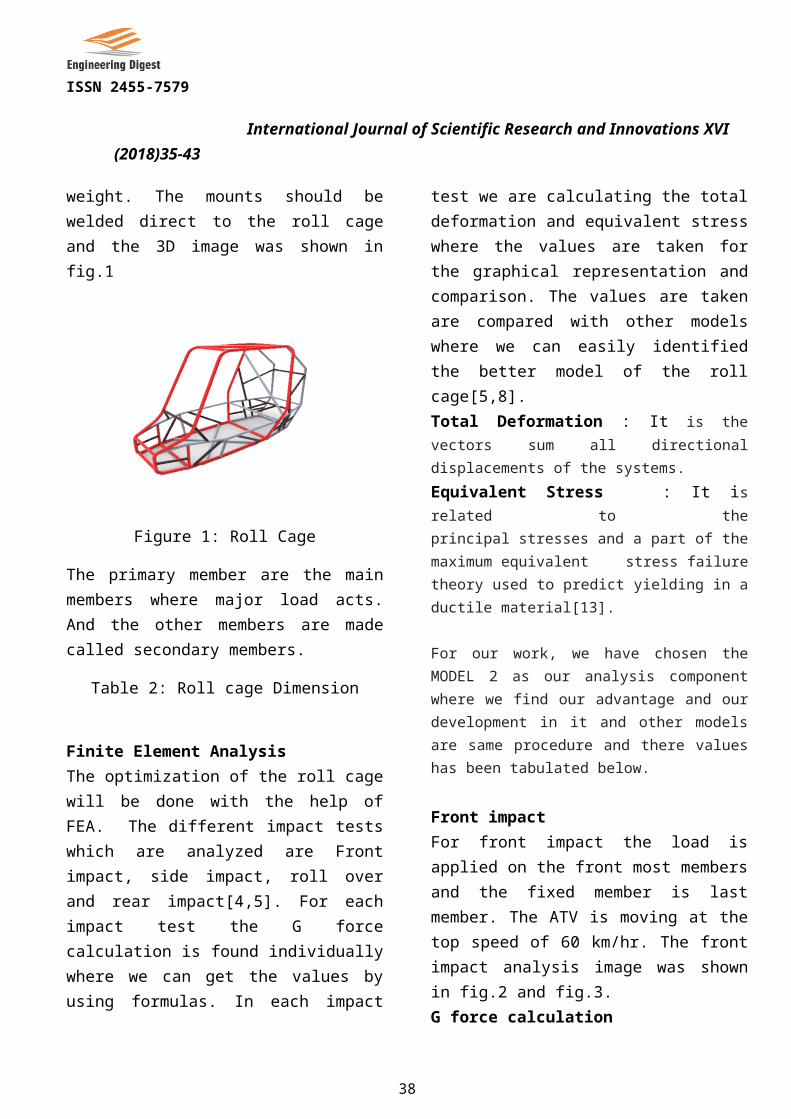
Side impact For side impact, the load is applied on the side most member. And the fixed member is other side member. The side impact analysis image was shown in fig.4 and fig.5.G force calculation Initial velocity =60 km/hr Finial velocity =0 km/hr Impact time =0.32 s From the law of motion,
a = 21.51m/s2
G force = ; G force = 2.4 gThis mean total weight multiplied by 2.4
Figure 4: Total deformation-Side impact-M2
Figure 5: Equivalent stress-Side impact-M2
Rear impact
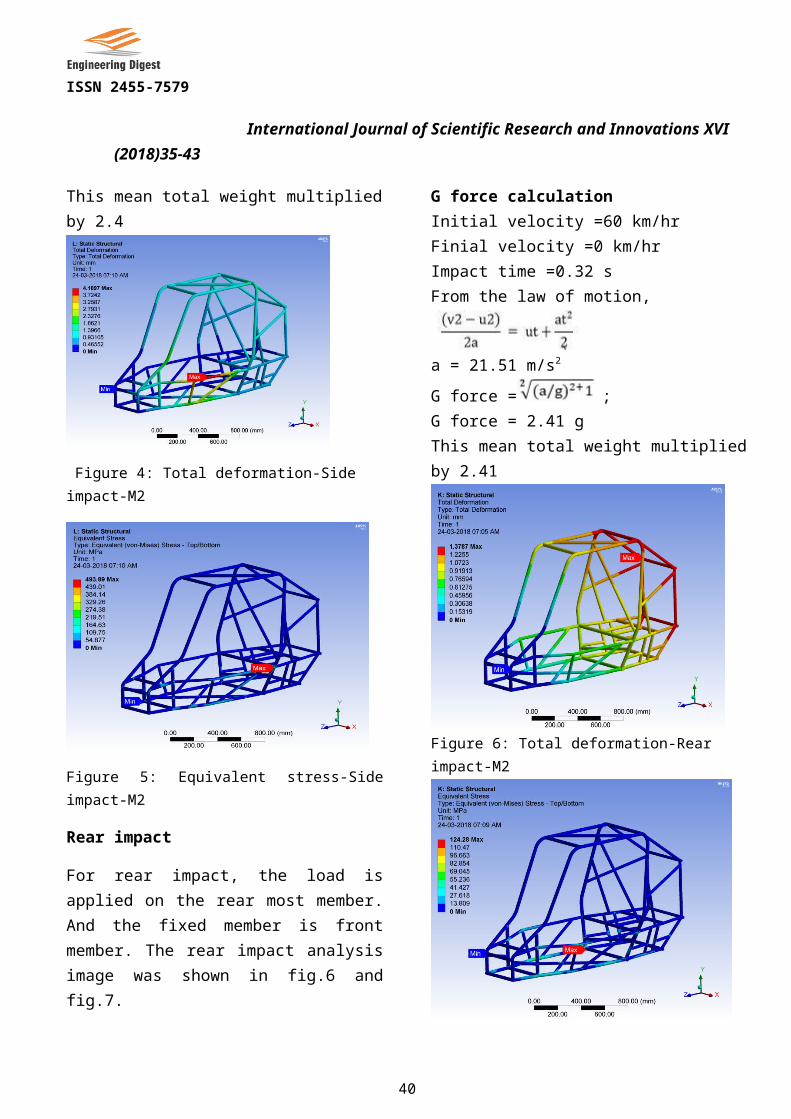
For rear impact, the load is applied on the rear most member. And the fixed member is front member. The rear impact analysis image was shown in fig.6 and fig.7.G force calculation Initial velocity =60 km/hr Finial velocity =0 km/hr Impact time =0.32 s From the law of motion,
a = 21.51 m/s2
G force = ; G force = 2.41 gThis mean total weight multiplied by 2.41
38

ISSN 2455-7579
International Journal of Scientific Research and Innovations XVI (2018)35-43
Figure 6: Total deformation-Rear impact-M2
Figure 7: Equivalent stress-Rear impact-M2
Roll over For front impact the load is applied on the front most members. And the fixed member is last member. The ATV is moving at the top speed of 60 km/hr. The roll over impact analysis image was shown in fig.8 and fig.9.G force calculation Initial velocity =60 km/hr Finial velocity =0 km/hr Impact time =0.32 s From the law of motion,
a = 21.51 m/s2
G force = ;G force = 2.41 g
This mean total weight multiplied by 2.41
Figure 8: Total deformation-Roll over-M2
Figure 9: Equivalent stress-Roll over-M2
The values that taken from the analysis report for models that we have chosen are tabulated for the better reference and these values are taken for the optimization of the roll cage.
Table 3: Deformation results-Impact test
39
ISSN 2455-7579
International Journal of Scientific Research and Innovations XVI (2018)35-43
Table 4: Equivalent Stress-Impact test
Optimization
After analyzing the result, the member or points which experiences high stress are added with supported members to improve stress distribution. The member which experience low stress on load condition is replaced with members of lower thickness. The final dimensional parameters of the roll cage are determined by changing the respective parameters on different iterations. The strength is increased by replacing the weld joints by with bends.
The yield strength of a selected material AISI 4130 is 650 MPa. So the maximum stress of the results was taken to be about 600 MPa for optimum analysis results[7,5].
Analysis result after optimization
After optimization, the analysis result are compared with yield strength of the AISI 4130 material that it is satisfiying the condition and the safety of the design. We are taking the safe design to ensure the safety of the driver as well the objective of our work[9,14].Now we are going to plot the graph which give more efficient details about the model that we have chosen and the best option for our work through the results.
Graph 1
Wall thickness vs Total deformation
In this, a Graph is drawn between the wall thickness (x-axis) and total deformation (y-axis) where the values are taken from corresponding impact tests that we had done earlier and its gives a clear idea of a roll cage design in figure 10 it explains the detail clearly.
1.25 1.5 1.75 20123456789
7.65996.7258
5.604
4.02
Total Deformation
Wall thickness (mm)
defo
rmat
ion
(mm
)
Figure 10: Graph of Wall thickness vs Total deformation
Graph 2
40
Deformation ObtainedModel
sFront
ImpactRear
ImpactSide
ImpactRoll-over
Model 1
7.63 1.56 5.04 3.69
Model 2
6.73 1.38 4.19 3.32
Model 3 5.60 1.12 3.49 2.83
Model 4
4.02 0.95 3.32 2.54
Equivalent Stress ObtainedModel
sFront
ImpactRear
Impact
Side Impact
Roll-over
Model 1
661.91 164.93 664.51 352.06
Model 2
548.31 124.28 493.89 300.03
Model 3 444.86 98.66 421.40 235.54
Model 4
355.25 84.51 368.05 217.05

ISSN 2455-7579
International Journal of Scientific Research and Innovations XVI (2018)35-43
Wall Thickness vs Equivalent stress
In this, a Graph is drawn between the wall thickness (x-axis) and equivalent stress (y-axis) where the values are taken from corresponding impact tests that we had done earlier and its gives a clear idea of a roll cage design in figure 11 the graph explains in detail.
1.25 1.5 1.75 1.250
100200300400500600700 661.91
548.31444.86
355.25
Equivalent stress
Wall thickness (mm)
Stre
ss (M
Pa)
Figure 11: Graph of Wall thickness vs Equivalent stress
From the above data we can get the total
deformation and equivalent stress of each model which have different wall thickness and by considering the weight of the roll cage, we can easily determine the perfect one of the model design that is safe as well as our objective that to be accomplished.
The weight of the roll cage is one of the important factor that to be considered so that it
will increase the efficiency as well as increase of the speed of the vehicle. On accounting the weight of the roll cage we can easily determine the design that is safe and economical.
Table 5: Weight-Models
By consider three factor i.e., total deformation,
equivalent stress and weight of the different roll cage wall thickness we can determine the better design that is more safe and efficient in usage of an All-Terrain Vehicle.
Table 6: Models-Wall thickness- Deformation – Stress - Weight
As comparing with the values of the total deformation, equivalent stress, weight and the factor of safety we came to an endpoint that the Model 2 i.e., wall thickness of 1.50mm is the better one among the other model[15,8]. For our model 2 we have a positive result of stress limit as well as the factor of safety. The deformation result that we had obtained is a upper hand result
41
Models Wall Thickness(mm)
Weight (kg)
Model 1 1.25 26.414
Model 2 1.50 31.697
Model 3 1.75 36.98
Model 4 2.00 42.262
ModelsWall Thickness (mm)
Deformation (mm)
Stress (MPa)
Weight (kg)
Model 1 1.25 7.63 661.91 26.414
Model 2 1.50 6.73 548.31 31.697
Model 3 1.75 5.60 444.86 36.98
Model 4 2.00 4.02 355.25 42.262

ISSN 2455-7579
International Journal of Scientific Research and Innovations XVI (2018)35-43
with have an advantage in our work and the weight of our roll cage is an another advantage it lies the efficient of the vehicle. We calculated the factor of safety for our model of our wall thickness as 1.18 which give that our design is safer and manufacture able for our All-terrain vehicle.
Table 6: Models-Factor of safety
ModelsWall
Thickness(mm)
Factor of Safety
Model 1 1.25 0.99Model 2 1.50 1.18Model 3 1.75 1.46Model 4 2.00 1.62
Thus, from our point of view the better and safer wall thickness of the roll cage of an All-Terrain Vehicle is MODEL 2 i.e., wall thickness of 1.50 mm.
Conclusion
Thus the design, development, analysis and optimization of the roll cage are carried out successfully. Our work under different wall thickness which gives a turning point in the ATV’s where the corresponding condition gives various result and we have done it. The use of FEA was invaluable to the design and analysis of the frame for off-road vehicle. Safety is of utmost concern in every aspect; for the driver, crew & environment. The report of analysis was so needful in finding out the equivalent stress,maximum deformation and the factor of safety for the different impact tests i.e., Front impact, Side impact, Rollover impact and Rear Impact.
Our choice of wall thickness and its analysis detail that we obtained:
Optimized Model Model 2
Wall Thickness (mm) 1.5
Total Deformation (mm) 6.7
Equivalent Stress (MPa) 548
Weight (kg) 31.7
Factor of Safety 1.18
Design verification Design is SAFE
References
[1]Rulebook BAJA SAE INDIA 2018 [2]Herb Adams, “Chassis Engineering”, Berkley Publishing Group New York. [3] F. L. Singer, “Strength of Materials”, Harper and Row Publishers, New York. [4] Khelan Chaudhari, International Journal on Theoretical and Applied Research in Mechanical Engineering (IJTARME), ISSN: 2319 – 3182, Volume-2, Issue-4, 2013 [5] Manjot Singh, International Journal of Research in Mechanical Engineering & Technology, ISSN: 2249-5762 (Online) 2014 | ISSN: 2249-5770 [6] S. K. Gautham Prashanth,IOSR Journal of Mechanical and Civil Engineering (IOSR-JMCE) e-ISSN: 2278-1684,p-ISSN: 2320-334X, Volume 12, Issue 2 Ver. III (Mar - Apr. 2015), PP 56-61[7] Linder, Astrid; Avery, Matthew. “Change of Velocity and Pulse Characteristics in Rear Impacts: Real World and Vehicle Tests Data,” The Motor InsuranceRepair and Research Centre. Thatcham, United Kingdom.'http://wwwnrd.nhtsa.dot.gov/pdf/nrd-01/esv/esv18/cd/files/18ESV-000285.pdf [8] William B. Riley and Albert R. George, “Design, Analysis and Testing of a Formula SAE Car Chassis”, SAE TECHNICAL PAPER SERIES 2002-01-3300. [9] Dr. N.K.Giri, “Automobile Mechanics”, Khanna Publishers.
42

ISSN 2455-7579
International Journal of Scientific Research and Innovations XVI (2018)35-43
[10] Automobile Engineering, Kirpal Singh[11] Sadhu Singh,“Strength of Materials”, Khanna Publishers,New Delhi, INDIA, 2012.[12] Chandrupatla,“Finite Element Analysis for Engineering and Technology”, University Press (INDIA) Private Limited,New Delhi, 2011.[13] Design of Machine Elements V B Bhandari
[14] Stability and vibrations of an all-terrain vehicle subjected to nonlinear structural deformation and resistance - L Dai, J Wu [15] Integration CAD/CAM/CAE System for Production All-Terrain Vehicle Manufactured with Composite Materials - G. Vratanoski, Li. Dudeski, V. Dukovski
Definitions/Abbreviations
ATV- All-terrain vehicle B - Boron C - Carbon Mn - Manganese Mo - Molybdenum Ni - Nickel Si - Silicon Cr - Chromium Va - Vanadium M2 - Model 2 mm - Millimeter Km/hr - Kilometer per hour s - Second g -Gram MPa -Mega Pascal
43