wilsonweb.physics.harvard.eduwilsonweb.physics.harvard.edu/HUMANRIGHTS/PHYSICS... · Web...
148
Draft 06/24/2014 Renewable Power and Nuclear Energy: Opportunities, Challenges and Policy Recommendations Prepared for the 2014 Erice Seminars Robert Budnitz Carmine Difiglio Michael Jefferson Hisham Khatib Tatsuo Masudo Charles McCombie Jef Ongena Lara Pierpoint Adnan Shihab-Eldin Bruce Stram 1
Transcript of wilsonweb.physics.harvard.eduwilsonweb.physics.harvard.edu/HUMANRIGHTS/PHYSICS... · Web...

Draft 06/24/2014
Renewable Power and Nuclear Energy:
Opportunities, Challenges and Policy Recommendations
Prepared for the 2014 Erice Seminars
Robert BudnitzCarmine DifiglioMichael Jefferson
Hisham KhatibTatsuo Masudo
Charles McCombieJef Ongena
Lara PierpointAdnan Shihab-Eldin
Bruce Stram
1

Draft 06/24/2014
Contents
1. Introduction2. Key Messages and Policy Recommendations3. Expanding Renewable Energy 4. Nuclear Power: Status Report and Future Prospects 5. Economics of Nuclear and Renewables 6. Electricity Storage7. Environmental Impacts of Nuclear and Renewables8. Fusion
9.
2

Draft 06/24/2014
1. Introduction
Nuclear and renewable power plants produce essentially no greenhouse gas emissions as they generate electricity. In order to achieve the greenhouse gas emission goals endorsed at the 2009 G8 Summit (L'Aquila, Italy1), a significant share of the electrical fleet must include zero-emission plants such as renewable and nuclear plants.2
ADD
Or a major reduction in electricity use. Yet at the same time….
CONTINUE
At the same time, worldwide power demand is expected to significantly increase due to economic growth outside the OECD.3
Economic growth and electricity supplies are
OMIT inextricably it is too strong
linked. A failure to satisfy power demand in the developing world will not only constrain economic growth but sustain “energy poverty” experienced today by 1.4 billion people with no access to electricity. The UN Millennium Development Goals adopted in 2000 placed a high priority to eradicate energy policy.
The power sector investments needed to support both economic growth and emission reduction are formidable. The IEA estimates that $17 trillion must be spent for new power plant and transmission infrastructure between 2013 and 2015. While it is 1 At the 2009 G8 Summit in L'Aquila, Italy, a goal to reduce world-wide greenhouse gas emissions in 2050, relative to 2005 emissions was endorsed by the G8 members. In addition, governments of the countries that constitute 80% of total GHG emissions have agreed to take measures to significantly cut GHG emissions. This is the best reason to explain why this paper does not address coal with CCS.
2 Multiple studies by the IEA, IIASA and others conclude that 1) very significant cuts are necessary in the power sector to achieve deep greenhouse gas emission cuts; 2) the emission reductions in the power sector can be achieved at relatively low costs compared to other sectors; and 3) while there is some room for “transitional” low GHG technologies such as natural gas or coal with carbon capture and storage, it will be necessary to have a large share of renewable and nuclear to reduce world-wide greenhouse gas emissions by 50% by 2050. Consequently, natural gas plants with waste heat recovery, coal plants with CO2 capture and storage or natural gas plants with CO2 capture and storage can all contribute to significant power-sector emission reductions in many countries the ultimate goal must be a high percentage of zero-emission renewable and nuclear plants.
3 The IEA (2013 World Energy Outlook) estimates that electricity demand will increase by 2.3%/year through 2035 driven by demand growth of 3.3%/year outside of the OECD.
3

Draft 06/24/2014
indisputable that zero-emission power plants must constitute a major part of this investment ($6.2 trillion for renewable power plants4), there is a significant controversy as to whether it is practical for renewable energy to expand sufficiently to meet this need or whether governments should give nuclear power support, comparable to that provided to renewable energy, in satisfying the twin needs for more electricity and less greenhouse gas emissions. Carbon capture and sequestration (CCS) is also under discussion as it could allow for more coal development while reducing greenhouse gas emissions,
THIS WHOLE DISCUSSION IS TECHNICALLY INACCURATE .AND CONFUSING Burning any carbon (coal, oil or natural gas or methane inevitably produces carbon dioxide This will stay unless captured and sequestered somewhere The coal interests talk about “CLEAN COAL” and then deceive people I call it a conspiracy to whitewash coal. What was IPCC talking about? Carbon capture at the power plant? What is the difference between capture at the power plant or in Central Park?
The IPCC estimated in 2007 that CCS could reduce coal-fired power plant emissions by 80-90%;5 the IEA cites 85% as the efficiency of capture.6 This paper concentrates on the relative merits and costs of renewables and nuclear, for which life cycle CO2 emissions are negligible.
The paper is intended to inform this debate
IT DOES NOT AS WRITTEN
by examining the technical and economic challenges faced by nuclear and renewable energy including cost, safety, environmental impacts, public acceptance and integration into the electrical grid.
2. Key Messages and Policy Recommendations
World-wide economic growth will require continued power sector investments to meet growing electricity demand. While electricity demand growth in the OECD will be relatively modest, most serious studies including the International Energy Agency project that the developing economies will increase electricity demand by over 3 percent per year.
Governments of the largest world economies are committed to substantial reductions of greenhouse gas emission For example, on September 6, 2012, nations of the world’s leading economies ranked climate change along with growth, jobs, investment and trade as a key issue of the future, one that will
4 IEA, World Energy Outlook 2013, Paris
5 http://www.ipcc.ch/pdf/special-reports/srccs/srccs_wholereport.pdf
6 http://www.iea-etsap.org/web/E-TechDS/PDF/E14_%20CCS%20draft%20oct2010_%20GS-gc_OK.pdf4
Draft 06/24/2014
extract ever higher costs if “we delay additional actions,” (St. Petersburg Declaration, adopted by the G20 nations).
Multiple studies have shown, world-wide, that the power-sector would have to achieve deep cuts in greenhouse gas emissions in order to make significant cuts in overall emissions. The studies show that a large share of energy-sector emissions come from the power sector. The studies’ cost analyses also show that reducing greenhouse gas emissions in the power sector is relatively cost effective compared to other sectors, especially the transportation sector.
While replacement of coal fired plants with natural gas or fossil-fuel plants with carbon capture and storage can facilitate progress in cutting power sector emissions, the share of carbon free power sources, such as renewable energy and nuclear power, must constitute a much larger share of power sector generation if overall emission goals are to be achieved.
Government policies to promote the growth of renewable energy or nuclear power that result in high electricity costs are not sustainable as high electricity costs and limited electricity supplies are harmful to economic growth.
If renewable energy programmes are based on overly optimistic technical assessments, costs are likely to exceed sustainable levels.
Policies should be designed to insure that the uptake of the most cost-effective technologies and limit the cost exposure to technologies that require technological advances or technologies that cannot be expected to experience significant cost reductions when applied on a commercial scale.7
Policies should consider the full costs and benefits of power sector technologies. Important benefits may be the elimination of pollutants such as toxic particulates, sulphur, mercury, volatile organic compounds and nitrogen oxides from fossil fuel power plants. Cost may include pollution or resources required to construct renewable or nuclear power plants, adverse impacts on wildlife or property values and, for nuclear plants, the possible release of radiation during plant operation or the disposition of spent reactor fuel.
Cost-effective electricity storage would significantly improve renewable and nuclear power economics. Storage benefits intermittent renewable technologies such as wind and solar plants. Storage also benefits base load power plants like nuclear that cannot be easily cycled to follow load,
Electricity storage would also reduce significant conflicts in dispatching renewable and nuclear power during periods of slack power demand.
7 Wind energy is an example of an initially costly technology that achieved large cost reductions as a result of commercialization. Cost reductions from commercialization are often referred to as “technology learning.” It can be used to justify subsidies to technologies that are not currently competitive if it is expected that, with expanding commercial production, costs will come down. A “learning ratio” is often used to measure the cost reduction achieved by a doubling of commercial capacity.
5

Draft 06/24/2014
Research to develop cost-effective storage should be a priority of governments.
Likewise, research to reduce the cost or address shortcomings of renewable and nuclear technologies should also be a governmental priority.
Significant reductions in power sector greenhouse gas emissions will require reductions in renewable and nuclear power costs. Cost reductions can be achieved through commercial application but also require research and development.
Nuclear power plants will not be built in most OECD economies without government backing as the financial risks to utilities, other energy companies and banks are simply too large. Building nuclear power plants in the United States is particularly challenging because of low U.S. natural gas prices ($4.70 per million Btu as of 19 June, 2014).
The prospects for nuclear power are much better outside the OECD in economies. The prevalence of state-owned power companies, generally lower construction costs and the prevailing regulatory environments help explain why the bulk of planned nuclear power plants are in Russia, Asia and the Middle East.
Modular nuclear power reactors may offer significantly lower costs, scalability, safety and economic risk and their development should be a governmental priority.
As the development of nuclear power is particularly challenging in the competitive power markers of OECD countries, OECD governments may choose to:
o Forgo significant reliance on light-water reactors as a means to achieve GHG goals and wait to see whether commercially available modular nuclear reactors would be competitive8.
o Provide financial backing to enable the construction of light-water reactors, perhaps with the expectation that successful experience with the technology may eventually lead to commercial acceptance of the technology in competitive power markets.
o Wait to see whether nuclear reactor projects outside the OECD (and those few within the OECD) achieve the necessary cost reductions that might make nuclear reactors more attractive to investors in competitive power markets.
o Assume that development of nuclear power is not likely to be a means to achieve deep cuts in GHG emissions.
If OECD governments choose to forgo support for nuclear power (either by assuming part of the financial risk (subsidizing) current technology reactors or
8 Assuming that there would be an overall scheme such as cap-and-trade or GHG taxes to financially reward technologies that produce lower GHG emissions.
6

Draft 06/24/2014
by developing modular reactors for widespread deployment), then there is less likelihood that deep cuts in power sector emissions will be achieved.
3. Expanding Renewable Energy
The purpose of this section is to outline and evaluate the challenges presented by increasing penetrations of renewable electricity generation. These generation sources primarily include solar and wind, which are growing rapidly, and are new enough to the grid that the impact of high penetrations is not fully understood. The challenges associated with solar and wind will be examined qualitatively, and to the extent possible, in terms of the costs they might imply to the system over and above the costs associated with deploying and operating the electrical generation equipment. Hydropower is generally well integrated into existing operations, but has much less potential for growth. Tidal, wave, run-of-river hydro and geothermal sources are currently much more limited both in quantity and growth. Energy efficiency is sometimes considered an energy “source” but is not usually combined with renewables; nonetheless, it is discussed below, because the potential for more efficiency would obviate the need for renewables (or for more nuclear) to some extent. Special challenges posed in developing countries are presented as well.
The intrinsic nature of solar and wind power is very likely to present greater challenges than “conventional” sources. Within limits, those challenges can be overcome, but at a cost. Later sections of the paper will draw on a variety of sources to identify a range of such costs, at least as they are foreseen by researchers helping prepare ambitious plans for grids to obtain high shares (30%-50%) of their megawatt hours from primarily solar and wind generation.
Since a primary policy rationale to including renewables is reduction of carbon emissions, prospects for high (30-50%) penetrations of renewable power will be a key focus, even though they may require significant technology improvements. These issues also raise the question of what role is appropriate for nuclear power (a non CO2 power source whose capacity can be expanded) in helping integrate renewables into grid operation.
3.1 Some Power System Fundamentals
Modern electric power grids are really a technological marvel, even if routine. Electric power delivered as needed on demand is a very valuable resource for industry, commerce, and everyday household life. That value greatly exceeds the cost of producing and delivering the power. In addition to the simple availability of easy to use energy, the value is much increased by virtue of the reliability and the “quality” of the supply. Power must be supplied to user within voltage tolerance limits, and rigidly maintained frequency (60Hz in the US.)
Power systems are typically very large networks drawing on many generating sources of power and dispatching that power to many loads. This involves large scale “transmission” of power to nodes and “distribution” of power to users who range from
7

Draft 06/24/2014
very large industrial complexes to ordinary homeowners and everyone in-between. These systems are extensively thought out and planned.
The degree of difficulty for maintaining such a system is substantially exacerbated by the fact that power flows are virtually instantaneous and that power storage opportunities are very limited. Thus any upsets in the system (large power plants or industrial users tripping offline, transmission line breakdowns, etc.) must be offset on the order of seconds. Further, like any mechanical equipment, power plants must be periodically shut down for planned maintenance. Additional reserve power must be available to supply power during these periods.
The two most basic measures of electricity are megawatts (MW) which connotes the flow rate of power or capacity of generation, and megawatt hours (MWh) which indicates energy usage.
Costs associated with power sources occur at three levels. First there are the costs associated with the generation facility itself. These are capital costs for land, equipment and construction, and ongoing operating and maintenance costs. The given facilities must be connected to the grid and the grid must be capable of carrying sufficient power to desired nodes which gives rise to additional costs both capital and operating. Finally, all power systems have substantial infrastructure whose primary purpose is to maintain grid stability and reliability. This need is acute because, at least for now, the possibility of storing electricity is very limited and ranges from very expensive to impossible.
Solar and wind power are fundamentally different in character from traditional fossil fuel sources (or nuclear and hydro.) Such “conventional” facilities are normally described by their capacity for power production in terms of MW. That capacity is generally available on a dispatchable basis for the system operator. Fuel (coal, oil, reservoir water, uranium) is stored on site or piped in (natural gas). While breakdowns do occur they can be made very rare.
Solar and wind are also rated according to capacity. However, these ratings are based on specified conditions: 1 KW/square meter insolation and 12 m/s wind, for example. But these conditions are not achieved at the discretion of the operator, but rather are subject to nature.
Consequently, both solar and wind energy present intermittency issues to system operators. These are time of day, seasonal and even idiosyncratic. Solar and wind produce energy according to sunshine and wind available. Either of those can change very suddenly. But power demand doesn’t fall, so the shortage situation must be dealt with. Wind availability may be ill timed according to time of day or seasonal power needs. In addition, both solar and wind at utility scale require substantial expanses of land for deployment and good insolation or wind availability. Thus these sources may require substantial transport of power from locations not convenient to the grid. Conventional sources have similar problems, but face fewer location constraints since their fuel is more transportable or ubiquitously available.
8

Draft 06/24/2014
Up to a certain level of penetration of intermittent renewables, these issues don’t present unique challenges for grid operators. While rare, breakdowns from conventional power generation equipment certainly occur and variations in load occur frequently. Operators have developed a number of tactics for dealing with these. Spinning reserves, for example, can be brought online very quickly to offset power sags or meet load coming onto the system. Power is already transported long distances in particular circumstances.
However, these features come at a cost. Currently such costs are often subsumed into aggregate system operation costs. Since renewable sources tend to draw more heavily on these resources, they are in effect being subsidized by grid operation. (They can be charged directly for such services, but currently, given their small portion of total supply this is not often done.) This implicit subsidy is in addition to direct subsidies that renewables are often currently provided.
As the proportion of solar and wind power grows, the operational realities of these issues come to light. To the extent possible, some exemplary costs imposed by renewables will be evaluated. A number of European nations are planning for substantial increases in solar and/or wind shares for their power sources. The California grid currently provides excellent examples which will be explored. Further, as current energy policy, particularly in California dictates unprecedented shares of renewable power for future years within utility planning horizons, ultimate limitations of such power are being investigated and will be examined here.
3.2 System Costs versus Facility Costs
All large power plants require substantial capital investment for site locations, structures and equipment. In the case of “conventional” power plants (coal, oil, natural gas, hydro and nuclear), these are all directed toward turning some sort of turbine which is attached to generation machinery. These capital investments are usually expressed in terms of dollars per MW. With the exception of hydro power, the turbines are ultimately driven by expansion caused by heat either through steam or directly by combustion (gas turbines). These generators produce alternating current power. That power must be conditioned and transferred to the grid. Critically, all of these spinning generators must be synchronized, i.e. spin at the same speed.
Except for hydro, these conventional plants have fuel costs. All have operating costs similar to what would occur in any factory, and require significant periodic maintenance.
3.2.1 Connection
Solar and wind power installations require high capital expenditure per MW of rated power (which does not have the same connotation as conventional plants.) Solar PV power needs specific equipment to “condition” produced power to convert direct current to AC, increase voltage and maintain grid synchronization. Additional steps must be taken to ensure that solar PV installations meet grid requirements for upset conditions. Grid operators prefer that wind farms install additional equipment to support grid interaction, providing e.g. the ability to curtail wind output.
9

Draft 06/24/2014
3.2.2 Transmission
Large scale power facilities generally need their produced power transmitted to the grid for ultimate delivery to system nodes and then distribution among users. Such transmission costs tend to be higher for solar and wind relative to their rated capacity because of the location limitations cited above, and because relative to their rated power, they have relatively low load factors. Transmission is generally sized to accept the highest output likely from such facilities. This is especially true when plans for renewable energy set ambitious goals for production. Higher per MW costs spread over relatively fewer MWH means higher cost.
Nuclear facilities also often bear relatively high transmission costs. For safety considerations, they have a redundancy in connection to provide greater assurance for cooling water pumps. This is in addition to onsite backup diesel or other power.
3.2.3 Balancing and Adequacy of Supply
Over and above these facilities costs, power grids require system infrastructure to maintain the continued operation and stability of the grid. While solar and wind inherently place disproportionate demands on this infrastructure, these are not different in kind from conventional sources.
Solar and wind power availability may tend to grow on a predictable daily and/or seasonal cycle. Solar especially can be expected to have a daily cycle. During any off cycle, if power demand doesn’t fall in concert (the solar cycle tends to almost coincide with peak daily power demand), standby power must be available (at least according to most current standard practice). This same requirement applies to conventional power which needs backup power (i.e. “reserve”) for maintenance cycles. Perhaps not so well understood, is the problem caused by the need to ramp down conventional sources as solar and wind ramp up. Some baseload facilities, coal and nuclear primarily, have historically run more or less continuously at full power in most systems. System goals (i.e. California’s 33% of electricity retail sales from renewables by 2020, but to a greater extent 50% in the future which is under consideration) set for renewable power generation require displacing power from these facilities.
Further, solar and wind have inherently more volatile output than conventional sources whose variability is tied basically to relatively rare breakdowns. For solar, sunlight may be obstructed, and wind may stop blowing. These events are likely to have some warning, but they are akin to breakdowns in mechanical equipment. The problem is exacerbated in that these effects may be correlated among a range of solar installations or wind farms.
The principle means of providing these needs is first spinning reserve, usually a coal or oil plant, gas turbine, or hydro, intentionally running at less than full capacity. So situated, these may be ramped up (or down) very quickly to respond to very short term situations.
10

Draft 06/24/2014
With greater warning, provided by weather forecasts in the case of renewables, and maintenance planning as well as equipment monitoring, reserve facilities can be fired up and brought online to fill in gaps in demand. Again these are typically gas-fired fossil fuel plants or hydro. Such units typically provide needed power at lower incremental cost through greater efficiency. Simple cycle gas turbines are used for spinning reserve because they have lower capital costs than most other capacity options.
3.3 Flexibility
The flexibility of the contribution of new renewables (NRs) to the electricity supply varies. Although hydroelectricity is generally reliable, and provides flexible supply (except in periods of prolonged drought), it can also store huge amounts of water/power to be used when necessary. This advantage is also assisted by pumped hydro storage, which involves pumping water uphill into the reservoir at off-peak and then releasing it when needed. Biomass (subject to land and water availability, and food requirements) and geothermal can provide reliable renewable sources. However, other NRs (particularly solar and wind) present formidable challenges to the transmission supply operators due to their intermittency, unpredictability, and changing meteorological conditions. This intermittency is delaying/preventing electricity markets from accommodating and meeting the ambitious renewable goals set by energy planners in some countries.
The flexibility of national electricity grids to accommodate variable power sources is enhanced by: achieving geographic and technological diversification of variable energy sources, improving local energy management and increasing prospects of energy-storage schemes, and also by trading with other electricity grids.
Nuclear plants pose other types of system challenges in that they are not easily dispatchable. They need some time to ramp up and down their load and follow system demand particularly if a large component of new renewables (NRs) exist. Some existing LWR type plants have limited ability to significantly vary their output to match changing demand. PWRs, as well as CANDU and BWR, have load-following capability, which will allow them to fill more than baseline generation needs. Some newer reactors also offer some form of enhanced load-following capability. For example, the Areva EPR can slow its electrical output power between 990 and 1,650 MW at 82.5 MW per minute.
In the generation dispatching schedule, renewables production is “free” and it is a “must dispatch” source of generation. This is followed by nuclear. Correspondingly, if the system has minimum load, such as at weekends, and a surge of wind occurs, renewables and nuclear output may exceed demand. It is not easy to ramp down load on nuclear quickly or shut down other dispatchable facilities in the generating system. These events lead generation to significantly exceed load. If there are enough regional interconnections neighbouring systems can accommodate some of this excess generation (as regularly happens with Denmark’s wind energy generation); but what happens if those systems have the same problem? For example, it has been found that offshore North-West Europe periods of calm quite regularly coincide across a wide area of ocean.
11

Draft 06/24/2014
The least-cost solution is to offer incentives to consumers to take more load by various means including negative pricing. This means that nuclear output is not only offered free, but consumers are actually paid incentives to take it. We are not talking here of a hypothetical case but actual incidents experienced by the European system in recent years (although for years the result for Danish electricity customers was that they were paying the highest prices for electricity in Europe – a baton handed over to the German electricity consumer more recently). In other cases, the power output of these plants is simply curtailed. If NRs, particularly the wind component, is increased then this dispatching problem is going to become more acute. Whether this will lead to an increase in the disadvantages and costs of nuclear generation, or to the fuller exposure of the frailties of NRs to the advantage of nuclear remains to be seen.
3.4 System Cost and Renewable Share
A number of countries and states in the US have put forward very ambitious goals for the share of power provided by renewable sources. California calls for 33% electricity retail sales from renewables by 2020 (originally 20% by 2017), not including hydro. Finland, France, Germany, Republic of Korea, and the UK have ambitious goals as well. Denmark is already deriving 30% of its power production from wind, but exports power to nearby countries in times of surplus. Maine, Massachusetts, New Hampshire, New York and Maryland have already cut their power sector emissions by 40% with renewables and gas. Consequently, much study and planning has been undertaken to understand the consequences of these goals. These are potentially two fold. First total cost of power per MWh increases (on a fully allocated cost basis which includes the cost of capital) because renewable generation is at least now relatively expensive, and because system costs per MWh increase as the share of renewables increases.
System costs increase because proportionately more balancing and back-up resources are required to compensate for the intermittency of those increased renewables.
The second concern is the extent to which there is a limit to the share of renewable power, at least as provided by wind and solar that can’t be dealt with without some dispatchable fossil fuel power in the system.
3.5 Nuclear and Power Storage
In principle, nuclear
This is TECHINCALLY DISTINCTNuclear is a source.Storage is stuff stored somewhereTo put them together is confusing UNLESES it is clearly stated that the purpose is to discuss instantaneous demand/
and storage power (both subjects of other chapters) can ameliorate these marginal cost increases. Both can provide backup and balancing services. (Nuclear power is used for
12

Draft 06/24/2014
load following in Belgium, France and Germany, but not allowed in the US. See OECD, pp. 67-72.) However, both currently are burdened with very high capital expenditures. Both would be expected to have reduced utilization factors were they to be employed in grids with high renewables generation. This effect would be reduced if nuclear were relied on for base load power and even more so, if it could be used to supply storage power. However, policy changes and technology developments are needed to promote nuclear. Power storage needs substantial technology advancement to be very helpful in this regard.
3.6 Energy Efficiency
IMPORTANT to be careful here I suggest modification
THE TERM ENERGY EFFICIENCY IS LOOSELY USED TO INCLUDE TWO ASPECTS> TRUE IMPRIVEMENBTS IN EFFICY BY ACHIEVING THE SAME DESIRED RESUKLT (SUCH AS REFRIGERATION) WITH LESS ENERGY AND ENERGY RESTRAINT WHERE ,FOR WHATEVER REASON SOCIETY DECIDES NOT TO DO AS MUCH
The potential for “energy efficiency” improvements is large.
Under the IEA New Policies Scenario, total energy demand increases by 1/3 from 2013 to 2035, rather than 45% under current policies (see Figure 2.3). Efficiency, especially in end-use sectors, accounts for three-quarters of that reduction. The IEA “Efficient World” scenario is even more aggressive, reducing global primary energy demand by 50% compared to the “new policies” case. [3]
Both the IEA and IIASA emphasize the importance of energy efficiency to reduce the required demand for new power generation. In IEA’s “new policies” scenario and additional $3.4 trillion of cumulative investment through 2035will be made in energy efficiency compared to their “current policies” scenario. IIASA estimates that $15 trillion will be needed through 2050. These investments produce an impressive payoff with IEA estimating $6.1 trillion in energy savings and IIAS estimating $57 trillion in avoided heating and cooling costs alone. [3, 4] Nonetheless, as shown in Figure 3.1, while energy efficiency investment significantly reduces the global growth in primary energy demand, significant global growth remains. The estimates of electric power demand growth cited above, account for investments in energy efficiency required by new energy policies.
Figure 3.1 Comparison of energy demand in IEA New Policies Scenario vs. Current Policies Scenario
13

Draft 06/24/2014
Realizing this efficiency potential will require strong, sustained policies. The IIASA Global Energy Assessment suggests governments need to address split incentives, such as when energy users and building owners have different time horizons for recouping investments, and recommends strong building and appliance standards coupled with information and awareness programs. Policies like these would help nations reduce future energy demand, with benefits including reductions in GHG emissions and other pollutants and significant job creation. [4]
3. IEA (2013), “World Energy Outlook”, pp.226-2274. Johansson, T., Patwardhan, A., Nakicenovic, N., and Gomez-Echeverri, L., eds. and et al.,“Global Energy Assessment: Toward a Sustainable Future,” International Institute for Applied Systems Analysis (IIASA), Laxenburg, Austria, 2012.
3.7 Challenges Outside of the OECD
Outside the OECD, electrification started rather late, but is gaining momentum. The share of electricity in the Total Final Energy Consumption is 16% in 2011, which is expected to grow to 22% in 2035 according to the IEA New Policies Scenario. The annual growth rate of electricity demand between 2011 and 2035 is estimated at 3.3%, which is much higher than the growth rate of non-OECD Total Final Energy Consumption (2.0%).
Although energy consumption needs to grow at rates high enough to support economic development, rapid expansion of fossil fuel use will have deleterious effects on the environment. Therefore, in emerging countries, a major energy policy objective should be the “decoupling” of economic growth from energy consumption growth. Along with efforts to promote energy conservation and efficiency, clean energy supplies such as nuclear and renewables will be needed; gas is a cleaner-burning fossil fuel then coal, and will help reach GHG targets, but is not sufficient to decarbonize the electricity sector. However, there is uncertainty as to whether the electricity sector will attract enough
14

Draft 06/24/2014
investment to meet growing demand, especially in unstable countries. Business models as well as regulatory regimes tested and practiced in OECD countries will not necessarily be applicable to emerging economies due to the difference in not only developmental stage but also social, political and cultural background. Energy subsidies present a particular problem, as growing demand places burdens on national budgets and discourages energy efficiency. As several OECD energy companies have discovered, money will have to be found to fund new plants and non-OECD countries in particular will be hard-pressed. Theft of power, corruption and other problems has caused several foreign power investments by independent power companies to fail.
However, the largest challenge, which may even dwarf the challenges discussed above, will be the “eradication of energy poverty,” especially electricity poverty, in the least developed countries or regions. This is an indispensable part of the efforts under the first goal (“Eradicate extreme poverty and hunger”) of the UN Millennium Development Goals adopted in 2000. There are 1.4 billion people around the world that lack access to electricity, some 85% of them in rural areas (Figure 3.2). A typical example will be the situation in Myanmar, where 74% of the population lacks access to electricity [2]. Due to its criticality to the quality of human life, access to electricity should be facilitated above all else. Without electricity, the opportunity for education of younger generations will severely be reduced, with serious negative implications on human capacity-building.
Figure 3.2, Number of People without Access to Electricity in Rural and Urban Areas in the IEA New Policies Scenario (unit: millions of people)
Source: IEA, Energy Poverty, 2010
In this regard, a leapfrogging as seen in telecommunication (bursting into mobile phone bypassing the stage of landline phone) should be widely materialized by making the best use of renewables. Micro grids using locally available energy sources, such as solar and
15

Draft 06/24/2014
wind power, will be an important option rather than waiting for the investment in large-scale generation and centralized transmission systems. Low-cost, off-grid solar power, as seen in remote villages in India, is a good start. In a nutshell, every effort should be mobilized to overcome such chronic energy poverty as soon as possible, though the particular combination of solutions relevant to each country will vary.
3.8 Conclusions
If sensible policy seeks very substantial reductions in carbon emissions, it is clear that renewable power and reduced energy intensity for our goods and services are extremely useful for achieving that end while maintaining the standard of living to which we are accustomed or aspire. Thought of in those terms, nuclear power is desirable as well.
However, achieving this end can be very costly given our current
capabilities.
CONTRAINTSAND CAPABILITIES
At this time, our capabilities with regard to low cost electricity storage, either directly or through other energy storage, callable on demand, are lacking. These are critical to better utilization of both intermittent renewables and nuclear. Renewable energy stored could be used to help overcome slumps when such power is in limited supply. Similarly, excess off peak nuclear power could be stored to meet peak demand. Low-cost storage could be used to greatly facilitate the use of either of these sources, or perhaps better, both together.
Today’s high cost of energy storage is not the final word. (See later section on power storage.) Further, as power systems evolve using solar and wind, better techniques and technologies will become available if steps are taken to develop them. On the other hand, these issues have been extant for many years so they are not at all trivial.
References1. Energy and Environmental Economics, Inc.(2014), Investigating a Higher
Renewables Portfolio Standard in California 2. OECD NEA (2012), Nuclear Energy and Renewables: System Effects in Low-
Carbon Electricity Systems, Nuclear Energy Agency, Organization for Economic Co-Operation and Development.
4. Nuclear Power: Status Report and Future Prospects
The scope of this section includes the current status and future prospects of commercial nuclear electric power, with emphasis on issues of safety, physical security, proliferation, and economics. (Issues related to radioactive waste are discussed elsewhere in this paper.)
16

Draft 06/24/2014
Discussions of these issues are presented separately for the current fleet, for new reactor designs similar in size to the current fleet, and for prospective new reactors of substantially smaller size. Also, this section discusses the issue of expansion of commercial nuclear power into new countries.
4.1 Reactor Safety
The fundamental issue that makes nuclear power reactor installations different from other industrial undertakings is, of course, the possibility that a major accident could release large amounts of radioactivity into the environment, endangering offsite populations and contaminating offsite land and property, possibly for long term. As the world saw with the accident at Fukushima in Japan in 2011, this is a real possibility, even in the most advanced countries, and not merely a threat confined to countries with lesser technological prowess.
What do we know now about the likelihood of such accidents? The answer is that we know considerably more than was known two or three decades ago. We understand the origins of these accidents (how they might start), we understand the variety of ways in which they might progress, and we can estimate the likelihood and the consequences of the many different accident scenarios. The advances in our analysis methods, and in the collection and use of the operating data needed to support them, have been remarkable world-wide in recent years.
We analyse “safety” by working out, in as realistic a way as we can, the likelihood per year that a large accident might occur. We now have methods that enable us to perform such an analysis, which is intrinsically probabilistic in character, and these analyses are now done routinely around the world. The community has settled on two different figures-of-merit, one being the annual frequency that a reactor will suffer a core-damage accident, and the other the annual frequency of a so-called “large” release of radioactivity, defined as sufficient to cause prompt radiation-induced fatalities offsite.Based on what we know today, the annual frequency of core damage of one of the reactors in the worldwide operating fleet is estimated to be, on average, in the range of around a few x 10-5/year. This is a typical value. It varies considerably from one to the next individual reactor even in the same country or even operated by the same company, and it is known only within a factor of three or so, or even less well, depending on the analyst and the design. However, based on what we know, the worldwide average is believed to be in the range just cited. The likelihood that any such an accident will progress to a large release is small, perhaps in the range of a few percent to ten percent. This means that the frequency of a large release is likely in the range at or above ~10-6 per year or so, as a worldwide average.
One thing is clear. The community of reactor-safety experts has no doubt, based on objective assessments of many different indicators that the general safety performance of today’s operating fleet has substantially improved over, say, the situation 15-20 years ago. All of our indicators of safety tell us this, and this trend is true worldwide. The indicators include rates of initiating events that might cause an accident if not mitigated, failure rates of vital safety equipment, rates and severity of operator and maintenance errors, major improvements in fire protection, and changes in the designs to provide
17

Draft 06/24/2014
more safety system backup and reliability. Another significant improvement has been the worldwide sharing of operating experience and a diligent effort worldwide to learn from this experience. Although the improvements vary from plant to plant, they have occurred worldwide.
Whether today’s performance is adequately safe will not be addressed here. This is both an individual judgment that people make differently, and a societal judgment made differently by different countries. Though risk-based assessments, including assessing risks associated with alternative sources of energy, are to be encouraged.
There is a vital caveat that must be discussed, of course. Like any technology, nuclear-power technology can be mismanaged, and a major accident could occur at any time. (As an example, consider the fact that for a passenger flying in a commercial aircraft, the safety performance is 30 to 100 times better on average than it was 40 years ago, and incontrovertibly so. But a plane crash could occur on any day. Yet if it did, even though it would a tragedy, it would not contravene the strong evidence that commercial flight is indeed much safer on average than it was decades ago.)
So too with nuclear power reactors. If the worldwide performance is in the range of a few times 10-5 per year, and if there are close to 500 reactors today, one such core-damaging event might occur on average every several decades. Yet one could occur tomorrow. Crucially, what worries the reactor safety community is that if a major error of some kind were made, as happened in Japan with the decision to place the Fukushima reactors at a tsunami-vulnerable site without adequate protection, the likelihood of an accident would be higher. What to do?
It is important to note that we do know how to achieve a safety level like the above. A few vital attributes of the enterprise must all be present: (a) We must incorporate the appropriate safety features in all existing reactors, including improvements in equipment reliability and in the training of operators; (b) we must apply all lessons learned from operating experience worldwide; (c) we must emphasize safety culture everywhere; (d) we must remain attentive to aging issues, including equipment aging, staff aging, and institutional fossilization; (e) we must maintain the morale of staff, taking care to infuse the enterprise with a generational “mix” that includes both experience and youth; and (f) crucially, we must maintain and reinforce a vigorous and independent regulatory agency in every country, enhanced to the maximum extent possible by a strong international framework for establishing high safety standards, provision for technical assistance and peer reviews of design and operational safety and sharing and disseminating lessons learned and best practices experience,
If the above attributes are all present and attention is paid to maintaining each of them, the existing worldwide operating reactor fleet can continue to achieve the safety performance noted above. This is true not only for the light-water power reactors (LWRs) that comprise the bulk of today’s operating fleet but also for the others operating today: the heavy-water reactors, the gas reactors, and the Russian RBMK water-graphite reactors – but only if “operated well.”
18

Draft 06/24/2014
Why can’t we do better with the existing large LWR reactors? Based on our understanding of the design of the existing LWR reactors and of how they are operated, certain limitations seem to make it difficult to achieve, say, an order of magnitude better fleet average than the above. These limitations involve the way the designs call on safety equipment when in trouble, the reliability of the equipment, the way operators are relied on, and the interplay among these factors.
However, for new LWR designs, especially those with more passive safety features and those whose design has taken maintenance and reliability into account from the start, the community of reactor safety experts has reason to believe that much better safety performance will ensue --- perhaps an order of magnitude better. A few reactors with these advanced designs are now under construction around the world.
Why are these advanced LWRs better? There are many reasons besides the two crucial ones mentioned above (passive features, and design for reliability and maintenance.) The new designs have greater embedded “engineering margin” in many different places; they have fewer and better components whose failure matters; they are easier to operate and more tolerant of operator error; and they are simpler to understand, and hence to analyse if an off-normal event were to occur. Crucially, they have included a number of advanced technologies that simply did not exist when the earlier nuclear plants were designed, such as advanced computer-based information systems, digital instrumentation and control systems, advanced operator-training simulators, and advanced materials in many different aspects of the design.
What about the safety of other advanced designs? There are two quite different types: (a) First are the proposed new smaller LWRs, the so-called “small modular” LWRs. There is reason to believe that their safety performance should be every bit as good as that of the new large LWRs, and in some ways perhaps better, because they have fewer components and simpler operations in many areas. Because most of the technologies used in these smaller LWRs are very similar to those in today’s large LWRs, these smaller LWRs probably have a “head start” in reaching commercial viability, compared to other advanced reactor designs. (b) Second are various advanced reactors other than the smaller LWRs. Some are large and some are small. They include advanced gas reactors, homogeneous reactors, liquid-metal reactors, and a few others. Among these are a few advanced designs using fast-neutron cores; these offer the capability to use the energy in the fertile heavy metal in the fuel as well as the fissile content, along with the capability to destroy the actinides to reduce the residual high-level waste burden substantially. Effectively, such reactors would use a greater percentage of the original energy contained in the fuel, and would alleviate some of the longest-lived contributors to the nuclear waste burden.
All of the smaller new design concepts, whether they are thermal reactors or fast reactors, possess a set of safety-improvement features that are intrinsic to their smaller size. Specifically, the smaller size makes thermal transients and many other upset conditions easier to design against and also to control if an upset condition were to occur. Some smaller designs also require less standby safety equipment, which is an advantage for simplicity, for lower capital cost, and for easier and thus less costly maintenance. But even the largest of these advanced designs has several very attractive
19

Draft 06/24/2014
safety features, often involving passive safety design concepts and easier operation. The issue, of course, is that until any of these is actually designed in full and then built and operated, we cannot really know. (Admiral Hyman Rickover famously once remarked along the lines that a “paper reactor” is always safer and less expensive than a real one.)
What about the safety of power reactors potentially to be deployed in “newcomer” countries, meaning countries without a current commercial reactor program? The key issue is likely one of culture. First is the political culture, which involves a long-term national commitment and public acceptance if the launching of a nuclear –power program is to be successful. And crucially, a country needs a culture in which an independent regulatory agency with authority and independence from politics can operate appropriately. Second is the social culture. While many of these “newcomer” countries have strong social cultures, some do not. A culture of corruption, or a culture that does not hold safety as paramount, or a culture without commitment to transparency in management practices and communication, a strong continuity of institutions and a tradition of follow-through, is less likely to foster the environment needed to achieve an adequate safety record. Finally, in any “newcomer” country, there is the need for technical and financial infrastructure. This is true across the board, including routine technical infrastructure such as maintenance and electronics-instrumentation-electricity-grid support, the availability of competent craft labour, and spare-parts availability. A country also needs a financial infrastructure to support a large industrial installation like a nuclear power plant, including an insurance infrastructure and a trustworthy court system to enforce contracts. Without all of these various “cultural” attributes, power reactors in a “newcomer” country are unlikely to achieve an adequate safety record.
Thorium-fuelled reactors: All of today’s operating reactors, and almost all of the advanced designs that are under development around the world, use uranium as the fuel. However, reactor designs that use thorium as the fuel are fully feasible, and several different such designs have been advanced over the years. Much of the excitement over using thorium relates to thorium’s relatively high earth abundance, including in countries like India which possess little uranium. Using thorium for a power reactor is fully feasible, although there is almost no operating experience with them beyond a very few experimental facilities. There is no reason to believe that a thorium reactor cannot achieve the safety, security, and non-proliferation record of the best of the uranium-fuelled designs, if “done right,” while recognizing that many of the technical issues with both safety and non-proliferation differ in important ways. In India, a program to develop a thorium-fuelled power reactor has been in place for some years. However, only the future will tell us whether this development program will succeed, both technically and in terms of cost.
International institutions to promote reactor safety and security: A fundamental principle worldwide is that the regulation of the safety of power reactors is a national responsibility, not an international responsibility. However, because there is a worldwide recognition of a fact that is often phrased as “a nuclear reactor accident anywhere affects nuclear power programs everywhere,” and because many power reactors are located near the border with another country, a number of international and multi-national institutions have arisen that work to promote nuclear reactor safety and security worldwide. Foremost among them, of course, is the International Atomic
20

Draft 06/24/2014
Energy Agency. One major IAEA initiative is the Nuclear Safety Convention, to which all countries with power reactors are signatories. The IAEA has for decades also developed principles for safety and security, international safety and security standards, guidance documents, and programs of assistance that have had important impacts. The IAEA also collects, analyses, and disseminates information about reactor safety and security issues, organizes conferences and other meetings to promote international cooperation among experts, maintains an incident response and information centre that can respond if needed when an accident or incident occurs, and provides several services to countries that request them to provide on-the-site advice and review of safety programs, safety practices, and regulatory-agency performance. All of the above provide vital assistance worldwide, although taking advantage of these services is entirely voluntary on the part of any individual country.
Another organization that carries out a set of similar programs in many of the same areas is the OECD’s Nuclear Energy Agency, although its programs are mostly restricted to the OECD’s own member countries. The NEA’s efforts have had great value. They have positively improved safety and security worldwide even beyond the borders of the NEA’s own member countries. A strengthened international safety regime would bring about tangible enhancement to safety of nuclear power worldwide and increase acceptance for an expanded role as part of future energy mix. One initiative that might provide greater worldwide benefit would be if participation could be made mandatory for at least some of the IAEA’s programs, such as those that do site peer-review visits to reactors worldwide to give advice and review of a site-specific program. Given the IAEA’s current structure, it seems difficult to see how to bring about such a change to mandatory participation, but there is little doubt as to the benefits, if something along these lines could be put in place.
4.2 Reactor Physical Security
The issue here is the potential vulnerability of a reactor installation to an outside attack, or to a malevolent act by an “insider” team, or some combination. The current approach to security emphasizes “guns, guards, and gates” along with intelligence and counter-intelligence systems. The obvious concerns are the adequacy of the external defences, the adequacy of the on-site security force and system, and the effectiveness of systems that screen employees to detect those with relevant skills and malevolent motivations. Recently, concerns with cyber-security threats have also come into prominence.
On balance, the general feeling on the part of the community of nuclear power experts and many others worldwide is that the current schemes used to achieve the desired security regime seem adequate, everywhere around the world. (Even in countries with other problems, the military tends to be strong and well organized.) There are always ongoing concerns, which revolve around the screening of employees and guards, especially in countries where corruption is an issue. Also of concern is the potential decline in vigilance due to complacency, and the potential for political interference.
One issue that continually arises is how to know whether today’s physical security scheme is “adequate.” No objective definition is accepted by all. Several methods have been developed and used to assess the extent to which a given security scheme can
21

Draft 06/24/2014
protect against a given postulated threat. International technical forums and projects have worked on this issue for many years, and some convergence has occurred on the main issues and analysis approaches. However, disagreements persist on how to do this evaluation, and part of the problem is that the values brought to the evaluation by different countries inevitably differ, and probably always will.
4.3 Proliferation Issues
The issue here is the potential misuse of nuclear power reactor or fuel-cycle technology to make weapons-usable material directly, or to extract it from a power-reactor or a fuel cycle facility by either a government or a non-governmental group for malevolent purposes.
Today, there is an international protocol to achieve the aims of deterring proliferation of nuclear weapons and weapons technology, under the Non-Proliferation Treaty, while fostering peaceful uses of nuclear energy including nuclear power. The treaty is enforced through a safeguards system administered by the UN’s International Atomic Energy Agency. The central aspects of this NPT protocol include inspections both planned (through safeguards) and unplanned (through the Additional Protocols that are not agreed to yet by all NPT members), monitoring both within and from outside a given installation or country, the availability of extensive training, the use of exercises to test the functioning of the system, and periodic reviews. Other institutions, such as the Nuclear Suppliers Group, also contribute significantly. A vital aspect of the overall international regime is a set of restrictions on the export of so-called “dual use” technologies which have both civilian uses and potential uses that could enhance the proliferation of nuclear-weapons capability.
For many years, major emphasis was placed on the issues of proliferation arising if power-reactor fuel is reprocessed so that plutonium is extracted for re-use, making it “available” in “weapons-usable” form. The concern was mostly directed at government-sponsored reprocessing programs that are openly acknowledged. That emphasis has in the last decade or so been supplemented by emphasis on deterring the use by a government of uranium-enrichment technology, which can produce weapons-usable highly-enriched U-235 (HEU) under the guise of enriching to lower enrichment levels to make LWR fuel. Both technologies have dual use are permitted in principle under NPT if genuinely and demonstratively justified for a large nuclear power program and deployed transparently.
NPT has been relatively successful so far but not fully. First, there are several examples where , as a few members of NPT have developed dual use technologies under the pretext of a civilian national nuclear power program only to prove, or is suspected, to be otherwise (e.g. North Korea walking away on its NPT obligations and testing several nuclear weapons and in case of IRAN, is suspected of aiming to develop at least a nuclear weapon capacity, giving it planned and developed its enrichment program initially in secret). The second failure is evident in case of several countries that chose not to be party to NPT and went on to develop nuclear weapons, declared (India and Pakistan as well as South Africa), and undeclared (in the case of Israel). Another is the
22

Draft 06/24/2014
failure of the recognized nuclear weapons states under NPT to begin a credible program to systematically reduce, eliminate and renounce their arsenal of nuclear weapons.
Today, this concern about proliferation arising from openly acknowledged government-sponsored programs (whether a reprocessing program or an enrichment program) has been supplemented with a major parallel concern about possible clandestine government-sponsored programs, or about a program embarked upon by a sub-national group.
While theft of separated plutonium has always been an issue, theft of HEU has typically been of lesser concern because of its lesser availability -- although research and test reactors around the world that use HEU have always been a concern and remain so. Today, however, the theft of both separated plutonium and HEU are emphasized together as threats to peace.
The physical security aspects of this issue seem to be adequate – that is, adequate against theft by an unauthorized individual or non-governmental group. Less clear is the adequacy of the world’s ability to intervene if a sitting government proceeds, as government policy, down a path toward proliferation (meaning a path leading to the development of an actual nuclear weapon). This includes using a commercial nuclear power program as a “cover” for an illicit weapons program, or using an ostensible power-reactor facility (such as a low-enriched-uranium enrichment plant) for those ends. This set of issues has political ramifications that are beyond the scope of this essay.
4.4 Recommendations
From the above discussion, a few recommendations seem to emerge naturally. Some are for technical work, and some concentrate on institutions and policies.
Recommendations (technical)
A. Small (modular) reactors show great promise to enable the expansion of nuclear power in many electricity markets that are otherwise inaccessible to the larger LWRs. These smaller reactors are likely to be especially attractive in many developing countries, although not exclusively in them. To make these reactors a genuine option, an emphasis on technical research and engineering development, and also on developing efficient means for regulatory agencies to review and approve the new technologies, is imperative. It should receive priority worldwide, as should identifying the most promising SMR designs and moving them toward prototype demonstrations.
B. Enhancing the training of technical personnel and developing technical infrastructure, especially in countries that today have little or no nuclear-power deployment and perhaps even little strong technical base at all, should be another worldwide priority.
Recommendations (policies and institutions)
23

Draft 06/24/2014
D. A major barrier to widespread deployment of nuclear power is the set of “culture issues” that include corruption culture, safety culture, and the culture of institutional continuity and integrity. Policies that emphasize the positive attributes of these cultural issues, or discourage their opposite, are an urgent matter.
E. The need for an independent regulatory agency with authority and independence from politics cannot be overemphasized. No country without this should deploy nuclear-power technology. Policies, including policies in the developed world to provide assistance and mentoring, are a vital component of a successful worldwide nuclear power endeavour.
F. There is a need to strengthen the international safety regime, including, where feasible, making some current advisory services of IAEA mandatory.
G. In cases where policies are established to reduce the carbon footprint of the electricity grid, nuclear power should not receive discrimination in favour of renewables.
5. Economics of Nuclear and Renewables
New renewables (NR: wind; solar; modern biomass and biofuels; tidal, wave and ocean energy) are widely claimed to be clean, indigenous and sustainable sources of energy. Therefore, they are favoured by many governments and the public as a whole. However, their present contribution to global energy consumption is still limited (about 3% in 2013; and only about 10% even for heating), since their economics are not yet favourable. In most instances they need to be supported by state subsidies and regulations. They suffer from high investment costs and, as a result of the intermittent and diffused nature of wind, solar, and tidal, relatively low utilisation factors.
This section focuses on the economic aspects of nuclear and “new” renewables (NRs). Incorporating NRs into power grids poses challenges due to dispatching problems and potential needs for expensive transmission extension and/or grid reinforcement; issues with intermittency and prospects for energy storage as a solution are discussed in other sections.
Wider introduction of smart grids and the likely demise of nuclear in some OECD countries (in the short and medium term, at least) will enhance the future prospects for NRs. However, their immediate future expansion will depend on continued subsidies, which are becoming difficult to sustain in present economic circumstances. Development of large energy storage facilities and carbon pricing could significantly enhance future NRs prospects as indicated earlier.
Correspondingly, NRs, in spite of their popularity with some governments and sections of the public, are likely to face challenges which will slow their present rapid progress. This also poses problems for power system planners. Their long-term future cannot yet be viewed with certainty. It will be many years before they become a major source of energy for our universe. [1]
24

Draft 06/24/2014
Nuclear power plants face different challenges and prospects, being now shied away from in many industrialised countries and having lukewarm prospects in most developing economies. They currently suffer from large size and high costs, long lead times and many risks – investment as well as regulatory – although the wider diffusion of small modular reactors (SMRs) may modify this outlook. Challenges are compounded by safety and proliferation considerations and a lack of technical skills in many countries. In contrast to renewables, their share of global energy consumption is declining. Nuclear’s share of global electricity generation was as high as 17.6% in 1990; in 2013, it was only 12% - a percentage that is not likely to improve significantly in the near future. 5.1 The Economic and Financial Evaluation of Renewables and Nuclear
The levelised cost of electricity (LCOE) [4], is the traditional method for assessing and listing dispatchable generating facilities according to their annual costs (see Annex), and it applies to assessment of the cost of nuclear. However, it does not directly apply in the case of non-dispatchable technologies, like renewable, due to their intermittency, timing, and therefore unpredictability. Developing the necessary algorithms for such a purpose, particularly in the case of wind energy, is not easy because of the difficulty in forecasting the timing of the wind blowing, its intensity and duration. For example, account needs to be taken of capacity factors achieved by wind energy developments. In the UK it has been confidently claimed that onshore wind energy developments achieve a capacity (or load) factor between 20% and 50%, with an average attained of 30%. In fact, the official statistics demonstrate that for onshore wind energy developments in England the rolling average capacity factor achieved to early 2014 has been barely 24%, and in 2010 nearly 60% of these developments failed even to achieve 20% - yet capital costs will be similar wherever wind energy developments occur onshore regardless of mean wind speeds impacting upon performance. Solar and tidal forms of energy suffer from the same problem to some extent.
5.1.1 Assessing the returns on investment in renewables
To assess the viability and economics of NRs (particularly solar and wind) it is necessary to compute the future stream of the electrical system cost with NRs and compare it with the system cost without the incorporation of NRs.This has also to be weighted with the carbon saving and other intangibles of the NRs. The electric system cost does not only apply to generation facilities but also to the transmission system extension and grid reinforcement as well, which can be substantial in the case of wind technologies. In most cases the electric system cost per kWh delivered with the presence of NRs is going to be higher than in the absence of NRs. The extra cost indicates the extent of the subsidy (feed-in tariff) which needs to be provided, or increase in tariff to consumers to compensate, for these extra costs (NRs’ penalty). Calculating the present worth of system costs without NRs is straight forward. With the incorporation of NRs there is a need for a more elaborate approach. Below we develop a simple, but effective, means to compute the financial and economic effect of incorporating NRs. We have, however, to distinguish between solar energy which is relatively predictable in timing, duration and extent, and that of wind with its short term (if any) predictability in timing, duration and extent; and which can cause disruption to
25

Draft 06/24/2014
dispatching. In addition we need to take account, in the case of solar, the levels of direct and indirect solar variation which will vary between locations – generally higher in lower latitudes and lower in higher latitudes. Also, we need to differentiate if the investment is done by a regulated utility which can pass the extra cost of renewable electricity to consumers or it is executed by independent investors selling in the spot market. These need to comprehend fully the financial implications before committing themselves to a risky renewables investment.
The economic evaluation of power generating technologies should aim at evaluating their market value, that is, the revenue they generate to the provider. This particularly applies to NRs. The market value of NRs is lower than their LCOE due to integration costs. A new concept of ‘System LCOE’ has been developed. It is composed of generation cost plus integration costs. This new term system LCOE is the standard LCOE plus the indirect costs that occur at system level [5, 6]. The integration cost of NRs is additional system costs that are not direct generation cost of NRs. Integration costs of NRs have three cost drivers: variability, uncertainty, and location. It can be said that all generation technologies have integration costs. This is true, but it is more specific and pronounced in NRs due to the variability and unpredictability in dispatching.
The three components of the integration cost (variability, uncertainty and location) mentioned above are shown in the Fig. 5.1 and are defined as follows:
a) Profile (variability) costs occur because wind and solar PV are variable. In particular, at higher shares this leads to increasingly inappropriate load-matching properties. Backup capacities are needed due to variability of NRs. The full-load hours of capital-intensive dispatchable power plants decrease while these plants need to ramp up and down more often.
b) Balancing (uncertainty) costs occur because renewable supply is uncertain.Day-ahead forecast errors of wind or solar PV generation cause unplanned intraday adjustments of dispatchable power plants and require operating reserves that respond within minutes to seconds.
Figure 5.1: System costs of new renewables.
26

Draft 06/24/2014
SOURCE: https://www.pik-potsdam.de/members/Ueckerdt/system-lcoe-working-paper
c) Grid-related (location) costs occur not only because NRs are mostly located far from load centres and large investments in transmission might be necessary, but also because of grid constraints and congestion management.
System LCOE are defined by adding the three components of integration costs to standard LCOE that reflect generation costs. Such integration costs vary from one system to another depending on the extent of penetration of NRs, location and the composition of the dispatchable plant in the generation system. They need to be computed separately for any national grid in order to compute the true market value of NRs. Therefore, the system costs of NRs can be significantly higher than their LCOE as demonstrated in Figure 5.1, though they do come down in the long-term, as the system adapts and integration options increase.
There are now many investors in NRs, ranging from regulated utilities to private investors in the spot market, and from large facilities and investments to individual households investing in small roof top PV installations. New and more advanced ways of investing in NRs are being developed: individual investors, leasing, net metering, etc. Therefore, it is not possible to deal with each case - but general and simple guidelines for assessment should be developed as indicated below.
5.1.2 The Economics of nuclear [7]
Nuclear’s global share as primary energy has been on a slow decline and is not expected to recover in the short to medium term despite a massive construction boom in China and a handful of other centrally-planned economies. This is in contrast to NRs. Hydro’s global share will remain flat while NRs show greater promise, albeit starting from a small base. (See Figure 3.2)
Figure 5.2: Favourable prospects for new renewables and demise of nuclear?
27

Draft 06/24/2014
Source: BP Energy Outlook 2035 [8]
With increasing privatisation and liberalisation of the power generation sector, private investors are not interested in investing in nuclear due to its capital intensive nature, escalating construction costs, long lead times and possible high future risks.
It is only in utilities in centrally-planned power systems that nuclear is still finding some favour. Among the many reasons that are keeping private investors away from nuclear power is the fact that it is difficult to know how much a given project is going to cost by the time the plant goes operational, or for that matter how long it will take to complete the project. This fact alone explains why so few are being built in the West. In centrally-planned economies the cost of capital can be disguised, thus making it difficult to estimate costs across different economic systems.
There are currently only a handful of new reactors under construction in the US. The UK is pushing hard to get two new ones built – with a great deal of difficulty – and only two others are currently under construction in France and Finland, both behind schedule and over budget. Over the next decade more reactors may be retired globally than new ones built. This is contrasted, however, with more robust builds taking place in Asia and India.
Learning over time has not been an evident virtue of the nuclear industry. Practically all technologies for electricity generation, particularly NRs, have been able to reduce their cost over time, except nuclear. This is not only due to more stringent regulations and standards, but also due to lack of standardisation, modularisation and streamlining of regulations and the construction process. This is coupled with safety concerns, particularly those resulting from the three major accidents which nuclear plants have suffered since their inception: Three Mile Island (US), Chernobyl (Ukraine) and (though
28

Draft 06/24/2014
the result primarily of failure to protect a plant from activity from a nearby tectonic plate) the more recent example of Fukushima.
Analysis of the economics of nuclear power must take into account costs and accidents that foreshadow the risks of future uncertainties. To date all operating nuclear power plants were developed by state-owned or regulated utility monopolies where many of the risks associated with construction costs, operating performance, fuel price, and other factors were borne by consumers rather than suppliers. Many countries have now liberalized the electricity market where these risks, and the risk of cheaper competitors emerging before capital costs are recovered, are borne by plant suppliers and operators rather than consumers, which leads to a significantly different evaluation of the economics of new nuclear power plants. [9]
Because of the large capital costs for nuclear power, and the relatively long construction period before revenue is returned, servicing the capital costs of a nuclear power plant is the most important factor determining the economic competitiveness of nuclear energy. The investment can contribute about 70% to 80% of the costs of electricity. The discount rate chosen to cost a nuclear power plant's capital over its lifetime is arguably the most sensitive parameter to overall costs, as detailed below.
The industry consensus is that a 5% discount rate is appropriate for fossil fuel plants operating in a regulated utility environment where revenues are guaranteed by captive markets, and 10% discount rate is appropriate for a competitive deregulated or merchant plant environment. However, an independent MIT study (2003) used a more elaborate finance model distinguishing equity and debt capital, and had a higher (11.5%) average discount rate for nuclear. [9]
Cost of constructing a new nuclear plant varies from one country to another, and is increasing. It depends on location, availability of cooling water, seismic activity, labour and material costs and of course cost of capital. Moody’s, in 2008, estimated the cost of nuclear plant in US to be around $7,000 per KW. Since then this has increased. A new US nuclear power station with more stringent regulation and cost over runs may cost as much as $10,000 per KW. The agreed cost of the Hinkley Point 1,600 MW reactor is £8 billion (i.e. $8,300/KW). The strike price for this plant is expected to be £92.5/MWh, i.e. 15.4 cents/kWh, this is double the UK wholesale electricity cost in 2013 – although currently in line with the subsidised cost of onshore wind energy developments in the UK. The UK government, in taking such an expensive decision, is prompted by the need to comply with EU emissions’ regulations and the phasing out of existing nuclear plants. However, this is not the case in most countries with centrally-planned power systems, government financing and less stringent regulations, where a cost of around $5,000 per KW, or even less, is likely. However the Hinkley Point investment cost and strike price is an indication of the way ahead for nuclear investments, particularly in OECD countries. [10]
5.1.3 Levelised Cost of Electricity Generation (LCOE)
As already mentioned, the cost of nuclear generation
29

Draft 06/24/2014
REPLACE can best be evaluated by USUALLY is evaluated
IS USUALLY evaluated
utilising LCOE. The method for evaluating the cost of electricity generation is the LCOE as detailed in Annex I.
Both the US-DOE (EIA) and the UK publish estimates for cost of generation of nuclear and NRs. The competiveness with fossil fuel plants depends on carbon pricing. If this is not included, as is the case in most centrally-planned power systems, there will be a significant gap between cheap generation utilizing cheap coal in modern coal firing plants and CCGT firing locally available natural gas on the one hand, and the more expensive nuclear and NRs on the other.
The following figures exhibit US LCOE costs for new generation in both year 2020 and 2035 [3]. Note that countries like China and the UAE which may experience lower capital costs for new nuclear, and for them, this figure may be lower.
Figure 5.3: Levelised costs of electricity in the USA for the years 2020 and 2035 (US cents per kWh).
[Coal plant costs include regulatory and environmental uncertainties (i.e. carbon pricing)]
The results of the LCOE calculations by the UK Department of Energy and Climate Change in 2012 are as follows:
30

Draft 06/24/2014
Figure 5.4: The results of the LCOE calculations by the UK Department of Energy and Climate Change. [All estimates are in £ per MWh and real 2012 prices. FOAK = First Of A Kind.]
CCGT OCGT Nuclear-
FOAK
Onshore>5 MW
(UK)
BiomassConversion
Offshore R2
Offshore R3
Large scale
solar PVPre-development Costs 0 5 6 7 1 4 6 0Capital Costs 9 54 64 70 9 77 78 134Fixed O&M 4 23 11 18 10 31 36 24Variable O&M 0 0 3 5 1 1 0 0Fuel Costs 49 73 5 0 86 0 0 0CO2 Capture and Storage Costs
0 0 0 0 0 0 0 0
Decommissioning and Waste Fund
0 0 2 0 0 0 0 0
Total Levelised Costs (without carbon)
62 151 90 101 108 113 120 158
Carbon cost 18 26 0 0 0 0 0 0Total Levelised Costs (with carbon)
80 181 90 101 108 113 120 158
Source: Department of Energy & Climate Change: Electricity Generation Costs 2012, July 2013. [4]
5.1.4 Costing of Nuclear Generation [11]
The life-cycle costs of a project and its feasibility, for a given output, depend on three factors: (i) the investment cost, (ii) the operational costs and (iii) the discount rate utilised. Many planners think that the discount rate is the most important of these three factors. It greatly affects the whole economics of the project and the decision making, particularly in capital-intensive projects like those of the nuclear industry. In spite of its crucial importance in project evaluation, it is surprising how little effort project evaluators exert to research the proper discount rate needed for their project evaluation. Simultaneously, all the efforts in estimating investment and operational costs are rendered worthless by an incorrect choice of discount rates.
Discount Rate
The discount rate utilised in evaluating power generation must reflect the risk involved in investing in this type of generation. Usually the capital asset pricing model (CAPM), is utilised for evaluating discount rates. Simply defined as
expected risk premium on a stock = beta × expected risk premium on market.
Beta is a measure of market volatility in the value of an asset, or a rough measure of risk. Therefore, treasury bills have a beta of zero because they do not carry any risk. The
31

Draft 06/24/2014
average equity in the market portfolio has a beta of 1. Therefore, its risk premium is the average market risk premium of say 7.5 per cent. Betas are typically estimated by performing a linear regression on returns on assets vs. returns on an index. Generally speaking:
expected risk premium on investment = beta × average market risk premium and real discount rate = real risk-free rate + (market risk premium × beta).
Therefore, investment in an asset that has a beta of 0.6 means that the real discount rate for this investment will be equal to 5.2 per cent; (0.7 per cent (which is the risk-free rate) + (7.5 per cent market risk premium × 0.6)).
Investment in established fossil fuel and new renewable generation carries limited risk, say a beta of 0.7 which is less than average market risk. Investment in nuclear facilities is quite risky, as already explained and may carry a beta of twice as much as that of other generation facilities. Definitely it is higher than market risk and its beta can be 1.2 – 1.5, with the discount factor higher than 10%.
Figure 5.5: Sensitivity of nuclear and coal power stations’ costs to discount rate (NOTE: not necessarily universal to all countries).
To demonstrate the importance of discount rates, the cases for nuclear and coal power stations have been compared. The results of the evaluation are demonstrated in Figure 5.6. The Figure gives the price per kilowatt-hour (kWh) of output and shows how the economics of each alternative changes with the discount rate. At low discount rates of less than 7 per cent, the nuclear alternative is cheaper. However, at a discount rate of 9–10 per cent or higher, it is definitely the coal alternative that is in favour, even at high coal prices. Obviously, the discount rate is crucial in such decision making between alternatives.
Figure 5.6: Price per kWh of output for nuclear and coal and indicative investment cost.
Nuclear Coal
32

Draft 06/24/2014
Investment cost (£ m)Operating costs/ kWhFuel cost/ kWh
15270.37p0.45p
8950.46p1.43p
Note: numbers are only indicative and do not represent today’s cost; the picture may be more favourable for nuclear in Asia and the UAE.
AND ATANOTEHR TIME IN THE USA
From Figure 5.6 it is clear how, for evaluation purposes, the cost per kWh generated is greatly affected by the discount rate for high capital-intensive investments, like those of a nuclear power station. The cost of 2p per kWh more than doubled when the discount rate was increased from 4 per cent to less than 11 per cent. Between these two discount rates, the cost of each kWh from a coal power station, which is less capital intensive but has a much higher operational cost, increased by less than one-third.
Capital Costs
The aim of a nuclear power program is to generate energy, and more explicitly electricity, at a cost that fits the economic needs of the country at issue. In practice, because the cost of reactor fuel is typically a modest component of electricity cost (seldom as large as 20%, typically 10% or so), and operating costs are typically in a similar range, the capital cost of building a power reactor is perhaps the major economic issue standing in the way of a major worldwide expansion of nuclear power.
This fact has led to an emphasis on capital cost as the major design figure-of-merit of the new large LWR reactors, albeit with limited (or at least spotty) success. It is true that all of the newer large LWR designs are less expensive than earlier ones because of the emphasis on the part of the design teams on cost containment. Whether this reduction is sufficient is the issue. A few years ago, it appeared that in the developed world the capital cost of these new LWRs was in a competitive range with other new baseload capacity. However, recent sharp declines in natural-gas prices (especially in North America but elsewhere too to a varying extent) have made large-LWR capital costs seem highly uncompetitive. This is exacerbated to the extent that the “externalities” cost of CO2 emissions from fossil-fired electricity stations are not captured in the cost or price of electricity. The widespread advent of electricity from renewable sources, even for those technologies (solar, wind) that are intermittent, is another factor, especially in countries that provide feed-in tariffs as incentives for renewables. How this will play out in the next decade in the developed world is unclear.
Another issue with nuclear power plant development is the cost of capital, because except in centrally-controlled economies (such as China) a risk premium is usually a factor when capital must be raised in the commercial capital markets. This premium reflects the perceived additional risks (financial risks as well as safety-security risks) associated with the technology. This issue is discussed elsewhere in this report.
33

Draft 06/24/2014
In the developing world, where capital is often all the more scarce, the emphasis has shifted somewhat to the idea of deploying the proposed new smaller (modular) designs, mainly so that capital investments can be made in smaller-sized investment packages – capacity would be added as needed by building additional small reactors one-by-one on a given site. (Of course, these smaller designs are also aimed at the electricity markets in the developed world.)
Load-Following: An Operational Cost Issue
Because a power reactor’s capital cost is such a large component of the total cost of electricity, it has seldom made economic sense to use such a reactor in a “load-following” mode -- that is, in a mode in which its output would vary from hour to hour as the demand on the grid changes. However, deployment of large amount of renewable electricity sources on a grid may make the desire for reactor load-following more important in the future. Besides the financial issues, there are also important technical considerations: frequent cycling of a reactor up and down in power can induce thermal and mechanical stresses on equipment for which some of them may not have been designed. While it is probably feasible to design a large power reactor to account for these technical issues, especially if the power excursions are limited to the 10% to 20% range for a modest fraction of the time (which would not affect overall economic viability very much), the technical feasibility has not been convincingly demonstrated yet. Therefore, using such reactors in load-following mode (daily or weekly) is an option that still requires technical evaluation and perhaps technical development for the future.
Countervailing Factors Supporting Nuclear Economics
The analysis suggests that nuclear power plants will not be built in liberalized power markets without government guarantees. If nuclear power plants built with government support or those built by state-owned power industries prove that nuclear power plants can be reliably built at a competitive cost, power plant economics will be a significant positive factor for the nuclear industry, especially taking into consideration national commitments to reduce greenhouse gas (GHG) emissions. If costs continue to increase over the estimates being used by the IEA and EIA, power-plant economics become a significant negative factor for the nuclear industry that may not be offset by pricing CO2 emissions.
These findings do not apply to reactor projects in many Asian countries. Nuclear power is estimated to enjoy a more favourable cost advantage than in the United States, Europe or Japan. In addition, private financing is less important in many Asian countries and delays due to licensing problems are less likely. Given the high electricity demand growth expected in Asia, more competitive costs, and government support, it is not surprising that over 60% of currently-planned nuclear reactors are in Asia.
Uncertainty in Nuclear Power Plant Costs
Cost estimates for Generation III+ power plants have been based on vendor estimates rather than actual experience (Kessides, 2010). These estimates might underestimate future nuclear power plant costs compared to estimates for other power technologies that
34

Draft 06/24/2014
are based on numerous actual projects and contracts. Generation III plant designs emerged in the 1990s. The cost estimates for these designs were typically in the neighborhood of $1,000 per kWe. As these designs have evolved, current U.S. or European cost estimates have grown to be several times higher. Plant cost estimates in the United States currently range from $2,500/kWe to $10,000/kWe. If the outlier cost estimates are deleted, current U.S. cost estimates range from $4,200/kWe to $6,600/kWe (Thomas, 2010). Unfortunately, there is no assurance that cost escalation will not continue. Past experience in the U.S. nuclear power industry is not encouraging. For example, between 1974 and 1975, fourteen power plants were estimated by utilities to cost, on average, $1,263/kWe. Actual costs averaged $4,817 (281 percent overrun). While the cost overrun for these 1974-75 plant start ups were higher than earlier plants, the average cost overrun for all U.S. nuclear power plants was 207 percent (Schlissel, D., Biewald, B., 2008).
Technology Learning
Predictions of future energy technology costs usually employ the concept of technology learning. The general principal is: for each doubling of capacity of a new energy technology, cost goes down by a fixed percentage (IEA 2000). Since the nuclear industry is well established, additions to capacity would fall well short of any opportunity for further technology learning unless the Generation III and III+ designs were judged to be sufficiently different than Generation II reactors to be new technologies. Most estimates of future nuclear technology costs do not view them as such and do not anticipate cost reductions in Generation III reactors. For example, the cost estimates for a European Generation III+ in the 2011 WEO remain constant at $3,800/kWhr from 2015 through 2035.
An analysis of the cost trajectory of the French nuclear reactor fleet indicates that construction costs, in constant dollars, have increased over time (Grubler, A., 2010). While this is consistent with U.S. experience (described above), it may be surprising since the French reactor fleet is generally regarded as the most successful and well-managed nuclear power deployment, in part, by avoiding the U.S. experience of building many different designs each requiring individual regulatory assessments.
Going forward there may be reasons for nuclear reactor costs to systematically increase. About 60% of the cost of a nuclear reactor stem from on-site engineering as opposed to the major equipment items (reactor vessel, steam generators and turbines). Reactor cooling is also an important cost component that has increased. In particular, environmental regulations to protect fish and other species have made it more likely that cooling towers would be required when reactors are located on rivers.
With high Asian economic growth that is not expected to lessen, the demand-supply balance for construction materials is likely to produce higher prices. For example, metallurgical coal prices are now at record levels despite a weakening world economy. As with petroleum, the supply of mineral resources is not likely to keep up with high world demand growth at constant prices. Likewise engineering and labour costs are likely to increase with high economic growth. Compared to the opportunities to reduce
35

Draft 06/24/2014
the costs of manufactured products, large nuclear power plants appear to face the likelihood of higher costs, not lower costs.
Importance of Capital Cost Escalation and Other Risks in Liberalized Power Markets
Risks of cost over-runs are less likely to deter nuclear power plants investments in uncompetitive power markets or state-owned enterprises. A costly power plant in these markets will not necessarily have adverse consequences on investors as the higher cost can be averaged into the existing fleet of power plants. A private investor in an uncompetitive State-regulated power market would still receive the normal rate of return. A state-owned company likewise passes on the incremental costs to ratepayers or the government incurs higher electric subsidy costs.
A liberalized power market presents an entirely different picture to an investor. Delays and cost over-runs not only threaten to diminish their rate of return but put the investment itself at risk. This risk is compounded by five factors: 1) nuclear power has high capital costs per kilowatt of electrical generating capacity (kWe) compared to natural gas or coal power plants; 2) nuclear power has large economies of scale and require large investments for a unit of investment (1 gigawatt or more); 3) having high capital costs, nuclear power is more vulnerable to increases in material costs and construction delay; 4) construction delays are more likely due to uncertainties in the regulatory process, especially for new plant designs; and 5) because of potential public and NGO opposition to nuclear power, construction delays can also be caused by delays in issuing local permits, lawsuits and political pressure. Because of these risk factors, financing is not feasible without government guarantees. Equity financing is typically not an alternative to debt financing as it is difficult to ask shareholders to forgo dividends and accept risk that banks were unwilling to take.
Recognizing these barriers to nuclear power plant investments, the U.S. government established government subsidies and risk-sharing for nuclear power plants in the Energy Policy Act of 2005. These included production tax subsidies for the earliest new nuclear plants, guarantees against regulatory delays and a loan-guarantee program to attract private financing. While no new nuclear plants have been built take advantage of the production tax subsidies, the U.S. Department of Energy (DOE) has issued two loan guarantees for two 1.1 gigawatt Westinghouse AP1000 nuclear reactors at the Vogtle generating plant. Like all of the several loan-guarantee applications DOE received, these new plants would be built at an existing nuclear plant campus. The project sponsors include the Georgia Power Company. Notably, the Georgia Power Company does not operate in a liberalized power market. The Georgia Power Company is fully regulated by the Georgia Public Service Commission. Competition is limited to customers with manufacturing or commercial loads of at least 900 kW. The Vogtle plants received $8.33 billion of DOE loan guarantees, or approximately $3,800 per kWe capacity. The plants are estimated to cost $11.9 billion or $5,000 per capacity (Thomas, 2010). A project such as Vogtle should enjoy low interest rates. The project is guaranteed in two ways: first, the DOE loan guarantees ensure that the banks will receive 76% of the total estimated plant cost; and second, the Georgia Public Service
36

Draft 06/24/2014
Commission will likely guarantee any remaining exposure to the Georgia Power Company.
Because of the high cost to build a single nuclear power plant, along with the likelihood of delays and cost overruns, Moody’s Investors Service has characterized a decision to build a nuclear power plant as a “bet-the-farm” risk. “From a credit perspective, companies that pursue new nuclear generation will take on higher business and operating risk profile, pressuring credit ratings over the intermediate- and long-term…Of the 48 issuers that we have evaluated during the last nuclear building cycle (1965-1995), two received ratings upgrades, six went unchanged and 40 had downgrades…the average downgrade fell four notches” (Moody’s Global). It is notable that these credit downgrades affected utilities that were mostly operating in a state-regulated environment where regulators have effectively transferred the utilities’ risks to ratepayers. Moody’s concludes that utilities that pursue new nuclear power plants will experience credit downgrades and should: 1) rely on strategic partnerships; 2) increase reliance on equity financing; 3) moderate dividend policies to increase cash flow; and 4) adopt a “back-to-basics” focus on core electric utility operations. These recommendations are aimed at utilities that “can expect regulators to support the financial health of the utilities they regulate and will authorize recovery of investments and costs over a long time frame” (Moody’s Global 2009). In a liberalized power market where power companies and investors would not enjoy such protections, the risk of credit downgrade would be much higher.
Small Modular Reactors
The smaller (modular) reactor designs hold out a promise of lower costs due to factory fabrication, simpler operating features, and simpler, less capital-intensive design features. They also have the promise of being safer, meaning requiring less safety equipment. The issue with these new smaller (modular) reactor designs is that, until they go into production, their potential cost advantages will not have been demonstrated. This is a classic “chicken-and-egg” dilemma, of course. How it will play out is still for the future.
5.2 Subsidies
Subsidies are an integral feature of the economics and costing of both NRs and nuclear. These subsidies are usually driven by two considerations: the first, “green” features with no carbon emissions during production; the other, that they provide a measure of local energy security being not dependent on imported fossil fuels or depletable resources.
5.2.1 Subsidies of renewables
Subsidies to NRs, mostly in OECD countries, take many forms both direct and regulatory. They are mainly in:
Capital subsidies and loan guarantees to manufacturers.
37

Draft 06/24/2014
Feed-in tariffs (FiT) to consumers. These provide financial encouragement to convert small electricity consumers (mainly households) into producers.
Production tax credits (PTC) for investors. Renewable portfolio standards (RPS) that ensures that a segment of electricity
production goes to NRs (mandatory targets). Tradable energy certificates. Priority in dispatching, guarantee to access transmission lines and long term
contracts. Carbon pricing and taxation.
Feed-in tariffs (FiT) are generally considered to provide the best inducement towards encouraging investment in NRs particularly to individual domestic suppliers. Feed-in tariffs are a generic class of polices that guarantee a set payment for electricity production from certain sources that feed the grid. This provides home owners as well as many establishments with an incentive to invest in solar panels, with a secured return on their investment. In 2004, the German government, which was in the forefront of such subsidy providers, guaranteed investors almost 60–70 cents per kilowatt-hour (kWh) they generate for the next two decades from photovoltaic generation (PV). This compares most favourably with German retail prices of 21–24 cents per kWh. Germany was not the only country to adopt FiT; similar practices were adopted by many European countries leading to expansion of uneconomical individual and community PV generation. However, such a bonanza cannot go on as market realities and economic hardships have begun to dawn. Recently, Germany decided that solar PV incentives will fall to 19.5 cents per kWh for smallish installations, 16.5 cents for installations up to 1 MW, and 13.5 cents for larger installations with gradual cuts of 0.15 cents per kWh per month.
The cost of solar panels, particularly rooftop systems has been dropping recently, particularly due to the reduction of the cost of Chinese panels. In Germany, the cost was around 2,900 euro per kW in 2010, this dropped to around to 1,900 euro in 2012. This was mainly due to the drop in the cost of manufactured panels which recently went down from 1,000 euro per kW to less than half of that. Yet it should be realised that the cost of labour, connections and other infrastructure did not significantly drop. These now constitute more than half cost of the system and are not likely to improve significantly in the future.
Subsidies for PV facilities have, from their inception until 2012, generated over 100 billion euros to consumers in Germany, despite the fact that PV plants only account for 3 per cent of electricity generation in Germany. Correspondingly, the cost of this huge subsidy increased the bill of German households by around 25 per cent between 2007 and 2011, putting a large burden on low income and seniors in the country. The domestic tariff in Germany is now 25.3 euro cents (32 US cents) per kWh, one of the world’s highest. Taxes and FiT account for almost half of this. Many wind energy investors now claim that they can produce electricity at a cost comparable to that of the national grid. This may be true in abstract terms but it ignores system effects, the multiple restrictions and other expenses, particularly new transmission investments, grid reinforcement and dispatching restrictions, associated with such generation, some of these are already mentioned and further detailed below. What is important is system
38

Draft 06/24/2014
cost, how much (positively or negatively) is the system affected by the introduction of the NRs. These costs do not yet allow wind energy to provide competitive electricity without subsidy in one form or another of the many incentives mentioned above. Solarbuzz, a solar market research and analysis firm, provides data for solar electricity costs in the US range from 28.91 cents per kWh in sunny climates to a very high 63.60 cents per kWh in cloudy ones. This is many times the 11–12 cents per kWh cost of grids utilising fossil fuels generation.
There is also the issue of what we mean by costs. Where modern biomass or biofuels undermine ecosystems, biodiversity, agricultural land and water availability (with knock-on effects on food supplies and prices), as explained in a later section, it surely behoves policy makers to heed a broad definition of costs.
The fact remains that most NRs, without governmental subsidies and intervention cannot compete, in most cases, with traditional thermal power generation practices and facilities. No new private NRs investment would venture into the market without support or encouragement of some form or another. With the present global economic challenges, future NR projects may not continue to enjoy the type of governmental favours of the past. The market future of NRs is challenging to new investments, and needs careful assessment as detailed below. With the increasing amount of variable-output NRs in the network, there is a need also to increase flexible generation. This can be not only in the form of hydroelectric plant or pump storage schemes if they exist, but also in the form of rapidly dispatchable single cycle gas turbines and diesel generation which can rapidly respond to load variation.
The WEO 2013 [2] reckons that in 2011, renewables excluding large hydro received an estimated $88 billion in subsidies in various forms, up 24% from 2010, of which $64 billion went to electricity and the remainder to biofuels (Figure 3.8). Solar PV received more than any other renewable energy technology for electricity generation ($25 billion), followed by wind ($21 billion) and bioenergy ($15 billion). In the new Policies Scenario, total future subsidies to renewables will grow to about $185 billion in 2020 and reach almost $240 billion per year by 2035. Support provided to bioenergy for power generation continues to grow over time, reaching $69 billion in 2035, exceeding that received by any other technology. The amount received by solar PV grows rapidly in the medium term, reaching $77 billion in 2027, before falling to $58 billion in 2035, as retired installations are replaced by new less expensive capacity. Onshore wind power receives more support each year until around 2020, before falling to $14 billion by 2035, as this technology becomes increasingly competitive. Biofuels receive $24 billion in 2011, increasing to $46 billion in 2020 and $59 billion in 2035, with the vast majority going to conventional biofuels in 2035.
Figure 5.7: Subsidies paid out, and anticipated, to new renewables (excluding hydro) in US $ millions (2013).
39

Draft 06/24/2014
Source: WEO 2013. Note: Other includes geothermal, marine and small hydro. CSP = concentrating solar power [2]
While subsides to NRs in the power sector increase in total, they decline on a per-unit basis as the cost of NR technologies fall and electricity prices increase, mainly due to higher fossil fuel prices and the introduction – in some regions – of a carbon price.
5.2.2 Subsidies to Nuclear [7]
THIS IS BIASSED
SUGGEST ADDING
LIKE ALL FORMS OF ENERGY its development depends on SUBSIDIES
Nuclear benefits from various forms of government support and subsidies involving liability limitations, preferential financing rates and export credit agency subsidies. However, the most important subsidies to the nuclear industry do not involve cash payments. Rather, they shift construction costs and operating risks from investors to taxpayers and ratepayers, burdening them with an array of risks including cost overruns, defaults to accidents, and nuclear waste management. This approach has remained remarkably consistent throughout the nuclear industry's history, and distorts market choices that would otherwise favour less risky energy investments.
In fact, once the total actual and potential costs of modern biomass and biofuels schemes, or sub-optimally located wind and solar energy schemes, are fully factored in this broad generalisation may not withstand close examination.
5.3 Advanced / Next Generation Technologies [13]
40
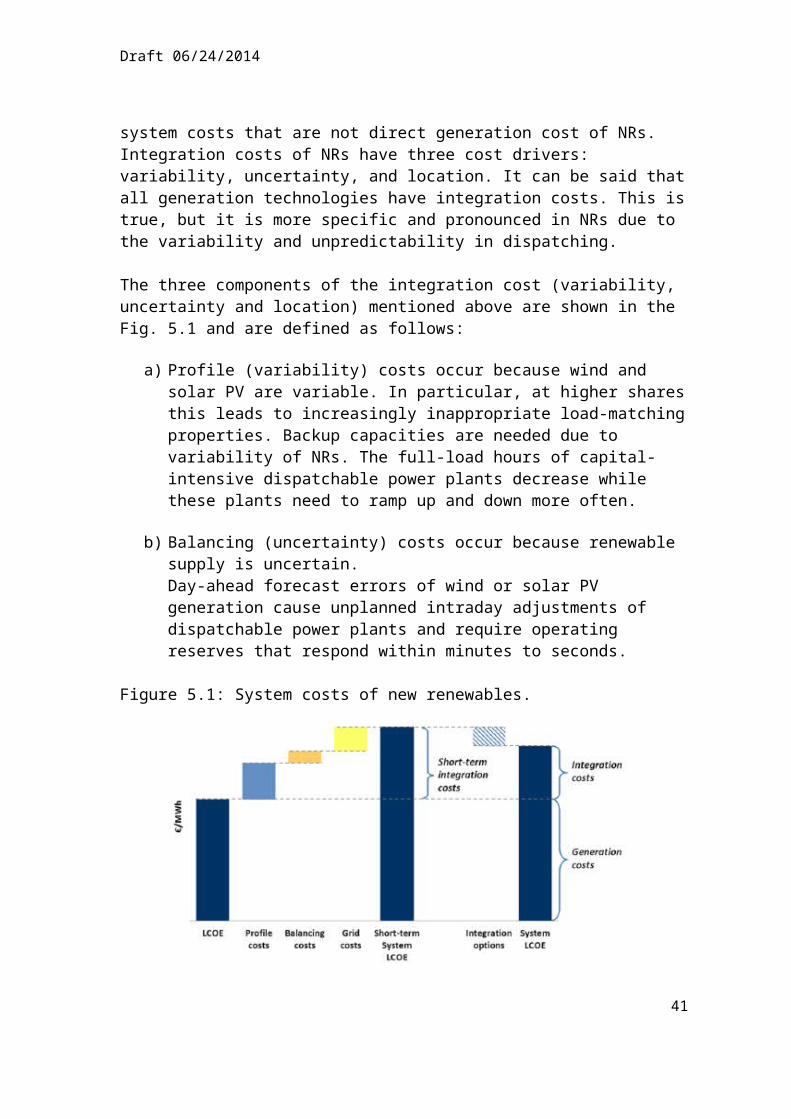
Draft 06/24/2014
We have already explained that the nuclear industry has not been able, for many decades, to reduce the cost of nuclear facilities. On the contrary, these have been increasing over time due to the rising cost of materials and difficulty of financing coupled with increasingly stringent regulations prompted by recent nuclear accidents and public awareness. Learning over the last few years did not assist in reducing the cost of nuclear due to lack of modularisation, standardisation, streamlining of regulations, and procurement/ construction process. Therefore the answer to nuclear’s future lies in dealing with the above, and answering the following, cost considerations:
Scale effects: Can the increase in the size of the plant lead to a reduction in the construction costs per MW installed? Alternatively, can the widespread diffusion of small modular reactors (SMRs) reduce construction costs per MW installed?
Modularization: Can the building of more components in factories and less on site (for large plants or SMRs) reduce construction time and cost?
Standardization and cumulative experience: Can capital cost reductions be achieved in standardizing plant designs and constructing similar plants in large series?
Regulation: Can the regulatory framework reduce the risk of cost overruns while providing adequate safety levels?
Procurement and competition: Can improved competition and procurement contracts result in significant cost reductions? [14]
5.4 Challenges to System integration of renewables and nuclear [7] [11]
As discussed above, one of the main challenges to NRs and nuclear is their integration in the power generation systems. If the contribution from NRs is small, say less than 10%, these problems are manageable. However, when their penetration assumes significant proportions then these pose serious challenges to system operation and cause an increase in system costs.
5.4.1 Examples of Estimated System Costs
Many countries have enacted official targets for renewable power share for their grids, and others are considering them. US states are doing so as well. This is leading to increasing shares in a number of jurisdictions. Consequently the challenges for grid operation caused by the intrinsic character of the intermittent nature of wind and solar are being faced by real world grid operators. Further, since these targets are typically still higher for future years, various planners have been engaged to forecast future operations and their costs.
The following are some costs calculated by the OECD NEA. They are presented with strong caveats in the original source. They are included here to be illustrative of the fact that these costs are believed to be real and significant. Further they vary by power system.
Figure 5.8: Grid-level system costs in selected OECD countries ($/MWH)
41

Draft 06/24/2014
Finland
Technology Nuclear Coal Gas Onshore wind
Offshore wind Solar
Penetration level 10% 30% 10% 30% 10% 30% 10% 30% 10% 30% 10% 30%
Back-up costs (adequacy)
0 0 0.06 0.06 0 0 8.05 9.7 9.68 10.67 21.4 22.04
Balancing costs 0.47 0.3 0 0 0 0 2.7 5.3 2.7 5.3 2.7 5.3
Grid connection 1.9 1.9 1.04 1.04 0.56 0.56 6.84 6.84 18.8
6 18.86 22.02 22.02
Grid reinforcement and extension
0 0 0 0 0 0 0.2 1.72 0.12 1.04 0.56 4.87
Total grid-level system costs
2.37 2.2 1.1 1.1 0.56 0.56 17.79 23.56 31.3
6 35.87 46.67 54.22
France
Technology Nuclear Coal Gas Onshore wind
Offshore wind Solar
Penetration level
10%
30%
10%
30%
10%
30% 10% 30
% 10% 30% 10% 30%
Back-up costs (adequacy)
0 0 0.08
0.08 0 0 8.14 8.6
7 8.14 8.67 19.4 19.81
Balancing costs
0.28
0.27 0 0 0 0 1.9 5.0
1 1.9 5.01 1.9 5.01
Grid connection
1.78
1.78
0.93
0.93
0.54
0.54 6.93 6.9
318.6
418.6
415.9
7 15.97
Grid reinforcement and extension
0 0 0 0 0 0 3.5 3.5 2.15 2.15 5.77 5.77
Total grid-level system costs
2.1 2.1 1 1 0.5 0.5 20.47
24.1
30.83 34.5 43 46.6
Germany
Technology Nuclear Coal Gas Onshore wind
Offshore wind Solar
Penetration level
10%
30%
10%
30%
10%
30% 10% 30% 10% 30% 10% 30%
Back-up costs (adequacy)
0 0 0.04
0.04 0 0 7.96 8.84 7.96 8.84 19.2
219.7
1
Balancing costs
0.52
0.35 0 0 0 0 3.3 6.41 3.3 6.41 3.3 6.41
Grid connection 1.9 1.9 0.9
30.93
0.54
0.54 6.37 6.37 15.7
115.7
1 9.44 9.44
Grid reinforceme 0 0 0 0 0 0 1.73 22.2
3 0.92 11.89 3.69 47.4
42
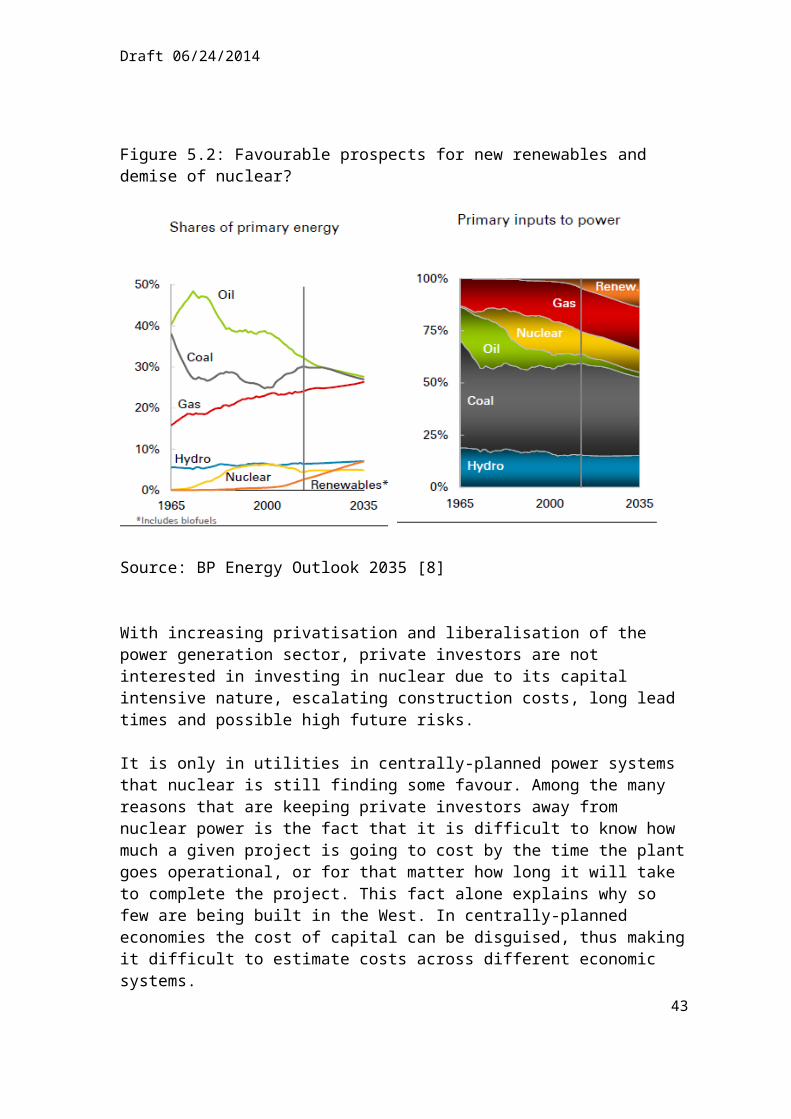
Draft 06/24/2014
nt and extension Total grid-level system costs
2.4 2.3 1 1 0.5 0.5 19.36 43.9 27.9 42.9 35.6 83
Republic of Korea
Technology Nuclear Coal Gas Onshore wind
Offshore wind Solar
Penetration level
10%
30%
10%
30%
10%
30% 10% 30% 10% 30% 10
% 30%
Back-up costs (adequacy)
0 0 0.03
0.03 0 0 2.36 4.04 2.36 4.04 9.2
1 9.4
Balancing costs
0.88
0.53 0 0 0 0 7.63 14.1
5 7.63 14.15
7.63
14.15
Grid connection
0.87
0.87
0.44
0.44
0.34
0.34 6.84 6.84 23.8
523.8
59.24 9.24
Grid reinforcement and extension
0 0 0 0 0 0 2.81 2.81 2.15 2.15 5.33 5.33
Total grid-level system costs
1.7 1.4 0.5 0.5 0.3 0.3 19.64 27.8 35.9
9 44.2 31.4 38.1
United Kingdom
Technology Nuclear Coal Gas Onshore wind
Offshore wind Solar
Penetration level
10%
30%
10%
30%
10%
30%
10% 30% 10% 30% 10% 30%
Back-up costs (adequacy)
0 0 0.06
0.06 0 0 4.0
5 6.92 4.05 6.92 26.08
26.82
Balancing costs
0.88
0.53 0 0 0 0 7.6
314.1
5 7.63 14.15 7.63 14.15
Grid connection
2.23
2.23
1.27
1.27
0.56
0.56
3.96 3.96 19.8
119.8
115.5
515.5
5Grid reinforcement and extension
0 0 0 0 0 0 2.95 5.2 2.57 4.52 8.62 15.1
8
Total grid-level system costs
3.1 2.8 1.3 1.3 0.6 0.6 18.6 30.2 34.0
5 45.4 57.9 71.7
United States
Technology Nuclear Coal Gas Onshore wind
Offshore wind Solar
Penetration level
10%
30%
10%
30%
10%
30% 10% 30% 10% 30% 10% 30%
Back-up 0 0 0.0 0.0 0 0 5.61 6.14 2.1 6.85 0 10.443

Draft 06/24/2014
costs (adequacy) 4 4 5
Balancing costs
0.16 0.1 0 0 0 0 2 5 2 5 2 5
Grid connection
1.56
1.56
1.03
1.03
0.51
0.51 6.5 6.5 15.2
415.2
410.0
510.0
5Grid reinforcement and extension
0 0 0 0 0 0 2.2 2.2 1.18 1.18 2.77 2.77
Total grid-level system costs
1.7 1.7 1.1 1.1 0.5 0.5 16.3 19.8 20.51 28.3 14.8 28.3
(Source: OECD, pp 127-128)
These are rather heroic calculations given the paucity of sources, but they do indicate plausible effects. Increasing the penetration of renewable has small effect on backup costs since they tend to increase in direct proportion to the renewable capacity (MW) that needs back up and the increased capacity adds proportional MWH. However, balancing costs increase because more spinning reserve capacity is required at lower load factors. As penetration increases, grid reinforcement and extension costs increase because the grid must be extended farther afield to find suitable renewable sources, and outer reaches of the grid must be reinforced to carry the increased load. (As a side note, backup and balancing is less costly in the US because the dispatchable power is typically gas fired which is less costly there.)
A further inference can be suggested from these results: it is that the marginal system costs will generally increase with increased penetration of renewable essentially because of their intermittency and tendency for remote locations.
In addition to marginal system cost per MWH, there is another critical metric: marginal cost per ton of CO2 emissions reduced by increased deployment of renewables. After all, that is a primary policy driver for renewable targets.
The state of California has set ambitious goals for renewable penetration: 33% by 2020, not including hydro. Further even more has been considered (up to 51% in a legislative proposal) for the future. The 33% level is thought to engender an implicit cost of carbon reduction of $50/ton. A number of power generators commissioned a recent study to investigate the problems and costs associated with increasing that target up to 50%. As the following table shows, the resulting estimates are $340 per ton for 40%, and a lowest cost $403 per ton for 50%. However, the Diverse Scenario is based on assumed flexibility benefits occasioned by 5000 MW of storage or advanced demand response. Recent trends are that increased renewable capacity has come in the form of large solar. Extending this yields $636 per ton.
44

Draft 06/24/2014
Figure 5.9: Implied cost of carbon abatement in 2030 for each Scenario relativeto the 33% RPS Scenario (Source: Energy and Environmental Economics, p. 144.)
5.5 Conclusions
Both renewables and nuclear face significant economic challenges. The costs associated with renewable technologies have consistently been higher than those for building fossil-fuelled power plants, although renewables costs (especially solar PV) are decreasing. Furthermore, renewables cost estimates may not fully include systems integration costs. For nuclear, the capital costs remain a major challenge; the cost of financing new nuclear plants is very high in many countries, owing to investors’ fears about time, technology, regulatory, and safety risks. These issues may not be as large for state-owned companies or regulated markets for which utilities have ready access to inexpensive capital, and this partly explains why enthusiasm for nuclear reactors is much stronger in Asia than in the US or Europe. Learning could help decrease costs for both types of technologies, but the track record for learning-by-doing in the nuclear sector is not good (though this may change with small modular reactors if they can be fabricated by manufacturing process).
Both nuclear and renewables receive subsidies that vary by country and region. Some subsidies are direct, like feed-in-tariffs for renewables, while others shift risks from utilities to customers.
The following recommendations would help establish a better accounting for the costs of nuclear and renewables, and could help support cost reduction of both:
1. Comparisons of nuclear and renewables costs should account for systems integration and differences in capacity factors.
45

Draft 06/24/2014
2. In order to estimate nuclear costs, more attention should be given to the choice of discount rate, as the discount rate drastically impacts the relative economic attractiveness of a nuclear project.
3. Studies of the technical issues that may impede using a nuclear reactor in “load-following” mode are important and should be given high priority.
4. Priority should be given to new reactor technologies like SMRs and regulatory reform in order to reduce nuclear capital costs.
References1. IEA. (2013): ‘Renewable Energy Mid-term Market Report, 2012’, OECD/IEA
20132. IEA. (2013): ‘World energy Outlook 2013’3. EIA. (2013): ‘Annual Energy Outlook, 2013’, US/EIA 20134. Department of Energy & Climate Change: Electricity Generation Costs 2012,
July 20135. Hirth, L: ‘The market value of variable renewables, the effect of solar wind
power variability on their relative price’. Energy Economics, 2013, 38,218–236
6. Vithayasrichareon, P. and MacGill, I.: ‘Assessing the value of wind generationin future carbon constrained electricity industries’. Energy Policy, 2013,53, 400–413
7. Wikipedia, ‘Economics of nuclear power plants’8. BP Energy Outlook 20359. The Future of Nuclear Power. Massachusetts Institute of Technology. 2003.
ISBN 0-615-12420-8. 10. Morris, C. (2012): ‘German solar bubble’. European Energy Review, 5 July 201211. Solar electricity prices. Solarbuzz.com, March 2012 update12. Benjamin K. Sovacool (2011). Contesting the Future of Nuclear Power: A
Critical Global Assessment of Atomic Energy, World Scientific, p. 126.13. EEnergy Informer, The International Energy Newsletter, March 201414. W. D’haeseleer, Synthesis of the economics of nuclear energy, for the EC, Nov
201315. IEA 2000, Experience Curves for Energy Technology Policy, International
Energy Agency Paris, 200016. Grubler, A. 2010, The costs of the French nuclear scale-p: A case of negative
learning by doing, Energy Policy, 201017. IEA-NEA 2010, Projected Costs of Generating Electricity, 2010 Edition,
International Energy Agency and the Nuclear Energy Agency, Paris, 201018. Kessides, I., 2010, “Nuclear power: Understanding the economic risks and
uncertainties”, Energy Policy, April 201019. Joskow, P.L., Parsons, J.E., 2009, “The economic future of nuclear power”,
Daedalus, Fall 200920. Moody’s Global 2009, New Nuclear Generation: Ratings Pressure increasing,
Moody’s Investors Service, New York, June 2009
46

Draft 06/24/2014
21. Schlissel, D., Biewald, B., 2008, Nuclear Power Plant Construction Costs, Synapse Energy Economics, Inc., Cambridge, July 2008
22. Thomas, S., 2010, The Economics of Nuclear Power: An Update, Heinrich Boll Stiftung Foundation, Berlin, March 2010
23. World Nuclear Association 2012, WNA Reactor Data Base, 25 June, 2012
6. Electricity Storage
A central challenge for grid operators, described in detail in previous sections, is matching electricity supply to demand. The challenge increases when more of the electricity supply is composed of intermittent renewable resources, and the trend is up for renewables on many nations’ electricity grids. Besides this operational challenge, intermittent renewables pose market challenges for baseload resources. For example, at night when the wind blows strongly and electricity demand is low, prices are suppressed but nuclear units generally cannot power down. If more renewables lead to more sustained price suppression, baseload units have trouble recovering their costs.[1]
Several system options could help balance electricity supply and demand with different mixes of intermittent, baseload and load-following generation capacity. One alternative is to match each renewable installation with full backup capacity (typically natural gas) such that all the combination of renewables and back-up is reliable and dispatchable. This, however, would increase the cost of renewable generation, and reduce the environmental benefits of renewables. A second option is to build substantial transmission capacity, so that a drop in renewable electricity generation in one area (e.g. due to clouds over solar panels) could be compensated for by electricity production in another region. In the U.S., studies have shown that 45% penetration of renewables is achievable with the current transmission system,[2] and as much as 80% renewable penetration can be achieved by expanding transmission capacity, including increasing the number of interties between the Eastern and Western grids and building transmission backbone lines to bring Midwest wind to the coasts.[3] Smaller grids, however, may not have sufficient capacity or geographic diversity to accommodate sudden, large shifts in supply. Furthermore, even in the U.S., cost and permitting issues are major barriers to achieving significant transmission capacity expansion. A third option for managing intermittency is to increase cycling of baseload plants, but this can be challenging and costly, especially for nuclear power. Demand response (DR), or contracting with consumers to reduce demand when the grid is short on supply, is yet another option to ensure matching of supply and demand; large DR potential remains in many countries and has relatively few drawbacks, other than challenges with consumer acceptance and eventual limitations for how much DR the system can sustain.
An important additional option to integrate varied generation sources, match electricity supply and demand, and allow generation sources to dispatch power at a profit is electricity storage.[4] In theory, if electricity storage could be deployed widely, grids of any size could sustain a wide range of profiles of intermittent and baseload power. Storage systems enable arbitrage of renewable generation, in which power is bought at times when demand is low, power is cheap, and renewables are generating, and then sold back when power prices are high. They can also provide ancillary services to the
47

Draft 06/24/2014
grid. At the consumer level, they can provide backup power and help maximize use of distributed generation systems. Storage, however, is currently costly, and most market structures worldwide do not favour its adoption because they do not allow remuneration for the flexibility benefits storage provides. Because neither storage nor the other options described above are without drawbacks, integrating high levels of renewables with baseload power may require a combination of strategies to meet multiple objectives. Among these strategies, energy storage is of particular interest because storage systems are flexible, may be carbon-free, and are scalable. However, high costs are currently a barrier.
The next section gives an overview of grid-scale storage technologies in various stages of development and deployment. Following sections discuss existing energy storage installations, valuing energy storage on the grid, and R&D efforts on storage. The emphasis throughout this report is on large storage systems that have the ability to provide grid-level renewables integration services, including electricity arbitrage and ancillary services like frequency regulation.
6.1 Overview of Selected Storage Technologies
Cost estimates can be challenging for storage technologies, as costs vary widely by geography (especially for pumped hydro and compressed air systems), and are hard to estimate for emerging technologies. Table 6.1 provides an overview of technology costs, and each is discussed further (with references) below.
Table 6.1 Summary of Storage Technology CostsTechnology Cost/kW (power) Cost/kWh (storage)Pumped Hydro $1500-$4300 $250-430Compressed Air $800-$1500 $125/kWhFlywheels up to $4000 $200-$500Lead-Acid $1700 - $4900 $450-$950Li-ion $500-$850NaS $3100-$3300 $520-$550Flow Batteries $3100-$3700 $520-$550Hydrogen $1150
Pumped Hydroelectric
Pumped hydro is the most mature, widely-deployed energy storage technology. Pumped hydro facilities include high and low water reservoirs, typically with elevation differences in the hundreds of meters range. During periods of electricity storage or “charging,” water is pumped from the lower to the higher reservoir, and then when electricity is needed, the water flows from the high reservoir to the lower through a hydroelectric turbine. According to the Electricity Storage Association, these processes lose very little electricity, reaching round-trip efficiencies as high as 80%. The major challenges for pumped hydro include dependence on geography, and public concerns about environmental degradation where new reservoirs are created.
48

Draft 06/24/2014
Current cost estimates for storage technologies vary by country, and can vary by location within countries – especially for pumped hydro storage. EPRI estimates U.S. pumped hydro costs at $2500-$4300/kW (power) and $420-430/kWh (storage) for small facilities with capacities less than roughly 5500 MWh, and $1500-$2700/kW and $250-270/kWh for facilities up to 14000 MWh.[5] The national hydropower association reports slightly lower capital costs for pumped hydro.[6]
The potential for building new pumped hydro varies by country as well. In the U.S., DOE and Oak Ridge National Laboratory are surveying potential for new facilities. Elsewhere, over 60 pumped hydro projects are under construction, most in Europe, China, India, and Japan.[7] The potential for pumped hydro could be large, even in Europe: a European Commission report indicated the possibility for a ten-fold increase in storage capacity,[8] and MacKay estimates up to 400GWh of potential in the UK.[9] However, realizing this potential is likely to require overcoming environmental challenges for specific geographies. In addition, in some regions, the economics for new pumped hydro facilities may be at issue, as more demand-side management and solar deployment shaves peak electricity prices and reduces arbitrage opportunities for storage plants. Switzerland has good examples of both. Following the decision to discontinue nuclear, the Swiss government published ambitious plans for increased hydro – which were immediately opposed by the cantons. Plans for increasing the capacity of pumped storage at the Grimsel have been put on ice because of the cheap midday wind energy flooding in from Germany.
Compressed Air Energy Storage
Compressed air energy storage systems (CAES) pump air underground into geologic formations or (more rarely) into above-ground vessels and pipes. When electricity is needed, the air is released, heated, and expanded by natural gas in order to drive a turbine. Advanced CAES technologies include those which take advantage of electricity production during the compression phase, and those which recycle flue gas in order to minimize natural gas burns. CAES faces twin challenges of limited geography and greenhouse gas emissions, but is the third-most widely deployed storage resource. The IEA in conjunction with the International Renewable Energy Agency estimates CAES capex costs at $800 - $1000/kW with cheap, natural underground storage,[10] EPRI estimates costs up to $1250/kW and $125/kWh,[11] and others go as high as $1500/kW.[12]
Flywheels
Flywheels are low-energy, high-power storage devices typically used for maintaining power quality and to provide blackstart capacity. Flywheels consist of rotors on electromagnetic bearings that increase spin speed while charging, then maintain spin with minimal frictional losses as an energy storage mechanism. When electricity is needed, the rotors generate electricity as they slow. Challenges include materials fatigue and limits on the system energy density; until flywheels can store more energy, they may not be a primary technology choice for peak-shifting applications needed to
49

Draft 06/24/2014
integrate intermittent renewables. IEA/IRENA estimate flywheels to cost up to $4000/kW for MW-sized systems, and an Lawrence Livermore National Laboratory study pegs storage costs at $200-$500/kWh.[13, 13A]
Batteries
Batteries consist of electrochemical cells, historically with an aqueous electrolyte and solid negative and positive electrodes. When charging, positive ions flow from the positive to the negative electrode while electrons flow in the opposite direction; these flows are reversed during discharge. In order to provide grid support services, batteries should be able to store significant amounts of energy at low cost (though unlike for consumer electronics and vehicles, grid-scale batteries may be large). For peak-shifting applications, grid-scale energy storage systems comprising batteries should be high-powered (e.g. MW-scale), able to respond to grid needs appropriately, and possess long cycle lifetimes. In general, batteries may be separated into sealed or flow designs. Lead-acid, lithium-ion, and sodium-sulphur technologies have, to date, been the most prominent battery chemistries for grid-scale storage, yet cost, durability and/or safety challenges remain.
Lead-acid batteries are generally considered the most mature of rechargeable battery technologies. Though they are deployed in smaller numbers than lithium-ion for grid support applications, they appear extensively in automobiles, telecommunications, and other systems. Challenges to expanded production and use of lead-acid for grid applications include battery toxicity, high costs, and low cycle life. EPRI estimates costs for commercial, advanced lead-acid batteries at $1700 - $1900/kW for 200 MWh, 50 MW systems, and up to $4900/kW for 250 MWh systems with twice the cycling life. Costs per kWh nearly double for the larger, longer-cycle life system, from about $450/kWh to about $950/kWh.[14]
Over the last few years, grid penetration of lithium-ion batteries has increased significantly. Lithium-ion batteries include a range of different chemistries, but all continue to face residual challenges with safety (e.g. reactivity and flammability) and cost. Both of these factors become more of an issue when the batteries are scaled from everyday applications in personal electronics devices to grid-scale energy storage systems. Bloomberg estimates lithium-ion battery capex costs at $850/kWh for hour-scale price arbitrage applications.[15]
Sodium-sulphur batteries have been developed and deployed primarily in Japan. They generally consist of a high-temperature molten sulphur positive electrode and liquid sodium negative electrode separated by a solid, sodium-conducting ceramic. Because of the abundance and elemental nature of the battery chemistry, these systems have the opportunity for low cost, however safety and cycle life challenges remain. EPRI estimates NaS battery costs at $3100 - $3300/kW, and $520 - $550/kWh.[16] To address safety and improve on cost, an analogous high-temperature molten Na/NiCl2 has been developed and is entering early stages of commercial deployment.
Flow batteries separate the power and energy function of a battery by storing charge in solution (typically aqueous) electrolytes that are flowed over a stack of electrochemical
50
Draft 06/24/2014
cells for power generation and storage. Higher power requires a larger stack of cells, while higher energy requires a larger tank of electrolyte. The benefit of this power/energy separation is typically achieved at the expense of energy density; flow battery systems are typically 2-5X larger than sealed battery systems. Vanadium redox batteries are, so far, the most widely-deployed flow batteries and utilize a single electrolyte for both the positive and negative battery active material. Advantages of vanadium redox flow batteries include long cycle life and relative safety. The high cost of vanadium limits the potential for this flow battery chemistry; EPRI estimates the cost of a 250 MWh vanadium redox battery at $3100 - $3700/kW and $620 - $740/kWh. [17]
Hydrogen
Hydrogen energy storage systems are virtually negligible in terms of grid deployment; SBC estimates less than 2MW capacity is installed worldwide.[18] Nonetheless, hydrogen fuel cells have the potential to provide significant amounts of electricity balancing for intermittent renewables. Most hydrogen in the U.S. is produced by steam reformation of hydrocarbons, but clean grid-scale battery technologies typically focus on hydrogen production from water. They operate by converting water into hydrogen and oxygen during charging (either through electrolysis, or biological or catalytic processes), and they recombine hydrogen and oxygen in order to produce electricity. These systems have been developed for over 50 years, primarily for space applications but with an eye towards automotive. One major advantage is that hydrogen systems can store energy for long periods of time, but a major drawback is the low efficiency with which hydrogen conversion occurs. Sandia National Labs estimates current hydrogen systems to cost about $1150/kW for 6 hours of storage.[19]
6.2 Existing Storage Facilities
By far, the most widely-deployed storage technology is pumped hydro, owing to its cost effectiveness. Pumped hydro, however, is limited by geography: it requires two large reservoirs with a significant altitude difference between them. Research is underway on using seawater and/or underground reservoirs, to minimize the environmental footprint, but these options are likely to be significantly more costly.[20]
Figure 6.2 Deployed Storage Capacity
51

Draft 06/24/2014
Deployed Electricity Storage Worldwide (rated power in kW)
Lead-AcidLi-IonVanadium Redox FlowSodium SulfurOther BatteryCompressed AirFlywheelPumped HydroTOTAL: 144 GW
Deployed Electricity Storage Worldwide - no PHS(rated power in kW)
Lead-Acid
Li-Ion
Vanadium Redox Flow
Sodium Sulfur
Other Battery
Compressed Air
FlywheelTOTAL: 1.8 GW
SOURCE: DOE Global Energy Storage Database (accessed March 19, 2014)
Other systems deployed globally include flywheels; the installed capacity is mostly composed of two half-gigawatt scale projects in Europe. Compressed air energy storage has significant presence in the U.S. Japan has the largest sodium sulphur battery installation, at 34 MW, and the U.S. leads on installed capacity of lithium-ion batteries. Thermal energy storage, often associated with buildings, represents a growing market segment to shift electricity demand.[21] Because thermal storage is often used in this demand-response-like manner, it is not depicted on the charts above or discussed further here.[22]
Several nations and regions worldwide have adopted policies to increase storage deployment. California recently passed a bill requiring utilities to procure 1.3 GW of electrical and thermal storage by 2020 in order to mitigate grid disruptions that may result from its 33% renewable portfolio standard.[23] Japan and Germany have both begun subsidize storage systems at the consumer level, to enhance operation of distributed PV systems.[24]
52

Draft 06/24/2014
Forecasting even near-term electricity storage deployment is very difficult, because the market structures and storage service opportunities vary widely, and the potential for cost reduction by storage technology is unclear. The IEA examines three storage deployment scenarios in its 2014 energy storage technology roadmap, showing a large increase in deployed energy storage by 2050 under a 2C GHG emissions target, and an even larger increase if aggressive storage cost reductions are achievable. This work clearly illustrates the value of activities that are directed towards reducing the cost of energy storage technologies.
Figure 6.3 Three 2050 Electricity Storage Deployment Scenarios (IEA); including a scenario in which warming is limited to 2 degrees C (2DS), a “breakthrough” scenario in which storage costs come down substantially, and an “EV” scenario with high EV penetration.
SOURCE: International Energy Agency, Energy Storage Technology Roadmap Launch slide presentation, Paris, France, March 19, 2014.
6.3 Valuing Storage in Electricity Markets
Ultimately, storage will only achieve high levels of penetration if it can compete for service provision in electricity markets. Markets are set up to value electric capacity and the generation that traditional power plants provide, but they do not generally value the high level of flexibility storage can provide. In some cases, regulatory decisions prevent storage systems from participating in ancillary service markets.
One way for storage systems to make money in electricity markets is with arbitrage, storing electricity from the grid when it is cheap and selling it back when it is expensive. Predicting precisely when to buy and sell, however, is difficult. A Bloomberg analysis determined that buying and selling at set times, i.e. buying at the 4th hour of the day and selling at the 12th, would yield nearly 30% less revenue than the perfect strategy in the German day-ahead market between 2008 and 2012.[25] In general, Bloomberg found that participation in the German ancillary services market was more economical than arbitrage. Besides providing arbitrage or ancillary services, a third way for storage systems to obtain market revenues is to receive capacity market payments, as PJM is currently considering in the U.S.
53

Draft 06/24/2014
Rather than allow storage to compete in electricity, ancillary service, or capacity markets (or some combination), a different option involves valuing energy storage based on a regulated, cost-of-service or willingness-to-pay model. Regulators could ensure a rate of return for storage developers that could include valuation of avoided costs, like the ability for storage to obviate the need for additional transmission. Under a rate-recovery system, storage could be treated alongside transmission, and this may become possible in the U.S. FERC is currently creating accounting standards to facilitate rate-basing of storage assets in 2015.[26]
The particular combination of market and non-market alternatives most conducive for storage will vary depending on the particular needs of each grid and the existing market dynamics. Bloomberg’s analysis of the market competitiveness of storage in Germany, North America, and the UK shows very few, but varying applications for which lithium-ion or sodium-sulphur batteries are economic. In Germany, only the provision of primary control reserve generated a positive IRR. In North America, arbitrage is profitable in some regions of Ontario, and economic opportunities exist for storage applications elsewhere[27] especially if battery costs come down and storage becomes eligible for capacity payments. In the UK the only currently profitable application for lithium-ion batteries is deferral of transmission upgrades.[28] In general, storage systems are otherwise too expensive.
As alluded to above, the storage technologies most likely to achieve commercial success are those which can provide more than one service, “stacking” the payments they can receive.[29] The U.S. Department of Energy classifies technologies according to whether they can definitely, potentially, or never supply various electricity services. Table 6.4 describes commercial and in-development technologies and lists the renewable integration-related services they can provide.
TABLE 6.4: Technologies and Energy Services
Service
Peak-shifting (arbitrage)
Energy smoothing and shaping
Ancillary services (e.g. frequency regulation)
Timescale hr.+ min. to hr. sub-minuteTechnologyPumped Hydro *Compressed Air *Flywheels *Lead-AcidLi-ionNaSFlow BatteriesHydrogen
Solid box = can provide, Hashed box = potentially provide, Empty box = cannot provide SOURCE: DOE & SBC[30] (*NOTE: DOE lists these as “can potentially provide”)
From the perspective of maximum opportunity for service provision, battery technologies are attractive, because they can provide all three types of services. They are
54

Draft 06/24/2014
also more attractive than other listed technologies because they tend to be more scalable (for example, they are not bound by reservoir sizes, and can be made quite small), and thus have applications at the distribution and consumer level. This larger market depth for batteries may mean they have more opportunities to come down the cost curve. The next section examines research and development priorities that could enhance the ability of storage systems to provide a range of services at low cost.
6.4 Development of Advanced Electricity Storage Technology
Much of the R&D focus on storage is and should be on attaining cost-competitive systems. This means developing storage solutions with low per-kW power and per-kWh storage capital costs. DOE has a near-term target of achieving costs below $250/kWh, and a long-term target of achieving capex under $150/kWh. DOE estimates that achieving a levelised cost of 10 cents/kWh in the long term will make storage solutions economically scalable without subsidies; for reference, the levelised cost of storage for lithium-ion is currently on the order of 10 times that.[31] Other research targets include reaching low O&M costs, related to achieving high efficiency, high energy density, high cycle life, and low capacity fade, among other parameters. Each of the technologies discussed so far faces different challenges achieving low cost targets. Safety and environmental issues are also of importance to potential storage investors. Battery technologies, for example, contend with some safety and reliability issues, and some battery research focuses on reducing safety risks and/or demonstrating the reliability of battery systems. Compressed air energy storage presents environmental challenges because it typically requires a natural gas system to heat expanding air. New technologies, however, may obviate the need for a gas heat source. Table 6.5 describes the primary focus of R&D for each of the storage technologies.
TABLE 6.5: R&D Thrusts by Storage Technology Technology Primary R&D ChallengesPumped Hydro Cost of underground/seawater reservoirs to remove geographic
dependence & mitigate environmental harms*Compressed Air Adiabatic and isothermal processes to avoid use of gas to heat air
upon decompression; artificial reservoirs to remove geo. dependence
Flywheels Materials cost; flywheel stabilityLead-Acid Improve cycle life and depth of dischargeLi-ion Find lower-cost materials for the negative electrode; increase
energy density & cycle life; confirm safety; scale-up from small, cylindrical to large-format, prismatic cells for energy storage applications
Molten Salt Improve durability/ manufacturability of ion-conducting separator; improve corrosion resistance; alternative chemistries to reduce operating temperature, improve safety
Flow Batteries Improve specific energy and cycle life; alternative chemistries to lower system cost
Hydrogen Improve efficiency of oxygen reactions while reducing cost of oxygen electrodes
55

Draft 06/24/2014
SOURCES: SBC EI 2013; DOE 2013
Two promising, very early-stage battery technologies aim to address some the challenges listed above. Lithium-air batteries could be a substitute for Li-ion, as they replace the cathode with oxygen and obviate the need for a cathode structure. Challenges with the designs remain, however, because the cathode degenerates due to encroaching humidity,[32] and Li-air’s reliance on oxygen electrochemistry means it suffers from efficiency challenges similar to those encountered by hydrogen batteries. Other flow battery chemistries may also be of interest; EPRI estimates, for example, that zinc-bromine batteries could cost as little as $1450 - $1750/kW, or about half the cost of vanadium redox systems.[33] Liquid metal batteries provide a second alternative to conventional molten salt batteries: the cathode, anode, and electrolyte are all liquid metal layers, separated due to their different densities. Research on liquid systems focuses on developing materials that can be kept at lower temperatures and sustain higher voltages.[34] The manufacturing, scale-up, and putative cost reduction of conventional, small cylindrical Li-ion batteries and systems comprising them is another interesting development.[35]
The U.S. and other countries are devoting substantial resources to storage technology development. The U.S. government spent about $1.3 billion on storage initiatives between 2009 and 2012, of which the majority went through DOE programs and roughly 25% through the Department of Defence. DOE programs have included basic research, storage demonstration programs under the American Recovery and Reinvestment Act, energy storage “hubs,” and ARPA-e storage projects aiming to develop new solutions and make them market-ready.
The European Electricity Grid Initiative mapped storage RD&D projects in Europe and found nearly €1 billion spread across nearly 400 projects. About 1/5 of the funding for these projects came from the EU, and the remainder from national governments. The survey showed that Europe is betting heavily on batteries and thermal storage, and especially on non-centralized storage systems. The authors noted this funding largely applied at an early R&D stage, and that in the next few years, the EU may implement increasing numbers of follow-on demonstration projects.[36] Japan continues to fund efforts toward demonstration and deployment of battery systems as well, leading the world on NaS.
Another frontier for storage technology research includes the use of electric vehicles (EVs) to provide grid services. Plug-in vehicles could provide frequency regulation and fast-response reserve power, competitive with spinning reserves. Some vehicle technologies could provide peak-shifting services useful for integrating intermittent generation sources. One study estimated that if wind supplied half of 2005 U.S. electricity generation (700 MW), 23% of the vehicle fleet could provide the needed firm backup capacity in the form of fuel cell cars with collective storage capacity of 1190 GWhr.[37] Similar studies have demonstrated promise for EV support of wind integration in the UK and in Germany.[38]
Despite this promise, deployment of grid-connected vehicle systems remains minimal worldwide. A major issue is cost; the German study noted that due to battery
56

Draft 06/24/2014
degradation, battery-powered electric vehicle owners could have difficulty recouping costs in the primary ancillary services market.[39] Another challenge includes developing a business model that is workable for grid operators and attractive for consumers. Grid operators will want maximum flexibility to use vehicle storage resources, while drivers need to be assured their cars will charged and available when needed.
The U.S. government is engaging in research to reduce these barriers to EV/grid systems. The Department of Energy has funded vehicle-to-grid demonstration projects, including one in the PJM territory with early results establishing revenue for grid-enabled vehicle owners of about $5/day.[40] The California ISO has developed a vehicle-grid integration roadmap as part of its Zero Emission Vehicles (ZEV) initiative, and the Department of Defence pledged $20 million in 2013 toward establishing grid-enabled plug-in electric vehicles on military bases. Navigant estimates that more than 250,000 grid-enabled of vehicles will be sold worldwide by 2022.[41]
Deciding where countries should focus storage R&D efforts requires understanding which technologies are most likely to compete based on the services they can provide, and which technologies are closest to commercial maturity. Environmental and social impacts are important considerations as well, especially as nations move to internalize emissions costs.
At this stage, no single technology stands out as being clearly most worthy of RD&D support. Pumped hydro and compressed air storage are the most mature and cost-effective, but both come with geographic limitations and environmental drawbacks. They should be deployed as cleanly and widely as possible, and research should continue on options to mitigate the challenges associated with both technologies. Batteries remain expensive, so research should focus on ways to bring costs down (including by improving performance parameters like efficiency and shelf-life). Battery configurations relying on earth-abundant materials should be top priority. Otherwise, the suite of battery systems receiving support should remain broad and include advanced, less-mature designs, until more clarity emerges about which technologies will compete best on cost. Electrochemical storage including flow batteries and hydrogen systems should remain a focus as well. Scientists have examined electrochemical storage solutions for decades, and while smaller-scale storage and mobility applications have taken centre stage and a large amount of the hydrogen funding at least in the U.S., renewed focus should rest on inexpensive conversion processes for grid-scale electricity storage.
6.5 Conclusions
Electricity storage can provide vital grid services needed for integrating renewable and nuclear generation. Worldwide deployment is still relatively small and dominated by pumped hydro, but that picture may change with sustained R&D investment and electricity market reforms to ensure low-cost storage solutions can provide value. To that end, we recommend entities with regulatory jurisdiction or the ability to provide research support do the following:
57

Draft 06/24/2014
1. Create a level playing field, allowing storage to participate in provision of all market services for which it is qualified,
2. Support deployment of mature storage technologies as widely as possible (especially pumped hydro), by characterizing resources to identify those with the lowest environmental impact and highest potential to help integrate baseload and intermittent generation, and
3. Continue to fund research, development, and demonstration projects across a wide range of advanced energy storage technologies, including grid-enabled electric vehicle systems.
References1. This is especially an issue in Germany; see e.g. “Renewable Analytics: Effects of
PV Electricity Generation on Wholesale Power Prices Summary 2012 and January 2013,” January 2013.
2. “Harnessing Variable Renewables: A Guide to the Balancing Challenge,” International Energy Agency, 2011.
3. Mai, T., Wiser, R., Sandor, D., Brinkman, G., Denholm, P., Hostick, D.J., Darghouth, N., Scholsser, A., and Strzepek, K., “Renewable Electricity Futures Study; Vol. 1: Exploration of High-Penetration Renewable Electricity Futures,” National Renewable Energy Laboratory, 2012.
4. Note that storage can provide a wide range of grid services on many timescales, and some systems can provide more than one type of service. For purposes of this study, we focus on grid-scale storage with the ability to provide electricity arbitrage and regulation services, as these are of especially high importance for grid integration of renewable and baseload sources.
5. Electric Power Research Institute, “Electricity Energy Storage Technology Options: A white paper primer on applications, costs, and benefits,” Technical Update, December 2010.
6. National Hydropower Association, “Challenges and Opportunities for New Pumped Storage Development: A White Paper Developed by NHA’s Pumped Storage Development Council,” 2012.
7. Ibid.8. Gimeno-Gutierrez, M. and Lacal-Arategui, R., “Assessment of the European
potential for pumped hydropower energy storage,” European Commission Joint Research Centre, 2013.
9. MacKay, David, “Sustainable Energy – without the hot air,” Uit Cambridge Limited, 2009.
10. IEA-ETSAP and IRENA, “Electricity Storage: Technology Brief,” April 2012.11. Electric Power Research Institute, “Electricity Energy Storage Technology
Options: A white paper primer on applications, costs, and benefits,” Technical Update, December 2010.
12. Wesoff, Eric, “Compressed Air Storage Beats Batteries at Grid Scale,” Greentech Media, March 3, 2011. http://www.greentechmedia.com/articles/read/compressed-air-energy-storage-beats-batteries accessed 5/12/14
13. IEA-ETSAP and IRENA, “Electricity Storage: Technology Brief,” April 2012.13.A http://www.c2es.org/docUploads/10-50_Berry.pdf
58

Draft 06/24/2014
14. Electric Power Research Institute, “Electricity Energy Storage Technology Options: A white paper primer on applications, costs, and benefits,” Technical Update, December 2010.
15. “Energy Storage Valuation Study: North America,” Bloomberg New Energy Finance, March 20, 2013
16. Electric Power Research Institute, “Electricity Energy Storage Technology Options: A white paper primer on applications, costs, and benefits,” Technical Update, December 2010.
17. Electric Power Research Institute, “Electricity Energy Storage Technology Options: A white paper primer on applications, costs, and benefits,” Technical Update, December 2010.
18. “Leading the Energy Transition: Electricity Storage Factbook,” SBC Energy Institute, September 2013.
19. Schoenung, Susan, “Economic Analysis of Large-Scale Hydrogen Storage for Renewable Utility Applications,” Sandia National Laboratories, August 2011.
20. “Leading the Energy Transition: Electricity Storage Factbook,” SBC Energy Institute, September 2013.
21. “Thermal Energy Storage: Technology Brief,” International Energy Agency-Energy Technology Systems Analysis Programme & International Renewable Energy Agency, January 2013.
22. Note, however, the significant exception of thermal storage coupled with concentrated solar power systems, rendering CSP a dispatchable renewable technology.
23. http://www.greenbiz.com/blog/2013/12/11/inside-california-energy-storage- mandate, accessed 3/22/14
24. Wilkinson, Sam, “PV Storage Market Set to Explode to $19 Billion in 2017; Germany Leads Again,” IHS, April 25, 2013.
25. “Energy Storage Valuation Study: Germany,” Bloomberg New Energy Finance, July 9, 2013.
26. “Energy Storage Valuation Study: North America,” Bloomberg New Energy Finance, March 20, 2013.
27. “Assessment of Energy Storage Alternatives in the Puget Sound Energy System” DOE/ PNNL Report DE-AC05-76RL01830, December 2013.
28. Ibid., “Energy Storage Valuation Study: North America,” Bloomberg New Energy Finance, March 20, 2013., and “Energy Storage Valuation Study: UK,” Bloomberg New Energy Finance, January 9, 2012.
29. Kaun, B. and S. Chen, “Cost-Effectiveness of Energy Storage in California: Application of the EPRI Energy Storage Valuation Tool to Inform the California Public Utility Commission Proceeding R. 10-12-007,” EPRI, Technical Update, June 2013.
30. U.S. Department of Energy, “Grid Energy Storage,” December 2013., and “Leading the Energy Transition: Electricity Storage Factbook,” SBC Energy Institute, September 2013.
31. Electric Power Research Institute, “Electricity Energy Storage Technology Options: A white paper primer on applications, costs, and benefits,” Technical Update, December 2010.
32. “Leading the Energy Transition: Electricity Storage Factbook,” SBC Energy Institute, September 2013.
59

Draft 06/24/2014
33. Electric Power Research Institute, “Electricity Energy Storage Technology Options: A white paper primer on applications, costs, and benefits,” Technical Update, December 2010.
34. Wesoff, E., “Slideshow: Update on Ambri’s Liquid Metal Grid-Scale Battery,” GreenTech Media, February 19, 2014.
35. Wessoff, E. “Tesla Giga Factory: $4B to $5B Price Tag, With Battery Production Slated for 2017,” GreenTech Media, February 27, 2014.
36. Geth, F., Kathan, J., Sigrist, L., and Verboven, P., “Energy Storage Innovation in Europe: A Mapping Exercise,” GRID+ and European Electricity Grid Initiative, October 2013.
37. W. Kempton, J. Tomi´c, “Vehicle-to-grid power implementation: From stabilizing the grid to supporting large-scale renewable energy,” Journal of Power Sources 144 (2005) 280–294.
38. See, e.g., MacKay (2009), and Loisel, R., Pasaoglu, G., and Thiel, C., “Large-scale deployment of electric vehicles in Germany by 2030: An analysis of grid-to-vehicle and vehicle-to-grid concepts,” Energy Policy 65 (2014) 432-443.
39. Loisel, R. (Ibid).40. Shepard, S. and Garther, J., “Vehicle to Grid Technologies: V2G Applications
for Demand Response, Frequency Regulation, Microgrids, Virtual Power Plants, and Renewable Energy Integration,” Navigant Research Report, 2013.
41. Shepard, S. and Garther, J., “Vehicle to Grid Technologies: V2G Applications for Demand Response, Frequency Regulation, Microgrids, Virtual Power Plants, and Renewable Energy Integration,” Navigant Research Report, 2013.
60

Draft 06/24/2014
7. Environmental Impacts of Nuclear and Renewables
There have been many studies on the environmental aspects of nuclear power generation, for two particular reasons:1) Nuclear energy production involves a series of processes from uranium mining
through to final waste disposal, all of which are major engineering activities. These commonly require the production and assessment of an official Environmental Impact Assessment (EIA) before they can be licensed.
2) Nuclear energy production is a controversial subject in most countries, resulting in an active debate on the associated environmental issues, and on their impacts relative to alternative means of producing electricity.
Increasing attention is also being paid to the environmental impacts of renewables as aggressive programmes to increase their market penetration have led to growing local opposition in some countries. Most often in the current energy debate, the comparisons that have been made are between nuclear and fossil fuels or between renewables and fossil fuels. Given the widely acknowledged high impact of fossil fuels, both on human health and on potential climate change (see e.g. Lynas, 2013), the more interesting comparison is between nuclear energy production and the use of other low carbon alternative energy sources such as hydropower, solar, wind and biomass.
In this section we consider the environmental impacts of nuclear and renewables in terms of a wide range of actual and potential impacts. We begin by using the literature data to summarise, as quantitatively as is feasible, the impacts of the different technologies in terms of their materials and energy requirements, their emissions during operation, their health effects during operation, the accident risks, and the associated waste streams. Recent studies referenced below provide important information for such comparisons, although challenges remain in gathering reliable data and in appropriate normalization of the impacts. We follow up these sections with some more anecdotal evidence on selected impacts that are either particularly topical or are important but less commonly addressed. These include impacts of wind turbines on persons and on bird life, the underestimated problems with biomass and concerns about biodiversity reduction. Finally we address the public attitudes towards both renewable energy technologies and to nuclear power. The energy policies of many countries are perhaps more strongly influenced by public and political perceptions of available technologies than they are by rational assessment of the actual benefits and drawbacks.
The most transparent approach to comparing all such environmental impacts from various electricity production methods is within a Life Cycle Analysis (LCA) in which all impacts, including costs, are assessed and summed throughout all stages. These types of analyses were extensively studied within the ExternE Project of the EU which ran through to 2005. The website established for this project remains updated to include references and results for subsequent work up to the present. (ExternE, 2014). This includes links to the NEEDS project which extends the nuclear power plant studies to include estimates for newer reactor technologies that may be implemented up to 2050 (Lecointe, et al 2007)
61

Draft 06/24/2014
Many of the figures given in the texts below for nuclear power and for renewable technologies are based on LCA analyses, often making use of the Ecoinvent database produced in Switzerland (Ecoinvent 2014). A large database was also assembled for the recent IPCC report on climate change (IPCC 2014) and results from this comprehensive document are also included below.
7.1 Energy Pay Back
For comparing electricity generating systems which require energy input for construction and operation of facilities, it is instructive to calculate the energy balance, i.e. the ratio of the energy input to energy output for the whole life cycle. Hirschberg and Dones (2014) state that, for nuclear, wind and fossil power, the ratio is in the range 1-6%. For photovoltaic, the range given for current systems is 18 to 34% but the authors expect technical advances to reduce this to 3-7 % over the next decades. An Austrian study which takes a pessimistic view of nuclear energy (Wallner et al, 2011) quotes energy balance figures from a variety of studies based on differing assumptions about ore quality. For very poor ores (0.01%) it is claimed that the energy input to nuclear power exceeds the output by a factor 1.5. Another common way to express the energy balance is the reciprocal of the above –the EROI (energy return on investment) the ratio of energy generated over its lifetime relative to the embodied energy. In general, the energy returns on energy invested for new renewable forms of energy are lower than for the fossil fuels – although the latter have been declining (Hall et al., 2014). The figure below gives a comprehensive comparison of EROI for a variety of energy technologies. The nuclear result is based on enrichment by diffusion which was the technology at the time the study was completed.
7.2 Resource Requirements62

Draft 06/24/2014
Materials
In common with many other modern applications, wind and solar energy technologies use “rare earth” materials. The US Department of Energy (USDOE 2012), and others, have identified neodymium, dysprosium, terbium, europium, and yttrium as substances which wind turbines and solar panels are currently dependent. Shortages in the short to medium term have been identified; these are likely to impact on the availability and cost of these materials not only for the wind and solar energy sector, but also on car batteries and energy-efficient lamps, and in electric vehicles. Particular concerns have arisen about the role of China which controls a large proportion of rare earth supplies, and in the use and disposal of these materials as well as silicon.
The proportion has been estimated at 97% of the world total production of rare earth metals (REM). Recently, China has cut its exports due, it is claimed, to environmental concerns, as a result of which REM prices “have skyrocketed, and the clean energy industry is in turmoil.” This has stimulated those economies with the greatest demand for critical materials – the EU, the USA and Japan – to seek the implementation of a strategy which would encourage new mining activity, focussed R&D, and other actions (including efforts to offer EU experience in the field of environmental protection as part of trade agreement arrangements with China) to help offset reliance on China (Baldi et al., 2014).
A top capacity wind turbine may use 2000kg of neodymium-based permanent magnet material. Not all wind turbines use permanent induction generators (that currently require neodymium); some use Tesla induction generators that do not require rare earth magnets, but the latter require variable pitch control and, if HVDC transmission becomes a widespread reality, permanent induction generators are likely to be given preference.
Solar cells draw on three other “critical” (but not rare earth) materials – gallium, indium, and tellurium – used in PV thin films. Indium and tellurium are already exceptionally scarce. The silicon base of most solar panels requires the melting of silicon rock to roughly 1700 degrees Celsius. This heating generally uses fossil fuels, especially coal-firing.
With regard to material inputs per MW year: wind was the highest, followed by solar PV, then solar space heating, with hydro and solar thermal almost equal next.Materials for Renewables (IPCC 2011)
63

Draft 06/24/2014
In nuclear power plants, steel and concrete comprise over 95% of the material inputs (Peterson et al, 2005). The data of these authors imply that construction of older nuclear power plants with a 1000 MWe capacity required around 45’000t of steel and 100’000 m3 of concrete. However, they show that the evolutionary Generation III plants—EPR and ABWR—use approximately 25% more steel and 70% more concrete than older LWRs. Other sources quote differing figures for a 1000 MWe plant, with estimates for steel ranging from 35’000 to 70’000t and for concrete up to 350’000m3 (White and Kulcinski, 1999). Specific figures for a Swiss PWR given by Dones et al (2007) are 40’000t for steel and 170’000 m3 for concrete. Peterson claims that for the same electricity production by wind power the materials needed are a factor of around 10 higher.
Water Use
Water usage by power plants is second only to that required by agriculture – but the major part of the water used for cooling a plant is returned to the river or sea from which it is taken. The figures given by the US Nuclear Energy Institute (NEI, 2014) for water use by a nuclear plant normalise to 1500 l/MWh (e) for once through cooling and 2700 l/MWh (e) for a plant with wet cooling towers. For a specific example (the 1000MWe Leibstadt plant in Switzerland), the required cooling water throughput is 32 m3/s and the losses from evaporation amount to 1m3/s. The nuclear plant requirements are stated to be 2 to 4 times lower than for geothermal or solar-thermal power plants. The highest water usage is by hydropower plants which can lose 17000l/MWh(e) due to evaporation from reservoirs. The IPCC WG III report on renewables (IPCC, 2011) gives a comprehensive overview of water usage, as illustrated below.
64

Draft 06/24/2014
Land Use
Hirschberg and Dones (2014) estimate that, for operation of nuclear power plants, the necessary land requirements correspond to only 0.6 m2/GWh(e). The Swiss figures given for hydro power and large solar are respectively 49 and 1275 m2/GWh(e). They point out, however, that solar panels on existing buildings need no additional land areas. Mackay (2009) states that wind farms need around 500 times as much land as a nuclear plant. This figure is in broad agreement with that of the NEI (2014) which estimates that wind farms need 300 times the area to produce the same output as a nuclear plant. The SBC Energy Institute (SBC, 2014) gives land use figures for the plant itself and also for all indirect land use. In normalised units m2/GWe, these are for nuclear power 50/120; for photovoltaic 329/463 and for wind 1500 to 3200.
A further contentious point, however, is the potential for loss of land use in an accident. This can be large for a major nuclear accident, as evidenced by Chernobyl and Fukushima. It can also be large for a dam break scenario, but, in this case, clean up can in principle be accomplished more rapidly.
7.3 Emissions
65

Draft 06/24/2014
Wind and solar energy perform well in terms of carbon dioxide emissions in comparison with the fossil fuels, and are claimed to perform well in terms of carbon dioxide equivalent emissions. This comparison is somewhat dependent upon whether aluminium is used in the construction of either wind towers, or solar PV or thermal plants. The association of sulphur hexafluoride with aluminium, a so-called greenhouse gas having a Global Warming Potential in excess of 3’000 times an equivalent volume of carbon dioxide makes this a potentially important consideration.
CO2 Emissions
Mackay (2009) estimates that building a 1GWe nuclear power plant results in CO2 emissions of 300’000 t CO2. For a 40 year plant lifetime, this corresponds to 900kg CO2/GWh(e). This is much lower than the figures that he gives for fossil fuels (400t CO2/kWh(e)). For the total CO2 emissions for all stages of the fuel cycle MacKay quotes an IPCC estimate of 40t CO2/GWh(e). The Austrian study by Wallner et al (2011) points out that below a certain ore concentration the life cycle emissions become dominated by the ore preparation; for a low concentration of 0.013%, the value given is 288 t CO2/GWh(e).
In general, however, nuclear power and all of the renewables considered result in much lower greenhouse gas emission than do fossil fuels. This is illustrated clearly by the figure below from Dones reproduced in the Hirschberg presentation (Hirschberg 2007).
The recent IPCC 5th Assessment Report (IPCC, 2014) also quotes CO2 emission data confirming that nuclear energy is among the lowest carbon forms of generation similar to wind turbines at 12g CO/kWh. Hydro and solar have emissions of 24g CO2/kWh and 28g CO2/kWh respectively. Biomass has much higher total emissions of
66

Draft 06/24/2014
220gCO2/kWh. For comparison, coal is at 920gCO2/kWh(e), gas at 490gCO2/kWh(e) and fossil fuels with CCS at 160-220gCO2/kWh(e).
Toxic Emissions
All energy technologies also produce air pollutants at some points in their life cycle. These include particulates, nitrous oxides, sulphur dioxide and volatile organic compounds. Nuclear and fossil fuels also result in some radioactive releases. At the local and regional levels air quality can be severely affected by carbon monoxide, and sulphur and nitrogen oxides. Per GWh generated, solar thermal emits larger volumes of carbon monoxide (285 kg) than natural gas (190 kg) or oil (110 kg). Solar PV has been estimated to release 263 kg of nitrogen oxides and 731 kg of sulphur oxides per GWh electricity generated, and wind energy 71 kg and 137 kg respectively (Hirschberg, 2007). The data gathered from numerous sources by the IPCC, show clearly that the SO2 and NO2 emissions per GWh generated by fossil fuels and biomass far outweigh those from nuclear power and all other renewables. Nuclear power plants release radioactive gases such as Kr-85 and Xe-133 and I-131. These can result in very small doses to persons. In coal fired plants, the fly ash is radioactive because of the quantities of uranium, radium and thorium in the coal. Although fly ash is being more effectively contained in coal plants, the resulting doses to nearby inhabitants are higher than doses from nuclear plants.
7.4 Health Effects
ADDSYStematic studies of health effects were begun inn Brookaven National Laboratory in the early 1970s and in Lawrence Berkekely Lab soon thereafterMore recently in
Canada’s Atomic Energy Control Board studied the overall risks of 11 energy sources
DELETE as long ago as
1982, and found that total risk per unit of energy output of wind came third (after coal and oil), and was then followed by solar PV in fourth place, solar thermal in fifth, solar space heating in sixth, and hydro seventh. Nuclear and finally natural gas offered the lowest risks in this survey. Man-days lost per unit of energy output, though lower than for coal and oil, were not inconsiderable – with wind and solar PV taking the next highest slots. A 1991 IAEA study found somewhat similar rankings, with fossil fuels (coal, oil, and gas) posing the highest mortality risks, followed by renewables and finally nuclear. (http://www.iaea.org/Publications/Magazines/Bulletin/Bull333/33302041419.pdf)
Coal (especially in China), oil and natural gas are the biggest causes of human deaths per GWh, in descending order, followed a long way behind by solar PV, wind and nuclear according to various 2013 publications. All these figures are relatively trivial by
67

Draft 06/24/2014
comparison with those resulting from the burning of traditional biomass in confined spaces. Deaths arising from regional and local pollution caused by coal burning are also considered to be a much greater end-cause of human fatalities.
The main cause of human fatalities in the solar PV sector arises from falls incurred by solar rooftop installers, and there have been estimates of these up to 150 per year worldwide. [http://nextbigfuture.com]. In the wind energy sector, human fatalities have been rising as the number of turbines installed has risen. In the USA 99 fatalities were reported as having occurred in the recent past [East County Magazine, San Diego, April 4, 2012]. A UK source reported 145 wind energy-related accidents annually 2009-2013, and nearly 120 fatalities between 2002 and 20013, of which just over half were wind industry workers and support workers [Caithness Windfarm Information Forum, 2013, citing the insurer gcube]. In December, 2011, the UK’s main wind energy industry association, RenewableUK, reported that there had been 1,500 accidents over the previous five years, although claiming these had resulted in only four fatalities and about 300 injuries. Other sources, however, have reported 40 fatalities in that period. The industry association’s then Director of Health and Safety further claimed: “No members of the public have ever been injured or harmed in the reports we have received.” Nevertheless, there have been numerous near misses due to blades falling off, small turbines collapsing (one in a school playground), and ice shear. [The Daily Telegraph, December 11, 2011.] In Germany there were 880 ice shearing events alone between 1990 and 2003; 94 in 2005; and 27 in 2006. [M. Durstwitz, BOREAS]. Many of the operational accidents have been transport-related. World-wide figures have not been released, but human fatalities and injuries arising from wind energy developments are likely to amount to scores and thousands, respectively.
One common way in which to compare the overall risks due to operation of electrical energy supply systems is to estimate the years of life lost per GWe year. Hirschberger (2007) gives the following figures:Years of Life Lost per GWe year due to normal operation:
Nuclear 219 Photovoltaic 508 Wind 24
Of course, public interest focuses primarily not on impacts of normal operation, but rather on potential consequences and probabilities if accidents. These are treated in the following section. But in the long run, given pressures of world population increase and land and water stresses, it is arguably modern biomass and biofuel developments which pose the greatest threat to sustainable development of the human race (and other species) among the new renewables.
7.5 Accidents
In this section we have in mind the potential impacts of earthquakes, tsunamis, volcanic eruptions, land slips, flooding and hurricanes. These potential impacts can have a bearing on some forms of new renewable energy operations as well as on nuclear. In particular geothermal, hydro and wind energy operations can be severely affected. Note, however, that fossil plants and systems are not without the propensity for accidents as
68
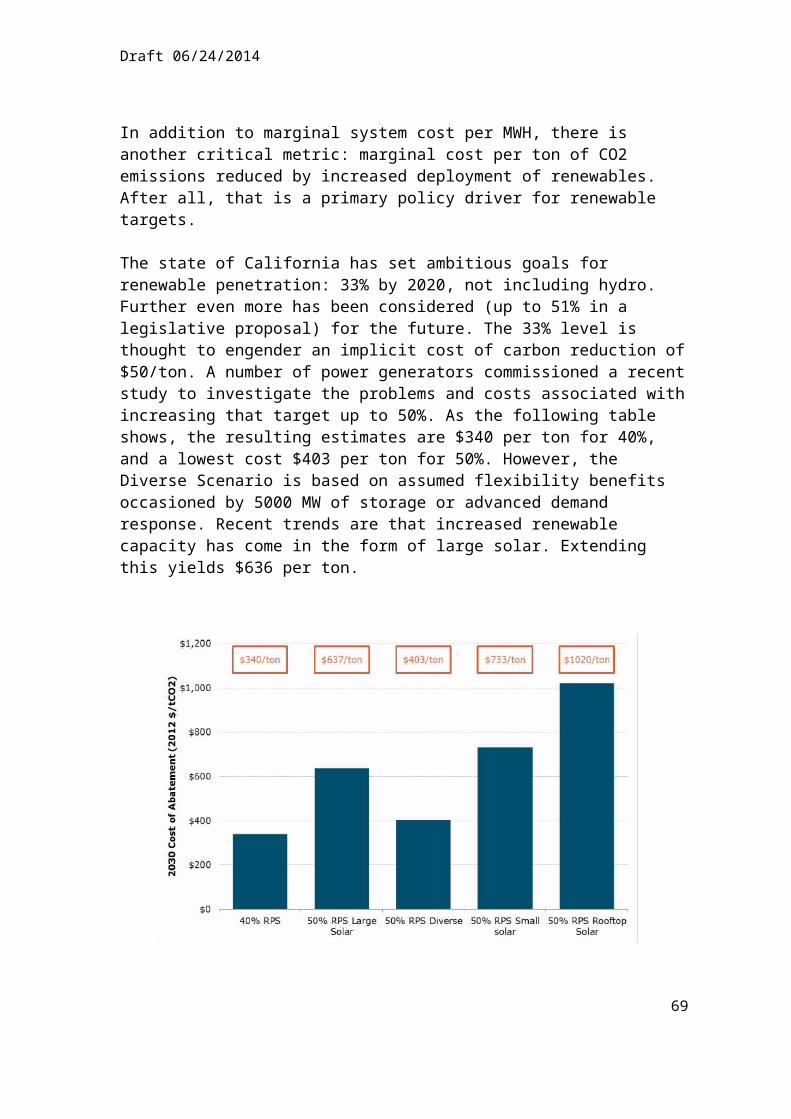
Draft 06/24/2014
well. Coal mine accidents and natural gas pipeline explosions claim many lives, and major earth events affect fossil systems as well as nuclear and renewables.
There has been much discussion in the recent past as to whether geothermal activities, like fracking for shale gas, can trigger earthquakes – or less severe earth tremors. The subject is hotly debated between those who consider such activities can trigger earth tremors, and those who dispute the contention – usually on two grounds, that earthquakes measured on the Richter scale have a far greater magnitude than any human activity is likely to cause, and because drilling does not cause earthquakes although using cool liquids against hot rocks may cause minor tremors. The geothermal industry, which world-wide has over 10,000 MW installed capacity, would claim their operations do not pose a significant threat to humans or the environment. Earthquakes and flooding could, of course, adversely affect their operations.
Dam failures of those built for irrigation purposes have a long history. Those built for hydropower have a somewhat shorter one. About half the failures that have occurred in recent decades were the result of heavy rainfall and resultant flooding - such as Banqiao-Shimantan, China, in 1975; Machuchu- 2 in India, in 1979; Shakidor, Pakistan, in 2005; and Kopru, in Turkey (where the dam’s diversion tunnel seal also failed), in 2012. Some 30 per cent of failures are due to structural issues – the hydropower dam at Gleno, Italy, in 1923; Teton, Idaho, USA, in 1976; and Campos Novos, in Brazil, in 2006. A further 20 per cent are due to seepage or piping causes – although these are frequently also associated with the previous causes. Other causes include earthquakes (the Fujinuma dam in Japan, after the March 11, 2011, Tohoku earthquake); lightning strikes (the Upriver dam in Washington State, USA, in 1986 when the power system and hence turbines were shut down); and turbine break-up, as occurred at Sayano-Shushenskaya dam, in Russia, in 2009. No estimates of human fatalities match those at Banqiao-Shimantan, in Henan province, in which 171,000 people died. In excess of 1,800 people died as a result of the failure of Machchu-2 in 1979, since when there have been only three cases where fatalities exceeded 100. On occasion, problems of getting to the dam and other communication problems have greatly exacerbated the problems, as occurred at Noppikoski, central Sweden, in September, 1985.
Hurricanes and strong winds more generally can cause wind turbine towers to collapse, blades to be spun off, turbines to catch fire, and ice shear to spread wider – potentially to areas where human life and property may be threatened. The US National Academy of Sciences has looked into the potential for tower buckling, and found it relatively high in Galveston County, Texas, and in Dare County, North Carolina. There have been numerous instances of blade spin-off, turbine fires, and ice shear around Europe.
Most energy sources and facilities are, of course, liable to be affected by earthquakes, strong winds, tidal waves, and other causes of flooding. From offshore oil and gas rigs to inadequately protected nuclear plants, and even coal mines let alone solar or wind power or biomass/biofuels, are not risk-free or able to withstand all possible natural disasters. Stefan Hirschberg has reported that in the period 1969-2000 hydropower was responsible for the highest number of fatalities among all forms of energy in non-OECD countries if the very high number of deaths following the Banqiao/Shirmantan dam
69

Draft 06/24/2014
accident is included. Even when this accident is excluded fatalities rank equal second, with non-OECD including China for coal, to those in the LPG sector ranked highest.
The IPCC (2011) report again presents relevant data. Results are presented for severe accidents with 5 or more fatalities since these tend to attract most public attention and to influence political actions most strongly. The authors give fatality rates normalized to the electricity generation in GW-years and they estimate maximum consequences for a single accident of a specific energy technology. Coal has by far the highest fatality rate (especially in China) and hydropower and nuclear have the lowest of the large technologies. Hydropower can, however, have large numbers of fatalities due to dam failures. All other renewable energy technologies have low fatality rates and low maximum consequences, the latter because of their distributed nature. The authors point out, however, that other types of risks should also be considered and give as examples induced seismicity from enhanced geothermal systems and the risk of ship collisions with offshore wind turbines. The extract below from the IPCC report illustrates the fatality rates for nuclear and renewables:
7.6 Wastes
Because of the enormously higher energy density in nuclear fuels, nuclear power plants produce much smaller quantities of wastes than do fossil plants. But the more relevant comparison here is with renewable energy systems which are often thought to produce little or no wastes. Again the most objective comparison normalizes the wastes produced to the electricity generated.
A 1000 MWe light water reactor generates around 200-350 m3 low- and intermediate-level waste and about 20 m3 (27 tonnes) of used fuel per year. (A coal fired plant of the same size produces about 400’000 tonnes of ash). Rhodes and Beller (2000) state that a 1000MWe solar electric plant generates 6’850t of hazardous waste from metals processing over a 30y lifetime and a 1000MWe solar thermal plant would generate
70

Draft 06/24/2014
435’000 t of manufacturing waste of which 16’300t would be contaminated by heavy metals.
Disposal of the wastes produced from electricity production is a high profile issue in the case of nuclear power. Despite the fact that geological disposal is widely recognised by the technical community as a suitable and safe approach, there is often strong public and political opposition to specific disposal projects, based primarily on the high toxicity and long lifetimes of the most active wastes. On the other hand, solar modules contain some potentially dangerous materials which do not decay with time. One of these is cadmium which is technically banned by the European Union's Restriction on Hazardous Substances directive, although the policy currently allows an exemption for its use in solar modules. There is little awareness of the problems of dealing with wastes from solar power production because the panels are produced largely in China and not in the other countries where solar power is promoted. The potential problems in China are huge (Nath, 2010); however; even in California around 20’000t of hazardous waste were produced by solar companies between 2007 and 2011 (Dearen, 2013). Toxic wastes, often containing low level radioactive substances, have despoiled areas around several Chinese cities (Baotou in Inner Mongolia is the most frequently cited), described as creating immense lakes of bubbling toxic waste covered in black dust. One such “tailings lake” is eight kilometres long. A great stench arises from such lakes; a few direct deaths are known to have occurred; unusually high rates of cancer, osteoporosis, and respiratory diseases have been noted; and farming land and occupations ruined.
7.7 Public Attitudes
Few robust general statements can be made about public attitudes to either new renewables or nuclear power. In both cases there are strong proponents and the bitterly opposed. However, it is very clear from public polling that there is a fundamental difference in public attitudes to renewable energy sources and to nuclear power. The data below from 2011 (Wallard et al., 2012) illustrate this clearly:
Energy source Public Support (%)Solar power 97Wind power 93Hydroelectric power 91Natural gas 80Coal 48Nuclear energy 38(IPSOS Data from April 2011)
Attitudes to Renewables
Public attitudes towards modern biomass and biofuels have been influenced by loss of traditional forests, reduced diversity of agricultural crops grown, concerns about impacts on wildlife, and the activities of environmental pressure groups. In general
71

Draft 06/24/2014
environmental pressure groups have been opposed to modern biomass and biofuel development on rational grounds. The same is not true for wind energy development and operation, large hydropower schemes, or estuarine barrages. In each of these cases, there are strong emotional issues involved in the argumentation. Support is normally high for solar PV at a small scale, but the acceptance of large area solar parks has not been tested.
The activities of industry groups involved in the promotion and development of new renewable schemes arguably are acting as those who have promoted the fossil fuels (such as the (US) Global Climate Coalition in the 1990s) and nuclear. However, sections of the wind energy industry have striven to outdo earlier such efforts – claiming that (for example) the UK wind energy industry does not receive subsidies, and that reference to capacity factor data provided by their own operators to the official agency is “bizarre pseudo-science” and “absolute nonsense”. (Jefferson, 2013)
Performance claims have been shown to be exaggerated (Jefferson, 2012). Efforts have been made to deny bird and bat fatalities, or to understate them. There has been reluctance to release data on associated human fatalities, accidents, and “near misses”. Negative impacts of wind energy developments on residential property prices, sleep patterns for some people, and visual outlooks have been regularly denied or evaded.Atif Ansar and colleagues (Ansar et al., 2014) have noted that for large hydropower schemes: “Much of the data in existing literature are drawn from surveys and interviews of dubious validity. At times, interest groups, seeking to promote a particular kind of scale or technology, also report distorted data.” Their first recommendation was:“Create transparency on risk profiles of serious energy alternatives, from not only the perspective of financial cost and benefit but also the environmental and social impacts – hard evidence is a counter-point to experts’ and promoters’ oft-biased inside view.”In the case of estuarine barrages for tidal power, there have been statements such as: “The most detailed work … carried out on the Severn has suggested that birds may actually benefit in most cases to a (sic) barrage being present.” Speakers at a tidal power conference covering estuarine barrages in the Bay of Fundy managed to avoid any reference to birds (until challenged from the audience), and time has proved them incorrect in their assessment of fish mortality at Annapolis (Clare (ed.), 1992). Against this background it is not surprising that members of the public may sometimes be confused, incorrect, and even deluded in their attitudes. Concern at challenges which may be posed by enhanced near-surface global warming also affects attitudes and support for new renewable energy developments in many quarters.
Public attitudes at the local level may also differ sharply. With increasing urbanisation a growing proportion of national populations is likely to have lost, or is in the process of losing, awareness of rural assets and change. This may not, of course, always be the case at the individual level. Rural dwellers themselves may also exhibit varying attitudes. Many may find wind turbines aesthetically pleasing, while others do not. Some may be deeply disturbed by their visual intrusion, on historic assets or fine landscapes, while others may be indifferent. Some may have residential properties at risk of price falls, or are among those who suffer loss of sleep pattern due to aerodynamic modulation from wind turbine blades. Some may see job opportunities arising, or other financial benefits (farmers where wind turbines are located, for example), while others are concerned their
72

Draft 06/24/2014
vacation homes will be blighted (such a polarity has emerged in various European countries, including Finland and the UK). There are also many examples of public acceptance growing over time among those living in close proximity to wind turbines, solar ‘parks’, and nuclear plants. There has even been reported an “inverse NIMBY” (Not In My Back Yard) syndrome where those with wind energy developments in their “backyard” strongly support the technology (Warren et al., 2005). As Charles Warren and his colleagues point out, the media may often give disproportionate attention to vocal minorities – in this case those opposed to wind energy developments. But all too often these vocal minorities can demonstrate that they are more closely in touch with the realities of costs and subsidies, impacts on residential property values and potential health impacts, and more sensitive to landscape impacts. As Matthew Cotton and Patrick Devine-Wright have written:
“The NIMBY label is problematic, as it is often used by proponents of development projects as a means to discredit all forms of project opposition, regardless of its motivation, and wrongly characterizes local people as worried, irrational, ignorant of scientific and technical facts, and selfishly unwilling to support projects that benefit the broader society. Even if one were to accept this characterization of citizens opposed to the siting, NIMBYism is neither irrational nor necessarily unethical” (Devine-Wright P., (2011).
In fact there is a growing body of evidence that local people are frequently well-informed about a technology, its likely performance in the intended setting, and the wider implications of its usage. There is also growing recognition in the literature of the importance of a sense of place attachment, something which due to familiarity over time is more deeply entrenched in rural dwellers. Thus landscape values and historic assets may be more highly valued by a higher proportion of rural dwellers than urban dwellers. There may be significant differences in emotional attachment between individuals, wherever their location (See Lynne and Devine-Wright, 2014) There also appear to be significant differences between countries when it comes to rural countryside protection concerns – stronger in England, for example, than in The Netherlands or in Germany. [see in Devine-Wright 2011, op cit, p. 83.]
The environmental concerns that have been expressed about aspects of new renewable energy development have for at least four decades been paralleled by some economic and technical concerns likely to exacerbate environmental impacts. These have included the generally low power densities of renewable energy as explored by Vaclav Smil, and the low and generally declining energy return on energy invested (EROI) focussed upon by Charles Hall, Cutler Cleveland, David Murphy and others.
Beginning to emerge among the general public in some relatively prosperous countries, however, is an even more profound concern. This is that a “dominant faith that renewable energy alternatives exist in abundance and all we need to do is to shift them, and then our energy and climate change problems can be solved, and we can go on enjoying affluence and growth forever. In the view of an increasing number it is precisely this mind-set that is condemning the planet to catastrophic breakdown and the probable die-off of billions” (Trainer, 2013). Trainer believes:
73

Draft 06/24/2014
“The renewable energy field is strewn with dogmatic, challengeable, and unexamined assertions and assumptions. It reveals many strongly held and unquestioned beliefs. Hardly anyone has published even a brief critical analysis of the field, the notable exception being Howard Hayden’s The Solar Fraud (2003, 2004.)” (Trainer E., 2007)
Thus even the aspiration of those who believe that the last remaining hope, on technical potential grounds, of meeting these challenges is solar energy has been challenged. That hope was, and for some still is, the use of concentrating solar power, with ultra-high voltage direct current transmission (CSP+UHVDC). This has the technical potential to meet the demand for energy services not just in Europe (the Desertec concept) but throughout Africa, as well as in the Americas and Asia. Proponents have had their optimism undermined by political and social turmoil in North Africa, the differing perspectives of European countries (especially between France, Germany and Spain), and failure to press forward determinedly with this technology (which has been around since 1912) in the USA. But there are even more pessimistic and challenging views. (Smith and Positano, 2010) have written:
“In conclusion, there is a strong presumption against technological optimism because it assumes that the human mind has unlimited problem-solving capacity. The evidence at hand, from a study of the foundational problems in basic sciences such as symbolic logic, mathematics, theoretical physics and softer sciences such as sociology, indicates that there are likely to be limits to the human minds’ fundamental problem-solving capacity.” (p. 84)
This indeed is a direct challenge to us all, now and for the generations to come. It is not surprising that there is now renewed interest in Garrett Hardin’s call to heed these issues (Hardin 1993).
Attitudes to nuclear power
It is interesting to study the fluctuations over time in public support for or rejection of nuclear power. There have been many studies over the decades since nuclear power was introduced which have discussed the public attitude to this energy source and, in particular, have analysed the reasons for the acknowledged anxieties of the public concerning radiation. Some have asserted that the original demonstration of nuclear power through the devastating weapons used in Japan has coloured public perceptions since then. Others (e.g. Weart 1988) claim that, even before then, there was an inbuilt fear of a hazardous agent that one “could not see, touch, taste or smell”. It has also been claimed by von Hippel for example in GEA (2012), that “one abiding concern has been the connection with nuclear weapons”. However, the weapons connection today seems more of an argument for specialists than for the general public. Deeper studies (e.g. by Paul Slovic and others) have highlighted specific attributes of nuclear energy that reduce public acceptance of the associated risks. The potential for high consequence accidents influences people more than do the arguments that probabilities of these are very low; the risks imposed on individuals by others are less acceptable than voluntary risks that
74

Draft 06/24/2014
they take upon themselves; the potential for long-term and wide-spread contamination of land causes concern.
Nevertheless, support for nuclear energy increased slowly in many countries, with the strongest support often being in countries with significant numbers of nuclear plants. In numerous countries, however, there has long been extremely active opposition to nuclear power, the most pronounced examples being Germany and Austria. The arguments have alternated between concerns about power plant operation and radioactive waste disposal.
In the first decade of this century, additional powerful arguments leading to increased support for nuclear were the need for expanded base load electricity in developing countries and also the growing fear of catastrophic climate change due to CO2 emissions from fossil fuel plants. Countries like China, India and South Korea developed massive expansion plans. Countries like the UK and the USA which had been, mainly for economic reasons, ambivalent about nuclear new build proposed expansion. Countries with ageing plants such as Switzerland, and the Netherlands started planning for newer generation plants. Even in Germany, the Government reversed plans for shutting down nuclear and agreed to extend plant lifetimes.
Then in March 2011 an unprecedented large earthquake and resulting tsunami led to the Fukushima Daiichi plant in Japan losing on site electrical power for so long that reactor cores melted, hydrogen explosions wrecked the upper part of the reactor buildings where the spent fuel pools were, and widespread radiation releases resulted. Unlike in the Chernobyl disaster decades before, this plant was of the same design as western reactors, the media coverage was intense and the nuclear consequences (which did not include radiation deaths) were accompanied by massive loss of human lives and of buildings due to the huge wave that swept inland. Since the Fukushima accident there have been a number of studies and public polls aimed at assessing the public and political impacts. Questions have also been raised about the level of defences (e.g. height of containing walls to prevent incursion of tsunami driven water in an area known to be close to a tectonic plate) and quality of maintenance somewhat removed from reactor design issues.
The immediate impacts were naturally very negative. Hasty political decisions in Germany and Switzerland (taken before any proper assessment of public attitudes – and shortly before upcoming elections) led the governments of these countries to announce that they would renounce nuclear power. A WIN-Gallup International Global Poll within a month of the accident recorded the views of over 24000 persons in 42 countries. 52.7 percent favoured the use of nuclear energy before the accident, and only 45.4 percent favoured it after the accident (Younghwan et al 2013), with the sharpest decrease in support (28%) being, as expected, in Japan.
In some countries, however, the dip in acceptance was short-lived or absent. In the USA, the 57% who favour nuclear power just one year after the accident was identical to the percentage measured just before the Fukushima incident (Newport 2012). Equally striking are the results from the UK (Poortinga et al 2013). The figure below shows that support for nuclear has remained rather constant throughout the Fukushima phase. In
75

Draft 06/24/2014
fact, the proportion wanting to phase out nuclear power (immediately or gradually) decreased from 50% in 2005 to 40% in 2013. It also shows, interestingly, that support for new renewables, solar and wind, although still much higher, has been reducing as their implementation has been spreading. Other countries where national nuclear support continues to be strong include China, Finland, India and South Korea.
It is interesting to speculate whether government support in these countries is a reason for the higher levels of public support or whether the greater public support makes it easier for governments to propose expansion.
7.8 Additional Issues
Biomass
It is widely recognised that there are profound land and water constraints in a world confronted by rising population, increasing food requirements, examples of recent food shortages and spreading malnourishment, abandonment of agricultural land due to soil erosion and salinization, the removal of trees and other vegetation, and the growing demand for water and limitations of suitable water availability (Pimentel and Pimentel 2008). Despite concern that basic biophysical limits may prove insurmountable, and stringent criticism of the push in the USA to convert corn, soya, and other crops into ethanol for vehicle usage (recognising that at the uppermost limit this would be unlikely
76
Draft 06/24/2014
to meet more than 15% of annual US transportation requirements) there are still pressures to pursue this route.
Striving to expand modern biomass and biofuels output, at the expense of food production and without due regard for land and water availability, is one of the gravest threats to sustainable development. In 2008 the then UN Special Rapporteur on the Right to Food expressed the view that this was “a crime against humanity”. The same year saw food riots in 47 countries due to shortages and price rises, which was a factor in regime change in some of these countries (Fouquet 2013). Again in 2012 the summer’s drought in the American Mid-West pushed maize and wheat prices up again, giving rise to new fears of social unrest around the world, and was blamed on the fact that: “US energy legislation requires that nearly half of this year’s harvest be used to produce ethanol for fuel.” – and despite the fact that “the energy obtained from ethanol is only 1% of American fuel consumption” (Bertrand et al 2012). As a result, pressures built up in the USA to waive the ethanol mandate, and the speculative activity of a number of grain dealers was further exposed. Already in October, 2011, the World Bank, the World Trade Organization, and eight other international agencies called for an end to biofuels subsidies at the G20 meeting then being held, on the ground that: “If oil prices are high and a crop’s value in the energy market exceeds that in the food market, crops will be diverted to the production of biofuels, which will increase the price of food.”
Several other plants have been focussed upon in addition to maize (US – corn) and soya, and with much the same initial enthusiasm and forgetfulness about longer term implications. Jatropha was introduced with such pronouncements as: “Could jatropha be a biofuel panacea?” (Hind 2007), with the response given: “There is no doubt about it. Those who are working with jatropha are working with the new generation crop.” The Wall Street Journal joined in the hype on August 24, 2007: “Jatropha Plant Gains Steam In Global Race for Biofuels” (Barta 2007). From Brazil to Botswana, India, Myanmar, Malaysia and China the fashion surged. Scientific American considered it a plant that “seems to offer all the benefits of biofuels without the pitfalls.” Yet already by June, 2009, calmer voices began to gain some prominence, by which time millions of acres of jatropha had been planted. The Proceedings of the National Academy of Sciences exposed the huge amounts of water required to grow jatropha (20,000 litres per litre of jatropha diesel), and the magazine Discover headed a report: “Jatropha: Not a Miracle Biofuel Crop After All?” EcoWorldly reported that jatropha plantations were not realising the oil yields that drove “the Jatropha euphoria”. Robert Bailis and Jennifer Baka of Yale University pointed out that growing jatropha on marginal land would only produce marginal results. Higher quality land and large volumes of water were required. Writing in Yale Environment 360, Jan Luoma headlined: “Hailed as a Miracle Biofuel, Jatropha Falls Short of Hype”. [May 9, 2009].
Moving from modern biofuels to modern biomass, miscanthus (elephant grass) was given similar treatment. In 2012 it was still hailed as “a revolutionary biomass crop”. Originally from Asia, this species has found favour in several EU-Member countries. In the UK it is still supported by government under the Energy Crops Scheme, which is part of the England Rural Development Programme. It need not only be used for co-firing in coal-fired electricity generating stations. It can, for example, be used for “high
77

Draft 06/24/2014
value equine bedding” (Defra 2007). Helpfully, the Guidelines also mention that miscanthus provides cover for wildlife – pheasant and partridges are specifically mentioned, and a reed warbler’s nest pictured. The report also mentions that research work on the impacts of miscanthus are still to be completed – which suggests that somewhere along the line someone may have concerns about the growing trend towards monoculture and its impacts on wildlife.
Perhaps an even more remarkable example of unintended consequences concerned a UK planning application on Appeal where the developer wished to burn palm oil in a proposed 6 MW electricity generator. The developer was given permission to proceed despite it being pointed out to the Planning Inspector that (quoting World Resources Institute data) 33 tonnes of carbon dioxide are emitted on average for every 1 tonne of palm oil produced in Indonesia, before transhipment to point of combustion, and involves loss of tropical forests, natural habitats and rare species. This and other examples are given in M. Jefferson in (Fouquet 2013).
There has, in fact, been intensifying debate in some countries about the carbon emissions associated with the burning of wood, and the growing and processing of biofuel inputs. Thus the UK Department of Energy and Climate Change produced a “Bioenergy Emissions Calculator” in September, 2013, which was presented with the following statement: “Preliminary results indicate … bioenergy from wood created by intensification of forestry, displacement of construction products or using unmanaged forests often causes large emissions” (Stephanson 2013). The Department’s Chief Scientific Adviser has concluded that there are realistic scenarios in which wood burning could increase carbon dioxide emissions for many decades. Hirschberger (op cit.) has concluded that so-called greenhouse gas emissions from co-firing wood in the power plant operation stage can more than offset carbon absorption at an earlier stage, and may only be exceeded by natural gas and matched by the burning of lignite in electricity generating systems. In the USA it has been found that corn and cellulosic ethanol increase carbon emissions compared to gasoline by up to 93 per cent and 50 per cent, respectively. [T. Searchinger, et al: “Use of US croplands for biofuels increased greenhouse gases through emissions from land-use change”, Science, 319 (5867) 1238-1240, 2008.]
An opportunity to sound the death knell for modern biomass and biofuel exploitation (unless second and third generation technologies achieve serious take-off) could have been sounded in March and April, 2014, with the publication of Working Group II and III Reports (WGII and WGIII) of the Intergovernmental Panel on Climate Change’s Fifth Assessment. The Technical Summary of the WGII Report (as well as underlying Chapters - especially 9 and 19) laid some stress on the negative effects that had already occurred and were likely to intensify unless reversed. Quite extraordinarily, the WGII Summary for Policymakers failed to make any reference to this, presumably as a deliberate act. By contrast, the Summary for Policymakers from WGIII (approved on April 12th, 2014) failed to mention modern biomass or biofuels among the “new” renewable forms of energy listed in a positive manner (p. 23), and on page 28 warned of the issues to be considered with bioenergy: namely, emissions from land, food security, water resources, biodiversity considerations, and human livelihoods (Intergovernmental
78

Draft 06/24/2014
Panel on Climate Change Working Groups II and III, AR5, March and April, respectively, 2014).
Some voices have been heard arguing for second, and even third, generation biofuel technologies. However, the reality is that despite all the research and claims dating from the early 1970s to the present time none of the projected algae and oil yields have been achieved. Problems of cost (up to US$ 800 per barrel), algae shade, invasion by wild algae, and harvesting (separating the oil from the algae is a very difficult and energy-intensive process) intrude. [David Pimentel: “A Brief Discussion on Algae for Oil Production: Energy Issues”, in: D. Pimentel (ed.): “Biofuels, Solar and Wind as Renewable Energy Systems”, 2008, pps. 499-500.]
Wind Power
For some people the incidence of aerodynamic (or amplitude) modulation of wind turbines can cause sleep disturbance, and hence health problems, at distances up to 1.5 kilometres from their nearest turbine. This is not turbine noise as such, but air disturbance (the swish-swish noise of blades turning). [Dr. C. Hanning: “Sleep disturbance and wind turbine noise”, July, 2009; Dr. A. Harry: “Wind Turbines, Noise and Health”, February, 2007; D. Bowdler: “Amplitude Modulation of Wind Turbine Noise: A Review of the Evidence”, 2008; D. Bowdler: “ETSU-R-97: why it is wrong”, New Acoustics, www.newacoustics.co.uk; E. Pedersen & W.K. Persson: “Response to wind turbine noise in different living environments”, Occup. Env. Medicine, 2007 (64), 480-486; C.P. Schneider: “Accuracy of Model Predictions and the Effects of Atmospheric Stability on Wind Turbine Noise at the Maple Ridge Wind Power Facility”, Lowville, New York, 2007; M. Stigwood: “Large wind turbines – are they too big for ETSU-R-97”, Institute of Acoustics, January 16, 2009; G.P. van den Berg: “Effects of the wind profile at night on wind turbine sound”, Journal of Sound and Vibration, 2004 (277), 955-970.] These sources include acoustics experts and doctors who have analysed the causes of their patients’ referred. At the March, 2014, Institute of Acoustics meeting held in Newport, U.K., examples of amplitude modulation and its impacts were provided from the USA, Sweden and Australia, as well as the UK. The main wind energy association, RenewableUK, at last began to show some concern about the issues raised, though reluctantly, and their consultants’ claims were strongly disputed by experts present.
One consequence of the above phenomenon is loss of residential property values. Wind energy developments can reduce residential property values by over 10% where located within 2 kilometres of the nearest turbine – in some cases resulting in properties becoming unsaleable. (Stephen Gibbons: forthcoming in http://www.spatialeconomics.ac.uk/SERC/publications/default.asp; and, for example, the experience of the Davis family, near Deeping St. Nicholas, Lincolnshire, England.) Often linked to these effects are the occasional impacts of aerodynamic modulation mentioned above, and visual impacts (on picturesque landscapes and in relation to historic assets).
Hydropower and Solar
79

Draft 06/24/2014
On a much larger scale from time to time, especially in some developing countries, are the impacts of large hydropower schemes resulting in displacement of population, loss of agricultural land, unemployment, and consequential economic and social upheaval, as Atif Ansar and colleagues have suggested (op cit.). To date of only limited significance are the complaints from some aircraft pilots and passengers of the near blinding glare of the Sun’s reflection off solar mirrors placed in the Mojave Desert on the California/Nevada border.
Impacts on Bird Life
The concern that modern biomass and biofuel developments will compromise biodiversity has led to increased interest in the study of bird life. This is because birds are an interesting indicator of biodiversity, being high in the food chain, sensitive to monoculture expansion, more mobile than most other groups, and therefore likely to respond to and reflect environmental quality on a broader scale than mammals or terrestrial insects. Hence they are often considered to be good indicators of wider ecosystem health. [R. D. Gregory et al: “Developing Indicators for European Birds”, in Philosophical Transactions of the Royal Society, 2005, (360), 269-288. Ian Bateman et al: “The UK National Ecosystem Assessment: Valuing Changes in Ecosystems Services”, in Helm and Hepburn, op cit, p. 86].
There is a vast literature on the impacts of loss of biodiversity and of human-erected structures on bird species and mortality. Although bird mortality is strongly linked to windows and other parts of buildings, passing traffic, and domestic cats, there is also strong evidence that wind turbines have been the cause of large numbers of bird fatalities. Fatalities appear to be increasing with the growing height of towers and to blade tip.
In the USA and elsewhere bird fatalities are higher around migration routes, especially down the western and eastern sides of the continent. In Canada also, the placing of wind energy developments along bird migration routes has been strongly condemned – such as on the peninsula in Prince Edward County, on the eastern shore of Lake Ontario. In Australia a wind energy development in North-West Tasmania has been responsible for the deaths of endangered wedge-tailed eagles.
There has been strong criticism of poorly conducted site surveys – even when, for example, the UK’s Royal Society for the Protection of Birds has had an involvement (for example, the Moorsyde Environmental Statement near Chillingham, Northumberland). Fewer site visits have been made in such instances than a proper survey would have required, there has been notable under-recording of birds, and faulty claims that the site was not on a bird “flyway”. In Denmark the authorities are accused of having bulldozed plans through to place seven 250-metre high wind turbines between the Thy National Park and the Veljerne RAMSAR site, which some estimate is Europe’s largest breeding ground for migratory birds. There are also instances, however, where concerns about bird species have caused the planned expansion of wind energy developments to be abandoned – as in the case of the offshore London Array, where the proximity of a significant red-throated diver colony was a major factor in 2014.
80
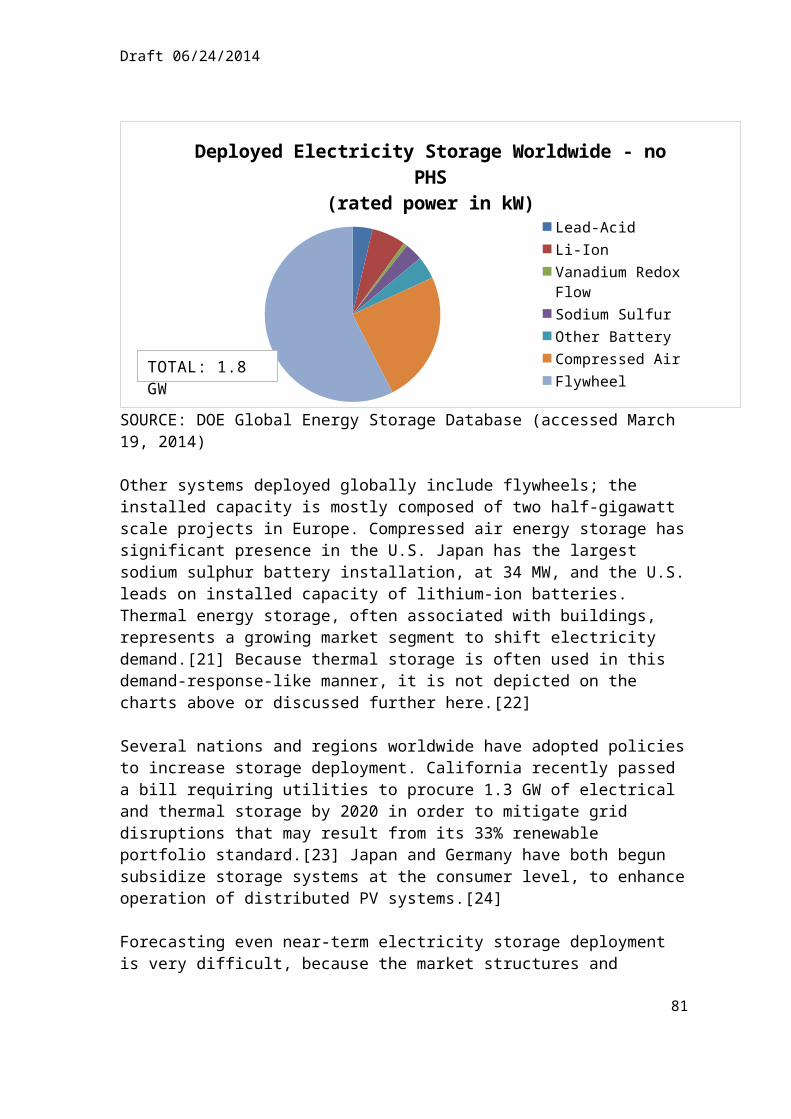
Draft 06/24/2014
Efforts to reduce casualties have arrived at the following conclusions. A prior environmental assessment should be carried out to ensure wind energy developments are not placed on or close to bird migration routes. Start-up wind speeds should be increased – from 4 metres per second to 5.5 metres per second (this has been found to result in little loss of overall wind turbine performance – in load/capacity factor terms). A radar look-out for the approach of large numbers of birds has also been recommended, although research findings suggest a poor link between number of birds in the vicinity of turbines and fatalities. [Manuela de Lucas et al: “Collision fatality of raptors in wind farms does not depend on raptor abundance”, Journal of Applied Ecology, 2008 (45) 1695-1703]. Stopping wind turbines within three minutes of the sighting of the approach of birds has been estimated to reduce fatality rates of griffon vultures by up to 50 percent.
It is not just bird fatalities that have given cause for concern. In 2010 420 wind turbines in Pennsylvania killed more than 10,000 bats according to the State Game Commission. At Tug Hill Plateau in New York State there are 195 wind turbines, with bat fatalities estimated at close to 60 per turbine per year. At Canada’s Ontario Wolf Island Eco-Power Centre there were nearly 2,000 bird and bat deaths in the first eight months of the wind development’s operation, with 33 bird species involved and five bat species – bat fatalities accounted for 1,270 of that total number. Then in December, 2013, a study from the University of Colorado at Denver appeared which concluded that: “well over 600,000 bats may have been killed at wind energy facilities in 2012.” [Mark A. Hayes: “Bats Killed in Large Numbers at United States Wind Energy Facilities”, Bioscience, December 2013 (63) 12]. Bat fatalities due to wind turbines have been reported in many European countries.
To date little action has been taken against wind energy developers and operators to discourage placing turbines where bird and bat fatalities arise. In the USA, however, there are environmental laws which can be applied to discourage this under the Migratory Bird Treaty Act. Duke Energy was fined $1 million in November, 2013, when eagles died at Top of the World and Campbell Hill wind energy developments outside Casper, Wyoming.
Two other forms of new renewable energy have attracted adverse criticism on grounds of their impact on birds. On February 12, 2014, The Wall Street Journal published an article headed: “The $2.2 Billion Bird-Scorching Solar Project”. This related to the large solar thermal (CSP or concentrating solar power) project in the Mojave desert on the Nevada/California border. Dozens of birds have died there in recent months apparently because of the heat emitted from the tower-based structures (as opposed to the more traditional, though still grossly under-exploited, parabolic mirrors).
The other form is estuarine barrages. These have been under discussion since Thomas Fulljames proposed a barrage across the Severn Estuary, between England and Wales, in 1849 (it is now the site of the Severn Bridge). The most widely known example in existence is near St. Malo, in North West France, where an estuarine barrage runs across the La Rance River. M. Rodier, of the developer Electricite de France, has stated that “The total closure of the estuary between 1963 and 1966 during the construction of the plant caused the almost complete disappearance of the original species.” [M. Rodier in:
81

Draft 06/24/2014
R. Clare (ed.): “Tidal power: trends and developments”, Thomas Telford, 1992, pps. 307-8.] Subsequently, Canada has closed its Annapolis barrage in the Bay of Fundy due to concerns about bird and fish mortality, and not proceeded with earlier plans for the Minas and Cumberland Basins, and Shepody Bay, for the same reason. [M. Jefferson: “Accelerating the transition to sustainable energy systems”, Energy Policy, 36 (2008) 4116-4125.]
7.9 Conclusions and Recommendations
From the information presented in this Chapter the following conclusions can be drawn: The negative environmental impacts of fossil fuels ADD In the absence of Carbon Dioxide Capture and Storage) are so pronounced compared to those of renewables and of nuclear power, that
electricity generation strategies should be based on reducing fossil fuel usage by promoting all low carbon technologies – where they can be soundly located and ideally with the consent of any local populations.
The need for sound analysis of actual and potential technical options is too often overlooked or evaded. Energy policies of many governments often appear to be based on subjective judgements of risks, influenced by powerful energy lobbies of all kinds, and designed primarily to appeal to the public.
Life cycle analyses of energy systems are the most promising approach to developing objective criteria that can aid future decision making. Unfortunately, too little attention is paid to this approach by decision makers.
The strongest proponents of both nuclear and renewables tend to have an overly optimistic view on the ability of their favoured technology to provide all of the low carbon electricity that is required
Nuclear power faces special challenges because of the widely recognised “radiation phobia” in the public. The scientific community in general, and the nuclear industry in particular, have not been very successful at responding to emotionally based public fears with rationally based science data. The greatest public concern about nuclear power is the potential for high consequence accidents, even if their estimated frequency is very low. The ultimate disposal of long-lived wastes also continues to be a concern for the public in most countries.
The environmental impacts of some renewable energy sources are underestimated by the public. Examples include:
o The impacts of promoting biofuelso The hazards of large damso The requirements for rare and toxic materialso Failure to consider their efficacy in terms of power density, EROI, sound
location (in relation to wind, solar, land and water availability). Financial requirements set against likely performance are insufficiently
examined and sometimes presented in a deliberately misleading manner by proponents of all the technologies considered..
Unless the potential for particular energy forms and technologies to cope with the demands, and to a sufficient extent the desires, of a growing human
82
Draft 06/24/2014
population in a finite world is carefully examined, then unavoidable limits will have to be faced.
SummaryIn setting preferences for the choice of electricity generation systems, many aspects have to be considered and, as Hirschberger and Dones (2014) point out in their comprehensive evaluation of systems, no single system performs best under all criteria. For the health and safety and environmental aspects discussed in this Chapter, renewables and nuclear energy both outperform by far fossil fuel sources. The relative advantages and drawbacks of renewables and nuclear are perceived or weighted differently by different technical, public or political stakeholders. Large hydropower is in many aspects superior, but opportunities for its use are often limited by topography and land use conflicts. The new renewables, solar and wind, can supply plentiful but dilute energy; they use large amounts of special materials and can require substantial tracts of land. Biomass can contribute, but the impacts on food production and on biodiversity need to be taken more into account. For nuclear power, the major hurdles are the fear of low-probability, high-consequence accidents and concerns about radioactive waste disposal. All these feed into the further hurdle that costs are high and uncertain. In practice, the dogmatic positions taken by extreme supporters on renewables or of nuclear power will serve only to prolong and increase the use of cheap fossil fuels, despite the acknowledged higher risks associated with these. An “all of the above” approach encouraging the use of all energy sources that have low output of carbon and other emissions appears to be the most rational approach.
References:1. Lynas M., (2014), “Nuclear 2.0: Why a Green Future Needs Nuclear Power”,
UIT Cambridge April 20142. ExterneE (2014), External Costs of Energy,
http://www.externe.info/externe_d7/ , accessed April 20143. Lecointe C. et al (2007), Final report on technical data, costs and life cycle
inventories of nuclear power plants, (http://www.needs-project.org/RS1a/RS1a%20D14.2%20Final%20report%20on%20nuclear.pdf )
4. Schenler W. et al (2009), “Project no: 502687, NEEDS, New Energy Externalities Developments for Sustainability, Deliverable D10.2 - RS2b, Final report on sustainability assessment of advanced electricity supply options”, http://www.needs-project.org/docs/NEEDS_RS2b_D10-2%20-%20Final%20Report.pdf
5. Ecoinvent (2014), www.ecoinvent.org6. IPCC (2014), Fifth Assessment Report,
http://www.ipcc.ch/report/ar5/index.shtml7. Hirschberger S., and Dones R. (2014), “Evaluation of Sustainability of
Electricity Supply Systems”, http://lrs.epfl.ch/webdav/site/lrs/shared/Document/hirschberg1.pdf , accessed April 2014
8. Wallner A. et al (2011), „Analyse von Energiebilanz und CO2 Emissionen der Nuklearindustrie über den Lebenszyklus“, http://www.ecology.at/files/berichte/E22.595-2.pdf
83

Draft 06/24/2014
9. Hall C., et al (2014), “EROI of Different Fuels and the Implications for Society”, Energy Policy, 64 ,January, 2014, pp141-152
10. US DOE (2011), “Department of Energy Critical Materials Strategy, 2011”, http://energy.gov/sites/prod/files/DOE_CMS2011_FINAL_Full.pdf
11. IPCC (2011) Working Group 3, “Strategic Report on Renewable Energy Sources” (Ed J. Sathaye), Chap 9 Renewable Energy in the Context of Sustainable Development, http://orbit.dtu.dk/fedora/objects/orbit:63951/datastreams/file_5672879/content
12. Peterson P. F., Zhao H., and Petroski R., (2005), “Metal And Concrete Inputs For Several Nuclear Power Plants”, Report UCBTH-05-001, available at http://pb-ahtr.nuc.berkeley.edu/papers/05-001-A_Material_input.pdf
13. White S. and Kulcinski G. (1999), “Birth to Death Analysis of Energy Payback Ratio and CO2 Gas Emission Rates for Coal, Fission, Wind and DT Fusion Electric Power Plants”,
http://www.colorado.edu/physics/phys3070/phys3070_sp05/docs/wisc1998.pdf 14. Dones R. et al, (2007) “Life Cycle Inventories of Energy Systems”, 2007
http://db.ecoinvent.org/reports/05_EnergySystemsSummary.pdf?area=463ee7e58cbf8
15. NEI (2014), “Water Use and Nuclear Power Plants”, http://www.nei.org/Master-Document-Folder/Backgrounders/Fact-Sheets/Water-Use-and-Nuclear-Power-Plants
16. MacKay D. (2009), “Sustainable Energy -without the Hot Air”, UIT, Cambridge, England, 2009, http://www.withouthotair.com/Contents.html
17. SBC (2014), Fact Sheets on Renewables http://www.sbc.slb.com/SBCInstitute/Publications.aspx
18. Hirschberg S. (2007), “Comparative Analysis of Energy Systems”, http://lrs.epfl.ch/webdav/site/lrs/shared/Document/Lecture%20Hirschberg%20EPFL%20Juni%202007.pdf
19. Rhodes R., and Beller D. (2000), “The Need for Nuclear Power”, Foreign Affairs. 1 Jan. 2000. Web. 19 Apr. 2014. http://www.foreignaffairs.com/articles/55629/richard-rhodes-and-denis-beller/the-need-for-nuclear-power
20. Dearen J. (2013), “Solar industry grapples with hazardous wastes”, http://ap.cjonline.com/pstories/us/20130210/1098090911.shtml
21. Nath I., (2010), “Cleaning Up After Clean Energy: Hazardous Waste in the Solar Industry”, Stanford Journal of International Relations, Spring 2010, https://www.stanford.edu/group/sjir/pdf/Solar_11.2.pdf
22. Wallard H., Duffy B., Cornick P., (2012), “After FukushimaI, Global Opinion on Energy Policy”, IPSOS Social Research Institute, http://www.ipsos.com/public-affairs/sites/www.ipsos.com.public-affairs/files/Energy%20Article.pdf
23. Weart S. (1988), “Nuclear Fear : A History of Images”, Cambridge, MA: Harvard University Press, 1988.
24. GEA (2012), “2012: Global Energy Assessment – Toward a Sustainable Future”, Cambridge University Press, Cambridge UK and New York, NY, USA and the International Institute for Applied Systems Analysis, Laxenburg, Austria
25. Younghwan K., Minki K., and Wonjoon K., (2013), “Effect of the Fukushima nuclear disaster on global public acceptance of nuclear energy”, http://papers.ssrn.com/sol3/papers.cfm?abstract_id=2322394
84

Draft 06/24/2014
26. Newport F., (2012), Americans Still Favor Nuclear Power a Year After Fukushima, http://www.gallup.com/poll/153452/Americans-Favor-Nuclear-Power-Year-Fukushima.aspx
27. Poortinga W., Pidgeon N., Capstick S. and Aoyagi M., (2013), “Public Attitudes to Nuclear Power and Climate Change in Britain Two Years after the Fukushima Accident”, http://www.ukerc.ac.uk/support/tiki-download_file.php?fileId=3371
28. Pimentel D., and Marcia H. Pimentel M. H., (2008), “Food, Energy, and Society”, 3rd. ed., 2008
29. R. Fouquet (ed.) (2013), “A Handbook on Energy and Climate Change, 2013”, pp.258-9.
30. Bertrand K., Lindsay G., Bar-Yam Y., (2012), NECSI Food Briefing, Sep 12, 2012, http://necsi.edu/research/social/foodprices/briefing/
31. Hind A., (2007), “Could jatropha be a biofuel panacea?”, http://news.bbc.co.uk/2/hi/6278140.stm
32. Barta P., (2007), “Jatropha Plant Gains Steam In Global Race for Biofuels”, Wall Street Journal online, http://online.wsj.com/news/articles/SB118788662080906716
33. DEFRA (2007), “Planting and Growing Miscanthus: Best Practice Guidelines – for Applicants to Defra’s Energy Crops Scheme”, http://adlib.everysite.co.uk/resources/000/023/838/miscanthus-guide.pdf
34. Stephenson A., (2013), “DECC’s BEaC Model (Bioenergy Emissions and Counterfactual Model”
35. Baldi, L., Peri M. and Vandone D., (2014), “Clean energy industries and rare earth materials: Economic and financial issues”, 2014 “Energy Policy”, March, pps. 53-61
36. Jefferson M. in R. Fouquet (ed.) (2013): “Handbook on Energy and Climate Change, Edward Elgar Pub (June 30, 2013), ISBN-13: 978-0857933683
37. Jefferson, M. (2012), “Capacity concepts and perceptions – Evidence from the UK wind energy sector”, IAEE Energy Forum (Spring 2012), 5-8
38. Ansar A., Flyvbjerg B. and Budzier B. and Lunn D., (2014), “Should we build more large dams? The actual costs of hydropower megaproject development, Energy Policy, March 2014, pp.1-14
39. Clare R. (ed.), (1992), “Tidal power: trends and developments”, 1992, contributions by R.G. Rice and G.C. Bakker pps. 3-21; and by S. Muirhead at p. 258
40. Warren C., et al., (2005) “’Green On Green’: Public Perceptions of Wind Power in Scotland and Ireland”, Journal of Environmental Planning and Management, November, 2005 (48), 6, 853-875.
41. Devine-Wright P. (ed.), “Renewable Energy and the Public: from NIMBY to Participation”, 2011, p. 118.]
42. Manzo L. C., and Patrick Devine-Wright P., (eds.) (2014): “Place Attachment: Advances in Theory, Methods and Applications”, 2014.]
43. Trainer E. (2013), “Some critical notes on the Global Energy Assessment’s Renewable Energy chapter”, 29 January, 2013
44. Trainer E., (2007), “Renewable Energy Cannot Sustain a Consumer Society”, 2007, p. 8.]
45. Smith J. W. and Positano S., (2010), “Self-Destructive Affluence of the First World: The Coming Crisis of Global Poverty and Ecological Collapse”
85

Draft 06/24/2014
46. Garrett Hardin G., (1993), “Living Within Limits: Ecology, Economics, and Population Taboos” (1993).
8. Nuclear Fusion: Status Report and Future Prospects
The number of conceivable non-fossil candidates that could replace the current massive use of fossil fuels is very limited: renewables, nuclear fission and fusion. Fusion is the least developed of the three, but has particularly valuable environmental and safety advantages and has virtually inexhaustible resources. This chapter discusses the current status of worldwide fusion research, resources, safety, environmental and economic aspects of fusion energy.
8.1 Principles
Replicating the fusion reaction in the sun would be a first possible approach to realize fusion on earth. However, the p-p reaction in the sun essentially converts 4 protons into a Helium-4 (4He) nucleus containing 2 neutrons. This reaction requires thus the conversion of protons into neutrons, implying a weak interaction with a very low probability and therefore not suited for an economical process on earth. A much more ‘simple’ solution is offered using hydrogen isotopes, already containing the necessary numbers of neutrons and protons from the start, thus resulting in a reaction where essentially a rearrangement of the nuclides takes place, with a 1024 times higher reaction rate than the p-p process in the sun. From all possible reactions involving H isotopes, the least difficult fusion reaction is the one between the hydrogen isotopes deuterium (D) and tritium (T):
D + T ➝4He (3.5MeV) + n (14.1MeV)
To produce sufficient fusion reactions, the core temperature of a D-T plasma has to be about 150-200 million C.
The reaction products are a 3.5 MeV Helium particle and a 14.1 MeV neutron, i.e. about an energy of about 17.6 MeV is released per fusion reaction. This will be converted into heat in a blanket and then into electricity using conventional technology (Carnot cycle). As about one million times more energy is released from a fusion reaction in comparison with a chemical one, this then explains why so little fuel can produce so much energy: when burnt in a fusion reactor, the deuterium contained in 1 liter of sea water (about 30 mg) will produce as much energy as burning 250 l of gasoline.
8.2 Status Of Magnetic Fusion Research
There exist presently two approaches to realise nuclear fusion on earth: inertial and magnetic fusion. Magnetic fusion uses magnetic fields to confine the fuel. Three classes of devices in use are tokamaks, stellarators and reversed field pinches. This line
86

Draft 06/24/2014
of research into controlled fusion is being funded in a large number of countries around the globe. Strong magnetic fields are used to keep the hot particles away from the walls of the confinement device. This is possible because of the property of charged particles to follow a helical path around magnetic field lines caused by the Lorentz force and possible movements perpendicular to the field are thereby highly restricted. The interested reader can find a wealth of additional information in [1].
Inertial fusion consists of micro-explosions of small fuel pellets by means of powerful lasers or particle beams. Confinement of the fuel is based on the inertia of the pellet fuel mass, which resists the natural expansion when it is heated to thermonuclear fusion temperatures. To achieve sufficient fusion reactions in this short time requires a density of about 1 kg/cm3, a 10000-fold increase over the original density and about 100 times the density of lead or 1000 times that of water [2]. This approach is being investigated in far fewer countries than is magnetic fusion. Moreover, because of the relation of target physics and target design to military programs, some aspects of inertial fusion research remain classified in several countries.
Fantastic progress has been made in magnetic fusion in the last decades. Three generations of tokamaks with doubling of characteristic dimensions at each step led to a 10000 times higher value of the fusion triple product (density times temperature times confinement time, characterizing performance of the fusion reaction) in the last 40 years. Since the start of controlled fusion research, a 10 million-fold improvement in the fusion triple product has been obtained approaching reactor conditions [3].First large scale Deuterium-Tritium experiments took place in the early 1990s. Several MW of fusion power have been released in a controlled way in deuterium-tritium experiments in JET (Joint European Torus, Culham, UK) and TFTR (Tokamak Fusion Test Reactor, Princeton, USA). Peak values of about 16 MW have been obtained on JET in 1997 corresponding to values for the power amplification QDT (i.e. the ratio of the power released from deuterium-tritium fusion reactions to the power applied to heat the fuel) close to 0.7. A summary of what has been achieved in high power D-T experiments is shown in Fig. I.
In addition, ion temperatures up to 45 keV, which is about 30 times higher as that in the centre of the sun, have been achieved in Japanese tokamak JT-60U (Japan Atomic Energy Agency, Naka Fusion Institute, Naka, Japan) [4]. Magnetic fusion research has thus now arrived at the point where large amounts of fusion energy can be produced in a controlled way. The next step is to maintain a steady power output from fusion reactions in long pulses. To make this possible, superconducting coils for the magnetic fields will have to be used, because they are not subject to the huge resistive losses of classical copper coils. The use of superconducting coils has been very successfully demonstrated e.g. in Tore Supra (CEA-Cadarache, France) and the Large Helical Device LHD (National Institute for Fusion Science, Toki, Japan). Both machines have record length pulses at relevant plasma parameters in hydrogen and deuterium plasmas: 6 minutes and 30 seconds on Tore Supra in 2004 [5] and 54 minutes on LHD in 2007 [6].
Magnetic fusion research entered a new era in 2005 with the international agreement (28 June 2005) on the construction site of ITER at Cadarache (close to Aix-
87

Draft 06/24/2014
en-Provence in France). Seven large nations are participating in the project: Europe, Russia, India, China, Japan, South Korea and the USA. Construction started in August 2010. First (H or 4He) plasmas are projected for 2023 and full power D-T plasmas around 2030.. Long pulses in D-T plasmas are planned for ITER, with 500 MW of fusion power in pulses of 400 s and longer, and corresponding QDT values ranging between 10 and 30. In addition, Europe and Japan have launched a joint project called “Broader Approach” for exploring the next step after ITER, which should be a first prototype of a fusion power reactor and is called DEMO. The “Broader Approach” includes three research projects [7]:
(i) the Engineering Validation and Engineering Design Activities (EVEDA) for the International Fusion Materials Irradiation Facility (IFMIF), a dedicated laboratory to be built in the near future to test candidate first wall materials / alloys for a future fusion power reactor. IFMIF consists of an accelerator-based, D-Li neutron source to produce neutrons with an energy peaking around 14 MeV at sufficient intensity and irradiation volume. The EVEDA phase consists of validating the main technological challenges of IFMIF, accelerator, target and test facility, with the construction of full scale prototypes: a deuteron accelerator at 125 mA and 9 MeV (a reduced version of the 40MeV, 125mA accelerator for IFMIF); three different lithium loops (Brasimone (ENEA), Oarai (JAEA) and Osaka University); a High Flux Test Module and He cooling gas prototype in the Karlsruhe Institute of Technology (KIT) and Small Specimens Test Technique in Japanese Universities [8] (ii) the International Fusion Energy Research Centre (IFERC) in Rokkasho, close to Aomori, in Japan, for DEMO design and R&D [9] (iii) an upgrade of the tokamak JT-60U, termed JT-60 Super Advanced or JT-60SA [10]
Inertial fusion progress has also been impressive. In the US, the National Ignition Facility (NIF, Livermore, California), hosts one of the most powerful laser systems in the world. As designed, the NIF laser system will deposit 1.8MJ in a few pico seconds, using 192 individual beamlet. NIF was completed in 2009. To characterize the performance of inertial fusion experiments the NIF group uses the fuel energy gain G, defined as the ratio energy output due to fusion reaction / energy input delivered to core plasma. A fuel energy gain of about 2 has been reached very recently in NIF [11] where an energy of 17.3 kJ from fusion reactions has been produced from an input energy of 8.5-9.4 kJ delivered to the DT plasma. Note that the fuel energy gain does not take into account the coupling between the laser and the DT plasma. If the Q factor, defined as the ratio of fusion energy output to laser energy input is introduced, the Q value for the experimental results of NIF correspond to an estimated Q ~ 0.01, because laser energy and fusion energy output are 1.9 MJ and 17.3 kJ, respectively. The European counterpart to NIF is the Laser Megajoule (LMJ), an experimental ICF device being built near Bordeaux, France by CEA, the French nuclear science directorate. Laser Mégajoule plans to deliver about 1.8 MJ of laser energy to its capsules, making it about as powerful as NIF. Laser Mégajoule is the largest ICF experiment being built outside the US and uses a series of 240 laser beam lines, organized into eight groups of 30 beams. GEKKO XII is a high-power 12-beam laser system at the Institute for Laser Engineering in Osaka, Japan in use since 1983. The 12 beams of the GEKKO laser are capable of delivering about 10 kJ per 1-2 ns pulse (i.e.10-20 TW). The Osaka group has proposed a
88

Draft 06/24/2014
new concept, called fast ignition, using a Petawatt laser, and is now promoting this as the FIREX project [12]. The difference between a central ignition scheme employed in NIF and LMJ and the fast ignition one can be compared to the difference between a diesel engine and a gasoline one from the viewpoint of the ignition mechanism.
Future plans in high power short pulse laser systems are ELI (Extreme Light Infrastructure) in Europe and GEKKO EXA in Japan. Both systems are intended to deliver 0.2 ExaWatt (2 1017 W) in femto (10-15) or atto (10-18) second pulses. The European system plans a pulse repetition rate of 1 minute, while the system in Japan will have a repetition rate of 2 hours, however at a 10 fold reduced cost.
8.3 Fusion Fuel Resources
Deuterium, a non-radioactive isotope of hydrogen is extremely plentiful as it can be obtained from ordinary water (about 30 g from 1 ton [13]) with cheap extraction techniques using conventional technology. Complete burning of deuterons and the first generation fusion products (T and 3He) results in the overall equation:
6D ➝2 4He + 2H + 2n + 43.3 MeV
providing 350 1015 J/ton D. The amount of deuterium in seawater on earth is estimated at 4.6 1013 tons, equivalent to about 5 1011 TWyr.
Tritium is the radioactive isotope of hydrogen. It decays to 3He by emission of an electron:
T ➝3He + e- + 18.7 keV
with the rather short half-life of 12.3 years. The quantities available in nature are not sufficient for technical applications. The neutrons produced in the fusion reactions will be used to breed it by bombarding a blanket around the burn chamber containing a lithium compound, according to:
6Li + n ➝4He (2.05MeV) + T (2.73MeV)
7Li + n ➝4He + T + n - 2.47 MeV
Thus the real consumables in the D-T fusion process are D and Li, while T is an intermediate product burned in the fusion reaction.
Lithium, like deuterium, is a widely available element. There are two isotopes 6Li and 7Li, which occur naturally (7.5% and 92.5% respectively). 6Li is the most useful isotope as it reacts with neutrons in the lower energy range (E < 1MeV). Model calculations [1] show that the burn up of 7Li in a future fusion reactor would be negligible and thus only 6Li is relevant to resource considerations. Per 6Li atom, one T atom is formed, with an extra energy of 4.78 MeV. Including the energy released in D-T fusion reactions, 22.38 MeV is released per 6Li atom. The energy content of natural Li is
89

Draft 06/24/2014
therefore about 27 1015 J/ton. Estimated reserves of natural Li are somewhat less than 29 million tons in known ore deposits and brines [14] and about 200 billion tons dissolved in sea water (0.1-0.2ppm) [15], equivalent to about 2.4 104 and 1.7 108 TWyr.
Since only one neutron is produced in each fusion reaction and since each new tritium nucleus to be bred from Li requires one neutron, it will be necessary to provide a small additional neutron source, to balance losses in the breeding blanket. Possible suitable neutron multipliers are beryllium and lead, using the (n, 2n) reaction:
9Be + n ➝2 4He + 2n - 1.57 MeV208Pb + n ➝207Pb + 2n – 7.4 MeV
8.4 Safety Aspects
Inherent and passive safety
First, the amount of fuel available at each instant is sufficient for only a few tens of seconds, in sharp contrast with a fission reactor where fuel for several years of operation is stored in the reactor core. Second, fusion reactions take place at extremely high temperatures and the fusion process is not based on a neutron multiplication reaction. With any malfunction or incorrect handling the reactions will stop. An uncontrolled burn (nuclear runaway) of the fusion fuel is therefore excluded on physical grounds. Even in case of a total loss of active cooling, the low residual heating excludes melting of the reactor structure [1].
Minimal Radioactivity
The basic fuels (D and Li) as well as the direct end product (4He) of the fusion reaction are not radioactive. However, a fusion reactor will require confinement and control of radioisotopes since it has a radioactive inventory consisting of (i) tritium and waste contaminated by tritium and (ii) reactor materials activated by the neutrons of the fusion reaction. Studies [1] indicate, however, that an adequate choice of the latter can minimise the induced radioactivity such that recycling should become possible after some decades to a century. Thus, radioactivity does not have to be inherent to nuclear fusion, in contrast to nuclear fission where the fission reaction itself leads to dangerous long-lived radioactive products.
The tritium cycle is internally closed, and the total tritium inventory in the fusion power plant will be on the order of a few kg. An evacuation of the public might not even be needed in case of an accident if a proper detritiation system is implemented. Special permeation barriers will have to be used to inhibit discharge into the environment of tritium diffusing through materials at high temperature [1]. As tritium is chemically equivalent to hydrogen, it can replace normal hydrogen in water and all kinds of hydrocarbons. It could thus contaminate the food chain when released in the atmosphere. The absorption of tritium contaminated food and water by living organisms is a potential hazard. However, possible damage is reduced owing to the short biological half-life of tritium in the body of about 10 days.
90

Draft 06/24/2014
Reduced proliferation risk
The operation of fusion reactors is not accompanied by the production of fissile materials required for nuclear weapons. Only a significant modification of the fusion reactor - the introduction of a special breeding section containing fertile material - would make the production of weapons grade fissile materials possible. However, the presence of such a section (in an environment where none at all should be present) could be easily discovered by qualified inspectors [16].
8.5 Environmental Aspects
Environmental pollution?
The primary fuels (D and Li) and the direct end product (4He) are not radioactive, do not pollute the atmosphere, and do not contribute to the greenhouse effect or the destruction of the ozone layer. Helium is in addition chemically inert and indispensable for superconducting applications. There are no problems with mining (Li) and fuel transportation. No ecological, geophysical and land-use problems exist such as those associated with biomass energy, hydropower and solar energy.
Measures for tritium containment and detritiation of substances contaminated with tritium will have to be taken. During normal operation the dose for the public in the neighbourhood of the plant will only be a fraction of the dose due to natural radioactivity.
Dangerous waste?
An important advantage of fusion is the absence of direct radioactive reaction products, in contrast to fission, where radioactive waste is unavoidable since the products of the energy releasing nuclear reaction are radioactive.
Adequate disposal of radioactive waste is especially difficult if the products are volatile, corrosive or long-lived. The neutron-activated structural materials of a fusion reactor would not pose such problems and because of their high melting point and their low decay heat, will not necessitate active cooling during decommissioning, transport or disposal. Studies [1] show that over their life time, fusion reactors would generate, by component replacement and decommissioning, activated material similar in volume to that of fission reactors but qualitatively different in that the long-term radio toxicity is considerably lower (no radioactive spent fuel).
Fusion could be made even more attractive by the use of advanced structural materials with low activation as e.g. vanadium alloys or silicon carbides. These materials offer in principle the prospect of recycling in about 100 years after the shutdown of the reactor as the radioactivity would fall to levels comparable to those of the ashes from coal-fired plants [1] (which contain always small amounts of thorium and other actinides). As already discussed above, there is a large research programme set up
91

Draft 06/24/2014
jointly between the EU and Japan to prepare the experimental investigation of properties of candidate alloys, with the IFMIF/EVEDA program.
8.6 Economic Aspects
It is obviously difficult to estimate with any useful precision the cost of a system that will only be put into service several decades from now. In comparison with other energy sources, environmental and safety-related advantages and the virtual inexhaustibility of the fuel sources should be taken into account, as well as the evolution of the cost of electricity based on (exhaustible) resources. Present studies, embodying many uncertainties, produce cost estimates, which are close to those of present power plants. Investment costs (reactor chamber, blanket, magnets, percentage of recirculating power...) will probably be higher, but the fuel is cheap and abundant. Fusion is likely to be a centralised energy source. On the basis of present knowledge, technologically sophisticated power plants will probably have an electrical output larger than 1 GW to be economic. The fast neutrons produced in the D-T reaction could be used to produce fissile material in fusion-hybrid breeder reactors. This complementary role for fusion might improve system economics compared with pure fusion systems; however, it would increase societal concerns related to safety, environment and weaponry.
Fig. I Fusion power development in the D-T campaigns of JET (full and dotted lines) and TFTR (dashed lines)[17].
References :
[1] I.Cook et al., "Safety and Environmental Impact of Fusion" Report EFDA-S-RE-1, EUR(01) CCE-FU/FTC 8/5 (April 2001);
92

Draft 06/24/2014
[2] M. Tabak et al., Phys. Plasmas 1, 1626 (1994).
[3] J.Wesson, "Tokamaks", Third Edition, Oxford Science Series nr. 118, Clarendon Press, Oxford (2004), ISBN-0-19-850922-7.
[4] S. Ishida, et al., “High performance experiments in JT-60U high current divertor discharges”, Proc. 16 th Int. Conf. Plasma Physics and Controlled Nuclear Fusion Research, Montreal, Canada, 1996, IAEA, Viennna, Vol. 1 (1997) 315.
[5] J.Bucalossi et al., 32nd EPS Conference on Plasma Phys. Tarragona, 27 June - 1 July 2005 ECA Vol.29C, O-4.005 (2005); G.Giruzzi et al., Plasma Phys. Contr. Fusion, 47, 12B, B93 (2005).
[6] T. Mutoh, et al., “Steady-state operation and high energy particle production of MeV energy in the Large Helical Device”, Nuclear Fusion, 47 (2007) 1250-1257.
[7] See for a description http://naka-www.jaea.go.jp/english/ba/index.html
[8] J. Knaster, et al., “IFMIF: overview of the validation activities”, Nucl. Fusion 53 (2013) 116001.
[9] N.Nakajima et al., “Overview of IFERC project in Broader Approach activities”, Proc. 24th IAEA Fusion Energy Conference, (8-13 October 2012, San Diego, USA), Paper OV/P-05 (2012).
[10] Y. Kamada, et al., “Progress of the JT-60SA project”, Nucl. Fusion 53 (2013) 104010
[11] O.A. Hurricane, et al., “Fuel gain exceeding unity in an inertially confined fusion implosion”, Nature, vol. 506 (2014) 343.
[12] H. Azechi, et al., “Present status of fast ignition realization experiment and inertial fusion energy development”, Nuclear Fusion, 53 (2013) 104021
[13] I.Friedman, Geochimica and Cosmochimica Acta, 4, 89-103 (1953)
[14] R.Keith Evans, “An abundance of lithium” (July 2008), www.worldlithium.com
[15] R.Keith Evans, "Lithium Reserves and Resources", Energy, 3, 379-385 (1978).
[16] "Status Report on Controlled Thermonuclear Fusion, Executive Summary and General Overview", prepared by the International Fusion Research Council (IFRC), International Atomic Energy Agency, Vienna (1990)
[17] J.Jacquinot and the JET Team, “Deuterium-tritium operation in magnetic confinement experiments: results and underlying physics”, Plasma Phys. Control. Fusion, 41 (1999) A13-A46.
93

Draft 06/24/2014
94