· Web viewMetabolite data analysis with Metaboanalyst Metaboanlyst is a free web based tool to...
7
Du Lab Updated Dec 15, 2016 Metabolite data analysis with Metaboanalyst Metaboanlyst is a free web based tool to analyze metabolomics data http://www.metaboanalyst.ca/ There are more resources on the website in the left side. 1. Format the data file A. Make a format in Excel as below (if two groups). Here there are two groups (Apical and Basal) Sample M1 1A M1 2A M1 3A M1 1B M1 2B M1 3B Label Apical Apical Apical Basal Basal Basal Proline 59844441 33791551 23474213 11951765 6 13673584 1 128762485 Allantoin 19858 34695 29799 71271 62978 48100 4- Hydroxybutyrate 2185475 1986435 2820447 3893676 2066648 3473576 Ribose-5-P 167070 197278 139778 195885 206918 130071
Transcript of · Web viewMetabolite data analysis with Metaboanalyst Metaboanlyst is a free web based tool to...

Du Lab Updated Dec 15, 2016
Metabolite data analysis with Metaboanalyst
Metaboanlyst is a free web based tool to analyze metabolomics data
http://www.metaboanalyst.ca/
There are more resources on the website in the left side.
1. Format the data file
A. Make a format in Excel as below (if two groups). Here there are two groups (Apical and Basal)
Sample M1 1A M1 2A M1 3A M1 1B M1 2B M1 3B
Label Apical Apical Apical Basal Basal Basal
Proline 59844441 33791551 23474213 119517656 136735841 128762485
Allantoin 19858 34695 29799 71271 62978 48100
4-Hydroxybutyrate 2185475 1986435 2820447 3893676 2066648 3473576
Ribose-5-P 167070 197278 139778 195885 206918 130071
Acetylcarnitine 48707 62685 56021 51924 26663 41485
Homoserine 100250 102629 112778 151527 166205 156264
Folic Acid 15674 10762 15763 10833 21809 11802
Arachidonate 61729 66610 73376 79207 68003 54012

Du Lab Updated Dec 15, 2016
isoValeric Acid 796251 800411 767928 919306 1036717 872882
Homovanilate 731392 667279 585246 794879 765786 663936
F16BP/F26BP/G16BP 42954 40554 48960 54221 67125 55755
Choline 22743223 21776263 19723315 25825552 30454783 25465297
OH-Phenylpyruvate 63157 56977 51205 50963 69219 58001
B. Save the excel file as CSV (Comma Delimited)
2. Click top “here to start”. Select Statistical Analysis”

Du Lab Updated Dec 15, 2016
Choose “Peak Intensity table” in data type, “Samples in columns (unpaired)” in format dropdown list.
Browse the *.csv file and press submit button on the right.
Press Missing value estimation, choose the default and then press process

Du Lab Updated Dec 15, 2016
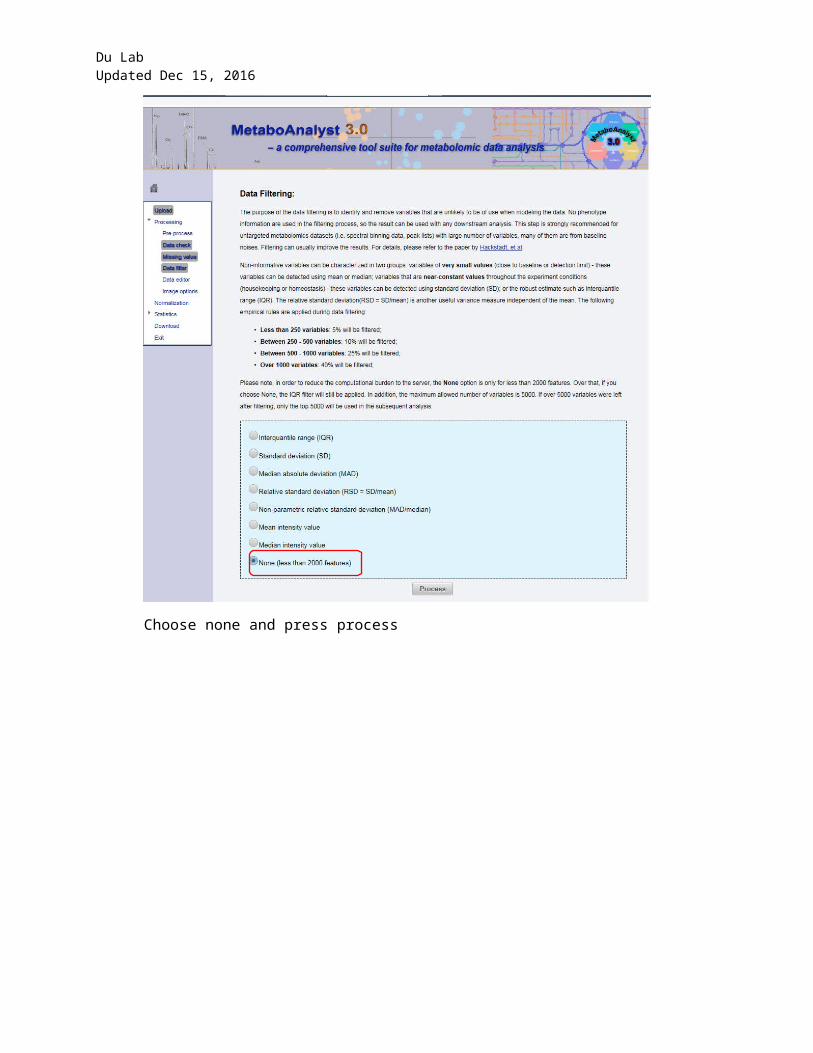
Choose none and press process
Du Lab Updated Dec 15, 2016
Choose normalization by a specific reference sample (Choose first sample)
Choose “Auto scaling”, press normalize.
Then press “proceed”

Du Lab Updated Dec 15, 2016
Press the option on the left for “fold change, T test, PCA, PLSDA and look at the imp. Feature, correlation. Finally, press download to download .zip for all the report.
Press “upload” on the left top and go the home page. For enrichment and pathway analysis, just paste the changes in T test