
mathforum.orgmathforum.org/kb/servlet/JiveServlet/download/671-2447111-8893246... · Web...
37
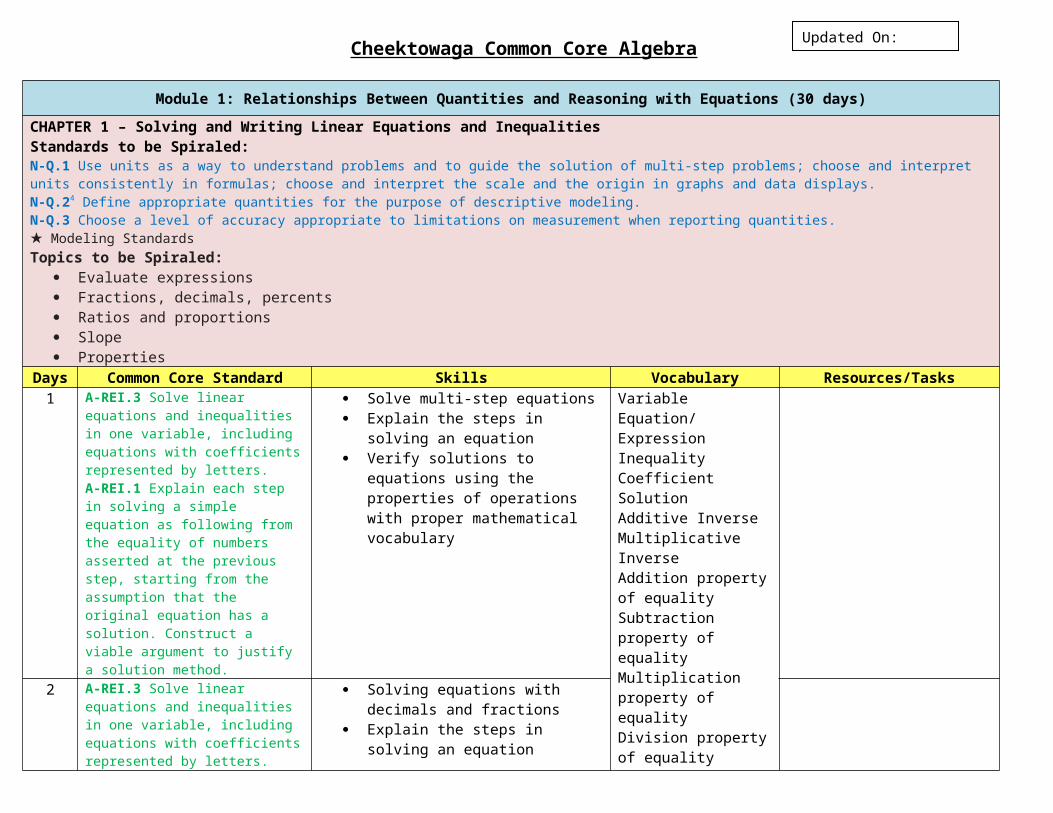
Cheektowaga Common Core Algebra Module 1: Relationships Between Quantities and Reasoning with Equations (30 days) CHAPTER 1 – Solving and Writing Linear Equations and Inequalities Standards to be Spiraled: N‐Q.1 Use units as a way to understand problems and to guide the solution of multi‐step problems; choose and interpret units consistently in formulas; choose and interpret the scale and the origin in graphs and data displays. N‐Q.2 4 Define appropriate quantities for the purpose of descriptive modeling. N‐Q.3 Choose a level of accuracy appropriate to limitations on measurement when reporting quantities. ★ Modeling Standards Topics to be Spiraled: Evaluate expressions Fractions, decimals, percents Ratios and proportions Slope Properties Days Common Core Standard Skills Vocabulary Resources/Tasks 1 A‐REI.3 Solve linear equations and inequalities in one variable, including equations with coefficients represented by letters. A‐REI.1 Explain each step in solving a simple equation as following from the equality of numbers asserted at the previous step, starting from the assumption that the original equation has a solution. Construct a viable argument to justify a solution method. Solve multi-step equations Explain the steps in solving an equation Verify solutions to equations using the properties of operations with proper mathematical vocabulary Variable Equation/ Expression Inequality Coefficient Solution Additive Inverse Multiplicative Inverse Addition property of equality Subtraction property of equality Multiplication property of equality Division property of equality 2 A‐REI.3 Solve linear equations and inequalities in one variable, including equations with coefficients represented by letters. Solving equations with decimals and fractions Explain the steps in solving an equation Updated On:
Transcript of mathforum.orgmathforum.org/kb/servlet/JiveServlet/download/671-2447111-8893246... · Web...
Cheektowaga Common Core Algebra
Module 1: Relationships Between Quantities and Reasoning with Equations (30 days)
CHAPTER 1 – Solving and Writing Linear Equations and InequalitiesStandards to be Spiraled:N Q.1 ‐ Use units as a way to understand problems and to guide the solution of multi step problems; choose and interpret units consistently in formulas; choose and interpret the ‐scale and the origin in graphs and data displays.N Q.2‐ 4 Define appropriate quantities for the purpose of descriptive modeling.N Q.3 ‐ Choose a level of accuracy appropriate to limitations on measurement when reporting quantities.★ Modeling StandardsTopics to be Spiraled:
Evaluate expressions Fractions, decimals, percents Ratios and proportions Slope Properties
Days Common Core Standard Skills Vocabulary Resources/Tasks1 A REI.3 ‐ Solve linear equations and
inequalities in one variable, including equations with coefficients represented by letters.A REI.1 ‐ Explain each step in solving a simple equation as following from the equality of numbers asserted at the previous step, starting from the assumption that the original equation has a solution. Construct a viable argument to justify a solution method.
Solve multi-step equations Explain the steps in solving an equation Verify solutions to equations using the
properties of operations with proper mathematical vocabulary
VariableEquation/ExpressionInequalityCoefficientSolutionAdditive InverseMultiplicative InverseAddition property of equalitySubtraction property of equalityMultiplication property of equalityDivision property of equality
2 A REI.3 ‐ Solve linear equations and inequalities in one variable, including equations with coefficients represented by letters.A REI.1 ‐ Explain each step in solving a simple equation as following from the equality of numbers asserted at the previous step, starting from the assumption that the original equation has a solution. Construct a viable argument to justify a solution method.
Solving equations with decimals and fractions
Explain the steps in solving an equation Verify solutions to equations using the
properties of operations with proper mathematical vocabulary
3 A REI.3 ‐ Solve linear equations and inequalities in one variable, including equations with coefficients represented
Solve multi-step inequalities Explain the steps in solving an
inequality
Updated On: 3/26/2013

by letters.A REI.1 ‐ Explain each step in solving a simple equation as following from the equality of numbers asserted at the previous step, starting from the assumption that the original equation has a solution. Construct a viable argument to justify a solution method.
Verify solutions to inequality using the properties of operations with proper mathematical vocabulary
4 A REI.3 ‐ Solve linear equations and inequalities in one variable, including equations with coefficients represented by letters.A REI.1 ‐ Explain each step in solving a simple equation as following from the equality of numbers asserted at the previous step, starting from the assumption that the original equation has a solution. Construct a viable argument to justify a solution method.
Solving inequalities with decimals and fractions
Explain the steps in solving an inequality
Verify solutions to inequality using the properties of operations with proper mathematical vocabulary
5 QUIZ6
*GAP* Solve word problems involving
percents using equations (finding whole, part, or percent)
PercentDiscountInterestMarkupMarkdownPercent errorPercent increasePercent decreaseTaxCommissionGratuity
7
*GAP*
Solve multistep percent problems involving simple interest, tax, markups, markdowns, gratuities, commissions, percent increase/decrease, and percent error.
8 A REI.3 ‐ Solve linear equations and inequalities in one variable, including equations with coefficients represented by letters.A CED.4 ‐ Rearrange formulas to highlight a quantity of interest, using the same reasoning as in solving equations. For example, rearrange Ohm’s law V = IR to highlight resistance R.★
Solve literal equations Verify solutions to equations using the
properties of operations with proper mathematical vocabulary
Literal equationsVariableEquation/ExpressionInequalityCoefficientSolutionAdditive InverseMultiplicative InverseAddition property of equalitySubtraction property of equality
9 A REI.3 ‐ Solve linear equations and inequalities in one variable, including equations with coefficients represented by letters.
Solve literal equations Verify solutions to equations using the
properties of operations with proper
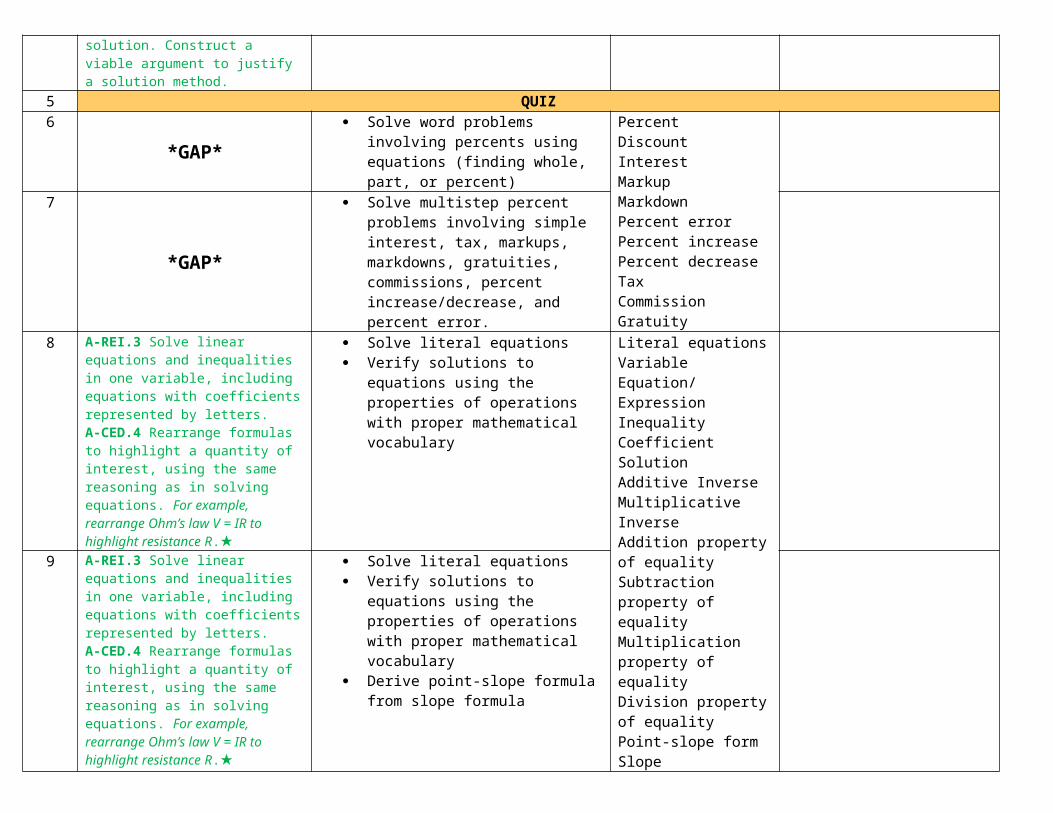
A CED.4 ‐ Rearrange formulas to highlight a quantity of interest, using the same reasoning as in solving equations. For example, rearrange Ohm’s law V = IR to highlight resistance R.★
mathematical vocabulary Derive point-slope formula from slope
formula
Multiplication property of equalityDivision property of equalityPoint-slope formSlope
10 A CED.1 ‐ Create equations and inequalities in one variable and use them to solve problems. Include equations arising from linear and quadratic functions, and exponential functions.★A CED.3 ‐ Represent constraints by equations or inequalities, and by systems of equations and/or inequalities, and interpret solutions as viable or non viable options in a ‐modeling context. For example, represent inequalities describing nutritional and cost constraints on combinations of different foods.★
Write and solve linear equations from a word problem
Write and solve linear inequalities from a word problem
Interpret solutions within the context of word problems (see template)
Explain whether solutions to a linear equation or inequality are valid or not
At mostAt leastIs less thanIs greater thanSolution
11 A CED.1 ‐ Create equations and inequalities in one variable and use them to solve problems. Include equations arising from linear and quadratic functions, and exponential functions.★A CED.3 ‐ Represent constraints by equations or inequalities, and by systems of equations and/or inequalities, and interpret solutions as viable or non viable options in a ‐modeling context. For example, represent inequalities describing nutritional and cost constraints on combinations of different foods.★
Write and solve linear equations from a word problem
Write and solve linear inequalities from a word problem
Interpret solutions within the context of word problems (see template)
Explain whether solutions to a linear equation or inequality are valid or not
12 CHAPTER 1 REVIEW13 CHAPTER 1 TEST
CHAPTER 2 – Graphing Linear Equations and InequalitiesStandards to be Spiraled:N Q.1 ‐ Use units as a way to understand problems and to guide the solution of multi step problems; choose and interpret units consistently in formulas; choose and interpret the ‐scale and the origin in graphs and data displays.N Q.2‐ 4 Define appropriate quantities for the purpose of descriptive modeling.N Q.3 ‐ Choose a level of accuracy appropriate to limitations on measurement when reporting quantities.

★ Modeling StandardsTopics to be Spiraled:
Evaluate expressions Fractions, decimals, percents Ratios and proportions Slope A SSE.1 ‐ Identify parts of an expression by defining appropriate vocabulary such as: term, coefficient, variable, constant
14 8.F.4 Construct a function to model a linear relationship between two quantities. Determine the rate of change and initial value of the function from a description of a relationship or from two (x, y) values, including reading these from a table or a graph. Interpret the rate of change and the initial value of a linear function in terms of the situation it models, and in terms of its graph or a table of values.
Graphing equations Meaning of x, y, slope, intercepts Solve an equation for y then graph it Write an equation of a line given two
points Write an equation of a line given the
slope and a point on the line
SlopeX-interceptY-interceptEquation of a linePoint-slope formSlope intercept form
1516 A CED.2 ‐ Create equations in two or
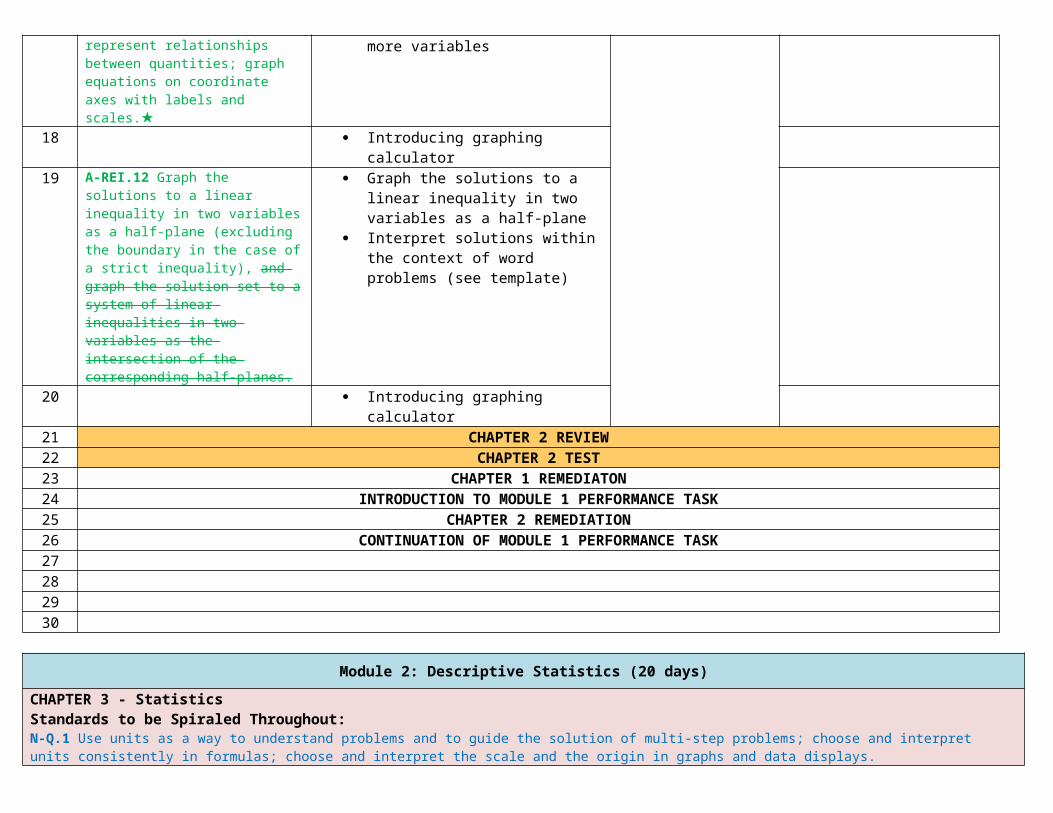
more variables to represent relationships between quantities; graph equations on coordinate axes with labels and scales.★
Write and graph linear equations using two or more variables
17 A CED.2 ‐ Create equations in two or more variables to represent relationships between quantities; graph equations on coordinate axes with labels and scales.★
Write and graph linear equations using two or more variables
18 Introducing graphing calculator19 A REI.12 ‐ Graph the solutions to a linear
inequality in two variables as a half‐plane (excluding the boundary in the case of a strict inequality), and graph the solution set to a system of linear inequalities in two variables as the intersection of the corresponding half‐planes.
Graph the solutions to a linear inequality in two variables as a half-plane
Interpret solutions within the context of word problems (see template)
20 Introducing graphing calculator21 CHAPTER 2 REVIEW22 CHAPTER 2 TEST23 CHAPTER 1 REMEDIATON24 INTRODUCTION TO MODULE 1 PERFORMANCE TASK

25 CHAPTER 2 REMEDIATION26 CONTINUATION OF MODULE 1 PERFORMANCE TASK27282930
Module 2: Descriptive Statistics (20 days)
CHAPTER 3 - StatisticsStandards to be Spiraled Throughout:N Q.1 ‐ Use units as a way to understand problems and to guide the solution of multi step problems; choose and interpret units consistently in formulas; choose and interpret the scale‐ and the origin in graphs and data displays.N Q.2‐ 4 Define appropriate quantities for the purpose of descriptive modeling.N Q.3 ‐ Choose a level of accuracy appropriate to limitations on measurement when reporting quantities.S ID.3 ‐ Interpret differences in shape, center, and spread in the context of the data sets, accounting for possible effects of extreme data points (outliers).★Days Common Core Standard Skills Vocabulary Resources/Tasks1 S ID.2 ‐ Use statistics appropriate to the
shape of the data distribution to compare center (median, mean) and spread (interquartile range, standard deviation) of two or more different data sets.★
Calculate mean, median, range, and interquartile range.
Compare two different sets of data using mean, median, and interquartile range
StatisticsCenterSpreadMeanMedianRangeInterquartile rangeStandard deviationDot plots (Line plots)FrequencyHistogramCumulative frequency histogramBox-and-whisker plotsPercentileFirst quartileThird quartileMinimumMaximumTwo-way frequency tableJoint relative frequencyMarginal relative frequency
2 S ID.2 ‐ Use statistics appropriate to the shape of the data distribution to compare center (median, mean) and spread (interquartile range, standard deviation) of two or more different data sets.★
Calculate standard deviation Compare two different sets of data
using mean, median, interquartile range and standard deviation
3 S ID.1 ‐ Represent data with plots on the real number line (dot plots, histograms, and box plots).★
Construct dot plots (line plots) and histograms
4 S ID.1 ‐ Represent data with plots on the real number line (dot plots, histograms, and box plots).★
Construct cumulative frequency histograms
5 S ID.1 ‐ Represent data with plots on the real number line (dot plots, histograms, and box plots).★
Construct box-and-whisker plots
6 S ID.5 ‐ Summarize categorical data for two categories in two way frequency tables. ‐Interpret relative frequencies in the context of the data (including joint, marginal, and conditional relative frequencies). Recognize possible associations and trends in the data.★
Create a two-way table from two categorical variables and read values from two way table. Interpret joint, marginal, and relative frequencies in context
Recognize associations and trends in
data from a two-way table Conditional relative frequency
7 QUIZ8 QUIZ REMEDIATION9 8.SP.2 Know that straight lines are widely
used to model relationships between two quantitative variables. For scatter plots that suggest a linear association, informally fit a straight line, and informally assess the model fit by judging the closeness of the data points to the line.
Calculate slope Construct a line of best fit manually
SlopeLine of best fitScatter plotCausationCorrelationCorrelation coefficientLinear regressionResidualsResidual plotQuadratic regressionExponential regression
10 S ID.8 ‐ Compute (using technology) and interpret the correlation coefficient of a linear fit.★S ID.9 ‐ Distinguish between correlation and causation.★
Define correlation coefficient Identify positive, negative, zero
correlation Identify best correlation coefficient Given verbal scenarios, state which
have positive, negative, or no correlations
Explain the difference between correlation and causation
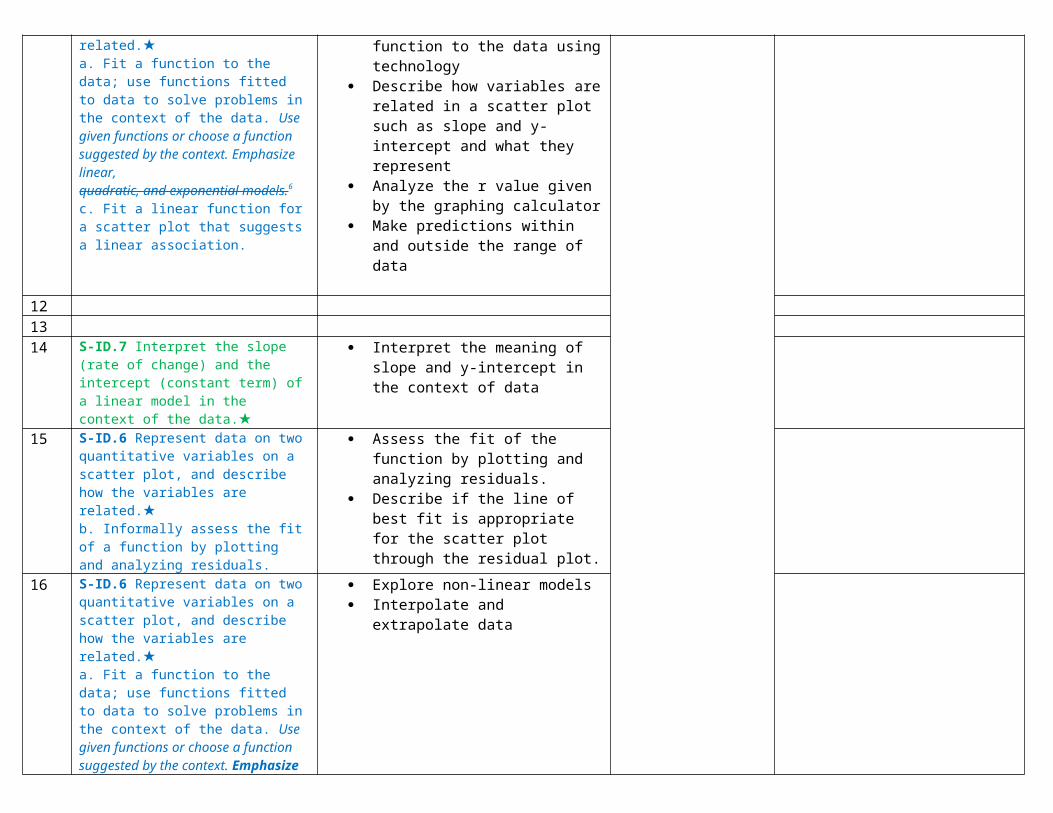
11 S ID.6 ‐ Represent data on two quantitative variables on a scatter plot, and describe how the variables are related.★a. Fit a function to the data; use functions fitted to data to solve problems in the context of the data. Use given functions or choose a function suggested by the context. Emphasize linear,quadratic, and exponential models.6
c. Fit a linear function for a scatter plot that suggests a linear association.
Determine the line of best fit when given a scatter plot using technology
Apply/fit the appropriate function to the data using technology
Describe how variables are related in a scatter plot such as slope and y-intercept and what they represent
Analyze the r value given by the graphing calculator
Make predictions within and outside the range of data
121314 S ID.7 ‐ Interpret the slope (rate of change)
and the intercept (constant term) of a linear model in the context of the data.★
Interpret the meaning of slope and y-intercept in the context of data
15 S ID.6‐ Represent data on two quantitative variables on a scatter plot, and describe how the variables are related.★b. Informally assess the fit of a function by plotting and analyzing residuals.
Assess the fit of the function by plotting and analyzing residuals.
Describe if the line of best fit is appropriate for the scatter plot through the residual plot.

16 S ID.6 ‐ Represent data on two quantitative variables on a scatter plot, and describe how the variables are related.★a. Fit a function to the data; use functions fitted to data to solve problems in the context of the data. Use given functions or choose a function suggested by the context. Emphasize linear,quadratic, and exponential models.6
Explore non-linear models Interpolate and extrapolate data
171819 CHAPTER 3 PERFORMANCE TASK20 CHAPTER 3 PERFORMANCE TASK
Module 3: Linear and Exponential Relationships (40 days)
CHAPTER 4 – Systems of EquationsStandards to be Spiraled Throughout:N Q.1 ‐ Use units as a way to understand problems and to guide the solution of multi step problems; choose and interpret units consistently in formulas; choose and interpret the scale‐ and the origin in graphs and data displays.N Q.2‐ 4 Define appropriate quantities for the purpose of descriptive modeling.N Q.3 ‐ Choose a level of accuracy appropriate to limitations on measurement when reporting quantities.A REI.10 ‐ Understand that the graph of an equation in two variables is the set of all its solutions plotted in the coordinate plane, often forming a curve (which could be a line).F LE.5‐ 16 Interpret the parameters in a linear or exponential function in terms of a context.★Days Common Core Standard Skills Vocabulary Resources/Tasks1 A REI.6‐ 7 Solve systems of linear equations
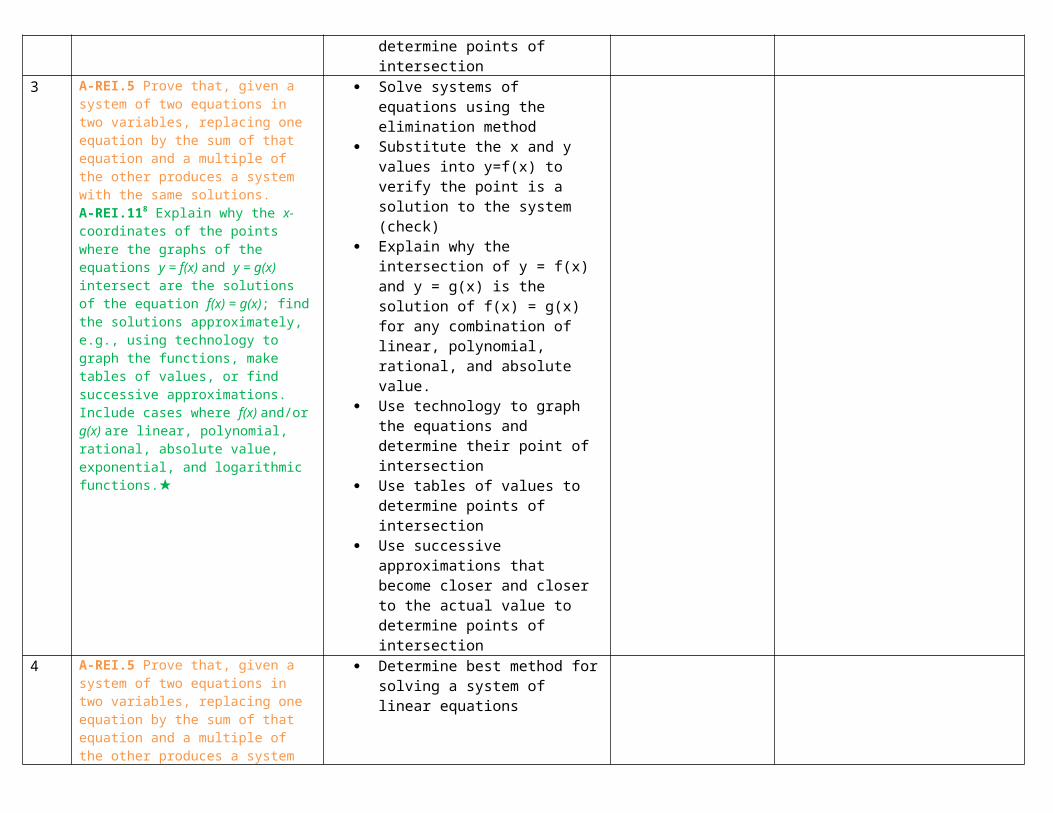
exactly and approximately (e.g., with graphs), focusing on pairs of linear equations in two variables.A REI.11‐ 8 Explain why the x‐coordinates of the points where the graphs of the equations y = f(x) and y = g(x) intersect are the solutions of the equation f(x) = g(x); find the solutions approximately, e.g., using technology to graph the functions, make tables of values, or find successive approximations. Include cases where f(x) and/or g(x) are linear, polynomial, rational, absolute value, exponential, and logarithmic functions.★
Solve systems of linear equations using graphs
Substitute the x and y values into y=f(x) to verify the point is a solution to the system (check)
Explain why the intersection of y = f(x) and y = g(x) is the solution of f(x) = g(x) for any combination of linear, polynomial, rational, and absolute value.
Use technology to graph the equations and determine their point of intersection
Use tables of values to determine points of intersection
Use successive approximations that become closer and closer to the

actual value to determine points of intersection
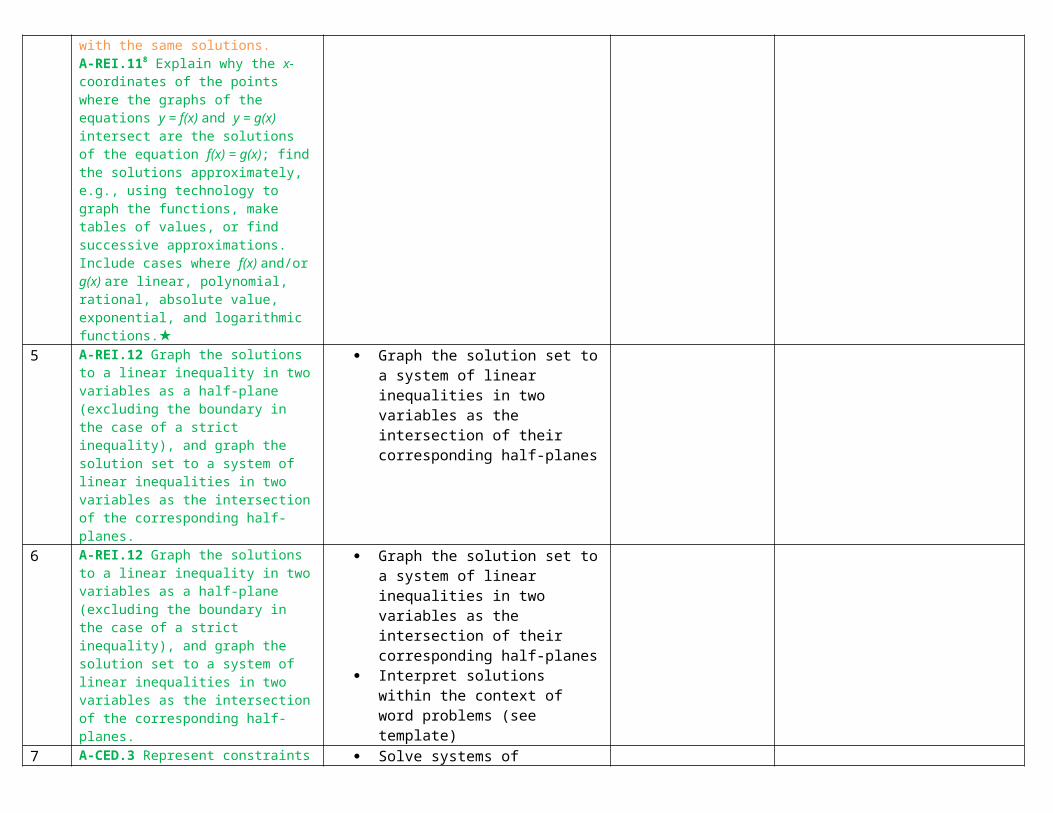
2 A REI.5 ‐ Prove that, given a system of two equations in two variables, replacing one equation by the sum of that equation and a multiple of the other produces a system with the same solutions.A REI.11‐ 8 Explain why the x‐coordinates of the points where the graphs of the equations y = f(x) and y = g(x) intersect are the solutions of the equation f(x) = g(x); find the solutions approximately, e.g., using technology to graph the functions, make tables of values, or find successive approximations. Include cases where f(x) and/or g(x) are linear, polynomial, rational, absolute value, exponential, and logarithmic functions.★
Solve a system of equations by substitution
Substitute the x and y values into y=f(x) to verify the point is a solution to the system (check)
Explain why the intersection of y = f(x) and y = g(x) is the solution of f(x) = g(x) for any combination of linear, polynomial, rational, and absolute value.
Use technology to graph the equations and determine their point of intersection
Use tables of values to determine points of intersection
Use successive approximations that become closer and closer to the actual value to determine points of intersection
3 A REI.5 ‐ Prove that, given a system of two equations in two variables, replacing one equation by the sum of that equation and a multiple of the other produces a system with the same solutions.A REI.11‐ 8 Explain why the x‐coordinates of the points where the graphs of the equations y = f(x) and y = g(x) intersect are the solutions of the equation f(x) = g(x); find the solutions approximately, e.g., using technology to graph the functions, make tables of values, or find successive approximations. Include cases where f(x) and/or g(x) are linear, polynomial, rational, absolute value, exponential, and logarithmic functions.★
Solve systems of equations using the elimination method
Substitute the x and y values into y=f(x) to verify the point is a solution to the system (check)
Explain why the intersection of y = f(x) and y = g(x) is the solution of f(x) = g(x) for any combination of linear, polynomial, rational, and absolute value.
Use technology to graph the equations and determine their point of intersection
Use tables of values to determine points of intersection
Use successive approximations that become closer and closer to the actual value to determine points of intersection
4 A REI.5 ‐ Prove that, given a system of two Determine best method for solving a
equations in two variables, replacing one equation by the sum of that equation and a multiple of the other produces a system with the same solutions.A REI.11‐ 8 Explain why the x‐coordinates of the points where the graphs of the equations y = f(x) and y = g(x) intersect are the solutions of the equation f(x) = g(x); find the solutions approximately, e.g., using technology to graph the functions, make tables of values, or find successive approximations. Include cases where f(x) and/or g(x) are linear, polynomial, rational, absolute value, exponential, and logarithmic functions.★
system of linear equations
5 A REI.12 ‐ Graph the solutions to a linear inequality in two variables as a half plane ‐(excluding the boundary in the case of a strict inequality), and graph the solution set to a system of linear inequalities in two variables as the intersection of the corresponding half planes.‐
Graph the solution set to a system of linear inequalities in two variables as the intersection of their corresponding half-planes
6 A REI.12 ‐ Graph the solutions to a linear inequality in two variables as a half plane ‐(excluding the boundary in the case of a strict inequality), and graph the solution set to a system of linear inequalities in two variables as the intersection of the corresponding half planes.‐
Graph the solution set to a system of linear inequalities in two variables as the intersection of their corresponding half-planes
Interpret solutions within the context of word problems (see template)
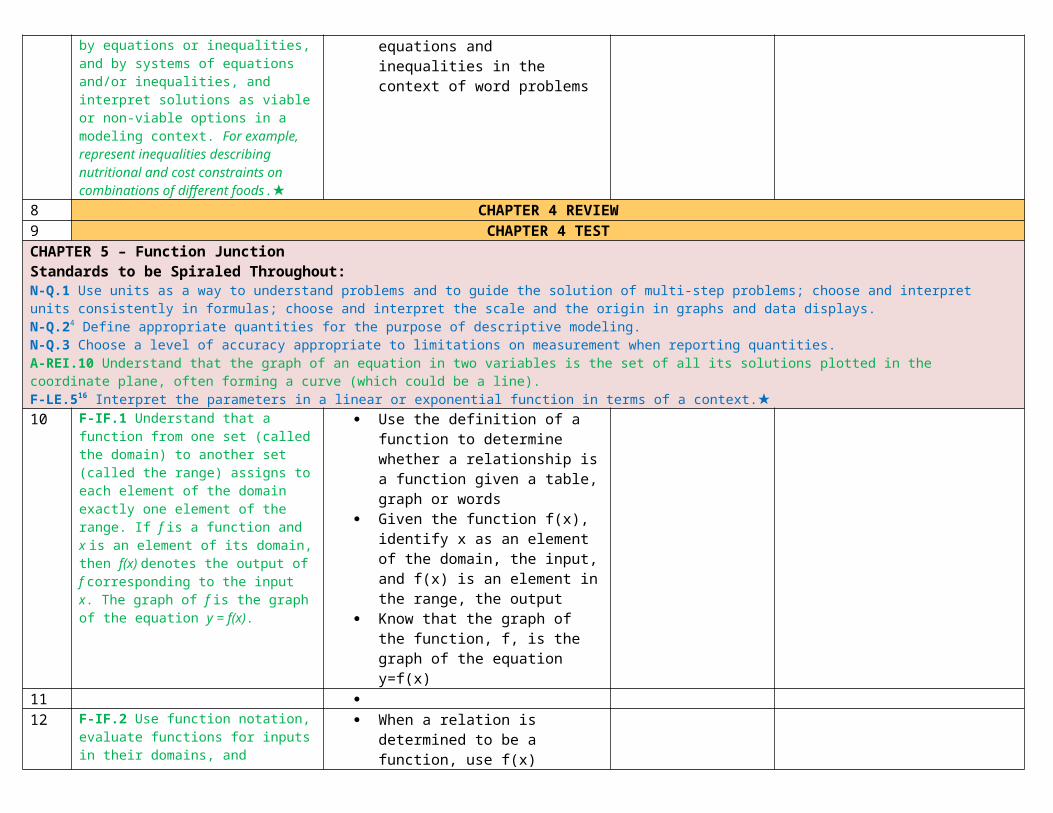
7 A CED.3 ‐ Represent constraints by equations or inequalities, and by systems of equations and/or inequalities, and interpret solutions as viable or non viable options in ‐a modeling context. For example, represent inequalities describing nutritional and cost constraints on combinations of different foods.★
Solve systems of equations and inequalities in the context of word problems
8 CHAPTER 4 REVIEW9 CHAPTER 4 TESTCHAPTER 5 – Function JunctionStandards to be Spiraled Throughout:N Q.1 ‐ Use units as a way to understand problems and to guide the solution of multi step problems; choose and interpret units consistently in formulas; choose and interpret the scale‐ and the origin in graphs and data displays.N Q.2‐ 4 Define appropriate quantities for the purpose of descriptive modeling.N Q.3 ‐ Choose a level of accuracy appropriate to limitations on measurement when reporting quantities.

A REI.10 ‐ Understand that the graph of an equation in two variables is the set of all its solutions plotted in the coordinate plane, often forming a curve (which could be a line).F LE.5‐ 16 Interpret the parameters in a linear or exponential function in terms of a context.★10 F IF.1 ‐ Understand that a function from one
set (called the domain) to another set (called the range) assigns to each element of the domain exactly one element of the range. If f is a function and x is an element of its domain, then f(x) denotes the output of f corresponding to the input x. The graph of f is the graph of the equation y = f(x).
Use the definition of a function to determine whether a relationship is a function given a table, graph or words
Given the function f(x), identify x as an element of the domain, the input, and f(x) is an element in the range, the output
Know that the graph of the function, f, is the graph of the equation y=f(x)
11 12 F IF.2 ‐ Use function notation, evaluate
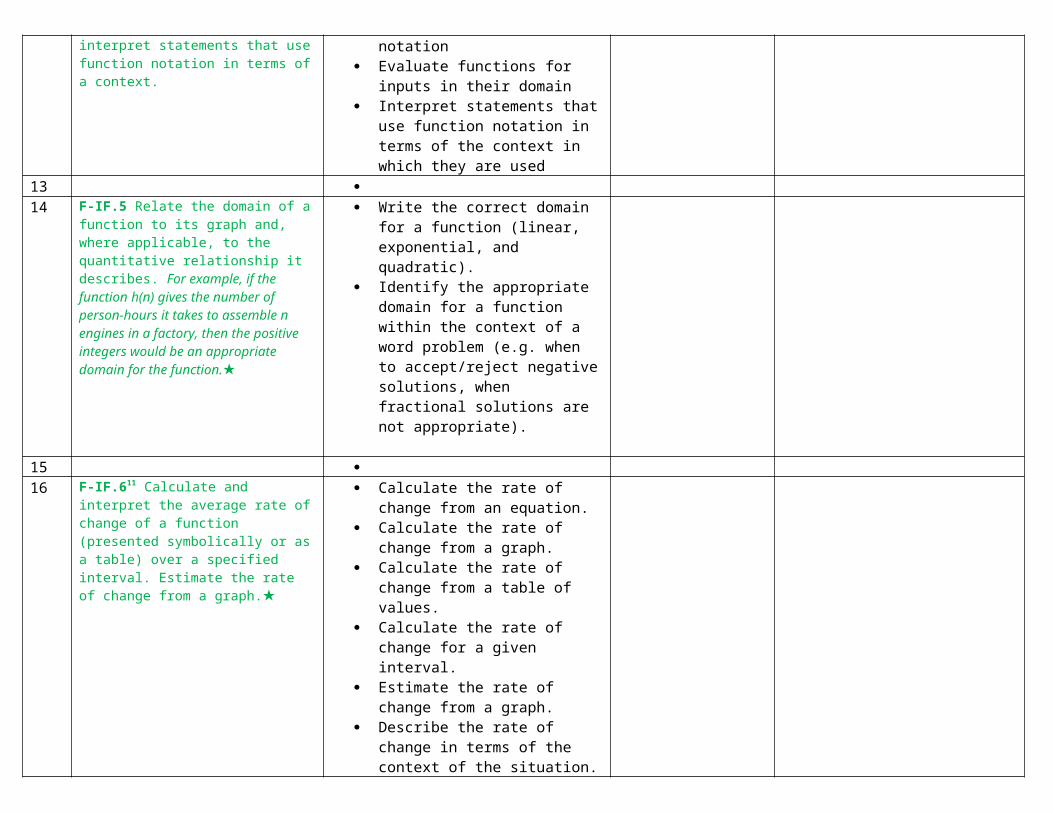
functions for inputs in their domains, and interpret statements that use function notation in terms of a context.
When a relation is determined to be a function, use f(x) notation
Evaluate functions for inputs in their domain
Interpret statements that use function notation in terms of the context in which they are used
13 14 F IF.5 ‐ Relate the domain of a function to its
graph and, where applicable, to the quantitative relationship it describes. For example, if the function h(n) gives the number of person hours it takes to ‐assemble n engines in a factory, then the positive integers would be an appropriate domain for the function.★
Write the correct domain for a function (linear, exponential, and quadratic).
Identify the appropriate domain for a function within the context of a word problem (e.g. when to accept/reject negative solutions, when fractional solutions are not appropriate).
15 16 F IF.6‐ 11 Calculate and interpret the average
rate of change of a function (presented symbolically or as a table) over a specified interval. Estimate the rate of change from a graph.★
Calculate the rate of change from an equation.
Calculate the rate of change from a graph.
Calculate the rate of change from a table of values.
Calculate the rate of change for a given interval.
Estimate the rate of change from a graph.

Describe the rate of change in terms of the context of the situation.
17 F IF.7 ‐ Graph functions expressed
symbolically and show key features of the graph, by hand in simple cases and using technology for more complicated cases.★a. Graph linear and quadratic functions and show intercepts, maxima, and minima.
Graph a linear function and identify the intercepts, domain, range, and rate of change
Compare the rate of change of two linear functions
Graph an exponential function and identify the intercepts, domain and range
1819 F BF.3‐ 14 Identify the effect on the graph of
replacing f(x) by f(x) + k, k f(x), f(kx), and f(x + k) for specific values of k (both positive and negative); find the value of k given the graphs. Experiment with cases and illustrate an explanation of the effects on the graph using technology. Include recognizing even and odd functions from their graphs and algebraic expressions for them.
Identify the parent function of a linear or exponential function.
Identify the shift of the graph of a linear or exponential function.
Graph the shift of a function as a translation of the parent function.
Create the equation for the graph after its translation.
Explain the effects of the shifts of graphs using my calculator.
Compare the parent function to the function that has been shifted.
Identify the translation of a function from the graph and write the function algebraically.
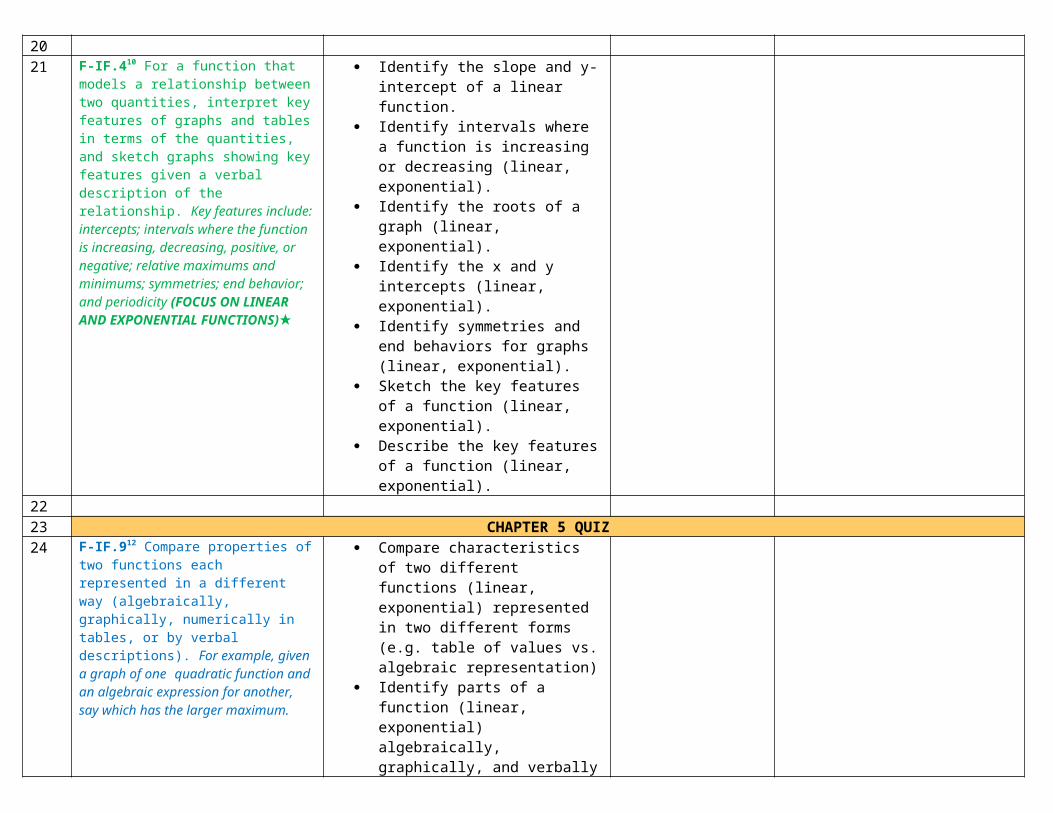
2021 F IF.4‐ 10 For a function that models a
relationship between two quantities, interpret key features of graphs and tables in terms of the quantities, and sketch graphs showing key features given a verbal description of the relationship. Key features include: intercepts; intervals where the function is increasing, decreasing, positive, or negative; relative maximums and minimums; symmetries; end behavior; and periodicity (FOCUS ON LINEAR AND EXPONENTIAL FUNCTIONS)★
Identify the slope and y-intercept of a linear function.
Identify intervals where a function is increasing or decreasing (linear, exponential).
Identify the roots of a graph (linear, exponential).
Identify the x and y intercepts (linear, exponential).
Identify symmetries and end behaviors for graphs (linear,
exponential). Sketch the key features of a function
(linear, exponential). Describe the key features of a
function (linear, exponential).2223 CHAPTER 5 QUIZ24 F IF.9‐ 12 Compare properties of two
functions each represented in a different way (algebraically, graphically, numerically in tables, or by verbal descriptions). For example, given a graph of one quadratic function and an algebraic expression for another, say which has the larger maximum.
Compare characteristics of two different functions (linear, exponential) represented in two different forms (e.g. table of values vs. algebraic representation)
Identify parts of a function (linear, exponential) algebraically, graphically, and verbally
25 F LE.1 ‐ Distinguish between situations that can be modeled with linear functions and with exponentialfunctions.★a. Prove that linear functions grow by equal differences over equal intervals, and that exponential functions grow by equal factors over equal intervals.b. Recognize situations in which one quantity changes at a constant rate per unit interval relative to another.c. Recognize situations in which a quantity grows or decays by a constant percent rate per unit interval relative to another.
Describe the difference between linear and exponential functions
Explain the slope of a linear function as compared to the growth of equal differences over equal intervals
Explain the growth/decay of an exponential function as compared to growth by equal factors over equal intervals
Identify when situations can be described by linear functions or by exponential functions
26 F LE.3 ‐ Observe using graphs and tables that a quantity increasing exponentially eventually exceeds a quantity increasing linearly, quadratically, or (more generally) as a polynomial function.★
Compare and contrast linear growth to exponential from a graph
Compare and contrast linear growth to exponential growth from a table
Explain why exponential models continue to grow/decay more rapidly than linear
27 CHAPTER 5 REVIEW28 CHAPTER 5 TESTCHAPTER 6 – SequencesStandards to be Spiraled Throughout:N Q.1 ‐ Use units as a way to understand problems and to guide the solution of multi step problems; choose and interpret units consistently in formulas; choose and interpret the scale‐ and the origin in graphs and data displays.
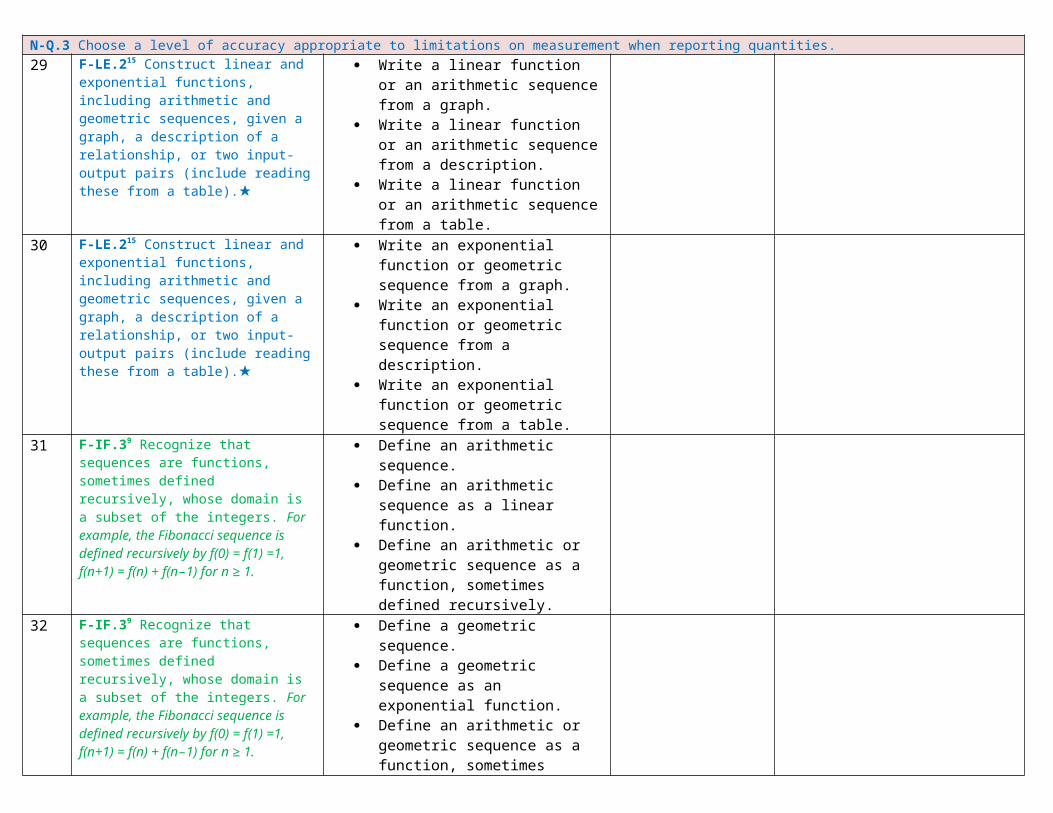
N Q.2‐ 4 Define appropriate quantities for the purpose of descriptive modeling.N Q.3 ‐ Choose a level of accuracy appropriate to limitations on measurement when reporting quantities.29 F LE.2‐ 15 Construct linear and exponential
functions, including arithmetic and geometric sequences, given a graph, a description of a relationship, or two input‐output pairs (include reading these from a table).★
Write a linear function or an arithmetic sequence from a graph.
Write a linear function or an arithmetic sequence from a description.
Write a linear function or an arithmetic sequence from a table.
30 F LE.2‐ 15 Construct linear and exponential functions, including arithmetic and geometric sequences, given a graph, a description of a relationship, or two input‐output pairs (include reading these from a table).★
Write an exponential function or geometric sequence from a graph.
Write an exponential function or geometric sequence from a description.
Write an exponential function or geometric sequence from a table.
31 F IF.3‐ 9 Recognize that sequences are functions, sometimes defined recursively, whose domain is a subset of the integers. For example, the Fibonacci sequence is defined recursively by f(0) = f(1) =1, f(n+1) = f(n) + f(n–1) for n ≥ 1.
Define an arithmetic sequence. Define an arithmetic sequence as a
linear function. Define an arithmetic or geometric
sequence as a function, sometimes defined recursively.
32 F IF.3‐ 9 Recognize that sequences are functions, sometimes defined recursively, whose domain is a subset of the integers. For example, the Fibonacci sequence is defined recursively by f(0) = f(1) =1, f(n+1) = f(n) + f(n–1) for n ≥ 1.
Define a geometric sequence. Define a geometric sequence as an
exponential function. Define an arithmetic or geometric
sequence as a function, sometimes defined recursively.
33 F BF.1‐ 13 Write a function that describes a relationship between two quantities.★a. Determine an explicit expression, a recursive process, or steps for calculation from a context.
Explain the steps to set up a linear or exponential function.
Construct an exponential function explicitly from a word problem.
Construct a linear function explicitly from a word problem.
Construct a linear function recursively from a word problem.
343536 CHAPTER 6 REVIEW37 CHAPTER 6 TEST38
3940
Module 4: Expressions and Equations (30 days)**Might extend into Module 5**
CHAPTER 7 - PolynomialsStandards to be Spiraled Throughout:N Q.1 ‐ Use units as a way to understand problems and to guide the solution of multi step problems; choose and interpret units consistently in formulas; choose and interpret the scale‐ and the origin in graphs and data displays.N Q.2‐ 4 Define appropriate quantities for the purpose of descriptive modeling.N Q.3 ‐ Choose a level of accuracy appropriate to limitations on measurement when reporting quantities.A SSE.1 ‐ Interpret expressions that represent a quantity in terms of its context.★
a. Interpret parts of an expression, such as terms, factors, and coefficients.b. Interpret complicated expressions by viewing one or more of their parts as a single entity. For example, interpret P(1+r)n as the product of P and a factor not depending on P.
Topics to be Spiraled: Factoring GCF Rules for exponents Solving literal equations with squared variables
Days Common Core Standard Skills Vocabulary Resources/Tasks1 A SSE.1 ‐ Interpret expressions that
represent a quantity in terms of its context.★a. Interpret parts of an expression, such as terms, factors, and coefficients.A APR.1 ‐ Understand that polynomials form a system analogous to the integers, namely, they are closed under the operations of addition, subtraction, and multiplication; add, subtract, and multiply polynomials.
Identify the parts of an expression by defining appropriate vocabulary such as: terms, factors, coefficients, constant, monomial, binomial, trinomial, polynomial, exponent, degree, variables, standard form, index, etc.
Explain how different parts of an expression effect the expression.
Define the closure property2 A APR.1 ‐ Understand that polynomials form
a system analogous to the integers, namely, they are closed under the operations of addition, subtraction, and multiplication; add, subtract, and multiply polynomials.
Add polynomials. Define the system of polynomials as
closed under addition. Explain that polynomials can be
operated on in the same way as integers.
3 A APR.1 ‐ Understand that polynomials form a system analogous to the integers, namely, they are closed under the operations of addition, subtraction, and multiplication; add, subtract, and multiply polynomials.
Subtract polynomials. Define the system of polynomials as
closed under subtraction. Explain that polynomials can be
operated on in the same way as integers.
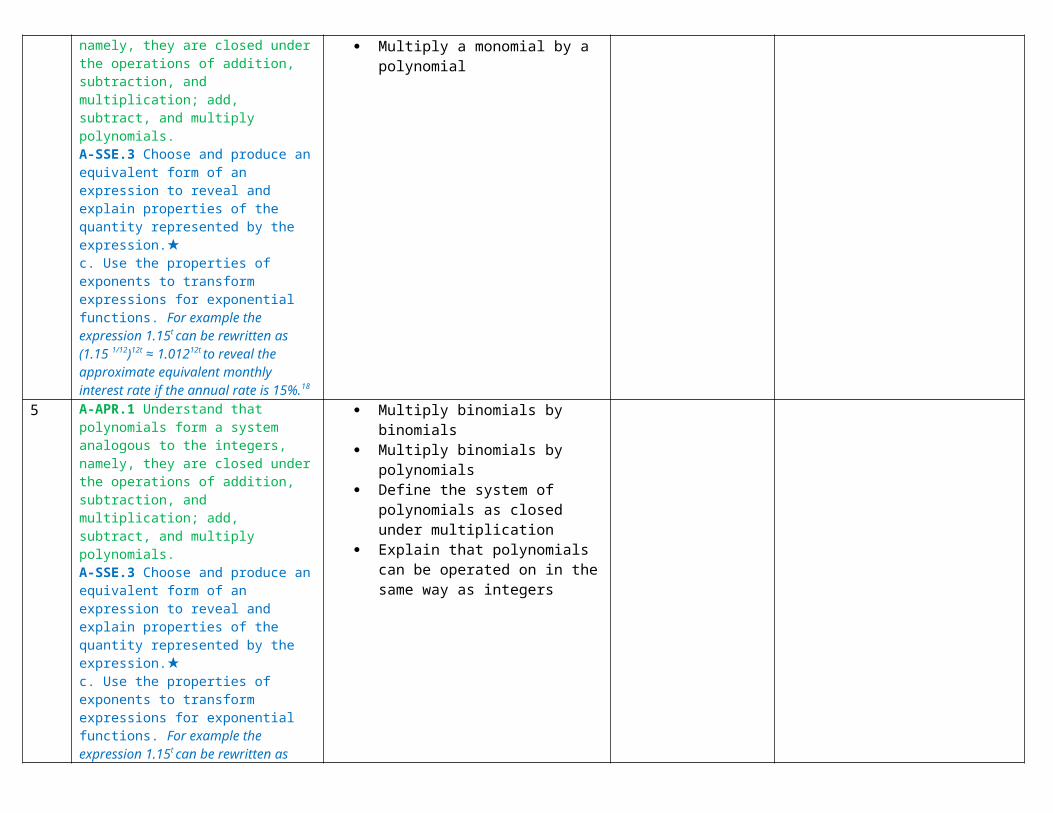
4 A APR.1 ‐ Understand that polynomials form a system analogous to the integers, namely, they are closed under the operations of addition, subtraction, and multiplication; add, subtract, and multiply polynomials.A SSE.3 ‐ Choose and produce an equivalent form of an expression to reveal and explain properties of the quantity represented by the expression.★c. Use the properties of exponents to transform expressions for exponential functions. For example the expression 1.15t
can be rewritten as (1.15 1/12)12t ≈ 1.01212t to reveal theapproximate equivalent monthly interest rate if the annual rate is 15%.18
Multiply a monomial by a monomial Raise a power to a power Multiply a monomial by a polynomial
5 A APR.1 ‐ Understand that polynomials form a system analogous to the integers, namely, they are closed under the operations of addition, subtraction, and multiplication; add, subtract, and multiply polynomials.A SSE.3 ‐ Choose and produce an equivalent form of an expression to reveal and explain properties of the quantity represented by the expression.★c. Use the properties of exponents to transform expressions for exponential functions. For example the expression 1.15t
can be rewritten as (1.15 1/12)12t ≈ 1.01212t to reveal theapproximate equivalent monthly interest rate if the annual rate is 15%.18
Multiply binomials by binomials Multiply binomials by polynomials Define the system of polynomials as
closed under multiplication Explain that polynomials can be
operated on in the same way as integers
6 A APR.1 ‐ Understand that polynomials form a system analogous to the integers, namely, they are closed under the operations of addition, subtraction, and multiplication; add, subtract, and multiply polynomials.
Explain that polynomials can be operated on in the same way as integers
Explain why the operation of division is not defined as closed.
7 A SSE.3 ‐ Choose and produce an equivalent form of an expression to reveal and explain properties of the quantity represented by the expression.★c. Use the properties of exponents to
???

transform expressions for exponential functions. For example the expression 1.15t
can be rewritten as (1.15 1/12)12t ≈ 1.01212t to reveal theapproximate equivalent monthly interest rate if the annual rate is 15%.18
8 CHAPTER 7 QUIZ9 A SSE.3 ‐ Choose and produce an equivalent
form of an expression to reveal and explain properties of the quantity represented by the expression.★A SSE.2‐ 17 Use the structure of an expression to identify ways to rewrite it. For example, see x4 – y4 as (x2)2 – (y2)2, thus recognizing it as a difference of squares that can be factored as (x2 – y2)(x2 + y2).
Factor quadratic expressions (Greatest Common Factor).
Rewrite an expression using laws of exponents.
Factor an expression by grouping (GCF).
10 A SSE.3 ‐ Choose and produce an equivalent form of an expression to reveal and explain properties of the quantity represented by the expression.★
Factor quadratic expressions (reverse double distribution a=1).
11 A SSE.3 ‐ Choose and produce an equivalent form of an expression to reveal and explain properties of the quantity represented by the expression.★
Factor quadratic expressions (Difference of two perfect squares).
12 A SSE.3 ‐ Choose and produce an equivalent form of an expression to reveal and explain properties of the quantity represented by the expression.★
Factor quadratic expressions (reverse double distribution a≠1).
13 A SSE.3 ‐ Choose and produce an equivalent form of an expression to reveal and explain properties of the quantity represented by the expression.★
Factor a polynomial completely
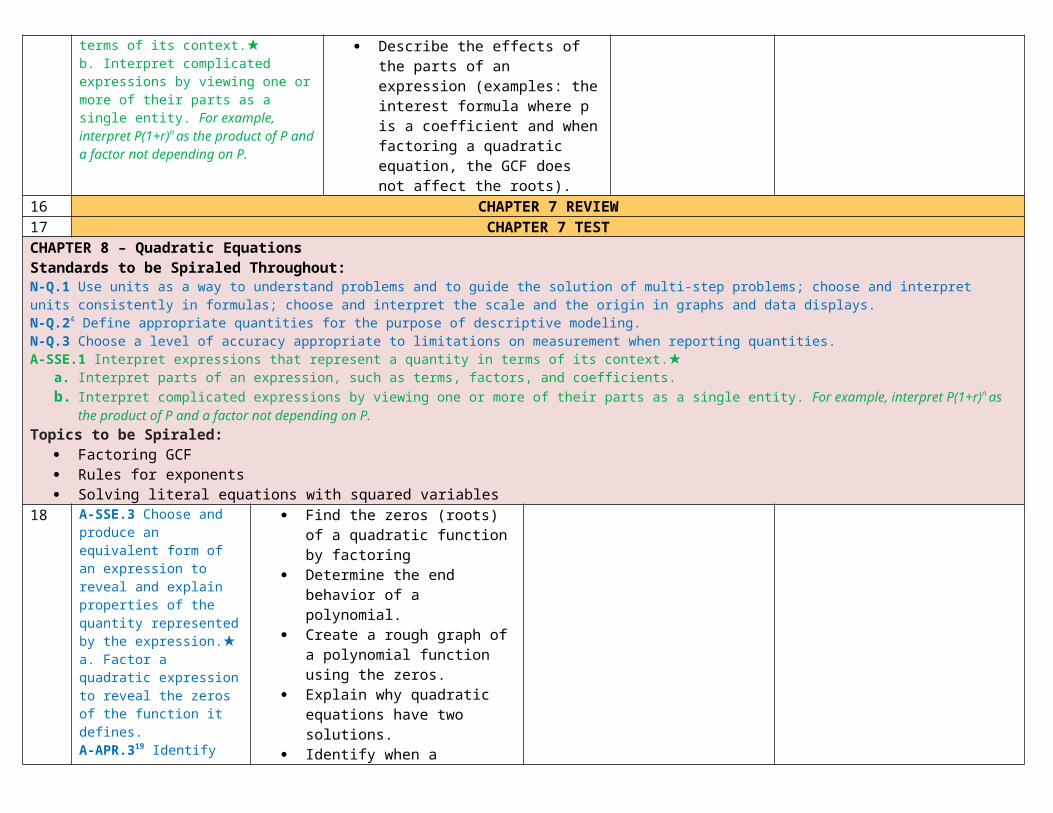
14 A SSE.1 ‐ Interpret expressions that represent a quantity in terms of its context.★b. Interpret complicated expressions by viewing one or more of their parts as a single entity. For example, interpret P(1+r)n
as the product of P and a factor not depending on P.
Identify the factors of an expression. Describe the effects of the parts of an
expression (examples: the interest formula where p is a coefficient and when factoring a quadratic equation, the GCF does not affect the roots).
15 A SSE.1 ‐ Interpret expressions that Identify the factors of an expression.
represent a quantity in terms of its context.★b. Interpret complicated expressions by viewing one or more of their parts as a single entity. For example, interpret P(1+r)n
as the product of P and a factor not depending on P.
Describe the effects of the parts of an expression (examples: the interest formula where p is a coefficient and when factoring a quadratic equation, the GCF does not affect the roots).
16 CHAPTER 7 REVIEW17 CHAPTER 7 TESTCHAPTER 8 – Quadratic EquationsStandards to be Spiraled Throughout:N Q.1 ‐ Use units as a way to understand problems and to guide the solution of multi step problems; choose and interpret units consistently in formulas; choose and interpret the scale‐ and the origin in graphs and data displays.N Q.2‐ 4 Define appropriate quantities for the purpose of descriptive modeling.N Q.3 ‐ Choose a level of accuracy appropriate to limitations on measurement when reporting quantities.A SSE.1 ‐ Interpret expressions that represent a quantity in terms of its context.★
a. Interpret parts of an expression, such as terms, factors, and coefficients.b. Interpret complicated expressions by viewing one or more of their parts as a single entity. For example, interpret P(1+r)n as the product of P and a factor not depending on P.
Topics to be Spiraled: Factoring GCF Rules for exponents Solving literal equations with squared variables
18 A SSE.3 ‐ Choose and produce an equivalent form of an expression to reveal and explain properties of the quantity represented by the expression.★a. Factor a quadratic expression to reveal the zeros of the function it defines.A APR.3‐ 19 Identify zeros of polynomials when suitable factorizations are available, and use the zeros to construct a rough graph of the function defined by the polynomial.
Find the zeros (roots) of a quadratic function by factoring
Determine the end behavior of a polynomial.
Create a rough graph of a polynomial function using the zeros.
Explain why quadratic equations have two solutions.
Identify when a quadratic equation gives non-real/complex solution(s). **Solving and writing complex solutions is not required in Algebra I.
19 A CED.4 ‐ Rearrange formulas to highlight a quantity of interest, using the same reasoning as in solving equations. For example, rearrange Ohm’s law V = IR to highlight resistance R.★
Rewrite equations with squared variables in terms of a different variable.
Solve quadratic equations by inspection (e.g. square rooting both sides)

A REI.4 ‐ Solve quadratic equations in one variable.b. Solve quadratic equations by inspection (e.g., for x2 = 49), taking square roots, completing the square, the quadratic formula and factoring, as appropriate to the initial form of the equation. Recognize when the quadratic formula gives complex solutions and write them as a ± bi for real numbers a and b.21
Solve quadratic equations by "completing the square" method.
Explain why quadratic equations have two solutions.
Identify when a quadratic equation gives non-real/complex solution(s). **Solving and writing complex solutions is not required in Algebra I.
20 A REI.4 ‐ Solve quadratic equations in one variable.b. Solve quadratic equations by inspection (e.g., for x2 = 49), taking square roots, completing the square, the quadratic formula and factoring, as appropriate to the initial form of the equation. Recognize when the quadratic formula gives complex solutions and write them as a ± bi for real numbers a and b.21
Solve quadratic equations by "completing the square" method.
Explain why quadratic equations have two solutions.
Identify when a quadratic equation gives non-real/complex solution(s). **Solving and writing complex solutions is not required in Algebra I.
21 A REI.4 ‐ Solve quadratic equations in one variable.b. Solve quadratic equations by inspection (e.g., for x2 = 49), taking square roots, completing the square, the quadratic formula and factoring, as appropriate to the initial form of the equation. Recognize when the quadratic formula gives complex solutions and write them as a ± bi for real numbers a and b.21
Solve quadratic equations by applying the quadratic formula.
Explain why quadratic equations have two solutions.
Identify when a quadratic equation gives non-real/complex solution(s). **Solving and writing complex solutions is not required in Algebra I.
22 A REI.4 ‐ Solve quadratic equations in one variable.b. Solve quadratic equations
Solve quadratic equations by applying the quadratic formula.
Explain why quadratic equations
by inspection (e.g., for x2 = 49), taking square roots, completing the square, the quadratic formula and factoring, as appropriate to the initial form of the equation. Recognize when the quadratic formula gives complex solutions and write them as a ± bi for real numbers a and b.21
have two solutions. Identify when a quadratic equation
gives non-real/complex solution(s). **Solving and writing complex solutions is not required in Algebra I.
23 A REI.4 ‐ Solve quadratic equations in one variable.a. Use the method of completing the square to transform any quadratic equation in x into an equation of the form (x – p) 2 = q that has the same solutions. Derive the quadratic formula from this form.
Rewrite a quadratic equation to the form (x - p)^2 = q by using "completing the square" method.
Derive the quadratic formula from "completing the square" method.
24 A SSE.3 ‐ Choose and produce an equivalent form of an expression to reveal and explain properties of the quantity represented by the expression.★b. Complete the square in a quadratic expression to reveal the maximum or minimum value of the function it defines.
Factor quadratic expressions by completing the square.
Explain what different forms of a quadratic expression reveal about the function.
Write a quadratic expression in vertex form to reveal the maximum or minimum value of the function.
25 A CED.1‐ 20 Create equations and inequalities in one variable and use them to solve problems. Includeequations arising from linear and quadratic functions, and simple rational and exponentialfunctions.★
Write a quadratic equation from a word problem.
Solve a quadratic equation written from a word problem and interpret its solution within the context.
26 27 A CED.2 ‐ Create equations in
two or more variables to represent relationships
Write quadratic equations using two or more variables.
Rewrite a quadratic equation in

between quantities; graph equations on coordinate axes with labels and scales.★
terms of one variable (y = form). Graph a quadratic equation from a
table of values with an appropriate scale and labels from a word problem.
2829 CHAPTER 8 REVIEW30 CHAPTER 8 TEST
Module 5: Quadratic Functions (30 days)
CHAPTER 9 – Graphing QuadraticsStandards to be Spiraled Throughout:N Q.1 ‐ Use units as a way to understand problems and to guide the solution of multi step problems; choose and interpret units consistently in formulas; choose and interpret the scale‐ and the origin in graphs and data displays.N Q.2‐ 4 Define appropriate quantities for the purpose of descriptive modeling.N Q.3 ‐ Choose a level of accuracy appropriate to limitations on measurement when reporting quantities.Topics to be Spiraled:
Days Common Core Standard Skills Vocabulary Resources/Tasks1 F IF.4‐ 22 For a function that
models a relationship between two quantities, interpret key features of graphs and tables in terms of the quantities, and sketch graphs showing key features given a verbal description of the relationship. Key features include: intercepts; intervals where the function is increasing, decreasing, positive, or negative; relative maximums and minimums; symmetries; end behavior; and periodicity.★F IF.7 ‐ Graph functions expressed symbolically and show key features of the graph, by hand in simplecases and using technology for more complicated cases.★
Identify minimums and maximums of a quadratic function
Identify intervals where a quadratic function is increasing or decreasing
Identify the roots of a quadratic function
Identify the x and y intercepts of a quadratic function.
Identify symmetries and end behaviors for quadratic functions
Identify the domain and range of a quadratic function
Sketch the key features of a quadratic function
Describe the key features of a quadratic function

a. Graph linear and quadratic functions and show intercepts, maxima, and minima.
23 F IF.8 ‐ Write a function
defined by an expression in different but equivalent forms to reveal and explain different properties of the function.a. Use the process of factoring and completing the square in a quadratic function to show zeros, extreme values, and symmetry of the graph, and interpret these in terms of a context.
Find the roots, minimum/maximum (turning point), symmetry (axis of symmetry) for a graph and explain what the purpose of these features are to the context of the problem.
Rewrite quadratic functions into different forms to explain different properties of the function.
Factor a quadratic equation. Complete the square to solve a
quadratic equation.
4 F IF.9‐ 24 Compare properties of two functions each represented in a different way (algebraically, graphically, numerically in tables, or by verbal descriptions). For example, given a graph of one quadratic function and an algebraic expression for another, say which has the larger maximum.
Compare characteristics of two different quadratic functions represented in two different forms (e.g. table of values vs. algebraic representation).
Identify parts of a quadratic function algebraically, graphically, and verbally (max/min of graphs, roots/solutions).
5 F IF.5 ‐ Relate the domain of a function to its graph and, where applicable, to the quantitative relationship it describes. For example, if the function h(n) gives the number of person hours it ‐takes to assemble n engines in a factory, then the positive integers would be an appropriate domain for the function.★
Write the correct domain for a quadratic function.
Identify the appropriate domain for a quadratic function within the context of a word problem (e.g. when to accept/reject negative solutions, when fractional solutions are not appropriate).
6 F IF.6‐ 23 Calculate and interpret the average rate of
Calculate the rate of change for a given interval.
change of a function (presented symbolically or as a table) over a specified interval. Estimate the rate of change from a graph.★
Estimate the rate of change from a graph.
Describe the rate of change in terms of the context of the situation.
7 F BF.1‐ 25 Write a function that describes a relationship between two quantities.★a. Determine an explicit expression, a recursive process, or steps for calculation from a context.
Explain the steps to set up a quadratic function.
Construct a quadratic function explicitly from a word problem.
Construct a quadratic function recursively from a word problem.
8 F BF.3‐ 26 Identify the effect on the graph of replacing f(x) by f(x) + k, k f(x), f(kx), and f(x + k) for specific values of k (both positive and negative); find the value of k given the graphs. Experiment with cases and illustrate an explanation of the effects on the graph using technology. Include recognizing even and odd functions from their graphs and algebraic expressions for them.
Identify the parent function of a quadratic function.
Identify the shift of the graph of a quadratic function.
Graph the shift of a function as a translation of the parent function.
Create the equation for the graph after its translation.
Identify the vertex point of a function (if applicable).
Explain the effects of the shifts of graphs using my calculator.
Compare the parent function to the function that has been shifted.
Identify the translation of a function from the graph and write the function algebraically.
910 F LE.3 ‐ Observe using graphs
and tables that a quantity increasing exponentially eventually exceeds a quantity increasing linearly, quadratically, or (more generally) as a polynomial function.★
Compare and contrast linear growth to exponential growth to quadratic growth from a graph.
Compare and contrast linear growth to exponential growth to quadratic growth from a table.
Explain why exponential models

continue to grow/decay more rapidly than linear or quadratic models.
1112 CHAPTER 9 REVIEW13 CHAPTER 9 TESTCHAPTER 10 – Funky FunctionsStandards to be Spiraled Throughout:N Q.1 ‐ Use units as a way to understand problems and to guide the solution of multi step problems; choose and interpret units consistently in formulas; choose and interpret the scale‐ and the origin in graphs and data displays.N Q.2‐ 4 Define appropriate quantities for the purpose of descriptive modeling.N Q.3 ‐ Choose a level of accuracy appropriate to limitations on measurement when reporting quantities.N RN.3 ‐ Explain why the sum or product of two rational numbers is rational; that the sum of a rational number and an irrational number is irrational; and that the product of a nonzero rational number and an irrational number is irrational.Topics to be Spiraled:
14 F IF.4‐ 22 For a function that
models a relationship between two quantities, interpret key features of graphs and tables in terms of the quantities, and sketch graphs showing key features given a verbal description of the relationship. Key features include: intercepts; intervals where the function is increasing, decreasing, positive, or negative; relative maximums and minimums; symmetries; end behavior; and periodicity.★F IF.7 ‐ Graph functions expressed symbolically and show key features of the graph, by hand in simple cases and using technology for more complicated cases.★
Graph square root functions using technology
Graph cube root functions using technology
Graph absolute value functions using technology
Graph step functions Graph piecewise-defined functions Identify the domain, range,
intercepts, maximums, minimums, end-behavior, intervals in which the function is increasing/decreasing, and symmetries where applicable for each of the functions listed above
1516 F IF.9‐ 24 Compare properties of
two functions each represented in a different way (algebraically, graphically,
Compare characteristics of two different functions represented in two different forms (e.g. table of

numerically in tables, or by verbal descriptions). For example, given a graph of one quadratic function and an algebraic expression for another, say which has the larger maximum.
values vs. algebraic representation).
Identify parts of a function algebraically, graphically, and verbally (max/min of graphs, roots/solutions).
1718 F IF.5 ‐ Relate the domain of a
function to its graph and, where applicable, to the quantitative relationship it describes. For example, if the function h(n) gives the number of person hours it ‐takes to assemble n engines in a factory, then the positive integers would be an appropriate domain for the function.★
Write the correct domain for a function.
Identify the appropriate domain for a function within the context of a word problem (e.g. when to accept/reject negative solutions, when fractional solutions are not appropriate).
19 F IF.6‐ 23 Calculate and interpret the average rate of change of a function (presented symbolically or as a table) over a specified interval. Estimate the rate of change from a graph.★
Calculate the rate of change for a given interval.
Estimate the rate of change from a graph.
Describe the rate of change in terms of the context of the situation.
20 21 F BF.3‐ 26 Identify the effect on
the graph of replacing f(x) by f(x) + k, k f(x), f(kx), and f(x + k) for specific values of k (both positive and negative); find the value of k given the graphs. Experiment with cases and illustrate an explanation of the effects on the graph using technology. Include recognizing even and odd functions from their graphs and algebraic expressions for them.
Identify the parent function of a function.
Identify the shift of the graph of a function.
Graph the shift of a function as a translation of the parent function.
Create the equation for the graph after its translation.
Identify the vertex point of a function (if applicable).
Explain the effects of the shifts of graphs using my calculator.
Compare the parent function to
the function that has been shifted. Identify the translation of a
function from the graph and write the function algebraically.
22 CHAPTER 10 REVIEW23 CHAPTER 10 TEST24252627282930