missgrayscience.weebly.commissgrayscience.weebly.com/uploads/4/9/6/4/4964830/... · Web viewIR,...
19
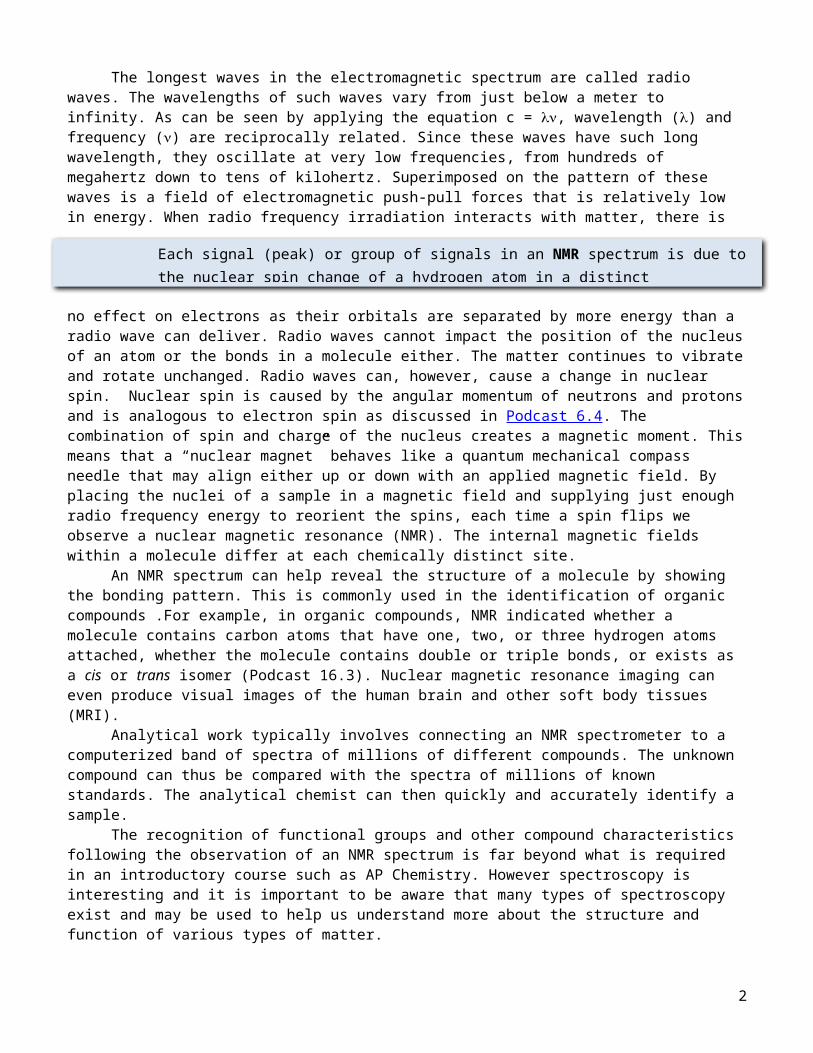
Spectroscopy for AP Chemistry Various regions of the electromagnetic spectrum may be used to help us probe matter with the assistance of a variety of different instruments in a process called spectroscopy. We will examine the following types of spectroscopy: Nuclear Magnetic Resonance Infrared Spectroscopy Ultraviolet And Visible Light Spectroscopy X-Rays: Photoelectron Spectroscopy REGION SPECTROSCOPIC TECHNIQUE EXAMPLE APPLICATION TV/Radio (R f ) Nuclear magnetic resonance (NMR) Measures energy changes in nuclear spin to study molecular structure. Microwav e Rotational Spectroscopy Bonding and intermolecular forces Infrared IR, FTIR, Raman spectroscopy Bond vibrations – molecular structure and intermolecular forces Visible/ UV UV-Vis spectroscopy, Atomic Emission Spectroscopy Electron transitions X-ray Photoelectron spectroscopy (PES) Electronic structure in an atom Nuclear Magnetic Resonance 1
Transcript of missgrayscience.weebly.commissgrayscience.weebly.com/uploads/4/9/6/4/4964830/... · Web viewIR,...
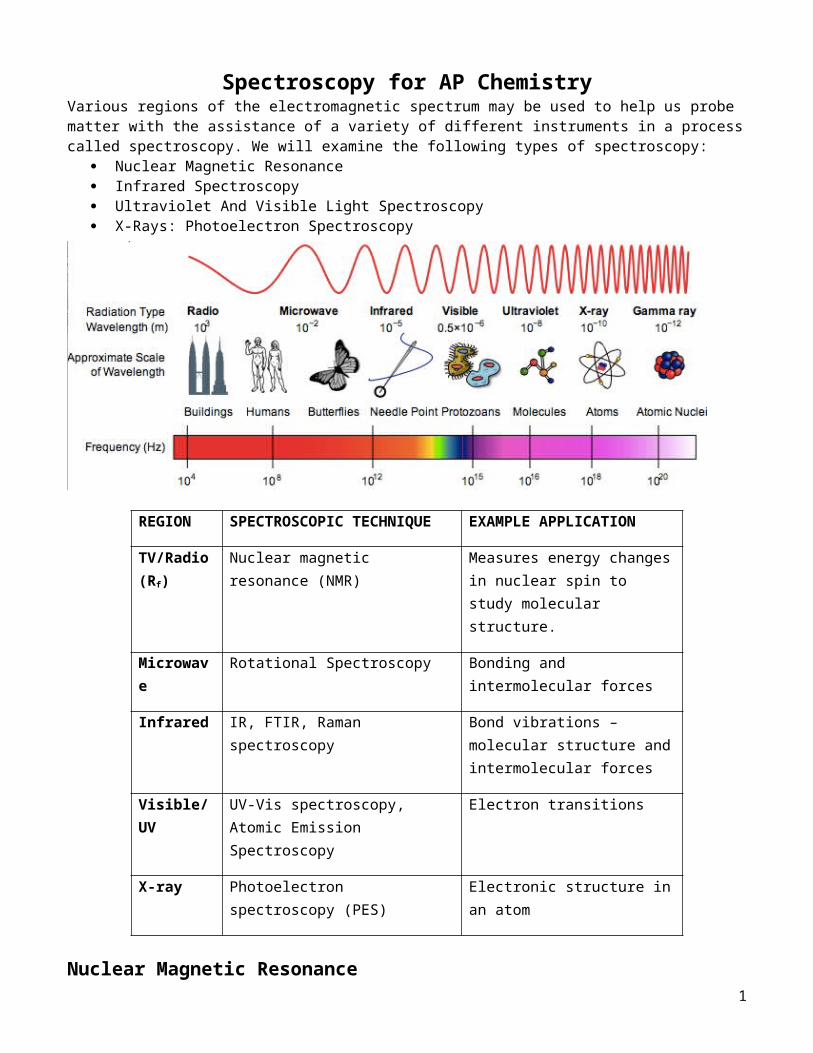
Spectroscopy for AP Chemistry Various regions of the electromagnetic spectrum may be used to help us probe matter with the assistance of a variety of different instruments in a process called spectroscopy. We will examine the following types of spectroscopy:
Nuclear Magnetic Resonance Infrared Spectroscopy Ultraviolet And Visible Light Spectroscopy X-Rays: Photoelectron Spectroscopy
REGION SPECTROSCOPIC TECHNIQUE
EXAMPLE APPLICATION
TV/Radio (Rf)
Nuclear magnetic resonance (NMR)
Measures energy changes in nuclear spin to study molecular structure.
Microwave
Rotational Spectroscopy Bonding and intermolecular forces
Infrared IR, FTIR, Raman spectroscopy
Bond vibrations – molecular structure and intermolecular forces
Visible/UV
UV-Vis spectroscopy, Atomic Emission Spectroscopy
Electron transitions
X-ray Photoelectron spectroscopy (PES)
Electronic structure in an atom
Nuclear Magnetic Resonance The longest waves in the electromagnetic spectrum are called radio waves. The wavelengths of such waves vary from just below a meter to infinity. As can be seen by applying the equation c = , wavelength () and frequency () are reciprocally related. Since these waves have such long wavelength, they oscillate at very low frequencies, from hundreds of megahertz down to tens of kilohertz. Superimposed on the pattern of these waves is a field of electromagnetic push-pull forces that is relatively low in energy. When
1
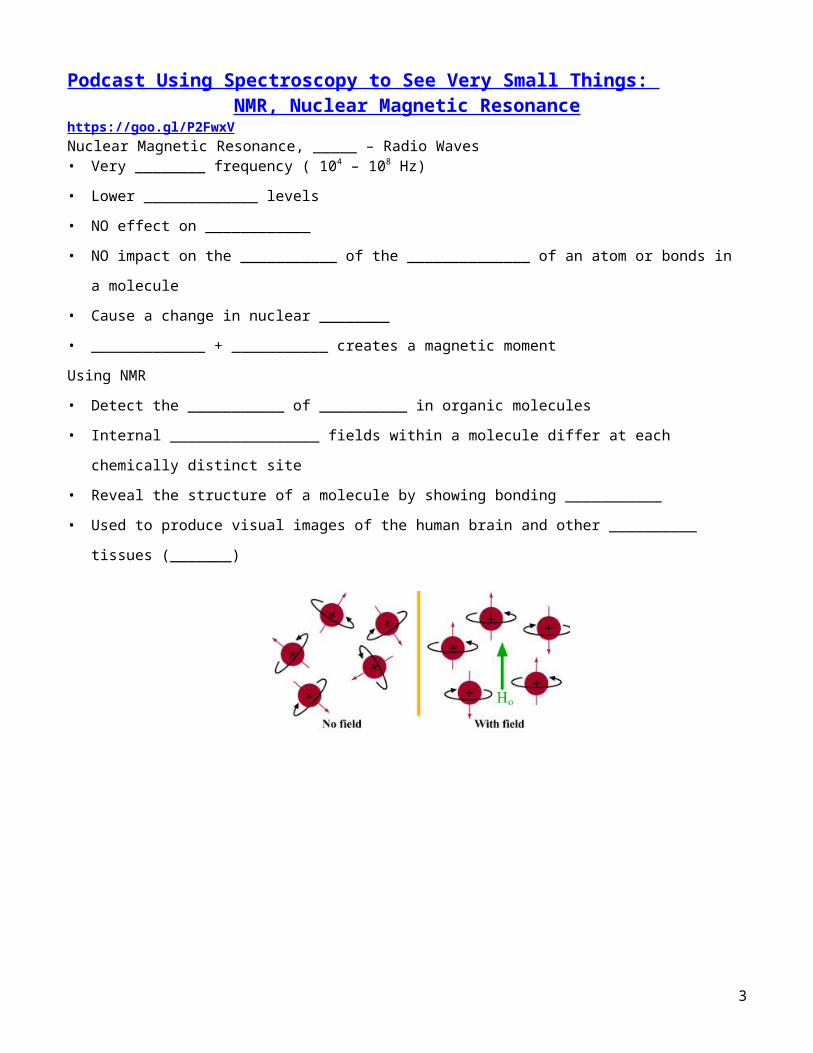
radio frequency irradiation interacts with matter, there is no effect on electrons as their orbitals are separated by more energy than a radio wave can deliver. Radio waves cannot impact the position of the nucleus of an atom or the bonds in a molecule either. The matter continues to vibrate and rotate unchanged. Radio waves can, however, cause a change in nuclear spin. Nuclear spin is caused by the angular momentum of neutrons and protons and is analogous to electron spin as discussed in Podcast 6.4. The combination of spin and charge of the nucleus creates a magnetic moment. This means that a “nuclear magnet” behaves like a quantum mechanical compass needle that may align either up or down with an applied magnetic field. By placing the nuclei of a sample in a magnetic field and supplying just enough radio frequency energy to reorient the spins, each time a spin flips we observe a nuclear magnetic resonance (NMR). The internal magnetic fields within a molecule differ at each chemically distinct site. An NMR spectrum can help reveal the structure of a molecule by showing the bonding pattern. This is commonly used in the identification of organic compounds .For example, in organic compounds, NMR indicated whether a molecule contains carbon atoms that have one, two, or three hydrogen atoms attached, whether the molecule contains double or triple bonds, or exists as a cis or trans isomer (Podcast 16.3). Nuclear magnetic resonance imaging can even produce visual images of the human brain and other soft body tissues (MRI). Analytical work typically involves connecting an NMR spectrometer to a computerized band of spectra of millions of different compounds. The unknown compound can thus be compared with the spectra of millions of known standards. The analytical chemist can then quickly and accurately identify a sample. The recognition of functional groups and other compound characteristics following the observation of an NMR spectrum is far beyond what is required in an introductory course such as AP Chemistry. However spectroscopy is interesting and it is important to be aware that many types of spectroscopy exist and may be used to help us understand more about the structure and function of various types of matter.
Podcast Using Spectroscopy to See Very Small Things: NMR, Nuclear Magnetic Resonance
https://goo.gl/P2FwxV Nuclear Magnetic Resonance, _____ – Radio Waves• Very ________ frequency ( 104 – 108 Hz) • Lower _____________ levels • NO effect on ____________• NO impact on the ___________ of the ______________ of an atom or bonds in a molecule• Cause a change in nuclear ________• _____________ + ___________ creates a magnetic moment Using NMR• Detect the ___________ of __________ in organic molecules• Internal _________________ fields within a molecule differ at each chemically distinct site• Reveal the structure of a molecule by showing bonding ___________• Used to produce visual images of the human brain and other __________ tissues (_______)
2
3
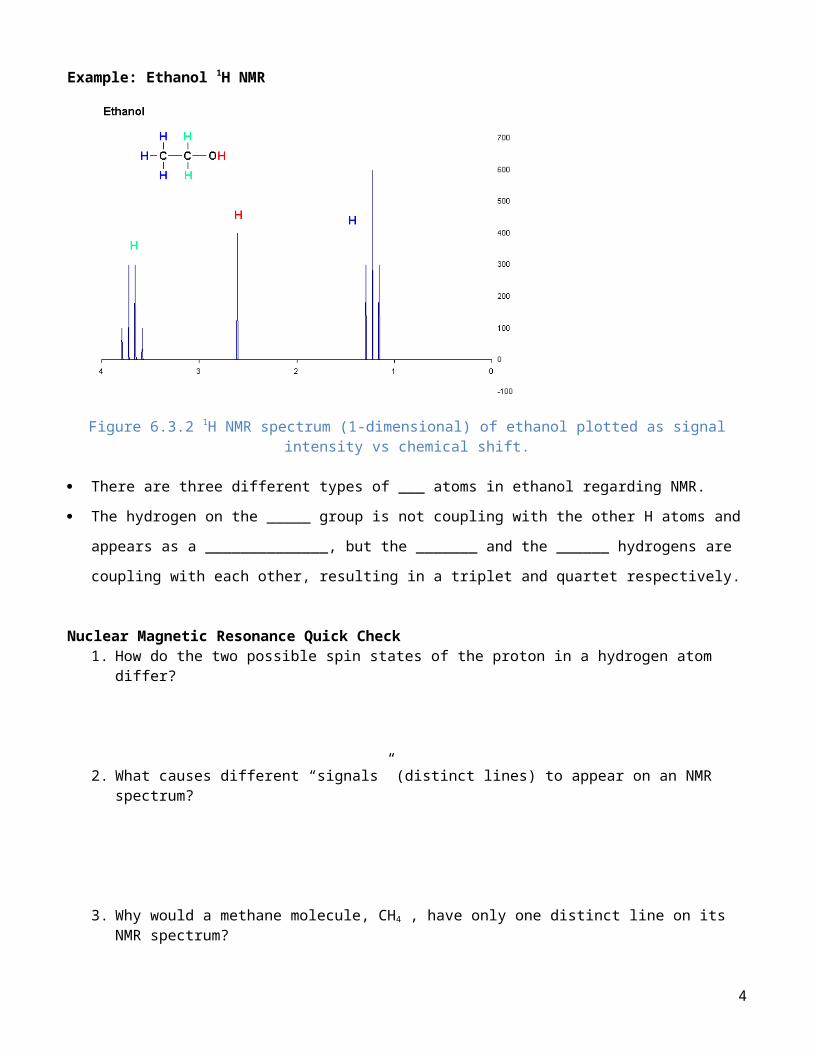
Example: Ethanol 1H NMR
Figure 6.3.2 1H NMR spectrum (1-dimensional) of ethanol plotted as signal intensity vs chemical shift.
There are three different types of ___ atoms in ethanol regarding NMR. The hydrogen on the _____ group is not coupling with the other H atoms and appears as
a ______________, but the _______ and the ______ hydrogens are coupling with each other, resulting in a triplet and quartet respectively.
Nuclear Magnetic Resonance Quick Check1. How do the two possible spin states of the proton in a hydrogen atom differ?
2. What causes different “signals” (distinct lines) to appear on an NMR spectrum?
3. Why would a methane molecule, CH4 , have only one distinct line on its NMR spectrum?
4
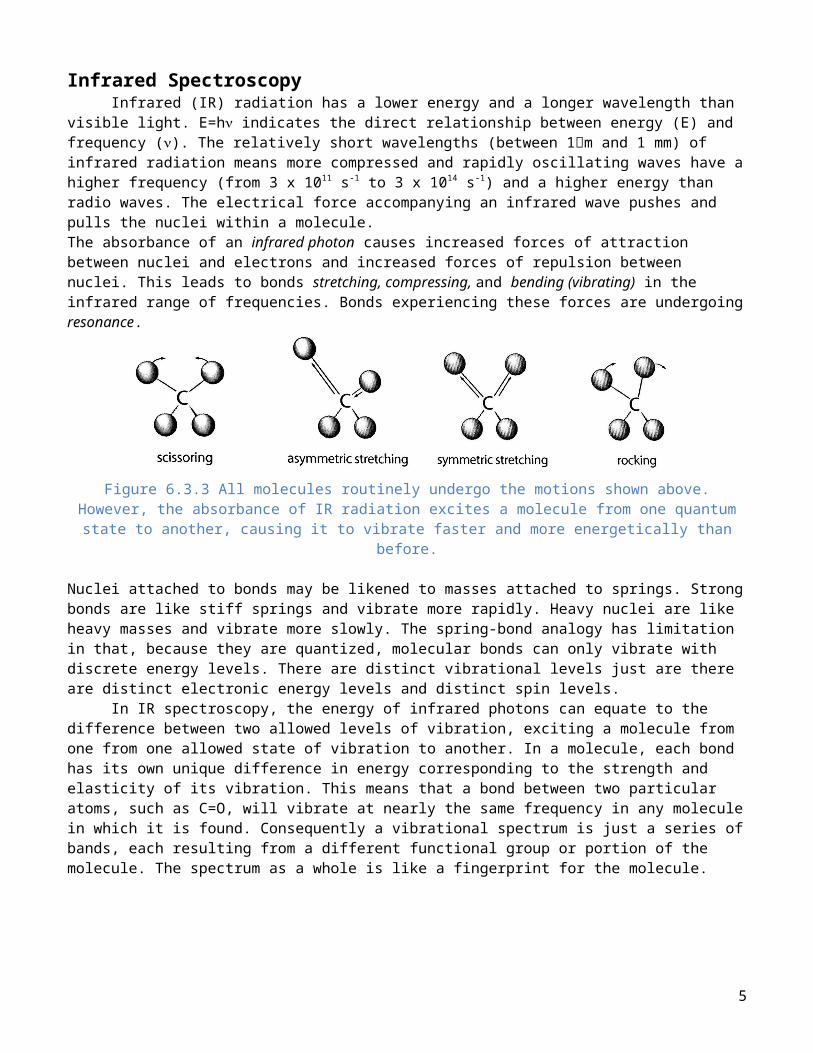
Infrared Spectroscopy Infrared (IR) radiation has a lower energy and a longer wavelength than visible light. E=h indicates the direct relationship between energy (E) and frequency (). The relatively short wavelengths (between 1m and 1 mm) of infrared radiation means more compressed and rapidly oscillating waves have a higher frequency (from 3 x 10¹¹ s-1 to 3 x 10¹⁴ s-1) and a higher energy than radio waves. The electrical force accompanying an infrared wave pushes and pulls the nuclei within a molecule. The absorbance of an infrared photon causes increased forces of attraction between nuclei and electrons and increased forces of repulsion between nuclei. This leads to bonds stretching, compressing, and bending (vibrating) in the infrared range of frequencies. Bonds experiencing these forces are undergoing resonance.
Figure 6.3.3 All molecules routinely undergo the motions shown above. However, the absorbance of IR radiation excites a molecule from one quantum state to another, causing
it to vibrate faster and more energetically than before.
Nuclei attached to bonds may be likened to masses attached to springs. Strong bonds are like stiff springs and vibrate more rapidly. Heavy nuclei are like heavy masses and vibrate more slowly. The spring-bond analogy has limitation in that, because they are quantized, molecular bonds can only vibrate with discrete energy levels. There are distinct vibrational levels just are there are distinct electronic energy levels and distinct spin levels. In IR spectroscopy, the energy of infrared photons can equate to the difference between two allowed levels of vibration, exciting a molecule from one from one allowed state of vibration to another. In a molecule, each bond has its own unique difference in energy corresponding to the strength and elasticity of its vibration. This means that a bond between two particular atoms, such as C=O, will vibrate at nearly the same frequency in any molecule in which it is found. Consequently a vibrational spectrum is just a series of bands, each resulting from a different functional group or portion of the molecule. The spectrum as a whole is like a fingerprint for the molecule.
Figure 6.3.4 Most IR spectra show the percentage of infrared radiation transmitted, rather than the percentage absorbed by different portions of the molecule. The “wavenumber” is
5

simply a measure of the number of cycles per unit distance (in this case cm). It is analogous to a measure of frequency and hence energy. As wavenumber decreases, so do
frequency and energy, while wavelength increases.
Even in different molecules, the frequency of vibration of a particular functional group or structural feature generally falls within a narrow range and hence can be used to verify the presence of that group.
IR Frequency
Bond and Functional Group
3500-3200 O – H stretch in phenols3400-3250 N – H stretch in amines,
amides3300-2500 O – H stretch in
carboxylic acids3330-3270 -C ≡ C – H (alkyne H)3100-3000 =C – H stretch (alkene H)3000-2850 -C – H stretch (alkane H)2830-2695 C – H stretch in
aldehydes2260-2100 C≡N stretch (nitrile)1760-1690 C = O stretch carbonyls
(general)1760-1690 C = O stretch in
carboxylic acids1750-1735 C = O stretch in esters1740-1720 C = O stretch in ketones1680-1640 -C = C – stretch in
alkenes
Most functional groups absorb infrared light with a frequency above 1500 cm-1. The region with frequencies below this primarily shows stretches between the parent chain atoms of the molecule and is of less use. Bizarrely this region is sometimes called the fingerprint region. It is largely ignored. As IR samples are dissolved in a solvent that will themselves absorb infrared radiation, a solvent spectrum is generally run for comparison.
Figure 6.3.5 A carbonyl group is extremely useful in elucidating the identity of an organic molecule. Though it generally absorbs in the region of 166- to 1760 cm-1, the exact position
6
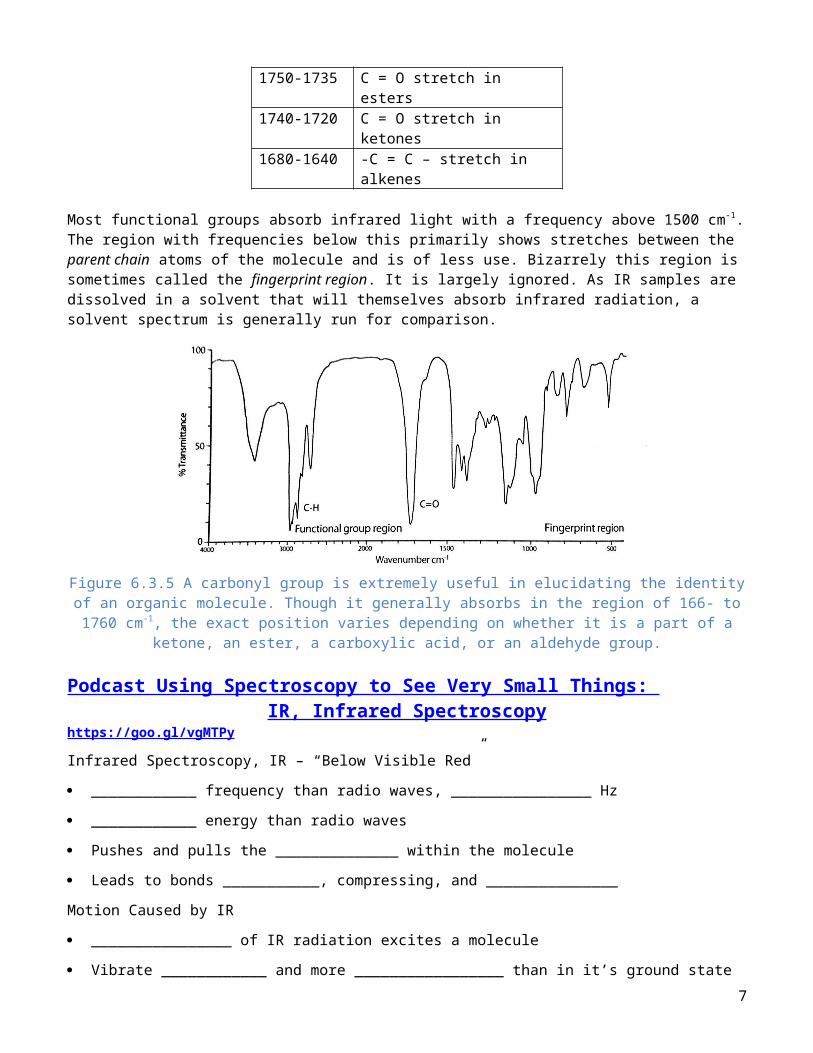
varies depending on whether it is a part of a ketone, an ester, a carboxylic acid, or an aldehyde group.
Podcast Using Spectroscopy to See Very Small Things: IR, Infrared Spectroscopy
https://goo.gl/vgMTPyInfrared Spectroscopy, IR – “Below Visible Red” ____________ frequency than radio waves, ________________ Hz ____________ energy than radio waves Pushes and pulls the ______________ within the molecule Leads to bonds ___________, compressing, and _______________Motion Caused by IR ________________ of IR radiation excites a molecule Vibrate ____________ and more _________________ than in it’s ground stateImagine that a bond is like a spring: Strong bonds are like stiff springs and vibrate more ________________. Heavy nuclei are like heavy ____________ and vibrate more ____________. Molecular bonds can only vibrate with _____________ energy
levelsHow It’s Used So a bond between two particular atoms, such as ____________, will vibrate
at nearly the same frequency in any molecule in which it is found. The IR spectrum is a series of bands from each different _______________ ________, or
portion of the molecule – a “functional group detector”
7
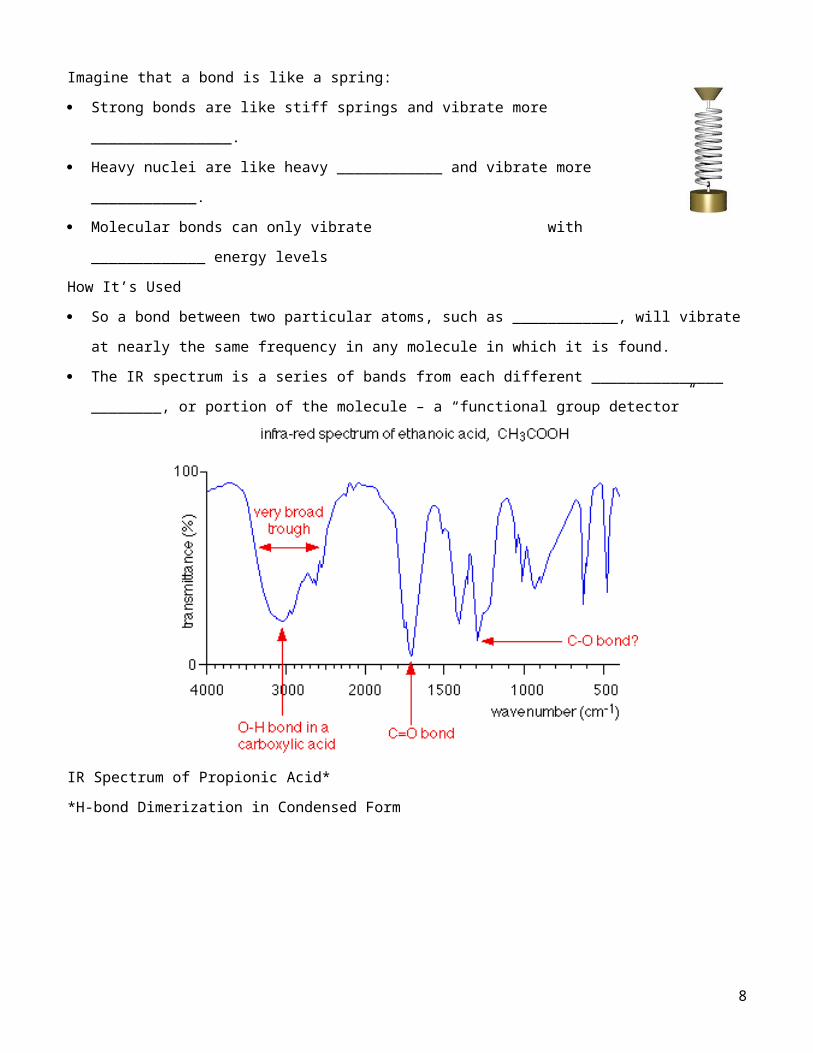
IR Spectrum of Propionic Acid**H-bond Dimerization in Condensed Form
Infrared Spectroscopy Quick Check1. What group might be indicated by the farthest left band in the IR spectrum in
Figure 6.3.5?
2. Rank the following N to N bonds in order of increasing vibrational frequency:N – N , N = N , N ≡ NWhich will absorb infrared photons with the longest wavelength?
Ultraviolet and Visible-Light Spectroscopy Visible and ultraviolet (UV) radiation are above infrared in terms of energy and below in terms of wavelength. Infrared radiation whose photon energies are below the red region of visible light gives way to visible red light at wavelengths between 800 and 700 nm. This is the region of the electromagnetic spectrum within which human beings perceive color. The visible light portion of the spectrum extends from above 700 to just below 400 nm. The sum of all these wavelengths makes up so-called white light. Wavelengths below 400 extending down to around 10 nm are associated with EMR (electromagnetic radiation) having energy above that of the violet portion of the visible range. For that reason, this portion of the spectrum is called ultraviolet. It is also the region within which photons may affect the most weakly held electrons, the so-called valence electrons. They may be excited out of their energy levels, and chemical bonding may be affected. The behavior of these valence electrons is to a large extent governed by Coulomb’s Law:
F=k Q1Q2r2
8

This relationship between the force (F) on two charged objects, the charges (Q1 and Q2), and the distance between them (r) was determined in 1785 by French physicist Charles-Augustin de Coulomb. The law is sometimes referred to as the inverse square law for obvious reasons, and it resembles Newton’s law of universal gravitation. The law shows that as the charge on one or both objects, such as a nucleus and an electron, increases, so does the force of attraction. It also shows that as the distance between an electron and the nucleus increases, the force of attraction decreases. This law can and should be used to explain most of the atomic and ionic trends in the periodic table. The valence electrons have the greatest r value and are shielded most effectively from the charge on the nucleus. The reduced charge experienced by the valence electrons is sometimes referred to as Zeff or the effective nuclear charge. Z represents the atomic number, which is the number of protons. The shielding electrons, or core electrons, are all those found in energy levels below
that of the valence shell. This equation indicates that the effective nuclear charge is essentially constant moving up or down a family in the periodic table. However, it will definitely increase moving from left to right across a period. The reduction in the nuclear charge felt by a valence electron is often referred to as the shielding effect. While any explanation of nuclear and ionic trends such as ionization energy and radius should be centered on Coulomb’s law, an explanation if Zeff and the shielding effect are definitely appropriate. UV/Vis spectroscopy involves the absorption of light by the valence electrons. Valence electrons occupy orbitals far from the nucleus and high in energy. Consideration of Coulomb’s law and the shielding effect tells us that these electrons are attracted by an attenuated and distant nuclear charge. Consequently they are the easiest electrons to disturb. They may be ionized and, under milder excitation, may be promoted to higher levels of energy (moved from their ground state to an excited state). Transition metal ions may experience movement of electrons between d orbitals of different energy levels. Such movement may be accompanied by the absorbance of release of visible light of specific wavelengths (d orbital splitting, or non-degenerate d orbitals, is a topic beyond the level of an AP Chemistry course; however you are encouraged to investigate this topic further.) As a consequence, compounds containing transition metal ions with partially filled d orbitals will exhibit color and hence are most suitable for study with visible spectroscopy. In organic molecules, valence electrons may be excited from a bonding orbital to an antibonding orbital. Such excitations are not associated with color, but rather with ultraviolet (UV) light. Finally in a lanthanide series or rare-earth containing compound, valance electrons may transition between non-degenerate f orbitals. Splitting of f orbitals leads to electron transitions associated with colored light much like those that occur in solutions containing transition metal ions. There is no sharp cut off between species affected by visible and invisible EMR, or colorless and colored. The important point is that energy in this region of the electromagnetic spectrum can promote valence electrons. Moving a valence electron from an occupied to an unoccupied orbital may impact a molecule’s size, shape, bond strength, polarity, paramagnetism, or color, at least until the electron returns to its ground state. UV/Vis spectroscopy is most commonly used in quantitative rather than qualitative analysis of solutions, although solids and gases may also be studied. The application of the Beer-Lambert law for quantitative analysis of solutions has been utilized in several of our labs already.
Zeff = Z – S Effective nuclear charge = number of protons – number of core electrons
9

Sometimes a valence electron may be completely removed, resulting in the creation of an ion. This process is called photoionization – ionization caused by a photon. Such an ionization caused by light is also called the photoelectric effect. Most molecules require UV radiation with wavelengths below 200 nm to produce such an effect.
Podcast Using Spectroscopy to See Very Small Things:UV-Vis, Ultraviolet and Visible Light Spectroscopy
https://goo.gl/BfYxqeUltraviolet and Visible Light, UV-Vis – Rainbow Colors and Beyond ___________ energetic than
infrared, ___________ frequency Visible light portion is a very
___________ range, _________________ nm in wavelength
UV wavelength ranges from ______________ nm
How It’s Used Affects the most weakly-held
electrons, or _______________ electrons
Causes electrons to ___________ from one energy level to another, thus may also affect chemical ____________
UV-Vis Spectroscopy Compounds containing
_______________ metals with ______________ filled d-orbitals are colorful and most suitable for _________________ spectroscopy
Many other excitations are not associated with color, but rather with _____ light.
UV/Vis spectroscopy is most commonly used in ______________________ analysis of solutions through the application of _________ _________
As the _________ of the solution fades either from reaction or from ___________, the absorbance decreases.
UV-Vis Quick CheckExamine the UV/Vis spectrum shown here. (a) and (b) represent two different samples of the same compound in aqueous solution.
10
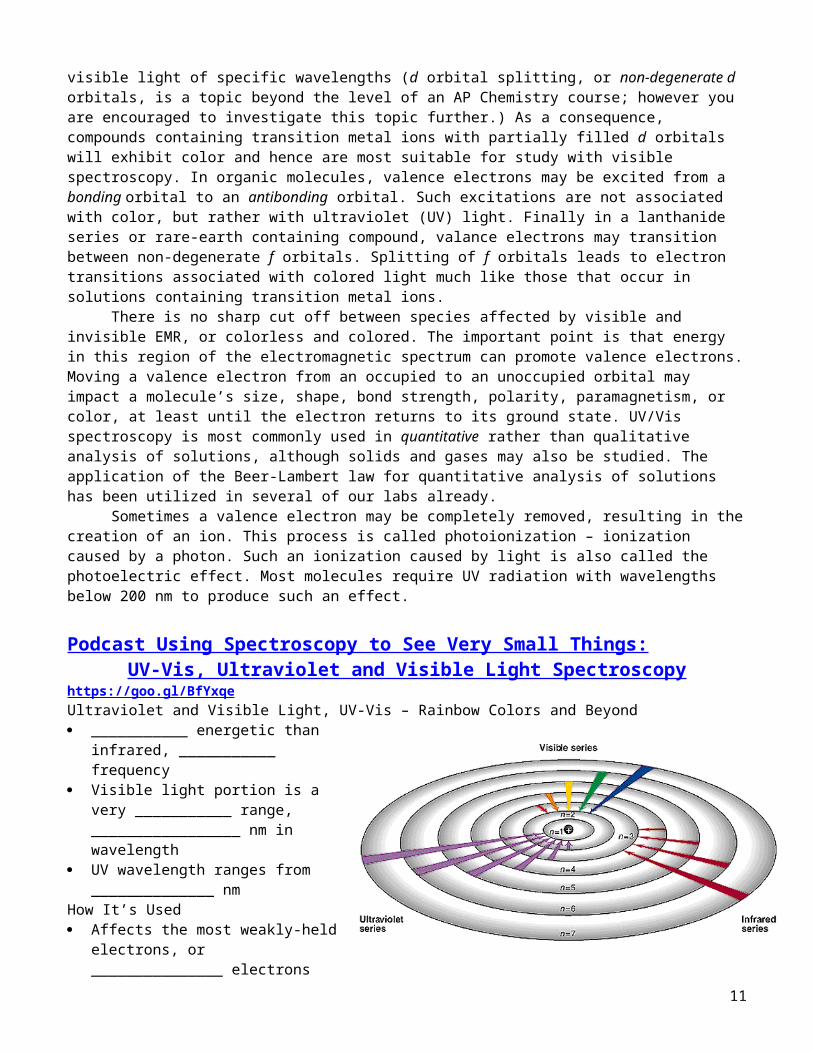
Figure 6.3.61. Which sample absorbed more light?
2. Which sample transmitted more light?
3. How does sample (a) differ from sample (b)?
4. At what wavelength is maximum absorbance occurring?
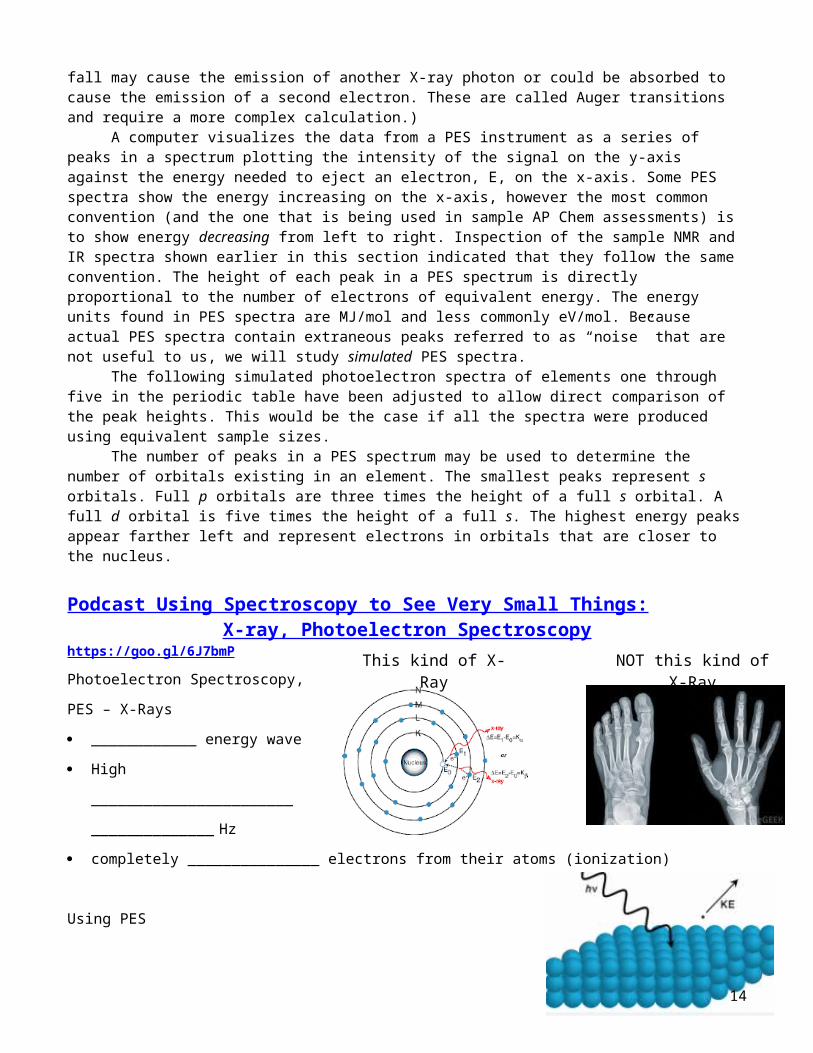
X-Rays: Photoelectron Spectroscopy Core electrons (those below the valence shell) are considerably more difficult to remove from their atom. Consideration of Zeff and Coulomb’s law indicates that core electrons are attracted to a poorly shielded, more positively charged nucleus, and because they exist in an orbital that is lower in energy, their average distance form the nucleus is considerably less than that of the valence electrons. Each of these factors tells us that core electrons are much more difficult to remove. The removal of core electrons requires the significant energy of an X-ray photon with wavelength below 10 nm all the way down to less than 0.01 nm. Photoelectron Spectroscopy (PES) was formerly known as X-ray electron spectroscopy or XES. It involves the use of a device that focuses a monochromatic beam of X-rays at a solid sample. Random atoms in the sample may then release electrons from any energy level in the atom. Emitted electrons are collected by a lens and passed through an electron energy analyzer to a detector. A computer then visualizes the electrons in the form of a photoelectron spectrum. The kinetic energy (KE) of the emitted electrons is measured by the electron energy analyzer. The energy of the X-Ray photon is simply calculated as h. This means the energy required to remove an electron from an inner energy level of an atom is simply the difference between these two values.
E = h – KE
11

This process is virtually identical to the one used to determine the first ionization energy of an atom except that very high energy UV or X-ray photons are required to emit core electrons. (It should be noted that occasionally the vacant orbital produced by an ejected electron may be filled by an electron falling from a higher energy orbital. The energy from such a fall may cause the emission of another X-ray photon or could be absorbed to cause the emission of a second electron. These are called Auger transitions and require a more complex calculation.) A computer visualizes the data from a PES instrument as a series of peaks in a spectrum plotting the intensity of the signal on the y-axis against the energy needed to eject an electron, E, on the x-axis. Some PES spectra show the energy increasing on the x-axis, however the most common convention (and the one that is being used in sample AP Chem assessments) is to show energy decreasing from left to right. Inspection of the sample NMR and IR spectra shown earlier in this section indicated that they follow the same convention. The height of each peak in a PES spectrum is directly proportional to the number of electrons of equivalent energy. The energy units found in PES spectra are MJ/mol and less commonly eV/mol. Because actual PES spectra contain extraneous peaks referred to as “noise” that are not useful to us, we will study simulated PES spectra. The following simulated photoelectron spectra of elements one through five in the periodic table have been adjusted to allow direct comparison of the peak heights. This would be the case if all the spectra were produced using equivalent sample sizes. The number of peaks in a PES spectrum may be used to determine the number of orbitals existing in an element. The smallest peaks represent s orbitals. Full p orbitals are three times the height of a full s orbital. A full d orbital is five times the height of a full s. The highest energy peaks appear farther left and represent electrons in orbitals that are closer to the nucleus.
Podcast Using Spectroscopy to See Very Small Things:X-ray, Photoelectron Spectroscopy
https://goo.gl/6J7bmPPhotoelectron Spectroscopy, PES – X-Rays ____________ energy wave High _______________________
______________ Hz completely _______________
electrons from their atoms (ionization)
Using PES Scientists identify specific ________________ comparing
the _____________ energy of electrons removed to the energy of the x-ray ____________ that bombard them
Reading a PES Graph
NOT this kind of X-RayThis kind of X-Ray
12
The number of _________ in a PES spectrum = number of ___________ existing in an elementThe smallest peaks represent ___ orbitals. Full p orbitals are ____ times the height of a full s orbital. A full d orbital is ____ times the height of a full s. The highest ____________ peaks represent electrons in orbitals that are ___________ to the nucleus. Example: Identify the orbitals and the element represented by the PES spectrum below.
Photoelectron Spectroscopy Quick Check1. On a separate paper, draw an orbital diagram (Aufbau Diagram) for elements 1
through 5 in the periodic table.2. Give three points of comparison between the orbital diagram (Aufbau Diagram)
and the PES spectrum for boron.
3. Compare and explain the position of the first peak for each of the elements 1 to 5.
4. Compare and explain the heights of the final peak (farthest right) for each of the elements 1 to 5.
5. What element does each PES spectrum below represent?
13
6. (a) Identify the element whose PES spectrum is shown. (b) Draw either the Bohr diagram or Aufbau (orbital) diagram for this element.
(c) Sketch the PES spectrum for the atom having 8 fewer protons than this atom. Label the axes clearly show the approximate energies.
(d) If photons of wavelength 1.25 x 10⁻⁸ m bombarded the original element, which , if any, of the electrons could be emitted? *HINT: calculate the energy of this wave!
14

Spectroscopy Review Questions1. Complete the following table:
Region of EM Spectrum Spectroscopic Technique Photons Used ToRadio Waves NMR (nuclear magnetic
resonance)Measure energy changes causing nuclear spin to study molecular structure.
Infrared
UV/Visible
X-Rays
2. The first ionization energies for selected elements from the second period of the periodic table are as follows:
Atom Li – 3 Be – 4 C – 6 N – 7 F – 9 Ne – 101st IE (kJ/mol)
520 899 1086 1302 1681 2081
Use Coulomb’s law to explain the trend in inoization energies in terms of the relative location of the electrons and the charge of the nucleus.
3. (a) Calculate the photon frequencies in 1/s for each of the following regions of the electromagnetic spectrum. (b) What range of the spectrum does each energy correspond to? (c) What type of spectroscopy might it be useful for?
Wavelength Range (a) Frequency (1/s) (b) Range (c) Spectroscopy
700 nm to 400 nm
400 nm to 10 nm
10 nm to 0.01 nm
4. Note the IE’s for the 1s electron of the following second row elements:Element Li Be B C N O FkJ/mol 4820 10600 18300 27000 38600 51100 66600
A substance is bombarded with X-rays having a wavelength of 1 nm. A photoelectron is ejected from the substance. Its energy is 69500 kJ/mol. Which of the elements listed above must be in the sample?
5. What element does each PES spectrum below represent?
15

16