€¦ · Web viewIn order to do so, we apply the WIOD's series of world input-output table ......
33
Brazilian Role in the Global Value Chains Joaquim José Martins Guilhoto Department of Economics, FEA - University of São Paulo REAL, University of Illinois, and CNPq Scholar E-mail: [email protected] Denise Imori Department of Economics, FEA - University of São Paulo E-mail: [email protected] In recent past, the global value chains have increasingly become more pervasive in the productive processes around the world and thus decisively affect how each country is integrated in a reshaped global economy. Understanding the role of the economies in the global value chains can help national and local governments to develop more effective responses to the challenges that are imposed by globalization. The present paper focuses Brazil, whose rate of economic openness is generally considered low compared to other large emerging countries such as China. The paper analyzes such topic with the viewpoint that products and services are now made in global value chains and that ‘trade in value added’ might be a better approach for the measurement of international trade. Thus, our main goals are 1) evaluating how the Brazilian participation in the global value chains has evolved in the last two decades; 2) analyzing the trade relationships of Brazil with other economies, especially those composing the BRIC group of countries. In order to do so, we apply the WIOD's series of world input-output table (in the period of 1995- 2011), and the 2005 IDE’s BRICs international input-output table. Our results show that the Brazilian trade in value added has been quite limited, but exhibits an increasing trend following the global upsurge of trade in value added. With respect to sectoral roles, the mining and metallurgical activities generated large shares of the Brazilian exports to value added, especially to China. Keywords: global value chains; trade in value added; input-output analysis As cadeias de valor globais têm se tornado cada vez mais presentes nos processos produtivos, afetando de modo importante como cada país integra-se à economia global. O entendimento do papel de cada economia nas cadeias de valor globais pode auxiliar a formulação de respostas efetivas aos desafios impostos pela globalização. O presente artigo enfoca o Brasil, cujo nível de abertura comercial é geralmente 1
Transcript of €¦ · Web viewIn order to do so, we apply the WIOD's series of world input-output table ......
Brazilian Role in the Global Value Chains
Joaquim José Martins GuilhotoDepartment of Economics, FEA - University of São Paulo
REAL, University of Illinois, and CNPq ScholarE-mail: [email protected]
Denise ImoriDepartment of Economics, FEA - University of São Paulo
E-mail: [email protected]
In recent past, the global value chains have increasingly become more pervasive in the productive processes around the world and thus decisively affect how each country is integrated in a reshaped global economy. Understanding the role of the economies in the global value chains can help national and local governments to develop more effective responses to the challenges that are imposed by globalization. The present paper focuses Brazil, whose rate of economic openness is generally considered low compared to other large emerging countries such as China. The paper analyzes such topic with the viewpoint that products and services are now made in global value chains and that ‘trade in value added’ might be a better approach for the measurement of international trade. Thus, our main goals are 1) evaluating how the Brazilian participation in the global value chains has evolved in the last two decades; 2) analyzing the trade relationships of Brazil with other economies, especially those composing the BRIC group of countries. In order to do so, we apply the WIOD's series of world input-output table (in the period of 1995-2011), and the 2005 IDE’s BRICs international input-output table. Our results show that the Brazilian trade in value added has been quite limited, but exhibits an increasing trend following the global upsurge of trade in value added. With respect to sectoral roles, the mining and metallurgical activities generated large shares of the Brazilian exports to value added, especially to China.
Keywords: global value chains; trade in value added; input-output analysis
As cadeias de valor globais têm se tornado cada vez mais presentes nos processos produtivos, afetando de modo importante como cada país integra-se à economia global. O entendimento do papel de cada economia nas cadeias de valor globais pode auxiliar a formulação de respostas efetivas aos desafios impostos pela globalização. O presente artigo enfoca o Brasil, cujo nível de abertura comercial é geralmente considerado baixo comparativamente a outros países em desenvolvimento, como a China. O artigo analisa tal tópico sob o ponto de vista de que bens e serviços são agora produzidos em cadeias de valor globais e que “comércio em termos de valor adicionado” (“trade in value added”) pode constituir uma abordagem adequada para a mensuração do comércio internacional. Assim, os principais objetivos do trabalho são: 1) avaliar como a participação do Brasil nas cadeias de valor globais evoluiu nas últimas duas décadas; 2) analisar as relações comerciais do país com outras economias, especialmente os membros do BRICs. Para tanto, emprega-se a série de matrizes de insumo-produto do WIOD (para o período de 1995 a 2011), bem como a matriz de insumo-produto internacional elaborada pelo IDE com foco nos BRICs. Os resultados mostram que o comércio do Brasil em termos de valor adicionado tem sido limitado, mas exibe uma tendência crescente de acordo com o grande aumento das trocas internacionais de valor adicionado. Setorialmente, as atividades de mineração e metalurgia geraram grandes parcelas das exportações brasileiras de valor adicionado, principalmente aquelas com destino à China.
Palavras-chave: cadeias de valor globais; comércio internacional; análise de insumo-produto
Área ANPEC: Área 7 – Economia Internacional
Classificação JEL: F02, F14, C671
1. Introduction
The global value chains (GVCs) are now prevalent in production processes. Products and services are rarely produced entirely within a single country. Instead, within GVCs, countries import intermediate inputs, to which they successively add layers of value (Dietzenbacher et al, 2013). This has led to an upsurge of trade in intermediate products, which corresponds to Baldwin’s (2006) “second wave of global unbundling” where the location of the production of intermediates differs from the location of the production of the final products.1
It is recognized that the BRIC countries influenced in a decisive way the globalization process and, hence, the uprising of GVCs. The present paper analyzes the role of Brazil in GVCs. In addition, as emphasized by Sturgeon et al. (2013), when considering the Brazilian role in GVCs, it is useful to consider its position within the BRIC group of countries, especially its relationship with China, a country whose importance in the GVCs is hard to be overstated. Thus, our main goals are 1) evaluating how the Brazilian participation in the global value chains has evolved in the last two decades; 2) analyzing the trade relationships of Brazil with other economies, especially those composing the BRIC group of countries. As stated by Meng et al. (2013), a better understanding of how the economies are integrated in the GVCs can help governments to develop more effective responses to the challenges that are imposed by globalization.
In the analysis, we have in mind that standard trade figures that measure the value of imports and exports do not reflect anymore what is really happening. As indicated by Backer and Miroudot (2013), traditional trade statistics record several times the value of intermediate inputs traded along the value chains. Consequently, most of the value of products and services is attributed to the country of the final producer, while the role of countries providing inputs upstream is overlooked. Hence, bilateral trade statistics and national output measures are not the best kind of figures to visualize the GVCs. In this context, OCDE and WTO jointly launched the “made in the world” initiative and proposed “trade in value added” as a better approach for the measurement of international trade (see OECD-WTO, 2012).
Encouraging the adoption of the “trade in value added” approach, in recent years groups of researchers have developed international / world input-output tables. These are interregional Isard-type input-output tables with countries instead of regions (Dietzenbacher et al, 2013). The empirical analysis in the present paper applies the IDE’s BRICs international input-output table, as well as the WIOD’s series of world input-output tables.
This paper is organized as follows, besides this Introduction: section 2 presents the methodology used in the empirical analysis. Results are then analyzed. Section 3.1 shows the evolution of Brazilian involvement in the GVCs in the last two decades. Section 3.2 explores the country’s trade relationships with other economies as in 2005, especially those composing the BRIC group of countries. These results are briefly reevaluated for the year 2011 in section 3.3 Then, the last section presents some our concluding remarks.
2. Methodology
For evaluating how the Brazilian involvement in the GVCs has evolved in recent years, we used the world input-output tables for the period of 1995-2011 that were constructed in the WIOD project (see Dietzenbacher et al, 2013). They are full inter-country input-output tables covering 40 countries2,
1 The first wave of global unbundling refers to the separation of the location of consumption and the location of production, which led to increased trade in final products (Baldwin, 2006).2 The countries in the WIOD’s world input-output tables are: Australia, Austria, Belgium, Brazil, Bulgaria, Canada, China, Cyprus, Czech Republic, Denmark, Estonia, Finland, France, Germany, Greece, Hungary, India, Indonesia, Ireland, Italy, Japan, Korea, Latvia, Lithuania, Luxembourg, Malta, Mexico, Netherlands, Poland, Portugal, Romania, Russia, Slovak
2

including the BRICs, and the rest of the world as a 41st country. These data from the WIOD project were applied in sections 3.1 and 3.3.
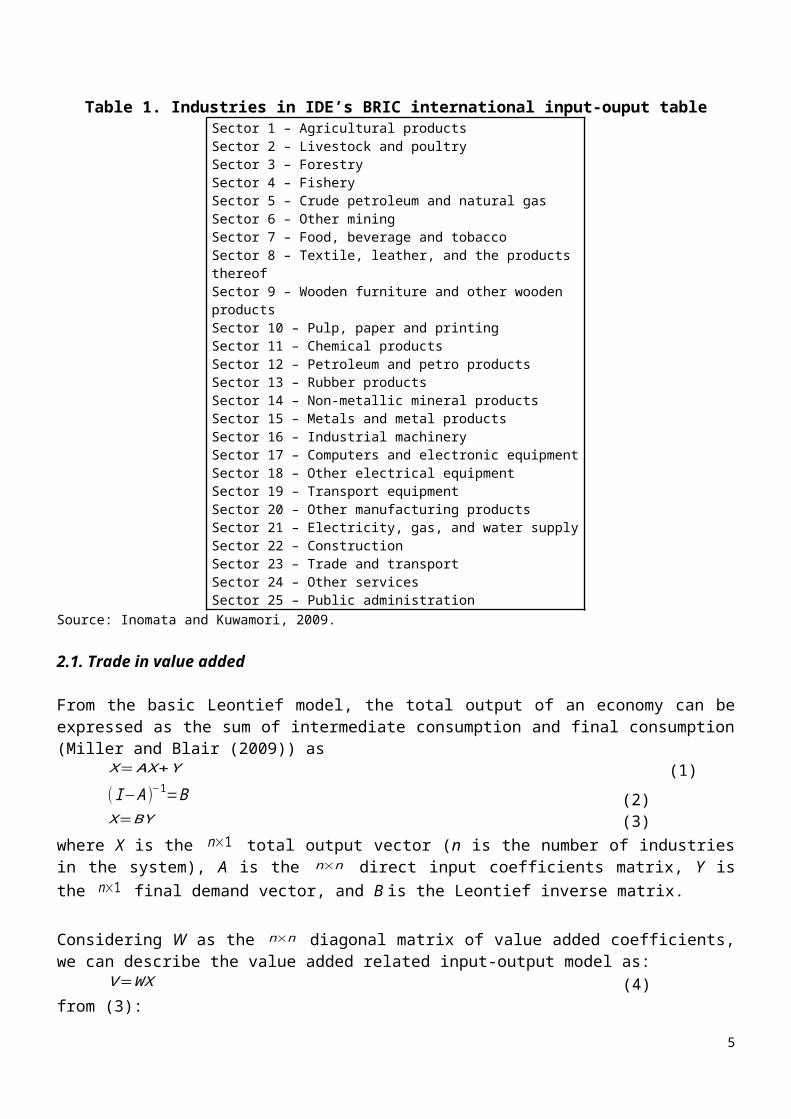
In order to analyze in more detail the trade relationships of Brazil with other economies, especially with the BRIC countries, we applied the 2005 IDE’s BRICs international input-output table (see Inomata and Kuwamori, 2008; Kuwamori et al, 2009; Inomata and Kuwamori, 2009). It covers seven economies: besides the BRIC countries, Japan, EU253, and the USA. The economic activities follow a 25 sectors classification, as in Table 2 below. The IDE’s input-output data was studied in section 3.2.
Table 1. Industries in IDE’s BRIC international input-ouput tableSector 1 – Agricultural productsSector 2 – Livestock and poultrySector 3 – ForestrySector 4 – FisherySector 5 – Crude petroleum and natural gasSector 6 – Other miningSector 7 – Food, beverage and tobaccoSector 8 – Textile, leather, and the products thereofSector 9 – Wooden furniture and other wooden productsSector 10 – Pulp, paper and printingSector 11 – Chemical productsSector 12 – Petroleum and petro productsSector 13 – Rubber productsSector 14 – Non-metallic mineral productsSector 15 – Metals and metal productsSector 16 – Industrial machinerySector 17 – Computers and electronic equipmentSector 18 – Other electrical equipmentSector 19 – Transport equipmentSector 20 – Other manufacturing productsSector 21 – Electricity, gas, and water supplySector 22 – ConstructionSector 23 – Trade and transportSector 24 – Other servicesSector 25 – Public administration
Source: Inomata and Kuwamori, 2009.
2.1. Trade in value added
From the basic Leontief model, the total output of an economy can be expressed as the sum of intermediate consumption and final consumption (Miller and Blair (2009)) as
X=AX +Y (1)( I−A )−1=B (2)X=BY (3)
where X is the n×1 total output vector (n is the number of industries in the system), A is the n×n direct input coefficients matrix, Y is the n×1 final demand vector, and B is the Leontief inverse matrix.
Considering W as the n×n diagonal matrix of value added coefficients, we can describe the value added related input-output model as:
V=WX (4)from (3):
Republic, Slovenia, Spain, Sweden, Taiwan, Turkey, United Kingdom, and USA (Dietzenbacher et al, 2013).3 EU25 is defined to include the following countries: Austria, Belgium, Cyprus, Czech Republic, Denmark, Estonia, Finland, France, Germany, Greece, Hungary, Ireland, Italy, Latvia, Lithuania, Luxembourg, Malta, Netherlands, Poland, Portugal, Slovakia, Slovenia, Spain, Sweden, and United Kingdom (Inomata and Kuwamori, 2009).
3

V=WBY (5)WB=G (6)V=GY (7)
where V is the n×1 value added vector, and G is the value added related Leontief inverse (Meng and Inomata, 2009).
In our empirical analysis, we applied inter-country input-output models. In this case, the above system can be expanded, considering r countries, in such a way that it is possible to estimate the contribution of the final demand in each country to the total value added of a given country. In this way, the dimensions of the above matrices become: a) X, Y and V, size [(r.n) x r]; b) A, B and G, size (r.n)x(r.n). Then, equation (7) can be represented as:
[ v1111 ⋮ v1 n
1 r
⋯ ⋱ ⋯vn 1
r 1 ⋮ vrrrr ]=[G11 ⋮ G1r
⋯ ⋱ ⋯Gr 1 ⋮ Grr ][ y11
11 ⋮ y1n1r
⋯ ⋱ ⋯yn 1
r 1 ⋮ yrrrr ]
(8)
[V ¿ 1 ⋯ V ¿r ]=[G11 ⋮ G1 r
⋯ ⋱ ⋯G r1 ⋮ Grr ] [Y ¿ 1 ⋯ Y ¿ r ]
(9)
In the above equation, vector V¿ 1
[(r.n) x 1] represents the contribution of country 1 to the total value added in each one of the r countries and n sectors considered in the model, given the final demand Y
¿ 1of
this country.
With the aim of analyzing the inter-country interdependence in terms of value added, matrix G above can be decomposed as follows:
[G11 ⋮ G1r
⋯ ⋱ ⋯Gr 1 ⋮ Grr ]=[G11 ⋮ 0
⋯ ⋱ ⋯0 ⋮ G rr ]+[ 0 ⋮ G1r
⋯ ⋱ ⋯Gr 1 ⋮ 0 ]
(10)In equation (11), the elements of the first term of the sum can be regarded as intra-country effects, representing impacts on the value added of sectors of a region due to exogenous changes in final demand of the same region. On the other hand, the elements of the second term of the sum can be regarded as spillover effects, representing impacts on the value added of sectors of a region due to exogenous changes in final demand of the other region.
2.2. GVC participation index
Koopman et al. (2011) proposed the “GVC participation index”, an index that summarizes the importance
of global value chains for a given country. In order to calculate it, given W Cj ' as the 1×n value added coefficient vector for country j, we define:
W C =[W C 1 ' ⋮ 0⋯ ⋱ ⋯0 ⋮ W Cr ' ]
(11)
where W C has size r x (r.n).
4
Considering E ji as the n×1 vector of gross exports from j to i, then the vector of total exports of country j is given by:
E j=∑i≠ j
E ji(12)
We also define:
E=[E1 ⋮ 0⋯ ⋱ ⋯0 ⋮ E r
](13)
Where E is a (r.n) x r matrix.
Then, the measure of value added by source embodied in exports is given by:
W C B E=[W C 1 ' B11 E1 ⋮ W C1 ' B1 r Er
⋯ ⋱ ⋯W Cr ' Br 1 E1 ⋮ W Cr ' Brr Er
](14)
In (15), the sum of off-diagonal elements along a column gives the foreign value added that is embodied in a given country’s exports, i.e.:
FV j=∑i≠ j
W Ci ' Bij E j(15)
On the other hand, the sum of off-diagonal elements along a row of (15) measures a country’s intermediate inputs that are embodied in the exports of other countries, i.e.:
IV j=∑i≠ j
W Cj ' B ji E i(16)
Given that, we can express the GVC participation index for country j as:
GVCParticipation j=
FV j
E j+
IV j
E jThe first term of the sum (backward participation) will be higher for countries that use large amounts of other countries intermediates to produce final products, while the latter term (forward participation) will be higher for those that are large providers of inputs for others.
3. Empirical Analysis
3.1. Brazilian involvement in the Global Value Chains
In this section, we applied the WIOD's series of world input-output tables (for the period of 1995-2011).
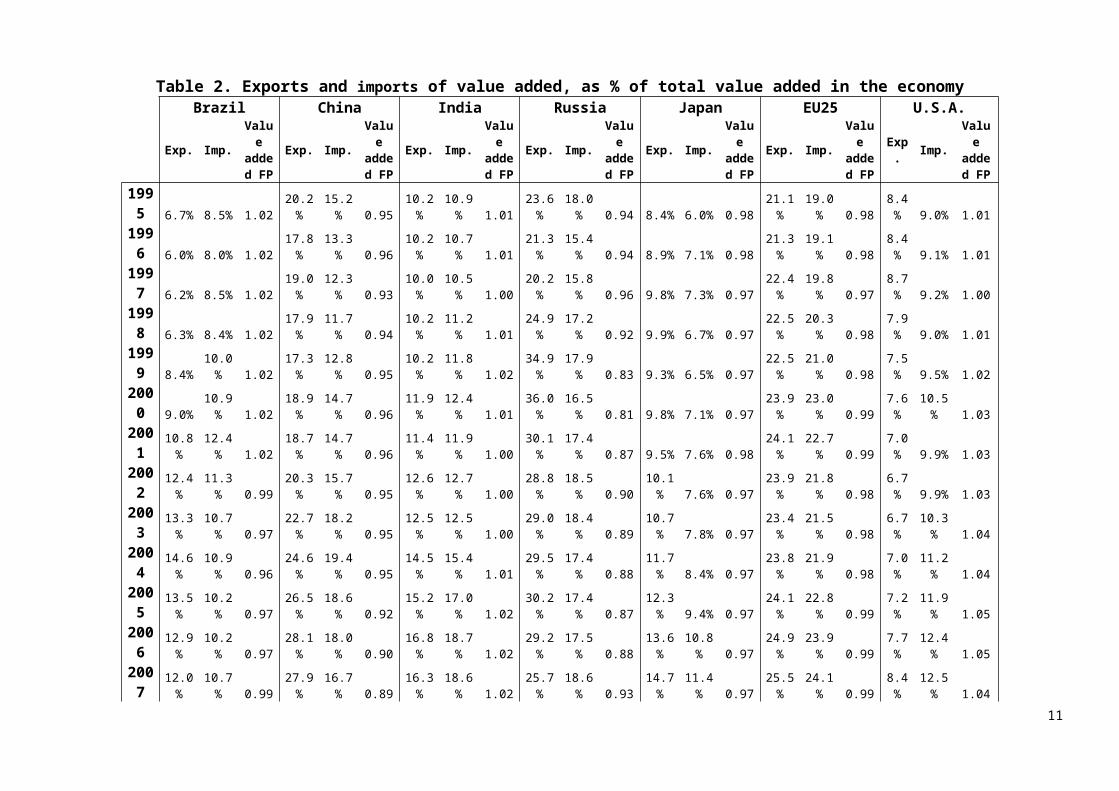
A possible indicator to analyze the degree of involvement of an economy in the GVCs is the ratio between the figures of exports or imports in value added terms and the total value added that was generated in the economy. Open economies that rely more on international trade will present higher values for those ratios. For the period of 1995-2011, Table 1 presents these ratios for Brazil, China, India, Russia, Japan, EU25, and USA.
Both the exports and the imports ratios indicate that the Brazil’s trade in value added was limited in the period. The Brazilian ratios were comparable to those of Japan and USA, while the EU25 had approximately as twice as much trade in value added (as % of the economy’s total value added). Also the other BRIC countries seemed considerably more involved in the GVCs than Brazil, in the entire period of 1995-2011.
5
Despite being limited, the Brazilian trade in value added exhibited an increasing trend in the period of 1995-2011, both as concerns its exports and its imports of value added. In fact, this is a trend that was verified for all the economies in Table 1, indicating an upsurge in global trade in value added in the last two decades.
A possible way to summarize these results is calculating the “value added footprint”, which is the ratio between the value added embodied in the final demand of an economy and the total value added that was generated in that economy. The results are also shown in Table 2. In the period 1995-2011, the Brazilian value added footprint remained around 1.0, due to the underlying result that the figures for exports of value added and for imports of value added were considerably close to each other.
Among the economies in Table 2, Brazil was the only one whose footprint displayed values higher than 1.0 (in the period 1995-2001, and after 2008), and also values below 1.0 (in the period 2002-2007). For the other economies, either the exports of value added were constantly higher than the imports of value added (case of India and USA), or the other way around (case of China, Russia, Japan, and EU25).
Koopman et al. (2011) proposed the “GVC participation index”, supporting the point that economies participate in GVCs both as users of foreign inputs and suppliers of intermediate goods and services used in other countries’ exports. In this way, according to Backer and Miroudot (2013), the GVC participation index is given by the sum of two shares: 1) share of imported inputs in the overall exports of an economy (backward participation); and 2) share of exports of intermediates that are used by other economies to produce goods for exports (forward participation).
The GVC participation index at the country level is presented in Figure 1, for the year 2011 (the calculations were based on WIOD’s tables). The highest GVC participation indexes corresponded to small open countries, whose exports embodied large amounts of foreign inputs. The most notable exception is Russia, a large country that presented very important participation in the GVC as a source of inputs that were incorporated to the exports of other countries. Approximately 90% of the Russian GVC participation index was due to its component of forward participation. The other economies that are central to our analysis presented much lower values for the index. It is remarkable that, among the 40 countries whose GVC participation was analyzed, India and Brazil were those with the lowest indexes as in 2011. There was an important difference with respect to the composition of their indexes, though, as for China and India the backward participation was more relevant than for USA, Japan, and Brazil, where foreign inputs corresponded to small shares of their gross exports and much of the participation in the GVCs was due to their sourcing of intermediate inputs to other economies.
Figure 1. GVC participation index, 2011
0.000.100.200.300.400.500.600.700.80
Luxe
mbo
urg
Taiw
anC
zech
Rep
ublic
Slov
ak R
epub
licB
elgi
umH
unga
ryN
ethe
rland
sK
orea
Irel
and
Rus
sia
Finl
and
Slov
enia
Esto
nia
Aus
tria
Mal
taPo
land
Den
mar
kSw
eden
Bul
garia
Lith
uani
aU
nite
d K
ingd
omSp
ain
Ger
man
yFr
ance
Rom
ania
Aus
tralia
Portu
gal
Mex
ico
Latv
iaIta
lyIn
done
sia
Turk
eyJa
pan
Cyp
rus
Gre
ece
USA
Chi
naC
anad
aIn
dia
Bra
zil
Backward Forward
6

Source: Research data.Note: Calculations based on WIOD’s world input-output tables.
7
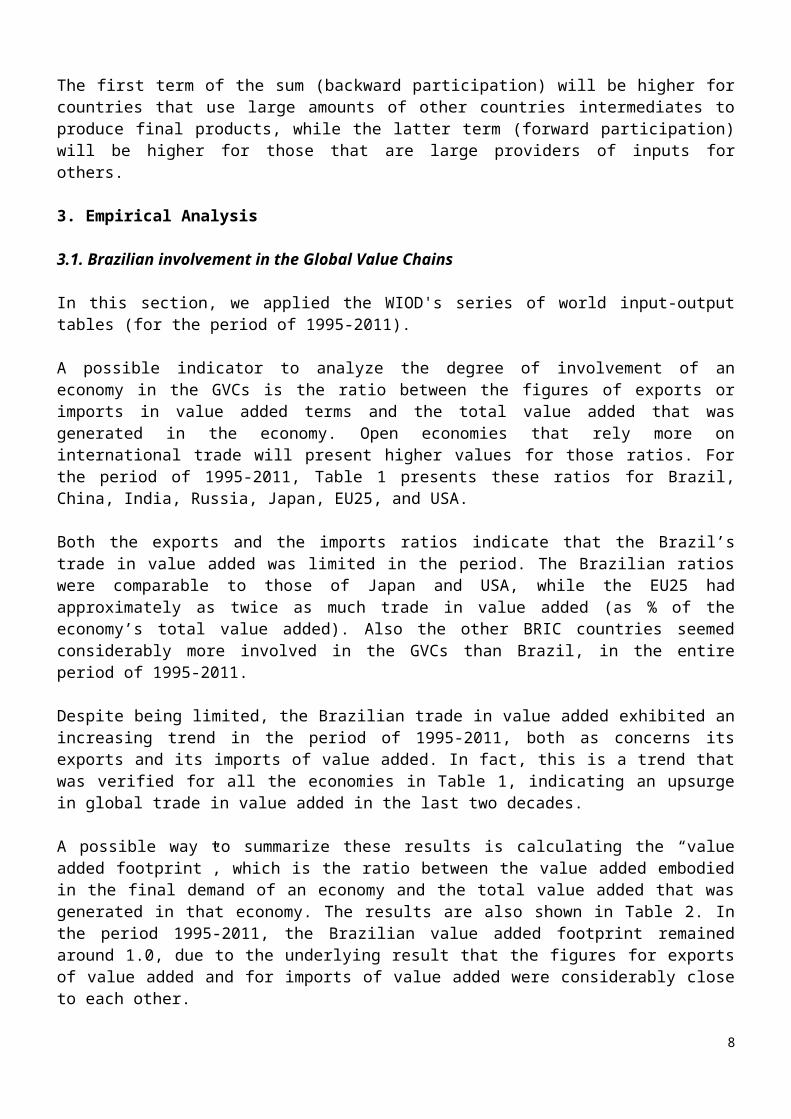
Table 2. Exports and imports of value added, as % of total value added in the economyBrazil China India Russia Japan EU25 U.S.A.
Exp. Imp.Value added
FPExp. Imp.
Value added
FPExp. Imp.
Value added
FPExp. Imp.
Value added
FPExp. Imp.
Value added
FPExp. Imp.
Value added
FPExp. Imp.
Value added
FP1995 6.7% 8.5% 1.02
20.2%
15.2% 0.95
10.2%
10.9% 1.01
23.6%
18.0% 0.94 8.4% 6.0% 0.98
21.1%
19.0% 0.98
8.4% 9.0% 1.01
1996 6.0% 8.0% 1.02
17.8%
13.3% 0.96
10.2%
10.7% 1.01
21.3%
15.4% 0.94 8.9% 7.1% 0.98
21.3%
19.1% 0.98
8.4% 9.1% 1.01
1997 6.2% 8.5% 1.02
19.0%
12.3% 0.93
10.0%
10.5% 1.00
20.2%
15.8% 0.96 9.8% 7.3% 0.97
22.4%
19.8% 0.97
8.7% 9.2% 1.00
1998 6.3% 8.4% 1.02
17.9%
11.7% 0.94
10.2%
11.2% 1.01
24.9%
17.2% 0.92 9.9% 6.7% 0.97
22.5%
20.3% 0.98
7.9% 9.0% 1.01
1999 8.4%
10.0% 1.02
17.3%
12.8% 0.95
10.2%
11.8% 1.02
34.9%
17.9% 0.83 9.3% 6.5% 0.97
22.5%
21.0% 0.98
7.5% 9.5% 1.02
2000 9.0%
10.9% 1.02
18.9%
14.7% 0.96
11.9%
12.4% 1.01
36.0%
16.5% 0.81 9.8% 7.1% 0.97
23.9%
23.0% 0.99
7.6%
10.5% 1.03
2001
10.8%
12.4% 1.02
18.7%
14.7% 0.96
11.4%
11.9% 1.00
30.1%
17.4% 0.87 9.5% 7.6% 0.98
24.1%
22.7% 0.99
7.0% 9.9% 1.03
2002
12.4%
11.3% 0.99
20.3%
15.7% 0.95
12.6%
12.7% 1.00
28.8%
18.5% 0.90
10.1% 7.6% 0.97
23.9%
21.8% 0.98
6.7% 9.9% 1.03
2003
13.3%
10.7% 0.97
22.7%
18.2% 0.95
12.5%
12.5% 1.00
29.0%
18.4% 0.89
10.7% 7.8% 0.97
23.4%
21.5% 0.98
6.7%
10.3% 1.04
2004
14.6%
10.9% 0.96
24.6%
19.4% 0.95
14.5%
15.4% 1.01
29.5%
17.4% 0.88
11.7% 8.4% 0.97
23.8%
21.9% 0.98
7.0%
11.2% 1.04
2005
13.5%
10.2% 0.97
26.5%
18.6% 0.92
15.2%
17.0% 1.02
30.2%
17.4% 0.87
12.3% 9.4% 0.97
24.1%
22.8% 0.99
7.2%
11.9% 1.05
2006
12.9%
10.2% 0.97
28.1%
18.0% 0.90
16.8%
18.7% 1.02
29.2%
17.5% 0.88
13.6%
10.8% 0.97
24.9%
23.9% 0.99
7.7%
12.4% 1.05
2007
12.0%
10.7% 0.99
27.9%
16.7% 0.89
16.3%
18.6% 1.02
25.7%
18.6% 0.93
14.7%
11.4% 0.97
25.5%
24.1% 0.99
8.4%
12.5% 1.04
2008
12.3%
12.3% 1.00
26.4%
16.3% 0.90
15.4%
18.7% 1.03
26.0%
19.4% 0.93
14.2%
12.4% 0.98
25.7%
24.7% 0.99
8.7%
13.2% 1.05
2009
10.0%
10.4% 1.00
21.1%
14.6% 0.94
12.9%
16.4% 1.03
22.8%
17.4% 0.95
10.9% 9.5% 0.99
23.6%
22.1% 0.99
8.0%
10.5% 1.02
2010
10.1%
11.2% 1.01
22.3%
16.4% 0.94
13.8%
17.0% 1.03
25.1%
19.1% 0.94
12.7%
10.3% 0.98
24.9%
23.6% 0.99
8.9%
12.0% 1.03
201 10.9 12.3 1.01 21.6 16.8 0.95 13.3 16.5 1.03 26.6 19.8 0.93 12.1 11.8 1.00 25.8 24.3 0.99 9.5 12.8 1.03
8

1 % % % % % % % % % % % % % %Source: Research data.Note: Calculations based on WIOD’s world input-output tables.
9

Figure 2 shows the GVC participation index for those selected economies for the period of 1995-2011. Until 2008, all of them exhibited an increasing trend in their indexes, which significantly declined in 2009. It is also interesting that in the years after 2005, USA and Japan presented more participation in the GVC than the BRIC countries (with outstanding exception of Russia).
Figure 2. GVC participation index, selected countries, 1995 - 2011
0.200.250.300.350.400.450.500.550.600.650.70
Brazil China India Russia Japan U.S.A.
Source: Research data.Note: Calculations based on WIOD’s world input-output tables.
During the period of 1995-2011, the Brazilian GVC participation index was quite low. In comparison with other economies, its participation did not grow as much as that of China, Japan, and India, whose participation indexes had surpassed the Brazilian one by 2003. Value added embodied in foreign inputs employed by domestic industries (backward participation) corresponded to approximately 10%, on average, of total gross exports of Brazil in the period of 1995-2011. The Brazilian backward participation grew prominently until the early 2000s, being stable since then. On the other hand, the Brazilian participation in the GVC as source of inputs (forward participation) was increasing until 2008. In the period of 1995-2011, it corresponded, on average, to nearly 25% of Brazilian gross exports.
3.2. The BRICs’ economic interdependence
In order to analyze the trade relationships of Brazil with other economies, we applied the 2005 IDE’s BRICs international input-output table.
The empirical results for the value added multiplier effect of Brazilian industries are shown in Figure 34. Concerning the spillover effects of the Brazilian industries, that one corresponding to the high-technology industry “Computers and electronic equipment” (17) is remarkable, as a one unit increase of final demand for its products would lead to the generation of 0.22 unit of value added in the foreign economies. The spillover effects of the high / medium-high technology industries “Other electrical equipment” (18) and “Transport equipment” (19) also stand out, as well as those of the manufacturing industries “Chemical products” (11), “Rubber products” (13), “Metals and metal products” (15), “Industrial machinery” (16), and “Other manufacturing products” (20).
Figure 3. Value added multiplier effect, Brazilian industries4 As can be seen in Figure 6, our results for the value added multiplier effects are not equal to 1.0, as would be expected if adding up the value added and the total intermediate consumption by each sector matched its total outlays. This is not the case of the IDE’s BRICs international input-output table, where, besides intermediate consumption and value added, the total outlays of each sector were also composed by: imports from the rest of the world; international freight & insurance and taxes on these import transactions; and statistical discrepancies between estimated trade data and import/export information embedded in the original I-O tables (see Inomata and Kuwamori, 2009).
10
0.00
0.20
0.40
0.60
0.80
1.00
1 2 3 4 5 6 7 8 9 10 11 12 13 14 15 16 17 18 19 20 21 22 23 24 25
Domestic multiplier effect Spillover effect
Source: Research data.Note: Calculations based on IDE’s BRICs international input-output table for 2005.
For each Brazilian industry, Figure 4 shows the distribution of spillover effects per foreign economy. For 23 of the 25 industries, the largest share of the foreign value added would be generated in EU25; the exceptions are the “Petroleum and petro products” (12) and “Computers and electronic equipment” (17) industries, for which the USA are responsible for the largest share of the spillover effects. The “Computers and electronic equipment” (17) industry also stands out as the one in the Brazilian economy that generates the largest spillover effect for both China and Japan, besides EU25 and USA, among all the industries. For China, however, the largest participation in the Brazilian spillover effect was found in the “Textile, leather, and the products thereof” (8) industry. For India and Russia, the largest spillover effect is generated when there is an increase in the final demand for the “Chemical products” (11) in Brazil.
Figure 4. Value added spillover effect per economy, Brazilian industries0% 10% 20% 30% 40% 50% 60% 70% 80% 90% 100%
Sector 1Sector 2Sector 3Sector 4Sector 5Sector 6Sector 7Sector 8Sector 9
Sector 10Sector 11Sector 12Sector 13Sector 14Sector 15Sector 16Sector 17Sector 18Sector 19Sector 20Sector 21Sector 22Sector 23Sector 24Sector 25
China India Russia Japan EU25 U.S.A.
Source: Research data.Note: Calculations based on IDE’s BRICs international input-output table for 2005.
As previously stated in the Methodology, it is also relevant to evaluate the international interdependence at the absolute level, i.e. considering the real economic scales. Table 3 shows the final demand system at the absolute level, added by all industries of the economies. Thus, each entry in the Table 3 indicates the
11

value added generated in the row economy due to the final demand of the column economy, both in direct and indirect ways. For example, the figure at the intersection of Brazil’s row and China’s column is US$ 11,081 million (in values of 2011). It indicates that the value added of US$ 11,081 million was generated inside Brazil to meet the actual final demand of Chinese economic agents, in 2005. In the same way, the figure at the intersection of China’s row and China’s column indicates that US$ 2,766,081 million was generated in China due to its own final demand (domestic effect), in 2005.
Therefore, in Table 3, the figures in Brazil’s row indicate how much value added was generated in the Brazilian industries to meet the direct and indirect requirements from the final demand of each economy in the system. In other words, besides the diagonal one (US$ 1,661,621 million) which corresponds to the domestic effect, those figures indicate the Brazilian exports of value added, in 2005. According to Table 3, the Rest of the World – an exogenous region to our input-output system – was the main foreign destination for Brazilian exports of value added in 2005, absorbing approximately US$ 133,305 million of that country’s value added. In the same way, the figures in Brazil’s column of Table 3 show the value added that was generated (directly and indirectly) due to the Brazilian final demand, in 2005. About those imports of value added by the Brazilian economic agents, it is noticeable that the ranking of partners is the same as that for exports of value added.
Concerning the relative contribution of the final demand of each economy to the generation of value added, in 2005, for Brazil, its own final demand was responsible for approximately 88% of its total value added. This indicates the importance of domestic consumption to the Brazilian industries, which was greater than in the Chinese case, but lower than what was observed for the developed economies of Japan, EU25, and USA. Concerning the Brazilian exports of value added to the economies in our system, after the Rest of the World, the main destination of Brazilian exports of value added was EU25 (22% of total exports of value added), followed by USA (18%). The other BRIC countries responded for approximately 8% of the Brazilian exports of value added, with more prominent participation of China. On the other hand, Brazil was responsible for only quite small shares of the total value added of the economies in our system. The more significant share corresponded to China’s value added: in 2005, the Brazilian final demand was responsible for 0.16% of that country’s value added (or 0.55% of its exports of value added).
Since these are central results for our analysis, it is interesting to see how they compare if based on alternative data, specifically the WIOD’s world input-output table for the year 2005. Dissimilarities in the resulting figures are expected depending on the chosen database, due to differences in their methodology for constructing the input-output tables (Inomata and Kuwamori, 2009; Dietzenbacher et al, 2013). Among these differences that may lead to uneven results, it is possible to indicate one about the valuation of economic flows: while the transactions in IDE’s BRICs international input-output table are at producers’ prices, WIOD’s world input-output tables are valued at basic prices. Another major point is that the WIOD’s world input-output tables intend to endogenously represent the whole global economy, but the IDE’s BRICs international input-output table focuses on 7 economies, depicting the rest of the world as an exogenous region of the model. Hence, economic effects due to interrelations with the rest of the world are not completely comprised in the analysis based on IDE’s BRICs international input-out table. It is expected, however, that the same general conclusions can be derived regardless of the database that is being applied.
It can be indicated that this is the case in the present study. Table 4 is comparable to the previous one, and presents results for the final demand system that were obtained by applying the WIOD’s database. Its 41 countries were appropriately aggregated to match the 7 endogenous regions in the IDE’s BRICs international input-output table, plus the rest of the world (R.o.W.). Although the comparison of Table 4 to Table 3 reveals that there are differences in the absolute level results for the final demand system, the general conclusions still hold applying either of the databases, for all the depicted economies. Concerning Brazil, the results based on WIOD’s world input-output table indicate less responsibility of the domestic final demand for the total value added of the country (less 1.25 p.p.). Besides this, the responsibility of
12

EU25 and USA for Brazilian exports of value added is slightly greater (in 1.08 p.p., and 0.73 p.p., respectively), at the expense of that of the rest of the world (less 0.75 p.p.). However and more importantly, the ranking of trade in value added partners remained exactly the same as the one that was obtained by applying the IDE’s database. In this way, one can be reassured to continue applying the IDE’s BRICs international input-output to analyze the trade relationships of the appointed economies. Results on the rest of this section were obtained from the IDE’s database.
13

Table 3. Final demand system, in 2005 – Based on IDE’s BRICs international input-output table (constant 2011 prices in US$ thousands)Brazil China India Russia Japan EU25 U.S.A. R.o.W.
Brazil 1,661,621,294 11,081,635 2,167,415 5,863,944 6,763,121 50,930,510 41,994,437 113,305,584China 6,153,683 2,766,081,681 10,359,116 11,668,978 109,174,064 226,849,460 240,653,870 508,878,003India 1,073,768 6,505,435 935,748,769 993,240 3,690,127 28,401,205 22,506,154 65,087,720Russia 1,548,724 15,622,974 4,156,124 991,324,400 8,176,103 171,010,274 26,591,514 216,713,840Japan 3,451,201 58,209,813 3,642,209 6,068,009 4,941,548,294 103,689,043 142,800,799 342,796,447EU25 16,767,788 50,130,727 21,376,331 57,373,258 50,608,982 13,241,548,786 289,489,332 850,854,256U.S.A. 10,342,177 28,810,643 6,430,934 4,922,162 47,749,341 168,258,302 12,680,717,066 551,493,964
Source: Research data.Note: Calculations based on IDE’s BRICs international input-output table for 2005.
Table 4. Final demand system, in 2005 – Based on WIOD’s world input-output table (constant 2011 prices in US$ thousands)Brazil China India Russia Japan EU25 U.S.A. R.o.W.
Brazil 1,441,904,697 11,566,743 2,080,966 4,334,186 8,024,922 62,756,016 49,060,371 87,293,386China 7,462,437 2,810,440,653 18,927,537 12,923,157 110,804,601 217,317,511 289,653,187 357,593,801India 1,101,662 7,912,106 927,627,558 1,611,330 6,744,411 49,076,840 44,825,046 54,527,131Russia 2,866,809 21,442,996 3,911,517 886,343,468 12,626,542 187,547,916 45,011,576 109,670,769Japan 6,012,089 82,639,526 6,134,543 12,578,289 5,048,336,284 119,833,940 168,595,512 315,589,199EU25 28,311,343 111,813,203 28,551,436 60,277,167 86,627,477 12,889,774,668 471,090,148 960,520,735U.S.A. 12,557,730 54,115,816 15,290,518 8,517,434 68,349,665 280,972,067 13,161,930,220 613,100,048ROW 34,679,523 209,585,286 80,062,822 36,479,104 240,958,576 743,531,896 854,110,604 8,412,709,266
Source: Research data.Note: Calculations based on WIOD’s world input-output table for 2005.
14

The results concerning the Brazilian exports of value added by industries are shown in Table A1, in the Annex.
The sectoral composition of Brazilian exports of value added to each of the BRIC countries is diverse. In the case of China, the value added that was imported from Brazil was generated mainly in the industries related to Agriculture (especially agricultural products) or Mining (notably non-energy minerals). Concerning the Brazilian manufacturing, most of its exports of value added to China were generated in industries whose products are mainly intermediates inputs, as is the case of the industries “Metals and metal products” (15) and “Chemical products” (11). In the case of India and Russia, however, the exports of value added from the Brazilian manufacturing were largely due to final goods, mostly from the low technology “Food, beverage and tobacco” industry (7). Russia was also an important destination to the value added from the Brazilian “Livestock and poultry” industry (2).
The exports of value added from the Brazilian “Food, beverage and tobacco” industry (7) were also important when one considers either Japan or EU25 as destination. However, to this economies, the industries “Metals and metal products” (15) and “Chemical products” (11) as well generated great shares of the Brazilian exports of value added. In the case of Japan, there was also a relatively large share in the trade basket for the exports of value added from the “Other mining” (6) industry. In its turn, EU25 stand out as the main destination (other than the domestic market) of the value added of the Brazilian “Agricultural products” industry. In the case of USA, the Brazilian exports of value added were mainly generated in manufacturing, with great weight on the “Metals and metal products” (15) industry. The “Wooden furniture and other wooden products” (9), “Chemical products” (11), and “Transport equipment” (19) industries were also important exporters of value added to the USA.
It is noteworthy that for almost every Brazilian industry the domestic final demand was responsible for at least 60% of the value added that was generated in 2005. The two exceptions are the industries corresponding to metallurgical activities, “Other mining” (6) and “Metals and metal products” (15). In the case of “Other mining” (6), 29% of its value added was generated due to (the final demand of) Rest of the World, 15% due to EU25, and 11% due to China. The final demand of USA and Japan were also responsible for significant shares of this industry’s value added (7% and 5%, respectively). In the case of “Metals and metal products” (15), besides the Rest of the World, USA and EU25 were important destinations of its value added, as respectively 11% and 7% of it was generated in response to their final demands.
Table A2 in the Annex shows the Brazilian imports of value added from each industry of the economies in our input-output system.
As was verified for the exports, also in the case of Brazilian imports of value added, the sectoral composition of the trade basket significantly varies according to the source economy. There is, however, the common point that, in all the foreign economies in our input-output system, the value added generated in response to the Brazilian final demand was concentrated in the manufacturing industries (at least 40%). Besides this, in all the economies the “Chemical products” industry was responsible for a significant share of the value added embodied in the Brazilian final demand, from 5% in Japan, up to 25% in Russia.
Expressive shares of India’s and Russia’s exports of value added to Brazil were generated in their “Crude petroleum and natural gas” (5), as well as in their related manufacturing industry “Petroleum and petro products” (12). In the case of Russia, the “Metals and metal products” industry (15) as also responsible for generating a sizable share of value added that was exported to Brazil.
Concerning the other BRIC country, China, the picture was quite different. The main manufacturing industry for the exports of value added to Brazil was the “Metals and metal products” (15). Besides that, the high / medium-high technology industries “Computers and electronic equipment” (17) and “Other
15

electrical equipment” (18) generated expressive figures of value added embodied in the Brazilian final demand.
This last observation could also be made for the non-BRIC economies in our system, that is, Japan, EU25, and USA. In these economies, besides the “Metals and metal products” (15) industry, a great share of the manufacturing exports of value added for Brazil was generated in the high / medium-high technology industries “Industrial machinery” (16), “Computers and electronic equipment” (17), “Other electrical equipment” (18), and “Transport equipment” (19). One major difference from the Chinese case, however, is that the exports of value added from these developed economies to Brazil were also characterized by the expressive participation of services activities. They were responsible for a share as large as 22% (in EU25 and in EUA) of the value added embodied in the Brazilian final demand.
Given the figures on exports and imports of value added, in 2005 Brazil presented value added surplus with all the economies in our input-output system, as shown by Table 5 (the figures correspond to the exports from the row country less imports from the column country). The Brazilian trade surplus (in value added terms) with the USA was the largest one, being followed by the trade surplus with EU25. Among the BRIC countries, the trade surplus (in value added terms) with Russia was outstanding in 2005, as the Brazil’s imports of value added from Russia corresponded to merely 29% of its exports.
Table 5. Bilateral trade balances in value added terms, in 2005 – Based on IDE’s BRICs international input-output table (constant 2011 prices in US$ thousands)
Brazil China India Russia Japan EU25 U.S.A.Brazil 0 4,927,951 1,093,646 4,315,220 3,311,920 34,162,722 31,652,259China -4,927,951 0 3,853,681 -3,953,995 50,964,251 176,718,733 211,843,227India -1,093,646 -3,853,681 0 -3,162,885 47,919 7,024,874 16,075,220Russia -4,315,220 3,953,995 3,162,885 0 2,108,093 113,637,015 21,669,352Japan -3,311,920 -50,964,251 -47,919 -2,108,093 0 53,080,060 95,051,458EU25 -34,162,722 -176,718,733 -7,024,874 -113,637,015 -53,080,060 0 121,231,030U.S.A. -31,652,259 -211,843,227 -16,075,220 -21,669,352 -95,051,458 -121,231,030 0
Source: Research data.Note: Exports from the row country less imports from the column country. Calculations based on IDE’s BRICs international input-output table for 2005.
It is interesting to compare these bilateral trade balances in value added terms with those that are obtained when one considers gross exports and gross imports data. The gross bilateral trade balances for 2005, based on the IDE’s BRICs international input-output table, are presented in Table 65. Brazil’s trade surplus with the economies in IDE’s database was smaller in value added terms in 2005, with exception of India. In that case, Brazil’s imports from India in 2005 were significantly lower in value added terms, especially from the Indian “Chemical products” (11) and “Petroleum and petro products” (12) industries, which embody expressive amounts of intermediate imports in their exports. On the other hand, we notice that the Brazil’s imports from Russia in 2005 were larger in value added terms than in the traditional gross trade data. It is reflecting the Russian value added that is embodied in the exports of other countries, mainly from its “Crude petroleum and natural gas” (5) industry.
5 It is known that all of a country’s bilateral value-added trade balances must sum to its gross trade balance with the world (Benedetto, 2012). There are two reasons why row sums of Table 5 and Table 6 are not equal. First, only seven economies are covered. Second, as explained in footnote 4, in IDE’s database there are other components than intermediate consumption and value added composing the total output of each sector. Thus, in our empirical application we cannot expect a country’s gross trade balance with the world to be the same as its trade balance with the world in value added terms.
16
Table 6. Gross bilateral trade balances, in 2005 – Based on IDE’s BRICs international input-output table (constant 2011 prices in US$ thousands)
Brazil China India Russia Japan EU25 U.S.A.Brazil 0 8,992,623 903,075 5,001,093 3,637,993 40,528,875 37,475,202China -8,992,623 0 4,736,400 -8,294,688 66,129,994 265,657,004 299,023,858India -903,075 -4,736,400 0 -4,067,056 -141,491 6,133,922 18,699,341Russia -5,001,093 8,294,688 4,067,056 0 2,270,638 159,868,149 14,040,313Japan -3,637,993 -66,129,994 141,491 -2,270,638 0 62,688,935 105,069,575EU25 -40,528,875 -265,657,004 -6,133,922 -159,868,149 -62,688,935 0 141,258,954U.S.A. -37,475,202 -299,023,858 -18,699,341 -14,040,313 -105,069,575 -141,258,954 0
Source: Research data.Note: Exports from the row country less imports from the column country. Calculations based on IDE’s BRICs international input-output table for 2005.
3.3. Brazil in the GVCs – the early 2010s
Given the turbulence in the global economy in the late 2000s and considering the dynamic character of global value chains, it is interesting to reevaluate the results of the previous section for a more recent year. We proceed to a glimpse of that analysis as follows, applying the WIOD’s world input-output table for 2011. Caution is required for comparing the following results to those that were obtained in previous section, but we consider that important insights can be so provided regarding the BRICs’ economic interdependence in the early 2010s.
Table A3 in the Annex presents the final demand system as in 2011, based on WIOD’s world input-output table. Concerning Brazil, an important point is that, in comparison with the results obtained applying the WIOD’s world input-output table for 2005, its total exports of value added declined in 2011 by US$ 2,150 million (constant 2011 prices). That trend was verified only for Brazil among the economies depicted in Table 6. Such decline was due to the decrease in absorption of the Brazilian value added by the USA, which amounted to more than US$ 18 billion. Partially offsetting such decline, the Brazilian exports of value added to China in 2011 were more than double that of 2005: they greatly increased from US$ 11,557 million in 2005 to US$ 25,825 million in 2011. On the other hand, in 2011 Brazil had strengthened its position as an importer of value added – notably from China, being the imports four times greater in the more recent year (US$ 30,524 million in 2011, in comparison with US$ 7,462 million in 2005).
As a result from these movements in exports and imports of value added by Brazil, there was a major change in the picture of balances of bilateral trade in value added, which was represented as in 2005 in Table 5. In 2011, Brazil presented deficits of trade in value added with all these economies. The larger one corresponded to its bilateral trade with EU25: the Brazilian imports of value added surpassed its exports by US$ 6,565 million. The largest bilateral surplus of trade in value added of Brazil in 2005, that on with the USA, was also reverted in 2011, when there was a Brazilian deficit of US$ 5,306 million. Such scenario for Brazil was remarkably different from China’s, as in 2011 the Chinese position as an important exporter of value added was strengthened. In 2011, China presented surpluses in the bilateral trade in value added balances with all the economies depicted in Table 6 (while in 2005 there were deficits in the trade in value added with Brazil and Russia).
Notwithstanding those changes in the Brazilian bilateral trade in value added, the raking of its trade partners remained the same in 2011 as it was in 2005. Hence, in 2011 the rest of the world (R.o.W.) was the main destination of Brazilian exports of value added, being followed by EU25 and the USA. However, an important point is that the Chinese share in the Brazilian exports of value added greatly increased in 2011, standing only 0.25 p.p. shorter than the USA’s share.
Concerning the BRICs as a group, two common points can be made about their trade in value added in 2011, in comparison with 2005. The first one is that their internal markets were responsible for larger
17

shares of their own value added in 2011. Accordingly, in that year, more than 89% of the value added in Brazil was generated to satisfy its own domestic final demand, a share that was surpassed only by that presented by the USA. The second common point among the BRICs is that in 2011 their final demands were responsible for larger shares of the value added generated in Japan, EU25, and USA. In comparison with 2005, therefore, their positions as importers of value added from the developed economies were strengthened.
4. Concluding Remarks
In recent past, the global value chains have increasingly become more pervasive in the productive processes around the world and thus decisively affect how each country is integrated in a reshaped global economy. Understanding the role of the economies in the global value chains can help national and local governments to develop more effective responses to the challenges that are imposed by globalization. The present paper focused the Brazilian case, whose rate of economic openness is generally considered low compared to other large emerging countries such as China.
Our results from the empirical analysis corroborate this perception in some extent. They can be summarized as follows: (1) Brazilian international trade in value added is quite limited compared to EU25 and to the other BRIC economies; (2) In the period 1995-2011, however, it exhibited an increasing trend, following the global upsurge of trade in value added; (3) Much of the Brazilian participation in the GVCs is due to its sourcing of intermediate inputs to other economies; (4) The spillover effects of high / medium-high technology industries of Brazil stand out, being mainly directed to the developed economies; (5) In 2005, the Brazilian trade in value added with China was largely based on metallurgical activities. Exports of agricultural products to China also embodied large figures of value added. In its turn, Chinese exports of value added to Brazil by some high / medium-high technology industries were expressive; (6) In the case of India and Russia, in 2005 the Brazilian exports of value added were largely generated in the low technology food industry, while the Brazilian imports of value added were notably related to petroleum and petro products; (7) The non-energy mining and the metallurgical industries’ value added in Brazil was generated in a large extend (more than 40%) to meet the final demand of foreign economies. Also, preliminary analyses, based on WIOD’s world input-output table for 2011, indicate that in the early 2010s the Brazilian exports of value added receded. Simultaneously, the agricultural and mining activities were then responsible for the generation of increasing shares of the value added that was exported by Brazil, while the manufacturing industries’ exports of value added experienced real declining in relation to 2005.
In that scenario, it is necessary for Brazil to examine its policies concerning the integration in global economy. There are options for these policies, but it seems that seeking for developing industries apart from GVCs, supported by the domestic market, is a quite limited and outdated strategy. What remains is to deal the effects of the rapid and ongoing processes brought by globalization. The essential point is to learn how to do this effectively. References
BACKER, K. D.; MIROUDOT, S. Mapping Global Value Chains, OECD Trade Policy Papers, No 159, 2013.BALDWIN, R. Globalization: the great unbundling(s). Economic Council of Finland. 2006.BENEDETTO, J.B. Implications and Interpretations of Value-Added Trade Balances. Journal of International Commerce and Economics, v. 4, pp. 39-53, 2012.DIETZENBACHER, E. et al. The construction of world input–output tables in the WIOD project. Economic Systems Research, v. 25, pp. 71-98, 2013.DIETZENBACHER, E. et al. The Role of Brazilian Regions in the Global Value Chain. Encontro Nacional de Economia, 2013.
18

INOMATA, S.; KUWAMORI, H. Compilation and Use of the BRICs International Input-Output Table. Asian International Input-Output Series, No. 73, Institute of Developing Economies, JETRO, March 2009.INOMATA, S.; KUWAMORI, H. Compilation of the International Input-Output Table for the BRICs – A Feasibility Study. Asian International Input-Output Series, No.71, Institute of Developing Economies, JETRO, March 2008.ISTAKE, M. Comércio externo e interno do Brasil e de suas macrorregiões: um teste do teorema de Heckscher-Ohlin. Tese (Doutorado em Economia Aplicada) – Escola Superior de Agricultura Luiz de Quiroz, Universidade de São Paulo, 2003.KOOPMAN, R. et al. Give Credit Where Credit Is Due: Tracing Value Added in Global Production Chains. National Bureau of Economic Research Working Paper Series No. 16426, 2011.KUWAMORI, H. et al. Compilation and Use of the 2005 International Input-Output Tables. Asian International Input-Output Series, No. 72, Institute of Developing Economies, JETRO, March 2009.LIU, H. et al. China and Brazil Productive Structure and Economic Growth Compared: 1980’s to 2000’s. North American Regional Science Council Annual Conference, 2010.MENG, B. et al. How are Global Value Chains Fragmented and Extended in China’s Domestic Production Networks? IDE Discussion Paper, No 424, 2013.MENG, B.; INOMATA, S. Production Networks and Spatial Economic Interdependence: An International Input-Output Analysis of the Asia-Pacific Region. IDE Discussion Paper, No 185, 2009.MILLER, R. E.; BLAIR, P. D. Input-Output Analysis: Foundations and Extensions. Cambridge University Press, 2009.OECD-WTO. Trade in Value-Added: Concepts, Methodologies and Challenges. 2012.STURGEON, T. et al. O Brasil nas cadeias globais de valor: implicações para a política industrial e de comércio. Revista Brasileira de Comércio Exterior, No 115, 2013.YÜCER et al. Internal and International Vertical Specialization of Brazilian States – An Input-Output Analysis. Forthcoming. 2014
19
AnnexTable A1. Brazilian industries’ exports of value added, in 2005 (2011 US$, thousands)
China India Russia Japan EU25 U.S.A. R.o.W. TotalSector 1 1,894,147 156,508 809,300 800,414 7,805,031 1,511,738 6,678,153 19,655,291Sector 2 92,988 107,747 510,815 224,682 1,344,610 356,647 2,410,540 5,048,028Sector 3 46,110 7,146 18,274 36,091 324,442 299,625 427,448 1,159,137Sector 4 4,335 1,360 6,690 14,328 181,092 109,327 56,692 373,824Sector 5 494,851 63,098 63,988 108,271 1,208,851 1,567,960 4,543,222 8,050,240Sector 6 1,881,370 93,140 54,155 828,081 2,671,427 1,292,118 5,094,519 11,914,812Sector 7 310,684 403,895 1,953,171 787,872 4,797,414 1,173,624 8,608,011 18,034,671Sector 8 202,695 18,611 32,891 121,855 1,457,591 1,935,583 2,716,978 6,486,204Sector 9 167,751 11,802 19,254 148,847 1,443,776 2,422,726 1,309,636 5,523,791Sector 10 323,788 29,441 64,627 207,255 1,804,916 1,062,388 2,800,920 6,293,336Sector 11 567,064 159,453 254,030 393,027 2,979,900 2,248,733 8,378,952 14,981,159Sector 12 221,539 47,428 89,513 126,337 957,951 1,166,897 3,263,677 5,873,342Sector 13 29,969 8,165 10,420 15,845 229,646 310,295 907,756 1,512,095Sector 14 36,488 13,520 17,374 28,057 398,447 983,690 1,194,445 2,672,020Sector 15 738,323 147,403 148,656 641,202 3,921,793 6,009,657 12,733,728 24,340,762Sector 16 255,894 50,255 42,778 86,032 1,197,330 1,851,060 3,965,685 7,449,033Sector 17 18,224 11,633 3,953 12,665 228,007 355,333 900,917 1,530,732Sector 18 81,403 29,459 40,621 36,007 792,102 1,597,341 3,909,674 6,486,607Sector 19 125,425 124,363 67,627 40,797 1,784,725 2,451,766 7,248,441 11,843,144Sector 20 89,013 35,222 65,182 66,597 706,647 923,749 1,990,490 3,876,900Sector 21 451,238 91,072 198,107 286,451 2,051,039 2,086,178 5,305,430 10,469,514Sector 22 29,412 6,000 9,304 12,272 118,664 134,384 374,355 684,390Sector 23 1,720,408 298,227 862,340 1,012,706 7,224,647 5,277,306 14,731,127 31,126,762Sector 24 1,298,516 252,465 520,874 727,432 5,300,462 4,866,310 13,754,791 26,720,849Sector 25 - - - - - - - -
Source: Research data.Note: Calculations based on IDE’s BRICs international input-output table for 2005.
20

Table A2. Brazilian imports of value added by source industry, in 2005 (2011 US$, thousands)China India Russia Japan EU25 U.S.A.
Sector 1 171,142 30,882 3,635 5,539 156,167 27,392Sector 2 74,359 2,635 2,667 949 16,499 15,925Sector 3 18,562 3,244 2,508 1,222 31,497 14,347Sector 4 17,902 1,226 1,028 1,486 6,874 1,458Sector 5 183,552 103,591 282,427 1,352 166,083 218,284Sector 6 232,465 14,814 50,121 2,150 75,699 146,680Sector 7 71,060 5,605 10,109 13,343 267,647 64,222Sector 8 285,887 24,809 2,489 14,224 143,966 42,009Sector 9 38,005 4,372 4,509 7,988 98,209 44,300Sector 10 88,453 5,351 12,846 65,220 370,511 192,311Sector 11 420,332 192,723 381,925 188,689 2,130,862 1,552,887Sector 12 104,106 181,466 88,338 30,207 111,770 35,435Sector 13 46,259 5,100 1,708 40,409 307,810 45,213Sector 14 98,118 8,210 7,144 35,639 175,519 62,276Sector 15 636,626 46,979 113,592 340,220 1,522,360 556,363Sector 16 296,496 20,477 8,730 362,598 1,849,067 729,245Sector 17 448,558 7,958 2,552 337,083 734,325 895,521Sector 18 466,562 11,212 9,718 140,133 735,480 301,704Sector 19 102,894 8,209 9,213 295,760 933,726 615,545Sector 20 219,012 18,483 5,169 67,798 264,908 219,077Sector 21 262,169 15,103 60,999 75,846 307,660 241,652Sector 22 19,624 7,672 12,889 27,175 145,738 60,446Sector 23 1,169,948 268,410 365,325 791,410 2,509,923 1,969,542Sector 24 681,593 85,236 106,603 602,599 3,633,927 2,289,912Sector 25 - - 2,480 2,161 71,559 433
Source: Research data.Note: Calculations based on IDE’s BRICs international input-output table for 2005.
21

Table A3. Final demand system, in 2011 – Based on WIOD’s world input-output table (constant 2011 prices in US$ thousands)Brazil China India Russia Japan EU25 U.S.A. R.o.W.
Brazil 1,826,164,400 25,825,173 2,117,833 4,220,388 8,206,040 63,198,074 30,938,594 88,460,901China 30,523,895 5,572,750,296 53,927,079 51,588,758 133,120,942 331,374,512 338,049,201 600,162,955India 3,233,199 16,347,951 1,483,238,234 4,135,946 8,482,768 68,188,310 56,697,018 71,262,628Russia 4,854,637 42,072,050 4,056,527 1,125,848,980 23,417,725 162,359,282 45,302,350 126,403,981Japan 8,930,581 124,605,302 8,539,900 18,816,385 5,179,144,384 93,636,487 116,640,838 344,470,847EU25 69,762,938 252,906,177 40,260,860 110,999,277 79,042,777 13,307,960,360 434,866,007 1,314,831,201U.S.A. 36,244,588 147,138,206 30,644,109 16,960,131 74,881,951 389,532,858 13,587,173,499 758,580,234ROW 97,790,786 589,718,905 140,987,551 98,502,722 371,810,839 978,647,236 927,114,180 14,670,014,194
Source: Research data.Note: Calculations based on WIOD’s world input-output table for 2011.
22