· Web viewHowever, when comparing labor unions to industries, it is even more evident that...
25
Money and Politics II: Outside Spending and the Relative Economic Power of Conservatives/Industries vs. Liberals/Labor, 2004-2014 Lead Authors: Katy Deng, Paul Frissora, Vu Pham, and Sarah Shine Contributing Authors: Shara Baptiste, Frenk Caushi, Joseph Costner, Erica Feigin, Miguel Garcia, Bill Holloman, Nate Keuter, Sam Luz, Derek Michaud,Chris Najimy, Cass Napolitano, Davit Tvildiani, and Ben Zieff Statement of the Problem In the book Who Rules America? , G. William Domhoff analyzed the conflict of political interests between the corporate community and the liberal-labor alliance. One of the many aspects analyzed is the difference in economic strength between the two groups. The corporate community is more capable of converting its vast economic power into political power. A group of students from last year’s Sociology 033 class wrote about “money and politics”, focusing on the role of political action committees (PACS) and lobbying expenditures. Their findings supported
Transcript of · Web viewHowever, when comparing labor unions to industries, it is even more evident that...

Money and Politics II: Outside Spending and the Relative Economic Power of Conservatives/Industries vs.
Liberals/Labor, 2004-2014
Lead Authors: Katy Deng, Paul Frissora, Vu Pham, and Sarah Shine
Contributing Authors: Shara Baptiste, Frenk Caushi, Joseph Costner, Erica Feigin, Miguel
Garcia, Bill Holloman, Nate Keuter, Sam Luz, Derek Michaud,Chris Najimy, Cass Napolitano,
Davit Tvildiani, and Ben Zieff
Statement of the Problem
In the book Who Rules America?, G. William Domhoff analyzed the conflict of political
interests between the corporate community and the liberal-labor alliance. One of the many
aspects analyzed is the difference in economic strength between the two groups. The corporate
community is more capable of converting its vast economic power into political power. A group
of students from last year’s Sociology 033 class wrote about “money and politics”, focusing on
the role of political action committees (PACS) and lobbying expenditures. Their findings
supported Domhoff’s argument that there is an unequal distribution of economic power between
the corporate community and labor.
One topic that last year’s students neglected was the 2010 Citizens United vs Federal
Elections Commission case. The Supreme Court decision in 2010 had an enormous impact on
money and politics in American society. Domhoff states on the decision: “The escalation in
corporate-related funding reached heights that would not have been believed possible early in
2010. A 5-4 majority of the Supreme Court ruled in Citizens United v. Federal Elections
Commission to uphold a challenge to legal restrictions on donations from corporate funds for

‘independent expenditures’ as a violation of the free speech rights granted to all persons by the
First Amendment”. The Supreme Court made two major rulings: 1) to challenge the restriction of
donations from corporations and unions as a violation of the free speech rights and 2) to the
challenge the ruling by the Court of Appeal that PACs that did not give to parties or candidates
could collect as many funds as they like from corporations and unions. Domhoff examines the
individuals in the Supreme Court: “The Supreme court has reflected the range of acceptable
opinion within the corporate community on the issues of concern to it. The appointees were also
primarily from the upper- and upper-middle classes, and an ‘inordinate number had served as
corporate attorneys before their appointments’. In addition, they also tended to be from elite law
schools, to have abandoned the practice of corporate law for lower-level judicial appointments or
professorships at prestigious law schools, and to have been active in a political party”. In other
words, the Supreme Court is decidedly “pro-corporate”.
In addition, last year’s focus on PACs and lobbying failed to examine another important
type of money in politics: outside spending. Therefore, we will use data made available by Open
Secrets (www.opensecrets.org/outsidespending/ ) on the outside spending activities of
conservatives and liberals, both prior to the Citizens United decision (pre-CU) and after that
decision (post-CU). Actually, Open Secrets aggregates the outside spending data in three
different ways: by group viewpoint (conservative vs. liberal spending), by donor industries
(industries vs. labor spending), and by dark money groups. Consequently, our research will be
conducted in three phases corresponding to these topics. Outside spending is defined by
OpenSecrets.org as “political expenditures made by groups or individuals independently of, and
not coordinated with, candidates' committees”. Such expenditures included electioneering
communications, advertising, and other types of independent expenditures.

PHASE 1: Outside Spending: Liberals vs. Conservatives
Data/Methods
Data were collected for the purpose of analyzing outside spending by conservatives and
liberals by election cycle, 2004-2014. The data on “group viewpoint” are found here:
https://www.opensecrets.org/ https://www.opensecrets.org/outsidespending/summ.php?disp=O.
In order to do this, students were divided up into groups and looked at a specific type of outside
spending. There were six election cycles and seven types of spending: electioneering
communications, single-candidate groups, Super PACs, non-party committees, non-disclosing
groups, single-candidate Super PACs, and independent expenditures. From there, each group
was responsible for making a graph of one of the seven types with all six election cycles
included. The last group was responsible for making a graph that included all types of spending
combining the results from all the other seven groups. All the graphs display two separate bars
(red for conservative and blue for liberal) for each election cycle for the purpose of comparison.
However, this paper will focus on just one graph that includes all types of spending and four
additional graphs that summarize the findings.
Findings

Graph 1 shows conservative and liberal outside spending totals for each election cycle from 2004
to 2014. Prior to the CU decision (2004-2008), spending levels were low and liberals outspent
conservatives. A reversal took place from 2010 on: spending levels increased and conservatives
outspent liberals. Additional noteworthy patterns of money flow can be seen by looking at the
years in which general elections took place—2004, 2008, and 2012. In the 2012 election cycle,
conservatives spent 861.8 million dollars, which is more than double the amount liberal groups
spent in that cycle and almost four times as much as conservative groups had spent in the
previous general election cycle of 2008, and almost 6 times as much as 2004. Clearly, the CU

decision opened the floodgates to conservative outside spending.
Graph 2 shows outside spending by both liberals and conservatives combined, pre- and
post-CU. After the ruling, outside spending nearly doubles, going from $1,268,200,000 to
$2,519,800,000. This is because the Citizens United ruling greatly reduced the amount of
restrictions and regulations that had previously been in place in regards to corporate and labor
spending. One of the justifications given for Citizens United was that it would impact liberal
groups just as much as it would impact conservative groups. Unions, which usually lean left,
would now be allowed to freely spend just as much as conservative groups, according to
conservative pundits. We can assess this “justification” by simply analyzing the ratios of
conservative and liberal spending before and after the Citizens United ruling.

The findings of Graph 3 show that conservative spending increased nearly threefold post-CU;
with the exact ratio of pre and post spending being 2.93. This is contrasted by spending by
liberals, which only increased by 1.32 times after the decision. This shows that the event of
Citizens United benefitted conservatives disproportionately. Their superior economic power
now enables them to outspend liberals by a wide margin.
Next, we can look at the bar graph for outside spending pre and post Citizens United, this
time divided by outside spending by liberals and conservatives.

Graph 4 shows again that, before Citizens United, the outside spending of liberals is higher than
conservatives. After that, however, conservative spending far outpaces that of liberals.
The Table below presents post-CU spending totals of conservatives and liberals broken
down by specific types of spending (see above). It also includes C/L ratios for each type of
spending. These ratios always exceed 1.0, meaning that, for every single type of outside
spending, conservatives have a spending advantage. An interesting point to note is that the
highest ratios (greater than 6) were for electioneering communication (primarily advertising) and
non-disclosing groups (“social welfare” organizations that do not have to disclose their donors),
but that the amount of money spent on the latter far exceeded spending on the former. This
seems to indicate that, after CU, conservatives took particular advantage of the ability to spend
anonymously (so-called “dark money” expenditures – see below).
Table: Ratios of Outside Spending Between Liberals and Conservatives Post Citizens United by
Type of Spending

Conclusion
The purpose of this project was to expand on Domhoff’s analysis of money in politics. Last
year’s students explored the relative economic power of the corporate community
(conservatives) and liberal-labor alliance (liberals) based on PACs and lobbying expenditures but
did not include outside spending. Their data supported the fact that the corporate community
does in fact spend more than the liberal-labor alliance, but only enough to assert that claim for
PACs and lobbying expenditures. An examination of outside spending was needed to further
assess Domhoff’s assertion that the corporate community contributes more than the liberals in
support for elections. Last year’s students also left out the crucial turning point in their analysis,
which was the 2010 Citizens United v. Federal Elections case. The Supreme Court made a
decision that favored the corporate community granting the right to spend unlimited amounts of
money in the form of “expenditures”. The data presented in this paper clearly show that in the
years before the Citizens United decision, the limits placed on spending are reflected in the
contributions made by conservatives and liberals. Conservatives spent a little less than liberals.
However, the years after Citizens United show a huge rise in outside spending from the
conservatives. A rise in spending for liberals also occurred but not as much as the conservatives.
The evidence supports Domhoff’s assertion: the corporate community (conservatives) has far
more economic power than liberals

P hase 2: Labor Vs. Industries in Outside Spending
The previous phase of the project examined outside spending by conservatives and
liberals. However, OpenSecrets.org also provides outside spending data specifically aggregated
by labor unions and industries. While the conservative-liberal and industry-union categories are
similar, there is some value to examining specific data on the latter dichotomy, especially given
Domhoff’s emphasis on the anti-union policy priorities of the corporate community and the
attendant conflict of interests between conservative industries and labor.
Data/Methods
Data were collected for the purpose of analyzing outside spending by labor unions and
industries. In order to do this, students were divided up into groups and looked at six election
cycles, summing up the total amounts of money (in millions) for labor unions and the totals for
selected (i.e., conservatively-oriented) industries. The industries included were: transportation,
miscellaneous business, finance/insurance/real estate, energy/natural resources, defense,
construction, communication/electronics, and agribusiness. Each student group added up the
total amount of spending by these industries and compared that to the amount spent by labor
unions, incorporating this information into bar graphs for each election cycle. Based on the bar
graphs, a summary table was constructed that included the total amounts spent by (a) labor
unions and (b) all industries combined, as well as (c) industry/labor ratios for each election cycle.
Then, using the summary data in the table, we made five graphs that depict the outside spending
patterns of labor unions and industries.

Findings
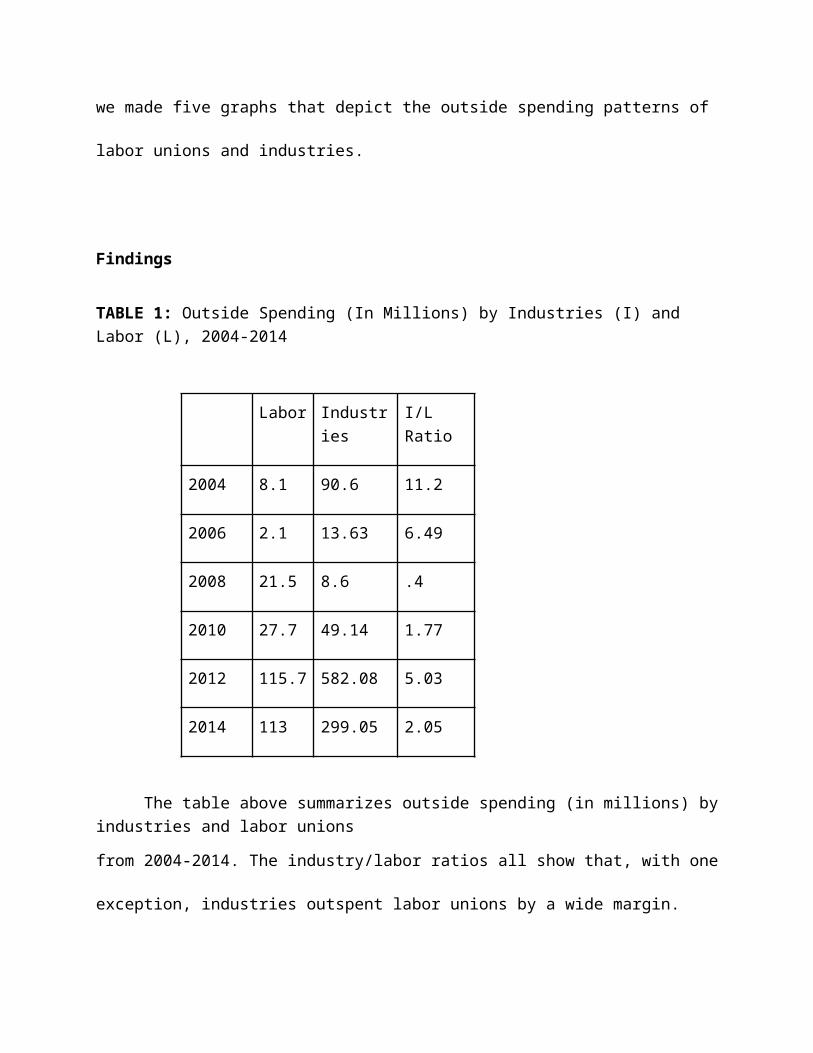
TABLE 1: Outside Spending (In Millions) by Industries (I) and Labor (L), 2004-2014
Labor Industries I/L Ratio
2004 8.1 90.6 11.2
2006 2.1 13.63 6.49
2008 21.5 8.6 .4
2010 27.7 49.14 1.77
2012 115.7 582.08 5.03
2014 113 299.05 2.05
The table above summarizes outside spending (in millions) by industries and labor unions
from 2004-2014. The industry/labor ratios all show that, with one exception, industries outspent
labor unions by a wide margin. The only exception to this would be seen in the 2008 election
year, where the industries-to-labor ratio (8.6/21.5) was .4. Apparently, labor made a special

effort to support the Obama campaign.
Graph 1 compares all outside spending for both industries and labor unions pre and post
Citizens United. The ratio of post/pre CU (1186.7/144.5) is 8.212, meaning that outside
spending increased eight fold after the year 2010. This was the post-Citizens United era,
documenting with precision the opened floodgates to huge outside spending increases after the
Citizens United case.

Graph 2 compares outside spending by just labor unions pre and post Citizens United.
The ratio of post/pre (256.4/31.7) is 8.09, meaning that labor outside spending increased eight
fold after the Citizens United case.
Graph 3 compares outside spending by all industries pre and post Citizens United. The
ratio of post/pre (930.3/112.8) is 8.24, meaning that industry outside spending once again
increased eight fold after the Citizens United case.
Graph 4. Comparing the Outside Spending of Labor (L) and Industries (I), Pre CU
Graph 4 compares the the outside spending of labor and industries pre-Citizens United.
The ratio of industries to labor (112.8/31.7) is 3.56, meaning that industries outspent labor unions
by almost four times even before the crucial Citizens United turning point.
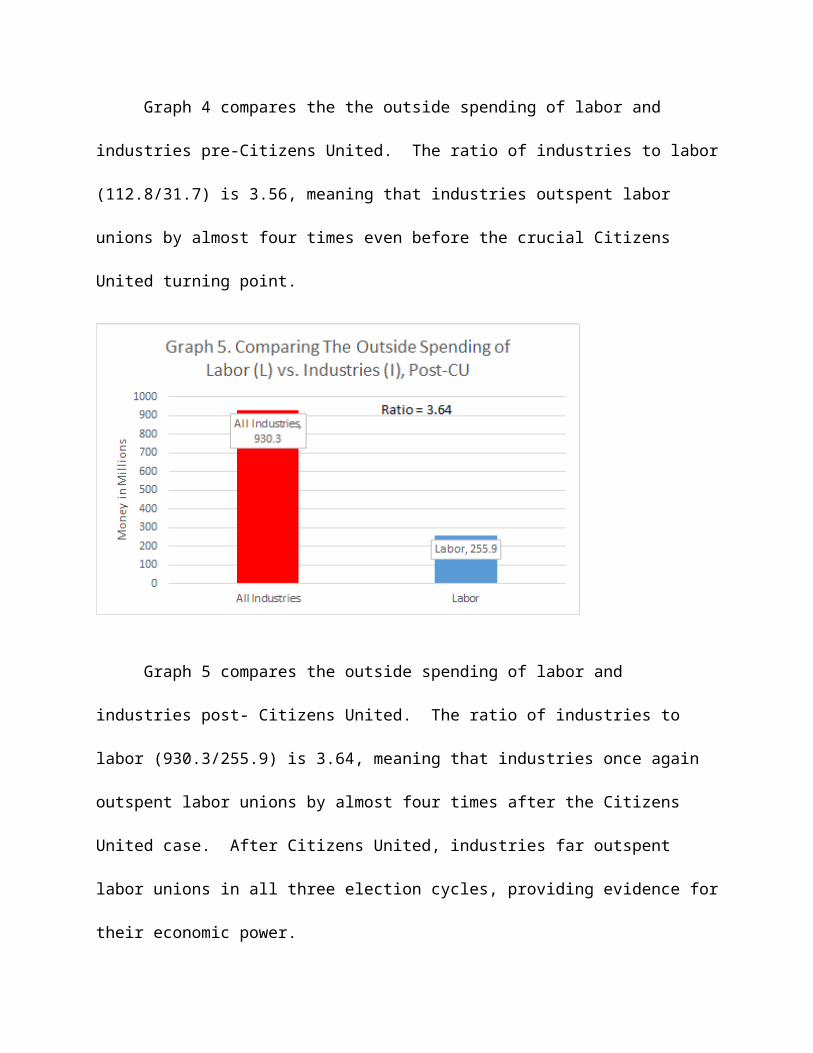
Graph 5 compares the outside spending of labor and industries post- Citizens United.
The ratio of industries to labor (930.3/255.9) is 3.64, meaning that industries once again outspent

labor unions by almost four times after the Citizens United case. After Citizens United,
industries far outspent labor unions in all three election cycles, providing evidence for their
economic power.
Conclusion
The purpose of phase 2 of this project was to analyze outside spending made specifically
by labor unions and industries. From the findings, it is clear that Citizens United permitted both
industries and labor unions to increase their spending, as total outside spending overall increased
by eight fold after 2010. However, when comparing labor unions to industries, it is even more
evident that industries have far more to spend than labor unions because they far outspent unions
by more than three fold, both pre and post Citizens United.
Phase 3: Dark Money Flows
In addition to examining outside spending by (a) conservatives vs. liberals, and (b)
industries vs. unions, we can also study the flow of “dark money” into political campaigns. Dark
money is defined as campaign donations that go to politically-active non-profit organizations.
Dark money, however, is not easily traceable. Post-Citizens United, politically-active non-
profits are allowed to receive unlimited corporate, labor, or individual donations, and
furthermore, are not required to disclose the names of donor organizations. In order to receive
tax advantages, however, the donor organizations must disclose their donations on their tax
forms. Opensecrets presents data on some of the top donors to dark money groups. They sifted
through thousands of IRS990 tax forms (where the donor disclosure occurs) to produce their list
of top donors (see the Table below). While the list of donors is fairly long, and the dark money
flows discovered are substantial, it is important to note that many of the sources/donors to

politically-active nonprofits, as well as much of the money flowing to politically-active
nonprofits, remain unknown.
Shown in the table below is detailed information regarding the spending patterns of the top
several dozen dark money groups by how much they donate to politically-active nonprofits. The
first column in this table lists the full name of the donor organization. The second column details
how much money they gave to conservative recipients, and the third details how much money
went to liberal recipients. The fourth and final column states whether or not the organization is
linked to the Koch Network. The Koch brothers are two ultra-conservative industrialist
billionaires who together spend millions of dollars during election cycles through their various
Super PACS, Think Tanks, and Dark Money groups. Their umbrella-like control over a range of
conservative organizations can be seen through this sociogram (from last year’s class):

In one final element to the table, many cells are shaded in green. This indicates that the group
focused its expenditures on environmental nonprofits. This comes almost exclusively from
liberal dark money groups, as conservatives are far less likely to look positively on
environmental regulations. This table shows some key patterns. Liberal dark money groups have
spent $240,306,684 from 2008 to 2014. This seemingly large number is dwarfed by the total
conservative spending in the same timeframe: $701,204,682. Furthermore, of the total
conservative money spent, $589,997,104 was linked to the Koch network, more than 84% of the
total conservative spending by dark money groups. Meanwhile, of the $240,306,684 spent by
liberal dark money groups, $180,689,894 was spent on environmental organizations, coming to
around 75% of the liberal money spent during that period. With the total money from dark
money groups reaching almost a billion dollars, it is beyond doubt that the flow of this amount of
money into politics has an impact.
Based on this information, it is appropriate to conclude that dark money groups in
America, on both sides of the political spectrum, hold substantial amounts of economic power in
regards to American politics. Not only are dark money groups able to donate unlimited amounts
of money for political expenditures, but their recipients are not required to disclose who gives
them money. By spending far more than liberals, conservatives (members of the corporate
community) take great advantage of the post-Citizens United rulings. (See the table below.)

Dark Money Groups by (a) Ideology, (b) Koch Network Ties,and c) Liberal Environmental Interests, 2008-2014
*Green=environmental spending
Name of Organization Conservative Money Liberal Money Koch LinksFreedom Partners Chamber of Commerce 243,049,000 YCenter to Protect Patient Rights 169,119,455 YSea Change Foundation 0.00 62,219,482 NClimateWorks 0.00 51,500,001 NCrossroads GPS 50,675,000 NTC4 Trust 45,536,800 YAtlantic Advocacy Fund 0.00 42,692,000 NAmericans for Job Security 24,645,750 YAdvocacy Fund 0.00 24,307,616 NWellspring Cmte 16,463,552 YGreen Tech Action Fund 0.00 15,179,988 NDonors Trust 14,133,103.00 YPharmaceutical Research and Manufactureres of America 13,780,000.00 YAmerican Action Network 13,135,000.00 YCellular Telecom and Internal Association 12,278,567.00 NRepublican Jewish Coalition 8,000,000.00 YAmerican Future Fund 7,403,700 YEnvironment America 0.00 7,147,955 NNational Christian Charitable Foundation 5,202,431 NPartnership Action Fund 0.00 5,158,814 NFree Enterprise America 5,057,000.00 NoWisconsin Club for Growth 4,998,735.00 YesAmerica Votes 0.00 4,991,613 NoEvangchr4 Trust 4,785,000.00 YesPartnership Project 4,558,533.00 NoFreedom's Watch 4,469,307.00 NoAlliance for Freedom 4,415,000.00 NoAmerican Justice Partnership 4,372,500.00 NoLeague of Conservation Voters 0.00 3,979,519.00 NoEnvironment California 0.00 3,970,139 NoPriorities USA 0.00 3,400,000 NoAmerica's Families First 0.00 3,379,000 NoAmerican Petroleum Institute 3,225,650 NoJudicial Crisis Network 2,984,000 YesSchwab Charitable Fund 2,960,999 NoAlliance for Climate Protection 0.00 2,755,800 NoAlliance for Quality Nursing Home Care 0.00 2,725,000 NoAnnual Fund 2,634,191 NoCitizenlink 2,536,883 YesFamily Coalition 2,500,000 NoBusiness Roundtable 2,419,500.00 YesCommon Sense 2,300,000.00 YesAction Now Initiative 2,183,500.00 YesWisconsin Manufacturers & Commerce Issue 2,075,600.00 YesFund for the Public Interest 0.00 1,865,000 NoPublic Interest Projects Action Fund 1,850,000.00 YesLynde & Harry Bradley Foundation 1,812,720.00 YesCitizens for a Strong America 1,797,956.00 yesPatriot Majority USA 0.00 1,757,500 NoFreedom & Values Alliance 0.00 1,715,346 NoRockefeller Philanthropy Advisors 1,638,250.00 NoJohn William Pope Foundation 1,525,000.00 YesMichigan Alliance for Business Growth 1,500,000.00 NoEnvironmental Defense Action Fund 0.00 1,388,080 NoNew Models 1,371,500.00 NoCitizens for a Working America 1,260,000.00 YesSierra Club 0.00 1,217,500 NoOpen Society Institute 0.00 1,176,350 No