Complete Sanitation of Dead Nestlings by Parent Birds May Bias Nest Depredation Rates
The effect of early life conditions on song traits in male dippers
(Cinclus cinclus)
Lucy Magoolagan1*, Peter J. Mawby2, Flora A. Whitehead2 and Stuart P. Sharp1
1Lancaster Environment Centre, Lancaster University, Lancaster, UK
2Unaffiliated, Lancaster, UK
*Correspondence:
L. Magoolagan, Lancaster Environment Centre, Lancaster University, Lancaster, LA1 4YQ
Email: [email protected]
Key words: birdsong, male song, developmental stress hypothesis, nutritional stress, parental
care, nestling development.
Word count: 3,852
1
1
2
3
4
5
6
7
8
9
10
11
12
13
14
15

Abstract
Song complexity and singing frequency in male birds are shaped by female choice; they
signal male quality because song is costly to develop and produce. The timing of song learning
and the development of the brain structures involved occur during a period when chicks are
exposed to a number of potential stressors. The quality and quantity of song produced by adults
may therefore reflect the level of stress experienced during early life, a theory known as the
‘developmental stress hypothesis’. We tested this hypothesis using song recordings and life-
history data from an individually marked, long-term study population of wild dippers (Cinclus
cinclus). The extent to which early life conditions predict adult song traits was investigated
using natal brood size as a measure of sibling competition; the rate of provisioning by parents as
a proxy for nutritional stress; and residuals of the linear regression between body mass and
tarsus length as a measure of nestling condition. The syllable diversity in the songs of adult
males was positively correlated with their body condition as nestlings, but there was no
significant correlation with either provisioning rate or brood size. Provisioning rate did,
however, predict song rate; males in relatively poor condition as nestlings or those raised in
smaller broods which were fed more frequently by their parents sang at a higher rate in
adulthood. These results support the developmental stress hypothesis and provide some of the
first evidence from a wild bird of how the conditions experienced during early life impact adult
song. Song traits may therefore provide females with information regarding both the current
condition and developmental history of males.
2
16
17
18
19
20
21
22
23
24
25
26
27
28
29
30
31
32
33
34
35

Introduction
In many bird species, males produce complex songs to defend their territories and
attract a mate, and female choice is thought to be a major driver of the evolution of large song
repertoires (1,2). While several studies have shown that singing is not metabolically demanding
(3,4), the development of the brain structures necessary for learning complex songs is thought to
incur significant energetic costs (5). Furthermore, time spent learning and performing song is
time taken away from other essential activities such as foraging (6) and increases exposure to
predation (7). Females can therefore use song characteristics as measures of male quality
(2,8,9), thereby gaining benefits such as proficient paternal care, territory defence, and ‘good
genes’ for their offspring (2,10,11).
Songbirds have a specialised auditory-vocal area of the forebrain that is responsible for
song learning and production known as the “song system” (7,12). The development of this
region of the brain occurs during the nestling and fledgling period, a time when young birds are
most vulnerable to stress (10,12), and it has been shown that damage to the song system can be
detrimental to adult song production (13). Song learning can therefore be an indicator of early
ontogeny as individuals that have not encountered stress are more likely to have the resources
available to invest in optimal brain development (12). Adult birds may be constrained in the
quality and quantity of the song they are able to produce because the costs of stress experienced
during development cannot be compensated for later in life (8,10,14–17). Originally proposed
as the ‘nutritional stress hypothesis’ (12), this idea is now known as the ‘developmental stress
hypothesis’ to incorporate all of the different stressors which young birds are exposed to (8).
Many studies have found evidence to support the developmental stress hypothesis by
using dietary manipulation or the administration of the stress hormone corticosterone, and
testing for negative effects of these treatments on song characteristics in adulthood (18).
Examples include: European starlings (Sturnus vulgaris; 8,19), zebra finches (Taeniopygia
guttata; 9,20–22), swamp sparrows (Melospiza georgiana; 5) and song sparrows (Melospiza
3
36
37
38
39
40
41
42
43
44
45
46
47
48
49
50
51
52
53
54
55
56
57
58
59
60
61

melodia; 23). However, most research has involved captive birds and there are very few reports
of a link between early life conditions and song traits in wild bird populations. One exception is
a study of male blue tits (Cyanistes caeruleus), in which individuals raised in experimentally
enlarged broods were shown to sing shorter strophe bouts than those from reduced broods (17).
Two further studies have used body size measurements as a proxy for early life stress; the
length of the innermost primary feather of nestling great reed warblers (Acrocephalus
arundinaceus) was positively correlated with adult repertoire size (10), whereas adult tarsus
length, a known correlate of nestling tarsus, was found to correlate with repertoire size in blue
tits (16).
In this paper, we provide one of the first tests of whether a wider range of early life
conditions predict adult song traits in a wild bird, the white-throated dipper (hereafter ‘dipper’;
Cinclus cinclus). Dippers are riverine passerines which sing highly complex songs (24). It has
previously been shown that unpaired males recorded early in the breeding season and assumed
to be attempting to attract a mate use a larger number of unique syllables within their songs and
sing at a higher rate than paired males (24). These song characteristics are likely to be favoured
by potential mates because female birds are known to prefer exaggerated acoustic traits in males
(15,25). Here, we test the developmental stress hypothesis by investigating whether these key
song characteristics, syllable diversity (as a proxy for repertoire size), song versatility and song
rate, are influenced by the conditions individuals experience as nestlings.
4
62
63
64
65
66
67
68
69
70
71
72
73
74
75
76
77
78
79
80

Methods
Study population
Data were collected between January 2014 and June 2016 in an individually marked
population of 40-50 pairs of dippers in the River Lune catchment near Sedbergh, Cumbria, UK
(54⁰323’N, 2⁰528’W). Individuals in this population are given a unique combination of three
plastic colour rings and a standard British Trust for Ornithology metal ring. Each year, all nests
in the study site are closely monitored to establish parental identity, the timing and outcome of
reproduction and a number of behavioural and life-history traits. Nestlings are ringed and
measured when they are nine days old. Measurements include tarsus length (± 0.1 mm) or
‘maximum tarsus’ which is the length of the tarsometatarsus, measured using dial callipers; and
body mass (± 0.1 g) taken using electronic scales. Adults are trapped for ringing and measuring
using mist nets or hand nets placed over the nest; any first-year birds which were ringed as
nestlings and have recruited into the population are also trapped so that they can be measured.
Fully grown birds can be sexed according to their wing length (± 0.5 mm), taken from the carpal
joint to the end of the longest primary on a closed wing using a capped wing rule (26,27); for
most individuals, sexing could be confirmed from observations of reproductive behaviour (e.g.
incubation is carried out by the female only; 28) and in no cases was there a discrepancy
between the two methods.
Song recording and analysis
Songs from 18 adult males born within the study site were recorded opportunistically
from distances of 10-15m using a Sennheiser ME66-K6 shotgun microphone with a Rycote
Softie windshield and a standard pistol grip connected to a Marantz PMD661 MKII solid state
recorder with a sampling frequency of 44.1 kHz; files were stored in WAV format. It was not
5
81
82
83
84
85
86
87
88
89
90
91
92
93
94
95
96
97
98
99
100
101
102
103
104

possible to measure the true size of an individual’s repertoire of syllables due to the apparent
complexity and improvised nature of dipper song; the more recordings made, the more unique
syllables were identified. We therefore measured the number of unique syllables produced in a
standardised sample of 10 songs, hereafter ‘syllable diversity’, as a proxy for repertoire size.
Ten was the minimum number of songs recorded for each individual after those with low signal
to noise ratio had been excluded; if more songs were available, then the first 10 were selected so
that all songs from any given individual were recorded within the same breeding stage (see
below for the categorisation of stages). Spectrograms were produced using Avisoft SASLab
Pro, version 5.2.08 (29), with a 512-point fast Fourier transform length and Hamming window
function, 75% frame size, a 87.5% window overlap, 86 Hz frequency resolution and 1.45 ms
time resolution. All songs were also high pass filtered at 1 kHz to remove low frequency
background noise (e.g. the sound of the river); this threshold was chosen because preliminary
analyses revealed that a small number of Dipper songs contained elements as low as 1.03 kHz
(24).
Syllable diversity was measured using visual and auditory inspections of spectrograms
to count the number of unique syllables produced across 10 songs (24). ‘Versatility’ is another
measure of song complexity and was calculated by dividing the number of unique syllables
found within one song by the total number of syllables found in that song (30); this value was
then averaged across each of an individual’s 10 songs. ‘Song rate’ was calculated using the
number of complete songs produced within a 30-minute period of observation for each
individual during which the bird sang at least once, starting at the time when the bird was first
observed singing; if more than one observation was available, the first was used. Previous work
has shown that these three song traits vary between males recorded at different stages of the
reproductive cycle (24), and the same three mutually exclusive breeding stages were classified
here: (1) ‘solo’ songs were those of individuals recorded in January or February that had yet to
be seen with a partner; (2) ‘pre-breeding’ songs were given by individuals that had been seen
with the same partner on at least two occasions foraging, prospecting or nest-building together;
and (3) ‘breeding’ songs were those of individuals which had paired up and had nests at the
6
105
106
107
108
109
110
111
112
113
114
115
116
117
118
119
120
121
122
123
124
125
126
127
128
129
130
131
132
laying, incubation or nestling stage. Insufficient recordings were available to include songs from
the same male recorded at different breeding stages. For more details of the song recording and
analysis procedures, see (24).
Provisioning rate
Offspring provisioning rates were measured during 1 h nest observations conducted at
least 15 m from the nest and using a portable hide if no natural hiding place was available. In a
small number of cases, manual observations were not possible (e.g. if the nest was inside a
culvert) and so recordings were made using a Panasonic HC-V160 video camera placed at least
5 m from the nest. For both manual observations and video recordings, the 1 h observation
period did not begin until after the first time an adult visited the nest. This minimised the effect
of observer or camera presence on provisioning rates, although very few birds ever seemed
aware of the observer or camera and in the vast majority of cases offspring provisioning took
place within a few minutes of the observer hiding or leaving the camera in place. Provisioning
rates were measured by simply counting the total number of feeds made by the two parents
during the hour. For each nest, observations were conducted between dawn and noon once in
each of the three weeks of the nestling period: on day 2, day 10 or 11, and day 17 or 18.
Statistical analyses
General or generalised linear models were used to test whether syllable diversity
(Gaussian error structure), versatility (Gaussian error structure) and song rate (Poisson error
structure) in adulthood were predicted by the conditions experienced during early life. These
explanatory variables included natal brood size (as a measure of sibling competition), parental
provisioning rate (as a measure of nutritional stress, whether mediated by parental investment or
food availability) and body condition when nine days old. The breeding stage of the male at the
time of song recording was also fitted to account for previously shown effects (24) and the age
7
133
134
135
136
137
138
139
140
141
142
143
144
145
146
147
148
149
150
151
152
153
154
155
156
157
158
of the male was fitted to control for potential changes in song characteristics with age. ‘Brood
size’ was recorded as the highest number of nestlings within the individual’s natal nest at any
time during the nestling period, but then input into the models as a factor due to limited
variation: ‘small’ or ‘large’ according to whether it was above or below the mean (mean brood
size = 4.39; mean ± SD small brood size = 3.38 ± 0.74; large brood size = 5.17 ± 0.40).
‘Provisioning rate’ was the mean of the provisioning rates from the three observation periods.
‘Body condition’ was calculated using the residuals from a linear regression of the body mass
and tarsus length of nestlings when nine days old; this is a widely used measure of condition
(e.g. 31). ‘Age’ was measured as a factor as the bird’s age at the time of song recording, either
‘first-year’ or ‘adult’. ‘Breeding stage’ was also a factor relating to the time of recording: ‘solo’,
‘pre-breeding’ or ‘breeding’ as described above. Prior to analysis, all variables were centred and
standardised to improve interpretation of main effects (32). Collinearity between explanatory
variables was checked using pairwise scatterplots, correlation coefficients and variance inflation
factors (33). All variables were considered because there was no collinearity between them (r <
0.4 in all cases) and variance inflation factors were small (< 3; 31). These five explanatory
variables were fitted in the full model along with the interactions between all pairs of early life
variables. All models were constructed in R, version 3.2.2 (34), and the full model for each song
trait was subjected to the ‘dredge’ function in the package ‘MuMIn’ (35) to rank all sub-models
by Akaike's Information Criterion, with the Hurvich and Tsai correction for small sample size
(AICc; 34,35). If ∆AICc ≤ 2 between two or more of the most parsimonious models, model
averaging was performed using MuMIn. Models were checked for overdispersion and validated
by plotting the distribution of the residuals, the residuals versus the fitted values and the
residuals versus each of the covariates (38).
8
159
160
161
162
163
164
165
166
167
168
169
170
171
172
173
174
175
176
177
178
179
180
181
182

Results
Syllable diversity
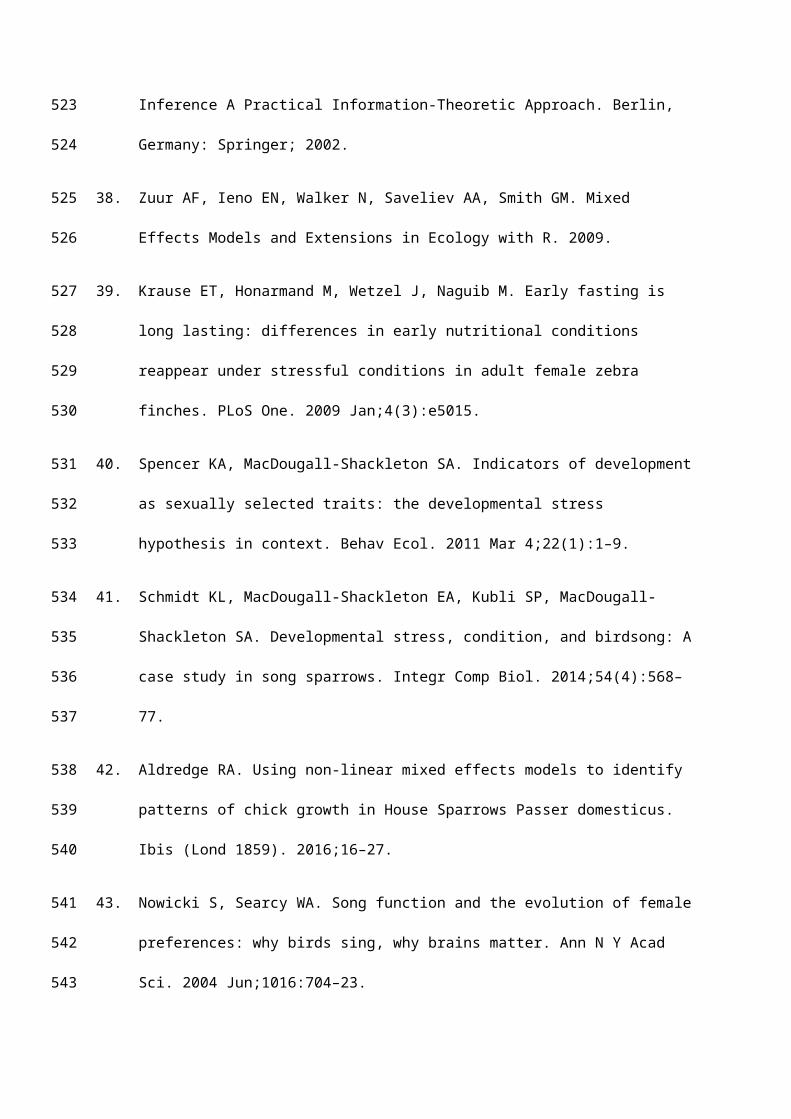
The syllable diversity of adult male dippers was predicted by their body condition as
nestlings; males in better condition when nine days old produced a greater number of unique
syllables within their adult songs (Table 1, Figure 1). No other variables were contained within
the best fitting models (Tables 1 and S1).
Figure 1. The relationship between nestling body condition and syllable diversity in adult
song.
The line shows the predicted relationship from averaging of the best fitting general linear
models; the raw data are plotted as points. The 95% confidence interval is shown in grey.
9
183
184
185
186
187
188
189
190
191
192
193

Table 1. The best fitting general linear models of the factors associated with adult male syllable diversity:
lm(syllable diversity ~ age + body condition + brood size + breeding stage + provisioning rate + body condition : brood size + body condition : provisioning rate + brood size : provisioning rate)
Only those models with an AICc value within 2 of that of the best fitting model are shown. For the full list of models see Table S1.
Model #
(Intercept) Age Body condition
Brood size
Breeding stage
Provisioning rate
Body condition x Brood size
Body condition x Provisioning rate
Brood size x Provisioning rate
df loglik AICc Delta Weight
1 69.83 12.03 3 -81.07 169.8 0.00 0.28
2 91.00 2 -83.33 171.5 1.61 0.13
10
194
195196
197

Versatility
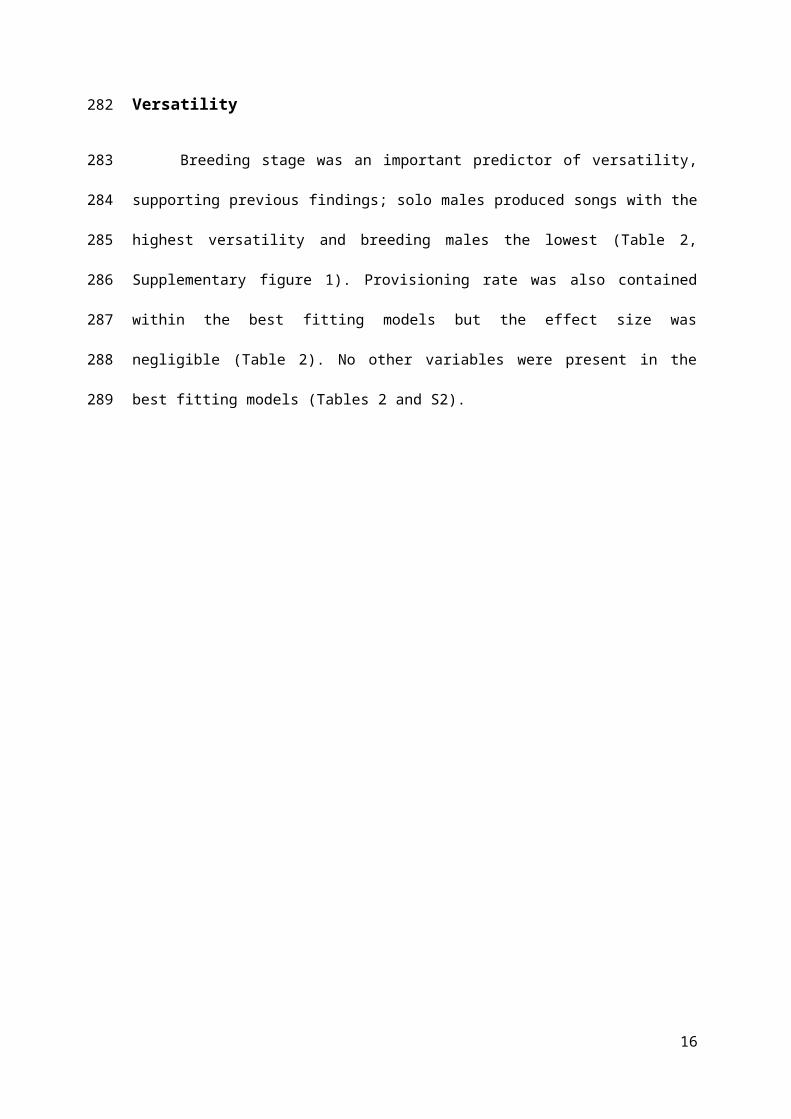
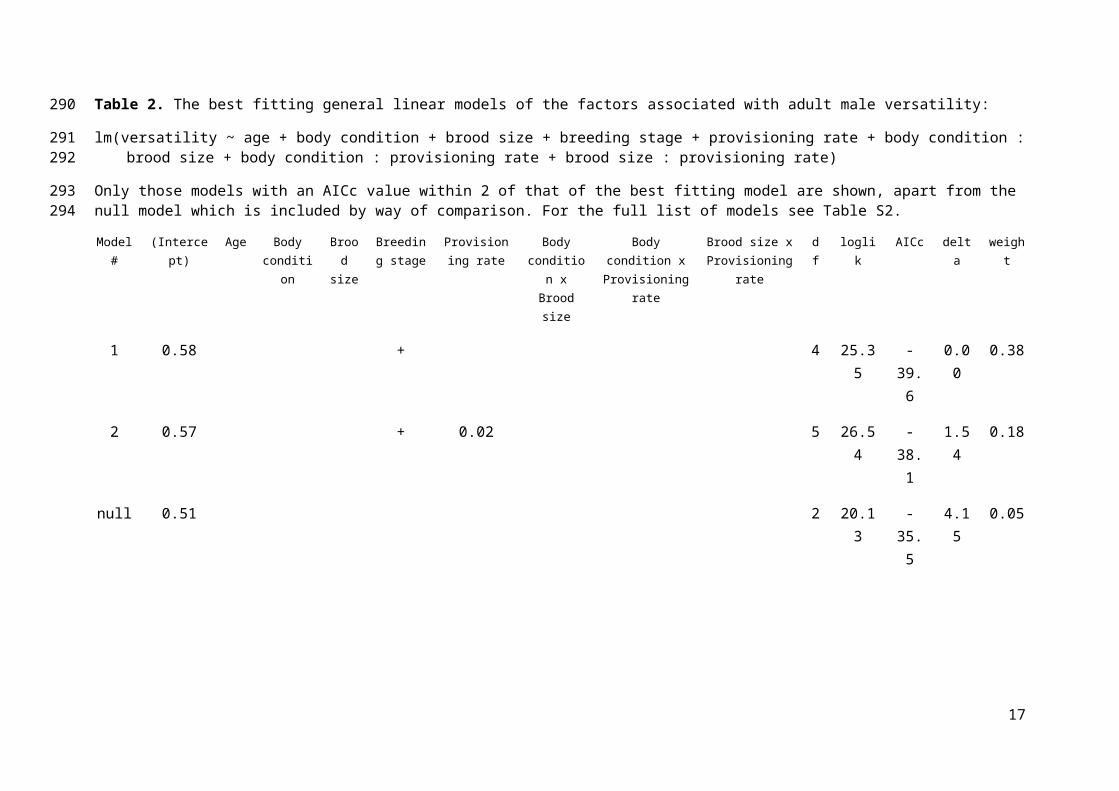
Breeding stage was an important predictor of versatility, supporting previous findings;
solo males produced songs with the highest versatility and breeding males the lowest (Table 2,
Supplementary figure 1). Provisioning rate was also contained within the best fitting models but
the effect size was negligible (Table 2). No other variables were present in the best fitting
models (Tables 2 and S2).
11
198
199
200
201
202
203
Table 2. The best fitting general linear models of the factors associated with adult male versatility:
lm(versatility ~ age + body condition + brood size + breeding stage + provisioning rate + body condition : brood size + body condition : provisioning rate + brood size : provisioning rate)
Only those models with an AICc value within 2 of that of the best fitting model are shown, apart from the null model which is included by way of comparison. For the full list of models see Table S2.
Model #
(Intercept) Age Body condition
Brood size
Breeding stage
Provisioning rate
Body condition x Brood size
Body condition x Provisioning rate
Brood size x Provisioning rate
df loglik AICc delta weight
1 0.58 + 4 25.35 -39.6 0.00 0.38
2 0.57 + 0.02 5 26.54 -38.1 1.54 0.18
null 0.51 2 20.13 -35.5 4.15 0.05
12
204
205206
207208

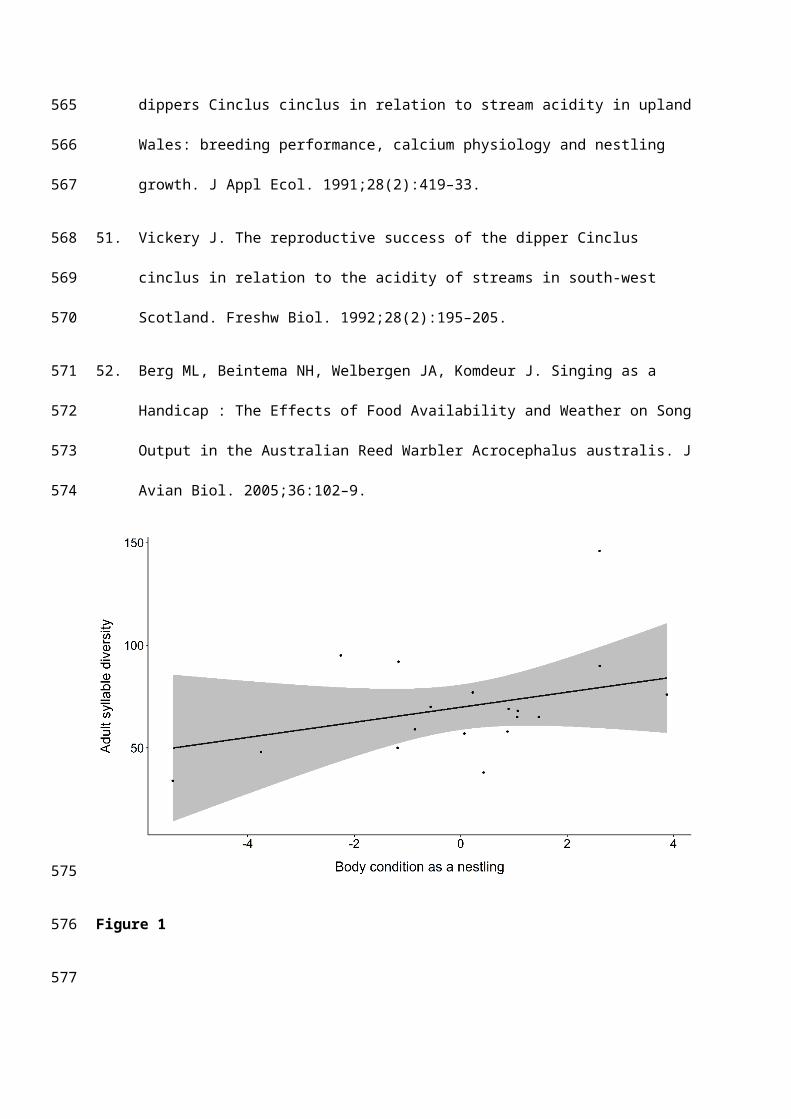
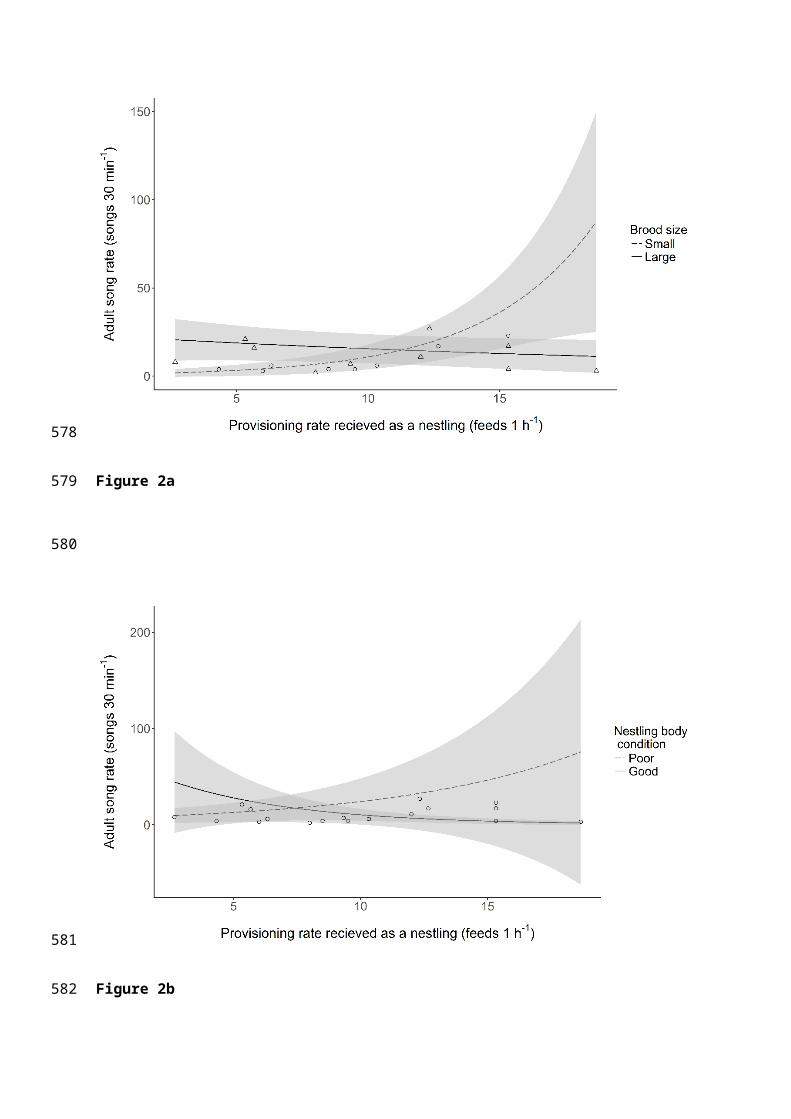
Song rate
The song rate of males was predicted by the rate at which they were provisioned as
nestlings; birds fed at a higher rate by their parents sang at a higher rate as adults (Table 3).
However, the best fitting models of song rate also contained the interactions between
provisioning rate and both body condition and brood size; the effect of provisioning rate on
song rate was greater for individuals in poorer condition and for those raised in small broods
(Table 3; Figs 2a and 2b). Song rate also varied with breeding stage, confirming previous
findings; solo males sang at a higher rate than pre-breeding and breeding males (Table 3). No
other terms were contained within the best fitting models (Tables 3 and S3).
Figure 2. The relationship between the rate at which nestlings were provisioned and their
song rate as adults.
The lines show the predicted relationships from averaging of the best fitting generalised linear
models, plotted for ‘solo’ breeding stage, with the 95% confidence intervals shown in grey. (a)
The dashed line shows the relationship for birds raised in small broods (< 4.39 nestlings, raw
data plotted as circles) and the solid line shows the same relationship for nestlings in large
broods (> 4.39 nestlings, raw data plotted as triangles), both plotted for mean nestling body
condition (-1.23 x 10⁻¹⁷). (b) The solid line shows the relationship for nestlings in good
condition on day 9 (mean condition + 1 SD) and the dashed line shows the same relationship for
nestlings in poor condition on day 9 (mean condition – 1 SD), both plotted for large broods
(>4.39 nestlings); the raw data are plotted as points.
13
209
210
211
212
213
214
215
216
217
218
219
220
221
222
223
224
225
226
227
228
229
230

Table 3. The best fitting generalised linear models of the factors associated with adult male song rate:
glm(song rate ~ age + body condition + brood size + breeding stage + provisioning rate + body condition : brood size + body condition : provisioning rate + brood size + provisioning rate, family = “poisson”)
Only those models with an AICc value within 2 of that of the best fitting model are shown, apart from the null model which is included by way of comparison. For the full list of models see Table S3.
Model #
(Intercept) Age Body condition
Brood size
Breeding stage
Provisioning rate
Body condition x Brood size
Body condition x Provisioning
rate
Brood size x Provisioning
rate
df loglik AICc delta weight
1 2.09 -0.09 + 1.16 -0.28 + 6 -59.17 138.0 0.00 0.42
2 2.63 -0.25 + + 1.00 -0.35 + 8 -53.21 138.4 0.45 0.34
null 2.32 1 -84.6 171.5 33.5 0
14
231
232233
234235
236

Discussion
The conditions individuals experience during the early part of their lives have been shown to
impact a range of life history variables and phenotypic traits in adulthood (39,40), including
behavioural traits such as birdsong (19,41). Our results demonstrate that song traits in male dippers
are correlated with early life conditions and provide some of the first evidence from a wild bird
population to support the developmental stress hypothesis (8,12). This hypothesis proposes that song
production and complexity may be compromised by exposure to stress during the nestling period as
this is when the brain structures responsible develop (5,8,12). Nestling body condition, which likely
reflects nutritional stress, was positively correlated with syllable diversity, a proxy for repertoire size;
this supports the findings of several experimental studies of captive birds in which the quality of
nestling diet was manipulated (9,19,21). The nestling phase is a critical period of growth for birds
(42), and individuals in poorer condition at this time are presumably unable to invest as heavily in the
development of the brain structures associated with song learning (5,43). Such birds would be unable
to learn and produce as many different syllables, hence syllable diversity may provide females with an
honest signal of male quality (2,8,9). Interestingly, versatility was found to vary with breeding stage
but was not correlated with any of the measures of early life conditions. Solo and pre-breeding males
sing with higher versatility than breeding males (24), suggesting that individuals are able to vary the
use of their repertoires according to context even if the size of their repertoire is constrained by
developmental stress. However, further research is needed to explore these ideas, in particular the
analysis of songs recorded from the same males at different breeding stages.
The rate at which male dippers were fed as nestlings was an important predictor of their song
rate as adults. In contrast to syllable diversity, song rate is usually considered a plastic trait associated
with the current condition of an individual, rather than developmental history (41,44,45, but see 8).
However, it is often reported that developmental stress can cause long-term damage and have a
negative effect on adult phenotypes, thereby affecting an individual’s ability to cope in their current
environment (40). For example, zebra finch chicks that were raised on a poor quality diet exhibited
15
237
238
239
240
241
242
243
244
245
246
247
248
249
250
251
252
253
254
255
256
257
258
259
260
261
262
increased resting metabolic rates as adults (46); this leads to an increase in daily food demand, which
in turn may increase the time an individual spends foraging and decrease the time spent performing
other behaviours such as singing (46). Individual song sparrows experiencing less stress during
development were found to have better body condition as adults (47), and condition directly affects
song output because only individuals with sufficient energy reserves are able to sustain high song
rates (45).
As with all altricial species, dipper chicks are completely dependent upon their parents for
food for the duration of the nestling period (28,48). An increase in foraging time and the associated
decrease in foraging success has been shown to cause reductions in clutch size, brood size, egg mass,
nestling mass, growth rates and survival rates (49–51). Provisioning rate is therefore likely to have a
major effect on the growth and development of each individual, and this may be greater in smaller
broods where the per capita effect of a change in food availability is higher. Our results show that
individuals raised in small broods which were fed more frequently sang at a higher rate as adults,
presumably because the additional resources available to these birds as chicks allowed them to
maintain better body condition later in life (5,43). The apparent absence of this effect in larger broods
may be due to sibling competition offsetting the benefits of an increase in provisioning rate. Similarly,
the positive correlation between provisioning rate and song rate in individuals whose nestling body
condition was relatively poor suggests that nutritional stress in early life impacts the condition-
dependent investment in singing behaviour of adults. While some studies have suggested that singing
is energetically inexpensive (3,4), adult condition has been shown to be positively correlated with
song rate in several species (2,45,52). Our study is the first to provide evidence that early life
conditions can influence song rate as well as complexity in wild birds, and further work is now
required to investigate the mechanisms behind these relationships.
16
263
264
265
266
267
268
269
270
271
272
273
274
275
276
277
278
279
280
281
282
283
284
285
286
287
288
Acknowledgements
We would like to thank the many local landowners and Paul Wilkinson at Yorkshire Dales
National Park for providing access and supporting our work; all the students and volunteers who
provided assistance in the field, especially Tess Moore; Robert Lachlan for advising on acoustic
analyses; and Mark Mainwaring, Rupert Marshall and Jos Barlow for comments on an earlier draft.
This work was approved by the relevant ethics committee at Lancaster University and complied with
the current laws of the UK.
17
289
290
291
292
293
294
295
296
297

References
1. Searcy WA, Yasukawa K. Song and Female Choice. Ecology and Evolution of Acoustic
Communication in Birds. 1996.
2. Catchpole CK, Slater PJB. Bird song-biological themes and variations. Cambridge Universty
Press; 2008.
3. Franz M, Goller F. Respiratory patterns and oxygen consumption in singing zebra finches. J
Exp Biol. 2003;206(Pt 6):967–78.
4. Ward S, Speakman JR, Slater PJB. The energy cost of song in the canary, Serinus canaria.
Anim Behav. 2003;66:893–902.
5. Nowicki S, Searcy WA, Peters S. Brain development, song learning and mate choice in birds:
a review and experimental test of the “nutritional stress hypothesis”. J Comp Physiol A. 2002
Dec;188(11–12):1003–14.
6. Oberweger K, Goller F. The metabolic cost of birdsong production. J Exp Biol.
2001;204(19):3379–88.
7. Gil D, Gahr M. The honesty of bird song: multiple constraints for multiple traits. Trends Ecol
Evol. 2002 Mar;17(3):133–41.
8. Buchanan KL, Spencer K a, Goldsmith AR, Catchpole CK. Song as an honest signal of past
developmental stress in the European starling (Sturnus vulgaris). Proc Biol Sci. 2003 Jun
7;270(1520):1149–56.
9. Spencer KA, Buchanan KL, Goldsmith AR, Catchpole CK. Song as an honest signal of
developmental stress in the zebra finch (Taeniopygia guttata). Horm Behav. 2003
Aug;44(2):132–9.
10. Nowicki S, Hasselquist D, Bensch S, Peters S. Nestling growth and song repertoire size in
298
299
300
301
302
303
304
305
306
307
308
309
310
311
312
313
314
315
316
317
318
319
320

great reed warblers: evidence for song learning as an indicator mechanism in mate choice.
Proc Biol Sci. 2000 Dec 7;267(1460):2419–24.
11. Jones AG, Ratterman NL. Mate choice and sexual selection: What have we learned since
Darwin? Proc Natl Acad Sci. 2009;106(Supplement_1):10001–8.
12. Nowicki S, Peters S, Podos J. Song Learning, Early Nutrition and Sexual Selection in
Songbirds. Integr Comp Biol. 1998;38(1):179–90.
13. Nottebohm F, Stokes TM, Leonard CM. Central control of song in the canary. J Comp Neurol.
1976;165:457–86.
14. Buchanan KL, Catchpole CK. Song as an indicator of male parental effort in the sedge
warbler. Proc Biol Sci. 2000 Feb 22;267(1441):321–6.
15. Catchpole CK. Song and female choice: good genes and big brains? Trends Ecol Evol.
1996;11(9):358–60.
16. Doutrelant C, Blondel J, Perret P, Lambrechts MM. Blue Tit song repertoire size, male quality
and interspecific competition. J Avian Biol. 2000 Sep;31(3):360–6.
17. Dreiss A, Richard M, Moyen F, White J, Møller AP, Danchin E. Sex ratio and male sexual
characters in a population of blue tits, Parus caeruleus. Behav Ecol. 2006;17(1):13–9.
18. Drummond H, Ancona S. Observational field studies reveal wild birds responding to early-life
stresses with resilience, plasticity, and intergenerational effects. Auk. 2015;132(3):563–76.
19. Spencer KA, Buchanan KL, Goldsmith AR, Catchpole CK. Developmental stress, social rank
and song complexity in the European starling (Sturnus vulgaris). Proc R Soc B Biol Sci.
2004;271(Suppl 3):S121-3.
20. De Kogel CH, Prijs HJ. Effects of brood size manipulations on sexual attractiveness of
offspring in the zebra finch. Anim Behav. 1996;51(3):699–708.
321
322
323
324
325
326
327
328
329
330
331
332
333
334
335
336
337
338
339
340
341
342
343

21. Buchanan KL, Leitner S, Spencer K a, Goldsmith AR, Catchpole CK. Developmental stress
selectively affects the song control nucleus HVC in the zebra finch. Proc Biol Sci.
2004;271(1555):2381–6.
22. Brumm H, Zollinger SA, Slater PJB. Developmental stress affects song learning but not song
complexity and vocal amplitude in zebra finches. Behav Ecol Sociobiol. 2009 Jul;63(9):1387–
95.
23. Schmidt KL, Moore SD, MacDougall-Shackleton EA, MacDougall-Shackleton SA. Early-life
stress affects song complexity, song learning and volume of the brain nucleus RA in adult
male song sparrows. Anim Behav. Elsevier Ltd; 2013 Jul;86(1):25–35.
24. Magoolagan L, Mawby PJ, Whitehead F, Sharp SP. The structure and context of male and
female song in dippers (In Review). J Ornithol. 2018;
25. Nowicki S, Searcy WA, Peters S. Quality of song learning affects female response to male bird
song. Proc Biol Sci. 2002 Sep 22;269(1503):1949–54.
26. Andersson JS, Wester SAL. Length of wing, bill, and tarsus as a character of sex in the Dipper
Cinclus cinclus. Ornis Scand. 1971;2(1):75–9.
27. Svensson L. Identification Guide to European Passerines. Fourth. British Trust for
Ornithology; 1992.
28. Tyler SJ, Ormerod SJ. The Dippers. First. T & AD Poyser Ltd; 1994.
29. Specht R. Avisoft-SASLab Pro. 1993.
30. Järvi T. The evolution of song versatility in the willow warbler Phylloscopus trochilus: A case
of evolution by intersexual selection explained by the “female’s choice of the best mate”.
Ornis Scand. 1983;14(2):123–8.
31. Schulte-Hostedde AI, Zinner B, Millar JS, Hickling GJ. Restitution of Mass – Size Residuals :
Validating Body Condition Indices. Ecology. 2005;86(1):155–63.
344
345
346
347
348
349
350
351
352
353
354
355
356
357
358
359
360
361
362
363
364
365
366
367

32. Schielzeth H. Simple means to improve the interpretability ofregression coefficients. Methods
Ecol Evol. 2010;1:103–13.
33. Zuur AF, Ieno EN, Elphick CS. A protocol for data exploration to avoid common statistical
problems. Methods Ecol Evol. 2010 Mar 13;1(1):3–14.
34. R Core Team, R Development Core Team R. R: A Language and Environment for Statistical
Computing. Team RDC, editor. R Foundation for Statistical Computing. Vienna, Austria: R
Foundation for Statistical Computing; 2015. p. 409.
35. Barton K. MuMIn: Multi-Model Inference. 2016.
36. Hurvich CM, Tsai C. Biometrika Trust Regression and Time Series Model Selection in Small
Samples. Biometrika. 1989;76(2):297–307.
37. Burnham KP, Anderson DR. Model Selection and Multimodel Inference A Practical
Information-Theoretic Approach. Berlin, Germany: Springer; 2002.
38. Zuur AF, Ieno EN, Walker N, Saveliev AA, Smith GM. Mixed Effects Models and Extensions
in Ecology with R. 2009.
39. Krause ET, Honarmand M, Wetzel J, Naguib M. Early fasting is long lasting: differences in
early nutritional conditions reappear under stressful conditions in adult female zebra finches.
PLoS One. 2009 Jan;4(3):e5015.
40. Spencer KA, MacDougall-Shackleton SA. Indicators of development as sexually selected
traits: the developmental stress hypothesis in context. Behav Ecol. 2011 Mar 4;22(1):1–9.
41. Schmidt KL, MacDougall-Shackleton EA, Kubli SP, MacDougall-Shackleton SA.
Developmental stress, condition, and birdsong: A case study in song sparrows. Integr Comp
Biol. 2014;54(4):568–77.
42. Aldredge RA. Using non-linear mixed effects models to identify patterns of chick growth in
House Sparrows Passer domesticus. Ibis (Lond 1859). 2016;16–27.
368
369
370
371
372
373
374
375
376
377
378
379
380
381
382
383
384
385
386
387
388
389
390
391
43. Nowicki S, Searcy WA. Song function and the evolution of female preferences: why birds
sing, why brains matter. Ann N Y Acad Sci. 2004 Jun;1016:704–23.
44. Møller A, Thornhill R. Male parental care, differential parental investment by females and
sexual selection. Anim Behav. 1998 Jun;55(6):1507–15.
45. Grunst ML, Grunst AS. Song complexity, song rate, and variation in the adrenocortical stress
response in song sparrows (Melospiza melodia). Gen Comp Endocrinol. 2014;200:67–76.
46. Criscuolo F, Monaghan P, Nasir L, Metcalfe NB. Early nutrition and phenotypic development:
“catch-up” growth leads to elevated metabolic rate in adulthood. Proc R Soc B Biol Sci.
2008;275(1642):1565–70.
47. Pfaff JA, Zanette L, MacDougall-Shackleton SA, MacDougall-Shackleton EA. Song repertoire
size varies with HVC volume and is indicative of male quality in song sparrows (Melospiza
melodia). Proc R Soc London B Biol Sci. 2007;274(1621):2035–40.
48. O’Connor RJ. The Growth and Development of Birds. Chichester: J. Wiley; 1984.
49. Ormerod SJ, Tyler SJ. Long-term change in the suitability of welsh streams for dippers
Cinclus cinclus as a result of acidification and recovery: a modelling study. Environ Pollut.
1989;62(2–3):171–82.
50. Ormerod SJ, O’Halloran J, Gribbin SD, Tyler SJ. The ecology of dippers Cinclus cinclus in
relation to stream acidity in upland Wales: breeding performance, calcium physiology and
nestling growth. J Appl Ecol. 1991;28(2):419–33.
51. Vickery J. The reproductive success of the dipper Cinclus cinclus in relation to the acidity of
streams in south‐west Scotland. Freshw Biol. 1992;28(2):195–205.
52. Berg ML, Beintema NH, Welbergen JA, Komdeur J. Singing as a Handicap : The Effects of
Food Availability and Weather on Song Output in the Australian Reed Warbler Acrocephalus
australis. J Avian Biol. 2005;36:102–9.
392
393
394
395
396
397
398
399
400
401
402
403
404
405
406
407
408
409
410
411
412
413
414
415

Figure 1
Figure 2a
416
417
418
419
420
421

Figure 2b
422
423
424

SUPPORTING INFORMATION
Table S1. Model selection table for global model:
lm(Repertoire ~ Context + Age + Provisioning rate + Brood size + Tarsus length + Provisioning rate * Tarsus length + Brood size * Tarsus length)
(Intercept) Age Brood size
Context Provisioning rate
Tarsus length
Brood size x Tarsus length
Provisioning rate x Tarsus length
df LogLik AICc Delta Weight
1 69.83 2 -83.33 171.46 0.00 0.25
5 91.00 + 4 -80.87 172.82 1.36 0.13
3 76.75 + 3 -82.75 173.22 1.76 0.10
17 69.83 5.22 3 -82.94 173.60 2.14 0.08
9 69.83 2.33 3 -83.25 174.22 2.76 0.06
2 70.00 + 3 -83.33 174.37 2.91 0.06
51 78.24 + 35.36 + 5 -79.93 174.86 3.40 0.05
6 91.00 + + 5 -80.20 175.41 3.95 0.03
7 96.56 + + 5 -80.26 175.53 4.07 0.03
19 76.98 + 5.48 4 -82.30 175.67 4.21 0.03
11 77.32 + 3.39 4 -82.58 176.24 4.79 0.02
4 78.32 + + 4 -82.72 176.51 5.05 0.02
425
426
427
428

21 90.55 + 1.61 5 -80.84 176.67 5.22 0.02
13 91.18 + 0.66 5 -80.86 176.73 5.27 0.02
18 67.90 + 6.29 4 -82.87 176.82 5.36 0.02
25 69.83 0.42 5.06 4 -82.94 176.96 5.50 0.02
10 69.71 + 2.36 4 -83.25 177.58 6.13 0.01
8 95.36 + + + 6 -79.83 179.31 7.85 0.00
22 89.55 + + 5.16 6 -79.88 179.40 7.94 0.00
52 78.97 + + 35.27 + 6 -79.92 179.48 8.02 0.00
59 78.34 + 0.66 35.01 + 6 -79.92 179.48 8.02 0.00
27 77.21 + 1.52 4.91 5 -82.27 179.54 8.08 0.00
20 75.98 + + 5.91 5 -82.29 179.57 8.11 0.00
14 91.06 + + 0.21 6 -80.20 180.04 8.58 0.00
23 96.10 + + 1.99 6 -80.21 180.05 8.60 0.00
12 78.43 + + 3.24 5 -82.57 180.13 8.67 0.00
15 96.52 + + 0.37 6 -80.26 180.16 8.70 0.00
26 67.91 + 0.41 6.13 5 -82.87 180.74 9.28 0.00
89 69.66 0.47 4.99 0.48 5 -82.94 180.88 9.42 0.00
55 94.87 + + 29.17 + 7 -77.91 181.02 9.56 0.00
29 90.77 + 1.14 1.96 6 -80.82 181.27 9.81 0.00
91 76.86 + 1.86 4.51 2.54 6 -82.20 184.04 12.58 0.00
28 76.26 + + 1.49 5.33 6 -82.26 184.15 12.69 0.00
24 93.79 + + + 4.89 7 -79.53 184.27 12.81 0.00
16 95.29 + + + 0.51 7 -79.83 184.86 13.40 0.00
30 89.82 + + 1.47 5.64 7 -79.84 184.89 13.43 0.00
60 79.08 + + 0.68 34.91 + 7 -79.91 185.02 13.56 0.00
123 78.25 + 0.74 34.75 + 0.57 7 -79.92 185.03 13.57 0.00
90 66.82 + 0.59 6.12 1.73 6 -82.84 185.32 13.86 0.00
93 101.02 + 2.30 4.14 8.97 7 -80.17 185.53 14.07 0.00
31 96.10 + + 0.13 2.03 7 -80.21 185.62 14.16 0.00
56 93.41 + + + 29.03 + 8 -77.54 187.08 15.62 0.00
63 94.90 + + 0.67 29.45 + 8 -77.90 187.80 16.34 0.00
92 74.79 + + 1.89 5.25 3.28 7 -82.16 189.52 18.06 0.00
94 98.17 + + 2.36 6.94 7.20 8 -79.40 190.80 19.34 0.00
32 93.80 + + + 0.69 5.13 8 -79.52 191.05 19.59 0.00

95 102.43 + + 1.28 3.66 6.79 8 -79.86 191.73 20.27 0.00
124 78.94 + + 0.72 34.79 + 0.30 8 -79.91 191.82 20.36 0.00
127 103.14 + + 2.22 33.37 + 8.92 9 -77.12 194.74 23.28 0.00
64 93.43 + + + 1.01 29.46 + 9 -77.52 195.53 24.08 0.00
96 99.41 + + + 1.65 6.34 5.86 9 -79.25 199.00 27.54 0.00
128 101.28 + + + 2.38 33.07 + 8.23 10 -76.84 205.11 33.65 0.00
1 69.83 2 -83.33 171.46 0.00 0.25
5 91.00 + 4 -80.87 172.82 1.36 0.13
429

Table S2. Model selection table for global model:
glm(song rate ~ context + age + provisioning rate + brood size + tarsus length + brood*provisioning rate + brood size * tarsus length + tarsus length * provisioning rate )
(Intercept) Age Brood Context Provisioning rate
Tarsus length
Brood size x
Provisioning rate
Brood size x Tarsus length
Provisioning rate x Tarsus
length
df logLik AICc delta weight
187 1.97 + 0.75 0.04 + -0.30 6 -60.50 140.63 0.00 0.43
43 2.03 + 0.90 + 4 -65.10 141.28 0.65 0.31
47 2.32 + + 0.73 + 6 -62.27 144.17 3.54 0.07
59 2.03 + 0.88 -0.03 + 5 -65.01 145.02 4.39 0.05
44 2.04 + + 0.89 + 5 -65.08 145.16 4.53 0.04
188 1.89 + + 0.76 -0.01 + -0.32 7 -60.14 145.47 4.84 0.04
251 1.97 + 0.77 0.07 + + -0.30 7 -60.49 146.18 5.55 0.03
48 2.29 + + + 0.76 + 7 -61.90 149.00 8.37 0.01
123 2.03 + 0.83 -0.12 + + 6 -64.93 149.50 8.87 0.01
60 2.03 + + 0.88 -0.04 + 6 -65.01 149.66 9.03 0.00
63 2.31 + + 0.73 -0.01 + 7 -62.26 149.72 9.09 0.00
153 2.07 0.21 0.15 -0.47 4 -70.02 151.13 10.50 0.00
191 2.05 + + 0.75 0.07 + -0.28 8 -60.00 152.01 11.38 0.00
430
431432
252 1.88 + + 0.80 0.05 + + -0.32 8 -60.10 152.21 11.57 0.00
219 2.00 + 0.16 -0.38 + -0.40 6 -66.74 153.12 12.49 0.00
154 2.11 + 0.21 0.16 -0.46 5 -69.92 154.83 14.20 0.00
155 2.04 + 0.20 0.14 -0.46 5 -69.94 154.88 14.25 0.00
124 2.03 + + 0.83 -0.12 + + 7 -64.93 155.06 14.43 0.00
64 2.27 + + + 0.73 -0.06 + 8 -61.74 155.48 14.85 0.00
87 2.46 + + -0.60 + 6 -68.07 155.79 15.16 0.00
7 2.59 + + 4 -72.51 156.09 15.46 0.00
127 2.31 + + 0.73 -0.02 + + 8 -62.26 156.52 15.89 0.00
15 2.56 + + 0.12 5 -71.34 157.67 17.04 0.00
157 2.29 + 0.18 0.12 -0.38 6 -69.25 158.13 17.50 0.00
220 2.05 + + 0.16 -0.37 + -0.38 7 -66.58 158.36 17.73 0.00
5 2.79 + 3 -75.42 158.54 17.91 0.00
192 1.97 + + + 0.77 0.02 + -0.30 9 -59.16 158.82 18.19 0.00
13 2.74 + 0.14 4 -73.95 158.98 18.35 0.00
23 2.57 + + -0.08 5 -72.03 159.06 18.43 0.00
156 2.08 + + 0.20 0.16 -0.44 6 -69.84 159.32 18.68 0.00
8 2.59 + + + 5 -72.48 159.96 19.33 0.00

255 2.05 + + 0.81 0.19 + + -0.29 9 -59.92 160.33 19.70 0.00
95 2.45 + + 0.08 -0.55 + 7 -67.69 160.59 19.96 0.00
21 2.76 + -0.09 4 -74.80 160.67 20.04 0.00
88 2.47 + + + -0.60 + 7 -68.04 161.29 20.66 0.00
6 2.79 + + 4 -75.14 161.35 20.72 0.00
31 2.55 + + 0.11 -0.03 6 -71.27 162.18 21.55 0.00
16 2.56 + + + 0.12 6 -71.30 162.24 21.61 0.00
14 2.74 + + 0.14 5 -73.72 162.44 21.81 0.00
83 2.07 + -0.76 + 4 -75.71 162.50 21.87 0.00
84 2.23 + + -0.70 + 5 -73.76 162.52 21.89 0.00
159 2.28 + + 0.16 0.09 -0.31 7 -68.77 162.74 22.11 0.00
29 2.73 + 0.12 -0.04 5 -73.87 162.75 22.12 0.00
158 2.30 + + 0.19 0.13 -0.37 7 -69.23 163.65 23.02 0.00
24 2.56 + + + -0.08 6 -72.02 163.68 23.05 0.00
223 2.21 + + 0.13 -0.40 + -0.27 8 -65.85 163.70 23.07 0.00
128 2.27 + + + 0.77 0.00 + + 9 -61.71 163.92 23.29 0.00
22 2.76 + + -0.08 5 -74.71 164.42 23.79 0.00
91 2.08 + 0.08 -0.70 + 5 -75.23 165.45 24.82 0.00
92 2.25 + + 0.10 -0.62 + 6 -73.09 165.81 25.18 0.00
30 2.74 + + 0.13 -0.02 6 -73.71 167.05 26.42 0.00
96 2.47 + + + 0.08 -0.54 + 8 -67.62 167.23 26.60 0.00
32 2.56 + + + 0.11 -0.03 7 -71.27 167.73 27.10 0.00
4 2.27 + + 3 -80.41 168.53 27.90 0.00
2 2.45 + 2 -81.88 168.56 27.93 0.00
10 2.42 + 0.13 3 -80.49 168.69 28.06 0.00
256 1.94 + + + 0.91 0.26 + + -0.33 10 -58.78 169.00 28.37 0.00
3 2.13 + 2 -82.30 169.39 28.76 0.00
160 2.28 + + + 0.16 0.09 -0.31 8 -68.77 169.54 28.91 0.00
11 2.14 + 0.12 3 -80.94 169.60 28.97 0.00
12 2.27 + + 0.11 4 -79.30 169.67 29.04 0.00
9 2.31 0.15 2 -82.64 170.07 29.44 0.00
19 2.13 + -0.07 3 -81.84 171.40 30.76 0.00
18 2.44 + -0.01 3 -81.87 171.46 30.83 0.00
1 2.32 1 -84.61 171.47 30.84 0.00
26 2.44 + 0.15 0.06 4 -80.29 171.66 31.03 0.00
20 2.27 + + -0.01 4 -80.40 171.88 31.25 0.00
224 2.22 + + + 0.13 -0.40 + -0.27 9 -65.82 172.13 31.50 0.00
27 2.14 + 0.11 -0.03 4 -80.87 172.82 32.19 0.00
25 2.31 0.14 -0.03 3 -82.56 172.84 32.21 0.00
17 2.32 -0.08 2 -84.02 172.85 32.21 0.00
28 2.29 + + 0.13 0.05 5 -79.13 173.26 32.62 0.00
187 1.97 + 0.75 0.04 + -0.30 6 -60.50 140.63 0.00 0.43
433
434

Supplementary Figure 1
Supplementary Figure 2
435
436
437
438
439