: TOMM Committee Kangaroo Island...6 Figure 24: Visitors who were very satisfied with their...
117
Prepared for: TOMM Committee Kangaroo Island CB Contact: Ben Nitschke, Account Manager Phone: (08) 8373 3822 Email: [email protected] Issue Date: 3 September, 2018 Project number: TOMM0004 www.colmarbrunton.com
Transcript of : TOMM Committee Kangaroo Island...6 Figure 24: Visitors who were very satisfied with their...
Prepared for: TOMM Committee Kangaroo Island
CB Contact: Ben Nitschke, Account Manager
Phone: (08) 8373 3822
Email: [email protected]
Issue Date: 3 September, 2018
Project number: TOMM0004
www.colmarbrunton.com

2
Contents.
Addressing the TOMM Indicators ......................................................................... 9
Introduction ........................................................................................................... 15
Background .................................................................................................................................................... 15
Research Objectives ..................................................................................................................................... 16
Research Methodology ................................................................................................................................. 16
Weighting ........................................................................................................................................................ 16
Questionnaire Design ................................................................................................................................... 17
Restructuring & Reanalysis of Previous Wave Data ............................................................................... 17
Confidence Intervals ..................................................................................................................................... 17
Data cleaning ................................................................................................................................................. 18
Limitations of the Research ......................................................................................................................... 18
Recommendation of Kangaroo Island to others as a holiday destination (EC1e) ............................ 25
Average expenditure per visit (EC1f) ........................................................................................................ 26
Annual number of visitors (EC1g).............................................................................................................. 27
Satisfaction with customer service received (EC2c) .............................................................................. 28
Satisfaction with professionalism of tourism operators (EC2d) ........................................................... 29
Compliments and complaints (EC2e) ........................................................................................................ 30
Average spend per night over $200 (EC3c) ............................................................................................ 31
Viewed wildlife in natural environment (EX1b) ....................................................................................... 34
Experienced scenic variety without crowds (EX1c) ................................................................................ 35
Experienced cultural heritage and history of settlement (EX1d) ......................................................... 36
Experienced spectacular scenery and coastal landscapes (EX1e) ....................................................... 37
Experienced areas of untouched natural beauty (EX1f) ........................................................................ 38
Experienced farming and rural landscapes (EX1g) ................................................................................ 39
Experienced local Kangaroo Island produce (EX1h) .............................................................................. 40
Kangaroo Island offers one of Australia’s top three nature & wildlife experiences (EX1i) ............. 42
Kangaroo Island has a friendly local community (EX1j) ....................................................................... 43
Agreement with positioning statement (EX1k) ....................................................................................... 44
Matching expectation set by marketing materials (EX1l) ..................................................................... 45
Satisfaction with overall experience (EX1m) ........................................................................................... 46
Seeing native wildlife in its natural environment (EX2a) ...................................................................... 47
Opportunity to learn more about the Island’s natural environment (EX2b) ..................................... 48
Opportunity to learn more about the Island’s history (EX2c) .............................................................. 49
Range, quality and availability of activities (EX2d) ................................................................................ 50

3
Quality of accommodation (EX2e) ............................................................................................................. 53
Range, quality and availability of Kangaroo Island produce (EX2f) .................................................... 54
Quality of public tourism infrastructure (EX2h) ...................................................................................... 57
Recommendation of Kangaroo Island as holiday destination (EX2i) .................................................. 63
Repeat visitation (EC2j) ............................................................................................................................... 64
Summary of sub-groups scores for experiential condition ‘Kangaroo Island delivers authentic
and credible experiences consistent with its positioning’...................................................................... 65
Summary of sub-groups scores for experiential condition ‘Kangaroo Island delivers authentic
and credible experiences consistent with its positioning’ (continued) ............................................... 66
Summary of sub-groups scores for experiential condition ‘The majority of visitors leave the
Island highly satisfied with their experience’ .......................................................................................... 67
Summary of sub-groups scores for experiential condition ‘The majority of visitors leave the
Island highly satisfied with their experience’ (continued) .................................................................... 69
Visits to natural areas occurring on managed sites (EN2b) ................................................................. 71
Locations visited ............................................................................................................................................ 72
Awareness of quarantine regulations prior to arriving (EN2e) ............................................................ 73
Visitor Profile ......................................................................................................... 78
Visitor Origin .................................................................................................................................................. 78
Age profile ...................................................................................................................................................... 81
Incidence of repeat visitation ..................................................................................................................... 83
Travel party .................................................................................................................................................... 85
Types of Accommodation ............................................................................................................................ 87
Satisfaction with accommodation .............................................................................................................. 89
Credible vs. Experienced Attributes & Attractions .................................................................................. 91
Reasons for Dissatisfaction ......................................................................................................................... 93
Suggestions for Improvement .................................................................................................................... 94
Exploration of those dissatisfied overall ................................................................................................... 95
Seasonal variances ............................................................................................... 98
Proportion of visitors by season ................................................................................................................. 98
Appendix A: Visitor Expenditure ...................................................................... 109
Incidence of Package Bookings ................................................................................................................ 109
Expenditure per visitor ............................................................................................................................... 111
Appendix B: VES Questionnaire ....................................................................... 113
4
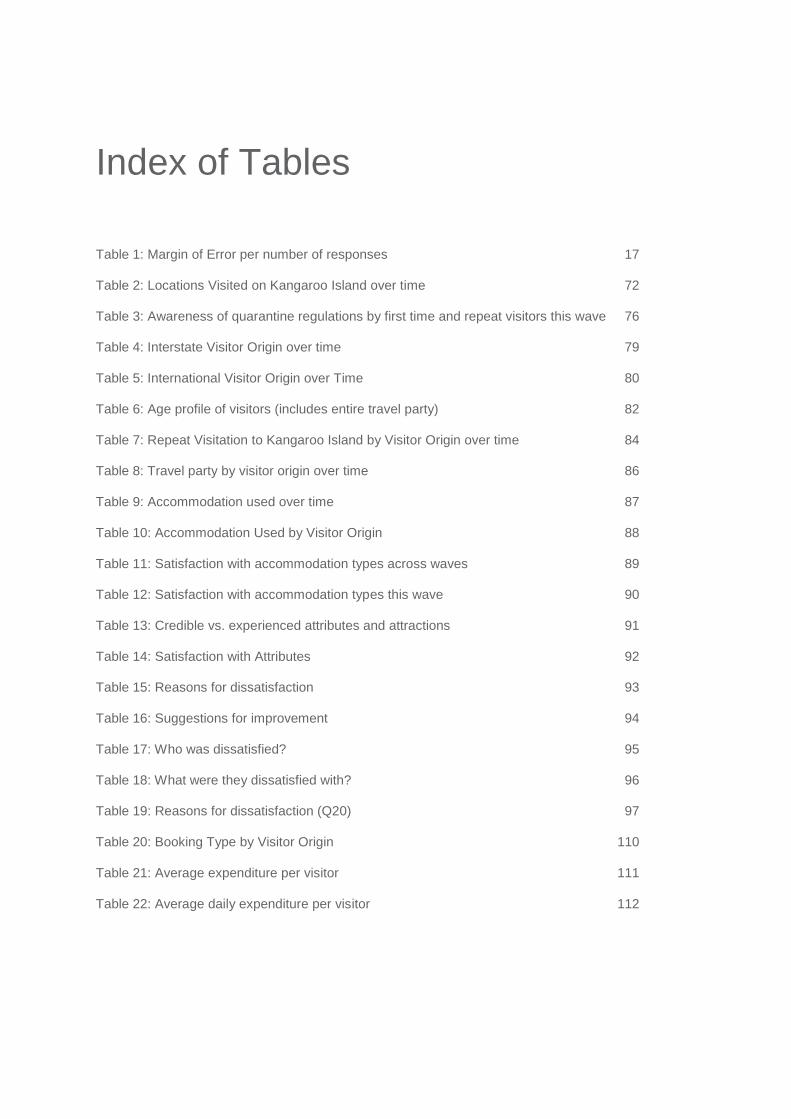
Index of Tables
Table 1: Margin of Error per number of responses 17
Table 2: Locations Visited on Kangaroo Island over time 72
Table 3: Awareness of quarantine regulations by first time and repeat visitors this wave 76
Table 4: Interstate Visitor Origin over time 79
Table 5: International Visitor Origin over Time 80
Table 6: Age profile of visitors (includes entire travel party) 82
Table 7: Repeat Visitation to Kangaroo Island by Visitor Origin over time 84
Table 8: Travel party by visitor origin over time 86
Table 9: Accommodation used over time 87
Table 10: Accommodation Used by Visitor Origin 88
Table 11: Satisfaction with accommodation types across waves 89
Table 12: Satisfaction with accommodation types this wave 90
Table 13: Credible vs. experienced attributes and attractions 91
Table 14: Satisfaction with Attributes 92
Table 15: Reasons for dissatisfaction 93
Table 16: Suggestions for improvement 94
Table 17: Who was dissatisfied? 95
Table 18: What were they dissatisfied with? 96
Table 19: Reasons for dissatisfaction (Q20) 97
Table 20: Booking Type by Visitor Origin 110
Table 21: Average expenditure per visitor 111
Table 22: Average daily expenditure per visitor 112

5
Index of Figures
Figure 1: Length of stay over time 22
Figure 2: Average Number of Nights over Time 23
Figure 3: Average number of nights by visitor origin over time 24
Figure 4: Willingness to recommend 25
Figure 5: Increase in average annual total expenditure per person per visit 26
Figure 6: Increase in annual number of visitors 27
Figure 7: Satisfaction with customer service received 28
Figure 8: Satisfaction with professionalism of tourism operators 29
Figure 9: Number of compliments and complaints received 30
Figure 10: Average spend per night over $200 31
Figure 11: Visitors that viewed Australia’s wildlife in natural surroundings 34
Figure 12: Visitors that experienced scenic variety without crowds 35
Figure 13: Visitors that experienced cultural heritage and history of settlement 36
Figure 14: Visitors that experienced spectacular scenery and coastal landscapes 37
Figure 15: Visitors that experienced areas of untouched natural beauty 38
Figure 16: Visitors that experienced farming and rural landscapes 39
Figure 17: Visitors that experienced local Kangaroo Island produce 40
Figure 18: Visitors that experienced Kangaroo Island as one of Australia’s top three nature &
wildlife experiences 42
Figure 19: Visitors that experienced a friendly local community on Kangaroo Island 43
Figure 20: Visitors who agree that Kangaroo Island is a wild and welcoming destination 44
Figure 21: Visitors stating that their experience matched or exceeded the expectation set by
marketing materials 45
Figure 22: Visitors who were very satisfied** with their overall experience on Kangaroo
Island 46
Figure 23: Visitors who were satisfied with seeing native wildlife in its natural environment 47

6
Figure 24: Visitors who were very satisfied with their opportunity to learn more about the
Island’s natural environment 48
Figure 25: Satisfaction with opportunity to learn more about the Island’s history 49
Figure 26: Satisfaction with the range activities 50
Figure 27: Satisfaction with the quality of activities 51
Figure 28: Satisfaction with the availability of activities 52
Figure 29: Satisfaction with quality of accommodation 53
Figure 30: Satisfaction with the range of local Kangaroo Island produce 54
Figure 31: Satisfaction with the quality of local Kangaroo Island produce 55
Figure 32: Satisfaction with the availability of local Kangaroo Island produce 56
Figure 33: Satisfaction with the quality of picnic & day use areas 57
Figure 34: Satisfaction with the quality of interpretive & educational signage 58
Figure 35: Satisfaction with the quality of public toilets 59
Figure 36: Satisfaction with the quality of road signage 60
Figure 37: Satisfaction with the quality of campgrounds 61
Figure 38: Satisfaction with the quality of roads 62
Figure 39: Willingness to recommend 63
Figure 40: Repeat visitation 64
Figure 41: Proportion of visitations to natural areas occurring on managed sites 71
Figure 42: Awareness of quarantine regulations 73
Figure 43: Awareness of any quarantine regulations by repeat and first time visitors 74
Figure 44: Awareness of Prohibited Items 75
Figure 45: Visitor Origin over time 78
Figure 46: Profile of respondents 81
Figure 47: Incidence of repeat visitation to Kangaroo Island over time 83
Figure 48: Travel party over Time 85
Figure 49: Proportion of visitors by season 98
Figure 50: Visitors who were very satisfied** with their overall experience on Kangaroo
Island by season 99

7
Figure 51: Average number of nights stayed by season 100
Figure 52: Average total expenditure per person per visit by season 101
Figure 53: Visitors who were very satisfied with customer service received by season 102
Figure 54: Visitors who spent $200+ per night by season 103
Figure 55: Visitors that experienced local Kangaroo Island produce by season 104
Figure 56: Visitors very satisfied with the range of local Kangaroo Island produce by season
105
Figure 57: Visitors very satisfied with the quality of local Kangaroo Island produce by season
106
Figure 58: Visitors very satisfied with the availability of local Kangaroo Island produce by
season 107
Figure 59: Repeat visitors by season 108
Figure 60: Trip to Kangaroo Island part of travel package 109

8
Disclaimer
TOMM does not represent or warrant that this information is correct, complete or suitable for the
purpose for which you wish to use it. By using this information, you acknowledge and agree to
release and indemnify the TOMM for any loss or damage that you may suffer as a result of your
reliance on this information.

9
Addressing the TOMM Indicators
At the core of TOMM is a practical set of indicators that monitor the status of tourism on Kangaroo
Island. A review of indicators was completed in the 2015/16 financial year to improve the monitoring
of the impact of tourism on Kangaroo Island. The indicators that relate to the visitor experience have
been measured through the annual Visitor Exit Survey since 2002.
This document outlines the findings of the 2017/18 Visitor Exit Survey (VES).

Summary of TOMM Indicators
Summary of Economic Indicators
Optimal Conditions Ref Indicators Acceptable Range VES 17/18 Results
Tourism optimises
economic benefits for
Kangaroo Island
EC1d Annual average number of nights stayed 4-7 nights 4.6 nights
EC1e Proportion of visitors that would recommend Kangaroo Island to others as a holiday destination
90% - 100% 95%
EC1f Average annual total expenditure per visit 5% - 10%↑ $722.70
[7.3% decrease]
EC1g Annual number of visitors to Kangaroo Island 0-20%*↑ 5.7%
Tourism operators excel in
their business
professionalism
EC2c Proportion of visitors that are very satisfied with the level of customer service they receive
65% - 100% 60%
EC2d Proportion of customers that are highly satisfied with the professionalism of tourism operators
65% - 100% 55%
EC2e The number of compliments and complaints received from visitors
↑ in positive comments
↓ in negative comments
↑ in positive comments
↓ in negative comments Island attracts Kangaroo its
high yield target markets EC3c
Proportion of visitors whose average spend per night exceeds $200
40% - 60% 34%

11
Summary of Experiential Indicators
Optimal Conditions Ref Indicators Acceptable Range VES 17/18 Results
Kangaroo Island delivers
authentic and credible
experiences consistent
with its positioning
EX1a Proportion of visitors that believe they
experienced an authentic wilderness holiday 80% - 100% Question removed in 2013/14
EX1b Proportion of visitors that viewed wildlife in the
natural environment 90% - 100% 97%
EX1c Proportion of visitors that experienced scenic
variety without crowds 90% - 100% 97%
EX1d Proportion of visitors that experienced cultural
heritage and history of settlement 70% - 100% 72%
EX1e Proportion of visitors that experienced
spectacular scenery and coastal landscapes 90% - 100% 99%
EX1f Proportion of visitors that experienced areas of
untouched natural beauty 90% - 100% 97%
EX1g Proportion of visitors that experienced farming
and rural landscapes 90% - 100% 88%
* Acceptable range changed from 0-3% to 0-20% in 2016.

12
Optimal Conditions Ref Indicators Acceptable Range VES 17/18 Results
Kangaroo Island delivers
authentic and credible
experiences consistent
with its positioning
EX1h Proportion of visitors that experienced local
Kangaroo Island produce 80% - 100% 83%
EX1i
Proportion of visitors that believe Kangaroo
Island offers one of Australia’s top three nature
& wildlife experiences
70% - 100% 81%
EX1j Proportion of visitors that believe Kangaroo
Island has a friendly local community 80% - 100% 93%
EX1k
Proportion of visitors who agree that Kangaroo
Island is a wild and welcoming destination, that
will surprise and amaze you, relax your mind,
refresh your spirit and make you feel totally
alive. It provides an opportunity to view and to
discover all the scenic variety of mainland
Australia
70% - 100% 85%
EX1l
Proportion of visitors that state that their
experience matched or exceeded the
expectation set by marketing materials
80% - 100% 94%
EX1m Proportion of visitors very satisfied with their
overall experience on Kangaroo Island 90% - 100% 85%

13
Optimal Conditions Ref Indicators Acceptable Range VES 17/18 Results
The majority of visitors
leave the island highly
satisfied with their
experience
EX2a Proportion of visitors who were very satisfied with seeing native wildlife in its natural environment
70% - 100% 69%
EX2b Proportion of visitors who were very satisfied with their opportunity to learn more about the Island’s natural environment
70% - 100% 49%
EX2c Proportion of visitors who were very satisfied with their opportunity to learn more about the Island’s history
70% - 100% 41%
Ex2d Proportion of visitors who were very satisfied with the range, quality and availability of activities available
70% - 100% 41%-45%
EX2e Proportion of visitors who were very satisfied with the quality of accommodation
70% - 100% 50%
EX2f Proportion of visitors who were very satisfied with the range, quality and availability of Kangaroo Island produce
70% - 100% 47% - 54%
EX2g Proportion of visitors that are very satisfied with the level of customer service they receive
80% - 100% 60%
EX2h
Proportion of visitors that are very satisfied with the quality of public tourism infrastructure (toilets, roads, campgrounds, picnic areas and signage) provided on Kangaroo Island
60% - 100% 32% - 48%
EX2i Proportion of visitors that would recommend Kangaroo Island as a holiday destination to others as a result of their experience
90% - 100% 95%
EX2j Proportion of repeat visitation 30% - 50% 28%

14
Summary of Environmental Indicators
Optimal Conditions Ref Indicators Acceptable Range VES 17/18 Results
Visitor activity has minimal
negative impacts on the
natural environment
EN2b Proportion of visitations to natural areas
occurring on managed sites 70% - 100% 74%
EN2e Proportion of visitors aware of quarantine
regulations prior to arriving on Kangaroo Island 70% - 100% 63%

KI TOMM: Visitor Exit Survey Report 2016-2017
15
15
Introduction
Background
Tourism is a key contributor to economic growth and development on Kangaroo Island, next to
agriculture, with both boosting productivity and providing a source of stable employment for residents.
TOMM (the Tourism Optimisation Management Model) was developed to monitor the effect of tourism
from a variety of perspectives (including environmental, economic, socio-cultural and visitor
experience) in the interests of both residents and visitors. The model is a community-based initiative
responsible for monitoring and managing the long-term sustainability of tourism on the island. The
initiative is overseen by a Management Committee with support and representatives from the
community, industry and Government agencies.
At the core of TOMM is a practical set of indicators that monitor tourism on Kangaroo Island. These
indicators measure changes in the economic, environmental, socio cultural and experiential
environments. A review of indicators was completed in the 2015/16 financial year.
The Visitor Exit Survey (VES) is a critical source of information with respect to measuring and
monitoring the TOMM indicators each year as well as collecting a raft of other information about
tourism on the Island. Trends demonstrated through these indicators are provided to agencies in
order to facilitate strategic planning for Kangaroo Island.
Colmar Brunton Research Services (CBRS) has carried out research with Kangaroo Island visitors as
part of the Tourism Optimisation Management Model (TOMM) monitor for the past fourteen financial
years. The following report details findings from the TOMM Visitor Exit Survey conducted throughout
the 2017/18 period. Where possible, tracking has been performed on questions that have been kept
comparable across the past fourteen years of the Visitor Exit Survey.
KI TOMM: Visitor Exit Survey Report 2016-2017
16
16
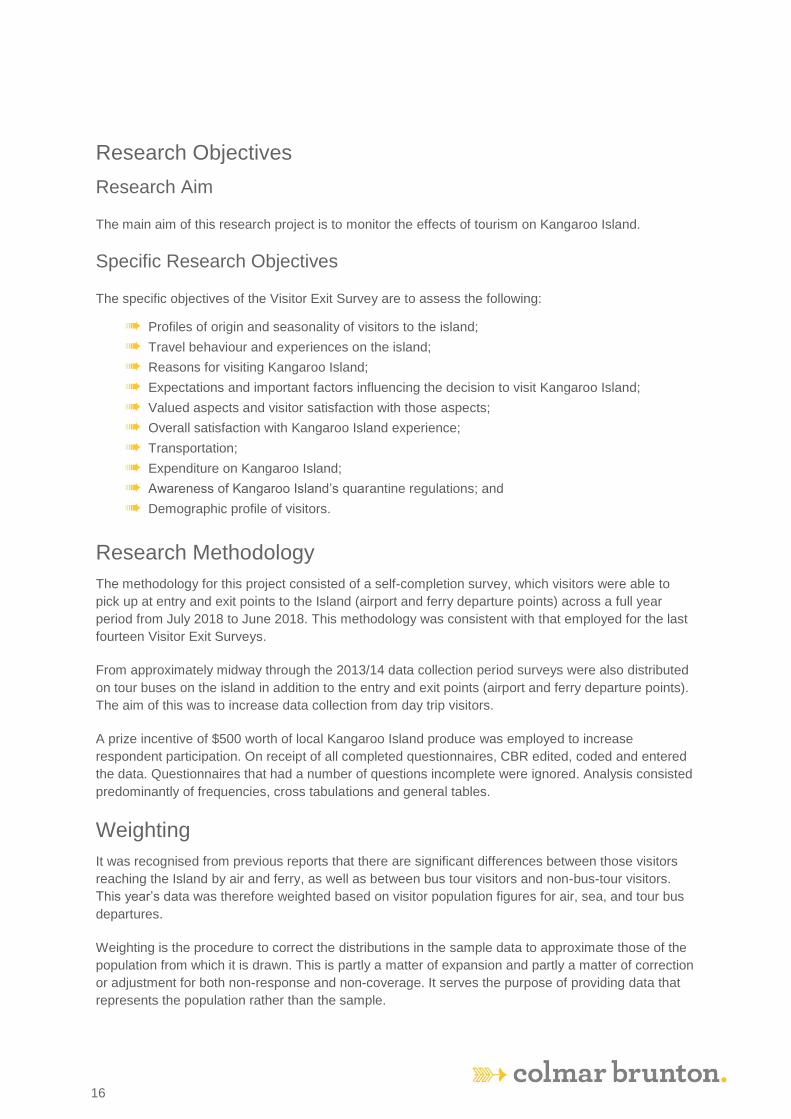
Research Objectives
Research Aim
The main aim of this research project is to monitor the effects of tourism on Kangaroo Island.
Specific Research Objectives
The specific objectives of the Visitor Exit Survey are to assess the following:
6 Profiles of origin and seasonality of visitors to the island;
6 Travel behaviour and experiences on the island;
6 Reasons for visiting Kangaroo Island;
6 Expectations and important factors influencing the decision to visit Kangaroo Island;
6 Valued aspects and visitor satisfaction with those aspects;
6 Overall satisfaction with Kangaroo Island experience;
6 Transportation;
6 Expenditure on Kangaroo Island;
6 Awareness of Kangaroo Island’s quarantine regulations; and
6 Demographic profile of visitors.
Research Methodology
The methodology for this project consisted of a self-completion survey, which visitors were able to
pick up at entry and exit points to the Island (airport and ferry departure points) across a full year
period from July 2018 to June 2018. This methodology was consistent with that employed for the last
fourteen Visitor Exit Surveys.
From approximately midway through the 2013/14 data collection period surveys were also distributed
on tour buses on the island in addition to the entry and exit points (airport and ferry departure points).
The aim of this was to increase data collection from day trip visitors.
A prize incentive of $500 worth of local Kangaroo Island produce was employed to increase
respondent participation. On receipt of all completed questionnaires, CBR edited, coded and entered
the data. Questionnaires that had a number of questions incomplete were ignored. Analysis consisted
predominantly of frequencies, cross tabulations and general tables.
Weighting
It was recognised from previous reports that there are significant differences between those visitors
reaching the Island by air and ferry, as well as between bus tour visitors and non-bus-tour visitors.
This year’s data was therefore weighted based on visitor population figures for air, sea, and tour bus
departures.
Weighting is the procedure to correct the distributions in the sample data to approximate those of the
population from which it is drawn. This is partly a matter of expansion and partly a matter of correction
or adjustment for both non-response and non-coverage. It serves the purpose of providing data that
represents the population rather than the sample.

KI TOMM: Visitor Exit Survey Report 2016-2017
17
17
The total population figures have not been provided to CBSR. Instead, the Kangaroo Island Council
was provided with a file that automatically calculates weights based on population data that is filled in.
The Council filled in the commercially sensitive information and provided CBSR with the resulting
weights. The population figures are not provided to CBSR or included in this report due to the
commercial sensitivity of this information.
Unless otherwise specified, all analysis has been based on weighted data.
Questionnaire Design
The 2017/18 questionnaire was identical to the 2016/17 questionnaire.
Restructuring & Reanalysis of Previous Wave Data
The reader should be aware that before analysis was conducted for the survey data for 2004/2005
year, the TOMM committee expressed their desire to restructure previous data in accordance with
each financial year. The board requested this to allow for more accurate trending and tracking
information to be obtained. In response to this request, CBSR agreed to restructure previous wave’s
data (2001 and 2002) to fit into financial years.
Confidence Intervals
Overall findings from a sample of n=2,042 can be reported within a +/-2.2% margin of error (‘n’ in
statistics refers to the size of the sample, i.e. the number of respondents). This means that if 50% of
visitors say they stayed on the island overnight, the ‘real’ response would fall between 48.8% and
52.2%. There are many cross tabulations included within the report with differing base sample sizes.
The table below illustrates the different margins of error associated with a series of sample sizes. The
reader should be mindful of these margins for error when analysing specific questions and trended
information within this report. Additionally, figures presented in this report are subjected to rounding
errors.
Table 1: Margin of Error per number of responses
Number of
responses per cell
Margin of Error
95% Confidence
2000 ±2.2%
1500 ±2.5%
1000 ±3.1%
500 ±4.4%

KI TOMM: Visitor Exit Survey Report 2016-2017
18
18
Data cleaning
In some cases, the data has been cleaned to improve the overall quality of the data. In case of
incomplete filled in questions by a respondent, the results for the incomplete question for that
respondent has been removed from the data. This is particularly evident for the expenses data where
calculations of total expenses are based on all the questions on the financial subject. Respondents
that have left out information might influence the overall result resulting in less accurate overall
analysis. For example, respondent’s expenditure data was excluded in rare cases where they
indicated that they travelled to the Island as part of a travel package, yet failed to specify the
Kangaroo Island component of the travel package. In order to make more valid comparisons over
time, this data cleaning procedure was applied to not only the 2016/17 wave, but the prior seven
waves as well.
Limitations of the Research
The current methodology employed for the Visitor Exit Survey involves visitors being able to collect
self-completion questionnaires at exit points from Kangaroo Island. Self-completion questionnaires
are cost effective and allow for ample distribution to the sample but often suffer from respondent bias
as there is less control over how it is completed.
Trained staff are not present to ensure accurate interpretation of the questions and individuals will
often skip over sections resulting in non-response bias while also requiring the questionnaire to be
short and simple potentially leaving out important information. Furthermore, self-completion surveys
often suffer from low response rates as the encouragement to complete the survey is not often there.
This results in additional respondent bias as certain demographics are more likely to complete self-
completion surveys than others (e.g. females).
Whilst the data in the research was weighted to account for differentiation of ferry, air, and tour bus
sample sizes from the actual figures, the findings must be considered with regard to the overall
reasonably low response rate.
There were significant differences in the methodology used between 00/01, 01/02 and subsequent
years. Again, trends should be considered indicative only, as many of the questions or code frames
have differed overtime, along with the methodology used to collect data. Unlike the methodology
currently used, surveys in 00/01 and 01/02 were not distributed throughout the financial year meaning
that statistical consistency is lost when trying to compare datasets from current years.
Finally, the reader should also be aware that some tracked results in this report will differ from the
results in previous reports. This is primarily due to the restructuring of the datasets into financial years
and the adaptation of analysis techniques for consistency across years.
KI TOMM: Visitor Exit Survey Report 2016-2017
19
19
Key Findings
2017/18 in a nutshell
The results of the 2017/18 Kangaroo Island Visitor Exit Survey show that key experiential indicators,
satisfaction and annual visitation numbers have been maintained at a high level or have increased
slightly on the previous year. However, average total expenditure per person per visit has declined in
2017/18 which may be linked to a decline in the proportion of overnight visitation. Overall satisfaction
is one of only two experiential measures which fell short of the acceptable range, yet it is nearing its
highest level since 2002/2003.
Economic indicators: 2017/18 saw decline in average annual total expenditure per person per
visit, and fewer visitors are staying overnight.
Average annual total expenditure per person per visit slowed in 2016/17, increasing by only 1.2%.
This year the trend has worsened, with a decrease of 7.3% in average total expenditure per visit to
$722.70, which nears spending in 2014/15 ($726.90).
The proportion of overnight visitors has decreased since last financial year. In 2017/18, 80% of
visitors stayed overnight which is significantly less than the 2016/17 measure (94%). This decrease in
overnight visitation has been driven by both interstate visitors (79%, down from 97% in 2016/17) and
international visitors (60%, down from 84% in 2016/17).
Only one of the measure pertaining to ‘Tourism operators excelling in their business professionalism’
fell within the acceptable range. However, the results were an improvement upon last year for each of
the indicators. The indicator which fell within its acceptable range was the number of compliments and
complaints received which saw an increase in complements and a significant decrease in complaints.
The proportion of those who were very satisfied with the customer service they received was 60%,
falling 5% short of the acceptable range (65%-100%). This is the highest result since the measure
commenced in 2009/10.
Experiential indicators: Repeat visitation and overall satisfaction has decreased even though
those visited feel that KI provides authentic and credible experiences. The proportion of repeat
visitation decreased from last year and has fallen just below the acceptable range. Almost all
indicators pertaining to ‘delivering authentic and credible experiences consistent with its
positioning’ fell within their acceptable ranges. The only indictors which fell short was the
proportion who were satisfied with their overall experience, and the proportion of visitors who
experienced farming and rural landscapes.
2015/16 marked the first time that the proportion of repeat visitors (32%) fell within the acceptable
range of 30%-50% since 2010/11. This wave (2017/18), repeat visitation has decreased significantly,
to 28% and now falls below this acceptable range.
Almost all the indicators surrounding ‘Kangaroo Island delivers authentic and credible experiences
consistent with its positioning’, fell within their respective acceptable ranges in 2017/18. The indicators
which did not fall within their acceptable ranges were:
• the proportion of visitors who experienced farming and rural landscapes which decreased
significantly from 2016/17 (from 92% to 88%); and
• the proportion of visitors who were very satisfied with their overall experience on Kangaroo
Island.

KI TOMM: Visitor Exit Survey Report 2016-2017
20
20
However, it should be noted that satisfaction with overall experience (85%) is high in comparison to
previous measures and nearing the highest recorded level (86%). The trend over the last five years
continues to show a steady increase in the proportion of visitors who are very satisfied / satisfied, and
a decrease in the proportion of those who are very dissatisfied / dissatisfied. Recommendation of KI as
a holiday destination also remained high, with 95% of visitors surveyed indicating that they would
recommend KI as a holiday destination to others as a result of their experience.

KI TOMM: Visitor Exit Survey Report 2016-2017
21
21
Economic Indicators
Overview
In 2017/18, indicators relating to the first economic condition ‘Tourism optimises economic benefits
for Kangaroo Island’ were generally consistent with the previous year, although the growth in
average annual total expenditure per person and the proportion of overnight visitors have both
declined. The average number of nights stayed (4.6), the proportion willing to recommend KI as a
holiday destination (95%), and the increase in the annual number of visitors to KI (5.7%) were all
within the acceptable range. Average annual total expenditure per person per visit decreased by 7.3%
to $722.70 which is well outside of the acceptable range of 5%-10%.
In the second condition, ‘Tourism operators excel in their business professionalism’, only one of
the indicators fell within the acceptable range. However, the results were an improvement upon last
year’s results for each of the indicators. The indicator which fell within its acceptable range was the
number of compliments and complaints received which saw an increase in complements and a
significant decrease in complaints. The proportion of those who were very satisfied with the customer
service they received was 60%, falling 5% short of the acceptable range (65%-100%). This is the
highest result since the measure commenced in 2009/10.
Finally, the third economic condition ‘Kangaroo Island attracts its high yield target markets’ also
remained consistent with the previous year and remains below the ideal level of 40%-60%, with 34%
of visitors spending more than $200 per night.
KI TOMM: Visitor Exit Survey Report 2016-2017
22
22
↓
↑
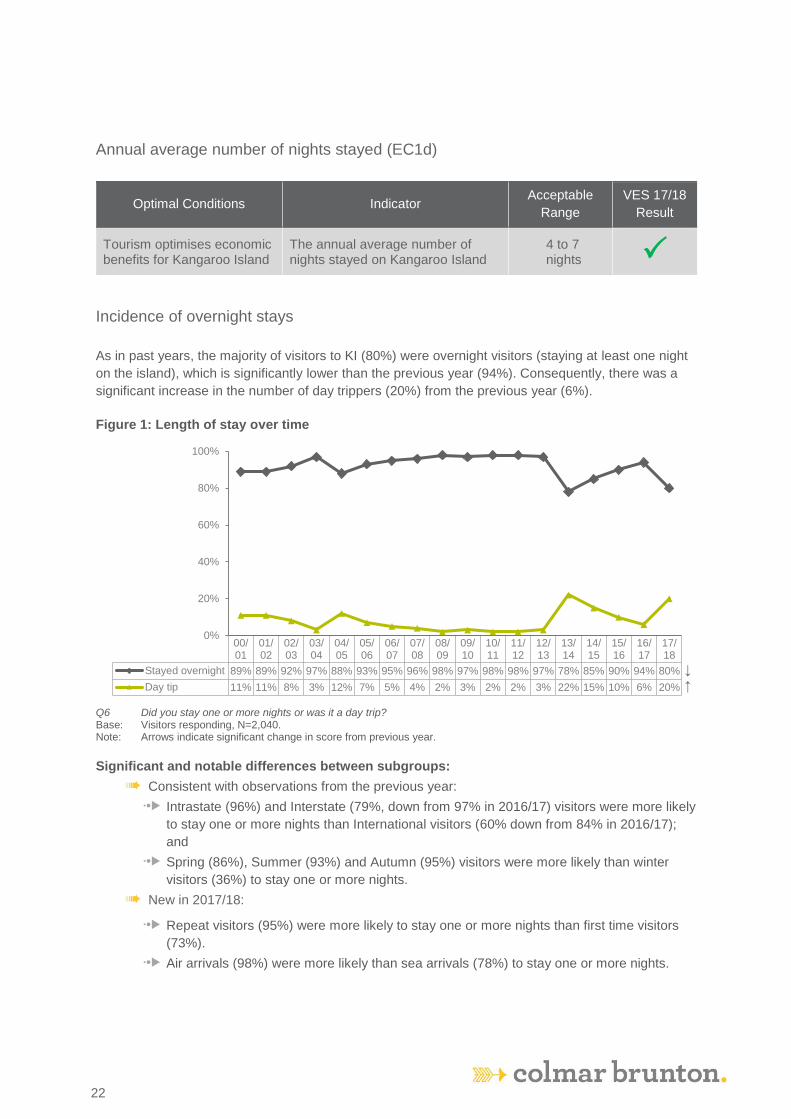
Annual average number of nights stayed (EC1d)
Optimal Conditions Indicator Acceptable
Range
VES 17/18
Result
Tourism optimises economic benefits for Kangaroo Island
The annual average number of nights stayed on Kangaroo Island
4 to 7 nights
Incidence of overnight stays
As in past years, the majority of visitors to KI (80%) were overnight visitors (staying at least one night
on the island), which is significantly lower than the previous year (94%). Consequently, there was a
significant increase in the number of day trippers (20%) from the previous year (6%).
Figure 1: Length of stay over time
Q6 Did you stay one or more nights or was it a day trip? Base: Visitors responding, N=2,040. Note: Arrows indicate significant change in score from previous year.
Significant and notable differences between subgroups:
6 Consistent with observations from the previous year:
7 Intrastate (96%) and Interstate (79%, down from 97% in 2016/17) visitors were more likely
to stay one or more nights than International visitors (60% down from 84% in 2016/17);
and
7 Spring (86%), Summer (93%) and Autumn (95%) visitors were more likely than winter
visitors (36%) to stay one or more nights.
6 New in 2017/18:
7 Repeat visitors (95%) were more likely to stay one or more nights than first time visitors
(73%).
7 Air arrivals (98%) were more likely than sea arrivals (78%) to stay one or more nights.
00/01
01/02
02/03
03/04
04/05
05/06
06/07
07/08
08/09
09/10
10/11
11/12
12/13
13/14
14/15
15/16
16/17
17/18
Stayed overnight 89% 89% 92% 97% 88% 93% 95% 96% 98% 97% 98% 98% 97% 78% 85% 90% 94% 80%
Day tip 11% 11% 8% 3% 12% 7% 5% 4% 2% 3% 2% 2% 3% 22% 15% 10% 6% 20%
0%
20%
40%
60%
80%
100%
KI TOMM: Visitor Exit Survey Report 2016-2017
23
23
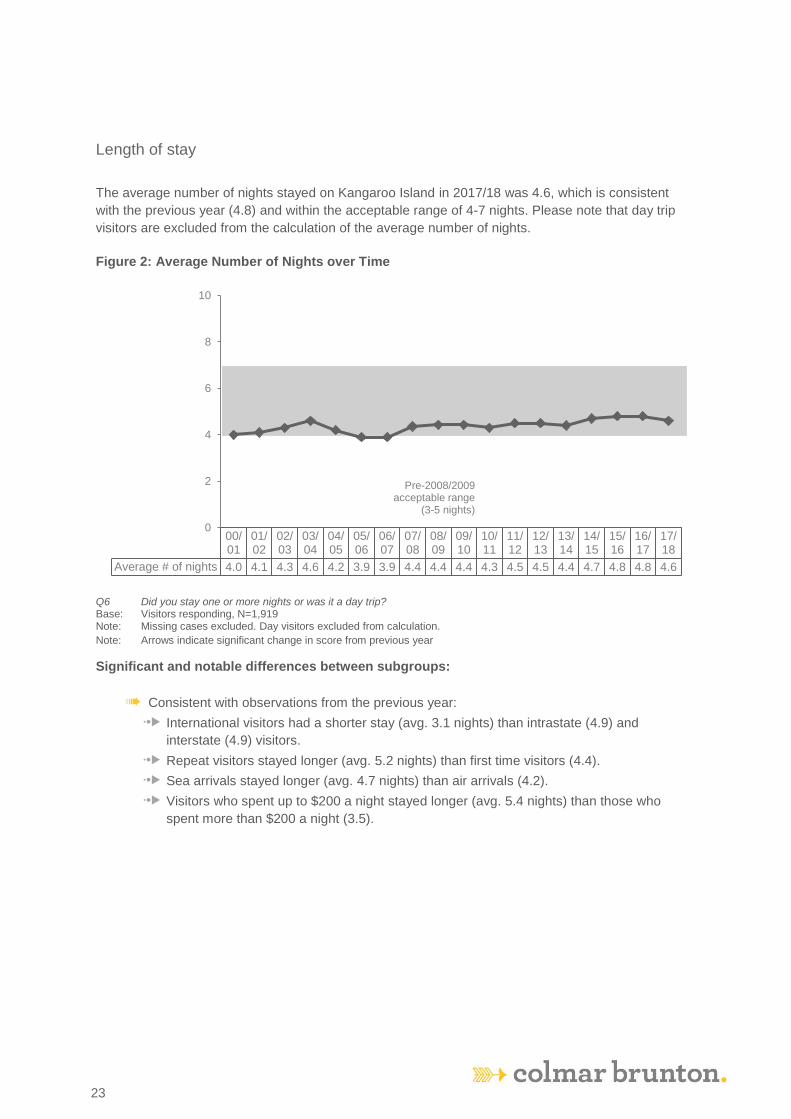
Length of stay
The average number of nights stayed on Kangaroo Island in 2017/18 was 4.6, which is consistent
with the previous year (4.8) and within the acceptable range of 4-7 nights. Please note that day trip
visitors are excluded from the calculation of the average number of nights.
Figure 2: Average Number of Nights over Time
Q6 Did you stay one or more nights or was it a day trip? Base: Visitors responding, N=1,919 Note: Missing cases excluded. Day visitors excluded from calculation.
Note: Arrows indicate significant change in score from previous year
Significant and notable differences between subgroups:
6 Consistent with observations from the previous year:
7 International visitors had a shorter stay (avg. 3.1 nights) than intrastate (4.9) and
interstate (4.9) visitors.
7 Repeat visitors stayed longer (avg. 5.2 nights) than first time visitors (4.4).
7 Sea arrivals stayed longer (avg. 4.7 nights) than air arrivals (4.2).
7 Visitors who spent up to $200 a night stayed longer (avg. 5.4 nights) than those who
spent more than $200 a night (3.5).
00/01
01/02
02/03
03/04
04/05
05/06
06/07
07/08
08/09
09/10
10/11
11/12
12/13
13/14
14/15
15/16
16/17
17/18
Average # of nights 4.0 4.1 4.3 4.6 4.2 3.9 3.9 4.4 4.4 4.4 4.3 4.5 4.5 4.4 4.7 4.8 4.8 4.6
0
2
4
6
8
10
Pre-2008/2009acceptable range
(3-5 nights)

KI TOMM: Visitor Exit Survey Report 2016-2017
24
24
Average number of nights by visitor origin
Length of stay was consistent by over time for visitor origin. Intrastate and interstate visitors had the
lengthiest stays at an average of 4.9 nights while international visitors had a shorter stay, at an
average of 3.1 nights.
Figure 3: Average number of nights by visitor origin over time
Q6 Did you stay one or more nights or was it a day trip?
Base: Intrastate visitors responding n=505, Interstate visitors responding n=980, International visitors responding n=434
Note: Missing cases excluded.
Note: Arrows indicate significant change in score from previous year.
00/01
01/02
02/03
03/04
04/05
05/06
06/07
07/08
08/09
09/10
10/11
11/12
12/13
13/14
14/15
15/16
16/17
17/18
Intrastate 4.6 4.8 4.2 4.8 4.8 4.5 4.9 5.0 4.8 4.9 4.8 4.6 4.9 4.8 5.2 4.9 5.0 4.9
Interstate 4.9 4.9 4.9 5.1 5.0 4.6 4.4 4.8 4.8 4.8 4.7 5.1 5.0 4.9 5.0 5.5 5.1 4.9
International 2.3 2.3 3.2 3.7 2.7 2.6 2.5 3.1 3.4 3.1 2.8 3.4 3.2 2.9 3.4 3.1 3.4 3.1
0
2
4
6
8
10

KI TOMM: Visitor Exit Survey Report 2016-2017
25
25
Recommendation of Kangaroo Island to others as a holiday
destination (EC1e)
Optimal Conditions Indicator Acceptable
Range
VES 17/18
Result
Tourism optimises economic benefits for Kangaroo Island
Proportion of visitors that would recommend Kangaroo Island to others as a holiday destination
90% - 100%
Willingness to recommend scores in 2016/17 remained consistent with scores from the previous 4
years at 95%. This result is within the acceptable range of 90-100%.
Figure 4: Willingness to recommend
Q23 Would you recommend Kangaroo Island as a holiday destination to others based on this trip? Base: Visitors responding, N=2,014 Note: Missing cases excluded. Note: Arrows indicate significant change in score from previous year.
Significant and notable differences between subgroups:
6 Consistent with observations from the previous year:
7 Air arrivals were more likely to indicate that they would recommend Kangaroo Island as a holiday destination (97%) compared to Sea arrivals (94%).
7 Intrastate visitors were more likely to indicate that they would recommend Kangaroo Island as a holiday destination (97%) compared to Interstate visitors (93%).
6 New in 2018/19:
7 Spring visitors (97%) were more likely to recommend Kangaroo Island as a holiday destination compared to summer (93%) and Autumn visitors (93%).
7 Repeat visitors were more likely to indicate that they would recommend Kangaroo Island as a holiday destination (97%) compared to first time visitors (94%).
00/01
01/02
02/03
03/04
04/05
05/06
06/07
07/08
08/09
09/10
10/11
11/12
12/13
13/14
14/15
15/16
16/17
17/18
% willing to recommend 98% 97% 99% 98% 98% 98% 98% 97% 95% 90% 94% 92% 93% 93% 93% 93% 95% 95%
0%
20%
40%
60%
80%
100%

KI TOMM: Visitor Exit Survey Report 2016-2017
26
26
↓
7 Those who spent up to $200 per night were more likely to indicate that they would recommend Kangaroo Island as a holiday destination (96%) compared to those who spent $201 or more (92%).
Average expenditure per visit (EC1f)
Optimal Conditions Indicator Acceptable
Range
VES 17/18
Result
Tourism optimises economic benefits for Kangaroo Island
Average annual total expenditure per visit
5% - 10% increase
After increasing by 1.2% in 2016/17 to $779.59, average total expenditure per person per visit
decreased significantly, to $722.70 in 2017/18. This reflects a 7.3% decrease in expenditure, which is
outside of the acceptable range of 5%-10%.
Figure 5: Increase in average annual total expenditure per person per visit
Q6 Did you stay one or more nights or was it a way trip?
Q8 What was the cost of the total package?
Q11 What is your best guess of the total Kangaroo Island component of the package?
Q13 What additional money did you spend on top of the package whilst on the Island?
Q14 Please indicate how much you spent on your trip to Kangaroo Island?
Q15 How many people did these costs cover?
Base: Visitors responding, 1,633
Note: Missing cases excluded.
Note: Visitors who indicated that their trip was part of a package yet did not specify the KI component of the package have been excluded from all expenditure calculations in this report
Significant and notable differences between subgroups:
6 Consistent with observations from the previous year:
7 Per person expenditure was higher for interstate visitors ($939.67) compared to both
intrastate ($650.79) and international visitors ($585.65).
7 Air arrivals spent more than sea arrivals ($1297.87 vs. $740.70).
09/10(n=1450)
10/11(n=1811)
11/12(n=1000)
12/13(n=2179)
13/14(n=2197)
14/15(n=1,414)
15/16(n=1,412)
16/17(n=1,826)
17/18(n=1,634)
Avg. total expenditureper person per visit
$623.00 $633.65 $684.31 $609.52 $601.92 $726.90 $770.06 $779.59 $722.70
$0
$200
$400
$600
$800
$1,000

KI TOMM: Visitor Exit Survey Report 2016-2017
27
27
7 As to be expected, those who stayed one or more nights spent more than day visitors
($848.01 vs. $312.65).
7 Those on a bus tour ($326.18) spent less than those not on a tour ($835.10).
Annual number of visitors (EC1g)
Optimal Conditions Indicator Acceptable
Range
VES 17/18
Result
Tourism optimises economic benefits for Kangaroo Island
Annual number of visitors to Kangaroo Island
0% - 20% increase
The annual number of visitors to Kangaroo Island increased from 213,933 in 2016/17 to 226,051 in
2017/18. This represents a 5.7% rise which is within the acceptable range of 0-20%.
Figure 6: Increase in annual number of visitors
Note: Data provided by TOMM Committee.
02/03
03/04
04/05
05/06
06/07
07/08
08/09
09/10
10/11
11/12
12/13
13/14
14/15
15/16
16/17
17/18
% increase innumber of visitors
2.3% 2.7% -2.0 -3.6 26.0 -5.4 5.6% 1.2% 3.0% 0.6% -0.4 1.2% 1.8% 4.4% 3.6% 5.7%
-30%
-20%
-10%
0%
10%
20%
30%
KI TOMM: Visitor Exit Survey Report 2016-2017
28
28
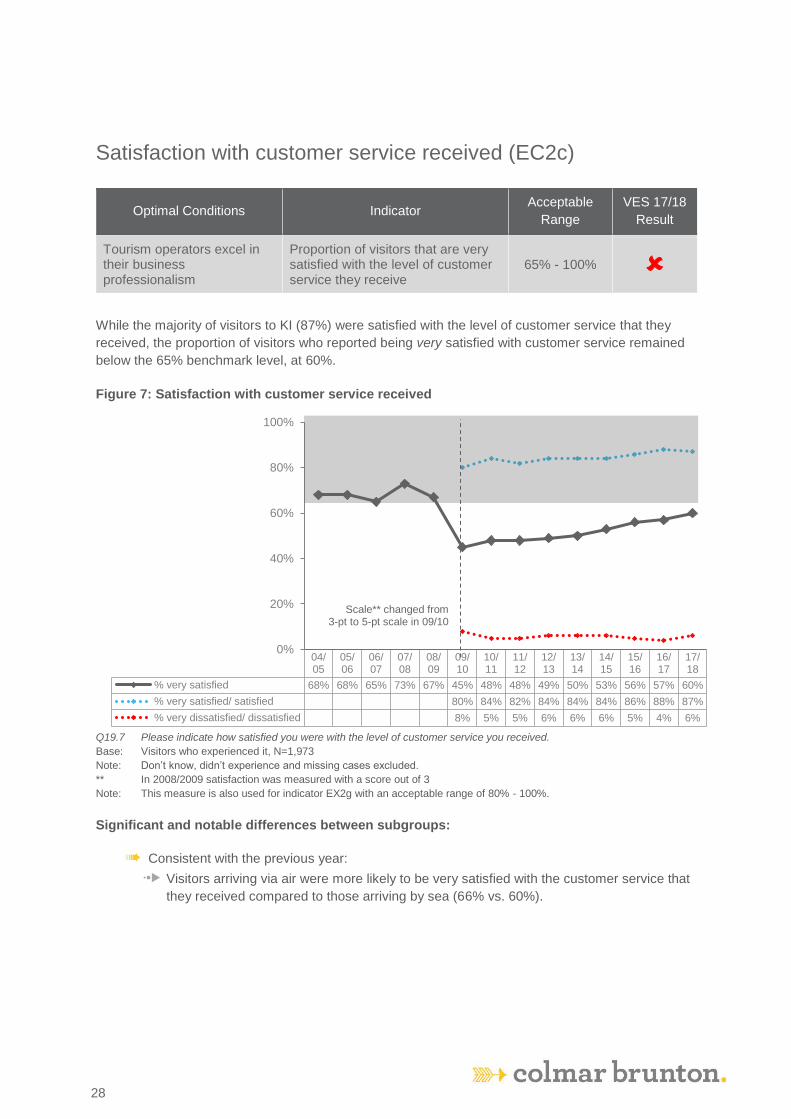
Satisfaction with customer service received (EC2c)
Optimal Conditions Indicator Acceptable
Range
VES 17/18
Result
Tourism operators excel in their business professionalism
Proportion of visitors that are very satisfied with the level of customer service they receive
65% - 100%
While the majority of visitors to KI (87%) were satisfied with the level of customer service that they
received, the proportion of visitors who reported being very satisfied with customer service remained
below the 65% benchmark level, at 60%.
Figure 7: Satisfaction with customer service received
Q19.7 Please indicate how satisfied you were with the level of customer service you received.
Base: Visitors who experienced it, N=1,973
Note: Don’t know, didn’t experience and missing cases excluded.
** In 2008/2009 satisfaction was measured with a score out of 3
Note: This measure is also used for indicator EX2g with an acceptable range of 80% - 100%.
Significant and notable differences between subgroups:
6 Consistent with the previous year:
7 Visitors arriving via air were more likely to be very satisfied with the customer service that
they received compared to those arriving by sea (66% vs. 60%).
04/05
05/06
06/07
07/08
08/09
09/10
10/11
11/12
12/13
13/14
14/15
15/16
16/17
17/18
% very satisfied 68% 68% 65% 73% 67% 45% 48% 48% 49% 50% 53% 56% 57% 60%
% very satisfied/ satisfied 80% 84% 82% 84% 84% 84% 86% 88% 87%
% very dissatisfied/ dissatisfied 8% 5% 5% 6% 6% 6% 5% 4% 6%
0%
20%
40%
60%
80%
100%
Scale** changed from 3-pt to 5-pt scale in 09/10

KI TOMM: Visitor Exit Survey Report 2016-2017
29
29
Satisfaction with professionalism of tourism operators (EC2d)
Optimal Conditions Indicator Acceptable
Range
VES 17/18
Result
Tourism operators excel in their business professionalism
Proportion of customers that are highly satisfied with the professionalism of tourism operators
65% - 100%
This year, the proportion of visitors to Kangaroo Island who reported that they were very satisfied with
the professionalism of tourism operators was 5%, which is consistent with the previous year (52%)
and below the acceptable range of 65-100%. It is, however, the highest proportion since the measure
commenced in 2009/10.
Figure 8: Satisfaction with professionalism of tourism operators
Q19.12 Please indicate how satisfied you were with the professionalism of tourism businesses. Base: Visitors who experienced it, N=1,815 Note: Don’t know, didn’t experience and missing cases excluded.
Significant and notable differences between subgroups:
6 Results were consistent between subgroups.
09/10
10/11
11/12
12/13
13/14
14/15
15/16
16/17
17/18
% very satisfied 41% 40% 43% 41% 48% 51% 52% 52% 55%
% very satisfied/ satisfied 77% 77% 79% 78% 82% 82% 83% 86% 85%
% very dissatisfied/ dissatisfied 9% 7% 7% 7% 6% 6% 5% 5% 6%
0%
20%
40%
60%
80%
100%
KI TOMM: Visitor Exit Survey Report 2016-2017
30
30
↓
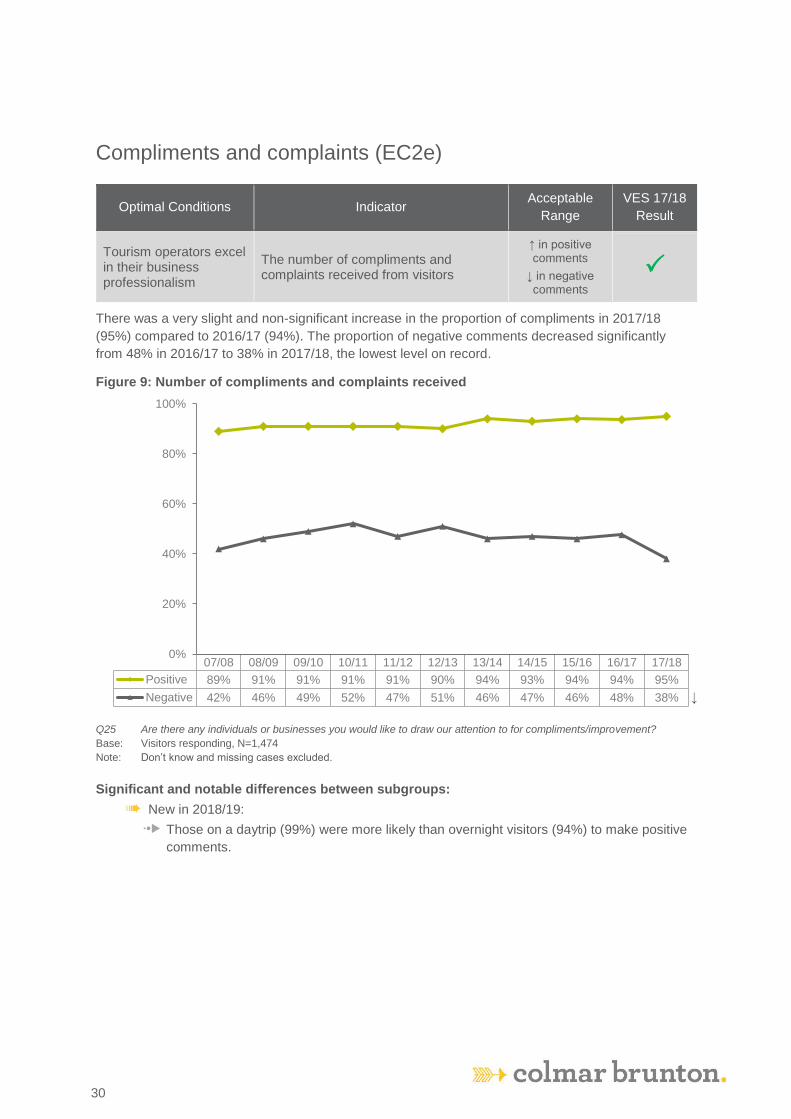
Compliments and complaints (EC2e)
Optimal Conditions Indicator Acceptable
Range
VES 17/18
Result
Tourism operators excel in their business professionalism
The number of compliments and complaints received from visitors
↑ in positive comments
↓ in negative comments
There was a very slight and non-significant increase in the proportion of compliments in 2017/18
(95%) compared to 2016/17 (94%). The proportion of negative comments decreased significantly
from 48% in 2016/17 to 38% in 2017/18, the lowest level on record.
Figure 9: Number of compliments and complaints received
Q25 Are there any individuals or businesses you would like to draw our attention to for compliments/improvement?
Base: Visitors responding, N=1,474
Note: Don’t know and missing cases excluded.
Significant and notable differences between subgroups:
6 New in 2018/19:
7 Those on a daytrip (99%) were more likely than overnight visitors (94%) to make positive
comments.
07/08 08/09 09/10 10/11 11/12 12/13 13/14 14/15 15/16 16/17 17/18
Positive 89% 91% 91% 91% 91% 90% 94% 93% 94% 94% 95%
Negative 42% 46% 49% 52% 47% 51% 46% 47% 46% 48% 38%
0%
20%
40%
60%
80%
100%

KI TOMM: Visitor Exit Survey Report 2016-2017
31
31
Average spend per night over $200 (EC3c)
Optimal Conditions Indicator Acceptable
Range
VES 17/18
Result
Kangaroo Island attracts its high yield target markets
Proportion of visitors for whom average spend per night exceeds $200
40% - 60%
The proportion of visitors who reported an average spend of over $200 per night was 37%, which is
consistent with the result from the previous year and below the acceptable range of 40-60%.
Figure 10: Average spend per night over $200
Q6 Did you stay one or more nights or was it a day trip?
Q8 What was the cost of the total package?
Q11 What is your best guess of the total Kangaroo Island component of the package?
Q13 What additional money did you spend on top of the package whilst on the Island? Q14 Please indicate how much you spent on your trip to Kangaroo Island? Q15 How many people did these costs cover? Base: Visitors responding, N=1,555 Note: Day trippers excluded. Note: Missing cases excluded. Note: Visitors who indicated that their trip was part of a package yet did not specify the KI component of the package have
been excluded from all expenditure calculations in this report
Significant and notable differences between subgroups:
6 Consistent with the previous year:
7 International visitors (44%) and Interstate visitors (36%) were more likely to spend over
$200 per night than Intrastate visitors (25%).
7 Those arriving by air were more likely to spend over $200 per night (65%) than those
arriving by sea (70%).
7 First time visitors were more likely to spend over $200 per night (39%) than repeat visitors
(22%).
09/10 10/11 11/12 12/13 13/14 14/15 15/16 16/17 17/18
% spend$200+ per night
28% 28% 26% 25% 30% 37% 35% 37% 34%
0%
20%
40%
60%
80%
100%

KI TOMM: Visitor Exit Survey Report 2016-2017
32
32
Summary of sub-group scores for economic indicators
Indicator Sub-groups who were within the Acceptable range for the indicator
Sub-groups who scored more highly for the indicator (compared to their comparative sub-group)
EC1d Annual average number of nights stayed
• Intrastate & interstate visitors • Spring, summer & autumn visitors • Those not on a bus tour • Sea and air arrivals • First time visitors & repeat visitors • Those who spent up to $200 a
night
• Interstate and intrastate visitors • Repeat visitors • Sea arrivals • Those who spent up to $200 a
night • Those not on a tour bus
EC1e
Proportion of visitors that would recommend Kangaroo Island to others as a holiday destination
• All subgroups
• Intrastate visitors • Repeat visitors • Air arrivals • Those who spent up to $200 a
night
EC1f Average annual total expenditure per visit
• Interstate visitors • Non-bus visitors • Over-night visitors
• Interstate visitors • Air arrivals • Those who stayed overnight • Those not on a bus tour
EC2c
Proportion of visitors that are very satisfied with the level of customer service they receive
• Air arrivals • Air arrivals
EC2d
Proportion of customers that are highly satisfied with the professionalism of tourism operators
• None • None
EC2e
The number of compliments and complaints received from visitors
• Air & sea arrivals • Interstate & International visitors • Repeat & First-time visitors • Summer, Autumn & Winter visitors • Those spending $200 or more per
night • Day-trippers & overnight visitors • Bus and non-bus visitors
• Those on a bus tour (Compliments)
• Day trippers (Compliments)
EC3c
Proportion of visitors whose average spend per night exceeds $200
• International visitors • Air arrivals
• Interstate and international visitors
• Air arrivals • First time visitors

KI TOMM: Visitor Exit Survey Report 2016-2017
33
33
Experiential Indicators
Overview
Almost all of the ‘Kangaroo Island delivers authentic and credible experiences consistent with
its positioning’ indicators fell within their respective acceptable ranges in 2017/18.
The indicators which did not fall within their acceptable ranges were the proportion of visitors who
experienced farming and rural landscapes which decreased significantly from 2016/17 (from 92% to
88%), and the proportion of visitors who were very satisfied with their overall experience on Kangaroo
Island. However, it should be noted that satisfaction with overall experience (85%) is high in
comparison to previous measures and nearing the highest recorded level (86%). The trend over the
last five years continues to show a steady increase in the proportion of visitors who are very satisfied /
satisfied, and a decrease in the proportion of those who are very dissatisfied / dissatisfied.
Recommendation of KI as a holiday destination also remained high, with 95% of visitors surveyed
indicated that they would recommend KI as a holiday destination to others as a result of their
experience.
Other notable results include an increase in the proportion of visitors who were very satisfied with the
quality of the roads (32% up from 25% in 2016/17) however remains well below the acceptable range
of 60%-100%.

KI TOMM: Visitor Exit Survey Report 2016-2017
34
34
Viewed wildlife in natural environment (EX1b)
Optimal Conditions Indicator Acceptable
Range
VES 17/18
Result
Kangaroo Island delivers authentic and credible experiences consistent with its positioning
Proportion of visitors that viewed wildlife in the natural environment
90% - 100%
The vast majority (97%) of visitors in 2017/18 viewed Australia’s wildlife in natural surroundings. This
result is consistent with last year’s measure and is within the acceptable range of 90-100%.
Figure 11: Visitors that viewed Australia’s wildlife in natural surroundings
Q18.2 For each of the following please indicate whether experienced this while on Kangaroo Island? Base: Visitors responding, N=1,876 Note: Missing cases excluded. * Figure reflects response to the question “please indicate whether you believe that Kangaroo Island provides you this
while on Kangaroo Island.
Significant and notable differences between subgroups:
6 Consistent with the previous year:
7 Those on a bus tour (100%) were more likely to see view Australian wildlife in natural
surroundings than those not on a bus tour (96%).
7 International visitors were more likely to view Australian wildlife in natural surroundings
than both interstate (96%) and intrastate visitors (95%).
6 New in 2017/18:
7 Winter visitors (99%) and Autumn visitors (98%) were more likely to view Australian
wildlife in natural surroundings than summer visitors (95%).
09/10 10/11 11/12 12/13 13/14 14/15 15/16 16/17 17/18
% of visitors 92% 93% 93% 93% 96% 96% 96% 97% 97%
0%
20%
40%
60%
80%
100%
98% of visitors believedthat KI provides this*

KI TOMM: Visitor Exit Survey Report 2016-2017
35
35
Experienced scenic variety without crowds (EX1c)
Optimal Conditions Indicator Acceptable
Range
VES 16/17
Result
Kangaroo Island delivers authentic and credible experiences consistent with its positioning
Proportion of visitors that experienced scenic variety without crowds
90% - 100%
Almost all visitors (97%) to Kangaroo Island experienced scenic variety without crowds, which is
consistent with last year’s measure (97%) and within the acceptable range of 90%-100%.
Figure 12: Visitors that experienced scenic variety without crowds
Q18.3 For each of the following please indicate whether experienced this while on Kangaroo Island? Base: Visitors responding, N=1,864 Note: Missing cases excluded. * Figure reflects response to the question “please indicate whether you believe that Kangaroo Island provides you this
while on Kangaroo Island. Significant and notable differences between subgroups:
6 Consistent with the previous year:
7 Intrastate visitors (98%) were more likely to experience scenic variety without crowds of
people than international visitors (93%).
7 Day trippers were less likely to have experienced this (91%) than those who stayed
overnight (98%).
7 Those who did not come on a bus tour (98%) were more likely to have experienced this
than those who came as part of a bus tour (91%).
7 Repeat visitors were more likely to have experience this (99%) than first time visitors
(96%).
09/10 10/11 11/12 12/13 13/14 14/15 15/16 16/17 17/18
% of visitors 95% 97% 97% 96% 94% 97% 97% 97% 97%
0%
20%
40%
60%
80%
100%
96% of visitors believed that KI provides this*

KI TOMM: Visitor Exit Survey Report 2016-2017
36
36
Experienced cultural heritage and history of settlement (EX1d)
Optimal Conditions Indicator Acceptable
Range
VES 17/18
Result
Kangaroo Island delivers authentic and credible experiences consistent with its positioning
Proportion of visitors that experienced cultural heritage and history of settlement
70% - 100%
This year, the proportion of visitors who experienced cultural heritage and history of settlement (72%)
was consistent with 2016/17 (74%). This is within the acceptable range of 70-100%.
Figure 13: Visitors that experienced cultural heritage and history of settlement
Q18.4 For each of the following please indicate whether you experienced this while on Kangaroo Island? Base: Visitors responding, N=1,821 Note: Missing cases excluded. * Figure reflects response to the question “please indicate whether you believe that Kangaroo Island provides you this
while on Kangaroo Island. Significant and notable differences between subgroups:
6 Consistent with the previous year:
7 International visitors were less likely to experience cultural heritage and the history of
settlement (54%) compared to both intrastate (74%) and interstate (77%) visitors.
6 New in 2018/19
7 Those spending less than $200 per night (75%) were more likely than those spending $201 or more per night (68%) to experience cultural heritage and the history of settlement.
09/10 10/11 11/12 12/13 13/14 14/15 15/16 16/17 17/18
% of visitors 68% 70% 71% 67% 71% 74% 76% 74% 72%
0%
20%
40%
60%
80%
100%
80% of visitors believed that KI provides this*

KI TOMM: Visitor Exit Survey Report 2016-2017
37
37
Experienced spectacular scenery and coastal landscapes
(EX1e)
Optimal Conditions Indicator Acceptable
Range
VES 17/18
Result
Kangaroo Island delivers authentic and credible experiences consistent with its positioning
Proportion of visitors that experienced spectacular scenery and coastal landscapes
90% - 100%
Almost all (99%) visitors experienced spectacular scenery and coastal landscapes in 2016/17. This
result is comparable to that of 2017/18 (99%) and is within the acceptable range of 90%-100%.
Figure 14: Visitors that experienced spectacular scenery and coastal landscapes
Q18.5 For each of the following please indicate whether you experienced this while on Kangaroo Island? Base: Visitors responding, N=1,865 Note: Missing cases excluded. * Figure reflects response to the question “please indicate whether you believe that Kangaroo Island provides you this
while on Kangaroo Island.
09/10 10/11 11/12 12/13 13/14 14/15 15/16 16/17 17/18
% of visitors 98% 98% 98% 98% 99% 99% 99% 99% 99%
0%
20%
40%
60%
80%
100%
99% of visitors believed that KI provides this*

KI TOMM: Visitor Exit Survey Report 2016-2017
38
38
Experienced areas of untouched natural beauty (EX1f)
Optimal Conditions Indicator Acceptable
Range
VES 17/18
Result
Kangaroo Island delivers authentic and credible experiences consistent with its positioning
Proportion of visitors that experienced areas of untouched natural beauty
90% - 100%
The proportion of visitors that reported experiencing areas of untouched natural beauty (97%) is
consistent with previous years. This result is within the acceptable range of 90-100%.
Figure 15: Visitors that experienced areas of untouched natural beauty
Q18.6 For each of the following please indicate whether you experienced this while on Kangaroo Island? Base: Visitors responding, N=1,989 Note: Missing cases excluded. * Figure reflects response to the question “please indicate whether you believe that Kangaroo Island provides you this
while on Kangaroo Island.
09/10 10/11 11/12 12/13 13/14 14/15 15/16 16/17 17/18
% of visitors 95% 95% 95% 95% 96% 95% 96% 97% 97%
0%
20%
40%
60%
80%
100%
98% of visitors believed that KI provides this*.

KI TOMM: Visitor Exit Survey Report 2016-2017
39
39
Experienced farming and rural landscapes (EX1g)
Optimal Conditions Indicator Acceptable
Range
VES 17/18
Result
Kangaroo Island delivers authentic and credible experiences consistent with its positioning
Proportion of visitors that experienced farming and rural landscapes
90% - 100%
The proportion of visitors who experienced farming and rural landscapes in 2017/18 (88%) decreased
significantly from 2016/17 (92%). This is now outside of the acceptable range of 90-100% after being
within the acceptable range for the previous two years.
Figure 16: Visitors that experienced farming and rural landscapes
Q18.7 For each of the following please indicate whether you experienced this while on Kangaroo Island?
Base: Visitors responding, N=1,860 Note: Missing cases excluded.
* Figure reflects response to the question “please indicate whether you believe that Kangaroo Island provides you this while on Kangaroo Island.
Significant and notable differences between subgroups:
6 Consistent with the previous year:
7 Day trippers were less likely to have experienced farming and rural landscapes (67%)
than those staying one or more nights (92%); and
7 Bus tour visitors (67%) were less likely than others (92%) to experience this.
7 International visitors (72%) were less likely to experience this than both Interstate (91%)
and intrastate visitors (91%).
6 New in 2016/17:
7 Winter visitors (73%) were less likely to have experienced farming and rural landscapes
than spring (92%), summer (91%), and autumn (91%) visitors
7 Repeat visitors (92%) were less likely to experience this than first time visitors (86%).
09/10 10/11 11/12 12/13 13/14 14/15 15/16 16/17 17/18
% of visitors 88% 89% 89% 89% 88% 88% 90% 92% 88%
0%
20%
40%
60%
80%
100%
94% of visitors believed that KI provides this*
↓

KI TOMM: Visitor Exit Survey Report 2016-2017
40
40
Experienced local Kangaroo Island produce (EX1h)
Optimal Conditions Indicator Acceptable
Range
VES 17/18
Result
Kangaroo Island delivers authentic and credible experiences consistent with its positioning
Proportion of visitors that experienced local Kangaroo Island produce
80% - 100%
The proportion of visitors who experienced local Kangaroo Island produce in 2017/18 was 83%, which
is consistent with the previous measure (87%) and within the acceptable range of 80-100%.
Figure 17: Visitors that experienced local Kangaroo Island produce
Q18.8 For each of the following please indicate whether you experienced this while on Kangaroo Island? Base: Visitors responding, N=1,976. Note: Missing cases excluded.
* Figure reflects response to the question “please indicate whether you believe that Kangaroo Island provides you this while on Kangaroo Island.
Significant and notable differences between subgroups:
6 Consistent with the previous year:
7 International visitors (67%) were less likely to experience local Kangaroo Island produce
than intrastate (93%) and interstate (83%) visitors;
7 Day trippers (46%) were less likely to experience this than those staying overnight (91%);
7 Repeat visitors to KI (94%) were more likely to experience this than first time visitors
(78%); and
7 Those on a bus tour (45%) were less likely to experience this than those not on a bus tour
(90%).
6 New in 2018/19:
09/10 10/11 11/12 12/13 13/14 14/15 15/16 16/17 17/18
% of visitors 79% 82% 82% 81% 75% 80% 83% 87% 83%
0%
20%
40%
60%
80%
100%
91% of visitors believed that KI provides this*

KI TOMM: Visitor Exit Survey Report 2016-2017
41
41
7 Intrastate visitors (93%) were more likely to experience local Kangaroo Island produce
than interstate visitors (83%); and
7 Winter visitors (62%) were less likely to experience this than spring (87%), Summer (89%)
and Autumn visitors (89%).
7 Air arrivals were more likely to experience local Kangaroo Island produce than sea
arrivals (82%);
KI TOMM: Visitor Exit Survey Report 2016-2017
42
42
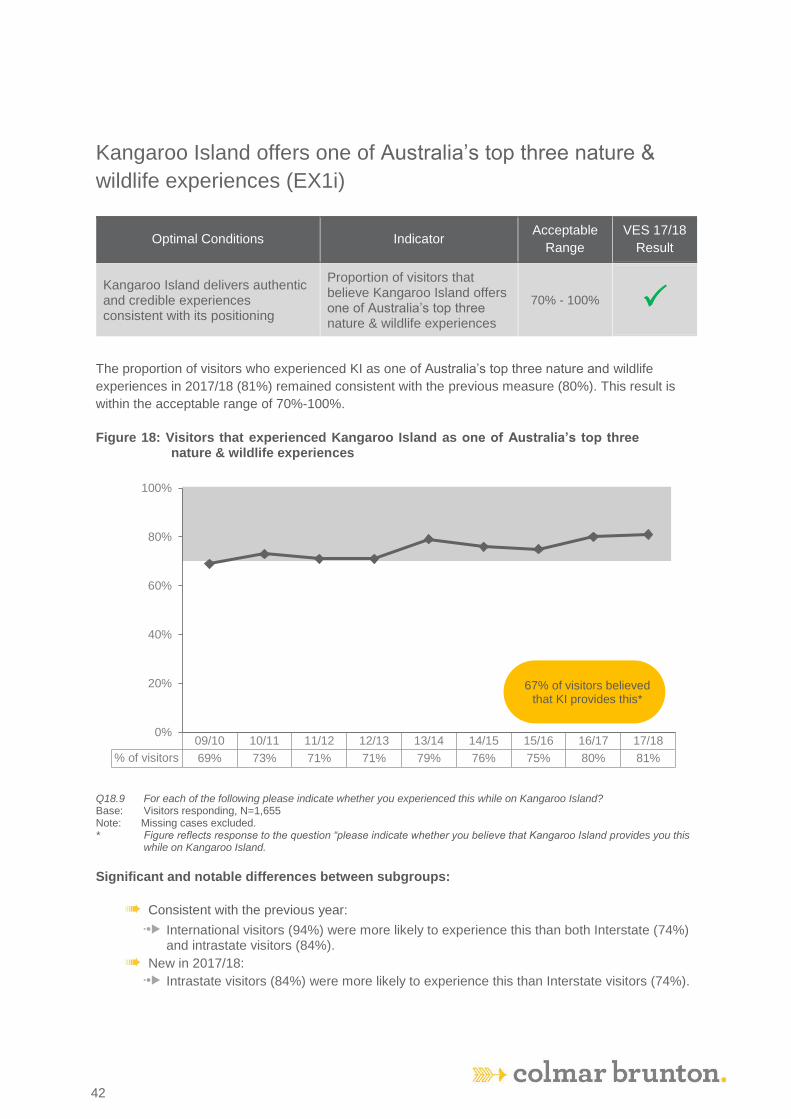
Kangaroo Island offers one of Australia’s top three nature &
wildlife experiences (EX1i)
Optimal Conditions Indicator Acceptable
Range
VES 17/18
Result
Kangaroo Island delivers authentic and credible experiences consistent with its positioning
Proportion of visitors that believe Kangaroo Island offers one of Australia’s top three nature & wildlife experiences
70% - 100%
The proportion of visitors who experienced KI as one of Australia’s top three nature and wildlife
experiences in 2017/18 (81%) remained consistent with the previous measure (80%). This result is
within the acceptable range of 70%-100%.
Figure 18: Visitors that experienced Kangaroo Island as one of Australia’s top three nature & wildlife experiences
Q18.9 For each of the following please indicate whether you experienced this while on Kangaroo Island? Base: Visitors responding, N=1,655 Note: Missing cases excluded. * Figure reflects response to the question “please indicate whether you believe that Kangaroo Island provides you this
while on Kangaroo Island. Significant and notable differences between subgroups:
6 Consistent with the previous year:
7 International visitors (94%) were more likely to experience this than both Interstate (74%) and intrastate visitors (84%).
6 New in 2017/18:
7 Intrastate visitors (84%) were more likely to experience this than Interstate visitors (74%).
09/10 10/11 11/12 12/13 13/14 14/15 15/16 16/17 17/18
% of visitors 69% 73% 71% 71% 79% 76% 75% 80% 81%
0%
20%
40%
60%
80%
100%
67% of visitors believed that KI provides this*

KI TOMM: Visitor Exit Survey Report 2016-2017
43
43
Kangaroo Island has a friendly local community (EX1j)
Optimal Conditions Indicator Acceptable
Range
VES 17/18
Result
Kangaroo Island delivers authentic and credible experiences consistent with its positioning
Proportion of visitors that believe Kangaroo Island has a friendly local community
80% - 100%
The proportion of visitors who experienced a friendly local community on KI was 93% in 2017/18. This
result is consistent with last year’s result (94%) and is within the acceptable range of 80%-100%.
Figure 19: Visitors that experienced a friendly local community on Kangaroo Island
Q18.10 For each of the following please indicate whether you experienced this while on Kangaroo Island? Base: Visitors responding, N=1,834 Note: Missing cases excluded. * Figure reflects response to the question “please indicate whether you believe that Kangaroo Island provides you this
while on Kangaroo Island. Significant and notable differences between subgroups:
6 Consistent with the previous year:
7 Intrastate (97%) and interstate (95%) visitors were more likely to experience a friendly
local community than international visitors (83%);
7 Overnight visitors (96%) were more likely than day trippers (82%) to experience this; and
7 Those on a bus tour (81%) were less likely to experience this than other visitors (96%).
6 New in 2017/18:
7 Repeat visitors were more likely to experience a friendly local community than first time
visitors (92%)
09/10 10/11 11/12 12/13 13/14 14/15 15/16 16/17 17/18
% of visitors 90% 92% 93% 93% 91% 91% 92% 94% 93%
0%
20%
40%
60%
80%
100%
92% of visitors believed that KI provides this*

KI TOMM: Visitor Exit Survey Report 2016-2017
44
44
Agreement with positioning statement (EX1k)
Optimal Conditions Indicator Acceptable
Range
VES 17/18
Result
Kangaroo Island delivers authentic and credible experiences consistent with its positioning
Proportion of visitors who agree** that Kangaroo Island is a wild and welcoming destination, that will surprise and amaze you, relax your mind, refresh your spirit and make you feel totally alive. It provides an opportunity to view and to discover all the scenic variety of mainland Australia
70% - 100%
The proportion of visitors who agreed with the positioning statement in 2017/18 (85%) was consistent
with agreement levels from the previous year (86%). This result remains within the acceptable range
of 70%-100%.
Figure 20: Visitors who agree that Kangaroo Island is a wild and welcoming destination
Q24 To what extent do you agree or disagree with this statement? Base: Visitors responding, N=2,009 Note: Missing cases excluded. ** Rated 7-10 on an eleven point scale, where 0 means strongly disagree and 10 means strongly agree.
Significant and notable differences between subgroups:
6 Consistent with the previous year:
7 Intrastate visitors (90%) were more likely to agree with the positioning statement than
interstate visitors (80%).
6 New in 2017/18:
7 Repeat visitors (90%) were more likely to agree with the positioning statement than first
time visitors (83%).
7 Air arrivals (92%) were more likely to agree with the positioning statement than those
arriving by sea (85%).
09/10 10/11 11/12 12/13 13/14 14/15 15/16 16/17 17/18
% of visitors 77% 81% 80% 82% 85% 85% 84% 86% 85%
0%
20%
40%
60%
80%
100%

KI TOMM: Visitor Exit Survey Report 2016-2017
45
45
Matching expectation set by marketing materials (EX1l)
Optimal Conditions Indicator Acceptable
Range
VES 17/18
Result
Kangaroo Island delivers authentic and credible experiences consistent with its positioning
Proportion of visitors that state that their experience matched or exceeded expectation set by marketing materials
80% - 100%
The vast majority of visitors to Kangaroo Island who stated that their experience matched or
exceeded expectations set by marketing materials (94%) was comparable to last year (95%). This
result remains within the acceptable range of 80%-100%.
Figure 21: Visitors stating that their experience matched or exceeded the expectation set by marketing materials
Q21 Do you believe that Kangaroo Island’s marketing material matched the experience you had while visiting Kangaroo
Island?
Base: Visitors responding, N=1,977
Note: Missing cases excluded.
Significant and notable differences between subgroups:
6 Consistent with the previous year:
7 Air arrivals (97%) were more likely to believe this than sea arrivals (94%).
6 New in 2017/18:
7 Intrastate visitor’s (97%) expectations were more likely to be met or exceeded than interstate visitors (92%)
7 Winter visitor’s expectations were more likely to be met or exceeded than Spring (92%), summer (94%), Autumn visitors (93%)
7 Repeat visitor’s (96%) expectations were more likely to be met or exceeded than first time visitors (93%).
05/06 06/07 07/08 08/09 09/10 10/11 11/12 12/13 13/14 14/15 15/16 16/17 17/18
% of visitors 75% 74% 75% 82% 91% 91% 91% 92% 93% 91% 93% 95% 94%
0%
20%
40%
60%
80%
100%

KI TOMM: Visitor Exit Survey Report 2016-2017
46
46
Satisfaction with overall experience (EX1m)
Optimal Conditions Indicator Acceptable
Range
VES 16/17
Result
Kangaroo Island delivers authentic and credible experiences consistent with its positioning
Proportion of visitors very satisfied** with their overall experience on Kangaroo Island
90% - 100%
The proportion of visitors who stated that they were very satisfied with their overall experience on the
island (85%) remained consistent with last year’s measure (86%). Overall satisfaction remains below
the acceptable range of 90%-100%.
Figure 22: Visitors who were very satisfied** with their overall experience on Kangaroo Island
Q22 Taking into account all aspects of your visit to Kangaroo Island, how would you rate your overall satisfaction?
Base: Visitors responding, N=2,011
Note: Missing cases excluded.
** Rated 8-10 on an eleven point scale, where 0 means extremely dissatisfied and 10 means extremely satisfied.
Significant and notable differences between subgroups:
6 New in 2016/17:
7 Air arrivals were more likely to be very satisfied (92%) than sea arrivals (85%).
02/03
03/04
04/05
05/06
06/07
07/08
08/09
09/10
10/11
11/12
12/13
13/14
14/15
15/16
16/17
17/18
% very satisfied** 87% 83% 80% 84% 83% 82% 79% 77% 82% 80% 81% 83% 84% 82% 86% 85%
% very satisfied/ satisfied 92% 96% 94% 95% 96% 96% 96% 97% 97%
% very dissatisfied/ dissatisfied 8% 4% 6% 5% 4% 4% 4% 3% 3%
0%
20%
40%
60%
80%
100%
Scale changed from3-pt to 10-pt scale in 09/10

KI TOMM: Visitor Exit Survey Report 2016-2017
47
47
Seeing native wildlife in its natural environment (EX2a)
Optimal Conditions Indicator Acceptable
Range
VES 17/18
Result
The majority of visitors leave the island highly satisfied with their experience
Proportion of visitors who were very satisfied with seeing native wildlife in its natural environment
70% - 100% The proportion of visitors who were very satisfied with seeing native wildlife in its natural
environment was 69% in 2017/18, which is a significant increase upon last year’s measure
(63%). However this level of satisfaction remains below the acceptable range of 70%-100%.
Figure 23: Visitors who were satisfied with seeing native wildlife in its natural environment
Q19.1 Please indicate how satisfied you were with.... Base: Visitors who experienced it, N=2,000 Note: Don’t know, didn’t experience and missing cases excluded. ** In 2006/07, 2007/08 and 2008/09 satisfaction was measured with a score out of 3. Note: In 2005/06 statement read ‘To see native wildlife, nature and the natural environment’, measured with a score out of 3. Note: In 2004/05 statement read ‘General interest in native wildlife, nature and the natural environment, measured with a score out of 3. Note: In 2003/04 measured with attributes (general interest in native wildlife, nature and the natural environment), with a score out of 3. Note: In 2002/03 satisfaction was measured with a score out of 10.
Significant and notable differences between subgroups:
The results were consistent between subgroups
04/05
05/06
06/07
07/08
08/09
09/10
10/11
11/12
12/13
13/14
14/15
15/16
16/17
17/18
% very satisfied 82% 80% 79% 81% 77% 49% 54% 58% 57% 59% 57% 61% 63% 69%
% very satisfied/ satisfied 77% 81% 84% 82% 84% 84% 87% 88% 88%
% very dissatisfied/ dissatisfied 8% 6% 5% 6% 5% 6% 4% 4% 5%
0%
20%
40%
60%
80%
100%
Scale** changed from 3-pt to 5-pt scale in 09/10
↑
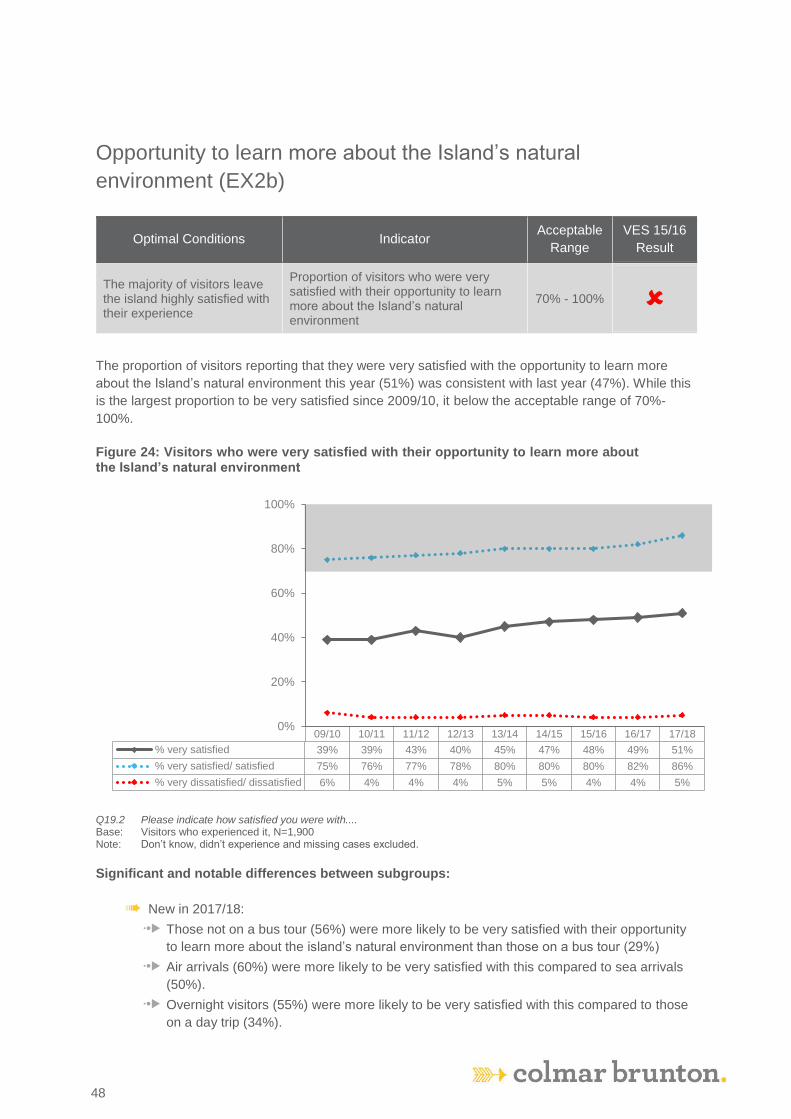
KI TOMM: Visitor Exit Survey Report 2016-2017
48
48
Opportunity to learn more about the Island’s natural
environment (EX2b)
Optimal Conditions Indicator Acceptable
Range
VES 15/16
Result
The majority of visitors leave the island highly satisfied with their experience
Proportion of visitors who were very satisfied with their opportunity to learn more about the Island’s natural environment
70% - 100%
The proportion of visitors reporting that they were very satisfied with the opportunity to learn more
about the Island’s natural environment this year (51%) was consistent with last year (47%). While this
is the largest proportion to be very satisfied since 2009/10, it below the acceptable range of 70%-
100%.
Figure 24: Visitors who were very satisfied with their opportunity to learn more about the Island’s natural environment
Q19.2 Please indicate how satisfied you were with.... Base: Visitors who experienced it, N=1,900 Note: Don’t know, didn’t experience and missing cases excluded. Significant and notable differences between subgroups:
6 New in 2017/18:
7 Those not on a bus tour (56%) were more likely to be very satisfied with their opportunity
to learn more about the island’s natural environment than those on a bus tour (29%)
7 Air arrivals (60%) were more likely to be very satisfied with this compared to sea arrivals
(50%).
7 Overnight visitors (55%) were more likely to be very satisfied with this compared to those
on a day trip (34%).
09/10 10/11 11/12 12/13 13/14 14/15 15/16 16/17 17/18
% very satisfied 39% 39% 43% 40% 45% 47% 48% 49% 51%
% very satisfied/ satisfied 75% 76% 77% 78% 80% 80% 80% 82% 86%
% very dissatisfied/ dissatisfied 6% 4% 4% 4% 5% 5% 4% 4% 5%
0%
20%
40%
60%
80%
100%

KI TOMM: Visitor Exit Survey Report 2016-2017
49
49
Opportunity to learn more about the Island’s history (EX2c)
Optimal Conditions Indicator Acceptable
Range
VES 17/18
Result
The majority of visitors leave
the island highly satisfied
with their experience
Proportion of visitors who were very
satisfied with their opportunity to learn
more about the Island’s history*
70% - 100%
The proportion of visitors who were very satisfied with their opportunity to learn more about the
Island’s history was 42% in 2017/18, which is consistent with last year’s measure (41%). This result
remains outside the acceptable range of 70%-100%.
Figure 25: Satisfaction with opportunity to learn more about the Island’s history
Q19.8 Please indicate how satisfied you were with.... Base: Visitors who experienced it, N=1,843 Note: Don’t know, didn’t experience and missing cases excluded.
* Prior to 2015/16 this was asked as satisfaction “To learn more about the Island’s cultural history” ** Prior to 2009/2010 this was asked as satisfaction “To learn more about Kangaroo Island’s culture and history”, which was measured
with a score out of 3.
Significant and notable differences between subgroups:
The Results were consistent between subgroups
04/05
05/06
06/07
07/08
08/09
09/10
10/11
11/12
12/13
13/14
14/15
15/16
16/17
17/18
% very satisfied 53% 51% 51% 59% 52% 32% 31% 36% 31% 35% 36% 40% 41% 42%
% very satisfied/ satisfied 66% 67% 68% 66% 70% 68% 73% 75% 75%
% very dissatisfied/ dissatisfied 8% 8% 8% 9% 8% 8% 8% 7% 7%
0%
20%
40%
60%
80%
100%
Scale** changed from 3-pt to 5-pt scale in 09/10
Question revised in 15/16*
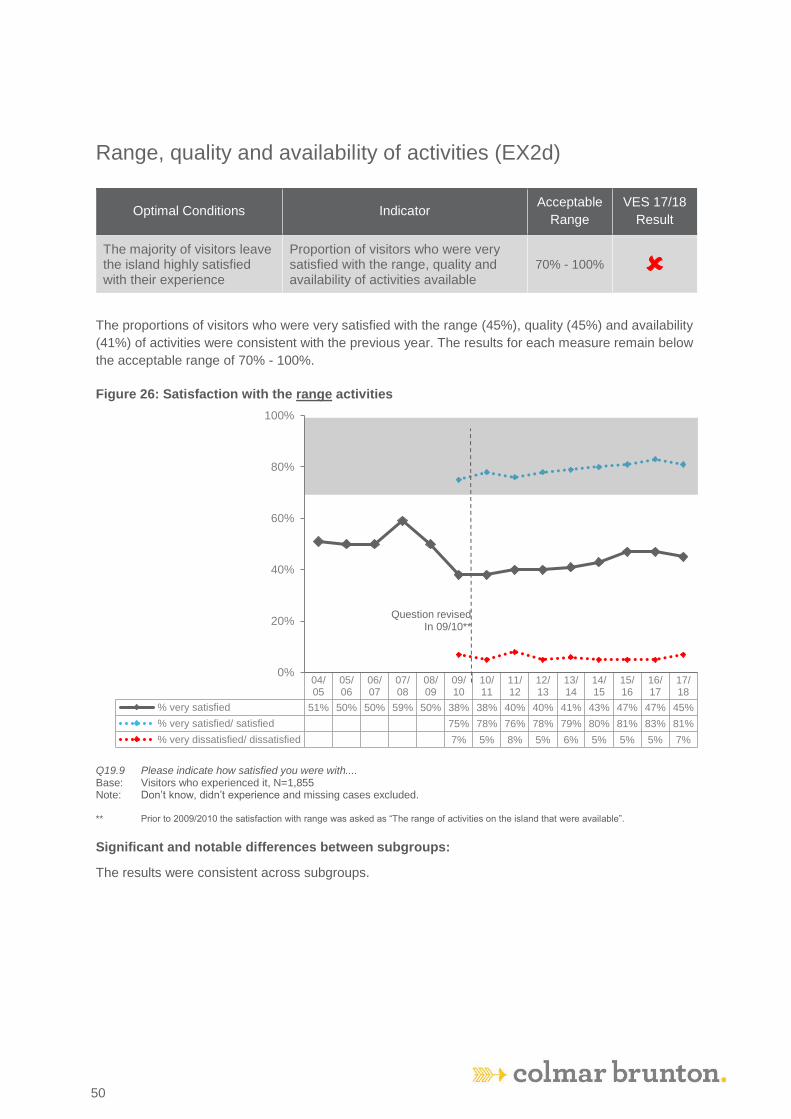
KI TOMM: Visitor Exit Survey Report 2016-2017
50
50
Range, quality and availability of activities (EX2d)
Optimal Conditions Indicator Acceptable
Range
VES 17/18
Result
The majority of visitors leave the island highly satisfied with their experience
Proportion of visitors who were very satisfied with the range, quality and availability of activities available
70% - 100%
The proportions of visitors who were very satisfied with the range (45%), quality (45%) and availability
(41%) of activities were consistent with the previous year. The results for each measure remain below
the acceptable range of 70% - 100%.
Figure 26: Satisfaction with the range activities
Q19.9 Please indicate how satisfied you were with.... Base: Visitors who experienced it, N=1,855 Note: Don’t know, didn’t experience and missing cases excluded. ** Prior to 2009/2010 the satisfaction with range was asked as “The range of activities on the island that were available”. Significant and notable differences between subgroups:
The results were consistent across subgroups.
04/05
05/06
06/07
07/08
08/09
09/10
10/11
11/12
12/13
13/14
14/15
15/16
16/17
17/18
% very satisfied 51% 50% 50% 59% 50% 38% 38% 40% 40% 41% 43% 47% 47% 45%
% very satisfied/ satisfied 75% 78% 76% 78% 79% 80% 81% 83% 81%
% very dissatisfied/ dissatisfied 7% 5% 8% 5% 6% 5% 5% 5% 7%
0%
20%
40%
60%
80%
100%
Question revised In 09/10**

KI TOMM: Visitor Exit Survey Report 2016-2017
51
51
Figure 27: Satisfaction with the quality of activities
Q19.10 Please indicate how satisfied you were with.... Base: Visitors who experienced it, N=1,804 Note: Don’t know, didn’t experience and missing cases excluded.
Significant and notable differences between subgroups:
6 New in 2017/18:
7 International visitors (32%) less likely to be very satisfied with the quality of available
activities than both intrastate (49%) and interstate visitors (48%)
7 Those not on a bus tour (50%) were more likely to be very satisfied with the quality of
available activities than those on a bus tour (17%).
7 Air arrivals (53%) were more likely to be very satisfied with the quality of available
activities than sea arrivals (44%)
7 Overnight visitors (49%) were more likely to be very satisfied with the quality of available
activities than those on a day trip (22%)
09/10 10/11 11/12 12/13 13/14 14/15 15/16 16/17 17/18
% very satisfied 37% 38% 41% 40% 43% 44% 46% 49% 45%
% very satisfied/ satisfied 77% 78% 78% 79% 80% 80% 82% 85% 84%
% very dissatisfied/ dissatisfied 7% 5% 6% 5% 5% 4% 4% 4% 6%
0%
20%
40%
60%
80%
100%
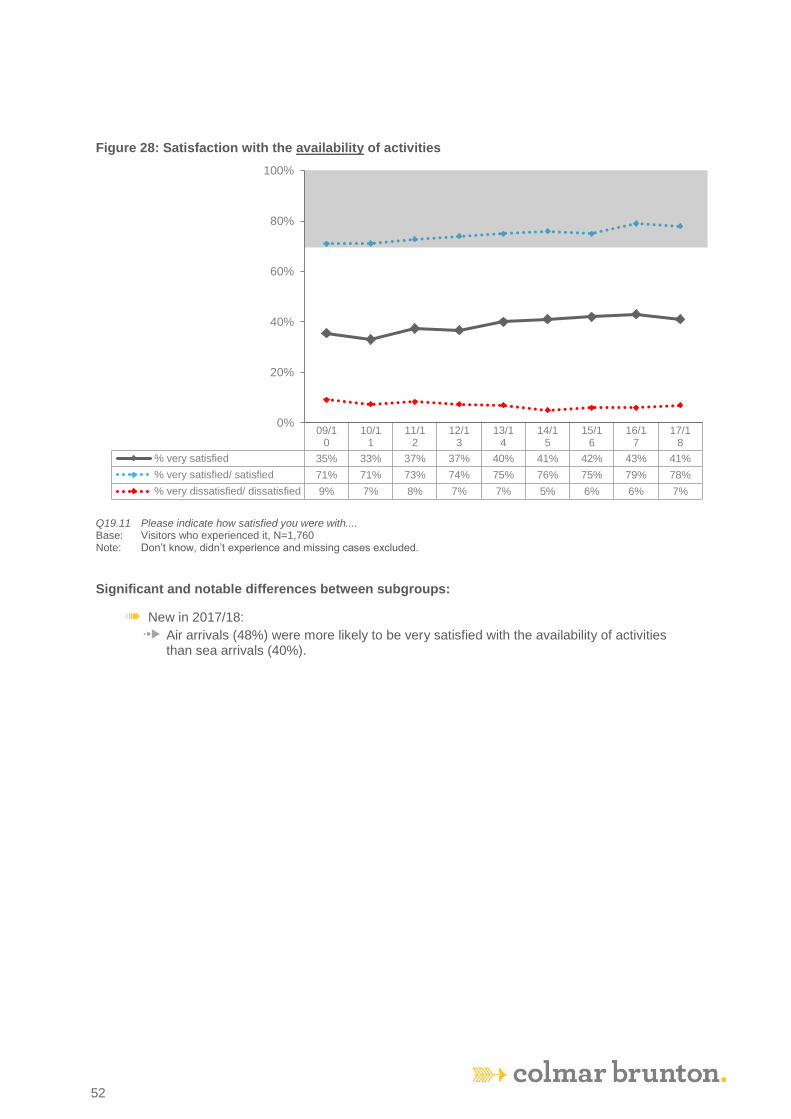
KI TOMM: Visitor Exit Survey Report 2016-2017
52
52
Figure 28: Satisfaction with the availability of activities
Q19.11 Please indicate how satisfied you were with.... Base: Visitors who experienced it, N=1,760 Note: Don’t know, didn’t experience and missing cases excluded.
Significant and notable differences between subgroups:
6 New in 2017/18:
7 Air arrivals (48%) were more likely to be very satisfied with the availability of activities than sea arrivals (40%).
09/10
10/11
11/12
12/13
13/14
14/15
15/16
16/17
17/18
% very satisfied 35% 33% 37% 37% 40% 41% 42% 43% 41%
% very satisfied/ satisfied 71% 71% 73% 74% 75% 76% 75% 79% 78%
% very dissatisfied/ dissatisfied 9% 7% 8% 7% 7% 5% 6% 6% 7%
0%
20%
40%
60%
80%
100%

KI TOMM: Visitor Exit Survey Report 2016-2017
53
53
Quality of accommodation (EX2e)
Optimal Conditions Indicator Acceptable
Range
VES 17/18
Result
The majority of visitors leave the island highly satisfied with their experience
Proportion of visitors who were very satisfied with the quality of accommodation
70% - 100%
The level of satisfaction towards the quality of accommodation this year (50%) was consistent with
satisfaction levels from the previous year. This result is below the acceptable range of 70-100%.
Figure 29: Satisfaction with quality of accommodation
Q19.3 Please indicate how satisfied you were with.... Base: Visitors who experienced it, N=1,867 Note: Don’t know, didn’t experience and missing cases excluded. ** In 2006/2007, 2007/2008 and 2008/2009 satisfaction was measured with a score out of 3 Note: In 2005/2006 statement read ‘To see native wildlife, nature and the natural environment.’ Satisfaction was measured with a score out
of 3. Note: In 2004/2005 statement used was ‘General interest in native wildlife, nature and the natural environment’. Satisfaction was measured
with a score out of 3.
Significant and notable differences between subgroups
6 Consistent with the previous year:
7 Air arrivals were more likely to be very satisfied (61%) than sea arrivals (49%).
04/05
05/06
06/07
07/08
08/09
09/10
10/11
11/12
12/13
13/14
14/15
15/16
16/17
17/18
% very satisfied 60% 59% 61% 69% 67% 46% 46% 46% 45% 46% 48% 50% 51% 50%
% very satisfied/ satisfied 75% 77% 78% 76% 76% 76% 80% 80% 78%
% very dissatisfied/ dissatisfied 10% 6% 7% 8% 7% 7% 5% 6% 8%
0%
20%
40%
60%
80%
100%
Scale** changed from 3-pt to 5-pt scale in
09/10

KI TOMM: Visitor Exit Survey Report 2016-2017
54
54
Range, quality and availability of Kangaroo Island produce
(EX2f)
Optimal Conditions Indicator Acceptable
Range
VES 17/18
Result
The majority of visitors leave the island highly satisfied with their experience
Proportion of visitors who were very satisfied with the range, quality and availability of local Kangaroo Island products
70% - 100%
The proportions of visitors very satisfied with the range (51%), quality (54%) and availability (47%) of
local Kangaroo Island produce were consistent with the previous year. These results remain below
the acceptable range of 70-100%.
Figure 30: Satisfaction with the range of local Kangaroo Island produce
Q19.4 Please indicate how satisfied you were with.... Base: Visitors who experienced it, N=1,679 Note: Don’t know, didn’t experience and missing cases excluded.
Significant and notable differences between subgroups:
6 Consistent with the previous year:
7 International visitors (37%) were less likely to be very satisfied with the range of KI
produce than both Interstate (51%) and intrastate visitors (56%).
09/10 10/11 11/12 12/13 13/14 14/15 15/16 16/17 17/18
% very satisfied 38% 38% 37% 39% 40% 43% 46% 48% 51%
% very satisfied/ satisfied 71% 74% 71% 72% 72% 74% 78% 79% 81%
% very dissatisfied/ dissatisfied 9% 6% 8% 7% 7% 7% 7% 6% 8%
0%
20%
40%
60%
80%
100%

KI TOMM: Visitor Exit Survey Report 2016-2017
55
55
Figure 31: Satisfaction with the quality of local Kangaroo Island produce
Q19.5 Please indicate how satisfied you were with.... Base: Visitors who experienced it, N=1,824 Note: Don’t know, didn’t experience and missing cases excluded.
Significant and notable differences between subgroups:
6 Consistent with the previous year:
7 Interstate visitors (61%) were more likely to be very satisfied with the quality of island produce than international visitors (44%);
6 New in 2017/18:
7 Summer visitors (60%) were more likely to be very satisfied with the quality of island produce than winter visitors (39%).
09/10 10/11 11/12 12/13 13/14 14/15 15/16 16/17 17/18
% very satisfied 44% 45% 43% 44% 47% 50% 52% 52% 54%
% very satisfied/ satisfied 77% 81% 78% 78% 80% 82% 84% 84% 85%
% very dissatisfied/ dissatisfied 7% 5% 6% 6% 5% 5% 5% 5% 7%
0%
20%
40%
60%
80%
100%
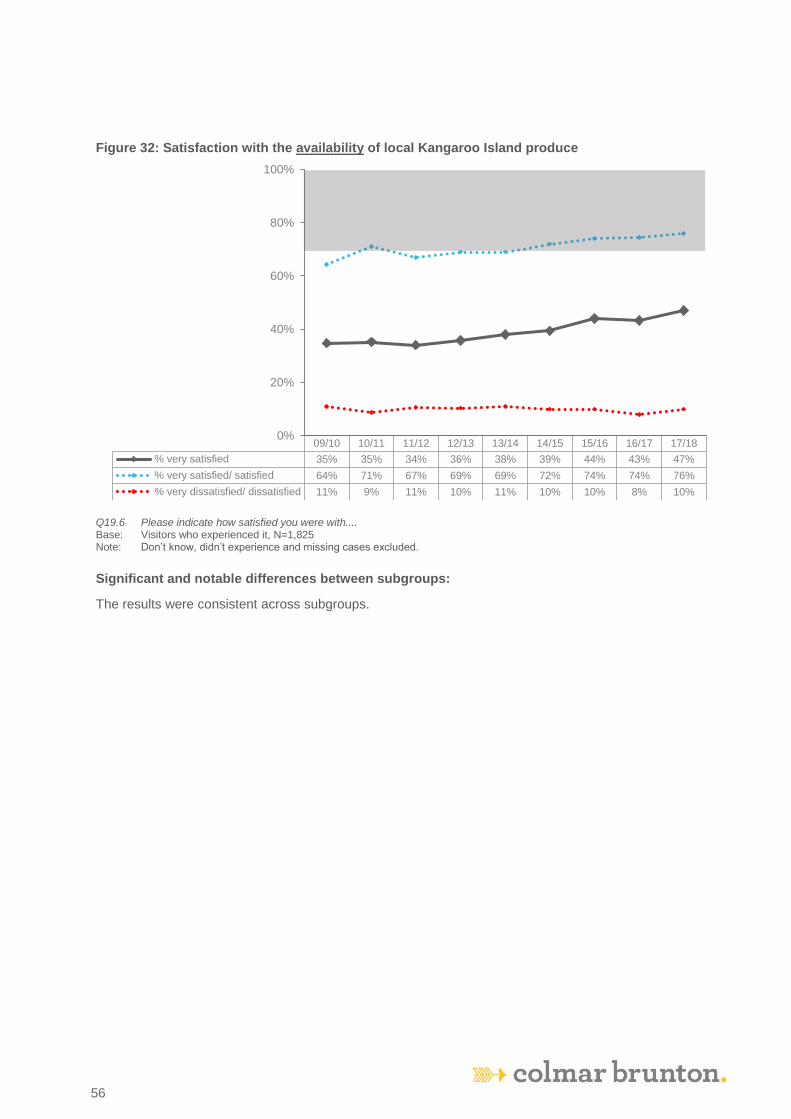
KI TOMM: Visitor Exit Survey Report 2016-2017
56
56
Figure 32: Satisfaction with the availability of local Kangaroo Island produce
Q19.6 Please indicate how satisfied you were with.... Base: Visitors who experienced it, N=1,825 Note: Don’t know, didn’t experience and missing cases excluded.
Significant and notable differences between subgroups:
The results were consistent across subgroups.
09/10 10/11 11/12 12/13 13/14 14/15 15/16 16/17 17/18
% very satisfied 35% 35% 34% 36% 38% 39% 44% 43% 47%
% very satisfied/ satisfied 64% 71% 67% 69% 69% 72% 74% 74% 76%
% very dissatisfied/ dissatisfied 11% 9% 11% 10% 11% 10% 10% 8% 10%
0%
20%
40%
60%
80%
100%

KI TOMM: Visitor Exit Survey Report 2016-2017
57
57
Quality of public tourism infrastructure (EX2h)
Optimal Conditions Indicator Acceptable
Range
VES 17/18
Result
The majority of visitors leave the island highly satisfied with their experience
Proportion of visitors who were very satisfied with the quality of public tourism infrastructure (toilets, roads, campgrounds, public parks, picnic and signage) provided on Kangaroo Island
60%-100%
The proportion of visitors who were very satisfied with various elements of Kangaroo Island’s
public tourism infrastructure remained unchanged for all aspects, except the quality of roads
which increased from 25% in 2016/17 to 32% in 2017/18. Results for each element of public
tourism infrastructure (e.g. toilets, roads, campgrounds) remain below the acceptable range
of 60-100%.
Figure 33: Satisfaction with the quality of picnic & day use areas
Q19.18 Please indicate how satisfied you were with.... Base: Visitors who experienced it, N=1,212 Note: Don’t know, didn’t experience and missing cases excluded.
Significant and notable differences between subgroups:
The results were consistent across subgroups.
09/10 10/11 11/12 12/13 13/14 14/15 15/16 16/17 17/18
% very satisfied 30% 35% 46% 43% 44% 46% 48% 47% 48%
% very satisfied/ satisfied 73% 78% 80% 83% 82% 82% 83% 85% 83%
% very dissatisfied/ dissatisfied 9% 5% 4% 5% 5% 6% 6% 4% 6%
0%
20%
40%
60%
80%
100%

KI TOMM: Visitor Exit Survey Report 2016-2017
58
58
Figure 34: Satisfaction with the quality of interpretive & educational signage
Q19.17 Please indicate how satisfied you were with.... Base: Visitors who experienced it, N=1,544 Note: Don’t know, didn’t experience and missing cases excluded.
Significant and notable differences between subgroups:
The results were consistent across subgroups.
09/10 10/11 11/12 12/13 13/14 14/15 15/16 16/17 17/18
% very satisfied 29% 28% 35% 31% 35% 35% 40% 40% 40%
% very satisfied/ satisfied 67% 71% 75% 72% 75% 75% 79% 79% 79%
% very dissatisfied/ dissatisfied 9% 6% 6% 7% 7% 7% 6% 7% 7%
0%
20%
40%
60%
80%
100%

KI TOMM: Visitor Exit Survey Report 2016-2017
59
59
Figure 35: Satisfaction with the quality of public toilets
Q19.13 Please indicate how satisfied you were with.... Base: Visitors who experienced it, N=1,847 Note: Don’t know, didn’t experience and missing cases excluded.
Significant and notable differences between subgroups:
The results were consistent across subgroups.
09/10 10/11 11/12 12/13 13/14 14/15 15/16 16/17 17/18
% very satisfied 25% 31% 38% 34% 36% 41% 43% 43% 42%
% very satisfied/ satisfied 64% 69% 75% 74% 74% 79% 80% 80% 76%
% very dissatisfied/ dissatisfied 13% 9% 7% 7% 7% 8% 5% 6% 7%
0%
20%
40%
60%
80%
100%
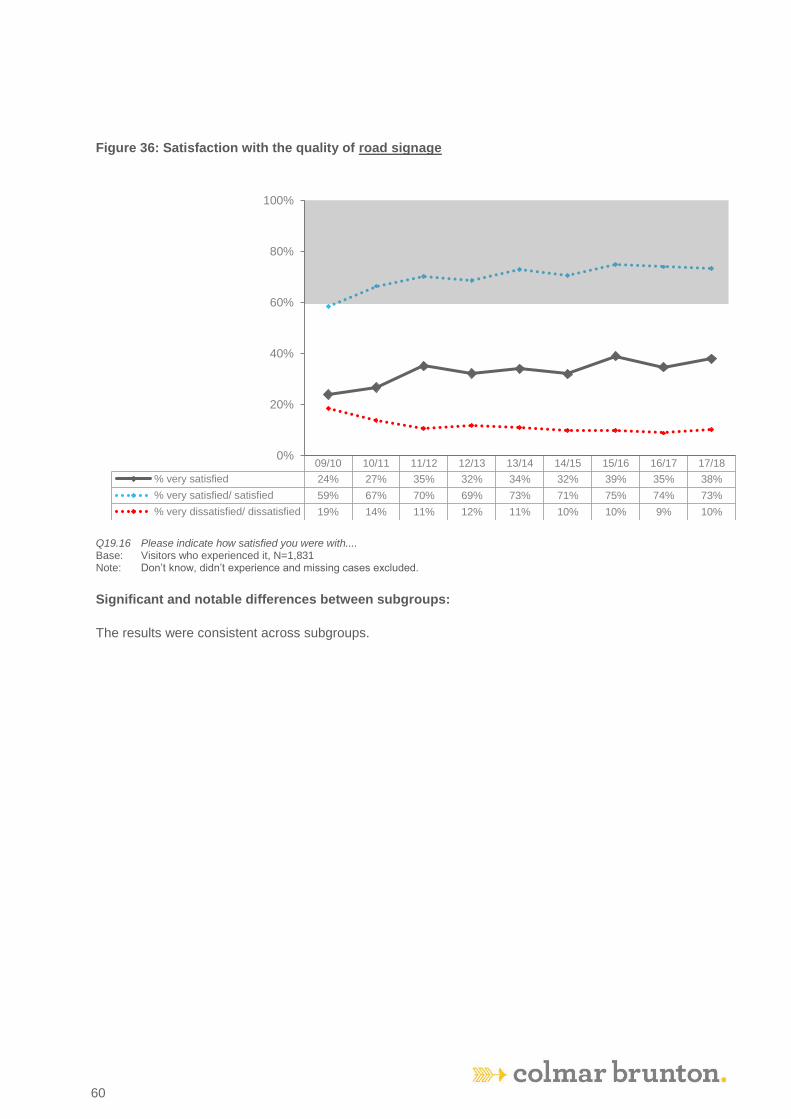
KI TOMM: Visitor Exit Survey Report 2016-2017
60
60
Figure 36: Satisfaction with the quality of road signage
Q19.16 Please indicate how satisfied you were with.... Base: Visitors who experienced it, N=1,831 Note: Don’t know, didn’t experience and missing cases excluded.
Significant and notable differences between subgroups:
The results were consistent across subgroups.
09/10 10/11 11/12 12/13 13/14 14/15 15/16 16/17 17/18
% very satisfied 24% 27% 35% 32% 34% 32% 39% 35% 38%
% very satisfied/ satisfied 59% 67% 70% 69% 73% 71% 75% 74% 73%
% very dissatisfied/ dissatisfied 19% 14% 11% 12% 11% 10% 10% 9% 10%
0%
20%
40%
60%
80%
100%

KI TOMM: Visitor Exit Survey Report 2016-2017
61
61
Figure 37: Satisfaction with the quality of campgrounds
Q19.15 Please indicate how satisfied you were with.... Base: Visitors who experienced it, N=595 Note: Don’t know, didn’t experience and missing cases excluded.
Significant and notable differences between subgroups:
6 New in 2017/18:
7 Air arrivals (55%) were more likely to be very satisfied with the quality of campgrounds than sea arrivals (39%).
09/10 10/11 11/12 12/13 13/14 14/15 15/16 16/17 17/18
% very satisfied 21% 26% 41% 33% 37% 34% 44% 43% 40%
% very satisfied/ satisfied 58% 65% 72% 66% 69% 70% 73% 75% 73%
% very dissatisfied/ dissatisfied 17% 11% 7% 13% 9% 9% 8% 7% 11%
0%
20%
40%
60%
80%
100%
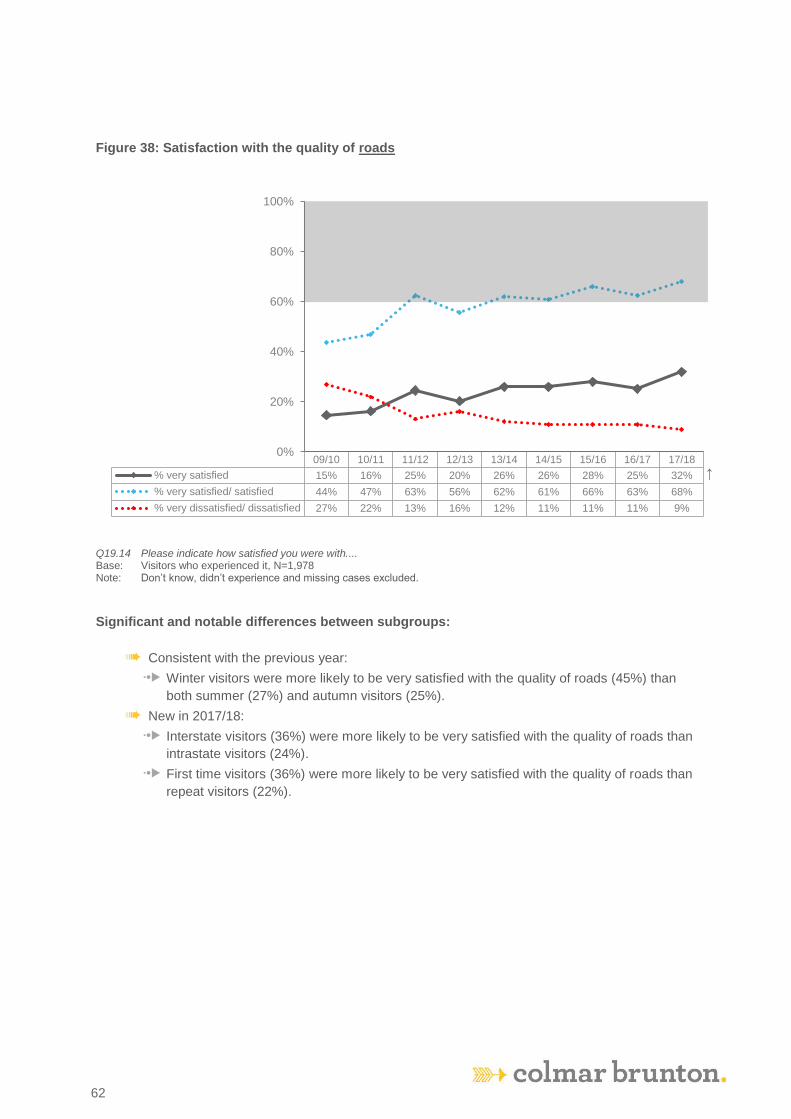
KI TOMM: Visitor Exit Survey Report 2016-2017
62
62
Figure 38: Satisfaction with the quality of roads
Q19.14 Please indicate how satisfied you were with.... Base: Visitors who experienced it, N=1,978 Note: Don’t know, didn’t experience and missing cases excluded.
Significant and notable differences between subgroups:
6 Consistent with the previous year:
7 Winter visitors were more likely to be very satisfied with the quality of roads (45%) than
both summer (27%) and autumn visitors (25%).
6 New in 2017/18:
7 Interstate visitors (36%) were more likely to be very satisfied with the quality of roads than
intrastate visitors (24%).
7 First time visitors (36%) were more likely to be very satisfied with the quality of roads than
repeat visitors (22%).
09/10 10/11 11/12 12/13 13/14 14/15 15/16 16/17 17/18
% very satisfied 15% 16% 25% 20% 26% 26% 28% 25% 32%
% very satisfied/ satisfied 44% 47% 63% 56% 62% 61% 66% 63% 68%
% very dissatisfied/ dissatisfied 27% 22% 13% 16% 12% 11% 11% 11% 9%
0%
20%
40%
60%
80%
100%
↑

KI TOMM: Visitor Exit Survey Report 2016-2017
63
63
Recommendation of Kangaroo Island as holiday destination
(EX2i)
Optimal Conditions Indicator Acceptable
Range
VES 17/18
Result
The majority of visitors leave the island highly satisfied with their experience
Proportion of visitors that would recommend Kangaroo Island as a holiday destination to others as a result of their experience
90% - 100%
The proportion of visitors who would recommend Kangaroo Island as a destination to others was 95%
in 2017/18. This result is consistent with that from the previous year (95%) and falls within the
acceptable range of 90%-100%.
Figure 39: Willingness to recommend
Q23 Would you recommend Kangaroo Island as a holiday destination to others based on this trip?
Base: Visitors responding, N=2,014
Note: Missing cases excluded.
Significant and notable differences between subgroups:
6 Consistent with the previous year:
7 Interstate visitors (93%) were less likely to recommend KI to others (93%) than intrastate
visitors (97%).
7 Air arrivals were more likely to recommend KI to others (97%) than sea arrivals (94%).
6 New in 2016/17:
7 Repeat visitors (97%) were more likely to recommend KI to others than first time visitors (94%).
7 Visitors who spent $200 or less per night (96%) were more likely to recommend KI to others than those who spent $201 or more per night (92%).
00/01
01/02
02/03
03/04
04/05
05/06
06/07
07/08
08/09
09/10
10/11
11/12
12/13
13/14
14/15
15/16
16/17
17/18
% willing to recommend 98% 97% 99% 98% 98% 98% 98% 97% 95% 90% 94% 92% 93% 93% 93% 93% 95% 95%
0%
20%
40%
60%
80%
100%
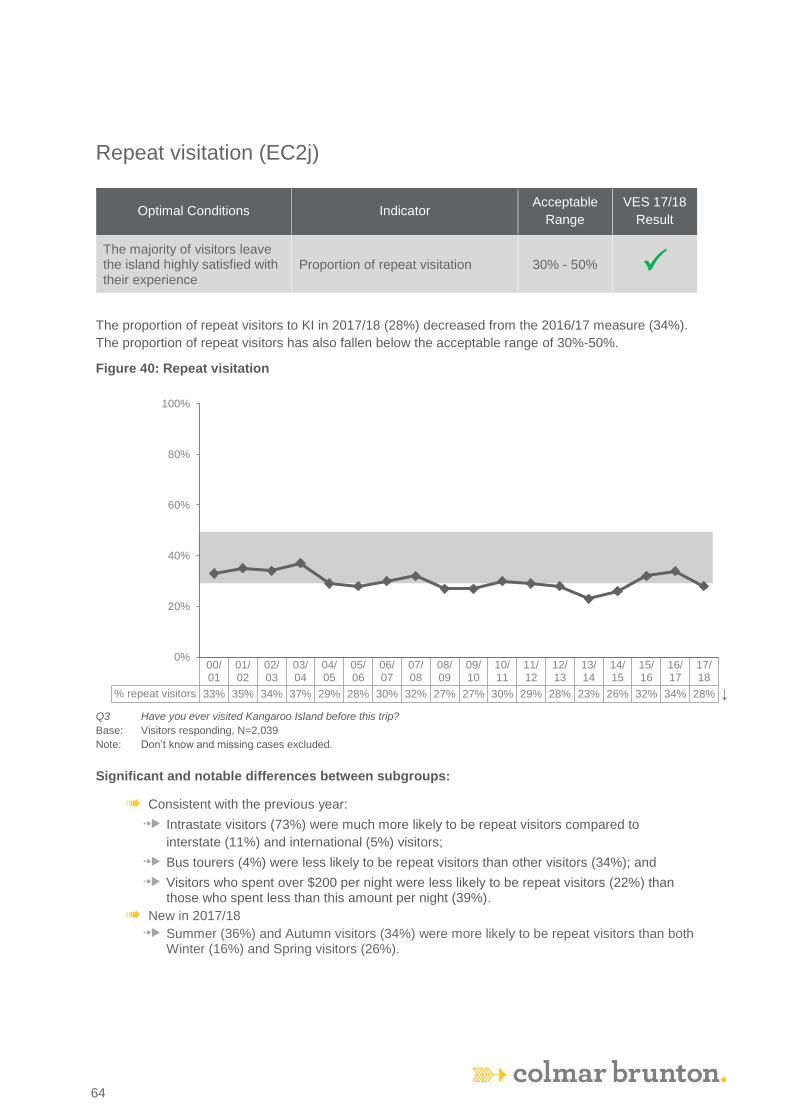
KI TOMM: Visitor Exit Survey Report 2016-2017
64
64
Repeat visitation (EC2j)
Optimal Conditions Indicator Acceptable
Range
VES 17/18
Result
The majority of visitors leave the island highly satisfied with their experience
Proportion of repeat visitation 30% - 50%
The proportion of repeat visitors to KI in 2017/18 (28%) decreased from the 2016/17 measure (34%).
The proportion of repeat visitors has also fallen below the acceptable range of 30%-50%.
Figure 40: Repeat visitation
Q3 Have you ever visited Kangaroo Island before this trip?
Base: Visitors responding, N=2,039
Note: Don’t know and missing cases excluded.
Significant and notable differences between subgroups:
6 Consistent with the previous year:
7 Intrastate visitors (73%) were much more likely to be repeat visitors compared to
interstate (11%) and international (5%) visitors;
7 Bus tourers (4%) were less likely to be repeat visitors than other visitors (34%); and
7 Visitors who spent over $200 per night were less likely to be repeat visitors (22%) than those who spent less than this amount per night (39%).
6 New in 2017/18
7 Summer (36%) and Autumn visitors (34%) were more likely to be repeat visitors than both Winter (16%) and Spring visitors (26%).
00/01
01/02
02/03
03/04
04/05
05/06
06/07
07/08
08/09
09/10
10/11
11/12
12/13
13/14
14/15
15/16
16/17
17/18
% repeat visitors 33% 35% 34% 37% 29% 28% 30% 32% 27% 27% 30% 29% 28% 23% 26% 32% 34% 28%
0%
20%
40%
60%
80%
100%
↓
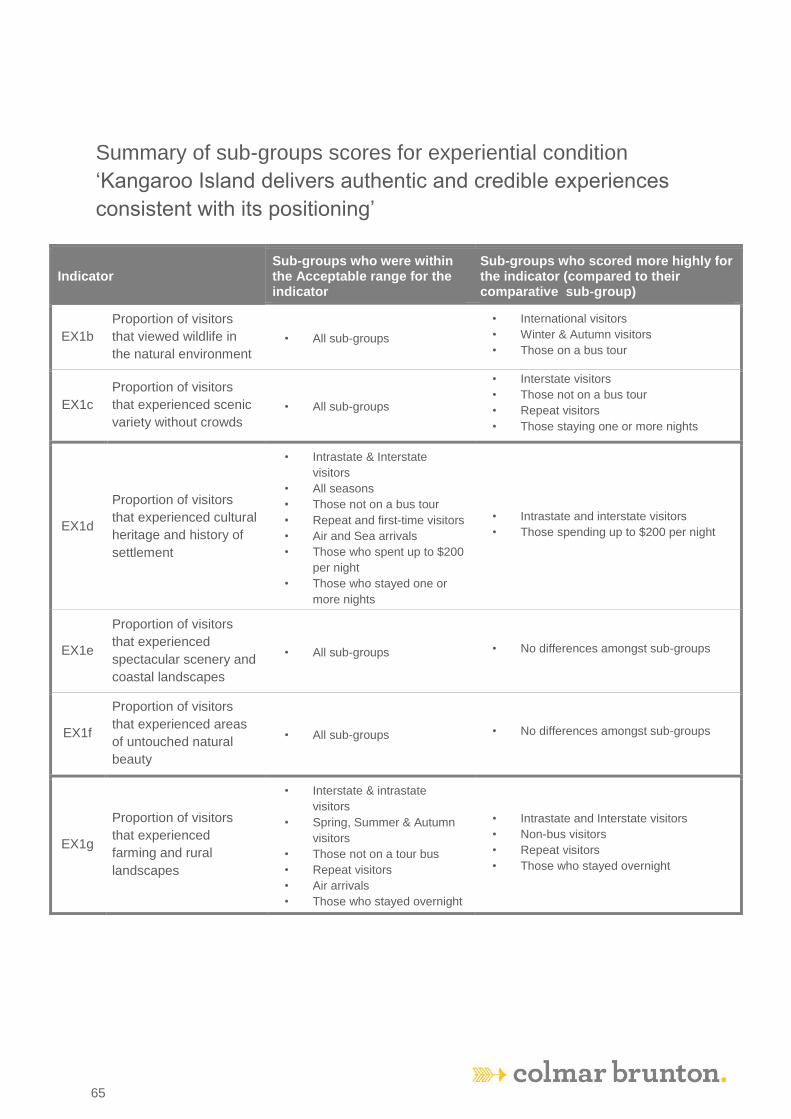
KI TOMM: Visitor Exit Survey Report 2016-2017
65
65
Summary of sub-groups scores for experiential condition
‘Kangaroo Island delivers authentic and credible experiences
consistent with its positioning’
Indicator Sub-groups who were within the Acceptable range for the indicator
Sub-groups who scored more highly for the indicator (compared to their comparative sub-group)
EX1b
Proportion of visitors
that viewed wildlife in
the natural environment
• All sub-groups
• International visitors
• Winter & Autumn visitors
• Those on a bus tour
EX1c
Proportion of visitors
that experienced scenic
variety without crowds
• All sub-groups
• Interstate visitors
• Those not on a bus tour
• Repeat visitors
• Those staying one or more nights
EX1d
Proportion of visitors
that experienced cultural
heritage and history of
settlement
• Intrastate & Interstate
visitors
• All seasons
• Those not on a bus tour
• Repeat and first-time visitors
• Air and Sea arrivals
• Those who spent up to $200
per night
• Those who stayed one or
more nights
• Intrastate and interstate visitors
• Those spending up to $200 per night
EX1e
Proportion of visitors
that experienced
spectacular scenery and
coastal landscapes
• All sub-groups • No differences amongst sub-groups
EX1f
Proportion of visitors
that experienced areas
of untouched natural
beauty
• All sub-groups • No differences amongst sub-groups
EX1g
Proportion of visitors
that experienced
farming and rural
landscapes
• Interstate & intrastate
visitors
• Spring, Summer & Autumn
visitors
• Those not on a tour bus
• Repeat visitors
• Air arrivals
• Those who stayed overnight
• Intrastate and Interstate visitors
• Non-bus visitors
• Repeat visitors
• Those who stayed overnight

KI TOMM: Visitor Exit Survey Report 2016-2017
66
66
Summary of sub-groups scores for experiential condition
‘Kangaroo Island delivers authentic and credible experiences
consistent with its positioning’ (continued)
Indicator Sub-groups who were within the Acceptable range for the indicator
Sub-groups who scored more highly for the indicator (compared to their comparative sub-group)
EX1h
Proportion of visitors
that experienced local
Kangaroo Island
produce
• All except international
visitors, winter visitors, first
time visitors, those on a tour
bus and day trippers
• Interstate and intrastate visitors
• Spring, Summer & Autumn visitors
• Repeat visitors
• Air arrivals
• Those who stayed overnight
• Those not on a bus tour
EX1i
Proportion of visitors
that believe Kangaroo
Island offers one of
Australia’s top three
nature & wildlife
experiences
• All sub-groups • International & Intrastate visitors
EX1j
Proportion of visitors
that believe Kangaroo
Island has a friendly
local community
• All sub-groups
• Intrastate & interstate visitors
• Those not on a bus tour
• Repeat visitors
• Those staying overnight
EX1k
Proportion of visitors who
agree that Kangaroo Island
is a wild and welcoming
destination, that will
surprise and amaze you,
relax your mind, refresh
your spirit and make you
feel totally alive. It provides
an opportunity to view and
to discover all the scenic
variety of mainland
Australia
• All sub-groups
• Intrastate visitors
• Repeat visitors
• Air arrivals
EX1l
Proportion of visitors
that state that their
experience matched or
exceeded expectation
set by marketing
materials
• All sub-groups
• Intrastate visitors
• Winter visitors
• Repeat visitors
• Air arrivals
EX1m
Proportion of visitors
very satisfied with their
overall experience on
Kangaroo Island
• Air arrivals • Air Arrivals

KI TOMM: Visitor Exit Survey Report 2016-2017
67
67
Summary of sub-groups scores for experiential condition ‘The
majority of visitors leave the Island highly satisfied with their
experience’
Indicator
Sub-groups who were within the Acceptable range for the indicator
Sub-groups who scored more highly for the indicator (compared to their comparative sub-group)
EX2a Proportion of visitors who were very satisfied with seeing native wildlife in its natural environment
• Intrastate & International visitors • Winter, Spring & Summer
visitors • Those not on a bus tour • Repeat visitors • Air arrivals • Those who spent more than
$200 per night • Those staying overnight
• No significant differences
EX2b
Proportion of visitors who were very satisfied with their opportunity to learn more about the Island’s natural environment
• None
• Those not on a bus tour • Air arrivals • Those who stayed overnight
EX2c
Proportion of visitors who were very satisfied with their opportunity to learn more about the Island’s cultural history
• None • No significant differences
Ex2d
Proportion of visitors who were very satisfied with the range, quality and availability of activities available
• None
• Those not on a bus tour (quality)
• Air arrivals (quality & availability)
• Stayed overnight (quality)
EX2e Proportion of visitors who were very satisfied with the quality of accommodation
• None • Air arrivals
EX2f
Proportion of visitors who were very satisfied with the range, quality and availability of Kangaroo Island produce
• None
• Intrastate & interstate visitors (range & quality)
• Summer visitors (quality)
EX2g Proportion of visitors that are very satisfied with the level of customer service they receive
• None • Air arrivals
EX2h
Proportion of visitors that are very satisfied with the quality of public tourism infrastructure (toilets, roads, campgrounds, picnic areas and signage) provided on Kangaroo Island
• None
• Intrastate visitors (roads) • Air arrivals (campgrounds) • Winter (roads) • First time visitors (roads)

KI TOMM: Visitor Exit Survey Report 2016-2017
68
68
EX2i
Proportion of visitors that would recommend Kangaroo Island as a holiday destination to others as a result of their experience
• All sub-groups
• Intrastate visitors • Repeat visitors • Air arrivals • Those spending up to $200
per night

KI TOMM: Visitor Exit Survey Report 2016-2017
69
69
Summary of sub-groups scores for experiential condition ‘The
majority of visitors leave the Island highly satisfied with their
experience’ (continued)
Indicator
Sub-groups who were within the Acceptable range for the indicator
Sub-groups who scored more highly for the indicator (compared to their comparative sub-group)
EX2j Proportion of repeat visitation
• Summer & autumn visitors • Those not on a bus tour • Those spending up to $200 per
night • Those who stayed one or more
nights
• Intrastate visitors • Summer & Autumn visitors • Those spending up to $200
per night • Those not on a bus tour • Those who stayed one or
more nights
KI TOMM: Visitor Exit Survey Report 2016-2017
70
70
Environmental Indicators
Overview
This year, the proportion of visitations to natural areas occurring on managed sites remained
consistent with the previous year and fell within the acceptable range of between 70%-100%. The
most popular location was Admirals Arch with visitation at 82% of the sample which was closely
followed by Flinders chase National Park (81%) and Remarkable Rocks (80%). Awareness of
quarantine regulations prior to visitor arrival also remained stable at 63%, below the acceptable range
of 70%-100%. Finally, awareness levels for specific prohibited items were also consistent with levels
from the previous year, aside from declared weeds (63%), awareness of which decreased from last
year (70%).

KI TOMM: Visitor Exit Survey Report 2016-2017
71
71
Visits to natural areas occurring on managed sites (EN2b)
Optimal Conditions Indicator Acceptable
Range
VES 17/18
Result
Visitor activity has minimal negative impacts on the natural environment
Proportion of visitations to natural areas occurring on managed sites
70% - 100%
The proportion of visits to managed sites (74%) has remained consistent over the past five years, and
continues to fall within the acceptable range of 70%-100%.
Figure 41: Proportion of visitations to natural areas occurring on managed sites
Q17 Which of these locations did you visit while on Kangaroo Island this time? Base: Total visitors, N=1,604
Significant and notable differences between subgroups:
The results were consistent across subgroups.
10/11 11/12 12/13 13/14 14/15 15/16 16/17 17/18
% of visits tomanaged sites
75% 76% 75% 76% 75% 76% 75% 74%
0%
20%
40%
60%
80%
100%
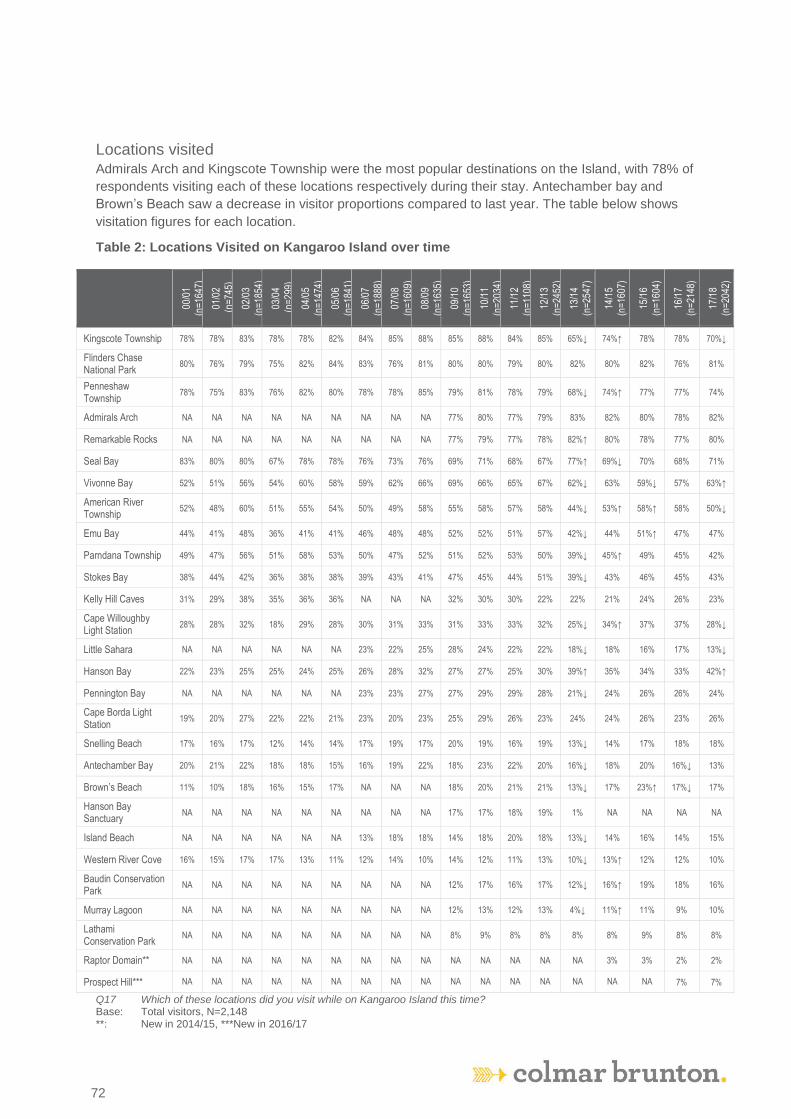
KI TOMM: Visitor Exit Survey Report 2016-2017
72
72
Locations visited Admirals Arch and Kingscote Township were the most popular destinations on the Island, with 78% of
respondents visiting each of these locations respectively during their stay. Antechamber bay and
Brown’s Beach saw a decrease in visitor proportions compared to last year. The table below shows
visitation figures for each location.
Table 2: Locations Visited on Kangaroo Island over time
Q17 Which of these locations did you visit while on Kangaroo Island this time? Base: Total visitors, N=2,148 **: New in 2014/15, ***New in 2016/17
00/0
1 (n
=16
47)
01/0
2
(n=
745)
02/0
3
(n=
1854
)
03/0
4
(n=
299)
04/0
5
(n=
1474
)
05/0
6 (n
=18
41)
06/0
7 (n
=18
88)
07/0
8
(n=
1609
)
08/0
9 (n
=16
35)
09/1
0
(n=
1653
)
10/1
1
(n=
2034
)
11/1
2
(n=
1108
)
12/1
3
(n=
2452
)
13/1
4
(n=
2547
)
14/1
5 (n
=16
07)
15/1
6
(n=
1604
)
16/1
7 (n
=21
48)
17/1
8
(n=
2042
)
Kingscote Township 78% 78% 83% 78% 78% 82% 84% 85% 88% 85% 88% 84% 85% 65%↓ 74%↑ 78% 78% 70%↓
Flinders Chase National Park
80% 76% 79% 75% 82% 84% 83% 76% 81% 80% 80% 79% 80% 82% 80% 82% 76% 81%
Penneshaw Township
78% 75% 83% 76% 82% 80% 78% 78% 85% 79% 81% 78% 79% 68%↓ 74%↑ 77% 77% 74%
Admirals Arch NA NA NA NA NA NA NA NA NA 77% 80% 77% 79% 83% 82% 80% 78% 82%
Remarkable Rocks NA NA NA NA NA NA NA NA NA 77% 79% 77% 78% 82%↑ 80% 78% 77% 80%
Seal Bay 83% 80% 80% 67% 78% 78% 76% 73% 76% 69% 71% 68% 67% 77%↑ 69%↓ 70% 68% 71%
Vivonne Bay 52% 51% 56% 54% 60% 58% 59% 62% 66% 69% 66% 65% 67% 62%↓ 63% 59%↓ 57% 63%↑
American River Township
52% 48% 60% 51% 55% 54% 50% 49% 58% 55% 58% 57% 58% 44%↓ 53%↑ 58%↑ 58% 50%↓
Emu Bay 44% 41% 48% 36% 41% 41% 46% 48% 48% 52% 52% 51% 57% 42%↓ 44% 51%↑ 47% 47%
Parndana Township 49% 47% 56% 51% 58% 53% 50% 47% 52% 51% 52% 53% 50% 39%↓ 45%↑ 49% 45% 42%
Stokes Bay 38% 44% 42% 36% 38% 38% 39% 43% 41% 47% 45% 44% 51% 39%↓ 43% 46% 45% 43%
Kelly Hill Caves 31% 29% 38% 35% 36% 36% NA NA NA 32% 30% 30% 22% 22% 21% 24% 26% 23%
Cape Willoughby Light Station
28% 28% 32% 18% 29% 28% 30% 31% 33% 31% 33% 33% 32% 25%↓ 34%↑ 37% 37% 28%↓
Little Sahara NA NA NA NA NA NA 23% 22% 25% 28% 24% 22% 22% 18%↓ 18% 16% 17% 13%↓
Hanson Bay 22% 23% 25% 25% 24% 25% 26% 28% 32% 27% 27% 25% 30% 39%↑ 35% 34% 33% 42%↑
Pennington Bay NA NA NA NA NA NA 23% 23% 27% 27% 29% 29% 28% 21%↓ 24% 26% 26% 24%
Cape Borda Light Station
19% 20% 27% 22% 22% 21% 23% 20% 23% 25% 29% 26% 23% 24% 24% 26% 23% 26%
Snelling Beach 17% 16% 17% 12% 14% 14% 17% 19% 17% 20% 19% 16% 19% 13%↓ 14% 17% 18% 18%
Antechamber Bay 20% 21% 22% 18% 18% 15% 16% 19% 22% 18% 23% 22% 20% 16%↓ 18% 20% 16%↓ 13%
Brown’s Beach 11% 10% 18% 16% 15% 17% NA NA NA 18% 20% 21% 21% 13%↓ 17% 23%↑ 17%↓ 17%
Hanson Bay Sanctuary
NA NA NA NA NA NA NA NA NA 17% 17% 18% 19% 1% NA NA NA NA
Island Beach NA NA NA NA NA NA 13% 18% 18% 14% 18% 20% 18% 13%↓ 14% 16% 14% 15%
Western River Cove 16% 15% 17% 17% 13% 11% 12% 14% 10% 14% 12% 11% 13% 10%↓ 13%↑ 12% 12% 10%
Baudin Conservation Park
NA NA NA NA NA NA NA NA NA 12% 17% 16% 17% 12%↓ 16%↑ 19% 18% 16%
Murray Lagoon NA NA NA NA NA NA NA NA NA 12% 13% 12% 13% 4%↓ 11%↑ 11% 9% 10%
Lathami Conservation Park
NA NA NA NA NA NA NA NA NA 8% 9% 8% 8% 8% 8% 9% 8% 8%
Raptor Domain** NA NA NA NA NA NA NA NA NA NA NA NA NA NA 3% 3% 2% 2%
Prospect Hill*** NA NA NA NA NA NA NA NA NA NA NA NA NA NA NA NA 7% 7%

KI TOMM: Visitor Exit Survey Report 2016-2017
73
73
Awareness of quarantine regulations prior to arriving (EN2e)
Optimal Conditions Indicator Acceptable
Range
VES 17/18
Result
Visitor activity has minimal negative impacts on the natural environment
Proportion of visitors aware of quarantine regulations prior to arriving on Kangaroo Island
70% - 100%
The proportion of visitors aware of quarantine regulations prior to arrival was 63% in 2017/18, which is
consistent with last year’s measure and below the acceptable range of 70%-100%.
Figure 42: Awareness of quarantine regulations
Q16a Were you aware of Kangaroo Island’s quarantine regulations, prohibiting the import of.... Q16b If yes, when did you find out this information Base: Visitors responding, N=2,042 ** The measurement method was different in 2007/2008 and 2008/2009, so these figures were slightly changed to enable tracking of this
indicator. The current awareness measurement used is the percentage of all respondents that were aware of the quarantine regulations.
Significant and notable differences between subgroups:
6 Consistent with the previous year:
7 Intrastate (73%) were more likely than both interstate (62%) and international visitors (50%) to be aware of quarantine regulations before their visit to the Island;
7 Repeat visitors (75%) were more likely to be aware than first time visitors (59%);
7 Overnight visitors (72%) were more likely to be aware than day trippers (30%);
7 Those who spent less than $200 per night (77%) were more likely to be aware than those who spent more than this amount (64%);
7 Sea arrivals (64%) were more likely to be aware than air arrivals (54%); and
7 Those not on a bus tour (71%) were more likely to be aware than those on a bus tour (27%).
6 New in 2017/18
7 Winter visitors (46%) were less likely to be aware than Spring (64%), Summer (66%) and Autumn visitors (73%).
7 Autumn visitors (73%) were more likely to be aware than Spring (64%), Summer (66%) and Winter visitors (46%)
08/09 09/10 10/11 11/12 12/13 13/14 14/15 15/16 16/17 17/18
% of visitors 58% 69% 70% 72% 71% 61% 66% 68% 66% 63%
0%
20%
40%
60%
80%
100%
Measurement** revised in 09/10

KI TOMM: Visitor Exit Survey Report 2016-2017
74
74
Figure 43: Awareness of any quarantine regulations by repeat and first time visitors
Q16a Were you aware of Kangaroo Island’s quarantine regulations, prohibiting the import of.... ** The measurement method was different in 2007/2008 and 2008/2009, so these figures have been slightly changed enable tracking of
this indicator. The current awareness measurement used is the percentage of all respondents that were aware of any of the quarantine regulations.
08/09 09/10 10/11 11/12 12/13 13/14 14/15 15/16 16/17 17/18
% of first time visitors 84% 86% 84% 86% 78% 86% 84% 81% 81%
% of repeat visitors 88% 91% 94% 91% 91% 95% 91% 86% 92%
0%
20%
40%
60%
80%
100%
Repeat visitors
First time visitors
Measurement** revised in 09/10

KI TOMM: Visitor Exit Survey Report 2016-2017
75
75
Awareness of specific prohibited items
This year, awareness of the prohibition on importing declared weeds (63%) decreased from 2016/17
(70%). Awareness of the prohibition of other products remained stable compared to the previous year.
Figure 44: Awareness of Prohibited Items
Q16a Were you aware of Kangaroo Island’s quarantine regulations, prohibiting the import of ...
Base: Visitors responding to each, Min n=1,307
Note: Missing cases excluded.
Significant and notable differences between subgroups:
6 Consistent with the previous year:
7 Those not on a bus tour were more likely than those on a bus tour to be aware of all the
specific prohibited items, except honey and potatoes.
7 Repeat visitors were more likely than first time visitors to be aware of all regulations aside
from potatoes;
7 Sea arrivals were more likely to be aware of all quarantine regulations than air arrivals;
7 Those who spent up to $200 per night were more likely to be aware of all regulations
compared to those who spent $201 or more per night; and
7 Those staying overnight were more likely than day trippers to be aware of all regulations
except potatoes and honey.
6 New in 2017/18:
7 Intrastate visitors were more likely than both interstate and international visitors to be
aware of all regulations, except those surrounding potatoes
09/10 10/11 11/12 12/13 13/14 14/15 15/16 16/17 17/18
Honey/bee products 80% 84% 83% 83% 77% 82% 82% 82% 80%
Rabbits 80% 81% 79% 79% 74% 77% 78% 77% 72%
Foxes 78% 80% 78% 79% 73% 77% 77% 77% 72%
Declared weeds 72% 75% 73% 73% 68% 73% 72% 70% 63%
Potatoes 66% 68% 68% 68% 62% 66% 69% 70% 69%
0%
20%
40%
60%
80%
100%
↓

KI TOMM: Visitor Exit Survey Report 2016-2017
76
76
Table 3: Awareness of quarantine regulations by first time and repeat visitors this wave
Aside from potatoes, repeat visitors to the Island were significantly more likely than first time visitors to
be aware of all quarantine items.
Q16a Were you aware of Kangaroo Island’s quarantine regulations, prohibiting the import of ... Note: Missing cases excluded. Note: Significant differences between visitor type indicated by arrows
Sources of information about quarantine regulations
Just under one in ten (9%) visitors provided further comment about where they had sourced
information about quarantine regulations for Kangaroo Island. As in previous years, the ferry/ferry
terminal was the most commonly mentioned source of quarantine regulation information (5% of all
visitors).
Aware of regulations prohibiting the import of…
(a) First time
visitors
n=
(b) Repeat
visitors
n=
Potatoes 68% 72%
Honey / bee products 77% 87%↑
Foxes 68% 82%↑
Rabbits 67% 83%↑
Declared weeds 60% 73%↑

KI TOMM: Visitor Exit Survey Report 2016-2017
77
77
Summary of sub-groups scores for experiential condition
‘Visitor activity has minimal negative impacts on the natural
environment’
Indicator Sub-groups who were within the Acceptable range for the indicator
Sub-groups who scored more highly for the indicator (compared to their comparative sub-group)
EN2b
Proportion of visitations
to natural areas
occurring on managed
sites
• All sub-groups • none
EN2e
Proportion of visitors
aware of quarantine
regulations prior to
arriving on Kangaroo
Island
• Intrastate visitors
• Autumn visitors
• Those not on a bus tour
• Repeat visitors
• Those spending up to $200
per night
• Intrastate visitors
• Autumn visitors
• Those not on a bus tour
• Those arriving by Sea
• Those spending up to $200 per night
• Repeat visitors
• Those staying one or more nights

KI TOMM: Visitor Exit Survey Report 2016-2017
78
78
Visitor Profile
Visitor Origin
The visitor origin has remained consistent with the previous year, with half (50%) of respondents
originating from interstate.
Figure 45: Visitor Origin over time
Q4 Where do you live?
Base: Visitors responding, N=2,042
00/01 01/02 02/03 03/04 04/05 05/06 06/07 07/08 08/09 09/10 10/11 11/12 12/13 13/14 14/15 15/16 16/17 17/18
Intrastate 40% 40% 43% 42% 35% 34% 34% 38% 32% 35% 32% 33% 29% 24% 28% 31% 33% 29%
Interstate 27% 27% 31% 25% 30% 27% 31% 33% 42% 40% 43% 42% 46% 46% 47% 45% 51% 50%
International 33% 34% 26% 33% 35% 39% 35% 29% 27% 25% 24% 26% 25% 30% 25% 24% 17% 21%
0%
20%
40%
60%
80%
100%
% o
f vis
itors
↓

KI TOMM: Visitor Exit Survey Report 2016-2017
79
79
Interstate visitor origin
Interstate visitation continued to be driven by those coming from Victoria (33%) and New South Wales
(38%) in 2017/18. The proportion of interstate visitors has remained largely stable with the only
increase coming from Western Australia (11%)
Table 4: Interstate Visitor Origin over time
02/0
3
(n=
447)
03/0
4
(n=
66)
04/0
5
(n=
362)
05/0
6
(n=
463)
06/0
7
(n=
543)
07/0
8
(n=
538)
08/0
9
(n=
682)
09/1
0
(n=
597)
10/1
1
(n=
819)
11/1
2
(n=
465)
12/1
3
(n=
1088)
13/1
4
(n=
1119)
14/1
5
(n=
696)
15/1
6
(n=
654)
16/1
7
(n=
957)
17/1
8
(n=
1,0
30)
VIC 39% 27% 36% 45% 36% 42% 43% 34% 39% 36% 41% 34% 34% 31% 37% 33%
NSW 43% 52% 40% 36% 38% 35% 29% 36% 35% 35% 32% 39% 33% 34% 35% 38%
QLD 11% 8% 13% 7% 10% 11% 15% 14% 12% 13% 13% 13% 17% 20% 14% 12%
WA 3% 3% 6% 7% 7% 5% 8% 9% 8% 8% 9% 9% 10% 10% 7% 11%↑
ACT 1% 4% 1% 4% 5% 3% 3% 4% 3% 4% 2% 2% 3% 3% 3% 2%
TAS 2% 0% 2% 0% 2% 2% 1% 2% 2% 3% 1% 1% 2% 1% 2% 2%
NT 1% 7% 2% 1% 2% 3% <1% 1% 1% 1% 3%↑ 1% 2% 1% 1% 1%
Q4 Where do you live? Base: Interstate visitors responding. Note: Missing cases excluded.

KI TOMM: Visitor Exit Survey Report 2016-2017
80
80
International visitor origin
Table 5: International Visitor Origin over Time
02/0
3
(n=
492)
03/0
4
(n=
150)
04/0
5
(n=
742)
05/0
6
(n=
936)
06/0
7
(n=
856)
07/0
8
(n=
462)
08/0
9
(n=
434)
09/1
0
(n=
674)
10/1
1
(n=
729)
11/1
2
(n=
363)
12/1
3
(n=
830)
13/1
4
(n=
947)
14/1
5
(n=
583)
15/1
6
(n=
597)
16/1
7
(n=
711)
17/1
8
(n=
478)
USA/ Canada
35% 29% 45% 28% 36% 29% 31% 29% 24% 24% 22% 24% 25% 23% 24% 22%
Other Europe
24% 34% 20% 31% 28% 25% 33% 29% 36% 36% 39% 32% 29% 30% 40% 17%
↓
UK 25% 15% 18% 21% 19% 24% 19% 22% 22% 19% 18% 15% 21% 20% 16% 22%
Germany 8% 15% 7% 12% 9% 13% 12% 12% 10% 10% 12% 10% 12% 14% 9% 15%
Asia 3% 5% 4% 4% 2% 2% 3% 6% 4% 7% 5% 11% 8% 9% 6% 8%
NZ 3% 1% 6% 2% 3% 5% 3% 2% 2% 2% 2% 5% 3% 3% 3% 13%
↑
Other Country
1% 0% 1% 2% 1% 1% 0% 1% 1% 0% 1% 3% 1% 1% 1% 3%
Japan 3% 1% 0% 2% 1% 0% 0% 1% 1% 1% 0% 1% 1% 1% 1% 0%
Q4 Where do you live? Base: International visitors responding. Note: Missing cases excluded. Note: Country Coded according to TRA, IVS.
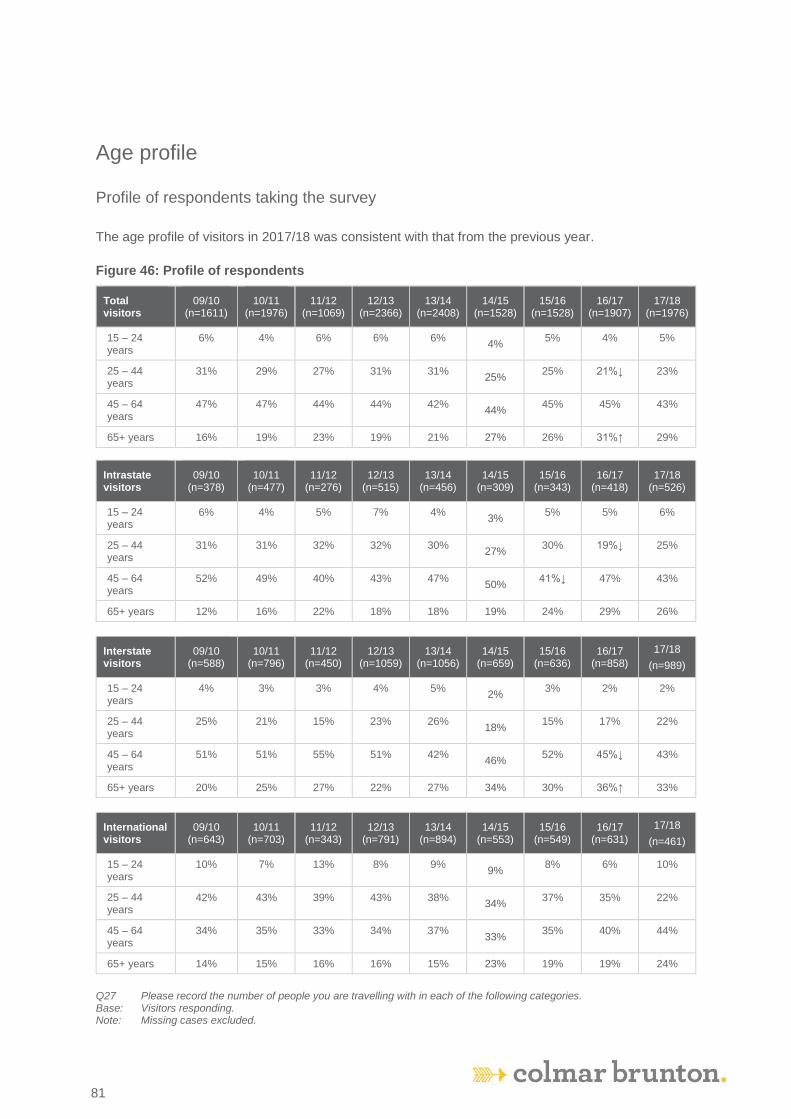
KI TOMM: Visitor Exit Survey Report 2016-2017
81
81
Age profile
Profile of respondents taking the survey
The age profile of visitors in 2017/18 was consistent with that from the previous year.
Figure 46: Profile of respondents
Total visitors
09/10 (n=1611)
10/11 (n=1976)
11/12 (n=1069)
12/13 (n=2366)
13/14 (n=2408)
14/15 (n=1528)
15/16 (n=1528)
16/17 (n=1907)
17/18 (n=1976)
15 – 24 years
6% 4% 6% 6% 6% 4%
5% 4% 5%
25 – 44 years
31% 29% 27% 31% 31% 25%
25% 21%↓ 23%
45 – 64 years
47% 47% 44% 44% 42% 44%
45% 45% 43%
65+ years 16% 19% 23% 19% 21% 27% 26% 31%↑ 29%
Intrastate visitors
09/10 (n=378)
10/11 (n=477)
11/12 (n=276)
12/13 (n=515)
13/14 (n=456)
14/15 (n=309)
15/16 (n=343)
16/17 (n=418)
17/18 (n=526)
15 – 24 years
6% 4% 5% 7% 4% 3%
5% 5% 6%
25 – 44 years
31% 31% 32% 32% 30% 27%
30% 19%↓ 25%
45 – 64 years
52% 49% 40% 43% 47% 50%
41%↓ 47% 43%
65+ years 12% 16% 22% 18% 18% 19% 24% 29% 26%
Interstate visitors
09/10 (n=588)
10/11 (n=796)
11/12 (n=450)
12/13 (n=1059)
13/14 (n=1056)
14/15 (n=659)
15/16 (n=636)
16/17 (n=858)
17/18
(n=989)
15 – 24 years
4% 3% 3% 4% 5% 2%
3% 2% 2%
25 – 44 years
25% 21% 15% 23% 26% 18%
15% 17% 22%
45 – 64 years
51% 51% 55% 51% 42% 46%
52% 45%↓ 43%
65+ years 20% 25% 27% 22% 27% 34% 30% 36%↑ 33%
International visitors
09/10 (n=643)
10/11 (n=703)
11/12 (n=343)
12/13 (n=791)
13/14 (n=894)
14/15 (n=553)
15/16 (n=549)
16/17 (n=631)
17/18
(n=461)
15 – 24 years
10% 7% 13% 8% 9% 9%
8% 6% 10%
25 – 44 years
42% 43% 39% 43% 38% 34%
37% 35% 22%
45 – 64 years
34% 35% 33% 34% 37% 33%
35% 40% 44%
65+ years 14% 15% 16% 16% 15% 23% 19% 19% 24%
Q27 Please record the number of people you are travelling with in each of the following categories. Base: Visitors responding. Note: Missing cases excluded.

KI TOMM: Visitor Exit Survey Report 2016-2017
82
82
Profile of visitors (includes entire travel party)
Table 6: Age profile of visitors (includes entire travel party)
12/13
(n=2452)
13/14
(n=2252)
14/15
(n=1584)
15/16
(n=1,554)
16/17
(n=2,148)
17/18
(n=1,872)
Total Female 55% 55% 53% 55% 52% 54%
Under 15 years 5% 9% 7% 7% 7% 5%
15 - 24 years 4% 6% 4% 2%↓ 4% 2%
25 - 44 years 14% 12% 9% 10% 8% 7%
45 - 64 years 22% 17% 18% 15%↓ 17% 16%
65 plus years 11% 11% 15% 20%↑ 16% 15%
Total Male 45% 45% 47% 45% 48% 46%
Under 15 years 4% 8% 7% 5%↓ 7% 7%
8%15 - 24 years 3% 3% 2% 3% 4% 3%
25 - 44 years 11% 10% 9% 9% 8% 8%
45 - 64 years 17% 14% 16% 15% 17% 17%
65 plus years 10% 10% 13% 14% 16% 17%
Q27 Please record the number of people you are travelling with in each of the following categories. Base: All responses – entire travel party accounted for Note: Missing cases excluded. Note: Question revised in 2010/11 to ask age and gender of entire travel party.
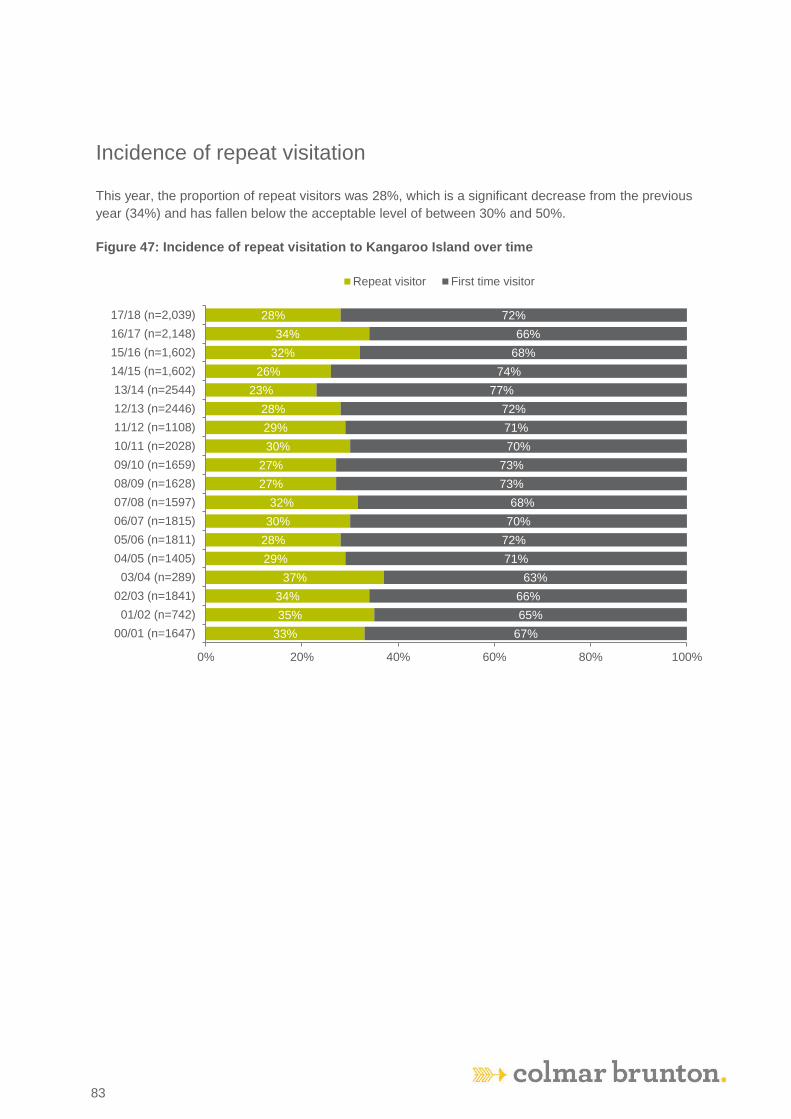
KI TOMM: Visitor Exit Survey Report 2016-2017
83
83
Incidence of repeat visitation
This year, the proportion of repeat visitors was 28%, which is a significant decrease from the previous
year (34%) and has fallen below the acceptable level of between 30% and 50%.
Figure 47: Incidence of repeat visitation to Kangaroo Island over time
33%
35%
34%
37%
29%
28%
30%
32%
27%
27%
30%
29%
28%
23%
26%
32%
34%
28%
67%
65%
66%
63%
71%
72%
70%
68%
73%
73%
70%
71%
72%
77%
74%
68%
66%
72%
0% 20% 40% 60% 80% 100%
00/01 (n=1647)
01/02 (n=742)
02/03 (n=1841)
03/04 (n=289)
04/05 (n=1405)
05/06 (n=1811)
06/07 (n=1815)
07/08 (n=1597)
08/09 (n=1628)
09/10 (n=1659)
10/11 (n=2028)
11/12 (n=1108)
12/13 (n=2446)
13/14 (n=2544)
14/15 (n=1,602)
15/16 (n=1,602)
16/17 (n=2,148)
17/18 (n=2,039)
Repeat visitor First time visitor

KI TOMM: Visitor Exit Survey Report 2016-2017
84
84
Incidence of repeat visitation by visitor origin
Incidence of repeat visitation among intrastate, and international visitors was consistent with the
previous year. However, repeat visitation among interstate visitors (11%) decreased from 2016/17
(16%).
Table 7: Repeat Visitation to Kangaroo Island by Visitor Origin over time
00/
01
01/
02
02/
03
03/
04
04/
05
05/
06
06/
07
07/
08
08/
09
09/
10
10/
11
11/
12
12/
13
13/
14
14/
15
15/ 16
16/ 17
17/ 18
Intrastate
68% 70% 67% 79% 68% 63% 68% 68% 60% 61% 67% 66% 65% 69% 67% 71% 74% 73%
Interstate
17% 18% 14% 19% 14% 16% 16% 14% 15% 11% 16% 14% 17% 12% 12% 16% 16% 11%
↓
International
5% 8% 6% 4% 4% 5% 5% 5% 6% 4% 4% 8% 6% 4% 3% 8%↑ 9% 5%
Q3 Have you ever visited Kangaroo Island before this trip? Base: Visitors responding. Note: Don’t know and missing cases excluded.

KI TOMM: Visitor Exit Survey Report 2016-2017
85
85
Travel party
Travelling with a partner or family and friends continued to be the two most common types of travel
party in 2017/18. Travel parties have remained consistent with last year.
Figure 48: Travel party over Time
Q2 On this trip, who did you travel with? Base: Visitors responding, N=2,042
Note: Missing cases excluded. ** Added category in 05/06.
04/05
05/06
06/07
07/08
08/09
09/10
10/11
11/12
12/13
13/14
14/15
15/16
16/17
17/18
Partner 37% 46% 44% 42% 46% 43% 46% 47% 47% 44% 46% 47% 43% 40%
Family & friends 45% 42% 45% 49% 46% 47% 46% 45% 46% 44% 45% 42% 47% 48%
Special interest/tour group
10% 7% 6% 3% 3% 5% 4% 3% 3% 5% 3% 4% 4% 5%
Alone 8% 5% 5% 5% 4% 4% 3% 4% 4% 7% 6% 6% 4% 6%
Businessassociate**
1% 1% 1% 0% 0% 0% 1% 1% 0% 0% 1% 1% 1%
0%
20%
40%
60%
80%
100%

KI TOMM: Visitor Exit Survey Report 2016-2017
86
86
Travel party by visitor origin
Table 8: Travel party by visitor origin over time
Q2 On this trip, who did you travel with? Base: Visitors responding. Note: Missing cases excluded.
Intrastate Visitors
07/08 (n=607)
08/09 (n=516)
09/10 (n=384)
10/11 (n=483)
11/12 (n=280)
12/13 (n=527)
13/14 (n=476)
14/15 (n=326)
15/16 (n=353)
16/17 (n=476)
17/18 (n=534)
With family and friends
58% 54% 56% 58% 65% 58% 61% 60% 55% 54% 63%↑
With a partner 34% 40% 36% 36% 30% 36% 30% 35% 38% 34% 27%↓
With a special interest group
1% 1% 3% 2% 1% 2% 3% 2% 3% 5% 3%
Alone 4% 4% 5% 3% 2% 3% 5% 3% 4% 5% 6%
With business associate (with or without spouse)
2% <1% <1% 1% 1% 1% 1% 1% <1% 2% 1%
Interstate Visitors
07/08 (n=538)
08/09 (n=682)
09/10 (n=598)
10/11 (n=819)
11/12 (n=465)
12/13 (n=1088)
13/14 (n=1123)
14/15 (n=696)
15/16 (n=653)
16/17 (n=956)
17/18 (n=1030)
With family and friends
47% 43% 46% 42% 35% 44% 40% 39% 37% 44% 42%
With a partner 47% 51% 48% 51% 57% 49% 49% 54% 51% 47% 45%
With a special interest group
2% 3% 3% 5% 2% 2% 5% 2% 4%↑ 5% 6%
Alone 5% 3% 3% 2% 6% 4% 6% 5% 7% 4% 7%
With business associate (with or without spouse)
0% <1% <1% <1% <1% <1% <1% <1% 1% <1% <1%
International Visitors
07/08 (n=460)
08/09 (n=434)
09/10 (n=672)
10/11 (n=728)
11/12 (n=361)
12/13 (n=829)
13/14 (n=942)
14/15 (n=584)
15/16 (n=596)
16/17 (n=714)
17/18 (n=478)
With family and friends
40% 42% 38% 38% 37% 36% 38% 38% 34% 43% 42%
With a partner 48% 46% 45% 51% 51% 54% 48% 43% 52% 49% 48%
With a special interest group
6% 6% 12% 4% 7% 4% 5% 6% 5% 4% 3%
Alone 6% 7% 5% 5% 5% 5% 9% 13% 7%↓ 4% 6%
With business associate (with or without spouse)
0% <1% <1% <1% 1% <1% <1% <1% 2%↑ <1%↓ 1%

KI TOMM: Visitor Exit Survey Report 2016-2017
87
87
Types of Accommodation
Hotels/motels and holiday homes continued to be the two most popular forms of accommodation
among visitors. The use of various types of accommodation has remained consistent with last year.
Table 9: Accommodation used over time
Q7 What type of accommodation did you stay in while on Kangaroo Island? Base: Visitors responding. Note: Don’t know and missing cases excluded. ^ Category was added in 2009/2010. * Categories were changed in 05/06, with some being merged to allow indicative comparison with previous years. + Bed and Breakfast / Farm Stay include both hosted and self-contained bed and breakfast / farm stay responses.
02/0
3
(n=
1848)
03/0
4
(n=
290)
04/0
5
(n=
1474)
05/0
6
(n=
1690)
06/0
7
(n=
1729)
07/0
8
(n=
1536)
08/0
9
(n=
1635)
09/1
0
(n=
1592)
10/1
1
(n=
1931)
11/1
2
(n=
1072)
12/1
3
(n=
2372)
13/1
4
(n=
2092)
14/1
5
(n=
1,3
92)
15/1
5
(n=
1,3
80)
16/1
7
(n=
1607)
17/1
8
(n=
1,9
33)
Hotel / motel 28% 29% 26% 32% 30% 25% 25% 23% 25% 22% 24% 25% 25% 25% 26% 24%
Holiday home / apartment / unit*
28% 13% 19% 26% 27% 21% 21% 22% 21% 26% 23% 22% 22% 27% 25% 25%
Camping, caravan or motor-home*
16% 21% 11% 16% 10% 13% 14% 17% 18% 14% 18% 17% 17% 16% 15% 17%
Cabin / Cottage*
18% 18% 17% 11% 12% 11% 10% 15% 11% 13% 13% 12% 12% 10% 12% 11%
Luxury lodge / retreat^
NA NA NA NA NA NA NA 9% 8% 8% 8% 8% 10% 7% 9% 8%
Bed and Breakfast/ Farm Stay*+
8% 12% 10% 14% 14% 10% 10% 7% 11% 10% 10% 8% 7% 7% 8% 10%
Backpacker hostel
3% 5% 7% 4% 4% 3% 2% 6% 4% 5% 4% 5% 4% 4% 3% 1%
Friends / relatives
7% 16% 8% 5% 5% 6% 4% 4% 4% 5% 4% 6% 6% 6% 5% 5%

KI TOMM: Visitor Exit Survey Report 2016-2017
88
88
Types of accommodation by visitor origin
Holiday homes were the most popular form of accommodation among intrastate visitors this year,
whereas interstate and international visitors were most likely to opt for a hotel or motel as their means
of accommodation.
Table 10: Accommodation Used by Visitor Origin
Q7 What type of accommodation did you stay in while on Kangaroo Island? Note: Don’t know and missing cases excluded.
Intrastate Interstate International
13/1
4
(n=
437)
14/1
5
(n=
303)
15/1
6
(n=
304)
16/1
7
(n=
356)
17/1
8
(n=
501)
13/1
4
(n=
904)
14/1
5
(n=
640)
15/1
6
(n=
564)
16/1
7
(n=
772)
17/1
8
(n=
990)
13/1
4
(n=
749)
14/1
5
(n=
484)
15/1
6
(n=
512)
16/1
7
(n=
749)
17/1
8
(n=
442)
Holiday home 34% 35% 37% 37% 34% 20% 22% 25% 23% 23% 8% 6% 13% 9% 11%
Hotel / motel 16% 13% 17% 20% 16% 25% 29% 24% 28% 27% 36% 37% 39% 32% 35%
Cabin 11% 13% 11% 13% 10% 11% 14% 11% 12% 12% 9% 6% 7% 9% 11%
Camping, caravan or motorhome
9% 10% 10% 10% 13% 23% 24% 24% 19% 22% 11% 13% 10% 8% 10%
Rented apartment or flat or unit
15% 13% 10% 11% 16% 11% 8% 7% 10% 11% 8% 7% 4% 6% 11%
Self-contained bed & breakfast or farm stay
3% 6% 6% 5% 7% 5% 3% 3% 5% 6% 5% 5% 4% 1% 5%
Luxury lodge/Retreat
5% 6% 4% 5% 5% 10% 10% 7% 9% 9% 12% 14% 12% 18% 9%
Friends / relatives
11% 12% 10% 9% 10% 5% 4% 4% 3% 3% 2% 2% 1% 4% 4%
Backpacker hostel
2% 2% 1% <1% 1% 3% 3% 2% 2% 1% 12% 8% 11% 10% 2%
Hosted bed & breakfast or farm stay
3% 3% 1% 2% 2% 1% 3% 3% 2% 3% 8% 6% 6% 13% 9%
Own property 2% 2% <1% 1% 2% <1% <1% <1% <1% 1% <1% 0% 0% <1% 0%

KI TOMM: Visitor Exit Survey Report 2016-2017
89
89
Satisfaction with accommodation
Satisfaction with accommodation in 2017/18 remained consistent with the previous year. Staying with
friends and family has the highest level of satisfaction (95%) followed by holiday home (88%) and self
contained bed and breakfast or farm stay (88%)
Table 11: Satisfaction with accommodation types across waves
Q7 What type of accommodation did you stay in while on Kangaroo Island? Q19.3 Please indicate how satisfied you were with the quality of accommodation. Base: Visitors who stayed in each accommodation type and responded. Note: Don’t know and missing cases excluded.
Note: Top 2 box reported
11/12
(n=1072)
12/13
(n=2372)
13/14
(n=1965)
14/15
(n=1318)
15/16
(n=1314)
16/17
(n=1254)
17/18
(n=1855)
Total Satisfaction 78% 76% 77% 80% 80% 80% 79%
Hosted bed & breakfast or farm stay
87% 89% 93% 92% 82% 84% 73%
Holiday home 84% 91% 87% 87% 93%↑ 85%↓ 88%
Luxury lodge/Retreat 80% 80% 87% 86% 84% 86% 87%
Rented apartment or flat or unit
82% 84% 81% 78% 93%↑ 84% 86%
Friends / relatives 78% 87% 94% 91% 89% 93% 95%
Self-contained bed & breakfast or farm stay
77% 93% 82% 96% 79%↓ 95%↑ 88%
Hotel / motel 79% 66% 75% 71% 71% 73% 71%
Cabin 68% 67% 72% 63% 85%↑ 77% 75%
Camping, caravan or motor home
67% 60% 59% 64% 70% 72% 66%
Backpacker hostel 63% 72% 56% 69% 52% 69% 80%

KI TOMM: Visitor Exit Survey Report 2016-2017
90
90
Table 12: Satisfaction with accommodation types this wave
Q7 What type of accommodation did you stay in while on Kangaroo Island? Q19.3 Please indicate how satisfied you were with the quality of accommodation. Base: Visitors who stayed in each accommodation type and responded. Note: Don’t know and missing cases excluded.
Note: Top 2 box reported
Significant differences between accommodation types indicated by letter (A-K)
A) Friends / relatives 95% (↑H, ↑I, ↑J, ↑K)
B) Holiday home 88% (↑H, ↑I, ↑J, ↑K)
C) Self-contained bed & breakfast or farm stay 88% (↑J, ↑K)
D) Luxury Lodge / Retreat 87%
E) Rented apartment or flat or unit 86%
F) Own property 82%
G) Backpacker hostel 80%
H) Cabin 75%
I) Hosted bed & breakfast or farm stay 73%
J) Hotel / motel 71%
K) Camping, caravan or motorhome 66%

KI TOMM: Visitor Exit Survey Report 2016-2017
91
91
Credible vs. Experienced Attributes & Attractions
Overall, the proportion of visitors who experienced the Island’s numerous attributes and attractions
and found them to be credible has remained unchanged.
Table 13: Credible vs. experienced attributes and attractions
Q18a For each of the following, please indicate whether you believe that Kangaroo Island provides this. Q18b For each of the following, please indicate whether you experienced this while on Kangaroo Island. Base: Visitors responding to each attribute. Note: Missing cases excluded.
Note: Top 2 box reported
Credible Experienced
12/13 (min
n=2341)
13/14 (min
n=2401)
14/15 (min
n=1534)
15/16 (min
n=1532)
16/17 (min
n=1327)
17/18 (min
n=1364
12/13 (min
n=1881)
13/14 (min
n=1980)
14/15 (min
n=1252)
15/16 (min
n=1290)
16/17 (min
n=1303)
17/18 (min
n=1299)
Spectacular scenery and coastal beauty
99% 99% 99% 99% 99% 99% 98% 99% 99% 99% 99% 99%
Areas of untouched natural beauty
96% 97% 95% 96% 97% 97% 95% 96% 95% 96% 97% 97%
Viewing Australia’s wildlife in natural surroundings
96% 98% 98% 97% 98% 98% 93% 96% 96% 96% 97% 97%
Scenic variety without crowds of people
96% 95% 97% 96% 96% 96% 96% 94% 97% 97% 97% 97%
Farming and rural landscapes
94% 92% 93% 94% 94% 94% 89% 88% 88% 90% 92% 88%
Island produce (food & wine)
90% 85% 89% 91% 94%↑ 91% 81% 75% 80% 83% 87% 83%
A friendly local community
90% 87% 88% 90% 91% 92% 93% 91% 91% 92% 94% 93%
The cultural heritage and history of settlement
75% 77% 79% 80% 80% 80% 67% 71% 74% 76% 74% 72%
One of Australia's top three nature and wildlife experiences
56% 64% 63% 64% 66% 67% 71% 79% 76% 75% 80% 81%
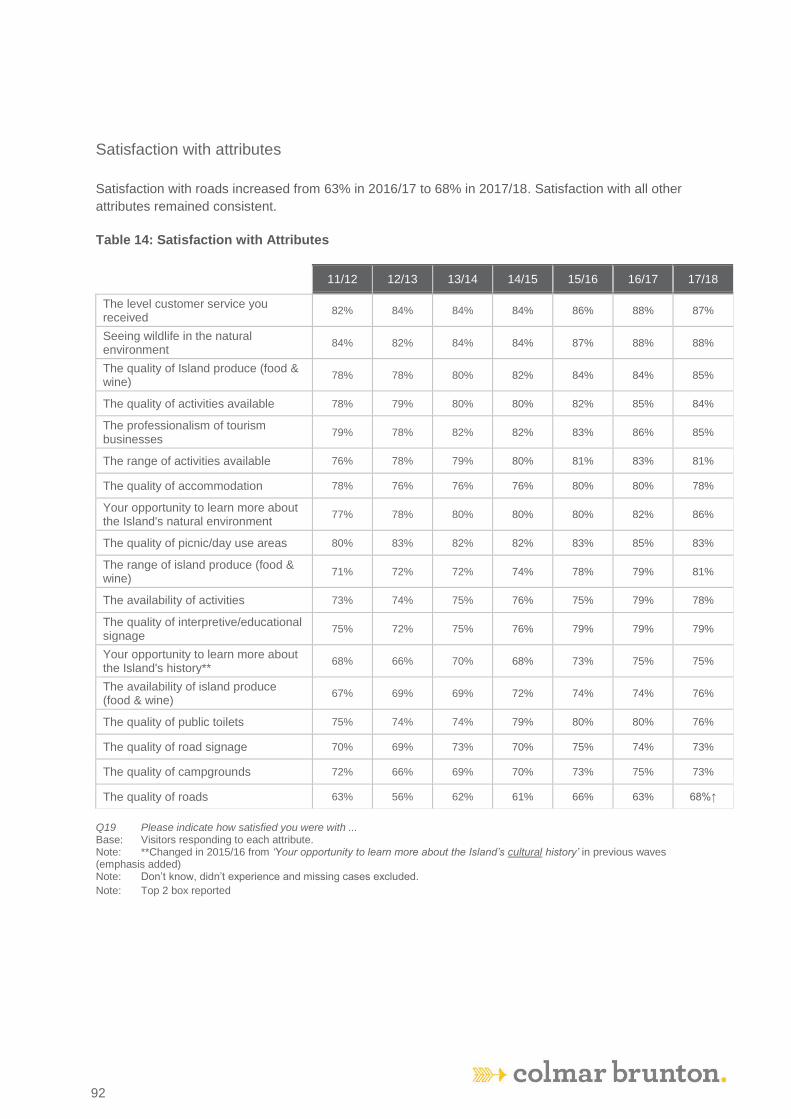
KI TOMM: Visitor Exit Survey Report 2016-2017
92
92
Satisfaction with attributes
Satisfaction with roads increased from 63% in 2016/17 to 68% in 2017/18. Satisfaction with all other
attributes remained consistent.
Table 14: Satisfaction with Attributes
Q19 Please indicate how satisfied you were with ... Base: Visitors responding to each attribute. Note: **Changed in 2015/16 from ‘Your opportunity to learn more about the Island’s cultural history’ in previous waves (emphasis added) Note: Don’t know, didn’t experience and missing cases excluded.
Note: Top 2 box reported
11/12 12/13 13/14 14/15 15/16 16/17 17/18
The level customer service you received
82% 84% 84% 84% 86% 88% 87%
Seeing wildlife in the natural environment
84% 82% 84% 84% 87% 88% 88%
The quality of Island produce (food & wine)
78% 78% 80% 82% 84% 84% 85%
The quality of activities available 78% 79% 80% 80% 82% 85% 84%
The professionalism of tourism businesses
79% 78% 82% 82% 83% 86% 85%
The range of activities available 76% 78% 79% 80% 81% 83% 81%
The quality of accommodation 78% 76% 76% 76% 80% 80% 78%
Your opportunity to learn more about the Island's natural environment
77% 78% 80% 80% 80% 82% 86%
The quality of picnic/day use areas 80% 83% 82% 82% 83% 85% 83%
The range of island produce (food & wine)
71% 72% 72% 74% 78% 79% 81%
The availability of activities 73% 74% 75% 76% 75% 79% 78%
The quality of interpretive/educational signage
75% 72% 75% 76% 79% 79% 79%
Your opportunity to learn more about the Island's history**
68% 66% 70% 68% 73% 75% 75%
The availability of island produce (food & wine)
67% 69% 69% 72% 74% 74% 76%
The quality of public toilets 75% 74% 74% 79% 80% 80% 76%
The quality of road signage 70% 69% 73% 70% 75% 74% 73%
The quality of campgrounds 72% 66% 69% 70% 73% 75% 73%
The quality of roads 63% 56% 62% 61% 66% 63% 68%↑
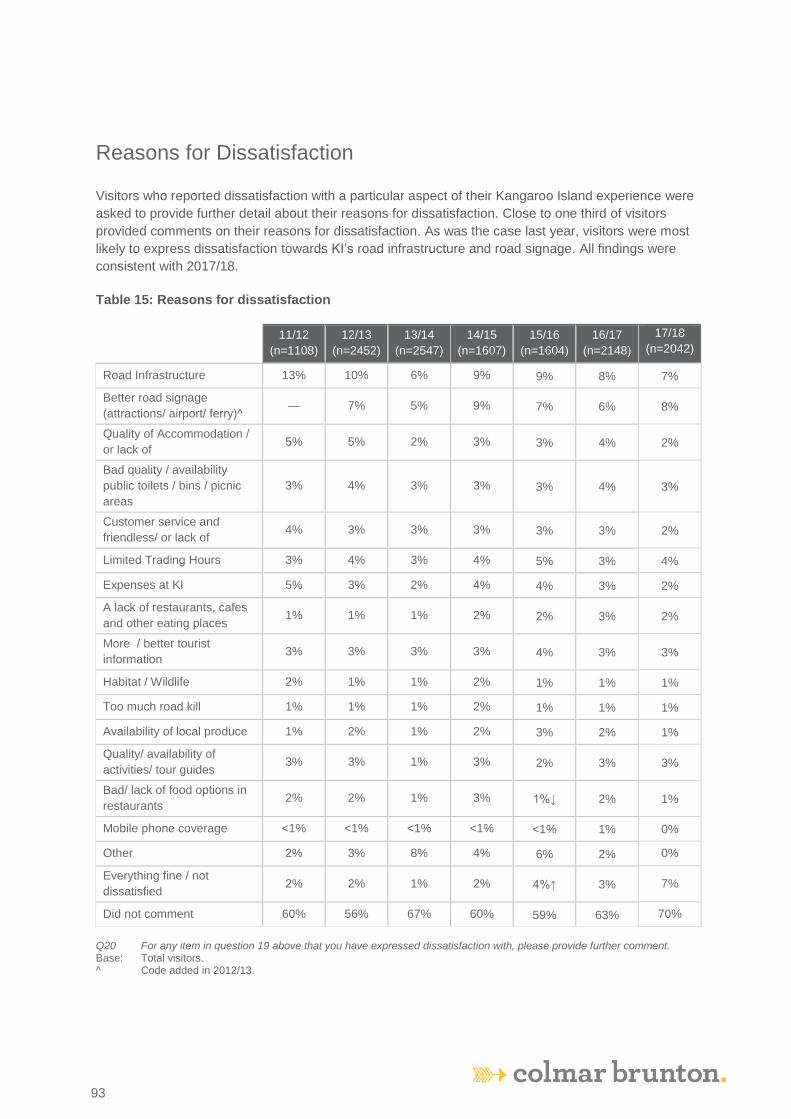
KI TOMM: Visitor Exit Survey Report 2016-2017
93
93
Reasons for Dissatisfaction
Visitors who reported dissatisfaction with a particular aspect of their Kangaroo Island experience were
asked to provide further detail about their reasons for dissatisfaction. Close to one third of visitors
provided comments on their reasons for dissatisfaction. As was the case last year, visitors were most
likely to express dissatisfaction towards KI’s road infrastructure and road signage. All findings were
consistent with 2017/18.
Table 15: Reasons for dissatisfaction
Q20 For any item in question 19 above that you have expressed dissatisfaction with, please provide further comment. Base: Total visitors. ^ Code added in 2012/13.
11/12
(n=1108)
12/13
(n=2452)
13/14
(n=2547)
14/15
(n=1607)
15/16
(n=1604)
16/17
(n=2148)
17/18
(n=2042)
Road Infrastructure 13% 10% 6% 9% 9% 8% 7%
Better road signage
(attractions/ airport/ ferry)^ — 7% 5% 9% 7% 6% 8%
Quality of Accommodation /
or lack of 5% 5% 2% 3% 3% 4% 2%
Bad quality / availability
public toilets / bins / picnic
areas
3% 4% 3% 3% 3% 4% 3%
Customer service and
friendless/ or lack of 4% 3% 3% 3% 3% 3% 2%
Limited Trading Hours 3% 4% 3% 4% 5% 3% 4%
Expenses at KI 5% 3% 2% 4% 4% 3% 2%
A lack of restaurants, cafes
and other eating places 1% 1% 1% 2% 2% 3% 2%
More / better tourist
information 3% 3% 3% 3% 4% 3% 3%
Habitat / Wildlife 2% 1% 1% 2% 1% 1% 1%
Too much road kill 1% 1% 1% 2% 1% 1% 1%
Availability of local produce 1% 2% 1% 2% 3% 2% 1%
Quality/ availability of
activities/ tour guides 3% 3% 1% 3% 2% 3% 3%
Bad/ lack of food options in
restaurants 2% 2% 1% 3% 1%↓ 2% 1%
Mobile phone coverage <1% <1% <1% <1% <1% 1% 0%
Other 2% 3% 8% 4% 6% 2% 0%
Everything fine / not
dissatisfied 2% 2% 1% 2% 4%↑ 3% 7%
Did not comment 60% 56% 67% 60% 59% 63% 70%

KI TOMM: Visitor Exit Survey Report 2016-2017
94
94
Suggestions for Improvement
Visitors were asked to make any suggestions to improve their travel experience on Kangaroo Island.
A total of 44% of respondents contributed a suggestion for improvement
Visitors were most likely to suggest that KI’s road infrastructure be improved and that the accuracy
and amount of tourist information be improved. Another likely suggestion was to lower the cost of
travelling (6%), which increased from 2016/17 (3%).
Table 16: Suggestions for improvement
Q26 What suggestions do you have for improving your Kangaroo Island travel experience? Base: Total visitors. ^ Code added in 2012/13.
11/12
(n=1108) 12/13
(n=2452) 13/14
(n=2547) 14/15
(n=1607)
15/16
(n=1604)
16/17
(n=2148)
17/18
(n=2042)
Improve road infrastructure 10% 9% 6% 10% 8% 5% 7%
Improve road signage/ attraction signage/ improve map/ provide map^
— 6% 3% 6% 5% 3% 5%
Improve quality/ number of stores, restaurants, takeaway shops
4% 4% 3% 4% 3% 4% 5%
Lower the cost of travel 9% 8% 5% 7% 7% 3% 6%↑
More/ accurate tourist information 8% 8% 5% 9% 9% 5% 6%
Reduce expenses on the Island (activities, food, petrol etc.)
5% 4% 3% 3% 3% 2% 1%
Extend length of stay 2% 2% 3% 3% 4% 2% 1%
Improve public transport, bus/ taxi / infrastructure
2% 1% 1% 1% 1% 1% 2%
Extend trading hours (shops/ restaurants/ tours/ petrol stations)
2% 3% 3% 2% 4% 3% 3%
Improve quality/ availability of accommodation
1% 1% 1% 3% 3% 1% 2%
More activities / wildlife viewing opportunities
1% 2% 3% 4% 1% 2% 3%
Improve mobile phone/ Internet coverage
1% 1% 1% 1% 2% 2% 1%
Improve public infrastructure (public toilets, rubbish bins, picnic areas etc.)
1% 3% 2% 1% 1% 1% 5%↑
Reduce road kill/ speed limits 1% 3% 2% 2% 2% 2% 1%
More/ better local produce 2% 2% 1% 2% 3% 2% 1%
Improve customer service/ friendliness of locals
1% 1% 2% 1% 2% 1% 1%
Keep KI untouched/ limit development 3% 3% 1% 1% 2% 2% 2%
Car rental - reduce costs/ availability/ provide more information
1% 1% 1% <1% 1% 1% 1%
Other suggestions 5% 6% 10% 8% 10% 5% 0%
No Comment / no suggestion 49% 47% 55% 41% 46% 60% 56%

KI TOMM: Visitor Exit Survey Report 2016-2017
95
95
Exploration of those dissatisfied overall
A small proportion (3%, n=57) of the total sample were dissatisfied overall, scoring Q22: Overall
Satisfaction, as a 5 or below out of 10. Compared to the total sample, these individuals were relatively
likely to be staying overnight, a repeat visitor or be travelling from interstate.
Table 17: Who was dissatisfied?
Those that were
dissatisfied n=57
Total 17/18 respondents
n=2,011
Travel party
Travelling with family or friends 45% 48%
Travelling with partner 44% 40%
Travelling with special interest/tour group 5% 5%
Travelling alone 6% 6%
Travelling with business associates (with or without spouse) 0% 1%
Season visited
Winter 15% 21%
Spring 30% 27%
Summer 26% 26%
Autumn 29% 26%
Previous visitation
Yes 24% 28%
No 76% 72%
Visitor Origin
Intrastate 28% 29%
Interstate 66% 50%
International 7% 21%
Arrival transportation
Air 5% 8%
Sea 95% 92%
Type of stay
Day trip 5% 20%
Overnight 95% 80%

KI TOMM: Visitor Exit Survey Report 2016-2017
96
96
Respondents who were dissatisfied overall (scoring Q22: Overall Satisfaction, as 5 or below out of 10)
tended to show much lower satisfaction towards all elements of their trip compared to the total
sample. The largest differences between the dissatisfied sub-group and the total sample were in
relation to: the range of activities available (60% difference), the professionalism of tourism
businesses (60% difference), the availability of activities (57% difference), and the quality of activities
available (57% difference).
Table 18: What were they dissatisfied with?
Those that were
dissatisfied n=57
Total 17/18 respondents
n=2,011
Trip as part of package
Yes 16% 24%
No 84% 76%
Spend
Up to $200 per night 54% 66%
More than $200 per night 46% 34%
Those that were
dissatisfied n=57
Total 17/18 respondents
n=2,011
% Very satisfied/
Satisfied (Top 2 box out of 5)
% Very satisfied/ Satisfied
(Top 2 box out of 5)
The level of customer service you received 38% 87%
Seeing wildlife in the natural environment 48% 88%
The quality of Island produce (food & wine) 45% 85%
The quality of activities available 27% 84%
The professionalism of tourism businesses 25% 85%
The range of activities available 21% 81%
The quality of accommodation 33% 78%
Your opportunity to learn more about the Island’s natural environment 45% 86%
The quality of picnic/ day use areas 30% 83%
The range of Island produce (food & wine) 37% 81%
The availability of activities 21% 78%
The quality of interpretive/ educational signage 24% 79%
Your opportunity to learn more about the Island’s history 35% 75%
The availability of Island produce (food & wine) 24% 76%
The quality of public toilets 33% 76%
The quality of road signage 34% 73%
The quality of campgrounds 27% 73%
The quality of roads 28% 68%
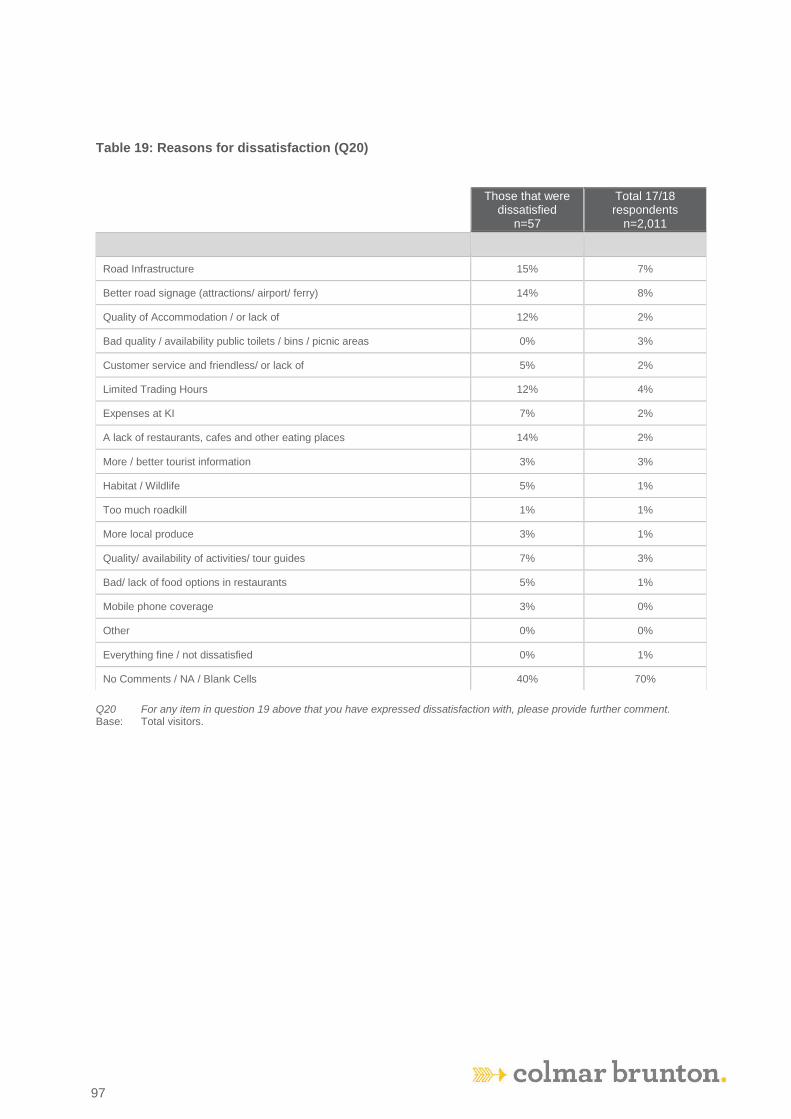
KI TOMM: Visitor Exit Survey Report 2016-2017
97
97
Table 19: Reasons for dissatisfaction (Q20)
Q20 For any item in question 19 above that you have expressed dissatisfaction with, please provide further comment. Base: Total visitors.
Those that were
dissatisfied n=57
Total 17/18 respondents
n=2,011
Road Infrastructure 15% 7%
Better road signage (attractions/ airport/ ferry) 14% 8%
Quality of Accommodation / or lack of 12% 2%
Bad quality / availability public toilets / bins / picnic areas 0% 3%
Customer service and friendless/ or lack of 5% 2%
Limited Trading Hours 12% 4%
Expenses at KI 7% 2%
A lack of restaurants, cafes and other eating places 14% 2%
More / better tourist information 3% 3%
Habitat / Wildlife 5% 1%
Too much roadkill 1% 1%
More local produce 3% 1%
Quality/ availability of activities/ tour guides 7% 3%
Bad/ lack of food options in restaurants 5% 1%
Mobile phone coverage 3% 0%
Other 0% 0%
Everything fine / not dissatisfied 0% 1%
No Comments / NA / Blank Cells 40% 70%

KI TOMM: Visitor Exit Survey Report 2016-2017
98
98
Seasonal variances
Proportion of visitors by season
Summer continues to be the most popular season to visit Kangaroo Island, accounting for 35% of
2017/18 visitors. All season’s visitation proportions have remained consistent with last year.
Figure 49: Proportion of visitors by season
Note: Data provided by TOMM Committee.
13/14 14/15 15/16 16/17 17/18
Winter 14% 15% 15% 15% 15%
Spring 25% 25% 25% 24% 25%
Summer 34% 34% 34% 35% 35%
Autumn 26% 25% 26% 27% 26%
0%
5%
10%
15%
20%
25%
30%
35%
40%
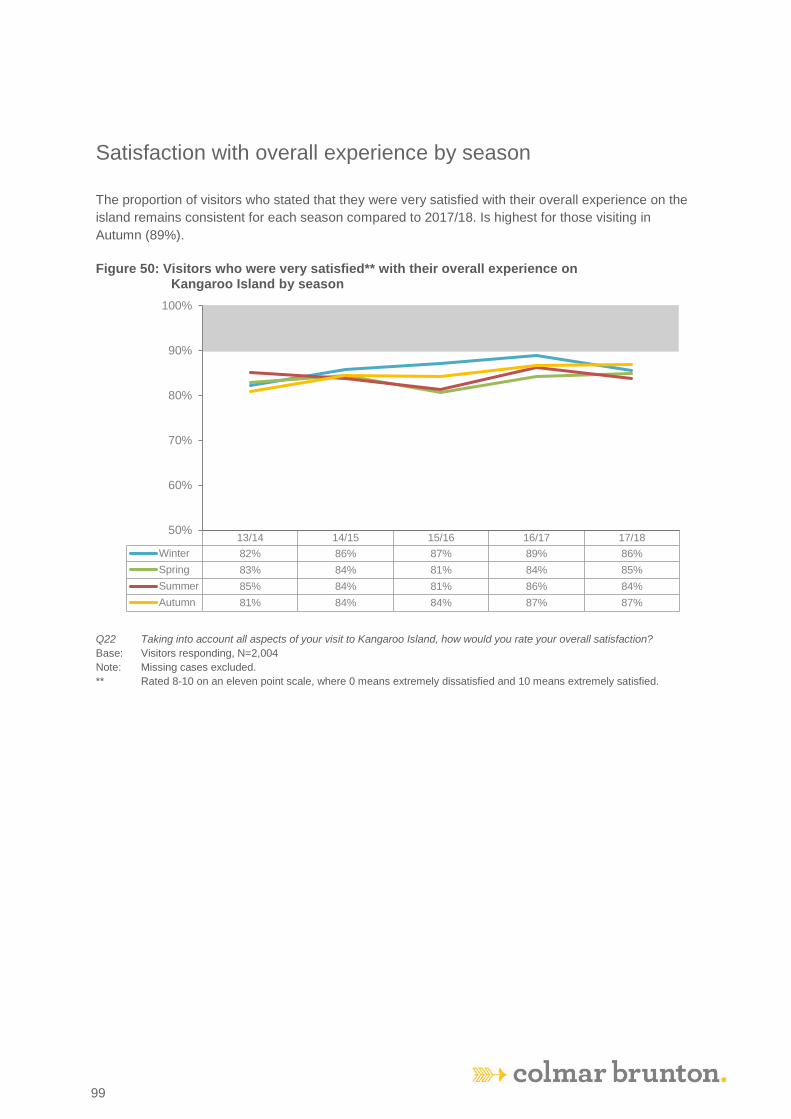
KI TOMM: Visitor Exit Survey Report 2016-2017
99
99
Satisfaction with overall experience by season
The proportion of visitors who stated that they were very satisfied with their overall experience on the
island remains consistent for each season compared to 2017/18. Is highest for those visiting in
Autumn (89%).
Figure 50: Visitors who were very satisfied** with their overall experience on Kangaroo Island by season
Q22 Taking into account all aspects of your visit to Kangaroo Island, how would you rate your overall satisfaction?
Base: Visitors responding, N=2,004
Note: Missing cases excluded.
** Rated 8-10 on an eleven point scale, where 0 means extremely dissatisfied and 10 means extremely satisfied.
13/14 14/15 15/16 16/17 17/18
Winter 82% 86% 87% 89% 86%
Spring 83% 84% 81% 84% 85%
Summer 85% 84% 81% 86% 84%
Autumn 81% 84% 84% 87% 87%
50%
60%
70%
80%
90%
100%

KI TOMM: Visitor Exit Survey Report 2016-2017
100
100
Average number of nights stayed by season
The average number of nights stayed is consistent between seasons with Autumn (4.6 nights) being
slightly lower than Winter, Spring and Summer (4.7 nights respectively).
Figure 51: Average number of nights stayed by season
Q6 Did you stay one or more nights or was it a day trip? Base: Visitors responding, N=1,912 Note: Arrows indicate significant change in score from previous year.
13/14 14/15 15/16 16/17 17/18
Winter 3.3 4.3 5.1 3.9 4.7
Spring 4.3 4.8 4.3 5.2 4.7
Summer 4.8 5.3 5.1 5.1 4.7
Autumn 4.2 4.3 5.2 4.7 4.6
0
2
4
6
8
10
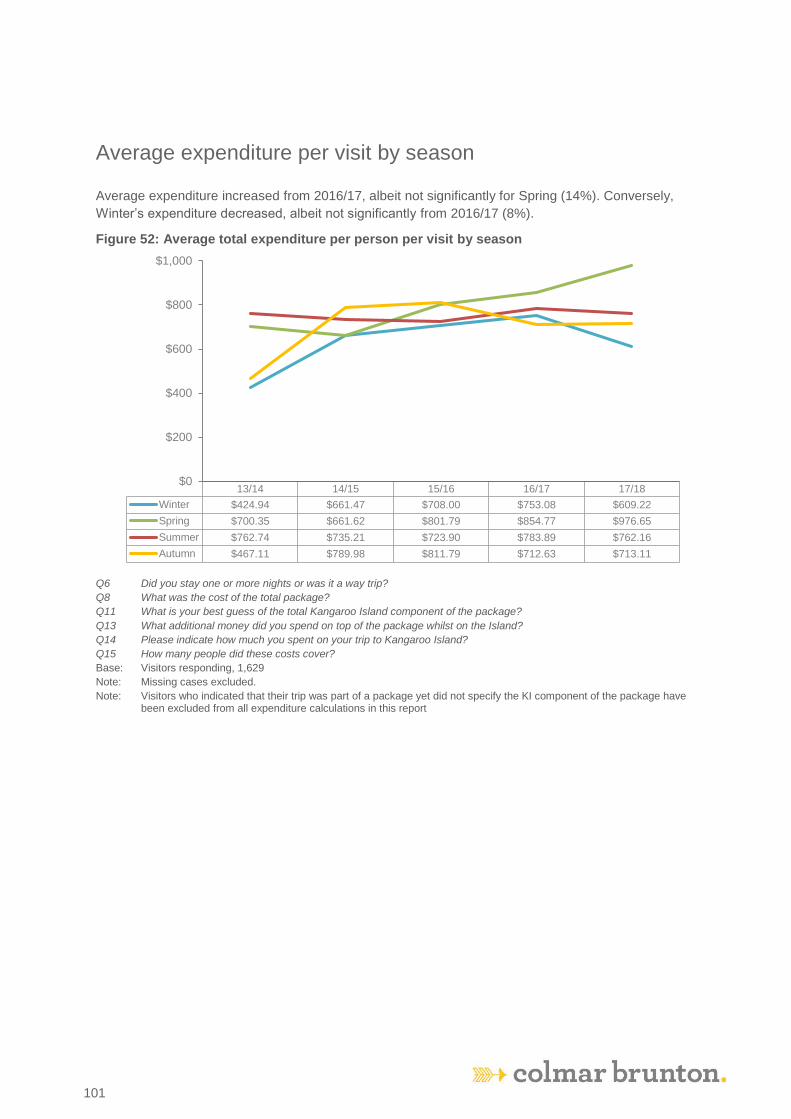
KI TOMM: Visitor Exit Survey Report 2016-2017
101
101
Average expenditure per visit by season
Average expenditure increased from 2016/17, albeit not significantly for Spring (14%). Conversely,
Winter’s expenditure decreased, albeit not significantly from 2016/17 (8%).
Figure 52: Average total expenditure per person per visit by season
Q6 Did you stay one or more nights or was it a way trip?
Q8 What was the cost of the total package?
Q11 What is your best guess of the total Kangaroo Island component of the package?
Q13 What additional money did you spend on top of the package whilst on the Island?
Q14 Please indicate how much you spent on your trip to Kangaroo Island?
Q15 How many people did these costs cover?
Base: Visitors responding, 1,629
Note: Missing cases excluded.
Note: Visitors who indicated that their trip was part of a package yet did not specify the KI component of the package have been excluded from all expenditure calculations in this report
13/14 14/15 15/16 16/17 17/18
Winter $424.94 $661.47 $708.00 $753.08 $609.22
Spring $700.35 $661.62 $801.79 $854.77 $976.65
Summer $762.74 $735.21 $723.90 $783.89 $762.16
Autumn $467.11 $789.98 $811.79 $712.63 $713.11
$0
$200
$400
$600
$800
$1,000

KI TOMM: Visitor Exit Survey Report 2016-2017
102
102
Satisfaction with customer service received by season
Satisfaction with customer service has remained consistent with 2017/18 for each season.
Figure 53: Visitors who were very satisfied with customer service received by season
Q19.7 Please indicate how satisfied you were with the level of customer service you received.
Base: Visitors who experienced it, N=1,967
Note: Don’t know, didn’t experience and missing cases excluded.
13/14 14/15 15/16 16/17 17/18
Winter 60% 57% 57% 66% 57%
Spring 48% 52% 55% 56% 61%
Summer 46% 51% 53% 53% 64%
Autumn 52% 52% 61% 57% 59%
0%
20%
40%
60%
80%
100%

KI TOMM: Visitor Exit Survey Report 2016-2017
103
103
Average spend per night over $200 by season
The proportion of visitors who reported an average spend of over $200 per night was consistent for all
seasons and Highest amongst winter visitors (36%).
Figure 54: Visitors who spent $200+ per night by season
Q6 Did you stay one or more nights or was it a day trip?
Q8 What was the cost of the total package?
Q11 What is your best guess of the total Kangaroo Island component of the package?
Q13 What additional money did you spend on top of the package whilst on the Island? Q14 Please indicate how much you spent on your trip to Kangaroo Island? Q15 How many people did these costs cover? Base: Visitors responding, N=1,533 Note: Day trippers excluded. Note: Missing cases excluded. Note: Visitors who indicated that their trip was part of a package yet did not specify the KI component of the package have
been excluded from all expenditure calculations in this report
13/14 14/15 15/16 16/17 17/18
Winter 30% 40% 30% 36% 36%
Spring 34% 33% 37% 45% 35%
Summer 27% 34% 33% 36% 33%
Autumn 30% 41% 35% 31% 31%
0%
20%
40%
60%
80%
100%

KI TOMM: Visitor Exit Survey Report 2016-2017
104
104
Experienced local Kangaroo Island produce by season
The proportion of winter visitors who experienced local Kangaroo Island produce in 2017/18 (62%)
decreased significantly compared to 2016/17 (90%). Other seasons have remained consistent with
2016/17.
Figure 55: Visitors that experienced local Kangaroo Island produce by season
Q18.8 For each of the following please indicate whether you experienced this while on Kangaroo Island? Base: Visitors responding, N=1,832. Note: Missing cases excluded.
13/14 14/15 15/16 16/17 17/18
Winter 70% 70% 80% 90% 62%
Spring 84% 83% 83% 87% 87%
Summer 81% 84% 84% 86% 89%
Autumn 66% 79% 84% 86% 89%
0%
20%
40%
60%
80%
100%
↓
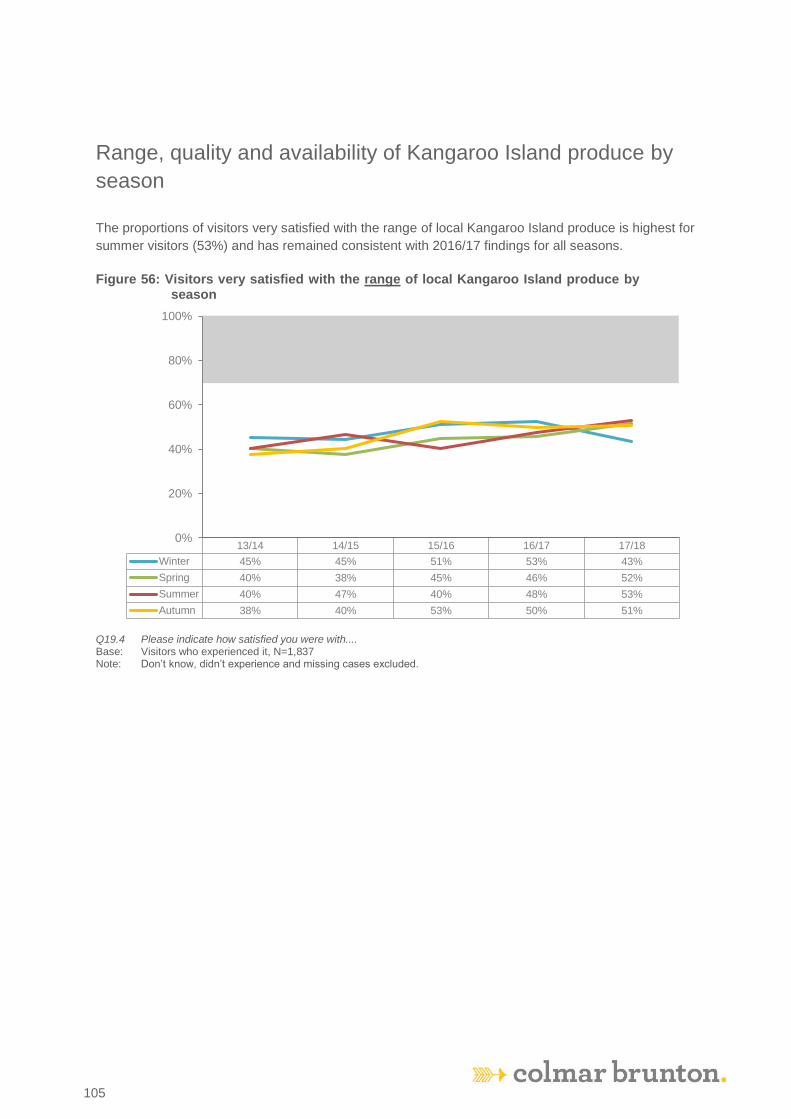
KI TOMM: Visitor Exit Survey Report 2016-2017
105
105
Range, quality and availability of Kangaroo Island produce by
season
The proportions of visitors very satisfied with the range of local Kangaroo Island produce is highest for
summer visitors (53%) and has remained consistent with 2016/17 findings for all seasons.
Figure 56: Visitors very satisfied with the range of local Kangaroo Island produce by season
Q19.4 Please indicate how satisfied you were with.... Base: Visitors who experienced it, N=1,837 Note: Don’t know, didn’t experience and missing cases excluded.
13/14 14/15 15/16 16/17 17/18
Winter 45% 45% 51% 53% 43%
Spring 40% 38% 45% 46% 52%
Summer 40% 47% 40% 48% 53%
Autumn 38% 40% 53% 50% 51%
0%
20%
40%
60%
80%
100%

KI TOMM: Visitor Exit Survey Report 2016-2017
106
106
The proportions of winter visitors very satisfied with the quality of local Kangaroo Island produce
(39%) decreased from 2016/17 (60%).
Figure 57: Visitors very satisfied with the quality of local Kangaroo Island produce by season
Q19.5 Please indicate how satisfied you were with.... Base: Visitors who experienced it, N=1,663 Note: Don’t know, didn’t experience and missing cases excluded.
13/14 14/15 15/16 16/17 17/18
Winter 54% 52% 56% 60% 39%
Spring 46% 42% 51% 50% 56%
Summer 48% 53% 47% 50% 60%
Autumn 44% 50% 58% 51% 54%
0%
20%
40%
60%
80%
100%
↓
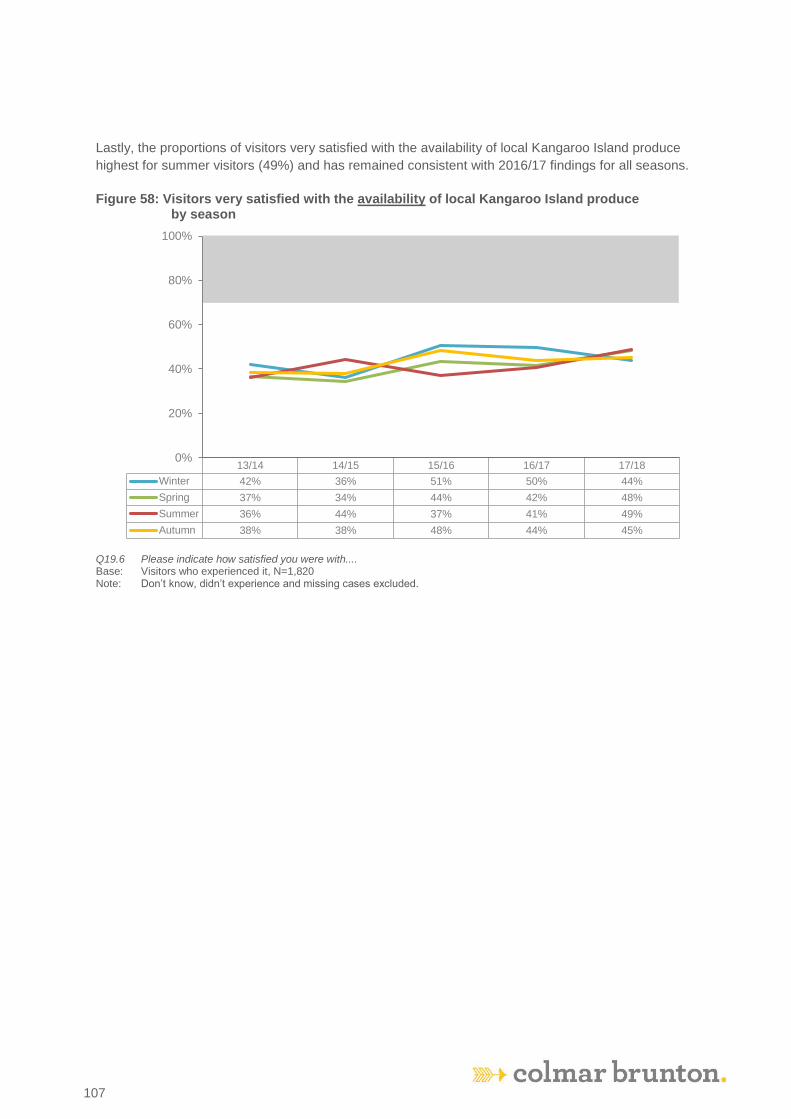
KI TOMM: Visitor Exit Survey Report 2016-2017
107
107
Lastly, the proportions of visitors very satisfied with the availability of local Kangaroo Island produce
highest for summer visitors (49%) and has remained consistent with 2016/17 findings for all seasons.
Figure 58: Visitors very satisfied with the availability of local Kangaroo Island produce by season
Q19.6 Please indicate how satisfied you were with.... Base: Visitors who experienced it, N=1,820 Note: Don’t know, didn’t experience and missing cases excluded.
13/14 14/15 15/16 16/17 17/18
Winter 42% 36% 51% 50% 44%
Spring 37% 34% 44% 42% 48%
Summer 36% 44% 37% 41% 49%
Autumn 38% 38% 48% 44% 45%
0%
20%
40%
60%
80%
100%

KI TOMM: Visitor Exit Survey Report 2016-2017
108
108
Incidence of repeat visitation by season
This year, the proportion of repeat visitors decreased significantly for Winter (from 38% in 2016/17 to
16% in 2017/18).
Figure 59: Repeat visitors by season
Q3 Have you ever visited Kangaroo Island before this trip? Base: Visitors responding n=2,032 Note: Don’t know and missing cases excluded.
13/14 14/15 15/16 16/17 17/18
Winter 18% 21% 29% 38% 16%
Spring 27% 26% 30% 30% 26%
Summer 32% 31% 39% 30% 36%
Autumn 16% 22% 27% 38% 34%
0%
20%
40%
60%
80%
100%
↓

KI TOMM: Visitor Exit Survey Report 2016-2017
109
109
Appendix A: Visitor Expenditure
One key limitation of data about visitor expenditure is the dependence of the figures on the
perceptions and opinions of visitors. In some cases, reporting may be inaccurate due to lack of
information about expenditure (i.e. when purchasing a package) or the impact of recall on data
quality. All data in this Appendix must be considered with caution.
Incidence of Package Bookings
This year, the proportion of visitors whose trip to Kangaroo Island formed part of a travel package
(24%) was consistent with last year (20%).
Figure 60: Trip to Kangaroo Island part of travel package
Q8 Was your trip to Kangaroo Island paid for as part of a travel package? Base: Visitors responding.
Note: Missing cases excluded.
20%
21%
23%
23%
28%↑
25%
25%
20%↓
24%
80%
79%
77%
77%
72%
75%
75%
80%
76%
0% 20% 40% 60% 80% 100%
09/10 (n=1485)
10/11 (n=2001)
11/12 (n=1102)
12/13 (n=2422)
13/14 (n=2516)
14/15 (n=1588)
15/16 (n=1595)
16/17 (n=2120)
17/18 (n=2036)
Part of a package Not part of a package

KI TOMM: Visitor Exit Survey Report 2016-2017
110
110
Type of booking by visitor origin
The proportion of visitors booking their trip as part of a package has remained consistent by visitor
origin, with international visitors remaining the most likely group to visit as part of a package (40%).
Table 20: Booking Type by Visitor Origin
Q8 Was your trip to Kangaroo Island paid for as part of a travel package? Base: Visitors responding. Note: Missing cases excluded.
Intrastate Visitors 11/12
(n=278) 12/13
(n=526) 13/14
(n=471)
14/15
(n=324)
15/16
(n=351)
16/17
(n=470)
17/18
(n=533)
Trip part of a package 19% 22% 19% 20% 24% 15% 15%
Not part of a package 81% 78% 81% 80% 76% 85% 85%
Interstate Visitors 11/12
(n=464) 12/13
(n=1077) 13/14
(n=1109)
14/15
(n=690)
15/16
(n=651)
16/17
(n=943)
17/18
(n=1027)
Trip part of a package 20% 19% 27% 19% 20% 18% 23%
Not part of a package 80% 81% 73% 81% 80% 82% 77%
International Visitors 11/12
(n=360) 12/13
(n=818) 13/14
(n=933)
14/15
(n=574)
15/16
(n=593)
16/17
(n=707)
17/18
(n=476)
Trip part of a package 33% 31% 36% 40% 34% 35% 40%
Not part of a package 67% 69% 64% 60% 66% 65% 60%

KI TOMM: Visitor Exit Survey Report 2016-2017
111
111
Expenditure per visitor
At the overall (total visitor) level, the reported average cost that was spent per person on the Island in
2017/18 ($722.70) was statistically consistent with the previous year’s reported average ($779.59).
Table 21: Average expenditure per visitor
Total Visitors 12/13
(n=2179) 13/14
(n=2197) 14/15
(n=1414) 15/16
(n=1,412) 16/17
(n=1,826) 17/18
(n=1,633)
Average $609.52 $601.92 $726.90 $770.06 $779.59 $722.70
Standard Deviation* $651.28 $1,509.09 $841.00 $856.32 $747.31 $618.87
Median^ $487.50 $400.00 $500.00 $550.00 $600.00 $575.00
Mode≠ $500.00 $500.00 $500.00 $500.00 $500.00 $500.00
Min. $0.00 $1.00 $0.00 $10.00 $0.00 $2.50
Max $24,000.00 $49,999.50 $16,400.00 $42,500.00 $18,000.00 $7,000
Intrastate Visitors 12/13
(n=491)
13/14 (n=443)
14/15 (n=310)
15/16 (n=338)
16/17 (n=434)
17/18
(n=445)
Average $478.95 $493.64 $642.38 $658.82 $643.23 $650.79
Standard Deviation* $398.06 $395.30 $521.39 $563.21 $433.69 $537.12
Median^ $400.00 $400.00 $500.00 $550.00 $550.00 $500
Mode≠ $500.00 $500.00 $500.00 $500.00 $500.00 $500
Min. $15.00 $3.50 $15.00 $33.33 $10.00 $11.00
Max $4,00.00 $5,000.00 $4,000.00 $6,250.00 $9,000.00 $5,666.67
Interstate Visitors 12/13
(n=1015)
13/14 (n=1014)
14/15 (n=642)
15/16 (n=606)
16/17 (n=857)
17/18
(n=873)
Average $691.97 $665.17 $819.43 $923.88↑ $894.75 $813.58
Standard Deviation* $622.53 $866.26 $795.47 $861.79 $853.15 $630.35
Median^ $500.00 $500.00 $650.00 $650.00 $712.00 $685.00
Mode≠ $500.00 $500.00 $500.00 $500.00 $500.00 $1,000.00
Min. $0.00 $2.00 $10.00 $12.50 $0.00 $2.50
Max $6,00.00 $12,500.00 $10,500.00 $12,500.00 $18,000.00 7,500
International Visitors 12/13
(n=673)
13/14 (n=738)
14/15 (n=462)
15/16 (n=468)
16/17 (n=535)
17/18
(n=315)
Average $603.88 $593.37 $642.51 $617.48 $687.29 $585.65
Standard Deviation* $890.51 2,599.39 $1,180.87 $1,128.53 $843.74 $685.15
Median^ $400.00 $328.00 $350.00 $450.00 $490.00 $400.00
Mode≠ $500.00 $250.00 $500.00 $500.00 $500.00 $500.00
Min. $0.00 $1.00 $0.00 $10.00 $0.00 $7.50
Max $24,000.00 $49,999.50 $16,400.00 $42,500.00 $10,150.00 $6250.00
* Standard Deviation provides an indication of the accuracy of the average. ^ Median is the point at which half the respondents spent more, and half spent less. ≠ Mode is the value that occurs the most frequently in a data set. Q6 Did you stay one or more nights or was it a way trip? Q9 What was the cost of the total package? Q11 What is your best guess of the total Kangaroo Island component of the package? Q13 What additional money did you spend on top of the package whilst on the Island? Q14 Please indicate how much you spent on your trip to Kangaroo Island? Q15 How many people did these costs cover? Base: Visitors responding. Note: Missing cases excluded. Note: Visitors who indicated that their trip was part of a package yet did not specify the KI component of the package have
been excluded from all expenditure calculations in this report
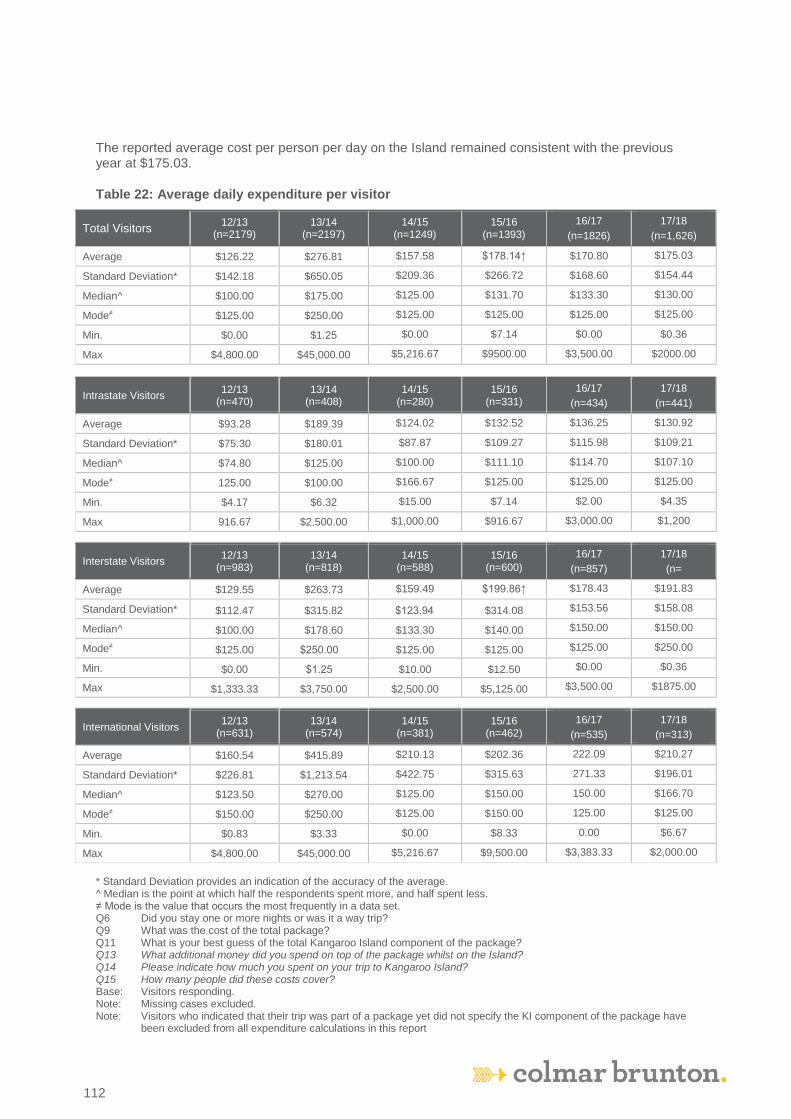
KI TOMM: Visitor Exit Survey Report 2016-2017
112
112
The reported average cost per person per day on the Island remained consistent with the previous year at $175.03.
Table 22: Average daily expenditure per visitor
Total Visitors 12/13
(n=2179) 13/14
(n=2197) 14/15
(n=1249) 15/16
(n=1393)
16/17
(n=1826)
17/18
(n=1,626)
Average $126.22 $276.81 $157.58 $178.14↑ $170.80 $175.03
Standard Deviation* $142.18 $650.05 $209.36 $266.72 $168.60 $154.44
Median^ $100.00 $175.00 $125.00 $131.70 $133.30 $130.00
Mode≠ $125.00 $250.00 $125.00 $125.00 $125.00 $125.00
Min. $0.00 $1.25 $0.00 $7.14 $0.00 $0.36
Max $4,800.00 $45,000.00 $5,216.67 $9500.00 $3,500.00 $2000.00
Intrastate Visitors 12/13
(n=470) 13/14
(n=408) 14/15
(n=280) 15/16
(n=331)
16/17
(n=434)
17/18
(n=441)
Average $93.28 $189.39 $124.02 $132.52 $136.25 $130.92
Standard Deviation* $75.30 $180.01 $87.87 $109.27 $115.98 $109.21
Median^ $74.80 $125.00 $100.00 $111.10 $114.70 $107.10
Mode≠ 125.00 $100.00 $166.67 $125.00 $125.00 $125.00
Min. $4.17 $6.32 $15.00 $7.14 $2.00 $4.35
Max 916.67 $2,500.00 $1,000.00 $916.67 $3,000.00 $1,200
Interstate Visitors 12/13
(n=983) 13/14
(n=818) 14/15
(n=588) 15/16
(n=600)
16/17
(n=857)
17/18
(n=
Average $129.55 $263.73 $159.49 $199.86↑ $178.43 $191.83
Standard Deviation* $112.47 $315.82 $123.94 $314.08 $153.56 $158.08
Median^ $100.00 $178.60 $133.30 $140.00 $150.00 $150.00
Mode≠ $125.00 $250.00 $125.00 $125.00 $125.00 $250.00
Min. $0.00 $1.25 $10.00 $12.50 $0.00 $0.36
Max $1,333.33 $3,750.00 $2,500.00 $5,125.00 $3,500.00 $1875.00
International Visitors 12/13
(n=631) 13/14
(n=574) 14/15
(n=381) 15/16
(n=462)
16/17
(n=535)
17/18
(n=313)
Average $160.54 $415.89 $210.13 $202.36 222.09 $210.27
Standard Deviation* $226.81 $1,213.54 $422.75 $315.63 271.33 $196.01
Median^ $123.50 $270.00 $125.00 $150.00 150.00 $166.70
Mode≠ $150.00 $250.00 $125.00 $150.00 125.00 $125.00
Min. $0.83 $3.33 $0.00 $8.33 0.00 $6.67
Max $4,800.00 $45,000.00 $5,216.67 $9,500.00 $3,383.33 $2,000.00
* Standard Deviation provides an indication of the accuracy of the average. ^ Median is the point at which half the respondents spent more, and half spent less. ≠ Mode is the value that occurs the most frequently in a data set. Q6 Did you stay one or more nights or was it a way trip? Q9 What was the cost of the total package? Q11 What is your best guess of the total Kangaroo Island component of the package? Q13 What additional money did you spend on top of the package whilst on the Island? Q14 Please indicate how much you spent on your trip to Kangaroo Island? Q15 How many people did these costs cover? Base: Visitors responding. Note: Missing cases excluded. Note: Visitors who indicated that their trip was part of a package yet did not specify the KI component of the package have
been excluded from all expenditure calculations in this report

KI TOMM: Visitor Exit Survey Report 2016-2017
113
113
Appendix B: VES Questionnaire
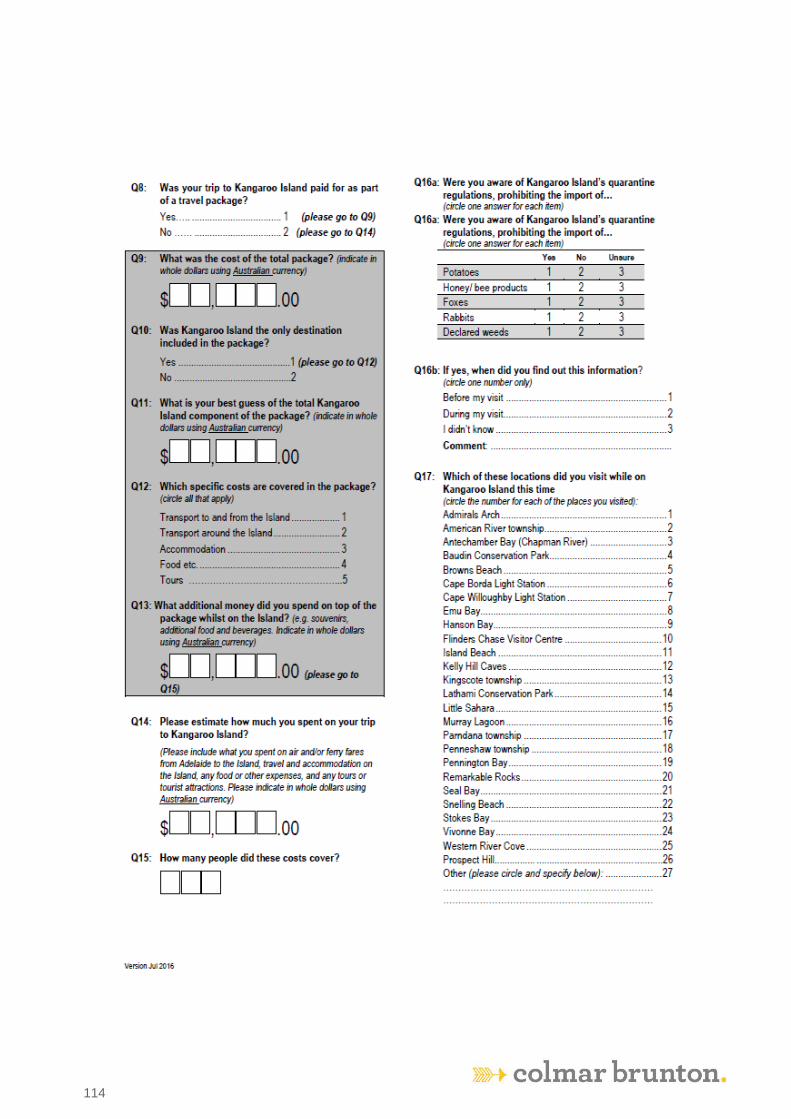
KI TOMM: Visitor Exit Survey Report 2016-2017
114
114
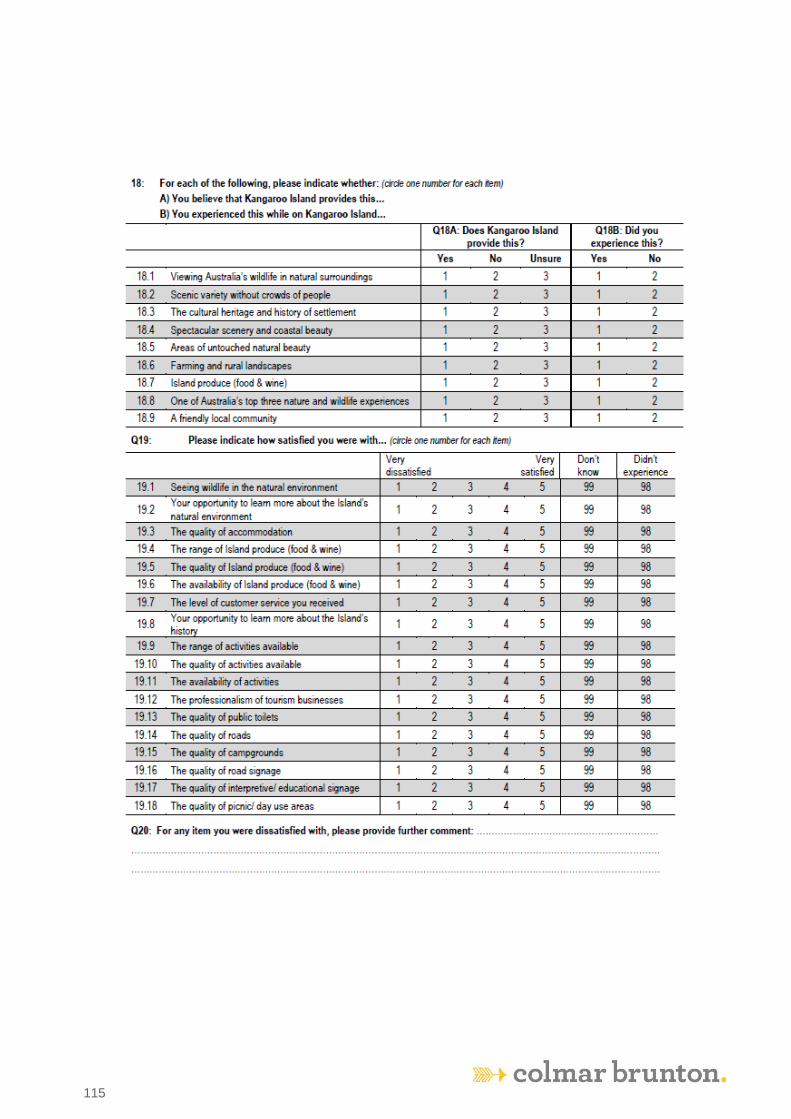
KI TOMM: Visitor Exit Survey Report 2016-2017
115
115

KI TOMM: Visitor Exit Survey Report 2016-2017
116
116
KI TOMM: Visitor Exit Survey Report 2016-2017
117
117
Colmar Brunton Social Research LEVEL 2, 199A RUNDLE STREET
ADELAIDE SA 5000
PH. (08) 8373 3822
ABN NO: 22 003 748 981
This document takes into account the particular instructions and requirements of our Client. It is not
intended for and should not be relied upon by any third party and no responsibility is undertaken to
any third party.