this pageFile/mbbr_chandler_johnson.pdf · 2018-03-09
39
Global Leaders in Biological Wastewater Treatment
Transcript of this pageFile/mbbr_chandler_johnson.pdf · 2018-03-09

Global Leaders in Biological Wastewater
Treatment

OVERVIEW OF ANOXKALDNES

•AnoxKaldnes is a global provider of leading-edge biological processes for wastewater treatment.
•The head-office is in Sweden. There are technical centers in Norway, USA, Australia and Spain.
•AnoxKaldnes approach to wastewater treatment is always based on a deep knowledge in microbiology and process technology.
•There is a very active R&D within AnoxKaldnes with the intentionto stay in the very frontline of developing new more efficient and cost effective biological processes.
•The knowledge and experience within the group is used to find the best solution for the customers together with the customer in each individual case.

“The most difficult task with wastewater treatment systems is not solving the problem but defining it”
Technical Centers: Sweden, Norway, USA, Spain, Australia, China
80+ Employees: (8 PhD, 20 Master of Science, 7 Process Engineers)
Research & Development: Internal & External Institutions
Focused on fixed film biological treatment systems

• 1985 Prof. Ødegaard started research on Kaldnes Moving Bed (TM) Process
• 1989 First MBBR was sold in Norway – still operating with same media
• 1996 First MBBR was sold in United States – paper mill in Ohio
• 1996 Research begins on IFAS concept using plastic media
• 2002 Kaldnes wins Stockholm Industry Water Award
• Continued Research into MBBR, BAS & IFAS biological processes and new media types
• Greater then 500 industrial / municipal system in operation with multiple plants under design using AnoxKaldnes MBBR, BAS & IFAS concepts
History

INTRODUCTION TO MOVING BED BIOFILM REACTOR (MBBR) PROCESS

Moving Bed™ Biofilm Technology(MBBR ™)
• The process is based on the biofilm principle. The core of the process is the biofilm carrier elements made from polyethylene with a density close to that of water.
§ The reactors are filled with carrier elements up to maximum 67% of the reactor volume.
§ The biofilm carrier elements are being kept suspended and in continuous movement in the water by aeration.
• The carriers are designed to provide a largeprotected surface for the micro-organisms and a good mass transfer.
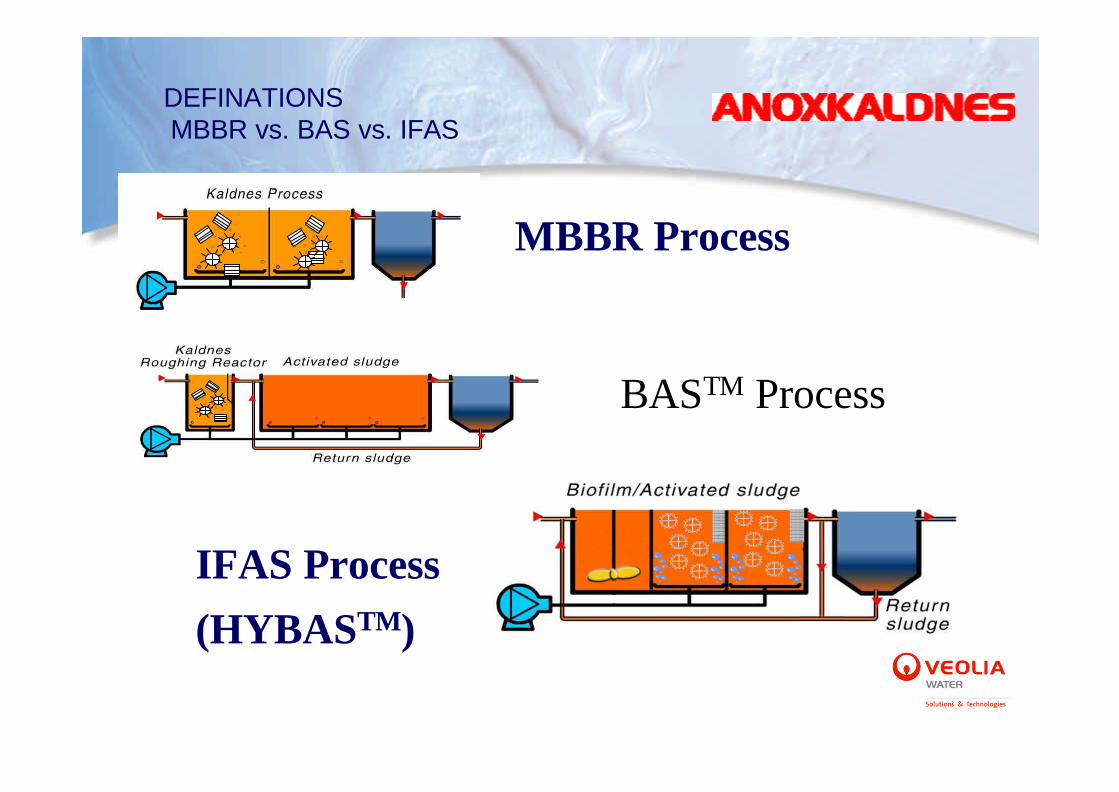
DEFINATIONSMBBR vs. BAS vs. IFAS
MBBR Process
IFAS Process(HYBASTM)
BASTM Process

Operation of the MBBR & HYBAS Process
Aerobic reactor
Anoxic reactor
1) Aeration for oxygen & mixing in BOD & nitrification
2) Slow speed mixers for mixing in post-denitrification applications
3) Screens used to retain media in each reactor
4) Multiple reactors used to specialize bacteria for each application

Components to the Aerobic HYBASTM
Treatment System
MAJOR COMPONENTS
A. MediaB. Stainless Steel
Aeration SystemC. Stainless Steel
Sieve AssembliesD. Tank E. BlowersF. Instrumentation &
Controls

Biofilm Carrier Elements
K1
500 m²/m³ in bulk(152.4 ft2/ft3)
10 mm (>3/8”) diam7 mm (>1/4”) length
K3TM
500 m²/m³ in bulk(152.4 ft2/ft3)
25 mm (~1”) diam10 mm (>0.33”) length
BIOFILM CHIPTM - P
900 m²/m³ in bulk(274 ft2/ft3)
45 mm diameter x 3 mm thick

AnoxKaldnes Aeration Grid Layout
Optimized for media applications
- Strength when draining basin
- Mixing of media at 67% fill (max conditions)
- In-Field Oxygen transfer comparable to fine bubble aeration
- Stainless steel for durability
- Zero maintenance

Sieve Assembly – Aeration Reactor
Fixed-in place stainless steel sieve assemblies. Designed for 2 inch’s head loss per reactor at peak hydraulic flows.

Operation of MBBR & HYBASTM System
Flexibility in Design – Add Future Capacity without Adding New Tankage & Postpone Investment until later
Increase Filling degree by adding more biomedia
40%39,000 kg/d
Current Load
67%
45,000 kg/dFuture Load Maximum Fill of
K1 / K3 Biomedia

Operation of MBBR/HYBASTM SystemComplete Mixed Reactor/ NO backwash required

World Wide Installations
• Municipal Wastewater (192 plants)
• Food Processing Industry (110 plants)
• Pulp & Paper Industry (70 plants)
• Pharmaceutical Industry (9 plants)
• Petroleum / Chemical Industry (24 plants)
• Electronics (6 plants)
• Fish Farming (45 plants)
• Other Industry (51 plants)

Municipal Installations
Type: 114 Plants for BOD Removal24 Plants for BOD Removal & Nitrification9 Plants for Post-Denitrification28 Plants for Total Nitrogen Removal17 Plant for Nitrification (HYBASTM)
Size: 15 Plants - 20 - 80 MGD (75,700 m3/d - 280,000 m3/d)
28 Plants - 4 - 10 MGD (15,140 m3/d - 37,850 m3/d)48 Plants - 1 - 4 MGD (3,785 m3/d - 15,140 m3/d)101 Plants - < 1 MGD (< 3,785 m3/d)

Application AreasOrganic Removal
• BOD/COD Removal• Roughing applications remove 50-80% of BOD prior to AS.
Moa Point WWTP –
New Zealand
Design Flow – 20 MGD / 68 MGD
(76 MLD / 258 MLD)
3 process trains
MBBR – 3 x 32,485 ft3 (3 x 920 m3)
BOD < 20 mg/L
TSS < 30 mg/L

Application AreasOrganic Removal
• BOD/COD Removal• Green fields projects, requiring complete treatment,
where space limitations are a factor.
Complete Treatment
Poipu WWTP
Design Flow - 1 MGD (3.7 MLD)
2 Reactors 29 ft dia x 10 ft SWD
(13,200 ft3 ; 374 m3)
BOD < 10 mg/L

Application AreasNitrification
• (NH3-N >>> NO3-N & NO2-N)
•Greenfield or cold temperature applications where nitrification is needed and space is a factor.
•After a lagoon which performs BOD removal and limits upgrade.
Lagoon Treatment System
Cheyenne – Crow Creek
Design Temp 9C
BOD, Nitrification to <2 mg/L
Johnstown, CO
Design Temp 5C
Nitrification to <2.2 mg/L

Application AreasNitrogen Removal
• Nitrogen Removal• Upgrading of existing systems where space
limitations are a factor.
Fields Point WWTP
Design Flow - 77 MGD (300 MLD)
BOD < 10 mg/L
Total Nitrogen < 5 mg/L
COD

INTRODUCTION TO BIOFILM + ACTIVATED SLUDGE (BAS) PROCESS

BiofilmActivated sludge
Biofilm - Activated Sludge treatment (BAS)

Operation of the BASTM Process
1) Aeration for oxygen & mixing in MBBR Pre-Treatment Reactor
2) MBBR operated as Flow-Through Process (No RAS)
3) Activated Sludge system operated with Reactor + Clarifier
4) Overall combination of two processes produces less sludge then either one by themselves.

Example of improving sludge quality through upgrade with MBBR pretreatment
Upgrade of existing activated sludge plants
Conventional System, SVI 200 ml/g
Biofilm pretreatment
installed
Upgraded System, SVI 40 ml/g

INTRODUCTION TO IFAS

IFAS upgrade for N removal
Principle:•BOD-removal and denitrification takes place in suspended phase (MLSS)•Nitrification performed by nitrifying bacteria attached to a carrier media. Two microbial systems in the same process. •No or little need for additional tankage•Dramatically decreased risk of filamentous problems, better sludge•Clarification hydraulic limited•Nitrification remains in case of activated sludge wash-out•Nitrifiers protected from incoming toxic ”spills”•Lower temperature dependence

MBBR-IFAS upgrade for N removal (HYBAS)
Much larger biofilm surface area exposed to wastewater after biofilm established
With the right type of media - no risk of red worms
Nitrifiers in biofilm

Microanimals (ciliates and rotifers)
Thin layer of heterotrophsNitrifiers
Clusters of nitrifiers

IFAS Retrofit Applications
Existing PlantBOD & TSS = 30 mg/L
Nitrification Only
Pre-DN & Nitrification
Pre & Post DN & Nitrification
COD
NH3-N < 1 mg/L
NH3-N < 1 mg/L & TN >8 mg/L
NH3-N < 1 mg/L & TN < 8 mg/L

AnoxKaldnes HYBASTM
Case Study - Broomfield


Broomfield WWTP – HYBASTM
Primary Effluent Characteristics
• Summer Flow = 8.0 MGD (30,300 m3/day)
• Winter Flow = 6.7 MGD (25,360 m3/day)
• BOD Load = 9,725 lbs/day; 4,410 kg/day (146 mg/L)
• TSS Load = 6,504 lbs/day; 2,950 kg/day (98 mg/L)
• TKN Load = 2,724 lbs/day; 1,235 kg/day (40.8 mg/L)
• Temperature = 13°C – 18°C

Broomfield WWTP – HYBASTM
Flow Diagram
Mixed Liquor Recycle
Mixed Liquor RecycleRAS fromClarifiers
To Secondary Clarifiers
Primary Effluent
FEQ Return
Flow Junction/Splitter Box
Anaerobic and Anoxic Basins
(mixed liquor only)
IFAS Aeration Basins(media and
mixed liquor)
Process Schematic ofBroomfield BNR/IFAS Facilities
Pre-Anoxic –12,846 ft3 (364 m3)
Anaerobic –21,313 ft3 (604 m3)
Anoxic –46,590 ft3 (1,319 m3)
Aerobic –160,526 ft3 (4,546 m3)

Broomfield WWTP – 1ST Winter
0
5
10
15
20
25
30
35
40
45
50
13-Jul-02 01-Sep-02 21-Oct-02 10-Dec-02 29-Jan-03 20-Mar-03
DATE
AM
MO
NIA
(m
g/L
)
Influent Ammonia Effluent Ammonia
MEDIA ADDED EACH WEEK - SLOWLY INCORPORATED TO A 30% FILL

Broomfield WWTP Full Scale DataBroomfield WWTP Monthly Average Influent Data
0
5
10
15
20
25
30
35
40
45
50
Jul-0
3
Sep-03
Nov-03
Jan-0
4
Mar-04
May-04
Jul-0
4
Sep-04
Nov-04
Jan-0
5
Mar-05
May-05
Jul-0
5
Sep-05
Nov-05
Jan-0
6
Mar-06
Date
Flo
w (M
GD
), N
H3-
N (m
g/L
), T
emp
(C)
0
50
100
150
200
250
300
350
400
450
500
BO
D &
TS
S (
mg/
L)
Influent Flow Influent Ammonia Wastewater Temperature
Influent TSS Influent BOD

Broomfield WWTP Full Scale DataBroomfield WWTP Monthly Average Effluent Data
0
2
4
6
8
10
12
14
Jul-03
Sep-0
3
Nov-03
Jan-0
4
Mar-04
May-04
Jul-0
4
Sep-0
4
Nov-04
Jan-0
5
Mar-05
May-05
Jul-0
5
Sep-0
5Nov
-05Ja
n-06
Mar-06
Date
TS
S, B
OD
, NH
3-N
, NO
x-N
, TP
(mg
/L)
Effluent TSS Effluent BOD Effluent NH3-N
Effluent NOx-N Effluent Total P

Broomfield WWTP Full Scale DataBroomfield WWTP Monthly Operational Data
0.0
1.0
2.0
3.0
4.0
5.0
6.0
7.0
8.0
Jul-0
3
Sep-0
3
Nov-03
Jan-0
4
Mar-04
May-04
Jul-0
4
Sep-0
4
Nov-04
Jan-0
5
Mar-05
May-05
Jul-0
5
Sep-0
5
Nov-05
Jan-0
6
Mar-06
Date
ML
SS
(g
/L);
Aer
ob
ic S
RT
(d
); N
H3-
N (
mg
/L)
0
20
40
60
80
100
120
140
160
180
SV
I (m
L/L
)
Aerobic SRT
Aerobic MLSSEffluent NH3-N
SVI

QUESTIONS??


![CHAPTER 75-03-09 GROUP CHILD CARE EARLY CHILDHOOD …CHAPTER 75-03-09 GROUP CHILD CARE EARLY CHILDHOOD SERVICES Section 75-03-09-01 Purpose [Repealed] 75-03-09-02 Authority and Objective](https://static.fdocuments.in/doc/165x107/5f0a5c0d7e708231d42b41db/chapter-75-03-09-group-child-care-early-childhood-chapter-75-03-09-group-child-care.jpg)