
ARTiCLeSrogersgroup.northwestern.edu/files/2018/pztnbme.pdf ·...
37
-
Upload
nguyenliem -
Category
Documents
-
view
213 -
download
0
Transcript of ARTiCLeSrogersgroup.northwestern.edu/files/2018/pztnbme.pdf ·...


Articleshttps://doi.org/10.1038/s41551-018-0201-6
© 2018 Macmillan Publishers Limited, part of Springer Nature. All rights reserved. © 2018 Macmillan Publishers Limited, part of Springer Nature. All rights reserved.
1Simpson Querrey Center and Feinberg School of Medicine, Center for Bio-Integrated Electronics, Northwestern University, Evanston, IL, USA. 2Department of Materials Science and Engineering, Frederick Seitz Materials Research Laboratory, University of Illinois at Urbana-Champaign, Urbana, IL, USA. 3Department of Civil and Environmental Engineering, Northwestern University, Evanston, IL, USA. 4Department of Mechanical Engineering, Northwestern University, Evanston, IL, USA. 5Department of Materials Science and Engineering, Northwestern University, Evanston, IL, USA. 6Advanced Composites Centre for Innovation and Science, University of Bristol, Bristol, UK. 7Division of Vascular and Interventional Radiology, Minimally Invasive Therapeutics Laboratory, Mayo Clinic, Phoenix, AZ, USA. 8Department of Pathology, Mayo Clinic, Phoenix, AZ, USA. 9Division of Abdominal Imaging, Mayo Clinic, Phoenix, AZ, USA. 10Department of Materials Science and Engineering, Tsinghua University, Beijing, China. 11Beckman Institute for Advanced Science and Technology, University of Illinois at Urbana-Champaign, Urbana, IL, USA. 12Department of Biomedical Engineering, Binghamton University, Binghamton, NY, USA. 13Department of Mechanical Engineering, Texas A&M University, College Station, TX, USA. 14Center for Mechanics and Materials, and Applied Mechanics Laboratory, Department of Engineering Mechanics, Tsinghua University, Beijing, China. 15Department of Biomedical Engineering, Northwestern University, Evanston, IL, USA. 16Department of Neurological Surgery, Northwestern University, Evanston, IL, USA. 17Department of Chemistry, Northwestern University, Evanston, IL, USA. 18Department of Electrical Engineering and Computer Science, Northwestern University, Evanston, IL, USA. 19These authors contributed equally: Xinge Yu, Heling Wang and Xin Ning. *e-mail: [email protected]; [email protected]; [email protected]
Accurately targeting a tumour site during needle-based biopsy procedures is critical for diagnosis and for personalized strat-egies in cancer treatment, where the biopsy tissue is essential
for genomic screening1. Approximately one in five biopsy samples are not viable for analysis owing to the insufficient number of malignant cells that often results from imprecise image-guided tar-geting of the biopsy needle into the tumour2. Repeating these inva-sive biopsy procedures increases the potential for complications for the patient, including tumour seeding; therefore, success following the initial biopsy is crucial3,4. Even the much anticipated national pan-cancer Molecular Analysis for Therapy Choice (MATCH) clin-ical trial, which aimed to use genomic analysis to advance precision medicine, suffered from major sample-quality issues impacting 94 of the 739 cases during an interim analysis; 127 samples could not be analysed for reasons that included insufficient tumour or tissue to allow for genomic analysis2,5.
Erroneous targeting of tumour tissue resulting in minimal or no malignant cells in the biopsy specimens can lead to misdiag-nosis and delayed care. Ultrasound and computed tomography are
helpful in guiding needles to the tumour tissue6,7; however, the accuracy and utility of these imaging tools can be limited, especially when lesions are small, are affected by motion (especially during respiration), cannot be seen without contrast agents, or are mobile, such as lymph nodes. Because of inherent risks to renal function, intravenous contrast is often not used during biopsy procedures; thus, percutaneous placement of the needle, especially with com-puted tomography guidance, relies on the ability of the operator to use adjacent landmarks, such as bony structures, for guidance. Additional risks due to radiation exposure to the patient and opera-tor from prolonged computed tomography fluoroscopy use also impact the success of guidance. As a result, despite best imaging practices and operator experience, high rates of false negatives and inadequate tissue sampling of lesions < 1 mm in the lungs and < 3 cm in the abdomen are common8.
Recent reports show that disease states, ranging from inflamma-tion to fibrosis to cancer, alter the mechanical properties of tissues, suggesting a potential for the use of targeting biopsy needles9–11. Specifically, measurements of the mechanical properties of soft
Needle-shaped ultrathin piezoelectric microsystem for guided tissue targeting via mechanical sensingXinge Yu1,2,19, Heling Wang3,4,5,19, Xin Ning2,19, Rujie Sun2,6, Hassan Albadawi7, Marcela Salomao8, Alvin C. Silva9, Yang Yu2,10, Limei Tian2,11, Ahyeon Koh12, Chan Mi Lee2, Aditya Chempakasseril2, Peilin Tian2, Matt Pharr13, Jianghong Yuan3,4,5,14, Yonggang Huang3,4,5*, Rahmi Oklu 7* and John A. Rogers1,2,5,15,16,17,18*
Needles for percutaneous biopsies of tumour tissue can be guided by ultrasound or computed tomography. However, despite best imaging practices and operator experience, high rates of inadequate tissue sampling, especially for small lesions, are com-mon. Here, we introduce a needle-shaped ultrathin piezoelectric microsystem that can be injected or mounted directly onto con-ventional biopsy needles and used to distinguish abnormal tissue during the capture of biopsy samples, through quantitative real-time measurements of variations in tissue modulus. Using well-characterized synthetic soft materials, explanted tissues and animal models, we establish experimentally and theoretically the fundamental operating principles of the microsystem, as well as key considerations in materials choices and device designs. Through systematic tests on human livers with cancerous lesions, we demonstrate that the piezoelectric microsystem provides quantitative agreement with magnetic resonance elastog-raphy, the clinical gold standard for the measurement of tissue modulus. The piezoelectric microsystem provides a foundation for the design of tools for the rapid, modulus-based characterization of tissues.
NATuRe BiOMediCAL eNgiNeeRiNg | VOL 2 | MARCH 2018 | 165–172 | www.nature.com/natbiomedeng 165

© 2018 Macmillan Publishers Limited, part of Springer Nature. All rights reserved. © 2018 Macmillan Publishers Limited, part of Springer Nature. All rights reserved.
Articles NaTUre Biomedical eNgiNeeriNg
tissues, particularly the elastic modulus, can be used to distinguish healthy and diseased tissues such as in the liver, kidney, lung and brain12–16. For example, in the liver, tumours exhibit abnormally high stiffness and densities compared with surrounding soft tissue10. As normal tissue becomes afflicted with disease, such as chronic inflammation or malignancy, the local modulus changes signifi-cantly, suggesting that this mechanical property could be used as a marker of pathology, specifically neoplasms. Thus, minimally inva-sive measurements of modulus may allow the detection of tumours with high accuracy17. Existing characterization methods rely on bulk measurements of displacement (that is, strain) as a function of applied force (that is, stress) delivered with instruments that apply vacuum suction18, tools that impart compressive forces19 or fine tips that induce small-scale indentations20, all typically ex vivo. The associated instruments with these methods often involve large equipment, thereby precluding their use in the direct evaluation of tissues in patients during surgical procedures21. Non-invasive mea-surements for estimating tissue lesions are possible with acoustic methods, such as ultrasound6 and acoustic radiation force impulse imaging21. However, magnetic resonance elastography (MRE) allows non-invasive measurements of modulus in which (1) external exci-tation leads to shear waves inside the tissue, (2) spatio-temporal information is yielded on the propagation of these waves and (3) data processing produces colour-coded quantitative maps of tissue stiffness22. Recent reports describe the use of MRE to identify and localize diseased tissue, such as in the liver for fibrosis23, kidneys24 and breasts25 for tumours, and spleen23 and lung26 for quantitating stiffness. These results clearly demonstrate that mechanical proper-ties can be used clinically to distinguish tissue types and advance the assessment of tissue. Abnormalities detected by MRE often trigger additional exams, such as computed-tomography-guided biopsies for diagnosis and genetic analysis27,28.
Here, we present advances in materials and device engineering that have the potential to allow accurate targeting of tumour tissue. These adapt and extend recently reported technologies for charac-terizing the mechanical properties of the skin to needle-based sys-tems for tissue targeting in the context of percutaneous biopsies29. Embodiments of our technology include both free-standing, flex-ible penetrating pins and thin laminates on standard instruments for performing biopsies. Extensive ex vivo and in vivo evaluations of various normal and diseased tissues, including human livers, illus-trate the measurement capabilities, with quantitative comparisons to clinical standards such as MRE. These studies establish the foun-dations for minimally invasive sensors for improving tissue target-ing, where Young’s modulus serves as the basis for guiding accurate specimen collection for histological and genetic testing.
Results and discussionMaterials, designs and fabrication procedures for needle-based modulus probes. Figure 1a shows schematic illustrations of two kinds of modulus-sensing probe. In both, two separate micro-components (lateral dimensions of 200 μ m × 140 μ m, separated by 1 mm) constructed with the piezoelectric material lead zir-conate titanate (PZT) provide mechanical actuation (distant from the tip) and sensing (near the tip). The modulus of the adjacent contacting tissue can be extracted by interpreting data that follow from applying voltage to the mechanical actuator and measuring the induced voltage of the sensor. These active elements consist of patterned multilayer stacks of PZT (500 nm) between bottom (Ti/Pt, 5 nm/200 nm) and top (Cr/Au, 10 nm/200 nm) electrodes (Supplementary Figs. 1 and 2), with an overcoat of polyimide (PI) for encapsulation (inset of Fig. 1a and Supplementary Fig. 4). The first embodiment (device 1) adopts a free-standing design in the shape of a penetrating pin, built on a thin, flexible substrate of 75-μ m-thick PI (Supplementary Figs. 3 and 4)30. A magnified view is shown in Fig. 1b. The sharp tip geometry and narrow width
(0.5 mm, with 4 mm length; Supplementary Fig. 5) allow penetra-tion through soft tissues for injection into targeted regions31,32. Previous studies of the constituent materials reveal no evidence of toxicity29. The electrodes for the sensors and actuators interface to input/output channels through photolithographically defined elec-trical interconnects (Au, 200 nm thick).
The second embodiment (device 2) uses a conventional steel biopsy needle as a platform to enable penetration of skin, fascia and solid organs and positioning within a lesion for the assessment of organ pathology, diagnosis and/or treatment. The main differ-ence compared with the design of device 1 is the use of an ultra-thin (3 μ m) sheet of PI (1.5 mm width, 4.5 mm length) as a substrate to allow sharp bending for conformal lamination onto the tip end region of the biopsy needle (Fig. 1c). A thin (50 μ m) interlayer of polydimethylsiloxane (PDMS) (modulus of ~100 kPa) lies between the bottom side of the PI and the surface of the needle, as a means to mechanically decouple the device from the steel needle, for reasons described later. Images of both devices are shown in Fig. 1d–f and Supplementary Fig. 6.
Finite element analysis (FEA) indicates that for a given actua-tion voltage, the sensor voltage relates to the modulus of the tissue through mechanical coupling among the actuator, substrate, tissue and sensor. With the device inserted into—and firmly in contact with—the tissue, application of a voltage leads to mechanical strain in the actuator via the piezoelectric effect, and a slight resultant bending of the needle substrate. The associated deformation of the surrounding tissue creates strain in the sensor. Through the inverse piezoelectric effect, this strain produces a measurable voltage; the magnitude of the strain, and therefore the voltage, depends on the tissue modulus. Figure 2a shows the model for FEA, while Fig. 2b illustrates the deformations in the device and surrounding tissue. The results in Fig. 2c,d indicate that strains induced in the tissue and devices (actuator, PI or PDMS-coated steel needle substrate and sensor) are very small (< 0.1%) for applied voltages in a practical range (up to several volts).
Fundamental studies of operational principles. The FEA results of Supplementary Fig. 7a reveal the dependence of the sensor voltage on tissue modulus. Specifically, the voltage increases by one order of magnitude when the tissue modulus increases from 1 kPa to 100 kPa. The voltage then decreases as the tissue modulus increases beyond this upper value. This non-monotonic relationship can be understood qualitatively as a balance of two considerations: (1) in the regime of low modulus, the actuator and substrate deform freely, with highly localized responses that lead to small strains in the sensor and correspondingly small sensor voltages; and (2) in the regime of high modulus, mechanical loading associated with the surrounding tissue limits the deformation of the actuator and the substrate, again leading to small sensor voltages. The sensor voltage reaches a maximum between these two limiting regimes at ~100 kPa in Supplementary Fig. 7b.
A scaling law that relates the tissue modulus Etissue and sensor voltage Vsensor can be established for values of the tissue modulus between 1 kPa and 1,000 kPa, as (see Supplementary Information for details)
=
VV
e A hk E h d
GE dE h
(1)sensor
actuator
312
PZT PZT
33 PI PI2
tissue3
PI PI3
where Vactuator is the actuator voltage and the other parameters and variables can be grouped into (1) material properties: the piezoelec-tric coefficient e31 and dielectric coefficient k33 of the actuator and sensor made of PZT, and the modulus EPI of the needle substrate made of PI; and (2) geometric parameters: thickness hPZT and area APZT perpendicular to the polarization direction of the actuator and
NATuRe BiOMediCAL eNgiNeeRiNg | VOL 2 | MARCH 2018 | 165–172 | www.nature.com/natbiomedeng166

© 2018 Macmillan Publishers Limited, part of Springer Nature. All rights reserved. © 2018 Macmillan Publishers Limited, part of Springer Nature. All rights reserved.
ArticlesNaTUre Biomedical eNgiNeeriNg
sensor, thickness hPI of the needle substrate, and spacing d between the actuator and the sensor. The function G depends on the tis-sue modulus and spacing via E dtissue
3 normalized by the bend-ing stiffness of the needle substrate, as in Supplementary Fig. 8. For hPZT ≪ hPI ≪ wPI, LPI (where wPI is the width of the needle sub-strate and LPI is the length of the needle substrate) and hPZT ≪ LPZT, wPZT ≪ d ≪ wPI, LPI (where LPZT is the length of the actuator and sen-sor, and wPZT is the width of the actuator and sensor), equation (1) is consistent with FEA, as shown in Supplementary Fig. 8.
This scaling law also gives the critical tissue modulus E *tissue below which the relationship between sensor voltage and tissue modulus is monotonic as (for example, ~100 kPa in Supplementary Fig. 7)
= .EE h
d0 2 (2)*tissue
PI PI3
3
which can be controlled by changing the modulus of the needle substrate, the thickness or the spacing between the actuator and sensor, as illustrated in Supplementary Fig. 9. Simulations indicate
that the sensor can measure samples with dimensions as small as 1 mm × 1 mm × 1.5 mm (length × width × thickness), as shown in Supplementary Fig. 10. Insights from this theoretical treat-ment establish the foundations for both design guidelines and analysis approaches.
In practical modes of operation, alternating current voltages drive the actuator, while lock-in techniques extract corresponding alternating current voltages from the sensor, typically in a frequency range of 1~100 Hz. The data-recording system includes a lock-in amplifier (SR830, Stanford Research Systems), a bio-amplifier (ADInstruments) and a computer for determining the amplitude of the voltage response from the sensors29. Tests on samples of PDMS with Young’s moduli similar to those of biological tissues validate this type of measurement33. Here, dynamic mechanical analysis (DMA) of the same samples provides comparative data on the stor-age and loss moduli. As expected from FEA predictions that use the moduli determined by DMA, the sensor voltage is independent of the actuation frequency from 1 to ~100 Hz (Fig. 2e). As a result, viscoelastic effects can be neglected; we confirmed that they can also be neglected for the biological samples, as is shown in Fig. 2f.
a
d
5 mm
50 μm
1 mm Biological tissue
gfe
1 cm 1 mm
1 m
m
0.5 mm
0.8 mm0.2 mm
4 m
m
1 mm
cb
4.5
mm
1 mm
1 m
m
0.8 mm
1.5 mm
0.2 mm
PI encapsulation
Au interconnection
PI encapsulation withcontact holes
Actuator
PI substrate
Au
PZT
Pt
PDMS
Biopsy needle
Device 1 Device 2
On biopsy needle
Sensor
Fig. 1 | Tissue modulus probes based on ultrathin PZT actuators and sensors. a, Exploded-view schematic illustrations of device 1 (free standing) and device 2 (integrated on a biopsy needle). PZT, lead zirconate titanate; PDMS, polydimethylsiloxane; PI, polyimide. b,c, Schematic illustrations with key dimensions of the sensor and actuator regions for device 1 (b) and device 2 (c). d, Optical images of device 1. The insets show an array of devices (bottom) and a magnified view of a sensor/actuator pair (top). e, Image of device 1 placed on a biological tissue. f, Optical images of device 2. The inset shows an image of device 2 on a biological tissue. g, Magnified view of the sensor and actuator regions on the biopsy needle substrate.
NATuRe BiOMediCAL eNgiNeeRiNg | VOL 2 | MARCH 2018 | 165–172 | www.nature.com/natbiomedeng 167

© 2018 Macmillan Publishers Limited, part of Springer Nature. All rights reserved. © 2018 Macmillan Publishers Limited, part of Springer Nature. All rights reserved.
Articles NaTUre Biomedical eNgiNeeriNg
The effects of inertia are negligible owing to the low operating frequencies (below 100 Hz), such that harmonic vibrations can be considered as quasi-static. For consistency, we used a frequency of 100 Hz in the studies described next.
Quantitative calibration and measurement of artificial tissue samples. Evaluation of a set of agarose gel (Sigma–Aldrich) samples formulated to yield a range of Young’s modulus values that span those of inner body soft organ tissues10,34,35 confirmed the relation-ships and calibration procedures outlined in the previous section, as shown in Supplementary Fig. 11. Supplementary Fig. 12 presents the actuator voltage (peak value) in device 1 as a function of sensor voltage for artificial tissues with various modulus values. The sen-sor voltages increase linearly with actuator voltage for each sample (moduli between 1 and 105 kPa). As a function of modulus, the sen-sor voltage varies in a fashion (Fig. 2g) consistent with FEA results and with previously described qualitative considerations. DMA measurements, FEA simulations and data from the needle devices precisely and completely define the relationship between modulus
and sensor voltages, for given actuator voltage, as shown in Fig. 2g and Supplementary Fig. 12.
Similar studies define the operation of the biopsy needle embodi-ment (device 2), as shown in Supplementary Figs. 13 and 14. Here, a monotonic linear relationship exists between the sensor voltage and tissue modulus (Supplementary Fig. 15), up to values of 1 MPa, consistent with replacement of the quantity EPI × h3
PI with K—an effective stiffness that is significantly larger than EPI × h3
PI due to the influence of the steel biopsy needle—in equation (2). Figure 2h summarizes the sensor voltages measured at similar actuator voltages for artificial tissues with various moduli. Compared with device 1, these systems exhibit comparatively small sensor voltages due to increased stiffness and reduced deformability of the substrate struc-ture (stainless steel has a modulus of ~200 GPa36; PI has a modulus of ~2.5 GPa29,37).
In both cases, the modulus measurements yield properties in near proximity to the actuator/sensor pairs. Placing the probe (device 1) at various levels of injection into an artificial multilayer tissue sam-ple constructed with three different layers of agarose gel (18, 33 and
a
e f
b
0 50 1000.0
0.2
0.4
0.6
0.8
Loss
Storage
Sen
sor
volta
ge (
mV
)
Frequency (Hz)
0 50 100
Frequency (Hz)
0
10
20
30
40
50
Modulus (kP
a)
Actuation
Vactuatorsin(ωt) Vsensorsin(ωt)
Tissue
Needle
Sensing
Applying voltage on actuator
Tissue
Insert the needle into the substrate
Actuator
Needle substrate
VA Vs
VA Vs
Sensor
d
wPI
LPZT
hPI
hPZT
2
3
4
5
Mod
ulus
(kP
a)
DMADevice 1
Device 2
0 30 60 90 1200.0
0.1
0.2
0.3
0.4
0.5
4 V
5 V
3 V
2 V
1 VSen
sor
volta
ge (
mV
)
Modulus (kPa)
0 40 80 120 160
Modulus (kPa)
0.01
0.02
0.03
0.04
0.05
0.06
Sen
sor
volta
ge (
mV
)
4 V
5 V
3 V
2 V
1 V
hg
c
Tissue
Needle
Strain εmax
0 0.07%
Tissue
εmax × 200εmax × 100
Actuator Sensor
0.2 mm
d
PDMS
Tissue
PI substrate
SensorActuator
0 0.02%
Strain εmax
0.2 mm
Fig. 2 | Fundamental studies of device operation. a,b, Working principles of a modulus probe injected into a tissue sample. c,d, Distribution of maximum principal strain εmax in the tissue, needle, actuator and sensor (actuator voltage 5 V, tissue modulus 100 kPa) for device 1 (c) and device 2 (d). e, Output voltage of the sensor in device 1 as a function of the actuation frequency, and the dynamic mechanics analysis results from the measured sample. f, Modulus of fresh pig liver measured by DMA and devices 1 and 2. g,h, Output voltage of a sensor as a function of the modulus of the samples tested, for device 1 (g) and device 2 (h). In e–h, the symbols and lines correspond to experimental and theoretical results, respectively. Error bars correspond to calculated standard error deviation for at least 20 samples.
NATuRe BiOMediCAL eNgiNeeRiNg | VOL 2 | MARCH 2018 | 165–172 | www.nature.com/natbiomedeng168

© 2018 Macmillan Publishers Limited, part of Springer Nature. All rights reserved. © 2018 Macmillan Publishers Limited, part of Springer Nature. All rights reserved.
ArticlesNaTUre Biomedical eNgiNeeriNg
80 kPa) demonstrates capabilities in depth profiling, as shown in Supplementary Fig. 16. The inset optical images of Supplementary Fig. 16a highlight the injection process. Supplementary Fig. 16b presents the sensor voltage and extracted modulus values as a func-tion of depth. This capability is critically important for investiga-tions of various layered tissue structures that are ubiquitous in biology, and for guidance in biopsies.
In these and other uses, the devices must be well encapsulated to avoid unwanted penetration of bio-fluids into the active regions of the devices38. Mechanical properties of tissues may vary over time due to dehydration, bleeding and/or tissue damage. Tests that involve injec-tion into artificial tissues or fresh explanted biological tissues show continuous, invariant operation for 60 min—significantly longer than the time duration for a typical biopsy (Supplementary Fig. 17). The systems reported here use PI as an encapsulant. Parylene repre-sents an alternative, with improved barrier properties.
Animal model evaluations in vivo and ex vivo. These probes can be inserted percutaneously into a wide range of biological tissues for modulus measurements both in vivo and ex vivo, as shown in rat models in Fig. 3a,b and Supplementary Fig. 18. Figure 3c–g and Supplementary Fig. 19 summarize the results obtained from explanted samples of liver, fat, kidney, spleen and lung, each in a non-diseased state. Modulus values for these organs and tissues are shown in Fig. 3h. The in vivo results, collected on an anaes-thetized rat, show that Eliver = 2.3 ± 0.2 kPa, Efat = 2.4 ± 0.5 kPa, Espleen = 3.9 ± 0.6 kPa, Elung = 6.5 ± 0.7 kPa and Ekidney = 7.8 ± 0.7 kPa, consistent with ex vivo measurements using the same measurement system and as separately reported based on conventional indenta-tion techniques39–41. Here, the error bars correspond to different measurement sites and are dominated by intrinsic variability asso-ciated with the organs themselves.
Measurements on human organ tissues, including cancer-ous sites. Tests using device 2 on human organ tissues illustrate the potential relevance to clinical practice. The samples include formalin-fixed healthy lung and adrenal gland as summarized in Fig. 4a,b. Comparisons from fresh cirrhotic liver and fresh liver tumour (hepatocellular carcinoma (HCC)) are shown in Fig. 4d,e. Cirrhotic liver exhibits a modulus ~10 kPa, while the modulus of liver tumour is notably higher at ~23 kPa. Tests of pathologi-cal tissues clearly show that device 2 can distinguish normal from diseased areas. Figure 4c,f provides images and modulus measure-ments of a fresh thyroid tissue and a formalin-fixed kidney tissue,
h
a
0
5
10
15
Ex vivo test in a petri dishIn vivo test on a live ratLiver
Fat
Spleen
Lung
Kidney
Mod
ulus
(kP
a)
b c
e f
d
gLung Liver
Spleen
1 cm 1 mm
3 mm 3 mm
3 mm3 mm3 mm
1 mm
1 mm1 mm1 mm Kidney Fat
Fig. 3 | in vivo and ex vivo measurements on animal model tissues. a,b, Schematic diagram (a) and an optical image (b) of a rodent during measurements with the chest opened. c–g, Photographs of a device injected into the lung (c), liver (d), spleen (e), kidney (f) and belly fat (g). The insets provide unmagnified views. h, Results of in vivo modulus measurements on a live rat and ex vivo results of the same organs after explanation. Error bars correspond to calculated standard error deviation for ten measurements.
0
10
20
30
40
50Lung
Mod
ulus
(kP
a)
0
10
20
30
40
50Adrenal gland
Mod
ulus
(kP
a)
0
10
20
30
40
50Kidney
Mod
ulus
(kP
a)
Fat Normal Tumour
0
10
20
30
40
50
Mod
ulus
(kP
a)
Thyroid
Normal Tumour0
10
20
30
40
50
Mod
ulus
(kP
a)
Hepatocellular carcinoma
0
10
20
30
40
50
Mod
ulus
(kP
a)
Cirrhotic liver
a cb
d fe
Tumour
Normal
Fat
Tumour
Normal
1 cm 1 cm1 cm
1 cm 1 cm 1 cm
Fig. 4 | Measurements of tissue modulus performed using a sensor system laminated onto a conventional biopsy needle. a–f, Modulus values measured on formalin-fixed and fresh tissues. The insets show optical images of the fixed lung tissue (a), fixed adrenal gland tissue (b), fixed kidney tissue with tumour (c), fresh cirrhotic liver (d), hepatocellular carcinoma (e) and fresh thyroid with tumour (f). Error bars correspond to calculated standard error deviation for ten measurements.
NATuRe BiOMediCAL eNgiNeeRiNg | VOL 2 | MARCH 2018 | 165–172 | www.nature.com/natbiomedeng 169

© 2018 Macmillan Publishers Limited, part of Springer Nature. All rights reserved. © 2018 Macmillan Publishers Limited, part of Springer Nature. All rights reserved.
Articles NaTUre Biomedical eNgiNeeriNg
both with tumours. The needle biopsy device is also capable of real-time measurements of modulus as a function of the penetration depth from normal tissue into tumour sites. Supplementary Fig. 20 demonstrates the measurements as the device traverses from cir-rhosis liver to a tumour. The results illustrate function on clinically relevant organ tissues, with the ability to distinguish normal from lesion areas, and to provide guidance in biopsies. The liver serves as a model to demonstrate further capabilities in image-guided biopsy tissue targeting, as described next.
Needle biopsy of tumour tissues. The evaluation of a variety of tumour tissues serves as a demonstration in the context of HCC42, which was chosen because concern for HCC is a common reason for ordering biopsy procedures43. Specifically, any suspicious liver lesion in patients at risk for HCC requires a biopsy for tissue diag-nosis and strict imaging surveillance to prevent its progression44. However, conventional biopsies of liver tissue for HCC have high rates of false negatives, and occult lesions < 3 cm are particularly difficult to target using ultrasound or computed tomography guid-ance45; HCC is thus a type of cancer for which improved biopsy quality would address an important clinical need.
Although magnetic resonance imaging and MRE can provide high-resolution images of the extent of a tumour, such methods are impractical for guiding a biopsy needle. Therefore, even though computed tomography is inferior to MRE in this context, computed tomography is commonly used because of its wide availability, low cost and fast modes of image acquisition compatible with use dur-ing a biopsy. Tests using device 2 demonstrate significant value in this context, as the evaluation of recipient livers with HCC yields modulus values that quantitatively match those extrapolated from MRE (the existing Food and Drug Administration (FDA)-approved procedure for the assessment of cirrhosis46). Specifically, MRE mea-surements of shear modulus (μ)47 relate to the Young’s modulus in soft tissues via the relationship E = 3μ (ref. 46).
Figure 5a shows a photograph of an explanted cirrhotic liver with HCC. This is also shown by magnetic resonance imaging in Fig. 5b. MRE yields a two-dimensional spatial map of the shear modulus across a slice of the liver near its centre, as presented in Fig. 5c and
Supplementary Fig. 21. The application of device 2 yields Young’s modulus values for this same tissue sample (Supplementary Fig. 22) in non-tumour cirrhotic areas and tumour areas at different loca-tions to provide at least ten measurements, as shown in Fig. 5d. Device 1 yields additional comparison data. The modulus values for the cirrhotic liver lie in the range 9–11 kPa (Fig. 5e,f), while those of the liver tumour are significantly higher, between 19 and 25 kPa. The modulus values in various areas of the cirrhotic liver fall in a narrow range, with a standard deviation < 10%. In contrast, the spa-tial variability of the liver tumour is as high as ~6 kPa, consistent with the known variations in the stiffness of tumours, where the centre of the tumour is often stiffer than the edge48. The results are consistent with the gold standard for mechanical measurements—MRE—via the relationship E = 3μ, and they are also comparable to those in the literature46,47. Collectively, these findings clearly indi-cate that both types of injectable sensor (devices 1 and 2) can be used as a unique tool for tissue pathology studies, such as tumour detection, including needle guidance during biopsy procedures.
OutlookCancer is a leading cause of death worldwide, and biopsy procedures are indispensable for diagnosis, assessing treatment response and—in an era of personalized medicine—genetic testing to guide therapy. Accurate tissue biopsy is therefore critical in the management of most cancers. However, centres across the nation and even multi-centre, pan-cancer clinical trials are unable to reduce failed biopsy rates to below 20%49. Current imaging modalities for guiding biop-sies either do not provide sufficient information or are not suitable for widespread clinical implementation. The results presented here suggest the potential of the miniaturized modulus-sensing device for biopsy guidance on the basis of elastography principles. This work demonstrates the feasibility of detection of HCC in liver tis-sue, for which false negative results following percutaneous biopsy of small lesions are common. More broadly, microsystem technologies for rapid, high-resolution modulus sensing could find uses across many other scenarios of clinical relevance. Future and ongoing work focuses on the engineering development of multi-function devices that enable the monitoring of temperature and flow rate.
b
e
a c
d
1 23 4
5
67
89
10
f
0
10
20
30
40
Mod
ulus
(kP
a)
Cirrhoticnon-neoplastic
Liver tumour
1 2 3 4 5 6 7 8 9 100
10
20
30
40
Mod
ulus
(kP
a)
Cirrhoticnon-neoplastic
Liver tumour
1 2 3 4 5 7 8 9 10
5 cmLiver tumour
10 cm
8 kPa
0
10 cm
6
Fig. 5 | Modulus-based biopsy guidance in cancerous human tissue samples. a, Photograph of a cirrhotic explanted human liver with a tumour. b, Magnetic resonance image of the tumour (red circle) within the liver. c, Magnetic resonance electrographs of the cirrhotic liver with tumour, presented as a 2D map of the shear modulus in a plane near the centre of the organ. d, Cross-sectional schematic diagram of the sites for measurement using the modulus-sensing probes. e,f, Modulus values measured from healthy and cancerous tissues using device 1 (e) and device 2 (f). Error bars correspond to calculated standard error deviation for ten measurements.
NATuRe BiOMediCAL eNgiNeeRiNg | VOL 2 | MARCH 2018 | 165–172 | www.nature.com/natbiomedeng170
© 2018 Macmillan Publishers Limited, part of Springer Nature. All rights reserved. © 2018 Macmillan Publishers Limited, part of Springer Nature. All rights reserved.
ArticlesNaTUre Biomedical eNgiNeeriNg
MethodsPreparation of membranes of Pb(Zr0.52Ti0.48)O3 (PZT). The fabrication of PZT membrane actuators and sensors began with the formation of 500-nm-thick films of PZT (MEMS Solution) by sol-gel techniques on oxidized silicon wafers. Sensor and actuator components, each with lateral dimensions of 200 μ m × 140 μ m used parallel-plate type capacitor designs with top and bottom electrodes. First, electron beam deposition formed a bilayer of Au/Cr (200 nm/10 nm) as the top electrode on multilayer stacks of PZT/Pt/Ti/SiO2 (500 nm/200 nm/5 nm/600 nm). Photolithography (Photoresist (PR) AZ 5214E; Micro Chemicals) and etching (gold: TFA, Transene Company; chrome: OM Group) defined an array of top electrodes (150 μ m × 100 μ m, with a square notch of 50 μ m × 50 μ m). Additional photopatterning (mask of PR hard baked at 150 °C for 5 min) and etching (HNO3:buffered hydrogen fluoride:deionized water = 1:1:20) defined PZT regions with dimensions of 180 μ m × 120 μ m (with a rectangle of 50 μ m × 40 μ m notch, for the purpose of bottom electrode connection). A final sequence of photopatterning and etching (HCl:HNO3:deionized water = 3:1:4 at 100 °C through a hard-baked mask of AZ4620) defined bottom Pt/Ti electrodes with dimensions of 200 μ m × 140 μ m. Next, protecting the PZT with PR (AZ4620) allowed partial undercut removal of the underlying SiO2 sacrificial layer by immersion in buffered hydrogen fluoride. Removing the PR with acetone enabled patterning of another layer of PR as a top surface encapsulation and perimeter anchor to the underlying wafer. Immersion in dilute hydrofluoric acid (deionized water:49% hydrofluoric acid = 3:1) completely removed the SiO2, thereby preparing the structures for transfer printing.
Fabrication of the sensor and actuator systems. A layer of photocurable epoxy (SU-8, MicroChem) was photopatterned to serve as a master for moulding surface relief onto a slab of PDMS as a stamp for transfer printing. Specifically, the photopatterning of a 100-μ m-thick film of SU-8 100 (MicroChem) spin cast on a polished silicon wafer defined an array of holes with rectangular cross sections (200 μ m × 140 μ m) to yield a corresponding array of posts on the PDMS via drop-casting of a liquid prepolymer mixture (Sylgard 184; Dow Corning, in a 10:1 ratio of prepolymer to curing agent), placement in a vacuum desiccator for 1 h to release bubbles, then curing in an oven at 70 °C for 24 h. Peeling the PDMS from the mould and placing it against a glass slide yielded a composite structure with sufficient dimensional stability to allow for accurate alignment. The process for transfer printing followed the scheme depicted in Supplementary Fig. 3, using an automated tool with a digital camera and microscope system for visualization. For device 1, transfer occurred onto a film of PI (75 μ m; DuPont) coated with a thin (1.2 μ m) layer of poly(pyromellitic dianhydride-co-4,4’-oxydianiline) amic acid solution baked at 90 °C for 30 s to provide a tacky, adhesive surface. The PZT actuator and sensor were transfer printed sequentially. After printing, the entire structure was baked at 150 °C on a hot plate for 5 min. The distance between the PZT sensor and actuator was 1 mm. Reactive ion etching (RIE; March) eliminated the layer of PR from the top surfaces of the devices. Spin casting another layer of PI (hard baked at 250 °C in a vacuum oven for 75 min) formed a robust encapsulation layer. Openings through the PI, again formed by RIE through a pattern of PR, provided access to the metal electrode contracts. Electron beam evaporation of Au/Cr (200 nm/10 nm) on a patterned layer of PR (AZ2070), followed by immersion in acetone, removed the PR to leave an array of metal interconnects. Another patterned layer of PI (1.2 μ m) formed an encapsulation layer over these traces. These overcoats of PI not only prevented direct physical contact of the device structures with biological tissues, but they also provided electrical insulation. The final step involved laser cutting of the PI substrate to form needle geometries with widths of 0.5 mm and lengths of 4 mm. An anisotropic conductive film served as a cable for electrical connection to an external power supply and data acquisition systems. For the ultrathin platforms (3 μ m; PI substrate) of device 2, the devices were first dry etched (RIE; March) through a patterned layer of PR to form a 1.5 mm × 4.5 mm area. Retrieval onto a sheet of water-soluble tape (polyvinyl alcohol), followed by electron beam evaporation of Ti/SiO2 (5 nm/40 nm) on the exposed backside, allowed adhesive transfer onto a 50-μ m-thick film of PDMS cast on a layer of PI on a glass slide to prevent any wrinkling or folding. Reactions between hydroxyl groups on the PDMS and SiO2 surfaces led to strong bonding after baking in an oven at 70 °C for 10 min. Immersion in hot water removed the polyvinyl alcohol. Mounting devices and PDMS on the biopsy needle used a similar procedure. Finally, the edge of the device was sealed by PDMS to ensure good adhesion between the device and biopsy needle.
Poling the PZT. Poling involved the application of a static electric field (200 kVcm−1) at 150 °C for 2 h to PZT films between the bottom and top contacts of Ti/Pt (5 nm/200 nm) and Cr/Au (10 nm/200 nm), respectively.
Device operation and data collection. The devices were implanted into either artificial or organ tissues. A waveform generator (Keithley 3390), a digital lock-in amplifier (SR830; Stanford Research Systems), digital multimeters (ADInstruments) and a laptop computer with a custom programme (LabVIEW, National Instruments) enabled the collection of data from the sensors and supply of voltage to the actuators.
Preparation of artificial tissue samples. Agarose gel (Sigma) and PDMS provided two different types of artificial tissue sample. Agarose gel tissue samples were prepared by dissolving powdered agarose in deionized water at 100 °C while vigorously stirring for 3 h until the solution became transparent. Solutions with different concentrations formed in this way were slowly cooled to room temperature, poured into moulds or small vials and then stored in a refrigerator overnight. For the case of PDMS, sample preparation began with the mixing of various ratios of prepolymer to curing agent, storing in a vacuum desiccator for 30 min, then pouring into the moulds and curing in an oven at 70 °C for 24 h.
DMA. DMA (Q800 DMA; TA Instruments) yielded Young’s moduli via analysis of quasi-static stress–strain curves. The measurements used the DMA film tension clamp in ambient conditions at a strain rate of 1% min–1 to a maximum value of 10%.
Animal model in vivo and ex vivo tests. The experiments were conducted in accordance with the ethical guidelines of the National Institutes of Health and with the approval of the Animal Care and Use Committee of Mayo Clinic’s institutional review board. For in vivo and ex vivo device validation, an anaesthetized Sprague Dawley rat was placed in a supine position over a warming platform. A mid-abdominal incision was made and the abdominal wall was retracted. Blunt dissection was used to expose the abdominal fat, liver, spleen and kidneys. The modulus sensor was inserted directly into each organ using a blunt forceps. Once the abdominal organ modulus measurements were acquired, a thoracic incision was made to insert the sensor into the lung tissue. Following in vivo measurements, the rat was euthanized and each organ was removed and transferred to petri dishes to obtain ex vivo measurements. The organ removal required less than 3 min and the ex vivo test occurred immediately after removal. The total ex vivo measuring time was 10 min.
Human organ tissue tests. Following Mayo Clinic’s institutional review board approval, we used samples of residual discarded tissue, including fresh and formalin-fixed tissue—specifically, the liver, lung, kidney, thyroid gland and adrenal gland. Tumour tissue was present in the liver, thyroid and kidney specimens. The institutional review board did not require informed consent from tissue donors because de-identified residual discarded clinical tissue was used in the experiments. The use of magnetic resonance imaging and MRE images of the livers was also approved.
Life Sciences Reporting Summary. Further information on experimental design is available in the Life Sciences Reporting Summary.
Data availability. The authors declare that all data supporting the findings of this study are available within the paper and its Supplementary Information.
Received: 7 September 2017; Accepted: 22 January 2018; Published online: 26 February 2018
References 1. Maharaj, B. et al. Sampling variability and its influence on the diagnostic
yield of percutaneous needle biopsy of the liver. Lancet 327, 523–525 (1986).
2. Saggese, M., Dua, D., Simmons, E., Lemech, C. & Arkenau, H.-T. Research biopsies in the context of early phase oncology studies: clinical and ethical considerations. Oncol. Rev. 7, e5 (2013).
3. Regev, A. et al. Sampling error and intraobserver variation in liver biopsy in patients with chronic HCV infection. Am. J. Gastroenterol. 97, 2614–2618 (2002).
4. Shyamala, K., Girish, H. C. & Murgod, S. Risk of tumor cell seeding through biopsy and aspiration cytology. J. Int. Soc. Prev. Community Dent. 4, 5–11 (2014).
5. National Cancer Institute NCI-MATCH Trial (Molecular Analysis for Therapy Choice) (2017); https://www.cancer.gov/about-cancer/treatment/clinical-trials/nci-supported/nci-match
6. Rago, T., Santini, F., Scutari, M., Pinchera, A. & Vitti, P. Elastography: new developments in ultrasound for predicting malignancy in thyroid nodules. J. Clin. Endocrinol. Metab. 92, 2917–2922 (2007).
7. Geraghty, P. R. et al. CT-guided transthoracic needle aspiration biopsy of pulmonary nodules: needle size and pneumothorax rate. Radiology 229, 475–481 (2003).
8. Picarelli, A. et al. Production of antiendomysial antibodies after in-vitro gliadin challenge of small intestine biopsy samples from patients with coeliac disease. Lancet 348, 1065–1067 (1996).
9. Discher, D. E., Janmey, P. & Wang, Y. L. Tissue cells feel and respond to the stiffness of their substrate. Science 310, 1139–1143 (2005).
10. Abramowitch, S. D., Feola, A., Jallah, Z. & Moalli, P. A. Tissue mechanics, animal models, and pelvic organ prolapse: a review. Eur. J. Obstet. Gynecol. Reprod. Biol. 144, S146–S158 (2009).
NATuRe BiOMediCAL eNgiNeeRiNg | VOL 2 | MARCH 2018 | 165–172 | www.nature.com/natbiomedeng 171

© 2018 Macmillan Publishers Limited, part of Springer Nature. All rights reserved. © 2018 Macmillan Publishers Limited, part of Springer Nature. All rights reserved.
Articles NaTUre Biomedical eNgiNeeriNg
11. Fung, Y. C. Biomechanics: Mechanical Properties of Living Tissues (Springer, New York, 2013).
12. Ziol, M. et al. Noninvasive assessment of liver fibrosis by measurement of stiffness in patients with chronic hepatitis C. Hepatology 41, 48–54 (2005).
13. O’Rourke, M. F. & Safar, M. E. Relationship between aortic stiffening and microvascular disease in brain and kidney: cause and logic of therapy. Hypertension 46, 200–204 (2005).
14. Li, M. et al. Modeling lung deformation: a combined deformable image registration method with spatially varying Young’s modulus estimates. Med. Phys. 40, 081902 (2013).
15. Miller, K. & Chinzei, K. Mechanical properties of brain tissue in tension. J. Biomech. 35, 483–490 (2002).
16. Wickramaratne, D. et al. Fine needle elastography (FNE) device for biomechanically determining local variations of tissue mechanical properties. J. Biomech. 48, 81–88 (2015).
17. Yeh, W.-C. et al. Elastic modulus measurements of human liver and correlation with pathology. Ultrasound Med. Biol. 28, 467–474 (2002).
18. Diridollou, S. et al. In vivo model of the mechanical properties of the human skin under suction. Skin Res. Technol. 6, 214–221 (2000).
19. Samani, A., Zubovits, J. & Plewes, D. Elastic moduli of normal and pathological human breast tissues: an inversion-technique-based investigation of 169 samples. Phys. Med. Biol. 52, 1565–1576 (2007).
20. Rho, J. Y., Roy, M. E., Tsui, T. Y. & Pharr, G. M. Elastic properties of microstructural components of human bone tissue as measured by nanoindentation. J. Biomed. Mater. Res. A 45, 48–54 (1999).
21. Nightingale, K., Soo, M. S., Nightingale, R. & Trahey, G. Acoustic radiation force impulse imaging: in vivo demonstration of clinical feasibility. Ultrasound Med. Biol. 28, 227–235 (2002).
22. Castera, L., Vilgrain, V. & Angulo, P. Noninvasive evaluation of NAFLD. Nat. Rev. Gastroenterol. Hepatol. 10, 666–675 (2013).
23. Leung, V. Y. et al. Quantitative elastography of liver fibrosis and spleen stiffness in chronic hepatitis B carriers: comparison of shear-wave elastography and transient elastography with liver biopsy correlation. Radiology 269, 910–918 (2013).
24. Muthupillai, R. et al. Magnetic resonance elastography by direct visualization of propagating acoustic strain waves. Science 269, 1854–1857 (1995).
25. Sinkus, R. et al. High-resolution tensor MR elastography for breast tumour detection. Phys. Med. Biol. 45, 1649 (2000).
26. Goss, B. C., McGee, K. P., Ehman, E. C., Manduca, A. & Ehman, R. L. Magnetic resonance elastography of the lung: technical feasibility. Magn. Reson. Med. 56, 1060–1066 (2006).
27. Agid, R. et al. CT-guided biopsy with cutting-edge needle for the diagnosis of malignant lymphoma: experience of 267 biopsies. Clin. Radiol. 58, 143–147 (2003).
28. Mirnezami, R., Nicholson, J. & Darzi, A. Preparing for precision medicine. N. Engl. J. Med. 366, 489–491 (2012).
29. Dagdeviren, C. et al. Conformal piezoelectric systems for clinical and experimental characterization of soft tissue biomechanics. Nat. Mater. 14, 728–736 (2015).
30. Carlson, A., Bowen, A. M., Huang, Y., Nuzzo, R. G. & Rogers, J. A. Transfer printing techniques for materials assembly and micro/nanodevice fabrication. Adv. Mater. 24, 5284–5318 (2012).
31. Jeong, J.-W. et al. Wireless optofluidic systems for programmable in vivo pharmacology and optogenetics. Cell 162, 662–674 (2015).
32. Koh, A. et al. Ultrathin injectable sensors of temperature, thermal conductivity, and heat capacity for cardiac ablation monitoring. Adv. Healthc. Mater. 5, 373–381 (2016).
33. Wang, Z., Volinsky, A. A. & Gallant, N. D. Nanoindentation study of polydimethylsiloxane elastic modulus using Berkovich and flat punch tips. J. Appl. Polym. Sci. 132, 41384 (2015).
34. Mauck, R. L. et al. Functional tissue engineering of articular cartilage through dynamic loading of chondrocyte-seeded agarose gels. J. Biomech. Eng. 122, 252–260 (2000).
35. Normand, V., Lootens, D. L., Amici, E., Plucknett, K. P. & Aymard, P. New insight into agarose gel mechanical properties. Biomacromolecules 1, 730–738 (2000).
36. Travessa, D., Ferrante, M. & den Ouden, G. Diffusion bonding of aluminium oxide to stainless steel using stress relief interlayers. Mater. Sci. Eng. A 337, 287–296 (2002).
37. Purton, D. & Payne, J. Comparison of carbon fiber and stainless steel root canal posts. Quintessence Int. 27, 93–97 (1996).
38. Fang, H. et al. Capacitively coupled arrays of multiplexed flexible silicon transistors for long-term cardiac electrophysiology. Nat. Biomed. Eng. 1, 0038 (2017).
39. Rotsch, C., Braet, F., Wisse, E. & Radmacher, M. AFM imaging and elasticity measurements on living rat liver macrophages. Cell Biol. Int. 21, 685–696 (1997).
40. Adler, A., Cowley, E. A., Bates, J. H. T. & Eidelman, D. H. Airway-parenchymal interdependence after airway contraction in rat lung explants. J. Appl. Physiol. 85, 231–237 (1998).
41. Wyss, H. M. et al. Biophysical properties of normal and diseased renal glomeruli. Am. J. Physiol. Cell Physiol. 300, C397–C405 (2011).
42. Bruix, J. & Sherman, M. Management of hepatocellular carcinoma: an update. Hepatology 53, 1020–1022 (2011).
43. Liaw, Y.-F. & Chu, C.-M. Hepatitis B virus infection. Lancet 373, 582–592 (2009).
44. Bravo, A. A., Sheth, S. G. & Chopra, S. Liver biopsy. N. Engl. J. Med. 344, 495–500 (2001).
45. Ahrar, K. in Percutaneous Image-Guided Biopsy 19–32 (Springer, New York, 2014).
46. Mariappan, Y. K., Glaser, K. J. & Ehman, R. L. Magnetic resonance elastography: a review. Clin. Anat. 23, 497–511 (2010).
47. Manduca, A. et al. Magnetic resonance elastography: non-invasive mapping of tissue elasticity. Med. Image Anal. 5, 237–254 (2001).
48. Stylianopoulos, T. et al. Causes, consequences, and remedies for growth-induced solid stress in murine and human tumors. Proc. Natl Acad. Sci. USA 109, 15101–15108 (2012).
49. Do, K., O’Sullivan Coyne, G. & Chen, A. P. An overview of the NCI precision medicine trials—NCI MATCH and MPACT. Chin. Clin. Oncol. 4, 31 (2015).
AcknowledgementsThis work was supported by the Center for Bio-Integrated Electronics. R.O. acknowledges National Institutes of Health grants R01HL137193, R01EB24403, R21EB021148 and R03CA172738, and Mayo Clinic. R.S. acknowledges support from the Engineering and Physical Sciences Research Council (grant number EP/L016028/1) and China Scholarship Council. L.T. acknowledges support from a Beckman Institute postdoctoral fellowship at the University of Illinois Urbana-Champaign. Y.H. acknowledges support from the National Science Foundation (grant numbers 1400169, 1534120 and 1635443) and National Institutes of Health (grant number R01EB019337). The authors acknowledge N. Pallace (Media Support Services at Mayo Clinic) for expert photography during the experiments.
Author contributionsX.Y., H.W., X.N., Y.H., R.O. and J.A.R. designed the experiment and wrote the manuscript. X.Y., H.W., X.N., R.S., M.S., H.A., Y.Y., A.K., C.M.L., A.C.S., P.T. and R.O. performed the experiments and analysed the experimental data. H.W. led the structural designs and mechanics modelling, with assistance from J.Y. L.T. and M.P. contributed to the analysis of the experimental results.
Competing interestsThe authors declare no competing interests.
Additional informationSupplementary information is available for this paper at https://doi.org/10.1038/s41551-018-0201-6.
Reprints and permissions information is available at www.nature.com/reprints.
Correspondence and requests for materials should be addressed to Y.H. or R.O. or J.A.R.
Publisher’s note: Springer Nature remains neutral with regard to jurisdictional claims in published maps and institutional affiliations.
NATuRe BiOMediCAL eNgiNeeRiNg | VOL 2 | MARCH 2018 | 165–172 | www.nature.com/natbiomedeng172

ARTICLEShttps://doi.org/10.1038/s41551-018-0201-6
© 2018 Macmillan Publishers Limited, part of Springer Nature. All rights reserved.
Needle-shaped ultrathin piezoelectric microsystem for guided tissue targeting via mechanical sensingXinge Yu1,2,19, Heling Wang3,4,5,19, Xin Ning2,19, Rujie Sun2,6, Hassan Albadawi7, Marcela Salomao8, Alvin C. Silva9, Yang Yu2,10, Limei Tian2,11, Ahyeon Koh12, Chan Mi Lee2, Aditya Chempakasseril2, Peilin Tian2, Matt Pharr13, Jianghong Yuan3,4,5,14, Yonggang Huang3,4,5*, Rahmi Oklu 7* and John A. Rogers1,2,5,15,16,17,18*
1Simpson Querrey Center and Feinberg School of Medicine, Center for Bio-Integrated Electronics, Northwestern University, Evanston, IL, USA. 2Department of Materials Science and Engineering, Frederick Seitz Materials Research Laboratory, University of Illinois at Urbana-Champaign, Urbana, IL, USA. 3Department of Civil and Environmental Engineering, Northwestern University, Evanston, IL, USA. 4Department of Mechanical Engineering, Northwestern University, Evanston, IL, USA. 5Department of Materials Science and Engineering, Northwestern University, Evanston, IL, USA. 6Advanced Composites Centre for Innovation and Science, University of Bristol, Bristol, UK. 7Division of Vascular and Interventional Radiology, Minimally Invasive Therapeutics Laboratory, Mayo Clinic, Phoenix, AZ, USA. 8Department of Pathology, Mayo Clinic, Phoenix, AZ, USA. 9Division of Abdominal Imaging, Mayo Clinic, Phoenix, AZ, USA. 10Department of Materials Science and Engineering, Tsinghua University, Beijing, China. 11Beckman Institute for Advanced Science and Technology, University of Illinois at Urbana-Champaign, Urbana, IL, USA. 12Department of Biomedical Engineering, Binghamton University, Binghamton, NY, USA. 13Department of Mechanical Engineering, Texas A&M University, College Station, TX, USA. 14Center for Mechanics and Materials, and Applied Mechanics Laboratory, Department of Engineering Mechanics, Tsinghua University, Beijing, China. 15Department of Biomedical Engineering, Northwestern University, Evanston, IL, USA. 16Department of Neurological Surgery, Northwestern University, Evanston, IL, USA. 17Department of Chemistry, Northwestern University, Evanston, IL, USA. 18Department of Electrical Engineering and Computer Science, Northwestern University, Evanston, IL, USA. 19These authors contributed equally: Xinge Yu, Heling Wang and Xin Ning. *e-mail: [email protected]; [email protected]; [email protected]
SUPPLEMENTARY INFORMATION
In the format provided by the authors and unedited.
NATURE BIOMEDICAL ENGINEERING | www.nature.com/natbiomedeng

1
List of contents:
Supplementary Note 1. Finite element analysis (FEA) method and condition.
Supplementary Note 2. FEA validation of the scaling law.
Figure S1. Schematic illustration of procedures for fabricating PZT membrane inks on a SiO2/Si
wafer. a. Schematic diagram of cross section view for a PZT wafer with structure
Au/Cr/PZT/Pt/Ti/SiO2/Si. b. The capacitor structure PZT membranes were patterned and defined by
photolithography technique. c. Partial under cut etching of SiO2 sacrificial layer by buffered oxide
etchant. d. Final PZT membrane inks formed by fully under cut etching of SiO2 sacrificial layer
with dilute HF solution.
Figure S2. Optical images of PZT membrane inks. a. PZT membrane inks array. b. Zoom in view of
a PZT membrane.
Figure S3. Representation of transfer printing PZT membranes using a stamp with a post, showing
individual process steps. a. Translation and Alignment to PZT membranes donor wafer. b. Selective
engagement with one PZT membrane. c. a PZT membrane retrieval from donor wafer and contact to
transfer onto polyimide (PI) acceptor substrate. d. e. Repeat cycles of steps a to c, zoom in view
shows the two PZTs which will act as the sensor and actuator.
Figure S4. Schematic illustration of sensors/actuators encapsulation and electrodes formation
process. a. a PZT membrane on polyimide (PI) substrate. b. First encapsulation PI layer spun and
cured on top of the PZT membrane, then patterned using photo resist (PR). c. Opening to holes for
cathode and anode connection by dry etching. d. Patterning PI for metallic interconnection wire
deposition. e. Cr(10 nm)/Au(200 nm) interconnection wire deposition by E=-beam onto the PR and
then remove additional PR by lift off technique. f. Final PI encapsulation layer deposited onto the
devices to prevent influence of liquid during test.
Figure S5. Modulus probe design and images. a. Design of 6 modulus probes array for laser cut. b.
Photograph of modulus probe devices done by laser cut. c. SEM image of a modulus probe device.
d, e. Zoom in view of the modulus probe device, shown sensor area (c), and actuator area (d).
Figure S6. Photography of modulus sensor devices. a. Free standing polyimide (PI) supporting layer
based device. b. Biopsy needle based device.
Figure S7. a. The nonlinear single-variable function G in the scaling law, determined by FEA. b.
Simulation result of Vsensor/Vactuator as a function of modulus.
Figure S8. Validation of the scaling law. a. validate that the function G depends only on a single
combination of parameters, (𝐸Tissue𝑑3)/(𝐸PIℎPI3 ). b. Validate the linear proportionality between the
sensor voltage and (𝐴PZT ℎPZT)/(𝐸PIℎPI𝑑
2).
Figure S9. Prediction of the critical tissue modulus by the scaling law (black solid lines) and the
FEA based on the geometrical dimensions of the device in the main text (red dots). a. Influence of
the needle substrate modulus. b. Influence of the needle substrate thickness. c. Influence of spacing
between the actuator and the sensor.
Figure S10. FEA prediction of the output voltage as a function of the tissue modulus for a small
sample (size 1.0 mm × 1.0 mm × 1.5 mm)

2
Figure S11. Tension stress-strain plots of artificial agarose gel in quasi-static strain rate regimes,
with different modulus values.
Figure S12. Experimental and theoretical analysis of the free standing device operation. Voltage
output of sensor as a function of actuator voltage, measured on ten different agarose gels with
known moduli, separately evaluated by quasi-static dynamical mechanical analysis shown in Figure
S11. Here, the symbols and lines correspond to experimental (E) and theoretical (T) results,
respectively. Error bars correspond to calculated standard error deviation.
Figure S13. The mechanism of deformation for the modulus sensors integrated on a biopsy needle.
The red arrows indicate that the deformation induced by the actuator is transferred to the sensor
mainly via the deformation of the tissue and also the PDMS below the PI substrate.
Figure S14. Theoretical analysis of biopsy needle based modulus sensor devices. a. Influence of the
PDMS modulus on the sensor voltage. b. Influence of the PDMS thickness on the sensor voltage.
Figure S15. Theoretical analysis of Vsensor as a function of modulus, with actuator voltage of 5V.
Figure S16. Experimental analysis and modulus measurements of multilayer artificial tissues. a.
Modulus measurement on a multilayer sample, with three different modulus of 18, 33, and 80 kPa.
b. Sensor voltage and modulus values at an actuation voltage of 5V, as a function of inject depth of
the multilayer sample.
Figure S17. Modulus measurements modulus as function of time for 60 minutes. a. Measured on
artificial agarose gel tissues with different modulus values. b. Measured on big tissues, including
liver, fat, kidney, and muscle.
Figure S18. Illustration of surgical procedures for modulus measurement on the rat.
Figure S19. Ex-vivo measurement of organ tissues of the rat. Device insert and measure on liver, a,
lung b, spleen c, fat d, and kidney e.
Figure S20. Real-time modulus measurement by a biopsy needle device. The device traverse from
cirrhosis liver to tumor. Error bars correspond to calculated standard error deviation.
Figure S21. Images of a cirrhotic liver with hepatocellular carcinoma. a. Measured by Magnetic
resonance image (MRI). b. Measured by Magnetic resonance electrography (MRE), shown stiffness
mapping of the whole cross section of the patient.
Figure S22. Image-guided modulus test. a,b, Photographs of a free standing device (device 1)
injected into the non-tumor area of liver (a), and tumor (b). c,d, Photographs of a biopsy needle
device (device 2) injected into the non-tumor area of liver (c), and tumor (d).

3
Supplementary Note 1: Finite element analysis (FEA) method and condition
FEA was conducted using the commercial software ABAQUS (version 6.14, Standard). The
end of the needle outside the tissue was fixed to constrain the rigid body motion. Since the
deformation was very small (strain <0.1 %), linear coupled mechanical-electric analysis was used to
obtain the deformation and sensor voltage. The actuator and sensor were modelled by the linear
piezoelectric material, and the tissue, PI and metals were modelled by the linear elastic material.
The number of mesh in the model was ~106, with refinement around the region with the actuator
and the sensor such that the minimum mesh size was 1/10 of the actuator/sensor size. The mesh
convergence of the simulation was guaranteed for all cases.
3D solid elements are used to model the tissue and 3D shell elements are used to model the
needle substrate, the actuator, the sensor and the electrode (Ti, Pt, Cr and Cu), with Figure S5
showing the layout. The needle is perfectly bonded to the tissue without relative slipping in FEA.
The material parameters are EPI=2.5 GPa, νPI=0.34, ETi=110 GPa, νTi=0.32, EPt=168 GPa,
νPt=0.38, ECr=279 GPa, νCr=0.21, ECr=117 GPa, νCu=0.36. The constitutive model for PZT is
11 12 1311 11 31
12 11 1322 22 31
13 13 3333 33 33
4423 23 15
4431 31 15
6612 12
0 0 0 0 0
0 0 0 0 0
0 0 0 0 0
0 0 0 0 0 2 0 0
0 0 0 0 0 2 0 0
0 0 0 0 0 2 0 0 0
C C C e
C C C e
C C C e
C e
C e
C
1
2
3
E
E
E
(S1)
11
22
1 15 11 1
33
2 15 11 2
23
3 31 31 33 33 3
31
12
0 0 0 0 0 0 0
0 0 0 0 0 0 02
0 0 0 0 02
2
D e k E
D e k E
D e e e k E
(S2)

4
where ij ,
ij , iE and iD are the stress, strain, electrical filed and electrical displacement
respectively. The elastic parameters are C11=110 GPa, C12=63 GPa, C13=64 GPa, C33=100 GPa,
C44=20 GPa and C66=(C11 -C12)/2. The piezoelectric parameters are e31=−9.6 N /(V•m), e33=15.1 N
/(V•m), and e15=12.0 N /(V•m). The dielectric parameters are k33 =852 0 , where 0 is the vacuum
permittivity.

5
Supplementary Note 2: FEA validation of the scaling law
The scaling law Eq. (1) in the main text is validated by FEA for ℎPZT ≪ ℎPI ≪ 𝑤PI, 𝐿PI, and
ℎPZT ≪ 𝐿PZT, 𝑤PZT ≪ d ≪ 𝑤PI, 𝐿PI. First, the function G is validated to depend only on a single
combination of parameters, (𝐸Tissue𝑑3)/(𝐸PIℎPI3 ). Among four parameters 𝐸Tissue, d, 𝐸PI and ℎPI,
one changes while the other three are fixed. The sensor voltage obtained by FEA then gives G,
which is shown by the G~(𝐸Tissue𝑑3)/(𝐸PIℎPI3 ) plot in Figure S2a. It is clear that all data points
fall on the same curve, confirming that G depends only on G~(𝐸Tissue𝑑3)/(𝐸PIℎPI3 ).
The linear proportionality between the sensor voltage and (𝐴PZTℎPZT)/(𝐸PIℎPI𝑑2) is verified
next. With G fixed, among five parameters d, 𝐸PI, ℎPI, 𝐴PZT and ℎPZT, one changes while the other
four are fixed. All data points obtained by FEA fall on the straight line in Figure S2b, confirming
that the sensor voltage is linearly proportional to (𝐴PZT ℎPZT)/(𝐸PIℎPI𝑑
2).

Figure S1. Schematic illustration of procedures for fabricating PZT membrane inks on a
SiO2/Si wafer. a. Schematic diagram of cross section view for a PZT wafer with structure
Au/Cr/PZT/Pt/Ti/SiO2/Si. b. The capacitor structure PZT membranes were patterned and defined
by photolithography technique. c. Partial under cut etching of SiO2 sacrificial layer by buffered
oxide etchant. d. Final PZT membrane inks formed by fully under cut etching of SiO2 sacrificial
layer with dilute HF solution.
Si
SiO2
Pt (200 nm)/Ti (5 nm)
PZT (500 nm)
Au (200 nm)/Cr (5 nm)
PR
O2
PR
PR
Anchors
a b
d c

50 m
Pt
Au
PZT
a b
Figure S2. Optical images of PZT membrane inks. a. PZT membrane inks array. b. Zoom in
view of a PZT membrane

PZTmembrane
PZTmembrane
Aligning Pick up Transfer printing
Pick upTransfer printing
a b c
e d
Figure S3. Representation of transfer printing PZT membranes using a stamp with a post,
showing individual process steps. a. Translation and Alignment to PZT membranes donor
wafer. b. Selective engagement with one PZT membrane. c. a PZT membrane retrieval from
donor wafer and contact to transfer onto polyimide (PI) acceptor substrate. d. e. Repeat cycles of
steps a to c, zoom in view shows the two PZTs which will act as the sensor and actuator.

PI
PZT
P R
PI
PZT
PI
PI
PZT
P R
PI
PZT
a b c
d e f
Figure S4. Schematic illustration of sensors/actuators encapsulation and electrodes
formation process. a. a PZT membrane on polyimide (PI) substrate. b. First encapsulation PI
layer spun and cured on top of the PZT membrane, then patterned using photo resist (PR). c.
Opening to holes for cathode and anode connection by dry etching. d. Patterning PI for metallic
interconnection wire deposition. e. Cr(10 nm)/Au(200 nm) interconnection wire deposition by
E=-beam onto the PR and then remove additional PR by lift off technique. f. Final PI
encapsulation layer deposited onto the devices to prevent influence of liquid during test.

a
b c
d
e
Figure S5. Modulus probe. a. Design of 6 modulus probes array for laser cut. b. Photograph of
modulus probe devices done by laser cut. c. SEM image of a modulus probe device. d, e. Zoom
in view of the modulus probe device, shown sensor area (c), and actuator area (d).

a b
Figure S6. Photography of modulus sensor devices. a. Free standing polyimide (PI)
supporting layer based device. b. Biopsy needle based device.

Figure S7. a. The nonlinear single-variable function G in the scaling law, determined by FEA. b.
Simulation result of Vsensor/Vactuator as a function of modulus
a
1E-3 0.01 0.1 1 100.00
0.04
0.08
0.12
0.16
V e A h E d= G
V k E h d E h
2 3
Sensor 31 PZT PZT Tissue
2 3
Actuator 33 PI PI PI PI
Scaling law:
G
/E d E h3 3
Tissue PI PI
Turning point
10 1000
20
40
60
80
Simulation results
Modulus (kPa)
Vsensor /
Vactu
ato
r (
10
-6)
b

Figure S8. Validation of the scaling law. a. validate that the function G depends only on a
single combination of parameters, (𝐸Tissue𝑑3)/(𝐸PIℎPI
3 ). b. Validate the linear proportionality
between the sensor voltage and (𝐴PZTℎPZT)/(𝐸PIℎPI𝑑2).
0.001 0.01 0.1 1 100.00
0.04
0.08
0.12
0.16
(Etissued3)/(EPIhPI)
G
a
Change ETissue
Change hPI
Change EPI
Change d
0.0 0.5 1.0 1.50.0
0.5
1.0
1.5
2.0
(e231APZThPZT)/(k33EPIhPId
2)
VS
en
so
r/V
Ac
tua
tor
×10-4
×10-7
Change hPZT
Change APZT
Change hPI
Change EPI
Change d
b

Figure S9. Prediction of the critical tissue modulus by the scaling law (black solid lines)
and the FEA based on the geometrical dimensions of the device in the main text (red dots).
a. influence of the needle substrate modulus. b. influence of the needle substrate thickness. c.
influence of spacing between the actuator and the sensor.
0 50 100 150 200 2500
1
2
3
4
5
6
Needle substrate thickness hPI (um)
Cri
tical
tissu
e m
od
ulu
s
(MP
a)
Scaling law E*Tissue h
3PI
FEA
0 10 20 30 40 50 600
1
2
3
4
5
6
Needle substrate modulus EPI (GPa)
Cri
tical
tissu
e m
od
ulu
s
(MP
a)
Scaling law E*Tissue EPI
FEA
a b
0.4 0.6 0.8 1.00
1
2
3
4
5
6
Actuator/sensor spacing d (mm)
Cri
tic
al
tis
su
e m
od
ulu
s
(MP
a) Scaling law E
*Tissue d
-3
FEA
c

Figure S10. FEA prediction of the output voltage as a function of the tissue modulus for a
small sample (size 1.0 mm× 1.0 mm× 1.5 mm)
Tissue modulus (kPa)
0 20 40 60 80 100 120-2.5
-2.0
-1.5
-1.0
VS
en
so
r/V
Actu
ato
r 10
-6
a b
tTissue
LTissue
LTissue
Needle
x
y
z x
y
tTissue
Needle
LTissue
LTissue=1.0 mm
tTissue=1.5 mm

2 4 6 80.0000
0.0005
0.0010
0.0015
Str
ess (
MP
a)
Strain (%)
E=2 kPa
2 4 6 80.0000
0.0005
0.0010
0.0015
Str
ess (
MP
a)
Strain (%)
E=6 kPa
2 4 6 80.0000
0.0005
0.0010
0.0015
Str
ess (
MP
a)
Strain (%)
E=11 kPa
2 4 6 80.000
0.001
0.002
0.003
Str
ess (
MP
a)
Strain (%)
E=18 kPa
2 4 6 80.000
0.001
0.002
0.003
Str
ess (
MP
a)
Strain (%)
E=24 kPa
2 4 6 80.000
0.001
0.002
0.003
Str
ess (
MP
a)
Strain (%)
E=33 kPa
2 4 6 80.000
0.002
0.004
Str
ess (
MP
a)
Strain (%)
E=45 kPa
2 4 6 80.000
0.002
0.004
Str
ess (
MP
a)
Strain (%)
E=57 kPa
2 4 6 80.000
0.002
0.004
Str
ess (
MP
a)
Strain (%)
E=80 kPa
2 4 6 80.000
0.002
0.004
0.006
Str
ess (
MP
a)
Strain (%)
E=105 kPa
Figure S11. Tension stress-strain plots of artificial agarose gel in quasi-static strain rate
regimes, with different modulus values.

1 2 3 4 5
0.0
0.1
0.2
0.3
0.4
0.5 2k
11k
24k
45k
80k
Sensor
Volta
ge (
mV
)
Actuator Voltage (V)1 2 3 4 5
0.0
0.1
0.2
0.3
0.4
0.5 6k
18k
33k
57k
105k
Sensor
Volta
ge (
mV
)
Actuator Voltage (V)
Figure S12. Experimental and theoretical analysis of the device operation. Voltage output
of sensor as a function of actuator voltage, measured on ten different agarose gels with known
moduli, separately evaluated by quasi-static dynamical mechanical analysis shown in Figure
S10. Here, the symbols and lines correspond to experimental (E) and theoretical (T) results,
respectively. Error bars correspond to calculated standard error deviation.

Figure S13. The mechanism of deformation for the modulus sensors integrated on a biopsy
needle. The red arrows indicate that the deformation induced by the actuator is transferred to the
sensor mainly via the deformation of the tissue and also the PDMS below the PI substrate
PI substratePDMS
Biopsy needle
Actuator Sensor
Tissue
Tissue

Figure S14. Theoretical analysis of biopsy needle based modulus sensor devices. a. Influence
of the PDMS modulus on the sensor voltage. b. Influence of the PDMS thickness on the sensor
voltage.
EPDMS (kPa)
0 20 40 60 80 100
2
4
6
8
10
12
a
Tissue Modulus ETissue (kPa)
VS
en
so
r/V
Actu
ato
r(×
10
-6)
100
60
50
30
20
hPDMS =50um
0 20 40 60 80 1000
5
10
15
20
25
b
Tissue Modulus ETissue (kPa)
hPDMS (um)
25
50
75
100
VS
en
so
r/V
Actu
ato
r(×
10
-6)
EPDMS =100kPa

Figure S15. Theoretical analysis of Vsensor as a function of modulus, with actuator voltage of 5V
0 200 400 600 800 1000
0.05
0.10
0.15
Vo
lta
ge
(m
V)
Modulus (kPa)
(T)

1 2 3 4
0.1
0.2
0.3
0.4
Inject Depth (mm)
Se
nso
r V
olta
ge
(m
V)
30
60
90 Mo
du
lus (k
Pa
)
2
1
Inject18 kPa
33 kPa
80 kPa
3
1 cm
a b
Figure S16. Experimental analysis and modulus measurements of multilayer artificial
tissues. a. Modulus measurement on a multilayer sample, with three different modulus of 18, 33,
and 80 kPa. b. Sensor voltage and modulus values at an actuation voltage of 5V, as a function of
inject depth of the multilayer sample.

0 20 40 600
20
40
60
80
100
Mo
du
lus (
kP
a)
Time (min)
6 kPa 24 kPa 45 kPa 80 kPa
0 20 40 600
20
40
60
Mo
du
lus (
kP
a)
Time (min)
Liver Fat kidney Muscle
a
b
Figure S17. Modulus measurements modulus as function of time for 60 minutes. a.
Measured on artificial agarose gel tissues with different modulus values. b. Measured on big
tissues, including liver, fat, kidney, and muscle.
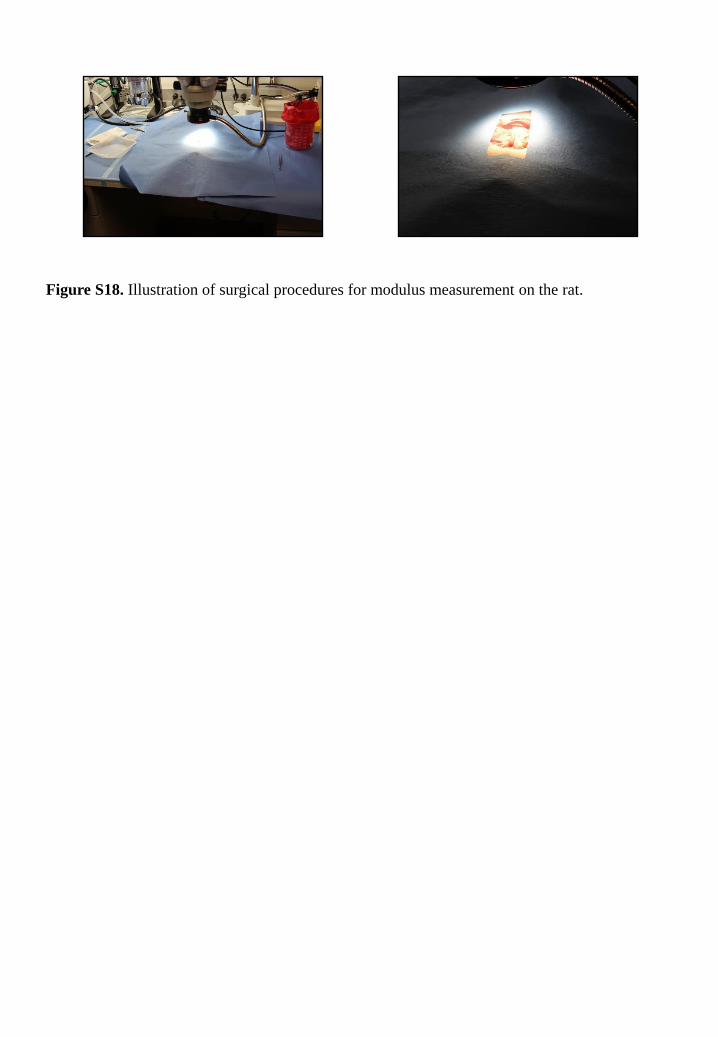
Figure S18. Illustration of surgical procedures for modulus measurement on the rat.

a
e
b c
d
Figure S19. Ex-vivo measurement of organ tissues of the rat. Device insert and measure on
liver, a, lung b, spleen c, fat d, and kidney e.

Figure S20. Real-time modulus measurement by a biopsy needle device. The device traverse
from cirrhosis liver to tumor.
1 2 3 4
10
20
30 Tumor
Cirrhosis
Modulu
s (
MP
a)
Travel depth (cm)

a b
Figure S21. Images of a cirrhotic liver with hepatocellular carcinoma. a. Measured by
Magnetic resonance image (MRI). b. Measured by Magnetic resonance electrography (MRE),
shown stiffness mapping of the whole cross section of the patient.

Figure S22. Image-guided modulus test. a,b, Photographs of a free standing device (device 1)
injected into the non-tumor area of liver (a), and tumor (b). c,d, Photographs of a biopsy needle
device (device 2) injected into the non-tumor area of liver (c), and tumor (d).
a b
c d


![NATIONAL INSTITUTE OF TECHNOLOGY ROURKELAgroupemail.nitrkl.ac.in/Files/InvigilationDutyChartMidSemesterSpring2016-17).pdfINVIGILATION DUTY CHART [ MID SEMESTER : 2016-17 - SPRING ]](https://static.fdocuments.in/doc/165x107/5e2a0c40ee05647eac604816/national-institute-of-technology-pdf-invigilation-duty-chart-mid-semester-2016-17.jpg)


