siteresources.worldbank.orgsiteresources.worldbank.org/INTTHAILAND/Resources/cp4.pdf · TABLE 4 -2:...
22
THE WORLD BANK GROUP
Transcript of siteresources.worldbank.orgsiteresources.worldbank.org/INTTHAILAND/Resources/cp4.pdf · TABLE 4 -2:...

THE WORLD BANK GROUP

Quality
And
Relev
ance O
f High
er E
ducatio
n
Towards a Competitive Higher Education System in a Global Economy
As noted in Chapter 2, the higher education system has experienced significant
growth in the last decade. The total number of postsecondary institutions jumped from 5 in
1967 to 166 in 2008. Maintaining quality during a time of system-wide expansion, diversifica-
tion and financial uncertainty are important challenges.
In the past, educational quality and relevance were often viewed as synonymous:
high-quality education was relevant education. But this is no longer the case. Today it is
possible to have high-quality education that is irrelevant to a country’s priorities—irrelevant
education increases the chances of graduate unemployment and brain drain, and deprives a
nation of an important vehicle for its development.
What is the quality and relevance of Thai higher education? Public perception
has been mixed. Although Thailand is credited with a few centers of academic excellence,
on average higher education quality is described as substandard. In a recent news article,
Boonrak Boonyaketmala, a former dean at Thammasat University, expressed “The spread of
higher education isn’t solving the fundamental problem of quality. Many of our universities
are little more than vocational colleges. Degrees are often the equivalent of a school-leaving
certificate from a good European school” (Barnes, 2005).
This chapter explores various dimensions of higher education quality and relevance
in Thailand—including international comparisons, institutional productivity in terms of gradu-
ates and publications, staffing and performance, and labor market responses. It concludes
with a brief description of recent policy responses to establish quality assurance mechanisms
for monitoring institutional outputs and activities.
INTERNATIONAL COMPARISONS
Measuring the quality of the tertiary education is challenging because of the mul-
tiplicity of fields and degrees offered as well as the difference in the missions of different types
of higher education institutions. Unlike secondary education, which has comparable tests in
math and science that enable international comparisons, there are fewer analogous measures
in higher education. Two major international league tables—the Shanghai Jiao Tong University
(China) Academic Ranking of World Universities and the Time Higher Education Supplement

THE WORLD BANK GROUP
(THES) World University Rankings—rank research-intensive universities worldwide. The THES
asked institutions to rank universities according to the following categories: peer review
(reputation), international faculty, international students, student/faculty ratios and citations
per faculty member. “The five indicators have been chosen to reflect strength in teaching,
research and international reputation, with the greatest influence exerted by those in the best
position to judge: Academics” (THES, 5 November 2004, p. 2). Similarly, in the Shanghai Jiao
Tong University index universities are ranked by several indicators of academic or research
performance, including alumni and staff winning Nobel Prizes and Fields Medals, highly cited
researchers, articles published in Nature and Science, articles indexed in major citation indices,
and the per capita academic performance of an institution. This index attempts to minimize
subjectivity of reputation rankings by focusing on outputs. Naturally, there are a number of
methodological limitations inherent in any ranking exercise. However, international league
tables are useful as comparative data provide insights for understanding Thailand’s universi-
ties in the context of global higher education. The highest ranked universities in the world
are clearly those that make significant contributions through excellence in research, teaching
and producing highly skilled graduates. Ultimately, the international reputation that develops
from these achievements establishes these institutions as world class.
Table 4-1 lists rankings from selected universities in Asia-Pacific from these two
benchmarking surveys. The Shanghai Jiao Tong University index did not place any Thai univer-
sities in its top 500 list nor in its top 100 Asian universities list. In the THES top 200 university
ranking, Thailand had one university placed at 166 (Chulalongkorn University). As a reference
point, India had two universities at rankings 154 and 174. Malaysia, Indonesia, nor Philippines,
as comparator countries, did not have any universities listed.

Quality
And
Relev
ance O
f High
er E
ducatio
n
Towards a Competitive Higher Education System in a Global Economy
TABLE 4-1: TOP UNIVERSITY RANKINGS, ASIA-PACIFIC NATIONS
However, what Thailand requires may not necessarily be more “world-class universi-
ties,” especially if more fundamental higher education needs are not being met. World class
research universities demand huge financial commitments, a concentration of exceptional hu-
man capital, and governance policies that allow for teaching and research excellence. Instead,
an initial focus could be on developing national universities, perhaps similar to the land-grant
universities in the US during the 19th century or the polytechnic universities of Germany and
Canada. Such institutions would cater to the diverse training needs of the domestic student

BOX 4 -1: THE INDIAN INSTITUTES OF TECHNOLOGY
Soon after becoming independent, India placed science and technology high on its economic develop-
ment agenda. The first Indian Institute of Technology (IIT) was established in 1951 at Kharagpur, (West Bengal) with
support from UNESCO, based on the MIT model. The Second IIT was established at Bombay (now Mumbai) in 1958
with assistance from the Soviet Union through UNESCO. In 1959, IIT Madras (now Chennai) was established with
assistance from Germany; and IIT Kanpur with help from a consortium of US Universities. British industry and the UK
Government supported the establishment of IIT Delhi in 1961. In 1994, IIT Guwahati was established totally through
indigenous efforts.
In 2001, the University of Roorkee was brought under the IIT family as the seventh such institution. While
taking advantage of experience and best practices in industrial countries, India ensured that the “institutions
represented India’s urges and India’s future in making” (Prime Minister Nehru, 1956). The Indian Parliament designated
them as “Institutes of National Importance”—publicly funded institutions enjoying maximum academic and
managerial freedom—offering programs of high quality and relevance in engineering, technology, applied sciences
and management at undergraduate, masters, and doctorate level and offering their own degrees. Student admissions
are made strictly according to merit through a highly competitive common entrance test.
Today, the IITs attract the best students interested in a career in engineering and applied sciences. With
4,000 new students selected out of 250,000 applicants every year, the IITs are more selective than the top US Ivy
League schools. Several IIT alumni occupy the highest positions of responsibility in education, research, business
and innovation in several parts of the world. In 2005, The Times Higher Education Supplement ranked the IITs as
globally third best engineering school after MIT and the University of California, Berkeley.
The main strength of the IITs has been their sustained ability to attract the best students and turn them into
“creative engineers” or “engineer entrepreneurs.” Initially IITs were criticized for their contribution to the brain-drain
as about 40% of the graduates went abroad. Today, with the opening and fast growth of the Indian economy, this
“weakness” is turning into a big strength for international cooperation and investments. Much of the success of
Bangalore, for instance, is attributed to the phenomenon of reverse brain drain.
Source: Salmi, 2009.
THE WORLD BANK GROUP
population and economy. This effort could also be linked to private sector development. Box
4-1 illustrates the development of the Indian Institutes of Technology as one such example.
(Salmi 2009)
INSTITUTIONAL QUALITY MEASURES
GRADUATION RATES
In 2004, about a quarter million Thai students completed bachelor’s degrees, over
25,000 diplomas, approximately 40,000 masters’ degrees, and over 1,000 Ph.D. (Figure 4-1).
As noted in Chapter 3, the gross enrollment rate for higher education in Thailand is about
50 percent. According to the most recent data available, in the 2002-03 academic year the
share of tertiary graduates as a percentage of the population at the typical age of graduation
for Thailand was 27 percent. In accordance to enrollment patterns, there are wide disparities

Quality
And
Relev
ance O
f High
er E
ducatio
n
Towards a Competitive Higher Education System in a Global Economy
by gender. The male graduation rate was 20.8 percent compared to 33.5 percent for females.
The share of Thai youth that attain a college degree in Thailand is slightly below the OECD
country average—32 percent (UNESCO, 2005). But is this an adequate output of graduates
given existing capacity?
FIGURE 4-1: NUMBER OF GRADUATES BY DEGREE
Source: Commission on Higher Education, 2008
These estimates of university output are largely shaped by the significant share of
the population that do not enter a higher education program. They do not quite capture the
performance of the higher education system per se. A more useful measure for this purpose
is to assess graduation levels in relation to higher education enrollments. As noted in Table
3-1, in 1998, there were approximately 915,000 students enrolled in B.A programs. Six years
later, the number of students that attained a B.A degree or higher was 304 thousand. Thus, we
can estimate that the college completion rate in Thailand was approximately 33 percent on
average. In other words, only one third of students who enrolled in a college degree program
graduated within six years. The OECD graduation rate average is 70 percent (OECD, 2007a). It
is apparent that there is significant room for improvement in the efficiency of the Thai higher
education sector given that a significant proportion of the student body either drops out
before graduation or takes many more years than needed to fulfill degree requirements.
38,8
56
258,
215
12,3
06
29,6
02
25,7
13
735
256,
559
3,09
0 43,1
90
25,5
50
257,
650
5,49
9 40,0
181,
283
THE WORLD BANK GROUP
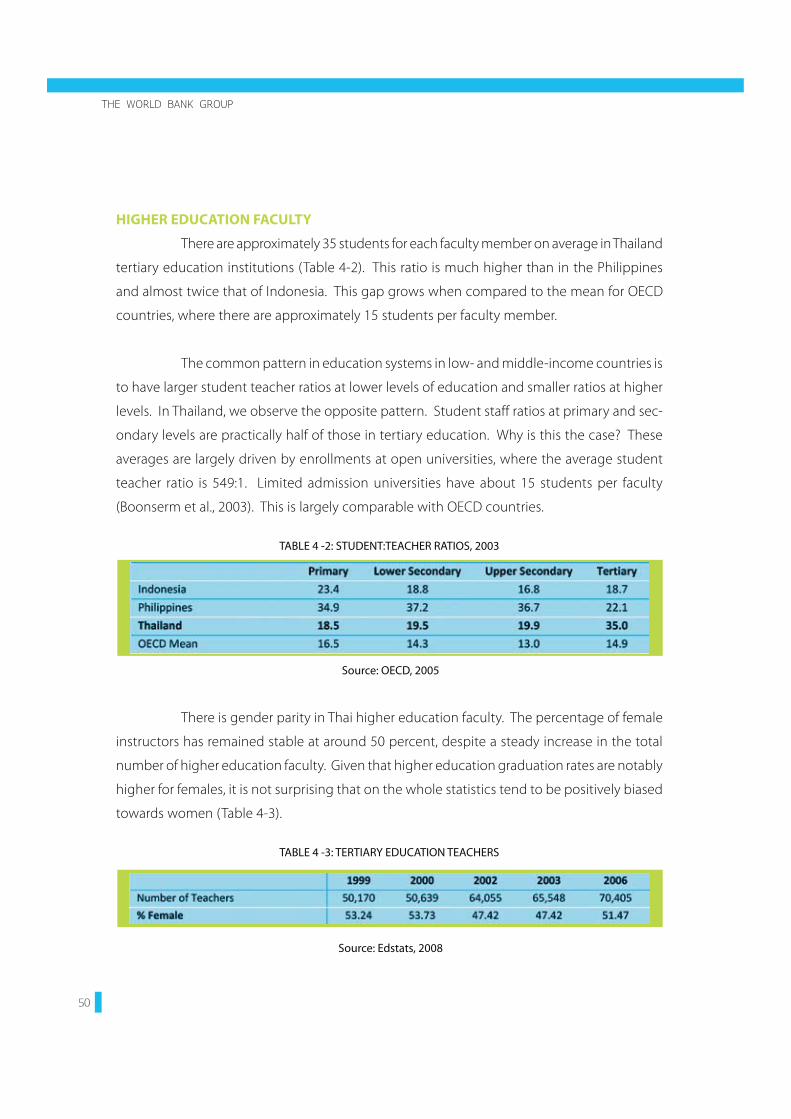
HIGHER EDUCATION FACULTY
There are approximately 35 students for each faculty member on average in Thailand
tertiary education institutions (Table 4-2). This ratio is much higher than in the Philippines
and almost twice that of Indonesia. This gap grows when compared to the mean for OECD
countries, where there are approximately 15 students per faculty member.
The common pattern in education systems in low- and middle-income countries is
to have larger student teacher ratios at lower levels of education and smaller ratios at higher
levels. In Thailand, we observe the opposite pattern. Student staff ratios at primary and sec-
ondary levels are practically half of those in tertiary education. Why is this the case? These
averages are largely driven by enrollments at open universities, where the average student
teacher ratio is 549:1. Limited admission universities have about 15 students per faculty
(Boonserm et al., 2003). This is largely comparable with OECD countries.
TABLE 4 -2: STUDENT:TEACHER RATIOS, 2003
Source: OECD, 2005
There is gender parity in Thai higher education faculty. The percentage of female
instructors has remained stable at around 50 percent, despite a steady increase in the total
number of higher education faculty. Given that higher education graduation rates are notably
higher for females, it is not surprising that on the whole statistics tend to be positively biased
towards women (Table 4-3).
TABLE 4 -3: TERTIARY EDUCATION TEACHERS
Source: Edstats, 2008

Quality
And
Relev
ance O
f High
er E
ducatio
n
Towards a Competitive Higher Education System in a Global Economy
The majority of tertiary faculty in both public and private higher education institu-
tions in Thailand hold graduate degrees, with about 80 percentage of academic staff holding
Master degrees or higher. Public institutions have higher shares of teachers with doctoral
degrees than private institutions, possibly as a result of grants and scholarship schemes that
Government offers for staff development.
FIGURE 4-2: ACADEMIC STAFF IN PUBLIC AND PRIVATE INSTITUTIONS BY EDUCATIONAL LEVEL
Source: Commission on Higher Education, 2008
According to CHE administrative data, only 1.4 percent of academic staff in public
higher education institutions held a full professor position in 2005. The distribution of faculty
assignments included 20 percent of associate professors, 36 percent of assistant professors
and 43 percent of lecturers. The relatively high proportion of lecturers and the small share of
full professors indicate that most institutions focus on student teaching rather than research.
The very low percentage of faculty at the rank of full professor may be subject of concern
because usually star academics bring prestige to institutions by attracting high quality stu-
dents and increased external resources, often producing relevant research and publications
which appear in international peer-reviewed journals. Such contributions raise the visibility
and status of the institution, which in turn raises the status of the system as a whole.
With regards to faculty scholarly output, Thailand has demonstrated substantial
progress with regards to number of publications in peer-reviewed journals. According to the

THE WORLD BANK GROUP
Science Citation Index (SCI), which tracks publications in science journals, Thailand increased
its publication significance from less than 500 articles in the mid-1970s to over 3,000 articles
per year by 2004 (Figure 4 -3). This trend picked up strength beginning in the mid-1990s. In
recent years, there has been a slight shift in the domains of publication, with a slowing trend in
the medical sciences and an increasing emphasis on the engineering sciences (Table 4-4).
FIGURE 4 -3: THAI PUBLICATIONS IN THE SCIENCE CITATION INDEX (SCI), 1974–2005
Source: Schiller, 2006
TABLE 4-4: THAI PUBLICATIONS BY SCIENTIFIC FIELD, 1995–2004
Source: Schiller, 2006
On the other hand, as a share of publications worldwide, Thailand’s faculty overall
contributions are small, well below 1 percent in all academic fields (Table 4-5). In comparison
to other Asian nations, for the period 2000-05, Thailand’s average scholarly output per year was
less than half of Singapore’s production, but close to double that of Malaysia. The number of
publications by faculty in China, Korea, and Taiwan was significantly larger.

Quality
And
Relev
ance O
f High
er E
ducatio
n
Towards a Competitive Higher Education System in a Global Economy
TABLE 4-5: YEARLY AVERAGE NUMBER OF PUBLICATIONS (SELECTED NATIONS, 1980–2005)
Source: Schiller, 2006
The relevance of scholarly research may be assessed by the frequency this work
gets cited in other scholarly publications. In this realm, Thailand scores relatively well in all
areas of academic pursuit. In most fields of research, Thailand’s “impact index” tends to be for
the most part—perhaps with the exception of the life sciences—just below the world aver-
age (Table 4-6), suggesting that the relatively small number of faculty working on research
are quite productive and are contributing meaningfully to global knowledge.
TABLE 4-6: THAI PUBLICATIONS’ IMPACT BY SCIENTIFIC FIELD
Source: Schiller, 2006
QUALITY OF TEACHING AND LEARNING
Traditional educational systems, in which the teacher is the main “source” of knowl-
edge, are ill-suited to equip people to work and live in a knowledge economy. Some of the
competencies such a society demands—teamwork, problem solving, motivation for lifelong
learning—cannot be acquired in a setting in which teachers convey facts to students whose

THE WORLD BANK GROUP
main task is to learn them in order to be able to repeat them. A lifelong learning system must
be competency driven. Within traditional institutional settings, countries must develop new
curricula and new teaching methods to adapt. Anecdotal data from Thailand indicates that
teaching and learning approaches in higher education institutions rely primarily on faculty-cen-
tered approaches, with limited opportunities for student independent work, problem solving
or group projects. Providing people with the tools they need to function in the knowledge
economy requires adoption of a new pedagogical model. This model differs from traditional
academic approaches in distinct ways, as illustrated in Table 4-7.
TABLE 4-7: CHARACTERISTICS OF TRADITIONAL AND LIFELONG LEARNING MODELS
Source: World Bank, 2003
While teaching models are often context-specific, a set of aspects of effective learn-
ing environments and principles have emerged from various findings that address the skills
demands of a knowledge economy. Further empirical evidence needs to provided, but those
aspects seem to map the demands of the knowledge economy, and there is a general trend
of OECD countries moving into integrating those aspects in their education practices. They
can be subsumed under the learner-centered education paradigm that differs from traditional
learning settings in that it is customized, knowledge rich, networked, and assessment-driven
(Box 4 -2). The growing predominance of interactive teaching methods and active learning,
case-based training, simulations, and team project – in short, a problem-oriented curriculum
– reflects the need to build cognitive-based and creative capital.

BOX 4 -2: TRENDS OF EFFECTIVE LEARNING ASPECTS AND ENVIRONMENTS FOR THE KNOWLEDGE ECONOMY
Learner-centered teaching The learner-centered education paradigm is based on the cognitive theories of learners’ active
involvement in reflection, interpretation and self-evaluation. Knowledge and skills are acquired through
exploration, drawing from the real world and applying learning in practice. Learning is social; it occurs
in interaction, together with others, debating and creatively changing social practices. Learner-centered
education supports deep learning and creativity. A learner-centered environment recognizes that learners acquire
new knowledge and skills best if the knowledge and skills are connected to what they already know. Teachers
need to know what learners already know and understand before introducing new material. Learner-centered
learning allows new knowledge to become available for use in new situations—that is, it allows knowledge
transfer and adaptation for a specific context to take place. Aspects include:
1) Customized Learning: Credit hours and time in the classroom may not necessarily be coupled in
learner-centered education. Although students with background knowledge and experiences in a content area
may quickly master the course material and required skills, others may need more time and additional help.
Consequently, students in learner-centered environments will often complete courses at different rates.
2) Knowledge-rich learning, learning by doing and learning by using: Learners ability to transfer what
they learn to new contexts requires both a grasp of themes and overarching concepts in addition to factual
knowledge as well as their application processes. Knowledge-rich learning thus favors teaching fewer subject
areas in depth rather than covering more subjects in less depth. In order to absorb the knowledge and apply
it, “learning by doing,” and “learning by using” approaches are important ways of using the knowledge and
concepts being taught. This kind of learning provides learners with a variety of strategies and tools for
retrieving and applying or transferring knowledge to new situations.
3) Inter-connected, net-and team-worked: In a knowledge economy, it becomes paramount to collaborate
with other parties and tap into the global stock of knowledge. Also, it is important that learners be able to learn
from one another. Giving learners the opportunity to work on joint projects is important for both children and
adults. Indeed research has shown that collaborating student groups can accelerate learning. It is furthermore
important to link activities inside the classroom with what is happening outside the classroom. Working on
real-life problems or issues that are relevant to participants increases interest and motivation and promotes
knowledge transfer. Moreover, important sources of information and knowledge exist outside the classroom
that learners need to understand and access.
4) Assessment-driven: Assessment-driven learning is based on defining clear standards, identifying the
point from which learners start, determining the progress they are making toward meeting standards, and
recognizing whether they have reached them. Assessment-driven learning helps the educational system define
the instructional action plan, which needs to reflect the different places from which learners start. Education
scientists currently experiment with how this approach can be reconciled with the accountability that schools
still have to adhere to. However, there is consensus that giving learners—even very young learners—a role in
the process of tracking their learning achievements and, especially, engaging them in discussion of the outcomes
of these assessments are powerful motivators and tools for improved and independent learning.
Source: World Bank, 2009
Quality
And
Relev
ance O
f High
er E
ducatio
n
Towards a Competitive Higher Education System in a Global Economy

THE WORLD BANK GROUP
QUALITY ASSURANCE PRACTICES
Significant steps have been taken to create a unified quality assurance framework
that will review performance of Thailand education institutions. Since the 1999 NEA was
promulgated, the quality of education system is officially evaluated both internally and ex-
ternally. Internally, higher education institutions are expected to conduct self assessments.
All institutions are required to implement an internal quality assurance system comprised of
control, audit and assessment. Institutions are expected to prepare annual reports which are
then submitted to CHE and made available to the public.
External assessments are meant to complement the internal institutional assess-
ment. The NEA established the Office for National Education Standards and Quality Assessment
(ONESQA) as the agency responsible for overseeing quality reviews of all higher education
institutions at least once every five years. The results of the assessments are shared with
relevant agencies and also made available to the public.
The NEA authorizes ONESQA to submit corrective measures and actions for schools
that are performing poorly in order to improve their functions. If an institution continues to
perform poorly, a report is submitted to CHE for further action. Anecdotal data suggests that
the current performance of ONESQA should be strengthened in order to translate monitoring
and evaluation into tangible improvements in higher education quality.
The first review cycle took place between 2000-05. Higher education institutions
were encouraged to present data from their internal evaluation process, including perfor-
mance indicators and statistical data collected from institutional review reports. All stake-
holders—faculty, students, parents and administrators—were encouraged to participate in
the review process. For the second review cycle, now ongoing from 2006 to 2010, a typology
with seven dimensions was created to systematize the evaluation process: (a) quality of gradu-
ates, (b) research and innovation, (c) academic services, (d) arts and culture preservation, (e)
organization and human resource development, (f ) curriculum and institutional aspects, and
(g) quality assurance system.

Quality
And
Relev
ance O
f High
er E
ducatio
n
Towards a Competitive Higher Education System in a Global Economy
As ONESQA looks inward to improve itself and to raise itself to a level comparable
to the most sophisticated accreditation systems in the world, it will have to consider how to
reincarnate itself so that its activities: (a) continue to be guided by evolving high standards;
(b) are forward looking and allow for innovative practice; and (c) address a number of the
shortcomings that characterize the present system. A robust accreditation process would
necessarily:
• be understandable by and acceptable to all stakeholders
• be fair, transparent, and objective
• involve credible members
• take into account the requirements of training and education, private and public
systems
• incorporate feedback loops for continuous improvement and fine tuning
• be simple, manageable, and adaptable as well as efficient and effective
• have built-in mechanisms for ongoing monitoring of its own efficiency and
effectiveness
In order for the practices of the Thai Quality Assurance system to be in line with
the most advanced international quality assurance systems, it would need to:
• Involve credible peer reviewers including international experts in the external review
process of programs. Ensure that individuals involved in the peer review process receive
sufficient training for the task at hand.
• Make all quality assurance reports of institutions high quality and publicly available.
• Ensure that the system is fair and efficient, functions without delays, is devoid of
unnecessary bureaucracy, does not intrude in the primary activities of universities and
does not stymie innovation.
• Assume a more constructive and formative role and ensure that recommendations made
by the ONESQA following program reviews are meaningful and possible to
implement.
• Build in a system for the review of ONESQA itself, using external and international
experts.
THE WORLD BANK GROUP
EMPLOYMENT AND THE LABOR MARKET
Another way to evaluate the relevance of the skills and knowledge provided in
higher education institutions is through the lens of job opportunities for their graduates.
This section presents a series of statistics on the Thai labor market that help illustrate whether
graduates are able to get jobs in their areas of training and whether employers are satisfied
with the quality of the graduates. It is essential to keep in mind that education is a necessary
but not sufficient condition for individuals to enjoy good labor market outcomes, regardless
of sector. Besides education, other factors including good labor market opportunities for the
skilled require an economy as a whole to be operating well with macroeconomic stability,
an attractive investment climate, and efficient labor markets, are all critical. It is of critical
importance to adopt a holistic approach to analyzing education-labor market relationships.
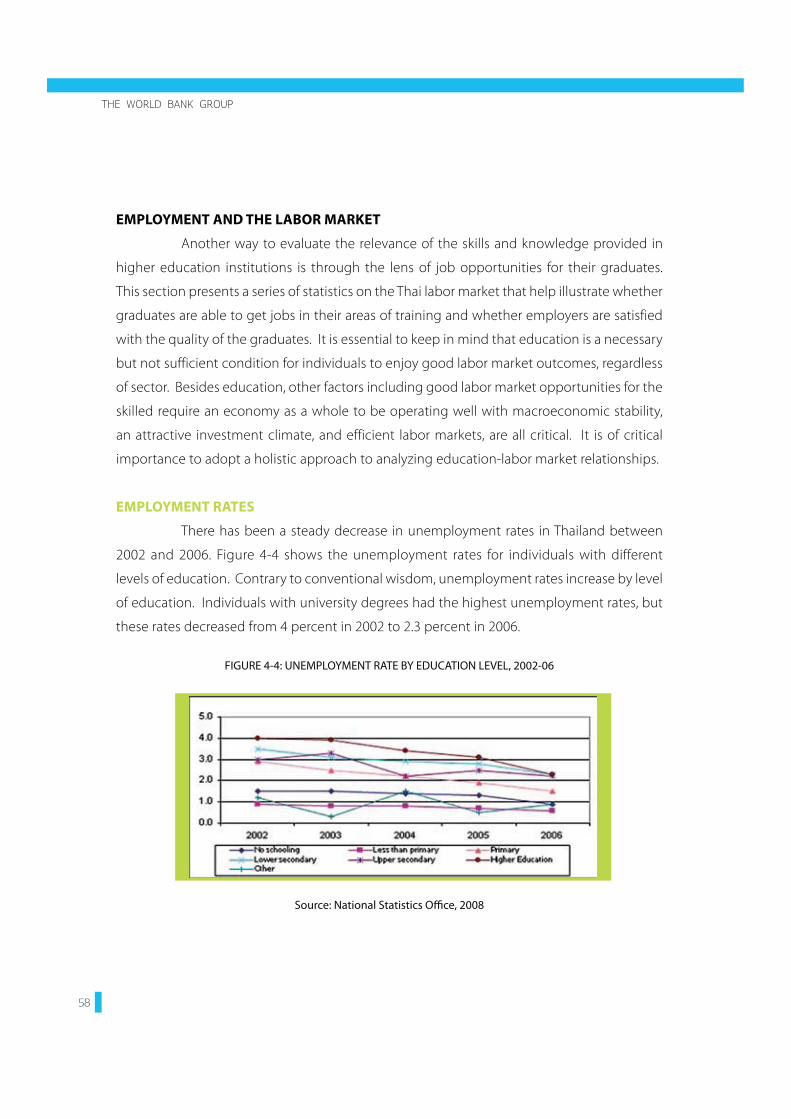
EMPLOYMENT RATES
There has been a steady decrease in unemployment rates in Thailand between
2002 and 2006. Figure 4-4 shows the unemployment rates for individuals with different
levels of education. Contrary to conventional wisdom, unemployment rates increase by level
of education. Individuals with university degrees had the highest unemployment rates, but
these rates decreased from 4 percent in 2002 to 2.3 percent in 2006.
FIGURE 4-4: UNEMPLOYMENT RATE BY EDUCATION LEVEL, 2002-06
Source: National Statistics Office, 2008

Quality
And
Relev
ance O
f High
er E
ducatio
n
Towards a Competitive Higher Education System in a Global Economy
Unemployment rates of university graduates differ by degree attained. Only 2.6
percent of Ph.D graduates were unemployed in 2000, compared to 30.9 percent of Associate
Degree graduates (Table 4-8). The unemployment rate also varies by field of study. A survey
report on job searching status of B.A graduates conducted by CHE suggests that students in
health and welfare programs had the smallest unemployment rates (7 percent), while science
graduates had the highest unemployment rates (40 percent) (Table 4-9). High unemployment
rates of science graduates suggest that either there are limited job opportunities in this field
and/or graduates have not developed the skills needed by the local economy in these aca-
demic programs. High unemployment rates have negative consequences not only for recent
graduates, but they can also discourage students from attending science programs and might
lead to scarcity of scientists in the future.
TABLE 4-8: GRADUATES BY WORKING STATUS AND DEGREE TYPE, 2000
Source: National Statistics Office, 2008
TABLE 4-9: EMPLOYMENT STATUS OF B.A GRADUATES BY FIELD OF STUDY, 2002-03
Source: Commission on Higher Education, Summary Report on Job Searching Status of Graduates in 2002-03
Comparisons with other East Asian countries corroborate a rising trend in unem-
ployment rates for higher education graduates between 1996 and 2005 (Figure 4-5). With

THE WORLD BANK GROUP
the exception of Indonesia, all other countries surveyed present increasing skilled-labor un-
employment rates. Thailand’s unemployment rates for higher education graduates increased
from over 10 percent to almost 30 percent during this period. After the 1997 financial crisis,
however, unemployment rates of high school graduates actually decreased. The main reason
for this phenomenon is that the financial crisis put pressure on firms to cut wage costs through
hiring younger workers, contract workers, and temporary workers. This reduced the need for
more costly, high-skilled workers. The rising trend in unemployment of college graduates in
the region may also be explained by an excess of supply of graduates with inadequate skills
as well as weak industry development.
FIGURE 4-5: UNEMPLOYED HIGHER EDUCATION GRADUATES AS SHARE OF TOTAL UNEMPLOYED
Source: International Labor Organization, 2007
How long does it take for higher education graduates to find gainful employment
in Thailand? Figure 4-6 and Figure 4-7 present the time that employed and unemployed
graduates require to find a new job. Generally, employed workers with higher education de-
grees spend less time searching for jobs than workers with less education. About 20 percent
of B.A degree holders are hired immediately after graduation and this proportion doubles to
approximate 40 percent for workers with graduate degrees. About 60 percent of employed
workers with graduate diplomas or Master degrees find jobs within 4 months after gradua-
tion. Graduates with an A.A or a B.A need more time to find a job than graduates with a Por

Quality
And
Relev
ance O
f High
er E
ducatio
n
Towards a Competitive Higher Education System in a Global Economy
Wor Sor vocational, two-year degree. In contrast, more than 60 percent of Ph.D graduates
need between six months and a year to find a new job. This might be the result that these are
highly coveted and competitive (as well as somewhat specialized) posts. Doctoral graduates
may also be more willing to wait for the “right” job or posts with higher compensation.
FIGURE 4-6: LENGTH OF TIME EMPLOYED GRADUATES LOOK FOR NEW JOBS
Source: National Statistics Office, 2008
FIGURE 4-7: LENGTH OF TIME UNEMPLOYED GRADUATES LOOK FOR JOBS
Source: National Statistics Office, 2008

THE WORLD BANK GROUP
Joblessness upon graduation, however, afflicts graduates across the spectrum
of degree earners and deserves a closer examination in terms of the relevance of academic
degrees on the part of potential employers. According to a survey of new job seekers that
recently graduated from a B.A program conducted by the National Statistics Office, the main
problem perceived by individuals was weak practical experience and qualifications (Figure
4-8). The second problem most often noted was slow economic conditions and a decreas-
ing number of job openings. Other problems included lack of information about potential
jobs and how to get one, an inability to find a satisfactory job, the need for a guarantor, and
passing required skills testing. It is clear that some of these problems are grounded in percep-
tions and may not be root challenges actually, while others could be minimized by improving
academic preparation, career counseling, employer outreach and internship opportunities in
higher education.
FIGURE 4-8: PROBLEMS IN JOB SEARCHING
Source: National Statistics Office, 2008
WAGES
Another way to estimate the benefits of pursuing higher education in Thailand is
to compare the wages of individuals in different sectors of the economy. As already noted
in Chapter 1, the labor market rewards quite substantially additional years of education. The
initial average salary for a new employee with Por Wor Sor degree was 6,464 Baht per month,
compared to 10,210 Baht for a B.A degree holder, and 16,488 Baht for a M.A degree holder.
The initial monthly allowance follows the same pattern, ranging from 955 Baht for Por Wor Sor

Quality
And
Relev
ance O
f High
er E
ducatio
n
Towards a Competitive Higher Education System in a Global Economy
graduates to 2,099 Baht for M.A. degree holders. Combined together, the difference in initial
income between Por Wor Sor graduates and M.A. degree graduates in the private sector is
around 11,000 Baht per month.
On average, wage differentials by educational level become greater over time. Earn-
ings increase with age, reflecting that the labor market compensates workers for additional
years of experience. This is the case for all workers, regardless of level and field of education.
But higher skilled workers receive a premium for additional work experience than workers with
lower educational levels (Figure 1-2). Figure 4-9 presents age-earnings profiles of workers by
educational level and field of study. As expected, earnings of workers with university degrees
are higher than those of secondary school diploma recipients in the same field. Holders of
academic university degrees experience the highest returns, despite some fluctuations, and
they are the highest earners for all age groups. The demographic group with more steady
increases and lower fluctuations are university degree working as teachers. For diploma hold-
ers, technical degrees earn higher wages than academic or teacher related fields.
FIGURE 4-9: AGE-EARNINGS PROFILE BY EDUCATION LEVEL AND FIELD OF STUDY
Source: Labor Force Survey, 2005

THE WORLD BANK GROUP
LABOR MARKET RELEVANCE OF HIGHER EDUCATION SKILLS
According to a survey of firms in Thailand and Malaysia, the main reason for job
vacancies is related to the inability to identify applicants with appropriate basic and technical
skills. More than 80 percent of companies in Thailand and 70 percent in Malaysia identified
insufficient basic and technical skills as the major causes for open jobs. On the other hand,
less than 20 percent of firms in both countries points to a lack of applicants as a major factor
for vacancies. This finding indicates an imbalance between the quantity and the quality of
higher education graduates. As already discussed in Chapter 1, this situation is particularly
acute in Thailand where employers are willing to pay a significant premium for high-skilled
workers.
FIGURE 4-10: MAIN CAUSES OF JOB VACANCIES (THAILAND AND MALAYSIA)
Source: World Bank, 2006b
Overall, a mixed picture emerges from the demand and supply sides of the
economy. The quality of tertiary education is difficult to measure, but different academics
and stakeholders have criticized the quality of education of Thai university graduates. No
universal definition of quality in tertiary education or agreement on general principles of
good practice is available, given the heterogeneity of institutions, programs, and degrees
at the tertiary level. Concerns have been raised over the unsatisfactory quality of the young

Quality
And
Relev
ance O
f High
er E
ducatio
n
Towards a Competitive Higher Education System in a Global Economy
generation’s educational background and their lack of comprehensive knowledge and skills.
Universities offer narrowly-specified fields of study, equipping youth with single tasking skills
and making them unable to adapt or relate their knowledge to broader contexts.
At the same time, research on university mapping indicates that Thailand has an
oversupply of social science graduates while lacking graduates in the fields of science, techno-
logy and health sciences (Suwan et al., 2001). As a result, those in oversupplied fields have had
more difficulty finding jobs and oftentimes end up working in jobs unrelated to their areas of
study. The labor market is willing to award a significant premium to those who exhibit mas-
tery of skills that are in short supply. These findings suggest a significant mismatch between
training provided in higher education institutions and skills needed in the labor market.
However, there are also some signs of hope and progress. The University Busi-
ness Incubator Project is a collaboration between universities and industry to generate new
products and innovations. The goal is to train graduate students and to provide them with
entrepreneurial skills, as well as the funds necessary to start new businesses. Between 2004 and
2006 there were 15 incubator units set up in universities, resulting in about 75 joint ventures,
with 1,000 students and recent graduates participating. The government should continue
to provide the enabling conditions necessary to encourage this project and others like it. In
a climate of greater competition for students, and fewer subsidies from Government, higher
education institutions need to find creative ways of enhancing their academic relevance while
also generating additional revenue.