QUESTIONSs3.amazonaws.com/caclubindia/cdn/forum/files/16_suggested_answer… · SUGGESTED ANSWERS...
231
SUGGESTED ANSWERS TO QUESTIONS SET AT THE PROFESSIONAL EDUCATION (EXAMINATION – II) MAY, 1996 – NOVEMBER, 2008 A COMPILATION PAPER – 4B : FINANCIAL MANAGEMENT BOARD OF STUDIES THE INSTITUTE OF CHARTERED ACCOUNTANTS OF INDIA
-
Upload
duongnguyet -
Category
Documents
-
view
221 -
download
0
Transcript of QUESTIONSs3.amazonaws.com/caclubindia/cdn/forum/files/16_suggested_answer… · SUGGESTED ANSWERS...

SUGGESTED ANSWERS TO
QUESTIONS
SET AT THE
PROFESSIONAL EDUCATION
(EXAMINATION – II)
MAY, 1996 – NOVEMBER, 2008
A COMPILATION
PAPER – 4B : FINANCIAL MANAGEMENT
BOARD OF STUDIES
THE INSTITUTE OF CHARTERED ACCOUNTANTS OF INDIA

CONTENTS
Page Nos.
CHAPTER − 1
Financial Management: An Overview 1.1 – 1.6
CHAPTER − 2 Working Capital Management 2.1 – 2.54
CHAPTER − 3 Tools of Financial Analysis & Planning
3.1 – 3.54
CHAPTER − 4 Capital Budgeting 4.1 – 4.43
CHAPTER − 5 Leverage 5.1 – 5.16
CHAPTER − 6 Capital Structure and Cost of Capital 6.1 – 6.37
CHAPTER − 7 Sources of Finance 7.1 – 7.8
1 FINANCIAL MANAGEMENT : AN OVERVIEW
Question 1
Outline the methods and tools of Financial Management. (Final-Nov. 1996) (6 marks)
Answer
Finance Manager has to decide optimum capital structure to maximise the wealth of the shareholders. For this judicious use of financial leverage or trading on equity is important to increase the return to shareholders. In planning the capital structure, the aim is to have proper mix of debt, equity and retained earnings. EPS Analysis, PE Ratios and mathematical models are used to determine the proper debt-equity mix to derive advantages to the owners and enterprise.
In the area of investment decisions, pay back method, average rate of returns, internal rate of return, net present value, profitability index are some of the methods in evaluating capital expenditure proposals.
In the area of working capital management, certain techniques are adopted such as ABC Analysis, Economic order quantities, Cash management models, etc., to improve liquidity and to maintain adequate circulating capital.
For evaluation of firm’s performance, Ratio analysis is pressed into service-with the help of ratios an investor can decide whether to invest in a firm or not. Funds flow statement, cash flow statement and projected financial statements help a lot to the finance manager in providing funds in right quantities and at right time.
Question 2
Explain as to how the wealth maximisation objective is superior to the profit maximisation objective. (Final-Nov. 1999)(PE-II-May 2003 & Nov. 2003) (3 marks)
Answer
A firm’s financial management may often have the following as their objectives:
(i) The maximisation of firm’s profit.
(ii) The maximisation of firm’s value / wealth.
The maximisation of profit is often considered as an implied objective of a firm. To achieve the aforesaid objective various type of financing decisions may be taken. Options resulting into
maximisation of profit may be selected by the firm’s decision makers. They even sometime may adopt policies yielding exorbitant profits in short run which may prove to be unhealthy for the growth, survival and overall interests of the firm. The profit of the firm in this case is measured in terms of its total accounting profit available to its shareholders.
The value/wealth of a firm is defined as the market price of the firm’s stock. The market price of a firm’s stock represents the focal judgment of all market participants as to what the value of the particular firm is. It takes into account present and prospective future earnings per share,the timing and risk of these earnings, the dividend policy of the firm and many other factors that bear upon the market price of the stock.
The value maximisation objective of a firm is superior to its profit maximisation objective due to following reasons.
1. The value maximisation objective of a firm considers all future cash flows, dividends, earning per share, risk of a decision etc. whereas profit maximisation objective does not consider the effect of EPS, dividend paid or any other returns to shareholders or the wealth of the shareholder.
2. A firm that wishes to maximise the shareholders wealth may pay regular dividends whereas a firm with the objective of profit maximisation may refrain from dividend payment to its shareholders.
3. Shareholders would prefer an increase in the firm’s wealth against its generation of increasing flow of profits.
4. The market price of a share reflects the shareholders expected return, considering the long-term prospects of the firm, reflects the differences in timings of the returns, considers risk and recognizes the importance of distribution of returns.
The maximisation of a firm’s value as reflected in the market price of a share is viewed as a proper goal of a firm. The profit maximisation can be considered as a part of the wealth maximisation strategy.
Question 3
Discuss the conflicts in Profit versus Wealth maximization principle of the firm.
(PE-II-Nov. 2007) (4 marks)
Answer
Conflict in Profit versus Wealth Maximization Principle of the Firm
The company may pursue profit maximisation goal but that may not result into creation of shareholder value. The profits will be maximized if company grows through diversification and expansion. But all growth may not be profitable. Only that growth is profitable where
ROA > WACC or ROE > K E or Firms invest in positive NPV profits. However, profit maximisation cannot be the sole objective of a company. It is at best a limited objective. If profit is given undue importance, a number of problems can arise like the term profit is vague, profit maximisation has to be attempted with a realisation of risks involved, it does not take into account the time pattern of returns and as an objective it is too narrow. Whereas, on the other hand, wealth maximisation, as an objective, means that the company is using its resources in a good manner. If the share value is to stay high, the company has to reduce its costs and use the resources properly. If the company follows the goal of wealth maximisation, it means that the company will promote only those policies that will lead to an efficient allocation of resources.
Question 4
“The information age has given a fresh perspective on the role of finance management and finance managers. With the shift in paradigm it is imperative that the role of Chief Financial Officer (CFO) changes from a controller to a facilitator.” Can you describe the emergent role which is described by the speaker/author? (Final-Nov.2000) (6 marks)
Answer
The information age has given a fresh perspective on the role financial management and finance managers. With the shift in paradigm it is imperative that the role of Chief Finance Officer (CFO) changes from a controller to a facilitator. In the emergent role Chief Finance Officer acts as a catalyst to facilitate changes in an environment where the organisation succeeds through self managed teams. The Chief Finance Officer must transform himself to a front-end organiser and leader who spends more time in networking, analysing the external environment, making strategic decisions, managing and protecting cash flows. In due course, the role of Chief Finance Officer will shift from an operational to a strategic level. Of course on an operational level the Chief Finance Officer cannot be excused from his backend duties. The knowledge requirements for the evolution of a Chief Finance Officer will extend from being aware about capital productivity and cost of capital to human resources initiatives and competitive environment analysis. He has to develop general management skills for a wider focus encompassing all aspects of business that depend on or dictate finance.
Question 5
Discuss the functions of a Chief Financial Officer. (PE-II-May 2004) (3 marks)
Answer
Functions of a Chief Financial Officer

The twin aspects viz procurement and effective utilization of funds are the crucial tasks, which the CFO faces. The Chief Finance Officer is required to look into financial implications of any decision in the firm. Thus all decisions involving management of funds comes under the purview of finance manager. These are namely
− Estimating requirement of funds
− Decision regarding capital structure
− Investment decisions
− Dividend decision
− Cash management
− Evaluating financial performance
− Financial negotiation
− Keeping touch with stock exchange quotations & behaviour of share prices.
Question 6
Explain two basic functions of Financial Management. (PE-II-Nov. 2002) (4 marks)
Answer
Two basic functions of Financial Management
Financial Management deals with the procurement of funds and their effective utilization in the business. The first basic function of financial management is procurement of funds and the other is their effective utilization.
(i) Procurement of funds: Funds can be procured from different sources, their procurement is a complex problem for business concerns. Funds procured from different sources have different characteristics in terms of risk, cost and control.
(1) The funds raised by issuing equity share poses no risk to the company. The funds raised are quite expensive. The issue of new shares may dilute the control of existing shareholders.
(2) Debenture is relatively cheaper source of funds, but involves high risk as they are to be repaid in accordance with the terms of agreement. Also interest payment has to be made under any circumstances. Thus there are risk, cost and control considerations, which must be taken into account before raising funds.
(3) Funds can also be procured from banks and financial institutions subject to certain restrictions.
(4) Instruments like commercial paper, deep discount bonds, etc also enable to raise funds. (5) Foreign direct investment (FDI) and Foreign Institutional Investors (FII) are two major routes
for raising funds from international sources, besides ADR’s and GDR’s.

(ii) Effective utilisation of funds: Since all the funds are procured at a certain cost, therefore it is necessary for the finance manager to take appropriate and timely actions so that the funds do not remain idle. If these funds are not utilised in the manner so that they generate an income higher than the cost of procuring them then there is no point in running the business.
Question 7
Write short notes on the following:
(a) Functions of Finance Manager. (Final-May 1998) (5 marks)
(b) Inter relationship between investment, financing and dividend decisions.
(Final-Nov. 1999) (5 marks)
(c) Finance function (PE-II-May 2008) (2 marks)
Answer
(a) Functions of Finance Manager
The Finance Manager’s main objective is to manage funds in such a way so as to ensure their optimum utilisation and their procurement in a manner that the risk, cost and control considerations are properly balanced in a given situation. To achieve these objectives the Finance Manager performs the following functions:
(i) Estimating the requirement of Funds: Both for long-term purposes i.e. investment in fixed assets and for short-term i.e. for working capital. Forecasting the requirements of funds involves the use of techniques of budgetary control and long-range planning.
(ii) Decision regarding Capital Structure: Once the requirement of funds has been estimated, a decision regarding various sources from which these funds would be raised has to be taken. A proper balance has to be made between the loan funds and own funds. He has to ensure that he raises sufficient long term funds to finance fixed assets and other long term investments and to provide for the needs of working capital.
(iii) Investment Decision: The investment of funds, in a project has to be made after careful assessment of various projects through capital budgeting. Assets management policies are to be laid down regarding various items of current assets. For e.g. receivable in coordination with sales manager, inventory in coordination with production manager.
(iv) Dividend decision: The finance manager is concerned with the decision as to how much to retain and what portion to pay as dividend depending on the company’s policy. Trend of earnings, trend of share market prices, requirement of funds for future growth, cash flow situation etc., are to be considered.

(v) Evaluating financial performance: A finance manager has to constantly review the financial performance of the various units of organisation generally in terms of ROI Such a review helps the management in seeing how the funds have been utilised in various divisions and what can be done to improve it.
(vi) Financial negotiation: The finance manager plays a very important role in carrying out negotiations with the financial institutions, banks and public depositors for raising of funds on favourable terms.
(vii) Cash management: The finance manager lays down the cash management and cash disbursement policies with a view to supply adequate funds to all units of organisation and to ensure that there is no excessive cash.
(viii) Keeping touch with stock exchange: Finance manager is required to analyse major trends in stock market and their impact on the price of the company share.
(b) Inter-relationship between Investment, Financing and Dividend Decisions
The finance functions are divided into three major decisions, viz., investment, financing and dividend decisions. It is correct to say that these decisions are inter-related because the underlying objective of these three decisions is the same, i.e. maximisation of shareholders’ wealth. Since investment, financing and dividend decisions are all interrelated, one has to consider the joint impact of these decisions on the market price of the company’s shares and these decisions should also be solved jointly. The decision to invest in a new project needs the finance for the investment. The financing decision, in turn, is influenced by and influences dividend decision because retained earnings used in internal financing deprive shareholders of their dividends. An efficient financial management can ensure optimal joint decisions. This is possible by evaluating each decision in relation to its effect on the shareholders’ wealth.
The above three decisions are briefly examined below in the light of their inter-relationship and to see how they can help in maximising the shareholders’ wealth i.e. market price of the company’s shares.
Investment decision: The investment of long term funds is made after a careful assessment of the various projects through capital budgeting and uncertainty analysis. However, only that investment proposal is to be accepted which is expected to yield at least so much return as is adequate to meet its cost of financing. This have an influence on the profitability of the company and ultimately on its wealth.
Financing decision: Funds can be raised from various sources. Each source of funds involves different issues. The finance manager has to maintain a proper balance between long-term and short-term funds. With the total volume of long-term funds, he has to ensure a proper mix of loan funds and owner’s funds. The optimum financing mix will increase return to equity shareholders and thus maximise their wealth.
Dividend decision: The finance manager is also concerned with the decision to pay or declare dividend. He assists the top management in deciding as to what portion of the

profit should be paid to the shareholders by way of dividends and what portion should be retained in the business. An optimal dividend pay-out ratio maximises shareholders’ wealth.
The above discussion makes it clear that investment, financing and dividend decisions are interrelated and are to be taken jointly keeping in view their joint effect on the shareholders’ wealth.
(c) Finance Function
The finance function is most important for all business enterprises. It remains a focus of all activities. It starts with the setting up of an enterprise. It is concerned with raising of funds, deciding the cheapest source of finance, utilization of funds raised, making provision for refund when money is not required in the business, deciding the most profitable investment, managing the funds raised and paying returns to the providers of funds in proportion to the risks undertaken by them. Therefore, it aims at acquiring sufficient funds, utilizing them properly, increasing the profitability of the organization and maximizing the value of the organization and ultimately the shareholder’s wealth.
2 WORKING CAPITAL MANAGEMENT
Question 1
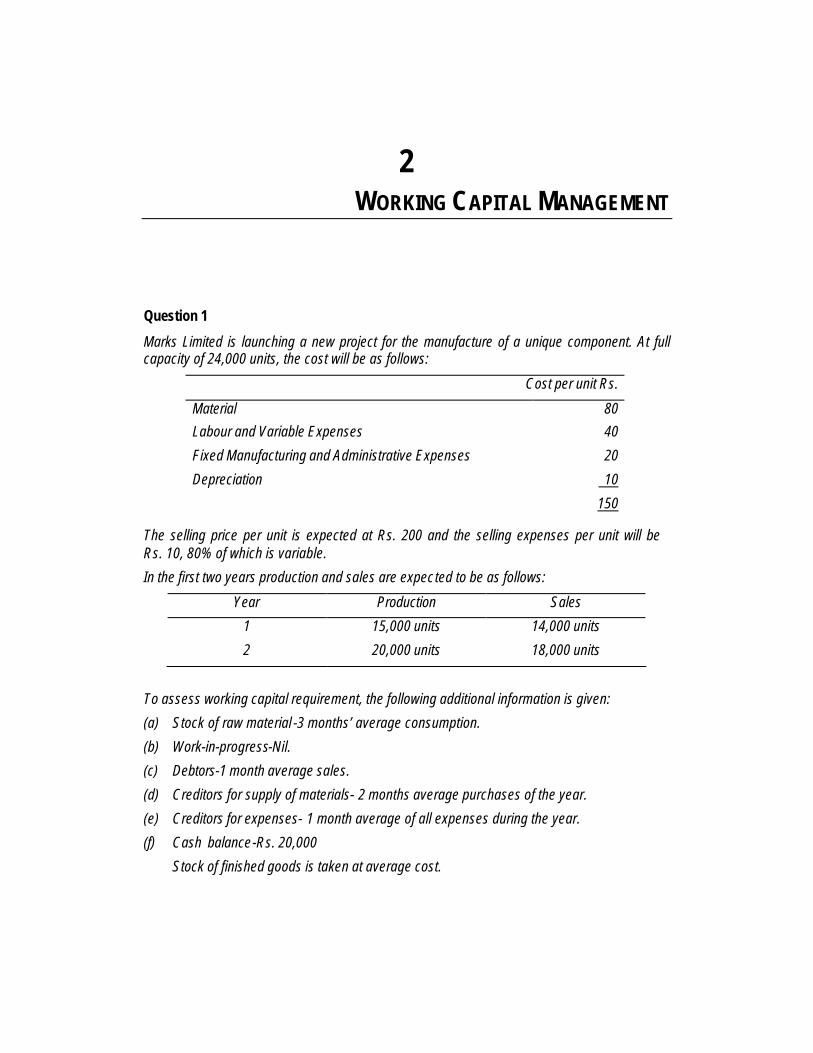
Marks Limited is launching a new project for the manufacture of a unique component. At full capacity of 24,000 units, the cost will be as follows:
Cost per unit Rs.
Material 80
Labour and Variable Expenses 40
Fixed Manufacturing and Administrative Expenses 20
Depreciation 10
150
The selling price per unit is expected at Rs. 200 and the selling expenses per unit will be Rs. 10, 80% of which is variable.
In the first two years production and sales are expected to be as follows:
Year Production Sales
1 15,000 units 14,000 units
2 20,000 units 18,000 units
To assess working capital requirement, the following additional information is given:
(a) Stock of raw material -3 months’ average consumption.
(b) Work-in-progress-Nil.
(c) Debtors-1 month average sales.
(d) Creditors for supply of materials- 2 months average purchases of the year.
(e) Creditors for expenses- 1 month average of all expenses during the year.
(f) Cash balance-Rs. 20,000
Stock of finished goods is taken at average cost.
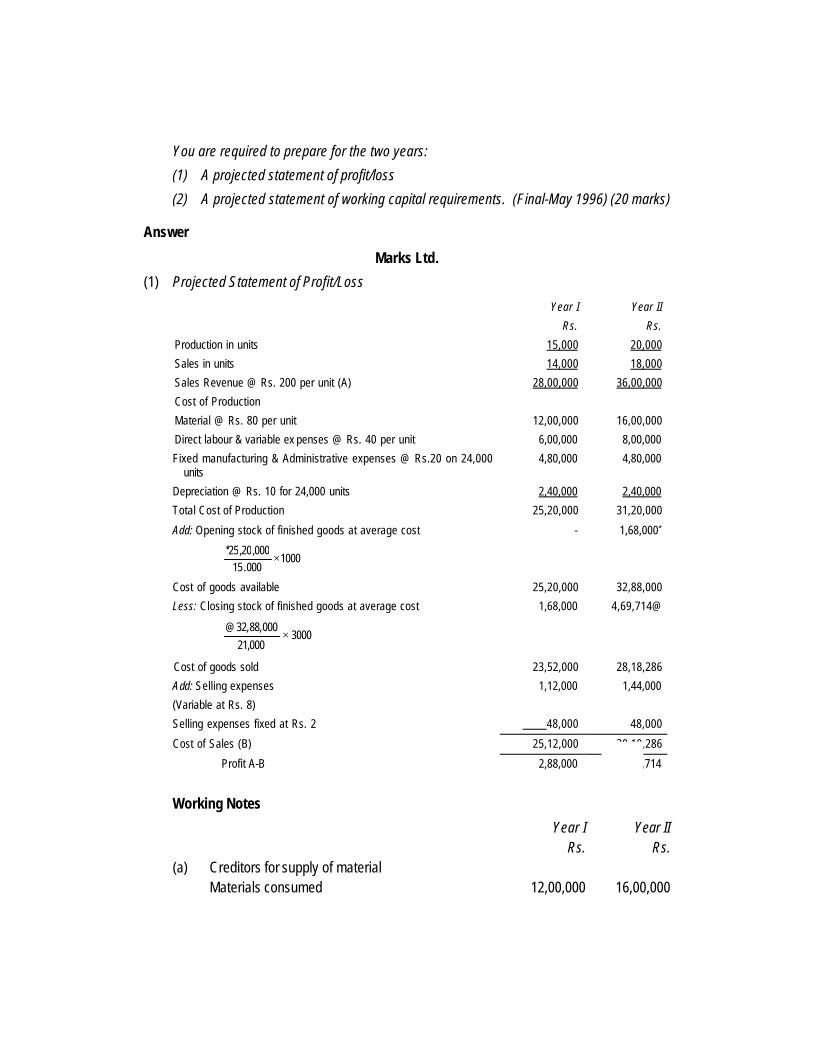
You are required to prepare for the two years:
(1) A projected statement of profit/loss
(2) A projected statement of working capital requirements. (Final-May 1996) (20 marks)
Answer
Marks Ltd.
(1) Projected Statement of Profit/Loss
Year I
Rs.
Year II
Rs.
Production in units 15,000 20,000
Sales in units 14,000 18,000
Sales Revenue @ Rs. 200 per unit (A) 28,00,000 36,00,000
Cost of Production
Material @ Rs. 80 per unit 12,00,000 16,00,000
Direct labour & variable ex penses @ Rs. 40 per unit 6,00,000 8,00,000
Fixed manufacturing & Administrative expenses @ Rs.20 on 24,000 units
4,80,000 4,80,000
Depreciation @ Rs. 10 for 24,000 units 2,40,000 2,40,000
Total Cost of Production 25,20,000 31,20,000
Add: Opening stock of finished goods at average cost
1000000.15
000,20,25*×
- 1,68,000*
Cost of goods available 25,20,000 32,88,000
Less: Closing stock of finished goods at average cost
3000000,21
000,88,32@×
1,68,000 4,69,714@
Cost of goods sold 23,52,000 28,18,286
Add: Selling expenses
(Variable at Rs. 8)
1,12,000 1,44,000
Selling expenses fixed at Rs. 2 48,000 48,000
Cost of Sales (B) 25,12,000 30,10,286
Profit A-B 2,88,000 5,89,714
Working Notes
Year I Rs.
Year II Rs.
(a) Creditors for supply of material Materials consumed 12,00,000 16,00,000
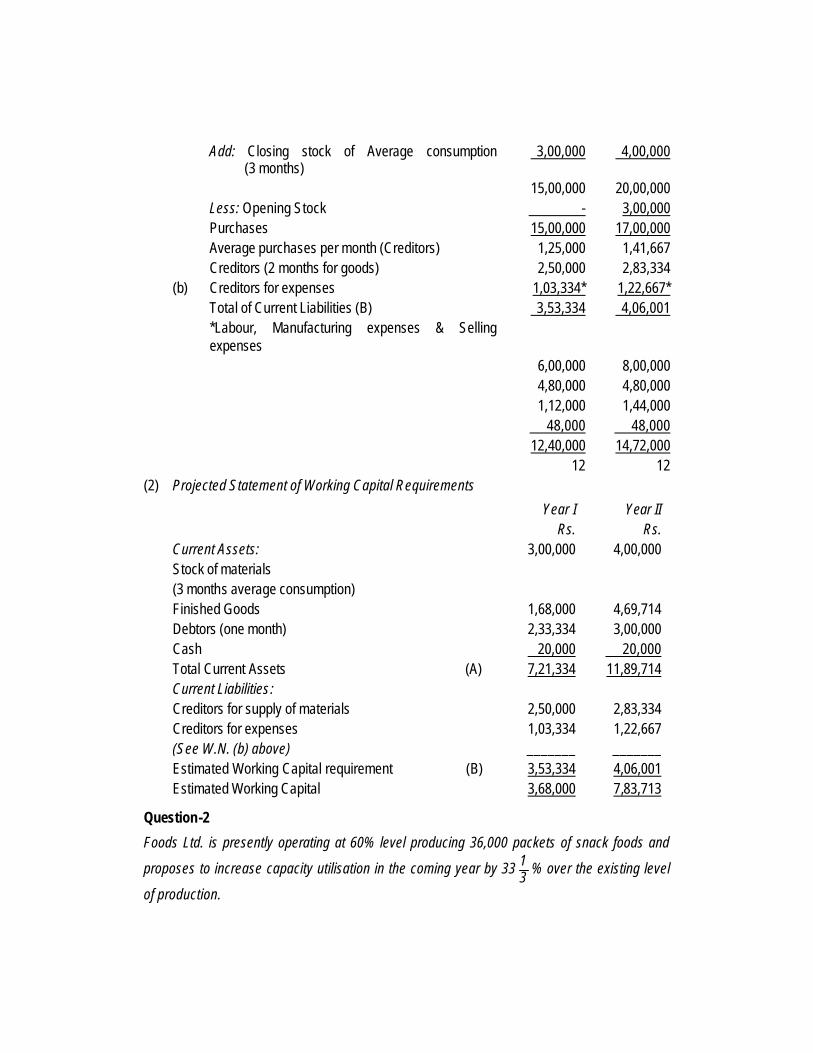
Add: Closing stock of Average consumption (3 months)
3,00,000 4,00,000
15,00,000 20,00,000 Less: Opening Stock - 3,00,000 Purchases 15,00,000 17,00,000 Average purchases per month (Creditors) 1,25,000 1,41,667 Creditors (2 months for goods) 2,50,000 2,83,334 (b) Creditors for expenses 1,03,334* 1,22,667* Total of Current Liabilities (B) 3,53,334 4,06,001 *Labour, Manufacturing expenses & Selling
expenses
6,00,000 8,00,000 4,80,000 4,80,000 1,12,000 1,44,000 48,000 48,000 12,40,000 14,72,000 12 12
(2) Projected Statement of Working Capital Requirements
Year I Rs.
Year II Rs.
Current Assets: Stock of materials (3 months average consumption)
3,00,000 4,00,000
Finished Goods 1,68,000 4,69,714 Debtors (one month) 2,33,334 3,00,000 Cash 20,000 20,000 Total Current Assets (A) 7,21,334 11,89,714 Current Liabilities: Creditors for supply of materials 2,50,000 2,83,334 Creditors for expenses 1,03,334 1,22,667 (See W.N. (b) above) _______ _______ Estimated Working Capital requirement (B) 3,53,334 4,06,001 Estimated Working Capital 3,68,000 7,83,713
Question-2
Foods Ltd. is presently operating at 60% level producing 36,000 packets of snack foods and
proposes to increase capacity utilisation in the coming year by 3331 % over the existing level
of production.
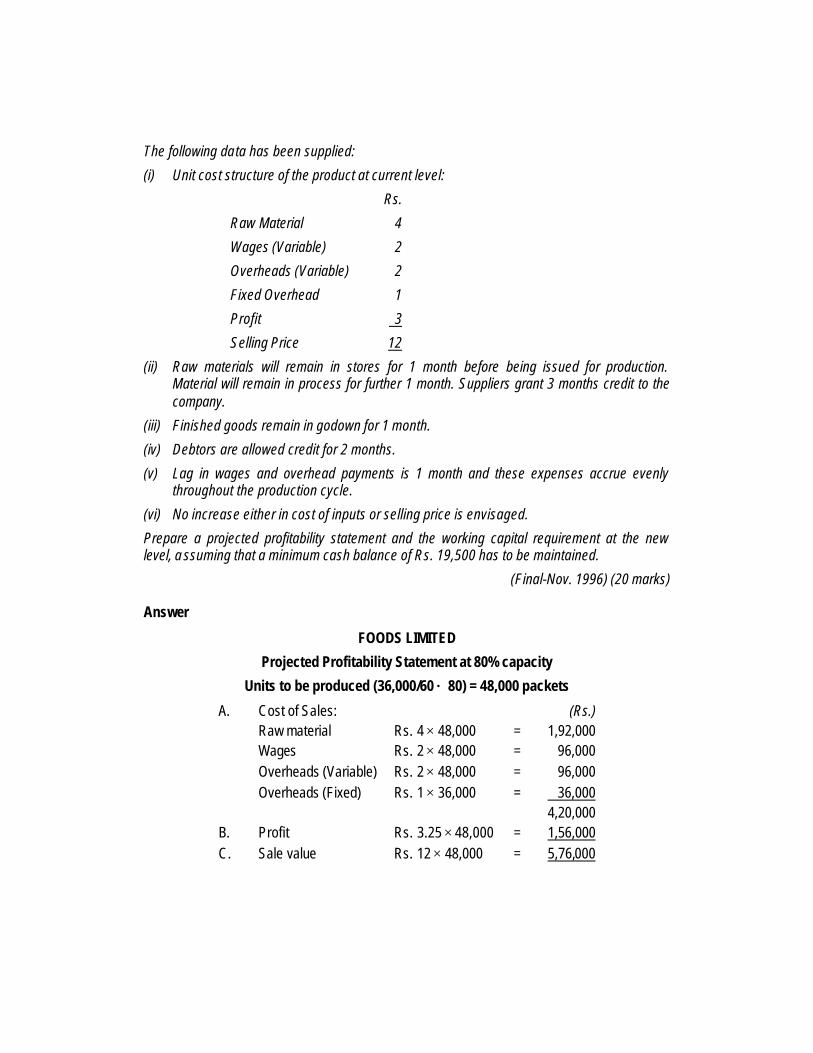
The following data has been supplied:
(i) Unit cost structure of the product at current level:
Rs.
Raw Material 4
Wages (Variable) 2
Overheads (Variable) 2
Fixed Overhead 1
Profit 3
Selling Price 12
(ii) Raw materials will remain in stores for 1 month before being issued for production. Material will remain in process for further 1 month. Suppliers grant 3 months credit to the company.
(iii) Finished goods remain in godown for 1 month.
(iv) Debtors are allowed credit for 2 months.
(v) Lag in wages and overhead payments is 1 month and these expenses accrue evenly throughout the production cycle.
(vi) No increase either in cost of inputs or selling price is envisaged.
Prepare a projected profitability statement and the working capital requirement at the new level, a ssuming that a minimum cash balance of Rs. 19,500 has to be maintained.
(Final-Nov. 1996) (20 marks)
Answer
FOODS LIMITED
Projected Profitability Statement at 80% capacity
Units to be produced (36,000/60 × 80) = 48,000 packets
A. Cost of Sales: (Rs.) Raw material Rs. 4 × 48,000 = 1,92,000 Wages Rs. 2 × 48,000 = 96,000 Overheads (Variable) Rs. 2 × 48,000 = 96,000 Overheads (Fixed) Rs. 1 × 36,000 = 36,000 4,20,000 B. Profit Rs. 3.25 × 48,000 = 1,56,000 C. Sale value Rs. 12 × 48,000 = 5,76,000

Alternatively:
If we assume the movement in stock levels, because of increase in capacity, i.e., from 60% to 80%, the profitability statement will be as follows:
Units to be produced (36,000/60 × 80) 48,000 packets
A. Cost of goods sold:
Rs. Raw Material (4 × 48,000) 1,92,000 Wages (2 × 48,000) 96,000 Overheads (Variable) (2 × 48,000) 96,000 Overheads (Fixed) (1 × 36,000) 36,000 4,20,000 Less: Increase in stock of Materials + WIP + Finished goods (Refer to working note)
18,000 Adjusted cost of sales 4,02,000 B. Profit 1,62,000 C. Sales (12 × 47,000)* 5,64,000
* Opening Stock + production – closing stock = 3,000 + 48,000-4,000= 47,000
Working Note:
Capacity 60% 80% Number of units of production 36,000 48,000 Cost/Unit Rs. Rs. Raw material stock (I month) 4 12,000 16,000 WIP Stock: Material (1 month) 4 12,000 16,000 Wages (1/2 month) 2 3,000 4,000 Variable overheads (1/2 month) 2 3,000 4,000 Fixed overheads (1/2 month) 1 1,500 (0.75) 1,500 Finished goods (1 month) 9 27,000 (8.75) 35,000 58,500 76,500 Increase in Stock 18,000 Working Notes:
Cost of Sales-average per month
Per annum Per month Raw material 1,92,000 16,000 Wages 96,000 8,000

Overheads (Variable) 96,000 8,000 Overheads (Fixed) 36,000 3,000 4,20,000 35,000 Profit 1,56,000 13,000 Sale value 5,76,000 48,000
Projected Statement of Working Capital at 80% capacity
Current Assets Raw material (48000/12 × 4) 16,000 Work in process 25,500 Materials (48,000 × 4 × 1/12) 16,000 Wages (48,000 × 2 × 1/24) 4,000 Variable overheads (48,000 × 2 × 1/24) 4,000 Fixed overheads (48,000 × 0.75 × 1/24) 1,500 Finished goods (48,000 × 8.75 × 1/12) 35,000 76,500 Sundry debtors 96,000 1,72,500 Cash balance 19,500 (A) 1,92,000 Less: Current Liabilities: Creditors for goods (48,000 x 4 x 3/12) 48,000 Creditors fro expenses (48,000 x 4.75 x 1/12) 19,000 (B) 67,000 Net working capital (A)–(B) 1,25,000
Note: (i) Since wages and overheads payments accrue evenly, it is assumed that they will be in process for half a month in average.
(ii) Fixed overheads per unit = Rs. 36000/48000=Rs. 0.75
Question 3
The fixed assets and equities of Eastern Manufacturing Co. Ltd. are supplied to you both at the beginning and at the end of the year 1996-97:
1.04.96 Rs.
31.03.97 Rs.
Plant Less Depreciation 63,500 1,42,500 Investment in Shares of Southern Manufacturing Company
1,32,000
2,90,000
Bonds Payable 2,50,000 70,000

Capital Stock 4,00,000 4,00,000 Retained Earnings 2,38,000 4,10,500
You are not in a position to have complete Balance Sheet data or an income statement for the year in spite of the fact that you have obtained the following information:
(a) Dividend of Rs. 37,500 were paid.
(b) The net income included Rs. 13,000 as profit on sale of equipment. There has been an increase of Rs. 93,000 in the value of gross plant assets even though equipments worth Rs. 29,000 with a net book value of Rs. 19,000 was disposed off. From the particulars given above, prepare a statement of sources and uses of net working capital.
(Final- Nov. 1997) (10 marks)
Answer
(a) Working Notes:
(i) Purchase of plant Rs. Net increase in gross value 93,000
Add: Gross value of plant sold 29,000
1,22,000 (ii) Depreciation on plant and machinery
Plant and Machinery account
Rs. Rs. To Balance b/d 63,500 By Sale of Plant & machinery A/c 19,000 To Purchases 1,22,000 By Depreciation (balancing figure) 24,000 _______ By Balance c/d 1,42,500 1,85,500 1,85,500
(iii) Funds from Operations Rs.
Increase in retained earnings [4,10,500 – 2,38,000] 1,72,500
Add: Dividend paid 37,500 Add: Depreciation on plant 24,000
2,34,000
Less: Gain on sale of equipment 13,000 2,21,000

Statement of Sources and Uses of Fund
Sources Rs. Uses Rs. Funds form operation 2,21,000 Purchase of plant 1,22,000 Sale of equipment 32,000 Purchase of Investments
(2,90,000 -1,32,000) 1,58,000
Decrease in net working capital (Balancing figure)
2,44,500 _______
Payment of bonds Dividends
1,80,000 37,500
4,97,500 4,97,500 Question 4
A newly formed company has applied to the commercial bank for the first time for financing its working capital requirements. The following information is available about the projections for the current year:
Estimated level of activity: 1,04,000 completed units of production plus 4,000 units of work-in-progress. Based on the above activity, estimated cost per unit is:
Raw material Rs. 80 per unit
Direct wages Rs. 30 per unit
Overheads (exclusive of depreciation) Rs. 60 per unit
Total cost Rs. 170 per unit
Selling price Rs. 200 per unit
Raw materials in stock: Average 4 weeks consumption, work-in-progress (assume 50% completion stage in respect of conversion cost) (materials issued at the start of the processing).
Finished goods in stock 8,000 units
Credit allowed by suppliers Average 4 weeks
Credit allowed to debtors/receivables Average 8 weeks
Lag in payment of wages Average 1 21 weeks
Cash at banks (for smooth operation) is expected to be Rs. 25,000
Assume that production is carried on evenly throughout the year (52 weeks) and wages and overheads accrue similarly. All sales are on credit basis only.
Find out
(i) the net working capital required;
(ii) the maximum permissible bank finance under first and second methods of financing as per Tandom Committee Norms. (Final-Nov. 1998) (20 marks)
Answer
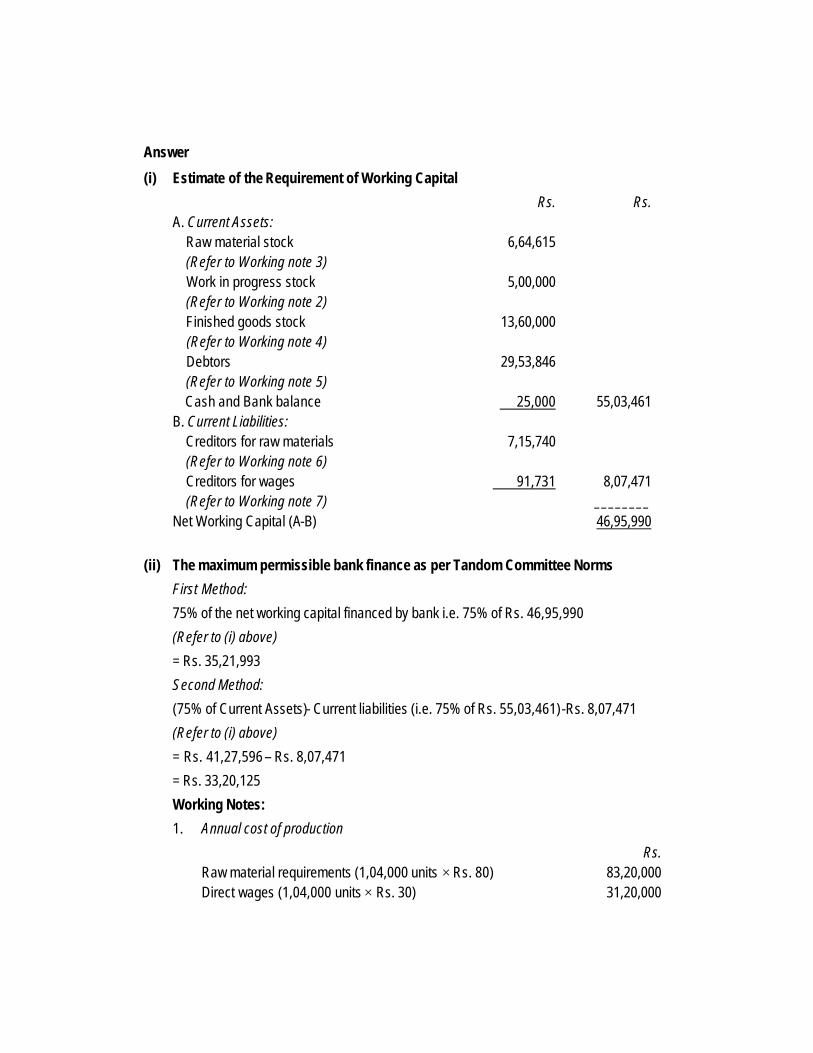
(i) Estimate of the Requirement of Working Capital
Rs. Rs. A. Current Assets: Raw material stock 6,64,615 (Refer to Working note 3) Work in progress stock 5,00,000 (Refer to Working note 2) Finished goods stock 13,60,000 (Refer to Working note 4) Debtors 29,53,846 (Refer to Working note 5) Cash and Bank balance 25,000 55,03,461 B. Current Liabilities: Creditors for raw materials 7,15,740 (Refer to Working note 6) Creditors for wages 91,731 8,07,471 (Refer to Working note 7) ________ Net Working Capital (A-B) 46,95,990
(ii) The maximum permissible bank finance as per Tandom Committee Norms
First Method:
75% of the net working capital financed by bank i.e. 75% of Rs. 46,95,990
(Refer to (i) above)
= Rs. 35,21,993
Second Method:
(75% of Current Assets)- Current liabilities (i.e. 75% of Rs. 55,03,461)-Rs. 8,07,471
(Refer to (i) above)
= Rs. 41,27,596 – Rs. 8,07,471
= Rs. 33,20,125
Working Notes:
1. Annual cost of production
Rs. Raw material requirements (1,04,000 units × Rs. 80) 83,20,000 Direct wages (1,04,000 units × Rs. 30) 31,20,000

Overheads (exclusive of depreciation)(1,04,000 × Rs. 60) 62,40,000 1,76,80,000
2. Work in progress stock
Rs. Raw material requirements (4,000 units × Rs. 80) 3,20,000 Direct wages (50% × 4,000 units × Rs. 30) 60,000 Overheads (50% × 4,000 units × Rs. 60) 1,20,000 5,00,000
3. Raw material stock
It is given that raw material in stock is average 4 weeks consumption. Since, the company is newly formed, the raw material requirement for production and work in progress will be issued and consumed during the year.
Hence, the raw material consumption for the year (52 weeks) is as follows:
Rs. For Finished goods 83,20,000 For Work in progress 3,20,000 86,40,000
Raw material stock weeks4 weeks52
86,40,000 Rs. ×
i.e. Rs. 6,64,615
4. Finished goods stock
8,000 units @ Rs. 170 per unit = Rs. 13,60,000
5. Debtors for sale
Credit allowed to debtors Average 8 weeks Credit sales for year (52 weeks) i.e. (1,04,000 units-8,000 units) 96,000 units Selling price per unit Rs. 200 Credit sales for the year (96,000 units × Rs. 200) Rs. 1,92,00,000 Debtors weeks8
weeks5201,92,00,00 Rs. ×
i.e Rs. 29,53,846 6. Creditors for raw material:
Credit allowed by suppliers Average 4 weeks Purchases during the year (52 weeks) i.e. (Rs. 83,20,000 + Rs. 3,20,000 + Rs. 6,64,615)
Rs. 93,04,615
(Refer to Working notes 1,2 and 3 above)

Creditors weeks4
weeks5293.04.615 Rs. ×
i.e Rs. 7,15,740 7. Creditors for wages
Lag in payment of wages Average 1
21 weeks
Direct wages for the year (52 weeks) i.e. (Rs. 31,20,000 + Rs. 60,000)
Rs. 31,80,000
(Refer to Working notes 1 and 2 above) Creditors
weeks21
1 weeks52
31,80,000 Rs. ×
i.e. Rs. 91,731
Question 5
Q Ltd. sells goods at a uniform rate of gross profit of 20% on sales including depreciation as part of cost of production. Its annual figures are as under:
Rs. Sales (At 2 months’ credit) 24,00,000 Materials consumed (Suppliers credit 2 months) 6,00,000 Wages paid (Monthly at the beginning of the subsequent month) 4,80,000 Manufacturing expenses (Cash expenses are paid – one month in arrear) 6,00,000 Administration expenses (Cash expenses are paid – one month in arrear) 1,50,000 Sales promotion expenses (Paid quarterly in advance) 75,000
The company keeps one month stock each of raw materials and finished goods. A minimum cash balance of Rs. 80,000 is always kept. The company wants to adopt a 10% safety margin in the maintenance of working capital.
The company has no work in progress
Find out the requirements of working capital of the company on cash cost basis.
(Final-May 1999) (12 marks)
Answer
(a) Working Notes:
1. Manufacturing expenses Rs. Sales 24,00,000 Less: Gross profit margin at 20% 4,80,000 Total Manufacturing cost 19,20,000

Less: Materials consumed 6,00,000 Wages 4,80,000 10,80,000 Manufacturing expenses 8,40,000 Less: Cash manufacturing expenses (50,000 × 12) 6,00,000 Depreciation 2,40,000 2. Total cash costs Rs. Manufacturing costs 19,20,000 Less: Depreciation 2,40,000 Cash Manufacturing costs 16,80,000 Add: Administrative expenses 1,50,000 Add: Sales promotion expenses 75,000 Total cash costs 19,05,000
Statement showing the Requirements of Working Capital of the Company
Rs. Current Assets: Debtors 1/6 th of total cash costs (1/6 × Rs. 19,05,000) 3,17,500 (Refer to Working note 2) Sales promotion expenses (prepaid) 18,750 Stock of raw materials (1 month) 50,000 Finished goods (1/12 of cash manufacturing costs) 1,40,000 (Rs. 16,80,000 x 1/12) (Refer to Working note 2) Cash in hand 80,000 6,06,250 Less: Current liabilities Creditors for goods ( 2 months) 1,00,000 Wages (1 month) 40,000 Manufacturing expenses (1 month) 50,000 Administrative expenses (1 month) 12,500 2,02,500 Net working capital 4,03,750 Add: Safety margin 10% 40,375 Working Capital Required 4,44,125
Question 6
A company is considering its working capital investment and financial policies for the next year. Estimated fixed assets and current liabilities for the next year are Rs. 2.60 crores and Rs. 2.34 crores respectively. Estimated Sales and EBIT depend on current assets investment,

particularly inventories and book-debts. The financial controller of the company is examining the following alternative Working Capital Policies:
(Rs. Crores)
Working Capital Policy
Investment in Current Assets
Estimated Sales EBIT
Conservative 4.50 12.30 1.23 Moderate 3.90 11.50 1.15 Aggressive 2.60 10.00 1.00
After evaluating the working capital policy, the Financial Controller has advised the adoption of the moderate working capital policy. The company is now examining the use of long-term and short-term borrowings for financing its assets. The company will use Rs. 2.50 crores of the equity funds. The corporate tax rate is 35%. The company is considering the following debt alternatives.
(Rs. Crores)
Financing Policy Short-term Debt Long-term Debt
Conservative 0.54 1.12
Moderate 1.00 0.66
Aggressive 1.50 0.16
Interest rate-Average 12% 16%
You are required to calculate the following:
(1) Working Capital Investment for each policy:
(a) Net Working Capital position
(b) Rate of Return
(c) Current ratio
(2) Financing for each policy :
(a) Net Working Capital position.
(b) Rate of Return on Shareholders equity.
(c) Current ratio. (Final-Nov. 2001) (20 marks)
Answer
Statement showing Working Capital for each policy
(Rs. in crores)
Working Capital Policy Conservative Moderate Aggressive

Current Assets: (i) 4.50 3.90 2.60 Fixed Assets: (ii) 2.60 2.60 2.60 Total Assets: (iii) 7.10 6.50 5.20 Current liabilities: (iv) 2.34 2.34 2.34 Net Worth: (v)=(iii)-(iv) 4.76 4.16 2.86 Total liabilities: (iv)+(v) 7.10 6.50 5.20 Estimated Sales: (vi) 12.30 11.50 10.00 EBIT: (vii) 1.23 1.15 1.00 (a) Net working capital position: (i)-(iv) 2.16 1.56 0.26 (b) Rate of return: (vii)/(iii) 17.3% 17.7% 19.2% (c) Current ratio: (i)/(iv) 1.92 1.67 1.11
Statement Showing Effect of Alternative Financing Policy
(Rs. in crores)
Financing Policy Conservative Moderate Aggressive Current Assets: (i) 3.90 3.90 3.90 Fixed Assets: (ii) 2.60 2.60 2.60 Total Assets: (iii) 6.50 6.50 6.50 Current Liabilities: (iv) 2.34 2.34 2.34 Short term Debt: (v) 0.54 1.00 1.50 Long term Debt: (vi) 1.12 0.66 0.16 Equity Capital 2.50 2.50 2.50 Total liabilities 6.50 6.50 6.50 Forecasted Sales 11.50 11.50 11.50 EBIT: (vii) 1.15 1.15 1.15 Less: Interest short-term debt : (viii)
0.06 0.12 0.18
(12% of Rs. 0.54) (12% of Rs. 1.00) (12% of Rs. 1.50) Long term debt : (ix) 0.18 0.11 0.03 (16% of Rs. 1.12) (16% of Rs. 0.66) (16% of Rs. 1.16) Earning before tax : (x)-(viii+ix)
0.91 0.92 0.94
Taxes @ 35% 0.32 0.32 0.33 Earning after tax: (xi) 0.59 0.60 0.61 (a) Net Working Capital Position : (i) -[(iv)+(v)]
1.02
0.56
0.06
(b) Rate of return on shareholders Equity capital : (xi)
23.6% 24% 24.4%
(c) Current Ratio : [(i)/(iv)+(v)]
1.35% 1.17 1.02
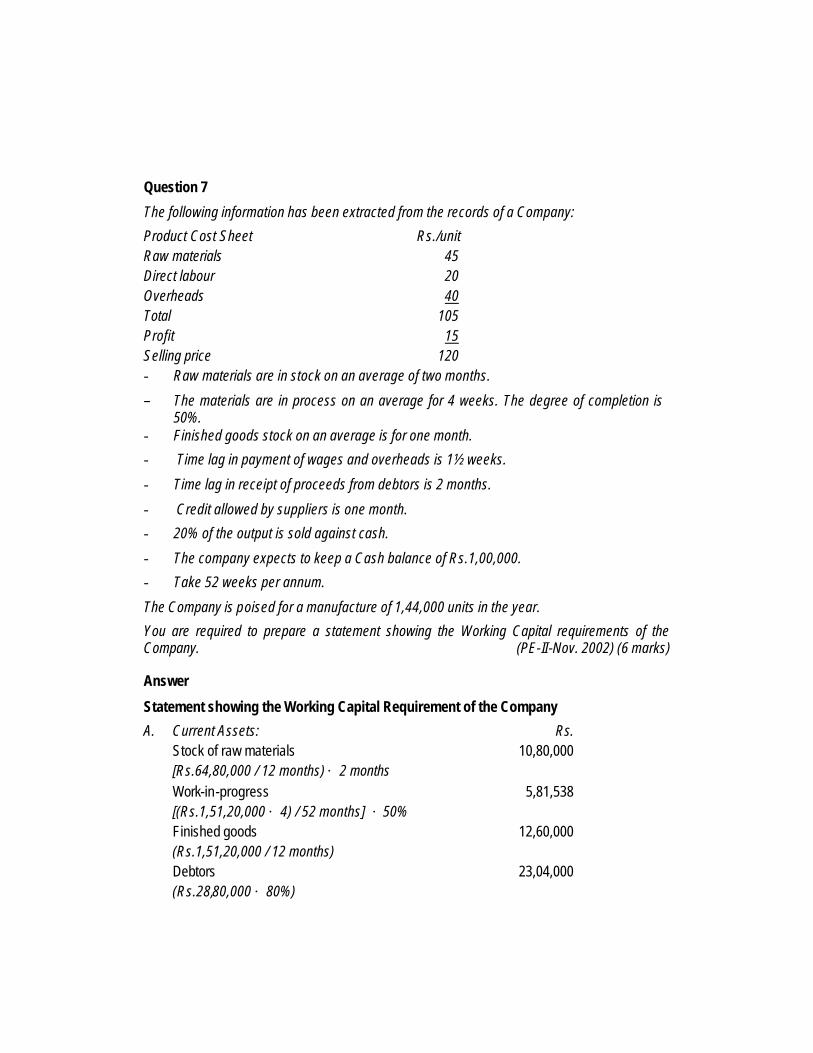
Question 7
The following information has been extracted from the records of a Company:
Product Cost Sheet Rs./unit Raw materials 45 Direct labour 20 Overheads 40 Total 105 Profit 15 Selling price 120 − Raw materials are in stock on an average of two months.
– The materials are in process on an average for 4 weeks. The degree of completion is 50%.
− Finished goods stock on an average is for one month.
− Time lag in payment of wages and overheads is 1½ weeks.
− Time lag in receipt of proceeds from debtors is 2 months.
− Credit allowed by suppliers is one month.
− 20% of the output is sold against cash.
− The company expects to keep a Cash balance of Rs.1,00,000.
− Take 52 weeks per annum.
The Company is poised for a manufacture of 1,44,000 units in the year.
You are required to prepare a statement showing the Working Capital requirements of the Company. (PE-II-Nov. 2002) (6 marks)
Answer
Statement showing the Working Capital Requirement of the Company
A. Current Assets: Rs. Stock of raw materials 10,80,000 [Rs.64,80,000 / 12 months) × 2 months Work-in-progress 5,81,538 [(Rs.1,51,20,000 × 4) / 52 months] × 50% Finished goods 12,60,000 (Rs.1,51,20,000 / 12 months) Debtors 23,04,000 (Rs.28,80,000 × 80%)

(Refer to Working note 2) Cash balances 1,00,000 53,25,538 Current Liabilities: Creditors of raw materials 5,40,000 (Rs.64,80,000 / 12 months) Creditors for wages & overheads 2,49,231
× weeks1.5
weeks5200Rs.86,40,0
7,89,231
Net Working Capital (C.A− C.L) 45,36,307 Working Notes: 1, Annual raw materials requirements (Rs.) 64,80,000 1,44,000 units × Rs.45 Annual direct labour cost (Rs.) 28,80,000 1,44,000 units × Rs.20 Annual overhead costs (Rs.) 57,60,000 1,44,000 units × Rs.40 Total Cost (Rs.) 1,51,20,000 2. Total Sales: 1,72,80,000 (1,44,000 units × Rs.120) Two months sales 28,80,000 (Rs.1,72,80,000 / 6 months)
Question 8
An engineering company is considering its working capital investment for the year 2003-04. The estimated fixed assets and current liabilities for the next year are Rs.6.63 crore and Rs.5.967 crore respectively. The sales and earnings before interest and taxes (EBIT) depend on investment in its current assets − particularly inventory and receivables. The company is examining the following alternative working capital policies:
Working Capital Investment in Estimated EBIT Policy Current Assets Sales (Rs. Crore) (Rs. Crore) (Rs. Crore) Conservative 11.475 31.365 3.1365 Moderate 9.945 29.325 2.9325 Aggressive 6.63 25.50 2.55
You are required to calculate the following for each policy:

(i) Rate of return on total assets.
(ii) Net working capital position.
(iii) Current assets to fixed assets ratio.
(iv) Discuss the risk-return trade off of each working capital policy.
(PE-II-May 2003) (6 marks) Answer
Basic data:
(Rs. in Crores)
Working Capital Investment Policy
Conservative Moderate Aggressive
1. Current assets 11.475 9.945 6.630
2. Fixed assets 6.630 6.630 6.630
3. Total assets 18.105 16.575 13.26
4. Current liabilities 5.967 5.967 5.967
5. Estimated sales 31.365 29.325 25.50
6. Estimated EBIT 3.1365 2.9325 2.55
7. Current ratio {(1) / (4)} 1.92 1.67 1.11
Computation of following for each policy:
(i) Rate of return on total assets
(in percentages):
17.32 17.69 19.23
[(6)/(3)] × 100
(ii) Net working capital position :
(in crores)
5.508 3.978 0.663
[(1)−(4)]
(iii) Current assets to fixed assets ratio :
[(1) / (2)]
1.73 1.50 1.00
(iv) Risk return trade off:
The net working capital or current ratio is a measure of risk. Rate of return on total assets is a measure of return. The expected risk and return are minimum in the case of conservative investment policy and maximum in the case of aggressive investment policy. The firm can improve profitability by reducing investment in working capital.

Question 9
XYZ Co. Ltd. is a pipe manufacturing company. Its production cycle indicates that materials are introduced in the beginning of the production cycle; wages and overhead accrue evenly throughout the period of the cycle. Wages are paid in the next month following the month of accrual. Work in process includes full units of raw materials used in the beginning of the production process and 50% of wages and overheads are supposed to be conversion costs. Details of production process and the components of working capital are as follows:
Production of pipes 12,00,000 units Duration of the production cycle One month Raw materials inventory held One month consumption Finished goods inventory held for Two months Credit allowed by creditors One month Credit given to debtors Two months Cost price of raw materials Rs. 60 per unit Direct wages Rs. 10 per unit Overheads Rs. 20 per unit Selling price of finished pipes Rs. 100 per unit Required to calculate:
(i) The amount of working capital required for the company.
(ii) Its maximum permissible bank finance under all the three methods of lending norms as suggested by the Tondon Committee, assuming the value of core current assets: Rs. 1,00,00,00. (PE-II May 2005) (10 marks)
Answer
(i) Amount in Rs
A – Current Assets
(i) Raw material inventory –(1 month)- 12,00,000 Uts × 60 × 121
60,00,000
(ii) – Work in Progress – Production cycle 1 month
Raw material (added in the beginning) Rs 60,00,000
Wages (12,00,000 × 10 ×21
) × 50% = 5,00,000
Overheads 20 × 10,00,000 × 121
× 50% = 10,00,000
Total 75,00,000

(iii) Finished goods (inventory held for 2 months)
Total Cost Material 60.00
Labour 10.00
Overheads 20.00 =90 × 12,00,000 ×122
1,80,00,000
(iv) Debtors for 2 months 12,00,000 × Rs 90 ×122
1,80,00,000
Total current assets 4,95,00,000
B – Current liabilities
(v) Creditors for Raw material – 01 month
7,20,00,000 ×121
60,00,000
(vi) Creditors for wages
12,00,000 × 10 ×121
10,00,000
Total current liabilities 70,00,000
Net working capital 4,25,00,000
(ii) Computation of Maximum Permissible Bank Finance according to
Tandon Committee Norms 1st Method
Rs CAs 4,95,00,000 CLs 70,00,000 Working capital gap 4,25,00,000 Less 25% from long term sources (1,06,25,000) Max Permissible Bank Finance 3,18,75,000
2nd Method
Rs

Working capital gap 4,25,00,000
Less: 25% of CAs (1,23,75,000)
MPBF 3,01,25,000
3r d Method
Total current assets – Core current assets = Rs 4,95,00,000 – 1,00,00,000
= Rs 3,95,00,000
Rs
Real current assets 3,95,00,000
Less: 25% 98,75,000
2,96,25,000
Less: Current Liabilities 70,00,000
MPBF 2,26,25,000
Question 10
The following annual figures relate to MNP Limited:
Sales (at three months credit) Rs.90,00,000 Materials consumed (suppliers extend one and half month’s credit)
Rs.22,50,000
Wages paid (one month in arrear) Rs.18,00,000 Manufacturing expenses outstanding at the end of the year (cash Rs.2,00,000 expenses are paid one month in arrear) Total Administrative expenses for the year (cash expenses are paid one month in arrear)
Rs.6,00,000
Sales Promotion expenses for the year (paid quarterly in advance)
Rs.12,00,000
The company sells its products on gross-profit of 25% assuming depreciation as a part of cost of production. It keeps two month’s stock of finished goods and one month’s stock of raw materials as inventory. It keeps cash balance of Rs.2,50,000.
Assume a 5% safety margin, work out the working capital requirements of the company on cash cost basis. Ignore work-in-progress (PE-II-May 2004) (6 marks)
Answer
Computation of Total Cash Cost: Rs. Rs. Sales 90,00,000
Less: Gross profit 22,50,000

(25% x sales revenue)
Total Manufacturing cost (A) 67,50,000 Less: Material consumed cost 22,50,000
Less: Wages paid 18,00,000 40,50,000
Manufacturing expenses 27,00,000
Less: Cash manufacturing expenses (Rs.2,00,000 × 12)
24,00,000
Depreciation: (B) 3,00,000
Total Manufacturing cost : (C) = (A) – (B) 64,50,000 Add: Administrative expenses 6,00,000
Add: Sales promotion expenses 12,00,000
Total cash cost of manufacturing and sales 82,50,000
Estimation of Current Assets :
Rs. Debtors 20,62,500 (Total cash cost × 3/12) or (Rs. 82,50,000 × 3/12) Cash balance 2,50,000
Pre-paid sales promotion expenses 3,00,000 Raw materials stock (Material consumed / 12) or (Rs.22,50,000 / 12)
1,87,500
Finished goods stock 13,75,000 (Total cash cost x 2/12) or (Rs.82,50,000 x 2/12) Total Current Assets 41,75,000 Estimation of Current Liabilities :
Sundry creditors 2,81,250
Material cost
(Rs.22,50,000 x 1.5 months / 12 months)
Manufacturing expenses outstanding 2,00,000
Wages outstanding (Rs. 18,00,000 × 1/12 months)
1,50,000

Administrative expenses outstanding (Rs.6,00,000 × 1 month / 12 months)
50,000
Total Current Liabilities 6 ,81,250
Working capital requirements : (CA − CL) (On cash cost basis)
34,93,750
Question 11
A proforma cost sheet of a Company provides the following particulars:
Amount per unit (Rs.) Raw materials cost 100 Direct labour cost 37.50 Overheads cost 75 Total cost 212.50 Profit 37.50 Selling Price 250
The Company keeps raw material in stock, on an average for one month; work-in-progress, on an average for one week; and finished goods in stock, on an average for two weeks.
The credit allowed by suppliers is three weeks and company allows four weeks credit to its debtors. The lag in payment of wages is one week and lag in payment of overhead expenses is two weeks.
The Company sells one-fifth of the output against cash and maintains cash-in-hand and at bank put together at Rs.37,500.
Required:
Prepare a statement showing estimate of Working Capital needed to finance an activity level of 1,30,000 units of production. Assume that production is carried on evenly throughout the year, and wages and overheads accrue similarly. Work-in-progress stock is 80% complete in all respects.
(PE-II-Nov 2006) (12 marks) Answer (a) Activity level: 1,30,000 units
Statement showing Estimate of Working Capital Needs A. Investment in Inventory:
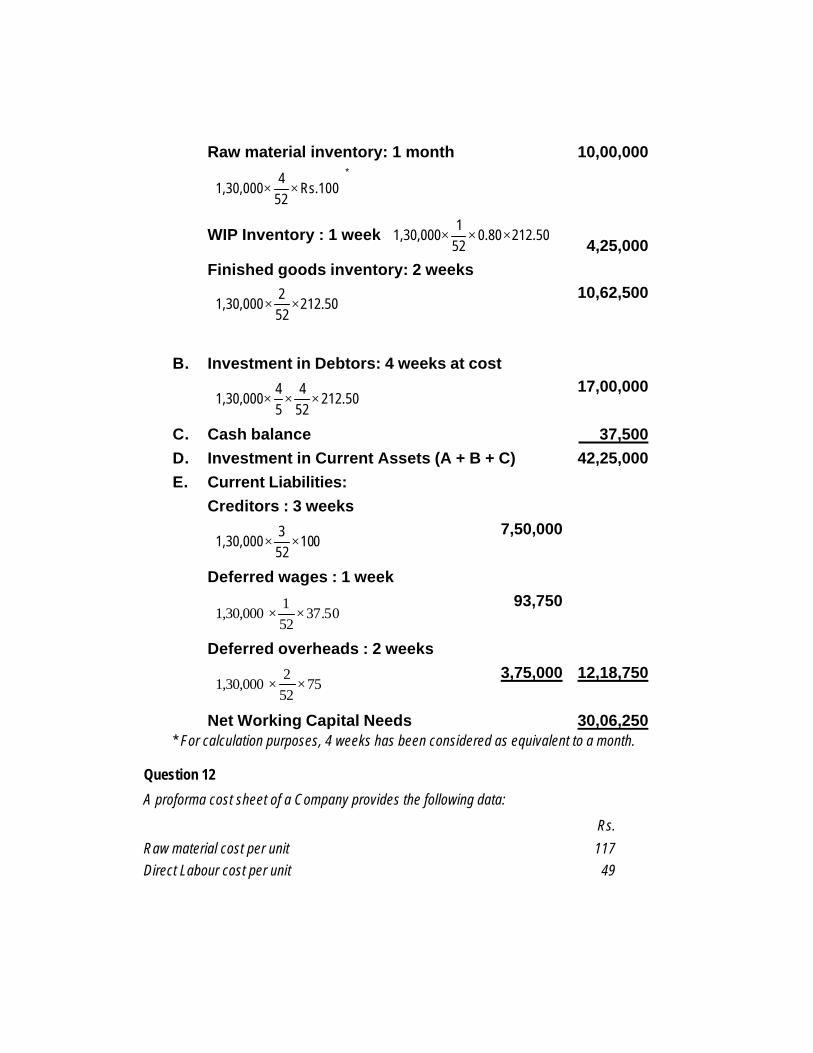
Raw material inventory: 1 month *
100 Rs.524
1,30,000
××
10,00,000
WIP Inventory : 1 week
××× 212.500.80
521
1,30,000
4,25,000 Finished goods inventory: 2 weeks
×× 12.502
522
1,30,000
10,62,500
B. Investment in Debtors: 4 weeks at cost
××× 212.50
524
54
1,30,000
17,00,000
C. Cash balance 37,500 D. Investment in Current Assets (A + B + C) 42,25,000 E. Current Liabilities: Creditors : 3 weeks
×× 010
523
1,30,000
7,50,000
Deferred wages : 1 week
×× 05.37
521
1,30,000
93,750
Deferred overheads : 2 weeks
×× 75
522
1,30,000
3,75,000
12,18,750
Net Working Capital Needs 30,06,250 * For calculation purposes, 4 weeks has been considered as equivalent to a month.
Question 12
A proforma cost sheet of a Company provides the following data:
Rs.
Raw material cost per unit 117 Direct Labour cost per unit 49

Factory overheads cost per unit
(includes depreciation of Rs. 18 per unit at budgeted level of activity)
98
Total cost per unit 264
Profit 36
Selling price per unit 300
Following additional information is available:
Average raw material in stock : 4 weeks
Average work-in-process stock : 2 weeks
(% completion with respect to Materials : 80%
Labour and Overheads : 60%) Finished goods in stock : 3 weeks
Credit period allowed to debtors : 6 weeks
Credit period availed from suppliers : 8 weeks Time lag in payment of wages : 1 week
Time lag in payment of overheads : 2 weeks
The company sells one-fifth of the output against cash and maintains cash balance of Rs. 2,50,000. Required: Prepare a statement showing estimate of working capital needed to finance a budgeted activity level of 78,000 units of production. You may assume that production is carried on evenly throughout the year and wages and overheads accrue similarly. (PE-II-Nov 2007) (9 marks)
Answer
Estimation of Working Capital Needs
I Investment in Inventory Rs.
(i) Raw material Inventory 117 Rs. 524
78,000 ××= 7,02,000
(ii) Work-in-Process Inventory
Material 117 0.80
522
78,000 ×××= = 2,80,800

Labour and Overheads Cost (other than depreciation)
129 0.60 522
78,000 ×××= = 2,32,200
5,13,000
(iii) Finished Goods Inventory (Cash Cost)
246 523
78,000 ××=
11,07,000
II
Investment in Debtors (Cash Cost)
246 0.8 526
78,000 ×××=
17,71,200
III Cash Balance 2,50,000
Investment in Current Assets 43,43,200
Current Liabilities and Deferred Payment
Rs.
(i) Creditors 117 528
78,000 ××= 14,04,000
(ii) Wages outstanding 49 521
78,000 ××= 73,500
(iii) Overheads outstanding (cash cost) 80 522
78,000 ××= 2,40,000
Total Deferred Payments 17,17,500
Net Working Capital (Current assets – Non-interest bearing current liabilities)
43,43,200 – 17,17,500 = Rs. 26,25,700
Question 13
MNO Ltd. has furnished the following cost data relating to the year ending of 31st March, 2008. Rs. (in Lakhs) Sales 450 Material consumed 150 Direct wages 30 Factory overheads (100% variable) 60 Office and Administrative overheads (100% variable) 60

Selling overheads 50 The company wants to make a forecast of working capital needed for the next year and anticipates that: ♦ Sales will go up by 100%,
♦ Selling expenses will be Rs. 150 lakhs,
♦ Stock holdings for the next year will be-Raw material for two and half months, Work-in-progress for one month, Finished goods for half month and Book debts for one and half months,
♦ Lags in payment will be of 3 months for creditors, 1 month for wages and half month for Factory, Office and Administrative and Selling overheads.
You are required to:
(i) Prepare statement showing working capital requirements for next year, and
(ii) Calculate maximum permissible bank finance as per Tandon Committee guidelines assuming that core current assets of the firm are estimated to be Rs. 30 lakhs.
(PE-II-May 2008) (8 marks)
Answer
Working:
Statement showing the projected Cost and Profitability for the year ending on 31-3-2009
Year ending
31/3/2008
(Rs.in lakhs)
Increase/Decrease Forecast for the next Year
ending 31/3/2009
(Rs.in lakhs)
Per month
Sales: 450 +100% 900 75
Direct Materials Consumed 150 +100% 300 25
Direct Wages 30 +100% 60 5
Prime Cost 180 360 30
+ Factory overheads 60 +100% 120 10
Works cost 240 480 40
+ Office & Administrative overheads
60
+100%
120
10
Cost of Production 300 600 50
+ Selling overheads 50 Increase 150 12.50

Total Cost 350 750 62.50
Profit 100 150 12.50
(i) Statement showing Working Capital Requirements of MNO Ltd. for the year 31-3-2009
Amount (Rs. in lakhs)
(A) Current Assets Raw Material (25 × 2.5 month) 62.50
Work-in-Progress
Raw Material (25 × 1 month) 25.00
Direct Wages (5 × 1 month) 5.00
Factory Overheads (10 × 1 month) 10.00
Finished goods (600 × 0.5/ 12) 25.00
Debtors (900 × 1.5/12) 112.50
Total (A) 240.00
(B) Current Liabilities − Lags in payment:
(i) Creditors (300 × 3/12)
75.00
(ii) Wages (60 × 1/12) 5.00
(iii) Factory overheads (120 × 0.5/12) 5.00
(iv) Office & Administrative overheads
(120 × 0.5/12) 5.00
(v) Selling overhead (150 × 0.5/12) 6.25
Total (B) 96.25
Networking capital (A−B) 143.75 Note: In the above answer while computing Work-in-Progress the degree of completion in respect of Labour and Overheads components have been assumed at 100%, which can be assumed otherwise also.
(ii) Maximum permissible Bank Finance (MPBF):
First Method Rs. in lakhs Total current assets 240 (−) Current Liabilities 96.25 143.75

(−) 25% from long term sources (approx.) 35.94 MPBF 107.81
Second Method Total current assets 240 (−) 25%from long term sources 60 180 (−) Current Liabilities 96.25 MPBF 83.75
Third Method Total current assets 240 (−) Core Current Assets 30 210 (−) 25% from long term sources 52.5 157.5 (−) Current Liabilities 96.25 MPBF 61.25
Question 14
H Ltd. has a present annual sales of 10,000 units at Rs. 300 per unit. The variable cost is Rs. 200 per unit and the fixed costs amount to Rs. 3,00,000 per annum. The present credit period allowed by the company is 1 month. The company is considering a proposal to increase the credit period to 2 months and 3 months and has made the following estimates:
Existing Proposed Credit Policy 1 month 2 months 3 months Increase in sales - 15% 30% % of Bad Debts 1% 3% 5%
There will be increase in fixed cost by Rs. 50,000 on account of increase of sales beyond 25% of present level.
The company plans on a pre-tax return of 20% on investment in receivables.
You are required to calculate the most paying credit policy for the company.
(Final-May 1996) (20 marks)
Answer
H Ltd.
Evaluation of Credit Policy

Present Policy
Proposed Policy
1 month 2 months 3 months A. Sales (Units) 10,000 11,500 13,000 B. Sales income 30,00,000 34,50,000 39,00,000 Variable cost at Rs. 200 per unit 20,00,000 23,00,000 26,00,000 Contribution 10,00,000 11,50,000 13,00,000 Fixed Costs 3,00,000 3,00,000 3,50,000 C. Net Margin 7,00,000 8,50,000 9,50,000 D. Investment in receivables
(see Working notes) 1,91,666 4,33,333 7,37,500
E. Expected Return on receivables at 20% 38,333 86,666 1,47,500 F. Bad Debts 30,000 1,03,500 1,95,000 G. Net Profit
(C–E–F) 6,31,667 6,59,834 6,07,500
H. Increase in profits - 28,167 (-) 52,334 As 2 months credit policy yield higher return, it should be adopted. Working Notes:
Calculation showing investments in receivables:
Formula = credit. months of No.12
Cost Fixed Cost Variable ×+
Investment
1,91,666112
23,00,000 : month 1 =×
2 months : 333,33,4212
26,00,000 =×
500,37,7312
29,50,000 months 3 =×=
Question 15
The present credit terms of P Company are 1/10 net 30. Its annual sales are Rs. 80 lakhs, its average collection period is 20 days. Its variable cost and average total costs to sales are 0.85 and 0.95 respectively and its cost of capital is 10 per cent. The proportion of sales on which customers currently take discount is 0.5. P company is considering relaxing its discount terms to 2/10 net 30. Such relaxation is expected to increase sales by Rs. 5 lakhs, reduce the

average collection period to 14 days and increase the proportion of discount sales to 0.8. What will be the effect of relaxing the discount policy on company’s profit? Take year as 360 days. (Final-May 1998) (5 marks)
Answer
Evaluation of effect of relaxing the discount policy on company’s profit
A. Incremental Revenue Rs.
Increase in contribution (Rs. 5,00,000 × 15%) 75,000
Reduction in investment in receivable × cost of capital
Present: 4,22,222 Rs. days 360
days 20 0.95 lacs 80 Rs.=
××
Proposed: 3,12,083 Rs. days 360
days 14 0.85) lacs 5 Rs. 0.95 lacs 80 (Rs.=
××+×
Reduction in investment in receivable Rs. 1,10,139 (Rs.4,22,222 – Rs. 3,12,083)
Cost of savings on investment in receivable (Rs. 1,10,139 × 10%) 11,014
86,014
B. Incremental Cost
Increase in discount
Present: (Rs. 80 lacs × 1% × 0 .5) = Rs. 40,000 Proposed : (Rs. 85 lacs × 2% × 0.8) = Rs. 1,36,000 Net increase in discount = Rs. 96,000 C. Net effect on profits (A–B) = Rs. 86,014 – Rs. 96,000 = (–) Rs. 9,986
Since, the proposed discount policy will reduce the profits of the company to the extent of Rs. 9,986. Therefore, it is not advisable for the company to relax the present discount policy.
Question 16
Radiance Garments Ltd. manufacturers readymade garments and sells them on credit basis through a network of dealers. Its present sale is Rs. 60 lakh per annum with 20 days credit period. The company is contemplating an increase in the credit period with a view to increasing sales. Present variable costs are 70% of sales and the total fixed costs Rs. 8 lakh

per annum. The company expects pre-tax return on investment @ 25%. Some other details are given as under:
Proposed Credit Policy Average Collection Period (days)
Expected Annual Sales (Rs. Lakh)
I 30 65 II 40 70 III 50 74 IV 60 75
Required: Which credit policy should the company adopt? Present your answer in a tabular form. Assume 360-days a year. Calculations should be made upto two digits after decimal.
(Final-Nov. 1999) (10 marks)
Answer
Statement showing Evaluation of the Proposed Credit Policies
(Amount Rs. In Lakhs)
Credit policies Proposed Present I II III IV Average Collection Period (days)
(20 days) (30 days) (40 days) (50 days) (60 days)
Sales (Annual) 60.00 65.00 70.00 74.00 75.00 Less: Variable cost (70% of sales)
42.00 45.50 49.00 51.80 52.50
Contribution 18.00 19.50 21.00 22.20 22.50 Less: Fixed Costs 8.00 8.00 8.00 8.00 8.00 Profit 10.00 11.50 13.00 14.20 14.50 Increase in profit compared to present profit: (A)
- 1.50 3.00 4.20 4.50
Investments in debtors 50.00 53.50 57.00 59.80 60.50 (Variable cost+ Fixed cost)
Debtors turnover 18 12 9 7.2 6 (360 days/Average collection period)
Average investment in debtors
2.78 4.46 6.33 8.3 10.08
(Investment in debtors/ Debtors turnover)

Additional investment in debtors compared to present level
- 1.68 3.55 5.52 7.30
Required return on additional investment (25%) : (B)
- 0.42 0.89 1.38 1.83
Incremental profit: (A)–(B) - 1.08 2.11 2.82 2.67
Decision: The company should adopt the credit policy III (with collection period of 50 days) as it yields a maximum profit to the company.
Question 17
A bank is analysing the receivables of Jackson Company in order to identify acceptable collateral for a short-term loan. The company’s credit policy is 2/10 net 30. The bank lends 80 percent on accounts where customers are not currently overdue and where the average payment period does not exceed 10 days past the net period. A schedule of Jackson’s receivables has been prepared. How much will the bank lend on pledge of receivables, if the bank uses a 10 per cent allowance for cash discount and returns?
Account Amount Rs.
Days Outstanding in days
Average Payment Period historically
74 25,000 15 20 91 9,000 45 60 107 11,500 22 24 108 2,300 9 10 114 18,000 50 45 116 29,000 16 10 123 14,000 27 48
1,08,800 (Final-Nov. 2000) (10 marks)
Answer
Analysis of the receivables of Jackson Company by the bank in order to identify acceptable collateral for a short-term loan:
(i) The Jackson Company’s credit policy is 2/10 net 30.
The bank lends 80 per cent on accounts where customers are not currently overdue and where the average payment period does not exceed 10 days past the net period i.e. thirty days. From the schedule of receivables of Jackson Company Account No. 91 and Account No. 114 are currently overdue and for Account No. 123 the average payment

period exceeds 40 days. Hence Account Nos. 91, 114 and 123 are eliminated. Therefore, the selected Accounts are Account Nos. 74, 107, 108 and 116.
(ii) Statement showing the calculation of the amount which the bank will lend on a pledge of receivables if the bank uses a 10 per cent allowances for cash discount and returns Account No. Amount (Rs.) 90 per cent of
amount (Rs.) 80% of amount (Rs.)
(a) (b)=90% of (a) (c)=80% of (b)
74 25,000 22,500 18,000 107 11,500 10,350 8280 108 2,300 2,070 1,656 116 29,000 26,100 20,880
Total loan amount 48,816
Question 18
The credit manager of XYZ Ltd. is reappraising the company’s credit policy. The company sells the products on terms of net 30. Cost of goods sold is 85% of sales and fixed costs are further 5% of sales. XYZ classifies its customers on a scale of 1 to 4. During the past five years, the experience was as under:
Classification Default as a percentage of sales
Average collection period- in days for non-defaulting
accounts 1 0 45 2 2 42 3 10 40 4 20 80
The average rate of interest is 15%. What conclusions do you draw about the company’s Credit Policy? What other factors should be taken into account before changing the present policy? Discuss.(Final-May 2001) (6 marks)
Answer
Since the amount of revenue generated from each category of customer is not given in the question. Let us consider Rs. 100 as the amount of revenue generated from each type of customer. Therefore, Rs. 100 shall be taken as the basis for reappraisal of Company’s credit policy.
Classification Gross profit @
15%*
Bed debts (Rs.)
Interest Cost
(Refer to
Total Cost (Rs.)
Net effect (Rs.)
Strategy

(Rs.) Working note)(Rs.)
(i) (ii) (iii) (iv)=(ii)+(iii) (v)=(i)-(iv) 1 15 Nil 1.57 1.57 13.43 Accept 2 15 2 1.47 3.47 11.53 Accept 3 15 10 1.40 11.40 3.60 Accept 4 15 20 2.80 22.80 (7.80) Reject
*It is given the cost of goods sold is 85%. Therefore Gross Profit is 15% of sales.
The reappraisal of company’s credit policy indicates that the company either follows a lenient credit policy or it is inefficient in collection of debts. Even though the company sells its products on terms of net 30 days, it allows average collection period for more than 30 to all categories of its customers. The net effect i.e. Gross Profit less Total Cost is favourable in respect of categories 1, 2 and 3 therefore these customers shall be taken into fold. For the customers covered in category 4 the net effect is unfavourable i.e. total cost is more than the gross profit. The company should try to reduce bad debt % for this category of customers at least by 7.8% (i.e. at 12.20%). If the company is able to do so, the company can allow the credit period of 80 days for at least increasing the market share.
The other factors to be taken into consideration before changing the present policy includes (i) past performance of the customers and (ii) their credit worthiness.
The information so required may be outsourced as well as insourced.
Working Note:
Computation of interest cost
Interest Cost=
For Category 1= days 365
days 45 85 Rs. 15% ×× = Rs. 1.57
For Category 2= days 365
days 42 85 Rs. 15% ×× = Rs. 1.47
For Category 3 =days 365
days 40 85 Rs. 15% ×× = Rs. 1.40
For Category 4 = days 365
days 80 85 Rs.15% ×× = Rs. 2.80
Question 19
Average rate of interest × Cost of goods sold × Average collection period in days for non-defaulting accounts
365 days

A company has prepared the following projections for a year:
Sales 21,000 units
Selling Price per unit Rs.40
Variable Costs per unit Rs.25
Total Costs per unit Rs.35
Credit period allowed One month
The Company proposes to increase the credit period allowed to its customers from one month to two months. It is envisaged that the change in the policy as above will increase the sales by 8%. The company desires a return of 25% on its investment.
You are required to examine and advise whether the proposed Credit Policy should be implemented or not. (PE-II-Nov. 2002) (4 marks)
Answer
Computation of contribution and extra funds blockage if the credit period allowed to customers is increased from one month to two months
Increase in sales units 1,680 (8% × 21,000 units ) Contribution per unit (Rs.) 15 Total contribution on 25,200 increased sales units (Rs.) : (A) (Rs.1,680 units × Rs.15 ) Total cost (Rs.) 7,35,000 21,000 units × Rs.35 Additional variable cost of 1,680 units (Rs.) 42,000 (1,680 units × Rs.25) Total cost (Rs.) 7,77,000 Funds blocked for 2 months (Rs.) 1,29,500 (Rs.7,77,000 /12 months)× 2 month Less: Present blockage of funds for 1 month (Rs.) 61,250 (Rs.7,35,000 / 12 months) × 1 month Extra blockage of funds (Rs.)
due to change in credit policy 68,250
100
blockage funds Extrasales increased on onContributi
) (
Return ×=policycreditinchangetodue

= 100250,68 .Rs200,25 Rs.
× = 36.92%
Advise: The return due to a change in the credit policy comes to 36.92%, which is more than the desired return of 25%. Hence, the proposal of increasing the credit period from one month to two months should be accepted.
Question 20
A firm has a current sales of Rs.2,56,48,750. The firm has unutilised capacity. In order to boost its sales, it is considering the relaxation in its credit policy. The proposed terms of credit will be 60 days credit against the present policy of 45 days. As a result, the bad debts will increase from 1.5% to 2% of sales. The firm’s sales are expected to increase by 10%. The variable operating costs are 72% of the sales. The Firm’s Corporate tax rate is 35%, and it requires an after-tax return of 15% on its investment. Should the firm change its credit period?
(PE-II-Nov. 2003) (6 marks)
Answer
Computation of after-tax operating profits:
Rs.
Sales increase 25, 64, 875
(10% of Rs. 2, 56, 48, 750)
Contribution margin 7,18,165
28% of Rs.25,64,875
Less: Bad debt + losses (1,79,542)
1.5% × Rs.2,56,48,750 = Rs.3,84,731
2% × Rs.2,82,13,625 = Rs.5,64,273
Operating profits 5,38,623
Operating profits after tax (OPAT) 3,50,105
0.65 × Rs.5,38,623
Increase in receivable investment
Increase in receivable Investment = 0 ACP 360
0Sales n ACP
360nSales
×−×
= days 45 days 360
,750Rs.2,56,48 days 60
days 36025.2,82,13,6 Rs ×−×
= Rs.(47,02,271 − 32,06,094)
= Rs.14,96,177
Expected rate of return = investment receivable in Increase
tax after profits Operating
= Rs.3,50,105 /Rs.14,96,177 = 23.40%
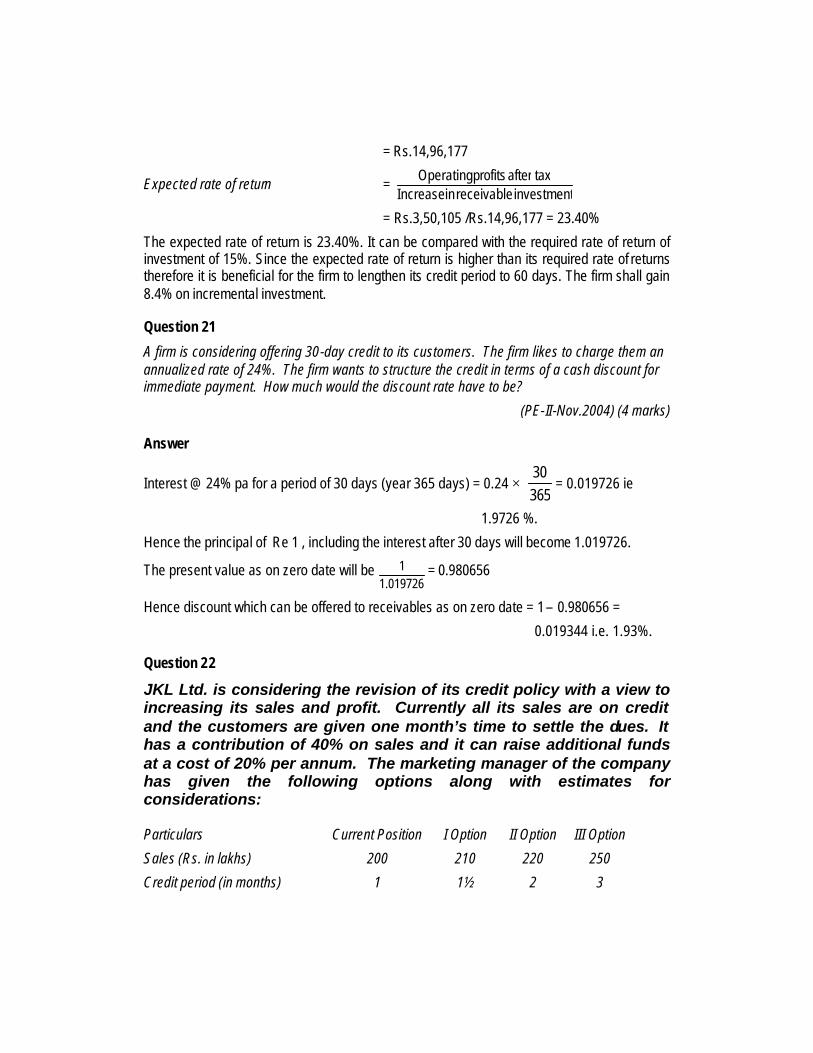
The expected rate of return is 23.40%. It can be compared with the required rate of return of investment of 15%. Since the expected rate of return is higher than its required rate of returns therefore it is beneficial for the firm to lengthen its credit period to 60 days. The firm shall gain 8.4% on incremental investment.
Question 21
A firm is considering offering 30-day credit to its customers. The firm likes to charge them an annualized rate of 24%. The firm wants to structure the credit in terms of a cash discount for immediate payment. How much would the discount rate have to be?
(PE-II-Nov.2004) (4 marks)
Answer
Interest @ 24% pa for a period of 30 days (year 365 days) = 0.24 × 36530
= 0.019726 ie
1.9726 %.
Hence the principal of Re 1 , including the interest after 30 days will become 1.019726.
The present value as on zero date will be 019726.1
1 = 0.980656
Hence discount which can be offered to receivables as on zero date = 1 – 0.980656 =
0.019344 i.e. 1.93%.
Question 22
JKL Ltd. is considering the revision of its credit policy with a view to increasing its sales and profit. Currently all its sales are on credit and the customers are given one month’s time to settle the dues. It has a contribution of 40% on sales and it can raise additional funds at a cost of 20% per annum. The marketing manager of the company has given the following options along with estimates for considerations: Particulars Current Position I Option II Option III Option
Sales (Rs. in lakhs) 200 210 220 250
Credit period (in months) 1 1½ 2 3

Bad debts (% of sales) 2 2½ 3 5
Cost of Credit administration
(Rs. in lakhs)
1.20
1.30
1.50
3.00
You are required to advise the company for the best option. (PE-II-May 2007) (8 marks)
Answer
Evaluation of the Different Options in Credit Policy of JKL Ltd.
(Rs. in lakhs)
Credit period 1 month Current position
1.5 months Option I
2 months Option II
3 months Option III
Sales 200 210 220 250
Contribution @ 40% 80 84 88 100
Increase in contribution over current level
− 4 8 20 (A)
Debtors =
67.16122001
=×
25.12612
2105.1=
×
67.36122202
=×
50.62122503
=×
Increase in debtors over current level
− 9.58 20.00 45.83
Cost of funds for additional amount of debtors @ 20%
− 1.92 4.00 9.17 (B)
Credit administrative cost 1.20 1.30 1.50 3.00
Increase in credit administration cost over present level
−
0.10
0.30
1.80 (C)
Bad debts 4.00 5.25 6.60 12.50
Increase in bad debts over current levels
− 1.25 2.60 8.50 (D)
Net gain/loss A – (B + C + D) − 0.73 1.10 0.53
Advise: It is suggested that the company JKL Ltd. should implement Option II which has a credit period of 2 months. Question 23
A Company has sales of Rs. 25,00,000. Average collection period is 50 days, bad debt losses are 5% of sales and collection expenses are Rs. 25,000. The cost of funds is 15%. The Company has two alternative Collection Programmes:
12
Sales Credit Period Collection Average ×

Programme I Programme II
Average Collection Period reduced to 40 days 30 days
Bad debt losses reduced to 4% of sales 3% of sales
Collection Expenses Rs. 50,000 Rs. 80,000
Evaluate which Programme is viable. (P.E.-II-May 2006)(6 marks)
Answer
(a) Evaluation of Alternative Collection Programmes
Present Programme 1st Programme 2nd Programme
Rs. Rs. Rs.
Sales revenues 25,00,000 25,00,000 25,00,000
Average collection period (days) 50 40 30
Receivables (Rs.) 3,42,466
×
365
50 25,00,000
2,73,973 2,05,479
Reduction in receivables from present level (Rs.)
-
68,493
1,36,987
Savings in interest @ 15% p.a. (A)
- Rs. 10,274 Rs. 20,548
% of bad debt loss 5% 4% 3%
Amount (Rs.) 1,25,000 1,00,000 75,000
Reduction in bad debts from present level (B)
-
25,000
50,000
Incremental benefits from present level (C) = (A) + (B)
-
35,274
Rs. 70,548
Collection expenses (Rs.) 25,000 50,000 80,000
Incremental collection expenses from present level (D)
-
25,000
55,000
Increment net benefit (C – D) - Rs. 10,274 Rs. 15,548
Conclusion: From the analysis it is apparent that Programme I has a benefit of Rs. 10,274 and Programme II has a benefit of Rs. 15,548 over present level. Whereas Programme II has

a benefit of Rs. 5,274 more than Programme I. Thus, benefits accrue at a diminishing rate and hence Programme II is more viable.
Note: In the above solution, 1 year = 365 days has been assumed. Alternatively, some candidates may give the solution on the basis 1 year = 360 days. In that case, the figures calculated for the different Programmes would be different from the figures given in the above solution. But the final conclusion regarding viability of the Programme would remain the same. The candidates may be given due credit.
Question 24
The annual cash requirement of A Ltd. is Rs. 10 Lakhs. The company has marketable securities in lot sizes of Rs. 50,000, Rs. 1,00,000, Rs. 2,00,000, Rs. 2,50,000 and Rs. 5,00,000. Cost of conversion of marketable securities per lot is Rs. 1,000. The company can earn 5% annual yield on its securities.
You are required to prepare a table indicating which lot size will have to be sold by the company.
Also show that the economic lot size can be obtained by the Baumal Model.
(Final- Nov. 1996) (14 marks)
Answer
Table indicating lot size of securities
Total annual cash requirements =T= Rs. 10,00,000
Lot Size (Rs.) =C 50,000 1,00,000 2,00,000 2,50,000 5,00,000 Number of Lots (T/C) 20 10 5 4 2 Conversion Cost (Rs.)=(T/C) b Where b = cost of conversion per lot.
20,000 10,000 5,000 4,000 2,000
Interest charges Rs. =(C/2)I 1,250 2,500 5,000 6,250 12,500 Total Cost Rs.= 21,250 12,500 10,000 10,250 14,500
Economic lot size is Rs. 2,00,000 at which total costs are minimum.
William J. Baumal Model: Cash management model of William J. Baumal assumes that the concerned company keeps all its cash on interest yielding deposits form which it withdraws as and when required. It also assumes that cash usage is linear over time. The amount of money is withdrawn from deposits in such a way that the cost of withdrawal are optimally balanced with those of interest foregone by holding cash. The model is almost same as economic stock order quantity model.
Formula Economic lot size = ITb2×

Where T= Projected cash requirement = Rs. 10,00,000
b= Conversion cost per lot = Rs. 1000
I= Interest earned on marketable securities per annum. = 5%
By substituting the figures in the formula
Economic lot size =0.05
100010,00,0002 ××
= Rs. 2,00,000
Question 25
(a) The following details are available in respect of a firm:
(i) Annual requirement of inventory 40,000 units
(ii) Cost per unit (other than carrying and ordering cost) Rs. 16
(iii) Carrying cost are likely to be 15% per year
(iv) Cost of placing order Rs. 480 per order.
Determine the economic ordering quantity.
(b) The experience of the firm being out of stock is summarised below:
(1) Stock out (No. of units) No. of times
500 1 (1) 400 2 (2) 250 3 (3) 100 4 (4)
50 10 (10) 0 80 (80)
Figures in brackets indicate percentage of time the firm has been out of stock.
(2) Stock out costs are Rs. 40 per unit.
(3) Carrying cost of inventory per unit is Rs. 20
Determine the optimal level of stock out inventory.
(c) A firm has 5 different levels in its inventory. The relevant details are given. Suggest a breakdown of the items into A, B and C classifications:
Item No. Avg. No. of units inventory Avg. Cost per unit 1 20,000 Rs. 60 2 10,000 Rs. 100 3 32,000 Rs. 11 4 28,000 Rs. 10

5 60,000 Rs. 3.40 (Final-Nov.1997) (6 + 8 + 6 marks)
Answer
(a) Carrying cost per unit per annum
= cost per unit × carrying cost % p.a.
= Rs. 16 × 0.15 =Rs. 2.40
Now from the formula for Economic Order Quantity (EOQ)
= unit percost Carrying
order percost ordering p.a. nconsumptio total 2 ××
= units 40002.40
48040,0002=
××
Alternative working:
Ordering size (units) 1,000 2,000 2,500 4,000 5,000 8,000 10,000 No. of orders required 40 20 16 10 8 5 4 Average inventory (units) 500 1,000 1,250 2,000 2,500 4,000 5,000 Total carrying cost of Average inventory in Rs.
1,200 2,400 3,000 4,800 6,000 9,600 12,000
Total ordering cost = No. of orders × Cost of placing each order
19,200 9,600 7,680 4,800 3,840 2,400 1,920
Total cost in Rs. 20,400 12,000 10,680 9,600 9,840 12,000 13,920
Hence least cost of Rs. 9,600 is at the ordering size of 4,000 units.
(b)
Safety stock level (units)
Stock out (units)
Stock out cost @ Rs. 40 per unit
Rs.
Probability of stock out
Expected stock out at
this level
Total expected stock out
cost 500 0 0 0 0 0 400 100 4000 0.01 40 40 250 250 10,000 0.01 100
150 6000 0.02 120 260 100 400 16,000 0.01 160
300 12,000 0.02 240

150 6,000 0.03 180 840 50 450 18,000 0.01 180
350 14,000 0.02 280 200 8,000 0.03 240 50 2,000 0.04 80 1,620
0 500 20,000 0.01 200 400 16,000 0.02 320 250 10,000 0.03 300 100 4,000 0.04 160 50 2,000 0.10 200 2,800
Safety stock level (units)
Expected stock out costs
Carrying cost at Rs. 20 per unit
Rs.
Total safety stock cost
0 2,800 0 2,800 50 1,620 1,000 2,620
100 840 2,000 2,840 250 260 5,000 5,260 400 40 8,000 8,040 500 0 10,000 10,000
Optimum safety stock where the total cost is the least is at 50 units level.
(c)
Item No. Units % of total Units
Unit cost Rs.
Total cost Rs.
% of total cost
1 20,000 13.3 60.00 12,00,000
39.5] A
2 10,000 6.7 100.00 10,00,000
32.9]
3 32,000 21.3 11.00 3,52,000 11.6] B 4 28,000 18.7 10.00 2,80,000 9.2] 5 60,000 40.0 3.40 2,04,000 6.8
1,50,000 100.0 30,36,000
100.0
Item Nos. I and II being very valuable are to be controlled first though in quantity are hardly 20% of the total, hence can be classified as A. Next priority is for items 3 and 4, though quantity wise 40% to be classified as B and last priority item 5 though in quantity bulk but value is less hence to be classified as C.
Question 26

A Ltd uses inventory turnover as one performance measure to evaluate its production manager. Currently, its inventory turnover (based on cost of goods sold ÷inventory) is 10 times per annum, as compared with industry average of 4. Average sales are Rs. 4,50,000 p.a. variable costs of inventory have consistently remained at 70% of sales with fixed costs of Rs. 10,000. Carrying costs of inventory (excluding financing costs) are 5% per annum. Sales force complained that low inventory levels are resulting in lost-sales due to stock outs. Sales manager has made an estimate based on stock out reports as under:
Inventory Policy Inventory Turnover Sales in Rs. Current 10 4,50,000
A 8 5,00,000 B 6 5,40,000 C 4 5,65,000
On the basis of above estimates, assuming a 40% tax rate and an after tax required return of 20% on investment in inventory, which policy would you recommend?
(Final-May 2002) (6 marks)
Answer
Calculation of Cost of Goods Sold
Policy Variable Cost (Rs.) Fixed Cost (Rs.) Total Cost (Rs.)
Current 4,50,000 × .7 = 3,15,000 + 10,000 3,25,000
A 5,00,000 × .7 = 3,50,000 + 10,000 3,60,000
B 5,40,000 × .7 = 3,78,000 + 10,000 3,88,000
C 5,65,000 × .7 = 3,95,500 10,000 4,05,500
Investment Level in Various Policies
(Rs.) Current 3,25,000 ÷10 32,500
A 3,60,000 ÷ 8 45,000 B 3,88,000 ÷ 6 64,667 C 4,05,500 ÷ 4 1,01,375
Evaluation of Inventory Policies
Policy Current Rs.
A Rs.
B Rs.
C Rs.
Sales 4,50,000 5,00,000 5,40,000 5,65,000 Cost of Goods sold 3,25,000 3,60,000 3,88,000 4,05,500 Contribution 1,25,000 1,40,000 1,52,000 1,59,500 Less: Carrying cost @ 5% 1,625 2,250 3,233 5,069 Profit before tax 1,23,375 1,37,750 1,48,767 1,54,431

Incremental Profit (Before tax) 14,375 11,017 5,664 Incremental Profit (After tax) 8,625 6,610 3,398 Incremental Investment 12,500 19,667 36,708
Incremental Rate of Return (%) 69 33.6 9.26 Conclusion: Since the incremental rate of return is highest with inventory policy A, therefore, policy A should be followed.
Question 27
A publishing house purchases 72,000 rims of a special type paper per annum at cost Rs. 90 per rim. Ordering cost per order is Rs. 500 and the carrying cost is 5 per cent per year of the inventory cost. Normal lead time is 20 days and safety stock is NIL. Assume 300 working days in a year: You are required:
(i) Calculate the Economic Order Quantity (E.O.Q).
(ii) Calculate the Reorder Inventory Level.
(iii) If a 1 per cent quantity discount is offered by the supplier for purchases in lots of 18,000 rims or more, should the publishing house accept the proposal?
(PE-II-Nov. 2008) (8 marks)
Answer
(i) 1
0
icSC 2
EOQ=
Where,
S = Annual consumption
C0 = Ordering cost per order
ic1 = Stock carrying cost per unit per annum
90 Rs. of 5%500 72,000 2
××=
01,60,00,00 =
= 4,000 Rims.
(ii) Re-order Level = Normal Lead Time × Normal Usage

= 20 × 240
= 4,800 Rims.

Note:
year a in days workingNormal
usage Annual Usage Normal =
300
72,000 = = 240 Rims.
(iii) Evaluation of Quantity Discount Offer:
EOQ Discount Offer
Size of order 4,000 Rims 18,000 Rims No. of orders in a year 18 4
Average inventory
2size Order
2,000 Rims 9,000 Rims
Cost: Rs. Rs.
Ordering Cost @ Rs. 500 per order 9,000 2,000
Inventory carrying cost
At EOQ – (4,000/2) × Rs. 4.5
At Discount offer – (18,000/2) × Rs. 4.455
9,000
-
-
40,095
Purchases Cost
At EOQ – 72,000 × Rs. 90
64,80,000
−
At discount offer – 72,000 × Rs. 89.10 ________ 64,15,200
Total Cost 64,98,000 64,57,295
The total cost is less in case of quantity discount offer. Hence, quantity discount offer should be accepted.
Question 28
A Ltd. has a total sales of Rs. 3.2 crores and its average collection period is 90 days. The past experience indicates that bad-debt losses are 1.5% on sales. The expenditure incurred by the firm in administering its receivable collection efforts are Rs. 5,00,000. A factor is prepared to buy the firm’s receivables by charging 2% commission. The factor will pay advance on receivables to the firm at an interest rate of 18% p.a. after withholding 10% as reserve.
Calculate the effective cost of factoring to the Firm. (Final-May 2002) (6 marks)
Answer
Average level of Receivables = 3,20,00,000 × 90/360 80,00,000

Factoring commission = 80,00,000 × 2/100 1,60,000
Factoring reserve = 80,00,000 × 10/100 8,00,000
Amount available for advance=Rs. 80,00,000-(1,60,000+8,00,000) 70,40,000
Factor will deduct his interest @ 18% :-
Interest =
= Rs. 3,16,800
Advance to be paid = Rs. 70,40,000 – Rs. 3,16,800 = Rs. 67,23,200
Annual Cost of Factoring to the Firm: Rs. Factoring commission (Rs. 1,60,000 × 360/90) 6,40,000 Interest charges (Rs. 3,16,800 × 360/90) 12,67,200
Total 19,07,200 Firm’s Savings on taking Factoring Service: Rs. Cost of credit administration saved 5,00,000 Cost of Bad Debts (Rs. 3,20,00,000 x 1.5/100) avoided 4,80,000
Total 9,80,000 Net Cost to the firm (Rs. 19,07,200 – Rs. 9,80,000) 9,27,200 Effective rate of interest to the firm=
13.79%*
Note: The number of days in a year have been assumed to be 360 days.
Question 29
Briefly explain the meaning and importance of ‘Credit-rating’. (Final-May 2002) (4 marks)
Answer
Credit-rating essentially reflects the probability of timely repayment of principal and interest by a borrower company. It indicates the risk involved in a debt instrument as well its qualities. Higher the credit rating, greater is the probability that the borrower will make timely payment of principal and interest and vice-versa.
It has assumed an important place in the modern and developed financial markets. It is a boon to the companies as well as investors. It facilitates the company in raising funds in the capital market and helps the investor to select their risk-return trade off. By indicating creditworthiness of a borrower, it helps the investor in arriving at a correct and rational decision about making investments.
Credit rating system plays a vital role in investor protection. Fair and good credit ratings motivate the public to invest their savings.
Rs. 70,40,000 × 18 × 90
100 × 360
Rs. 9,27,200 × 100
67,23,200

As a fee based financial advisory service, credit rating is obviously extremely useful to the investors, the corporates (borrowers) and banks and financial institutions. To the investors, it is an indicator expressing the underlying credit quality of a (debt) issue programme. The investor is fully informed about the company as any effect of changes in business/economic conditions on the company is evaluated and published regularly by the rating agencies. The corporate borrowers can raise funds at a cheaper rate with good rating. It minimizes the role of the ‘name recognition’ and less known companies can also approach the market on the basis of their rating. The fund ratings are useful to the banks and other financial institutions while deciding lending and investment strategies.
Question 30
Enumerate the activities which are covered by Treasury Management.
(PE-II-Nov. 2002) (3 marks)
Answer
Treasury Management is concerned about the efficient management of liquidity and financial risk in business. Main activities which are covered by Treasury Management are as follows:
(i) Cash management: Treasury management in a business organisation is concerned about the efficient collection and repayment of cash to both insiders and to third parties.
(ii) Currency management: It manages the foreign currency risk, exchange rate risks etc. It may advise on the currency to be used when invoicing overseas sales.
(iii) Funding management: Responsible for planning and sourcing firm’s short, medium and long term cash needs. It participates in capital structure, forecasting of future interest and foreign currency rates decision-making process.
(iv) Banking: Maintains good relations with bankers and carry out initial negotiations with them for any short term loan.
(v) Corporate finance: It advises on aspects of corporate finance including capital structure, mergers and acquisitions.
Question 31
Explain the ‘Aging Schedule’ in the context of monitoring of receivables.
(PE-II-Nov. 2004) (3 marks)
Answer
Ageing Schedule : An important means to get an insight into collection pattern of debtors is the preparation of their ‘Ageing Schedule’. Receivables are classified according to their age from the date of invoicing e.g. 0 – 30 days, 31 – 60 days , 61 – 90 days, 91 – 120 days and more. The ageing schedule can be compared with earlier month’s figures or the corresponding month of the earlier year.

This classification helps the firm in its collection efforts and enables management to have a close control over the quality of individual accounts. The ageing schedule can be compared with other firms also.
Question 32
Discuss Miller-Orr Cash Management model. (P.E-II-Nov. 2005 & Nov. 2007) (3 marks)
Answer
Miller – Orr Cash Management Model
According to this model the net cash flow is completely stochastic. When changes in cash balance occur randomly, the application of control theory serves a useful purpose. The Miller – Orr model is one of such control limit models. This model is designed to determine the time and size of transfers between an investment account and cash account. In this model control limits are set for cash balances. These limits may consist of ‘h’ as upper limit, ‘z’ as the return point and zero as the lower limit.
When the cash balance reaches the upper limit, the transfer of cash equal to ‘h – z’ is invested in marketable securities account. When it touches the lower limit, a transfer from marketable securities account to cash account is made. During the period when cash balance stays between (h, z) and (z, 0) i.e. high and low limits, no transactions between cash and marketable securities account is made. The high and low limits of cash balance are set up on the basis of fixed cost associated with the securities transaction, the opportunities cost of holding cash and degree of likely fluctuations in cash balances. These limits satisfy the

demands for cash at the lowest possible total costs. The formula for calculation of the spread between the control limits is:
Spread = 3/1
rateInterest Cashflows of VarianceCost nTransactio3/4
3
××
And, the return point can be calculated using the formula:
Return point = Lower limit + 3
Spread
Question 33
Explain Baumol’s Model of Cash Management.(PE-II-May 2008) (4 marks) Answer
William J. Baumol developed a model for optimum cash balance which is normally used in inventory management. The optimum cash balance is the trade-off between cost of holding cash (opportunity cost of cash held) and the transaction cost (i.e. cost of converting marketable securities in to cash). Optimum cash balance is reached at a point where the two opposing costs are equal and where the total cost is minimum. This can be explained with the following diagram:
Transaction Cost
Holding CostCost(Rs.)
Total Cost
Optimum Cash Balance
The optimum cash balance can also be computed algebraically.
Optimum Cash Balance = H AT2
A = Annual Cash disbursements T = Transaction cost (Fixed cost) per transaction

H = Opportunity cost one rupee per annum (Holding cost) The model is based on the following assumptions: (i) Cash needs of the firm are known with certainty.
(ii) The cash is used uniformly over a period of time and it is also known with certainty.
(iii) The holding cost is known and it is constant.
(iv) The transaction cost also remains constant.
Question 34
Discuss the meaning and features of ‘Commercial paper’. (PE-II- May 2008)(4marks) Answer
Commercial Paper and its Features
CP is a short term usance promissory note issued by a company, negotiable by endorsement and delivery, issued at such a discount on face value as may be determined by the issuing company. It is a money market instrument issued by highly rated corporate borrowers for meeting their working capital requirements. In India corporate borrowers were allowed to issue CP since January, 1990. The main features of CP are: (i) CP is a short term money market instrument with fixed maturity value.
(ii) It is a certificate evidencing an unsecured corporate debt of short term maturity.
(iii) It is generally issued at discount to face value but it can also be issued in interest bearing form.
(iv) CPs can be directly issued by a company to investors or through banks.
(v) It is an unsecured instrument.
Question 35
Discuss the factors to be taken into consideration while determining the requirement of working capital. (PE-II- Nov. 2008) (4 marks) Answer
Factors to be taken into consideration while determining the requirement of working capital: (i) Production Policies (ii) Nature of the business
(iii) Credit policy (iv) Inventory policy
(v) Abnormal factors (vi) Market conditions
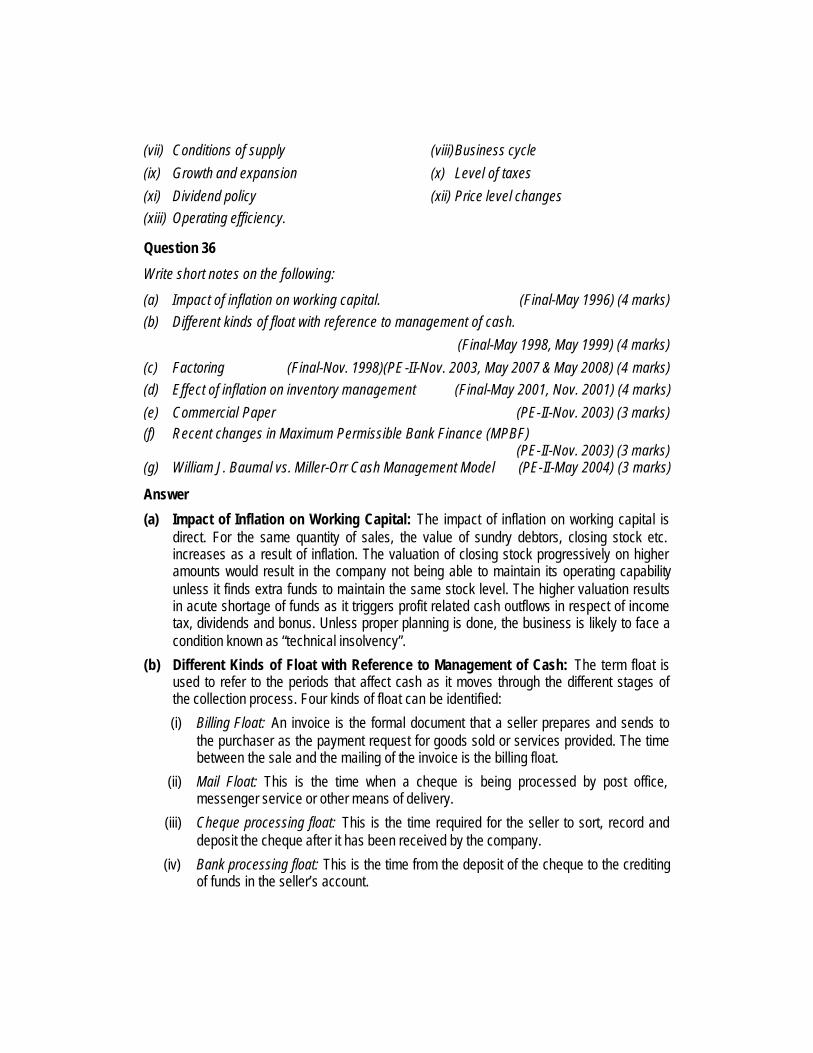
(vii) Conditions of supply (viii)Business cycle
(ix) Growth and expansion (x) Level of taxes
(xi) Dividend policy (xii) Price level changes (xiii) Operating efficiency.
Question 36
Write short notes on the following:
(a) Impact of inflation on working capital. (Final-May 1996) (4 marks) (b) Different kinds of float with reference to management of cash.
(Final-May 1998, May 1999) (4 marks)
(c) Factoring (Final-Nov. 1998)(PE-II-Nov. 2003, May 2007 & May 2008) (4 marks) (d) Effect of inflation on inventory management (Final-May 2001, Nov. 2001) (4 marks)
(e) Commercial Paper (PE-II-Nov. 2003) (3 marks) (f) Recent changes in Maximum Permissible Bank Finance (MPBF) (PE-II-Nov. 2003) (3 marks) (g) William J. Baumal vs. Miller-Orr Cash Management Model (PE-II-May 2004) (3 marks)
Answer
(a) Impact of Inflation on Working Capital: The impact of inflation on working capital is direct. For the same quantity of sales, the value of sundry debtors, closing stock etc. increases as a result of inflation. The valuation of closing stock progressively on higher amounts would result in the company not being able to maintain its operating capability unless it finds extra funds to maintain the same stock level. The higher valuation results in acute shortage of funds as it triggers profit related cash outflows in respect of income tax, dividends and bonus. Unless proper planning is done, the business is likely to face a condition known as “technical insolvency”.
(b) Different Kinds of Float with Reference to Management of Cash: The term float is used to refer to the periods that affect cash as it moves through the different stages of the collection process. Four kinds of float can be identified:
(i) Billing Float: An invoice is the formal document that a seller prepares and sends to the purchaser as the payment request for goods sold or services provided. The time between the sale and the mailing of the invoice is the billing float.
(ii) Mail Float: This is the time when a cheque is being processed by post office, messenger service or other means of delivery.
(iii) Cheque processing float: This is the time required for the seller to sort, record and deposit the cheque after it has been received by the company.
(iv) Bank processing float: This is the time from the deposit of the cheque to the crediting of funds in the seller’s account.

(c) Factoring: Factoring is a new financial service that is presently being developed in India. Factoring involves provision of specialised services relating to credit investigation, sales ledger management, purchase and collection of debts, credit protection as well as provision of finance against receivables and risk bearing. In factoring, accounts receivables are generally sold to a financial institution (a subsidiary of commercial bank-called “Factor”), who charges commission and bears the credit risks associated with the accounts receivables purchased by it.
Its operation is very simple. Clients enter into an agreement with the “factor” working out a factoring arrangement according to his requirements. The factor then takes the responsibility of monitoring, follow-up, collection and risk-taking and provision of advance. The factor generally fixes up a limit customer-wise for the client (seller).
Factoring offers the following advantages which makes it quite attractive to many firms.
(1) The firm can convert accounts receivables into cash without bothering about repayment.
(2) Factoring ensures a definite pattern of cash in flows.
(3) Continuous factoring virtually eliminates the need for the credit department. That is why receivables financing through factoring is gaining popularly as useful source of financing short-term funds requirements of business enterprises because of the inherent advantage of flexibility it affords to the borrowing firm. The seller firm may continue to finance its receivables on a more or less automatic basis. If sales expand or contract it can vary the financing proportionally.
(4) Unlike an unsecured loan, compensating balances are not required in this case. Another advantage consists of relieving the borrowing firm of substantially credit and collection costs and to a degree from a considerable part of cash management.
However, factoring as a means of financing is comparatively costly source of financing since its cost of financing is higher than the normal lending rates.
(d) Effect on Inflation on Inventory Management: The main objective of inventory management is to determine and maintain the optimum level of investment in inventories. For inventory management a moderate inflation rate say 3% can be ignored but if inflation rate is higher it becomes important to take into consideration the effect of inflation on inventory management. The effect of inflation on goods which the firm stock is relatively constant can be dealt easily, one simply deducts the expected annual rate of inflation from the carrying cost percentage and uses this modified version in the EOQ model to compute the optimum stock. The reason for making this deduction is that inflation causes the value of the inventory to raise, thus offsetting somewhat the effects of depreciation and other carrying cost factors. Since carrying cost will now be smaller, the calculated EOQ and hence the average inventory will increase. However, if rate of inflation is higher the interest rates will also be higher, and this will cause carrying cost to increase and thus lower the EOQ and average inventories.
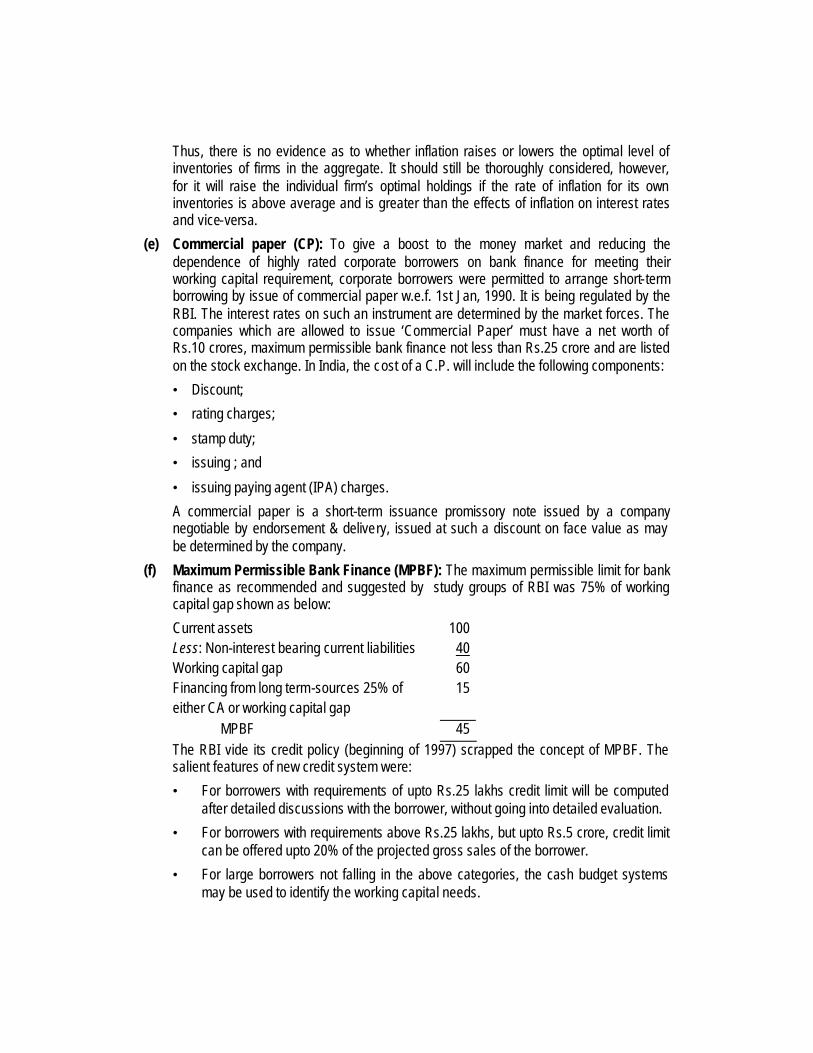
Thus, there is no evidence as to whether inflation raises or lowers the optimal level of inventories of firms in the aggregate. It should still be thoroughly considered, however, for it will raise the individual firm’s optimal holdings if the rate of inflation for its own inventories is above average and is greater than the effects of inflation on interest rates and vice-versa.
(e) Commercial paper (CP): To give a boost to the money market and reducing the dependence of highly rated corporate borrowers on bank finance for meeting their working capital requirement, corporate borrowers were permitted to arrange short-term borrowing by issue of commercial paper w.e.f. 1st Jan, 1990. It is being regulated by the RBI. The interest rates on such an instrument are determined by the market forces. The companies which are allowed to issue ‘Commercial Paper’ must have a net worth of Rs.10 crores, maximum permissible bank finance not less than Rs.25 crore and are listed on the stock exchange. In India, the cost of a C.P. will include the following components:
• Discount;
• rating charges;
• stamp duty;
• issuing ; and
• issuing paying agent (IPA) charges.
A commercial paper is a short-term issuance promissory note issued by a company negotiable by endorsement & delivery, issued at such a discount on face value as may be determined by the company.
(f) Maximum Permissible Bank Finance (MPBF): The maximum permissible limit for bank finance as recommended and suggested by study groups of RBI was 75% of working capital gap shown as below:
Current assets 100 Less: Non-interest bearing current liabilities 40 Working capital gap 60 Financing from long term-sources 25% of 15 either CA or working capital gap MPBF 45 The RBI vide its credit policy (beginning of 1997) scrapped the concept of MPBF. The salient features of new credit system were:
• For borrowers with requirements of upto Rs.25 lakhs credit limit will be computed after detailed discussions with the borrower, without going into detailed evaluation.
• For borrowers with requirements above Rs.25 lakhs, but upto Rs.5 crore, credit limit can be offered upto 20% of the projected gross sales of the borrower.
• For large borrowers not falling in the above categories, the cash budget systems may be used to identify the working capital needs.

(g) William J Baumal vs Miller- Orr Cash Management Model : According to William J Baumal’s Economic order quantity model optimum cash level is that level of cash where the carrying costs and transactions costs are the minimum. The carrying costs refers to the cost of holding cash, namely, the interest foregone on marketable securities. The transaction costs refers to the cost involved in getting the marketable securities converted into cash. This happens when the firm falls short of cash and has to sell the securities resulting in clerical, brokerage, registration and other costs.
The optimim cash balance according to this model will be that point where these two costs are equal. The formula for determining optimum cash balance is :
C = S
PU 2 ×,
Where
C = Optimum cash balance
U = Annual (monthly) cash disbursements
P = Fixed cost per transaction
S = Opportunity cost of one rupee p.a. (or p.m)
Miller-Orr cash management model is a net cash flow stochastic model. This model is designed to determine the time and size of transfers between an investment account and cash account. In this model control limits are set for cash balances. These limits may consist of h as upper limit, z as the return point, and zero as the lower limit.
When the cash balances reach the upper limit, the transfer of cash equal to h-z is invested in marketable securities account. When it touches the lower limit, a transfer from marketable securities account to cash account is made. During the period when cash balance stays between (h,z) and (z, o ) i.e high and low limits no transactions between cash and marketable securities account is made. The high and low limits of cash balance are set up on the basis of fixed cost associated with the securities transactions, the opportunity cost of holding cash and the degree of likely fluctuations in cash balances. These limits satisfy the demands for cash at the lowest possible total costs.

3 Tools of Financial Analysis & Planning
Question 1
The following information is available in respect of ABC Ltd.:
(1) Materials are purchased and received one month before being used and payment is made to suppliers two months after receipt of materials.
(2) Cash is received from customers three months after finished goods are sold and delivered to them.
(3) No time lag applies to payments of wages and expenses.
(4) The following figures apply to recent and future months:
Month Materials received Rs.
Sales Rs.
Wages and Expenses Rs.
January 20,000 30,000 9,500 February 22,000 33,000 10,000 March 24,000 36,000 10,500 April 26,000 39,000 11,000
May 28,000 42,000 11,500 June 30,000 45,000 12,000 July 32,000 48,000 12,500
August 34,000 51,000 13,000
(5) Cash balance at the beginning of April is Rs. 10,000.
(6) All the products are sold immediately they have been made and that materials used and sums spent on wages and expenses during any particular month relate strictly to the sales made during that month.
Prepare cash flow forecast month by month from April to July, profit and loss forecast for four months (April-July) and a movement of funds statement for the four months period (April-July).
(Final-Nov. 1997) (10 marks)

Answer
Cash forecast from April to July Amount in Rs. April May June July Opening Balance 10,000 7,000 4,500 2,500 Collections from debtors 30,000 33,000 36,000 39,000 40,000 40,000 40,500 41,500 Payments: Wages and Expenses 11,000 11,500 12,000 12,500 Payment to suppliers 22,000 24,000 26,000 28,000 33,000 35,500 38,000 40,500 Closing balance 7,000 4,500 2,500 1,000
Profit and Loss forecast for 4 months April-July
Rs. Sales (April to July) 1,74,000 Closing Stock (July Purchase) 32,000 2,06,000 Less: Opening stock- (March purchase) 24,000
Purchases (April to July) 1,16,000 Wages and Expenses (April to July) 47,000 1,87,000
Profit for the 4 months period 19,000 Movement of Funds Statement
Stock (Opening) April March purchase 24,000 Receivables (Opening) April Credit allowed 3 months January Sales 30,000 February Sales 33,000 March Sales 36,000 99,000 Creditors (Opening) April Credit received 2 months February Purchase 22,000 March Purchase 24,000 46,000 Closing stock (end of July), July Purchase 32,000 Receivable (end of July), May to July Sales 1,35,000 Creditors (end of July), June and July Purchase 62,000 Now movement of funds statement can be worked out as :

Sources: Rs. Profit earned during 4 months 19,000 Add: Increase in creditors (62,000 - 46,000) 16,000 35,000
Application: Less: Increase in receivables
(1,35,000-99,000) 36,000
Less: Increase in stock (32,000-24,000)
8,000
44,000 (-)9,000 Opening Cash balance 10,000 Hence closing cash balance 1,000
Question 2
The following are the Balance Sheets of Gama Limited for the year ending March 31, 2004 and March 31, 2005:
Balance Sheet as on March, 31
2004 2005
Rs. Rs. Capital and Liabilities
Share Capital 6,75,000 7,87,500
General Reserves 2,25,000 2,81,250 Capital Reserve (Profit on Sale of investment) - 11,250
Profit & Loss Account 1,12,500 2,25,000
15% Debentures 3,37,500 2,25,000 Accrued Expenses 11,250 13,500
Creditors 1,80,000 2,81,250
Provision for Dividends 33,750 38,250 Provision for Taxation 78,750 85,500
Total 16,53,750 19,48,500
Assets
Fixed Assets 11,25,000 13,50,000 Less: Accumulated depreciation 2,25,000 2,81,250
Net Fixed Assets 9,00,000 10,68,750

Long-term Investments (at cost) 2,02,500 2,02,500
Stock (at cost) 2,25,000 3,03,750
Debtors (net of provision for doubtful debts of Rs. 45,000 and Rs. 56,250 respectively for 2004 and 2005 respectively)
2,53,125 2,75,625
Bills receivables 45,000 73,125 Prepaid Expenses 11,250 13,500
Miscellaneous Expenditure 16,875 11,250
16,53,750 19,48,500
Additional Information:
(i) During the year 2004-05, fixed assets with a net book value of Rs. 11,250 (accumulated depreciation, Rs. 33,750) was sold for Rs. 9,000.
(ii) During the year 2004-05, Investments costing Rs. 90,000 were sold, and also Investments costing Rs. 90,000 were purchased.
(iii) Debentures were retired at a Premium of 10%.
(iv) Tax of Rs. 61,875 was paid for 2003-04.
(v) During the year 2004-05, bad debts of Rs. 15,750 were written off against the provision for Doubtful Debt account.
(vi) The proposed dividend for 2003-04 was paid in 2004-05.
Required:
Prepare a Funds Flow Statement (Statement of changes in Financial Position on working capital basis) for the year ended March 31, 2005. (PE-II-Nov.2005)(16 marks)
Answer
Computation of Funds from Operation
Profit and loss balance on March 31, 2005 Rs. 2,25,000
Add: Depreciation 90,000 Loss on Sale of Asset 2,250
Misc. Expenditure written off 5,625
Transfer to Reserves 56,250 Premium on Redemption of debentures 11,250
Provision for Dividend 38,250
Provision for Taxation 68,625
4,97,250
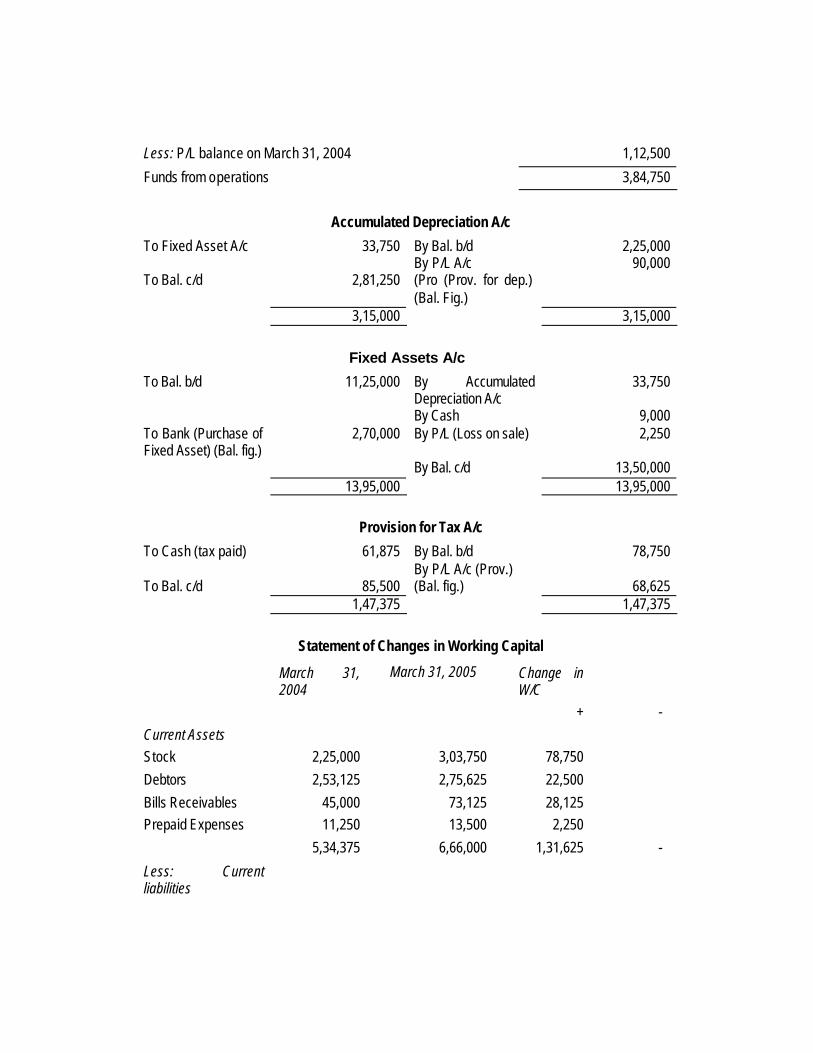
Less: P/L balance on March 31, 2004 1,12,500
Funds from operations 3,84,750
Accumulated Depreciation A/c
To Fixed Asset A/c 33,750 By Bal. b/d 2,25,000 To Bal. c/d 2,81,250
By P/L A/c (Pro (Prov. for dep.) (Bal. Fig.)
90,000
3,15,000 3,15,000
Fixed Assets A/c
To Bal. b/d 11,25,000 By Accumulated Depreciation A/c
33,750
By Cash 9,000 To Bank (Purchase of Fixed Asset) (Bal. fig.)
2,70,000 By P/L (Loss on sale) 2,250
By Bal. c/d 13,50,000 13,95,000 13,95,000
Provision for Tax A/c
To Cash (tax paid) 61,875 By Bal. b/d 78,750 By P/L A/c (Prov.) To Bal. c/d 85,500 (Bal. fig.) 68,625 1,47,375 1,47,375
Statement of Changes in Working Capital
March 31, 2004
March 31, 2005 Change in W/C
+ -
Current Assets Stock 2,25,000 3,03,750 78,750
Debtors 2,53,125 2,75,625 22,500
Bills Receivables 45,000 73,125 28,125 Prepaid Expenses 11,250 13,500 2,250
5,34,375 6,66,000 1,31,625 -
Less: Current liabilities

Accrued Expenses 11,250 13,500 - 2,250
Creditors 1,80,000 2,81,250 - 1,01,250
1,91,250 2,94,750 1,31,625 1,03,500
Working Capital 3,43,125 3,71,250 - -
Increase in Working Capital
28,125
1,31,625 1,31,625
Funds Flow Statement for the year ended March 31, 2005
Sources Rs. Working Capital from Operations 3,84,750 Sale of Fixed Assets 9,000
Sale of Investments 1,01,250 Share Capital Issued 1,12,500 Total Funds Provided (A) Rs. 6,07,500 Uses Rs. Purchase of Fixed Assets 2,70,000 Purchase of Investments 90,000 Payment of Debentures (at a premium of 10%) 1,23,750
Payment of Dividends 33,750 Payment of Taxes 61,875 Total Funds Applied (B) 5,79,375 Increase in Working Capital (A-B) Rs. 28,125
Question 3
Following are the financial statements of Zed L td.:
Balance Sheet as on
March 31, 2007 March 31, 2006 Rs. Rs.
Capital and Liabilities:
Share capital, Rs. 10 par value 1,67,500 1,50,000 Share premium 3,35,000 2,37,500
Reserves and Surplus 1,74,300 1,23,250
Debentures 2,40,000

−
Long-term loans 40,000 50,000 Creditors 28,800 27,100
Bank Overdraft 7,500 6,250
Accrued expenses 4,350 4,600 Income-tax payable 48,250 16,850
10,45,700 6,15,550
March 31, 2007 March 31, 2006 Rs. Rs.
Assets: Land 3,600 3,600 Building, net of depreciation 6,01,800 1,78,400 Machinery, net of depreciation 1,10,850 1,07,050 Investment in ‘A’ Ltd. 75,000
− Stock 58,800 46,150 Prepaid expenses 1,900 2,300 Debtors 76,350 77,150 Trade Investments 40,000 1,05,000 Cash 77,400 95,900 10,45,700 6,15,550
Income Statement
for the year ended March 31, 2007
Rs. Net Sales 13,50,000 Less: Cost of goods sold and operating expenses (including depreciation on buildings of Rs. 6,600 and depreciation on machinery of Rs. 11,400)
12,58,950
Net operating profit 91,050
Gain on sale of trade investments 6,400 Gain on sale of machinery 1,850 Profits before tax 99,300 Income-tax 48,250 Profits after tax 51,050

Additional information:
(i) Machinery with a net book value of Rs. 9,150 was sold during the year.
(ii) The shares of ‘A’ Ltd. were acquired by issue of debentures.
Required:
Prepare a Funds Flow Statement (Statement of changes in Financial position on Working capital basis) for the year ended March 31, 2007. (PE-II-Nov.2007) (12 marks)
Answer
Schedule of Changes in Working Capital
Impact on Working Capital
March 31, 2007 March 31, 2006
Increase Decrease
Current Assets Stock 58,800 46,150 12,650 −
Prepaid expenses 1,900 2,300 − 400
Debtors 76,350 77,150 − 800
Trade Investments 40,000 1,05,000 − 65,000
Cash 77,400 95,900 − 18,500
2,54,450 3,26,500 12,650 84,700 Current Liabilities
Creditors 28,800 27,100 − 1,700
Bank overdraft 7,500 6,250 − 1,250
Accrued expenses 4,350 4,600 250 − Income tax payable 48,250 16,850 − 31,400
88,900 54,800 250 34,350
Net Working Capital 1,65,550 2,71,700 12,900 1,19,050
Decrease in net working capital
1,06,150
−
1,06,150
−
2,71,700 2,71,700 1,19,050 1,19,050
Machinery Account
Rs. Rs. Balance b/d 1,07,050 Sale of machinery (given) 9,150 Purchase of machinery (plug) 24,350 Depreciation (given) 11,400

________ Balance c/d 1,10,850 1,31,400 1,31,400
Trade Investments Account
Rs. Rs.
Balance b/d 1,05,000 Cash (sale of trade investments) 65,000
_______ Balance c/d 40,000 1,05,000 1,05,000
Estimation of Funds flow from Operations
Rs.
Profits after tax 51,050
Add: Depreciation on Buildings 6,600 Depreciation on Machinery 11,400 18,000
69,050
Less: Gain on sale of machinery 1,850 Funds from Operations 67,200 Gain on sale of trade investments has been considered as an operating income. Trade investments have been considered as part of current assets.
Statement of Changes in Financial Position (Working Capital basis)
for the year ended March 31, 2007
Rs.
Sources: Funds from operations 67,200
Sale of machinery on gain (9,150 + 1,850) 11,000
Debentures issued (Rs. 2,40,000 – 75,000) 1,65,000 Investment in ‘A’ Ltd. financial transaction and hence not affecting working
capital
Issue of share capital (including share premium) 1,15,000 Financial Resources Provided 3,58,200
Uses:
Purchase of building (6,01,800 + 6,600 − 1,78,400) 4,30,000
Purchase of machinery 24,350
Payment of long-term loan 10,000

Financial Resources Applied 4,64,350
Net Decrease in Working Capital 1,06,150
Question 4
Balance Sheet of OP Ltd. as on 31st March, 2007 and 2008 are as follows:
Liabilities Amount Amount Assets Amount Amount
31.3.2007 31.3.2008 31.3.2007 31.3.2008
Rs. Rs. Rs. Rs.
Share capital 20,00,000 20,00,000 Land and Building 15,00,000 14,00,000
General Reserve 4,00,000 4,50,000 Plant and Machinery 18,00,000 17,50,000
Profit and Loss A/c 2,50,000 3,60,000 Investment 4,00,000 3,72,000
10% Debentures 10,00,000 8,00,000 Stock 4,80,000 8,50,000
Bank Loan (long-term) 5,00,000 6,00,000 Debtors 6,00,000 7,98,000
Creditors 4,00,000 5,80,000 Prepaid Expenses 50,000 40,000
Outstanding Expenses 20,000 25,000 Cash and Bank 1,40,000 85,000
Proposed Dividend 3,00,000 3,60,000
Provision for taxation 1,00,000 1,20,000
49,70,000 52,95,000 49,70,000 52,95,000
Additional informations:
(i) New machinery for Rs. 3,00,000 was purchased but an old machinery costing Rs. 1,45,000 was sold for Rs. 50,000 and accumulated depreciation thereon was Rs. 75,000.
(ii) 10% debentures were redeemed at 20% premium.
(iii) Investment were sold for Rs. 45,000, and its profit was transferred to general reserve.
(iv) Income-tax paid during the year 2007-08 was Rs. 80,000.
(v) An interim dividend of Rs. 1,20,000 has been paid during the year 2007-08.
(vi) Assume the provision for taxation as current liability and proposed dividend as non-current liability.
(vii) Investment are non-trade investment.
You are required to prepare:
(i) Schedule of changes in working capital.
(ii) Funds flow statement. (PE-II-Nov.2008) (12 marks)


Answer
(i) Schedule of Changes in Working Capital
Particulars 31st March Working Capital
2007 2008 Increase Decrease
Rs. Rs. Rs. Rs.
A. Current Assets:
Stock 4,80,000 8,50,000 3,70,000 −
Debtors 6,00,000 7,98,000 1,98,000 −
Prepaid Expenses 50,000 40,000 − 10,000
Cash and Bank 1,40,000 85,000 − 55,000
Total (A) 12,70,000 17,73,000
B. Current Liabilities:
Creditors 4,00,000 5,80,000 − 1,80,000
Outstanding Expenses 20,000 25,000 − 5,000
Provision for Taxation 1,00,000 1,20,000 − 20,000
Total (B) 5,20,000 7,25,000 ________ _______
Working Capital (A – B) 7,50,000 10,48,000 5,68,000 2,70,000
Increase in Working Capital _______ 2,98,000
Total 5,68,000 5,68,000
(ii) Funds Flow Statement
for the year ending 31st March, 2008
Sources of Funds Amount Application of Funds Amount
Rs. Rs.
Funds from operations 10,63,000 Redemption of debentures 2,40,000
Bank loan taken 1,00,000 Purchase of machinery 3,00,000
Sale of Machinery 50,000 Dividend paid 3,00,000
Sale of Investment 45,000 Interim Dividend paid 1,20,000
Increase in working capital 2,98,000

12,58,000 12,58,000
Workings:
1. Funds from operations:
Adjusted Profit and Loss A/c
Rs. Rs. Rs.
To General Reserve 33,000 By Balance b/d 2,50,000
To Depreciation By Funds from operations
10,63,000
On Land and Building 1,00,000 (Balancing figure)
On Plant & Machinery 2,80,000 3,80,000
To Loss on Sale of Machine 20,000
To Premium on Redemption of Debentures
40,000
To Proposed Dividend 3,60,000
To Interim Dividend 1,20,000
To Balance c/d 3,60,000
13,13,000 13,13,000
2. Depreciation on Land and Building = Rs. 15,00,000 – Rs. 14,00,000
= Rs. 1,00,000.
3. Loss on Sale of Old Machine = Cost Rs. 1,45,000 – Rs. 75,000 (Cum-Dep.) – Rs. 50,000 (Sales value) = Rs. 20,000
4. Depreciation on Plant and Machinery:
Plant and Machinery A/c Dr.
Cr.
Rs. Rs.
To Balance b/d 18,00,000 By Bank A/c (Sold) 50,000
To Bank A/c (Purchases) 3,00,000 By Profit and Loss A/c 20,000
(Loss on Sales)
By Depreciation 2,80,000
(Balancing figure)
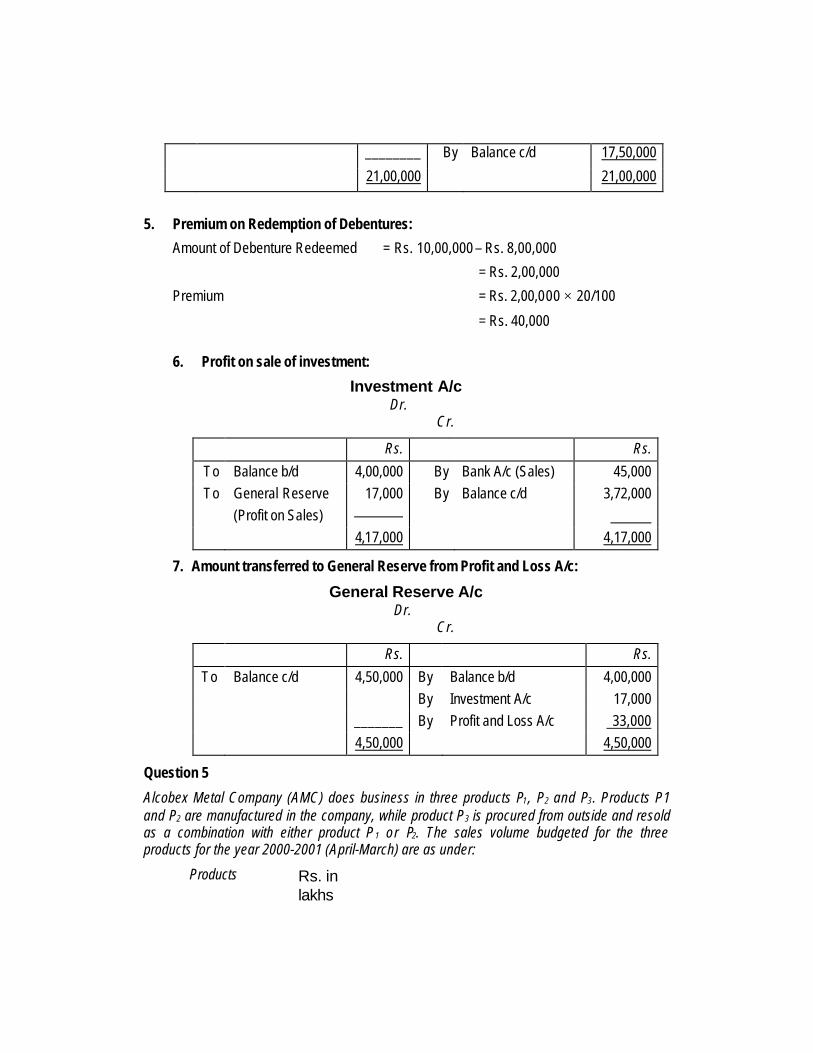
________ By Balance c/d 17,50,000
21,00,000 21,00,000
5. Premium on Redemption of Debentures:
Amount of Debenture Redeemed = Rs. 10,00,000 – Rs. 8,00,000
= Rs. 2,00,000
Premium = Rs. 2,00,000 × 20/100
= Rs. 40,000
6. Profit on sale of investment:
Investment A/c Dr. Cr.
Rs. Rs.
To Balance b/d 4,00,000 By Bank A/c (Sales) 45,000 To General Reserve
(Profit on Sales) 17,000
By Balance c/d 3,72,000
4,17,000 4,17,000
7. Amount transferred to General Reserve from Profit and Loss A/c:
General Reserve A/c Dr.
Cr.
Rs. Rs.
To Balance c/d 4,50,000 By Balance b/d 4,00,000 By Investment A/c 17,000 _______ By Profit and Loss A/c 33,000
4,50,000 4,50,000
Question 5
Alcobex Metal Company (AMC) does business in three products P1, P2 and P3. Products P1 and P2 are manufactured in the company, while product P3 is procured from outside and resold as a combination with either product P1 or P2. The sales volume budgeted for the three products for the year 2000-2001 (April-March) are as under:
Products Rs. in lakhs

P1 1,200 P2 500 P3 400 [Dec. 1999 to March, 2000 Rs. 20.00 lakhs P.M.
April, 2000 to July, 2000 Rs. 25.00 lakhs P.M. Aug. 2000 to Nov. 2000 Rs. 30.00 lakhs P.M. Dec. 2000 to March, 2001 Rs. 45.00 lakhs P.M.]
Based on the budgeted sales value, the cash flow forecast for the company is prepared based on the following assumptions:
(1) Sales realisation is considered at:
50% Current month
25% Second month
25% Third month
(2) Production Programme for each month is based on the sales value of the next month.
(3) Raw material consumption of the company is kept at 59% of the month’s production.
(4) 81% of the raw materials consumed are components.
(5) Raw material and components to the extent, at 25% are procured through import.
(6) The Purchases budget is as follows:
(i) Indigenous raw materials are purchased two months before the actual consumption.
(ii) Components are procured in the month of consumption.
(iii) Imported raw materials and components are brought three months prior to the month of consumption.
(7) The company avails of the following credit terms from suppliers:
(i) Raw materials are paid for in the month of purchases;
(ii) Company gets one month’s credit for its components;
(iii) For imported raw material and components payments are made one month prior to the dates of purchases.
(8) Currently the company has a cash credit facility of Rs. 140.88 lakhs
(9) Expenses are given below and are expected to be constant throughout the year:
Wages and Salaries Rs. 312 lakhs
Administrative Expenses Rs. 322 lakhs
Selling and Distribution Expenses Rs. 53 lakhs
(10) Dividend of Rs. 58.03 lakhs is to be paid in October.
(11) Tax of Rs. 23.92 lakhs will be paid in equal installments in four-quarters: i.e., January,

April, July and October.
(12) The term-loan of Rs. 237.32 lakhs is repayable in two equal installments half-yearly. i.e June/December.
(13) Capital expenditure of Rs. 292.44 lakhs for the year is expected to be spread equally during the 12 months period.
You are required to prepare a Cash Flow Statement (Cash Budget) for the period of June-November, 2000. (Final-May 2001) (20 marks)
Answer
Alcobex Metal Company Cash Flow statement (cash budget) for the period of June –November, 2000
(Rs. in lakhs) June July August September October November Total
cash flow
Opening Balance
(140.88) (273.98) (294.40) (310.35) (326.31) (405.03) (140.88)
(Refer to Assumption)
Collection from customers
166.67 166.67 169.17 170.42 171.67 171.67 1,016.27
(Refer to working note 1)
Total 25.79 (107.31) (125.23) (139.93) (154.64) (233.36) 875.39 Payment to supplier
99.49 101.70 103.5 104.76 104.76 104.76 618.97
(Refer to working note 4)
Wages and Salaries
26 26 26 26 26 26 56.00
Administrative expenses
26.83 26.83 26.83 26.83 26.83 26.83 160.98
Selling and Distribution
4.42 4.42 4.42 4.42 4.42 4.42 26.52
Dividend 58.03 58.03 Tax - 5.98 - 5.98 - - 11.96 Capital Expenditure
24.37 24.37 24.37 24.37 24.37 24.37 146.22

Repayment of term loan
118.66 118.66
Total 299.77 189.30 185.12 186.38 250.39 186.38 1,297.34 Closing balance
(273.98) (294.40) (310.35) (326.31) (405.03) (419.74) (421.95)
Assumptions:
1. Since the opening cash balance as on June, 2000 is not given, it is assumed that the credit facility enjoyed by the company of Rs. 140.88 lakhs is its opening balance.
2. Since the question does not provide relevant information regarding purchase price and payment terms to the suppliers in respect of Product P3 which is procured from outside and sold as a combination with either Product P1 or P2. It is assumed that the Product P3 is manufactured within the company and its production programme and production costs are same as to the manufacturing of Products P1 or P2.
3. In the working notes some of the calculations are taken from December for the sake of completeness otherwise they are not required.
Working Notes: 1. Collection from debtors: Sales Product
P2 Product
P3 Total Sales
Current month
collection
2nd month
collection
3rd month
collection
Total collection
(i) (ii) (iii) (iv) (v) (vi)=(ii)+(iii)+(iv) December 100 41.67 20 161.67 80.83 0 0 80.83 January 100 41.67 20 161.67 80.83 40.42 0 121.25 February 100 41.67 20 161.67 80.83 40.42 40.42 161.67 March 100 41.67 20 161.67 80.83 40.42 40.42 161.67 April 100 41.67 25 166.67 83.33 40.42 40.42 164.17 May 100 41.67 25 166.67 83.33 41.67 40.42 165.42 June 100 41.67 25 166.67 83.33 41.67 41.67 166.67 July 100 41.67 25 166.67 83.33 41.67 41.67 166.67 August 100 41.67 30 171.67 85.83 41.67 41.67 169.17 September 100 41.67 30 171.67 85.83 42.92 41.67 170.42 October 100 41.67 30 171.67 85.83 42.92 42.92 171.67 November 100 41.67 30 171.67 85.83 42.92 42.92 171.67 December 100 41.67 45 186.67 93.33 42.92 42.92 179.17 January 100 41.67 45 186.67 93.33 46.67 42.92 182.92 February 100 41.67 45 186.67 93.33 46.67 46.67 186.67 March 100 41.67 45 186.67 93.33 46.67 46.67 186.67 Total 1600 666.67 480 2746.67 1373.33 640.00 593.33 2606.67
2. Production Programme

Months Sales Value
(Refer to working note (i) column
(ii))
Total raw material
consumption
Components Other raw
material
Imported raw material &
components
Indigenous raw material
& components
Indigenous raw
material
Indigenous components
(i) (ii)=59% of (i)
(iii)=81% of (ii)
(iv)=(ii)-(iii)
(v)=25%of (ii) (vi)=(ii)-(v) (vii)=75% of (iv)
(viii)=75% of (iii)
December 161.67 95.38 77.26 18.12 23.85 71.54 13.59 57.95
January 161.67 95.38 77.26 18.12 23.85 71.54 13.59 57.95
February 161.67 95.38 77.26 18.12 23.85 71.54 13.59 57.95
March 166.67 98.38 79.65 18.68 24.58 73.75 14.01 59.74
April 166.67 98.33 79.65 18.68 24.58 73.75 14.01 59.74
May 166.67 98.33 79.65 18.68 24.58 73.75 14.01 59.74
June 166.67 98.33 79.65 18.68 24.58 73.75 14.01 59.74
July 171.67 101.28 82.04 19.24 25.32 75.96 14.43 61.53
August 171.67 101.28 82.04 19.24 25.32 75.96 14.43 61.53
September 171.67 101.28 82.04 19.24 25.32 75.96 14.43 61.53
October 171.67 101.28 82.04 19.24 25.32 75.96 14.43 61.53
November 186.67 110.13 89.21 20.93 27.53 82.60 15.69 66.91
December 186.67 110.13 89.21 20.93 27.53 82.60 15.69 66.91
January 186.67 110.13 89.21 20.93 27.53 82.60 15.69 66.91
February 186.67 110.13 89.21 20.93 27.53 82.60 15.69 66.91
Total 2585.05 1525.15 1235.38 289.76 381.27 1143.86 217.29 926.57
3. Purchase Programme
Months Indigenous others
(Refer to working note 2 above)
(column vii)
Indigenous Components
(Refer to working note 2 above)
(column viii)
Imported others
(i) (ii) (iii)
December 13.59 57.95 24.58 January 14.01 57.95 24.58 February 14.01 57.95 24.58 March 14.01 59.74 24.58 April 14.01 59.74 25.32 May 14.43 59.74 25.32
June 14.43 59.74 25.32 July 14.43 61.53 25.32

August 14.43 61.53 27.53 September 15.69 61.53 27.53 October 15.69 61.53 27.53 November 15.69 66.91 27.53
December 15.69 66.91 - January 0.00 66.91 - February 0.00 66.91 -
4. Payment to Suppliers (Rs. in lakhs) Months Indigenous
others Indigenous
Components (Previous month
paid now)
Imported others and components
(Next month purchase advance payment)
Total Payment
December 13.59 0 24.58 13.59 January 14.01 57.95 24.58 96.54 February 14.01 57.95 24.58 96.54 March 14.01 57.95 25.32 96.54 April 14.01 59.74 25.32 99.07 May 14.43 59.74 25.32 99.49 June 14.43 59.74 25.32 99.49 July 14.43 59.74 27.53 101.70 August 14.43 61.53 27.53 103.50 September 15.69 61.53 27.53 104.76 October 15.69 61.53 27.53 104.76 November 15.69 61.53 0.00 104.76 December 15.69 66.91 0.00 82.60 January 0.00 66.91 0.00 66.91 February 0.00 66.91 0.00 66.91 March 66.91 0.00 66.91 0.00 0.00
Question 6
XYZ Ltd. Company’s Comparative Balance Sheet for 2002 and the Company’s Income Statement for the year are as follows:
XYZ Ltd.
Comparative Balance Sheet

December 31, 2002 and 2001 (Rs. in crores) 200
2 2001
Sources of funds: Shareholder’s funds 140 250 92 Loan funds 135
140 110
385
232
40 272
Application of funds Fixed Assets Plant and Equipment 430 309 Less: Accumulated depreciation
(218) 212 (194)
115
Investments 60 75 Current Assets 205 160 180 270 17 20 26 428 10 460 Less : Current liabilities and provisions
230 310 70 60 15 315 113 8 378 82 385 272
XYZ Ltd.
Income Statement For the year ended December 31, 2002
(Rs. in crores)
Sales Rs.1,000 Less : Cost of goods sold 530 Gross margin 470 Less : Operating expenses 352 Net operating income 118 Non-operating items: Loss on sale of equipment (4)
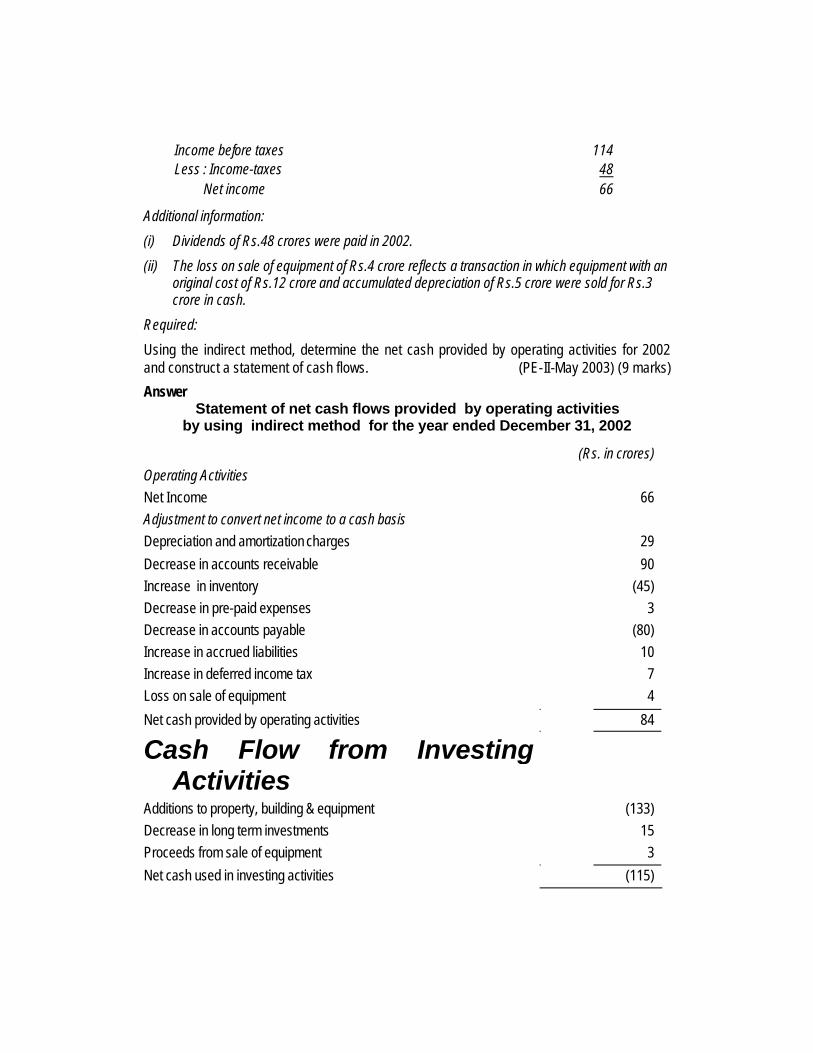
Income before taxes 114 Less : Income-taxes 48 Net income 66
Additional information:
(i) Dividends of Rs.48 crores were paid in 2002.
(ii) The loss on sale of equipment of Rs.4 crore reflects a transaction in which equipment with an original cost of Rs.12 crore and accumulated depreciation of Rs.5 crore were sold for Rs.3 crore in cash.
Required:
Using the indirect method, determine the net cash provided by operating activities for 2002 and construct a statement of cash flows. (PE-II-May 2003) (9 marks)
Answer Statement of net cash flows provided by operating activities
by using indirect method for the year ended December 31, 2002
(Rs. in crores) Operating Activities Net Income 66 Adjustment to convert net income to a cash basis Depreciation and amortization charges 29
Decrease in accounts receivable 90 Increase in inventory (45) Decrease in pre-paid expenses 3 Decrease in accounts payable (80) Increase in accrued liabilities 10 Increase in deferred income tax 7 Loss on sale of equipment 4
Net cash provided by operating activities 84
Cash Flow from Investing Activities
Additions to property, building & equipment (133) Decrease in long term investments 15 Proceeds from sale of equipment 3
Net cash used in investing activities (115)
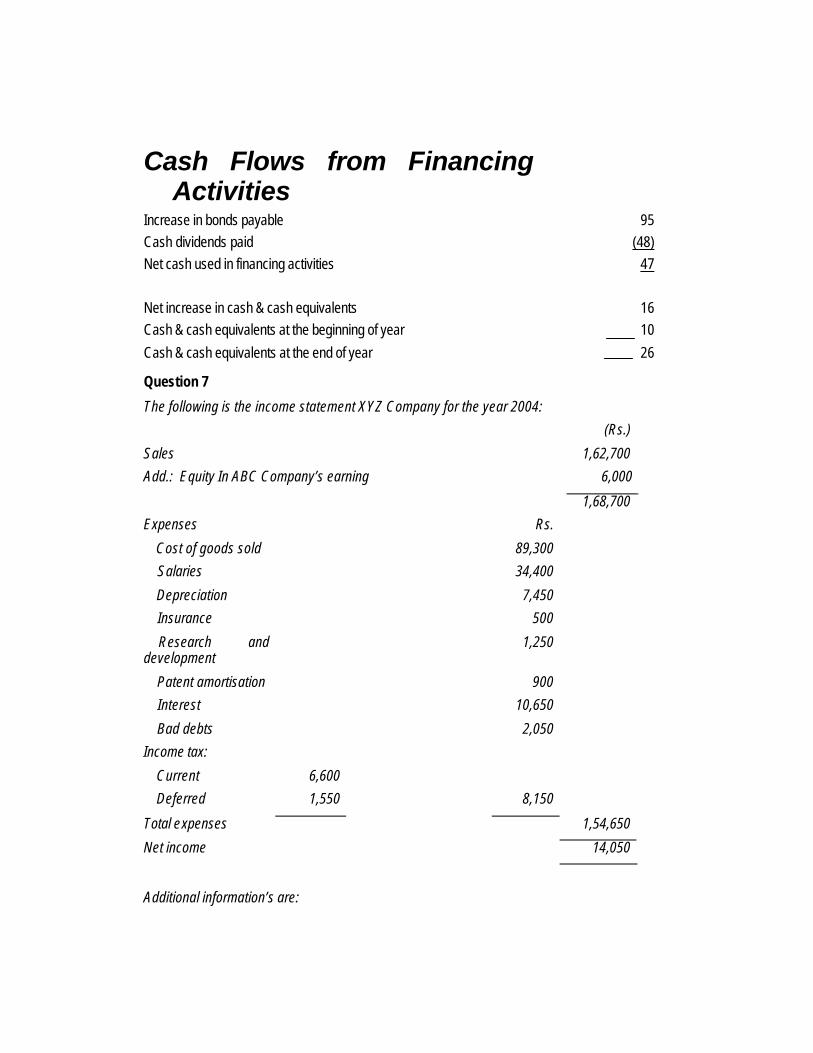
Cash Flows from Financing Activities
Increase in bonds payable 95 Cash dividends paid (48) Net cash used in financing activities 47 Net increase in cash & cash equivalents 16 Cash & cash equivalents at the beginning of year 10
Cash & cash equivalents at the end of year 26
Question 7
The following is the income statement XYZ Company for the year 2004:
(Rs.)
Sales 1,62,700
Add.: Equity In ABC Company’s earning 6,000
1,68,700
Expenses Rs.
Cost of goods sold 89,300
Salaries 34,400
Depreciation 7,450
Insurance 500
Research and development
1,250
Patent amortisation 900
Interest 10,650
Bad debts 2,050
Income tax:
Current 6,600
Deferred 1,550 8,150
Total expenses 1,54,650
Net income 14,050
Additional information’s are:

(i) 70% of gross revenue from sales were on credit.
(ii) Merchandise purchases amounting to Rs. 92,000 were on credit.
(iii) Salaries payable totaled Rs. 1,600 at the end of the year.
(iv) Amortisation of premium on bonds payable was Rs. 1,350.
(v) No dividends were received from the other company.
(vi) XYZ Company declared cash dividend of Rs. 4,000.
(vii) Changes in Current Assets and Current Liabilities were as follows:
Increase
(Decrease)
Rs.
Cash 500
Marketable securities 1,600
Accounts receivable (7,150)
Allowance for bad debt (1,900)
Inventory 2,700
Prepaid insurance 700
Accounts payable (for merchandise) 5,650
Salaries payable (2,050)
Dividends payable (3,000)
Prepare a statement showing the amount of cash flow from operations.
(PE-II-May 2005) (7 marks)
Answer
Statement showing cash flow from Operations
Rs Rs Cash flow from operations Cash sales (30% × 1,62,700) 48,810 Collection from debtors 1,20,890 Total cash from operations 1,69,700 Uses of cash from operations Payment to suppliers 86,350 Salaries expense 36,450 Payment for insurance 1,200 Research and development 1,250 Interest payment 12,000

Income tax paym ent 6,600 Total operating cash payment 1,43,850 Net cash flow from operations 25,850
Notes
(1)
Collection from debtors Rs Credit sales (70% × 1,62,700) 1,13,890 Less : Bad debts (2,050 less 1,900) 150 1,13,740 Add : decrease in accounts receivables 7,150 Collection from debtors on credit sales 1,20,890
(2) Dividends earned Rs 6,000 on equity of ABC Company has not been considered as it has not been received in cash.
(3) Payment to suppliers
Cost of goods sold Rs 89,300
Add: Increase in inventory 2,700
Purchases 9,200
Less: increase in accounts payable 5,650
Payment to suppliers 86,350
(4) Calculation of salaries payment
Salary expense Rs 34,400
Add : decrease in salary payable 2,050
Payment of salaries Rs 36,450
(5) Insurance payments
Insurance Rs 500
Add : increase in prepaid insurance 700
Payment for insurance Rs 1,200
(6) Interest payment
Interest expenses Rs 10,650
Add : Amortisation of bond premium 1,350
Interest payments Rs 12,000
(7) Income tax payments
Income tax expense Rs 8,150
Less: deferred tax 1,550

Rs 6,600
Changes in current tax payable Nil
Income tax payments Rs 6,600
Question 8
From the information contained in Income Statement and Balance Sheet of ‘A’ Ltd., prepare Cash Flow Statement:
Income Statement for the year ended March 31, 2006
Rs. Net Sales (A) 2,52,00,000 Less: Cash Cost of Sales 1,98,00,000
Depreciation 6,00,000 Salaries and Wages 24,00,000 Operating Expenses 8,00,000 Provision for Taxation 8,80,000 (B) 2,44,80,000 Net Operating Profit (A – B) 7,20,000
Non-recurring Income – Profits on sale of equipment 1,20,000 8,40,000 Retained earnings and profits brought forward 15,18,000 23,58,000 Dividends declared and paid during the year 7,20,000 Profit and Loss Account balance as on March 31, 2006 16,38,000
Balance Sheet as on
Assets March 31, 2005 March 31, 2006 (Rs.) (Rs.) Fixed Assets: Land 4,80,000 9,60,000 Buildings and Equipment 36,00,000 57,60,000 Current Assets:
Cash 6,00,000 7,20,000 Debtors 16,80,000 18,60,000 Stock 26,40,000 9,60,000

Advances 78,000 90,000 90,78,000 1,03,50,000
Balance Sheet as on
Liabilities and Equity March 31, 2005 March 31, 2006
(Rs.) (Rs.)
Share Capital 36,00,000 44,40,000 Surplus in Profit and Loss Account 15,18,000 16,38,000
Sundry Creditors 24,00,000 23,40,000
Outstanding Expenses 2,40,000 4,80,000 Income-tax payable 1,20,000 1,32,000
Accumulated Depreciation
on Buildings and Equipment 12,00,000 13,20,000 90,78,000 1,03,50,000
The original cost of equipment sold during the year 2005-06 was Rs. 7,20,000.
(PE-II-Nov. 2006) (10 marks)
Answer
Cash Flow Statement of Company A Ltd. for the year ending March 31, 2006
Cash flows from Operating Activities
Rs.
Net Profits before Tax and Extra-ordinary Item 16,00,000
Add: Depreciation 6,00,000
Operating Profits before Working Capital Changes 22,00,000
Increase in Debtors (1,80,000)
Decrease in Stock 16,80,000
Increase in Advances (12,000)
Decrease in Sundry Creditors (60,000)
Increase in Outstanding Expenses 2,40,000
Cash Generated from Operations 38,68,000

Income tax Paid 8,68,000
Net Cash from Operations 30,00,000
Cash flows from Investment Activities
Rs.
Purchase of Land (4,80,000) Purchase of Buildings and Equipment (28,80,000)
Sale of Equipment 3,60,000
Net Cash used in Investment Activities (30,00,000)
Cash flows from Financing Activities
Rs. Issue of Share Capital 8,40,000 Dividends Paid (7,20,000) Net Cash from Financing Activities 1,20,000 Net increase in Cash and Cash Equivalents 1,20,000 Cash and Cash Equivalents at the beginning 6,00,000 Cash and Cash Equivalents at the end 7,20,000
Buildings and Equipment Account
Rs. Rs. Balance b/d 36,00,000 Sale of Asset 7,20,000 Cash/Bank (purchase) (Balancing figure)
28,80,000
Balance c/d 57,60,000 ________
64,80,000 64,80,000
Accumulated Depreciation on Buildings and Equipment Account
Rs. Rs.
Sale of Asset
(Accumulated depreciation)
4,80,000
Balance b/d
Profit and Loss (Provisional)
12,00,000 6,00,000
Balance c/d 13,20,000 ________
18,00,000 18,00,000
Sale of Asset Account

Rs.
Original Cost 7,20,000 Less: Accumulated Depreciation 4,80,000
Net Cost 2,40,000
Profit on Sale of Asset 1,20,000 Sale Proceeds from Asset Sales 3,60,000
Question 9
X Ltd. has the following balances as on 1 s t April 2007:
Rs.
Fixed Assets 11,40,000
Less; Depreciation 3,99,000
7,41,000
Stocks and Debtors 4,75,000
Bank Balance 66,500
Creditors 1,14,000
Bills payable 76,000
Capital (Shares of Rs. 100 each) 5,70,000
The Company made the following estimates for financial year 2007-08:
(i) The company will pay a free of tax dividend of 10% the rate of tax being 25%.
(ii) The company will acquire fixed assets costing Rs.1,90,000 after selling one machine for Rs. 38,000 costing Rs. 95,000 and on which depreciation provided amounted to Rs. 66,500.
(iii) Stocks and Debtors, Creditors and Bills payables at the end of financial year are expected to be Rs. 5,60,500, Rs. 1,48,200 and Rs. 98,800 respectively.
(iv) The profit would be Rs. 1,04,500 after depreciation of Rs. 1,14,000.
Prepare the projected cash flow statement and ascertain the bank balance of X Ltd. at the end of Financial year 2007-08. (PE-II-May 2008) (8 marks)
Answer
Working:
(i) Cash Flow from operations
Rs.
Profit for the year 1,04,500

Add: Depreciation (non cash item) 1,14,000
2,18,500
Less: Profit on sale of machine 9,500
2,09,000
Add increase in:
Creditors (Rs. 1,48,200 – Rs. 1,14,000) = Rs. 34,200
Bills payable (Rs. 98,800 – Rs. 76,000) = Rs. 22,800 57,000
2,66,000
Less: Increase in stocks & debtors (Rs. 5,60,500 – Rs. 4,75,000) 85,500
Cash from operations 1,80,500
(ii) Payment of Dividend
10% on capital Rs. 5,70,000 = Rs. 57,000
Gross up Amount= 76,000 Rs.1007557,000 Rs.
=
×
Total Dividend Rs. 76,000
Tax 25% Rs. 19,000
Payment of Dividend Rs. 57,000
Note: Income Tax on Company’s Profit Ignored
Projected Cash Flow Statement for the Year ending on 31st March, 2008
Rs.
Bank Balance as on 1 st April, 2007 66,500
Add: Inflow of Cash
Sale of Machine Rs. 38,000
Cash From operation Rs. 1,80,500 2,18,500
Less: Outflow of Cash 2,85,000
Purchase of Fixed Assets Rs. 1,90,000
Payment of Dividend Rs. 57,000
Tax Paid Rs. 19,000 2,66,000
Bank Balance on 31st March, 2008 19,000
Question 10
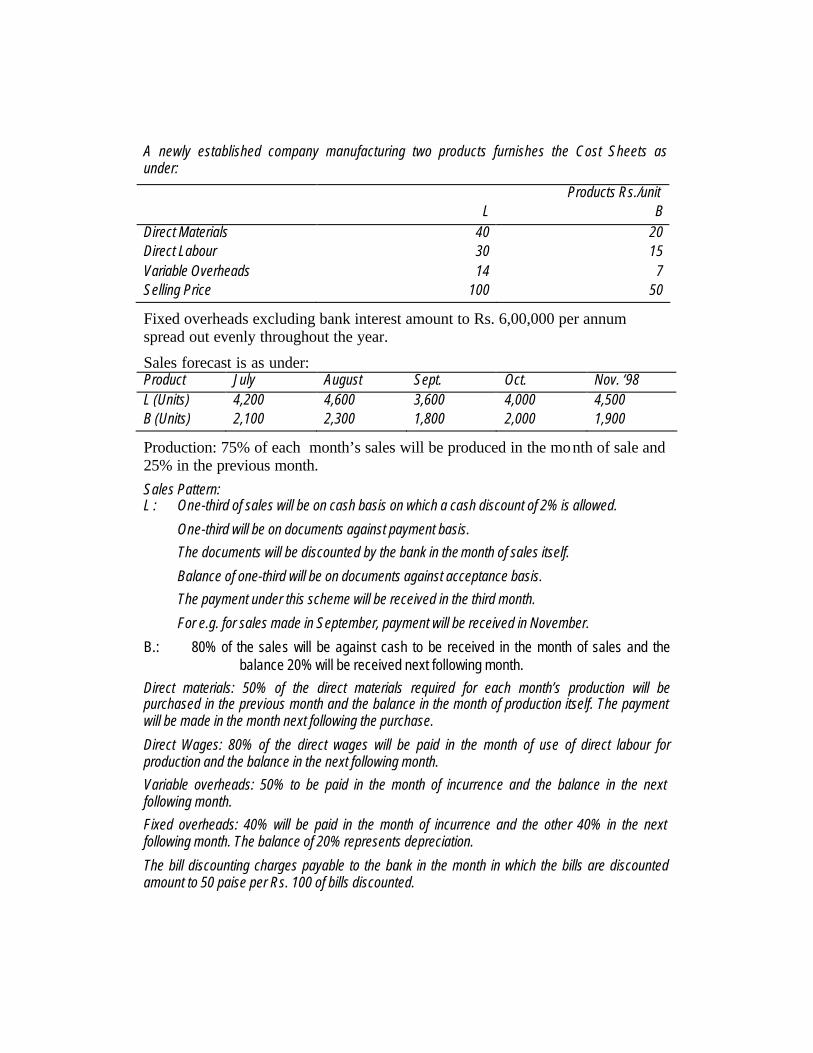
A newly established company manufacturing two products furnishes the Cost Sheets as under:
Products Rs./unit L B
Direct Materials 40 20 Direct Labour 30 15 Variable Overheads 14 7 Selling Price 100 50
Fixed overheads excluding bank interest amount to Rs. 6,00,000 per annum spread out evenly throughout the year.
Sales forecast is as under: Product July August Sept. Oct. Nov. ‘98 L (Units) 4,200 4,600 3,600 4,000 4,500 B (Units) 2,100 2,300 1,800 2,000 1,900
Production: 75% of each month’s sales will be produced in the month of sale and 25% in the previous month. Sales Pattern: L : One-third of sales will be on cash basis on which a cash discount of 2% is allowed.
One-third will be on documents against payment basis.
The documents will be discounted by the bank in the month of sales itself.
Balance of one-third will be on documents against acceptance basis.
The payment under this scheme will be received in the third month.
For e.g. for sales made in September, payment will be received in November.
B.: 80% of the sales will be against cash to be received in the month of sales and the balance 20% will be received next following month.
Direct materials: 50% of the direct materials required for each month’s production will be purchased in the previous month and the balance in the month of production itself. The payment will be made in the month next following the purchase.
Direct Wages: 80% of the direct wages will be paid in the month of use of direct labour for production and the balance in the next following month.
Variable overheads: 50% to be paid in the month of incurrence and the balance in the next following month.
Fixed overheads: 40% will be paid in the month of incurrence and the other 40% in the next following month. The balance of 20% represents depreciation.
The bill discounting charges payable to the bank in the month in which the bills are discounted amount to 50 paise per Rs. 100 of bills discounted.
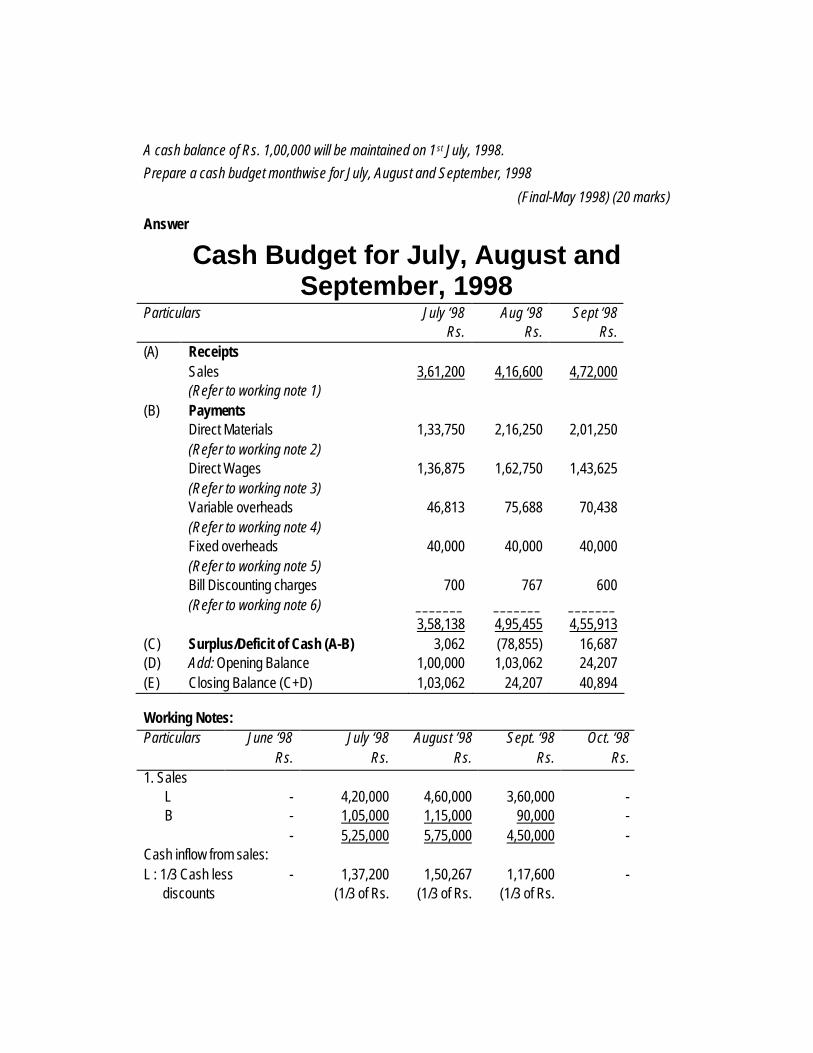
A cash balance of Rs. 1,00,000 will be maintained on 1st July, 1998.
Prepare a cash budget monthwise for July, August and September, 1998
(Final-May 1998) (20 marks)
Answer
Cash Budget for July, August and September, 1998
Particulars July ‘98 Rs.
Aug ‘98 Rs.
Sept ‘98 Rs.
(A) Receipts Sales 3,61,200 4,16,600 4,72,000 (Refer to working note 1) (B) Payments Direct Materials 1,33,750 2,16,250 2,01,250 (Refer to working note 2) Direct Wages 1,36,875 1,62,750 1,43,625 (Refer to working note 3) Variable overheads 46,813 75,688 70,438 (Refer to working note 4) Fixed overheads 40,000 40,000 40,000 (Refer to working note 5) Bill Discounting charges 700 767 600 (Refer to working note 6) _______ _______ _______ 3,58,138 4,95,455 4,55,913 (C) Surplus/Deficit of Cash (A-B) 3,062 (78,855) 16,687 (D) Add: Opening Balance 1,00,000 1,03,062 24,207 (E) Closing Balance (C+D) 1,03,062 24,207 40,894
Working Notes: Particulars June ‘98
Rs. July ‘98
Rs. August ’98
Rs. Sept. ‘98
Rs. Oct. ‘98
Rs. 1. Sales
L - 4,20,000 4,60,000 3,60,000 - B - 1,05,000 1,15,000 90,000 - - 5,25,000 5,75,000 4,50,000 -
Cash inflow from sales: L : 1/3 Cash less discounts
- 1,37,200 (1/3 of Rs.
1,50,267 (1/3 of Rs.
1,17,600 (1/3 of Rs.
-

4,20,000 x 98%)
4,60,000 x 98%)
3,60,000 x 98%)
1/3 D/P discounts - 1,40,000 (1/3 of Rs. 4,20,000)
1,53,333 (1/3 of Rs. 4,60,000)
1,20,000 (1/3 of Rs. 3,60,000)
-
1/3 DA collection - - - 1,40,000 - B : 80% cash - 84,000
(80% of Rs. 1,05,000)
92,000 (80% of Rs.
1,15,000)
72,000 (80% of Rs.
90,000)
-
20% collection
- - 21,000 (20% of
1,05,000)
23,000 (20% of
1,15,000)
-
Total - 3,61,200 4,16,600 4,72,600 2. Production (Qty)
L. 75% - 3,150 (75% of
4,200 units)
3,450 (75% of
4,600 units)
2,700 (75% of
3,600 units)
3,000 (75% of
4,000 units)
25% 1,050 (25% of
4,200 units)
1,150 (25% of
4,600 units)
900 (25% of
3,600 units)
1,000 (25% of
4,000 units)
1,125 (25% of
4,500 units)
1,050 4,300 4,350 3,700 4,125 B 75% - 1,575
(75% of 2,100 units)
1,725 (75% of
2,300 units)
1,350 (75% of
1,800units)
1,500 (75% of
2,000units) 25% 525
(25% of 2,100units)
575 (25% of
2,300 units)
450 (25% of
1,800 units)
500 (25% of
2,000 units)
475 (25% of
1,900units)
525 2,150 2,175 1,850 1,975 Direct material requirements: (Rs.)
L 42,000 (1,050
units x Rs. 40)
1,72,000 (4,300 units
x Rs. 40)
1,74,000 (4,350 units
x Rs. 40)
1,48, 000 (3,700 units
x Rs. 40)
1,65,000 (4,125
units x Rs. 40)
B 10,500 (525 units x Rs. 20)
43,000 (2,150 units
x Rs. 20)
43,500 (2,175 units
x Rs. 20)
37,000 (1,850 units
x Rs. 20)
39,500 (1,975
units x Rs. 20)

52,500 2,15,000 2,17,500 1,85,000 2,04,500 Purchases: (Rs.) 26,250
(50% of Rs.
52,500)
1,07,500 (50% of Rs.
2,15,000)
1,08,750 (50% of Rs.
2,17,500)
92,500 (50% of Rs.
1,85,000)
-
1,07,500 (50% of
Rs. 2,15,000)
1,08,750 (50% of Rs.
2,17,500)
92,500 (50% of Rs.
1,85,000)
1,02,250 (50% of Rs.
2,04,500)
-
1,33,750 2,16,250 2,01,250 1,94,750 Payment (Rs.) 1,33,750 2,16,250 2,01,250 3. Direct wages
L 31,500 (1,050 x Rs.
30)
1,29,000 (4,300 x Rs.
30)
1,30,500 (4,350 x Rs.
30)
1,11,000 (3,700 x Rs.
30)
-
B 7,875 (525 x Rs.
15)
32,250 (2,150 x Rs.
15)
32,625 (2,175 x Rs.
15)
27,750 (1,850 x Rs.
15)
-
39,375 1,61,250 1,63,125 1,38,750 Payment:
20% L - 7,875 (20% of
Rs. 39,375)
32,250 (20% of
Rs. 1,61,250)
32,625 (20% of
Rs. 1,63,125)
-
80% B - 1,29,000 (80% of
Rs. 1,61,250)
1,30,500 (80% of
Rs.1,63,125)
1,11,000 (80% of
Rs.1,38,750)
-
1,36,875 1,62,750 1,43,625 4. Variable overheads
L 14,700 (1,050 x Rs.
14)
60,200 (4,300 x Rs.
14)
60,900 (4,350 x Rs.
14)
51,800 (3,700 x Rs.
14)
-
B 3,675 (525 x Rs. 7)
15,050 (2,150 x Rs. 7)
15,225 (2,175 x Rs.
7)
12,950 (1,850 x Rs.
7)
-
18,375 75,250 76,125 64,750
Variable overheads payment (Rs.)
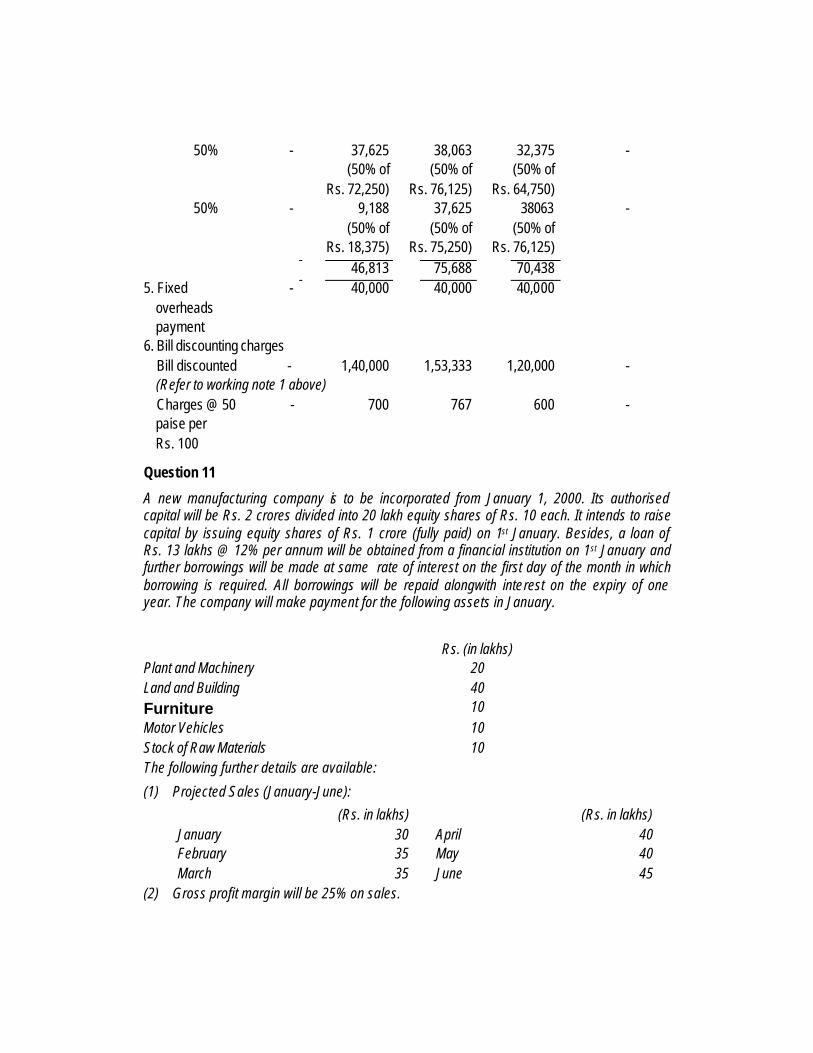
50% - 37,625 (50% of
Rs. 72,250)
38,063 (50% of
Rs. 76,125)
32,375 (50% of
Rs. 64,750)
-
50% - 9,188 (50% of
Rs. 18,375)
37,625 (50% of
Rs. 75,250)
38063 (50% of
Rs. 76,125)
-
46,813 75,688 70,438 5. Fixed overheads payment
- 40,000 40,000 40,000
6. Bill discounting charges Bill discounted - 1,40,000 1,53,333 1,20,000 - (Refer to working note 1 above) Charges @ 50 - paise per Rs. 100
700 767 600 -
Question 11
A new manufacturing company is to be incorporated from January 1, 2000. Its authorised capital will be Rs. 2 crores divided into 20 lakh equity shares of Rs. 10 each. It intends to raise capital by issuing equity shares of Rs. 1 crore (fully paid) on 1st January. Besides, a loan of Rs. 13 lakhs @ 12% per annum will be obtained from a financial institution on 1st January and further borrowings will be made at same rate of interest on the first day of the month in which borrowing is required. All borrowings will be repaid alongwith interest on the expiry of one year. The company will make payment for the following assets in January.
Rs. (in lakhs) Plant and Machinery 20 Land and Building 40 Furniture 10 Motor Vehicles 10 Stock of Raw Materials 10 The following further details are available:
(1) Projected Sales (January-June):
(Rs. in lakhs) (Rs. in lakhs) January 30 April 40 February 35 May 40 March 35 June 45
(2) Gross profit margin will be 25% on sales.

(3) The company will make credit sales only and these will be collected in the second month following sales.
(4) Creditors will be paid in the first month following credit purchases. There will be credit purchases only.
(5) The company will keep minimum stock of raw materials of Rs. 10 lakhs.
(6) Depreciation will be charged @ 10% per annum on cost on all fixed assets.
(7) Payment of preliminary expenses of Rs. 1 lakh will be made in January.
(8) Wages and salaries will be Rs. 2 lakhs each month and will be paid on the first day of the next month.
(9) Administrative expenses of Rs.1 lakh per month will be paid in the month of their incurrence.
Assume no minimum required cash balance.
You are required to prepare the monthly cash budget (January-June), the projected Income Statement for the 6 months period and the projected Balance Sheet as on 30 th June, 2000 .
(Final-May 2000) (20 marks) Answer
Monthly Cash Budget (January-June) (Rs. in lakhs)
Jan. Feb. March April May June Total Opening cash balance - 21.00 - 2.75 10.50 14.50 -
A. Cash inflows Equity shares 100.00 - - - - - 100.00 Loans 13 2.50 - - - - 15.50 (Refer to working note 1) Receipt from debtors - - 30.00 35.00 35.00 40.00 140.00 Total (A) 113.00 23.50 30.00 37.75 45.50 54.50 255.50
B. Cash Outflows Plant and Machinery 20.00 - - - - - 20.00 Land and Building 40.00 - - - - - 40.00 Furniture 10.00 - - - - - 10.00 Motor Vehicles 10.00 - - - - - 10.00 Stock of raw materials 10.00 - - - - - 10.00
(minimum stock) Preliminary expenses 1.00 - - - - - 1.00 Payment to creditors for credit purchases
- 20.50 24.25 24.25 28.00 28.00 125.00
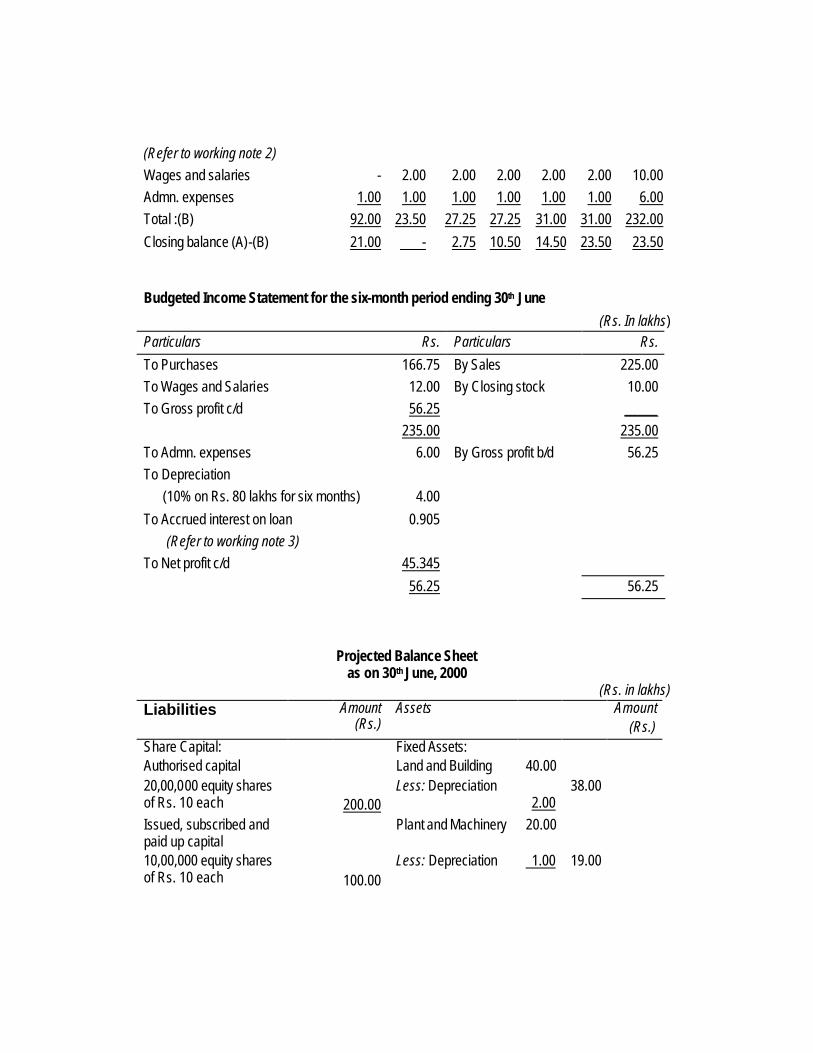
(Refer to working note 2) Wages and salaries - 2.00 2.00 2.00 2.00 2.00 10.00 Admn. expenses 1.00 1.00 1.00 1.00 1.00 1.00 6.00 Total :(B) 92.00 23.50 27.25 27.25 31.00 31.00 232.00
Closing balance (A)-(B) 21.00 - 2.75 10.50 14.50 23.50 23.50
Budgeted Income Statement for the six-month period ending 30th June
(Rs. In lakhs) Particulars Rs. Particulars Rs.
To Purchases 166.75 By Sales 225.00 To Wages and Salaries 12.00 By Closing stock 10.00 To Gross profit c/d 56.25 _____ 235.00 235.00 To Admn. expenses 6.00 By Gross profit b/d 56.25 To Depreciation
(10% on Rs. 80 lakhs for six months) 4.00
To Accrued interest on loan (Refer to working note 3)
0.905
To Net profit c/d 45.345
56.25 56.25
Projected Balance Sheet as on 30th June, 2000
(Rs. in lakhs) Liabilities Amount
(Rs.) Assets Amount
(Rs.) Share Capital: Fixed Assets: Authorised capital Land and Building 40.00 20,00,000 equity shares of Rs. 10 each
200.00
Less: Depreciation 2.00
38.00
Issued, subscribed and paid up capital
Plant and Machinery 20.00
10,00,000 equity shares of Rs. 10 each
100.00
Less: Depreciation 1.00 19.00

Reserve and Surplus Furniture 10.00 Profit and Loss 45.345 Less: Depreciation 0.50 9.50 Long-term loans 15.50 Motor Vehicles 10.00 Current liabilities and provisions:
Less: Depreciation 0.50 9.50 76.00
Sundry creditors 31.75 Current Assets: Accrued interest 0.905 Stock 10.00 Outstanding expenses 2.00 34.655 Sundry debtors 85.00 Cash 23.50 118.50 Miscellaneous
expenditure to the extent not written off:
_____ Preliminary expenses 1.00 195.50 195.50 Working Notes: 1. Subsequent Borrowings Needed (Rs. in lakhs) A. Cash Inflow Equity shares 100.00 Loans 13.00 Receipt from debtors - - 30.00 35.00 35.00 40.00 Total (A) 113.00 - 30.00 35.00 35.00 35.00
B. Cash Outflow Purchase of fixed assets 80.00 Stock 10.00 Preliminary expenses 1.00 Payment to creditors - 20.50 24.25 24.25 28.00 28.00 Wages and salaries - 2.00 2.00 2.00 2.00 2.00
Administrative expenses 1.00 1.00 1.00 1.00 1.00 1.00 Total 92.00 23.50 27.25 27.25 31.00 31.00 Surplus/ (Deficit) 21.00 23.50 2.75 7.75 4.00 9.00 Cumulative balance 21.00 (2.50) 0.25 8.00 12.00 21.00 There is shortage of cash in February of Rs. 25 lakhs which will be met by borrowings on February 1.
2. Payment to Creditors
Purchases = Cost of goods sold-Wages and salaries
Purchases for January= (75% of 30 lakhs) - Rs. 2 = Rs. 20.50 lakhs.
(Note: Since gross margin is 25% of sales, cost of manufacture i.e. materials plus wages

and salaries should be 75% of sales)
Hence, Purchases = Cost of manufacture minus wages and salaries of Rs. 2 lakhs)
The creditors are paid in the first month following purchases.
Therefore, payment in February is Rs. 20.50 lakhs
The same procedure will be followed for other months.
Total purchases = Rs. 125 lakhs (for Jan-May) + Rs. 31.75 lakhs (for June) + Rs. 10 lakhs (stock)
= Rs. 166.75 lakhs
3. Accrued Interest on Loan
12% interest on Rs. 13 lakhs for 6 months 0.78 lakhs Add: 12% interest on Rs. 2.5 lakhs for 5 months 0.125 lakhs 0.905 lakhs Question 12 From the following information, prepare a summarised Balance Sheet as at 31st March, 2002:
Working Capital Rs.2,40,000
Bank overdraft Rs.40,000
Fixed Assets to Proprietary ratio 0.75
Reserves and Surplus Rs.1,60,000
Current ratio 2.5
Liquid ratio 1.5
(PE-II-Nov.2002) (6 marks) Answer Working notes: 1. Current assets and Current liabilities computation:
15.2
sliabilitieCurrent
assetsCurrent = or 1
sliabilitieCurrent
2.5assetsCurrent = = k (say)
Or Current assets = 2.5 k and Current liabilities = k
Or Working capital = ( Current assets − Current liabilities)
Or Rs.2,40,000 = k (2.5 − 1) = 1.5 k Or k = Rs. 1,60,000
∴ Current liabilities = Rs. 1,60,000

Current assets = Rs.1,60,000 × 2.5 = Rs.4,00,000 2. Computation of stock
Liquid ratio = sliabilitieCurrent
assets Liquid
Or 1.5 = 0Rs.1,60,00Stock - assetsCurrent
Or 1.5 × Rs.1,60,000 = Rs.4,00,000 − Stock Or Stock = Rs.1,60,000 3. Computation of Proprietary fund; Fixed assets; Capital and Sundry creditors
Proprietary ratio = 75.0fundy Proprietar
assets Fixed =
∴ Fixed assets = 0.75 Proprietary fund
and Net working capital = 0.25 Proprietary fund
Or Rs.2,40,000/0.25 = Proprietary fund
Or Proprietary fund = Rs.9,60,000
and Fixed assets = 0.75 proprietary fund
= 0.75 × Rs.9,60,000
= Rs.7,20,000
Capital = Proprietary fund − Reserves & Surplus
= Rs.9,60,000 − Rs.1,60,000
= Rs.8,00,000
Sundry creditors = (Current liabilities − Bank overdraft)
= (Rs.1,60,000 − Rs.40,000)
= Rs.1,20,000
Construction of Balance sheet (Refer to working notes 1 to 3)
Balance Sheet
Rs. Rs.
Capital 8,00,000 Fixed assets 7,20,000
Reserves & Surplus 1,60,000 Stock 1,60,000

Bank overdraft 40,000 Current assets 2,40,000
Sundry creditors 1,20,000
11,20,000 11,20,000 Question 13 With the help of the following information complete the Balance Sheet of MNOP Ltd.:
Equity share capital Rs. 1,00,000
The relevant ratios of the company are as follows:
Current debt to total debt .40
Total debt to owner’s equity .60
Fixed assets to owner’s equity .60
Total assets turnover 2 Times
Inventory turnover 8 Times
(PE-II-May 2005) (7 marks)
Answer
MNOP Ltd
Balance Sheet
Liabilities Rs Assets Rs
Owner equity 1,00,000 Fixed assets 60,000
Current debt 24,000 Cash 60,000
Long term debt 36,000 Inventory 40,000
1,60,000 1,60,000
Working Notes
1. Total debt = 0.60 × Owners equity = 0.60 × Rs 1,00,000 = Rs 60,000
Current debt to total debt = 0.40 , hence current debt = 0.40 × 60,000 = 24,000
2. Fixed assets = 0.60 × Owners equity = 0.60 × Rs 1,00,000 = Rs 60,000
3. Total equity = Total debt + Owners equity = Rs 60,000 + Rs 1,00,000 = Rs 1,60,000
4. Total assets consisting of fixed assets and current assets must be equal to Rs 1,60,000 (Assets = Liabilities + Owners equity). Since Fixed assets are Rs 60,000 , hence, current assets should be Rs 1,00,000
5. Total assets to turnover = 2 Times : Inventory turnover = 8 Times

Hence , Inventory /Total assets = 2/8=1/4, Total assets = 1,60,000
Therefore Inventory = 1,60,000/4 = 40,000 Balance on Asset side
Cash = 1,00,000 – 40,000 = 60,000
Question 14
Using the following data, complete the Balance Sheet given below:
Gross Profits Rs. 54,000
Shareholders’ Funds Rs. 6,00,000
Gross Profit margin 20%
Credit sales to Total sales 80%
Total Assets turnover 0.3 times
Inventory turnover 4 times
Average collection period (a 360 days year)
20 days
Current ratio 1.8
Long-term Debt to Equity 40%
Balance Sheet
Creditors ………………….. Cash …………………..
Long-term debt ………………….. Debtors …………………..
Shareholders’ funds ………………….. Inventory …………………..
Fixed assets …………………..
(PE-II-Nov. 2005)(12 Marks)
Answer
Gross Profits Rs. 54,000
Gross Profit Margin 20%
∴ Sales = MarginProfit Gross
Profits Gross
= Rs. 54,000 / 0.20
= Rs. 2,70,000
Credit Sales to Total Sales = 80%

∴ Credit Sales = Rs. 2,70,000×0.80
= Rs. 2,16,000
Total Assets Turnover = 0.3 times
∴ Total Assets = Turnover AssetsTotal
Sales
= 3.0
000,70,2 Rs.
= Rs. 9,00,000
Sales – Gross Profits = COGS
∴ COGS = Rs. 2, 70,000 – 54,000
= Rs. 2, 16,000
Inventory turnover = 4 times
Inventory = 4000,16,2
turnover Inventory COGS
=
= Rs. 54,000
Average Collection Period = 20 days
∴ Debtors turnover = Period Collection Average
360
= 360/20=18
∴ Debtors = turnover DebtorsSalesCredit
= 18
2,16,000 Rs.
= Rs. 12,000
Current ratio = 1.8
1.8 = Creditors
Cash Inventory Debtors ++
1.8 Creditors = (Rs. 12,000 + Rs. 54,000 + Cash)
1.8 Creditors = Rs. 66,000 + Cash

Long-term Debt to Equity = 40%
Shareholders Funds = Rs. 6, 00,000
∴ Long-term Debt= Rs. 6, 00,000×40%
= Rs. 2, 40,000
Creditors (Balance figure)= 9, 00,000 – (6, 00,000 + 2, 40,000)
= Rs. 60,000
∴ Cash = (60,000×1.8) – 66,000
= Rs. 42,000
Balance Sheet (in Rs)
Creditors (Bal. Fig) 60,000 Cash 42,000
Debtors 12,000
Long- term debt 2,40,000 Inventory 54,000
Shareholders’ funds 6,00,000 Fixed Assets (Bal fig.) 7,92,000
9,00,000 9,00,000
Question 15
JKL Limited has the following Balance Sheets as on March 31, 2006 and March 31, 2005:
Balance Sheet
Rs. in lakhs March 31, 2006 March 31, 2005 Sources of Funds: Shareholders Funds 2,377 1,472
Loan Funds 3,570 3,083 5,947 4,555 Applications of Funds: Fixed Assets 3,466 2,900 Cash and bank 489 470
Debtors 1,495 1,168 Stock 2,867 2,407 Other Current Assets 1,567 1,404 Less: Current Liabilities (3,937) (3,794) 5,947 4,555

The Income Statement of the JKL Ltd. for the year ended is as follows:
Rs. in lakhs March 31, 2006 March 31, 2005 Sales 22,165 13,882 Less: Cost of Goods sold 20,860 12,544
Gross Profit 1,305 1,338 Less: Selling, General and Administrative expenses
1,135 752
Earnings before Interest and Tax (EBIT) 170 586 Interest Expense 113 105 Profits before Tax 57 481 Tax 23 192 Profits after Tax (PAT) 34 289
Required:
(i) Calculate for the year 2005-06:
(a) Inventory turnover ratio
(b) Financial Leverage
(c) Return on Investment (ROI)
(d) Return on Equity (ROE)
(e) Average Collection period.
(ii) Give a brief comment on the Financial Position of JKL Limited.
(PE-II-May 2006)(12 marks)
Answer
Ratios for the year 2005-2006
(i) (a) Inventory turnover ratio
Inventory Average
COGS =
22,407) (2,867
20,860
+=
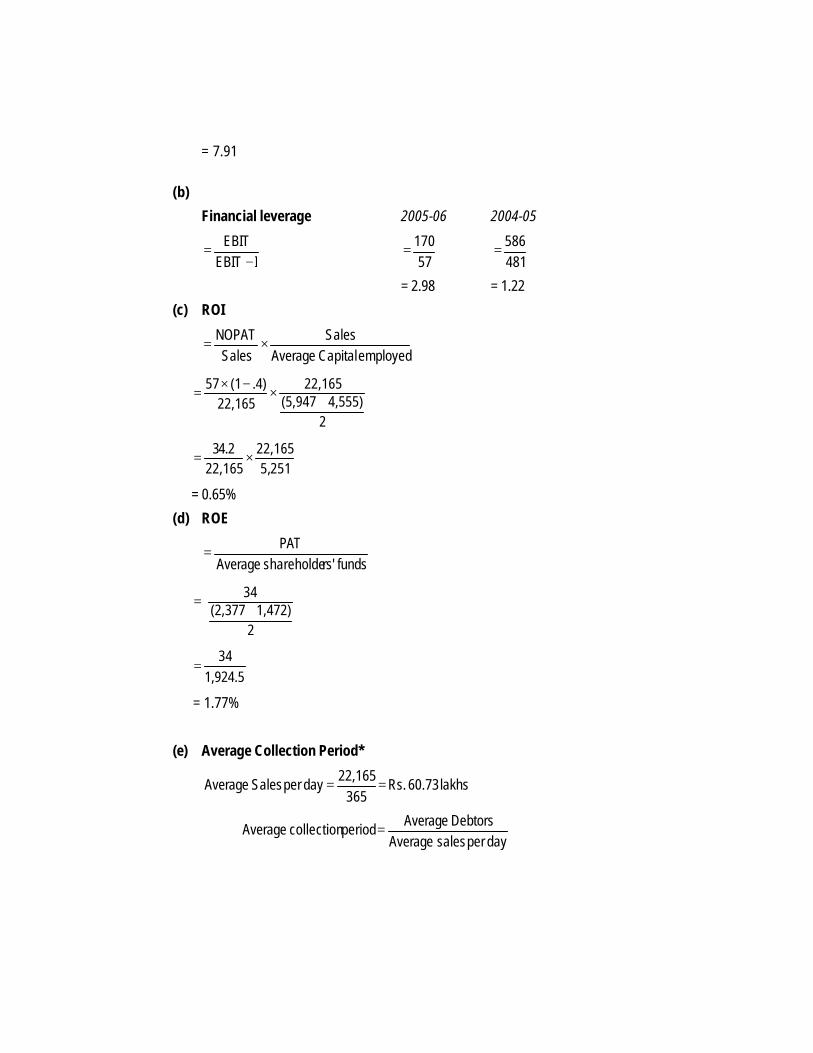
= 7.91
(b)
Financial leverage 2005-06 2004-05
I EBITEBIT
−
= 57
170 =
481586
=
= 2.98 = 1.22
(c) ROI
employed Capital Average
Sales
SalesNOPAT
×=
24,555) (5,947
22,165
22,165.4) (1 57
+
×−×
=
251,522,165
22,165
4.23 ×=
= 0.65%
(d) ROE
funds rs'shareholde Average
PAT =
21,472) (2,377
34
+=
1,924.5
43 =
= 1.77%
(e) Average Collection Period*
lakhs 60.73 Rs. 365
22,165 day per Sales Average ==
day per sales Average
Debtors Average period collection Average =

73.602
1,168) (1,495
+
=
60.73
5.1331 =
= 22 days
*Note: In the above solution, 1 year = 365 days has been assumed. Alternatively, some candidates may give the solution on the basis 1 year = 360 days.
(ii) Brief Comment on the financial position of JKL Ltd.
The profitability of operations of the company are showing sharp decline due to increase in operating expenses. The financial and operating leverages are becoming adverse.
The liquidity of the company is under great stress.
Question 16
The Financial statements of Excel AMP Graphics Limited are as under:
Balance Sheet As at 31st December, 2001 2001 2000
Sources of Funds: (Rs. in crores)
Shareholders’ funds
Share Capital 1,121 931
Reserves & Surplus 8,950 10,071 7,999
8,930
Loan Funds:
Secured Loans − 259
Finance lease obligations 74 −
Unsecured loans 171 245 115
374
10,316 9,304
Applications of Funds:
Fixed Assets
Gross Block 6,667 5,747
Less: Depreciation 3,150 2,561
Net Block 3,517 3,186

Capital Work-in-progress 27 3,544 28
3,214
Investments 288 222
Current Assets, Loans & Advances:
Inventories 2,709 2,540
Sundry debtors 9,468 9,428
Cash & Bank Balances 3,206 662
Loans & Advances 2,043 1,712
17,426 14,342
Less: Current liabilities & Provisions
Current liabilities 10,109 7,902
Provisions 513 572
10,622 8,474
Net Current Assets 6,804 5,868
Net Deferred Tax Liabiliy (320) −
10,316 9,304
Profit and Loss Account For the year ended 31 December, 2001
2001 2000 (Rs. in crores) Income: Sales & Services 23,436 17,849 Other Income 320 306 23,756 18,155 Expenditure: Cost of Materials 15,179 10,996 Personnel Expenses 2,543 2,293 Other Expenses 3,546 2,815 Depreciation 419 383 Less: Transfer from revaluation reserve 7 412 6 377 Interest 164 88 21,844 16,569 Profit Before Tax 1,912 1,586

Provision for Tax: Current Tax 450 371 Deferred Tax (6) − Profit after Tax 1,468 1,215 Required:
(a) Compute and analyse the return on capital employed (ROCE) in a Du-Pont control chart framework.
(b) Compute and analyse the average inventory holding period and average collection period.
(c) Compute and analyse the return on equity (ROE) by bringing out clearly the impact of financial leverage. (PE-II-Nov.2003) (16 marks)
Answer
(a) Working note: Computation of Cost of goods sold (COGS), Operating profit before depreciation, interest &
tax (OPBDIT), Operating profit before interest and tax (OPBIT), Profit before interest and tax (PBIT), Profit before tax (PBT) and Profit after tax (PAT) (Rs. in crores)
Year 2001 2000
Cost of goods sold (COGS) 21,268 16,104 (Material consumed + Personnel expenses + Other expenses) Operating profit before depreciation, interest and tax (OPBDIT) 2,168 1,745 (Income from sales & service – COGS)
Operating profit before interest and tax (OPBIT) 1,756 1,368 (OPBDIT – depreciation) Profit before interest and tax (PBIT) 2,076 1,674 (OPBIT + Other incomes) Profit before tax (PBT) 1,912 1,586 (PBIT – Interest)
Profit after tax (PAT) 1,468 1,215 (PBT – Tax)
Return on capital employed (ROCE): (Before interest & tax)
= employed Capital
Sales
Sales tax andinterest before profits Operating ×
= employed Capital
OPBIT
* Capital employed = (Balance sheet total − Capital WIP − Investments − Loans & advances) Year

2001 2000 ROCE 22.07% 18.63% (Refer to working note)
×100
Rs.7,958Rs.1,756
×100Rs.7,342Rs.1,368
Operating profit margin 7.49% 7.66% (Refer to working note)
×100Rs.23,436Rs.1,756
×100Rs.17,849Rs.1,368
Material consumed / Sales 64.77% 61.61% Personnel expenses /Sales 10.85% 12.85% Other expenses / Sales 15.13% 15.77% Depreciation / Sales 1.76% 2.11%
(b) Computation and analysis of average inventory holding period and average collection period:
(Rs.’ in crores) Year 2001 2000 1. Inventory turnover ratio: 5.6 4.33 (Material consumed/ Closing inventory)
(Rs.15,179/Rs.2,709) (Rs.10,996/Rs.2,540)
2. Average inventory turnover period: 64 days 83 days (360 days / Inventory turnover ratio) 3. Receivables turnover ratio: 2.48 1.89 (Net credit sales/Closing Sundry debtors)
(Rs.23,436/Rs.9,468) (Rs.17,849/Rs.9,428)
4. Average collection period: 145 days 190 days (360 days / Receivables turnover ratio)
(c) ROE = PAT / Shareholders’ funds
2001 2000
= Cr. 10,071Cr. 1,468
Cr. 8,930Cr. 1,215
= 14.58 % 13.61%
ROE = ROA + ED { (ROA − i ∗ ( 1 − T c)}
ROA (Post tax) 14.34% 12.11% {(ROCE ∗ (1 − .35)} Tax / PBT 23.22% 23.39% Loan funds / Total funds 2.37% 4.02% Shareholders Funds / Total funds 97.63% 95.98% ROE is marginally better than ROA, as debt ratio employed by the company is minimal.
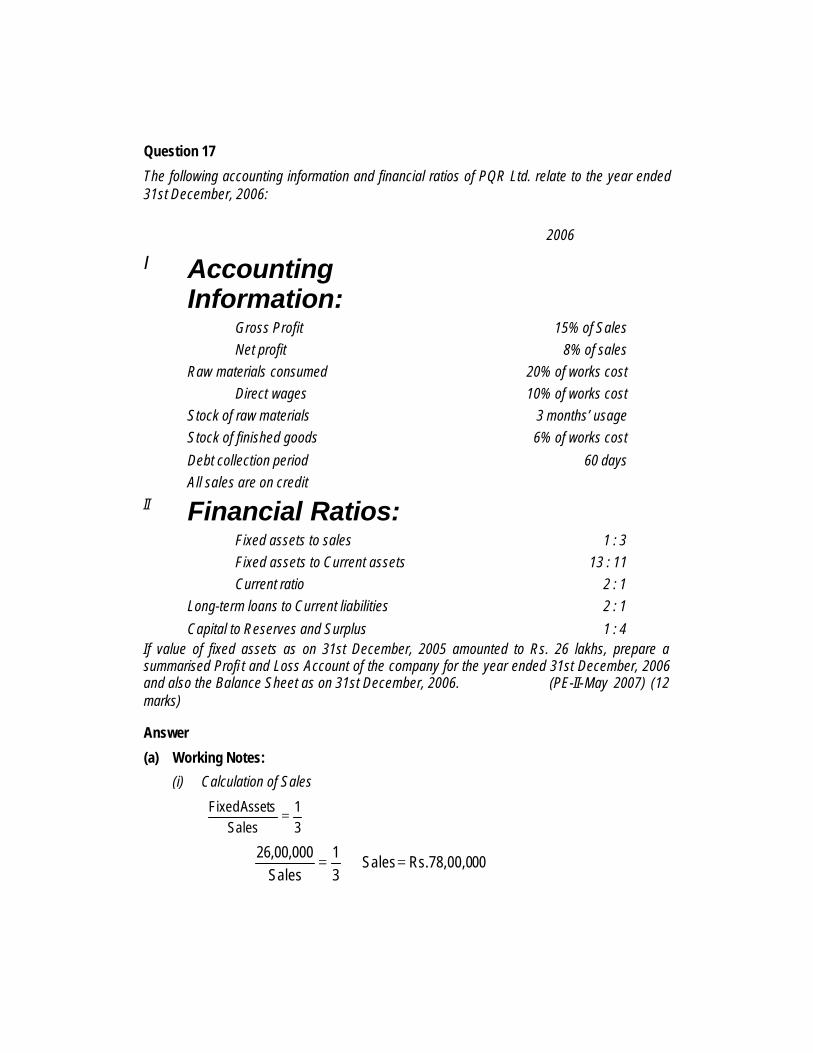
Question 17
The following accounting information and financial ratios of PQR Ltd. relate to the year ended 31st December, 2006:
2006
I Accounting Information:
Gross Profit 15% of Sales Net profit 8% of sales Raw materials consumed 20% of works cost Direct wages 10% of works cost Stock of raw materials 3 months’ usage Stock of finished goods 6% of works cost
Debt collection period 60 days All sales are on credit
II Financial Ratios:
Fixed assets to sales 1 : 3 Fixed assets to Current assets 13 : 11 Current ratio 2 : 1 Long-term loans to Current liabilities 2 : 1
Capital to Reserves and Surplus 1 : 4 If value of fixed assets as on 31st December, 2005 amounted to Rs. 26 lakhs, prepare a summarised Profi t and Loss Account of the company for the year ended 31st December, 2006 and also the Balance Sheet as on 31st December, 2006. (PE-II-May 2007) (12 marks)
Answer
(a) Working Notes:
(i) Calculation of Sales
31
Sales AssetsFixed =
∴ 00Rs.78,00,0 Sales 31
Sales26,00,000
=⇒=
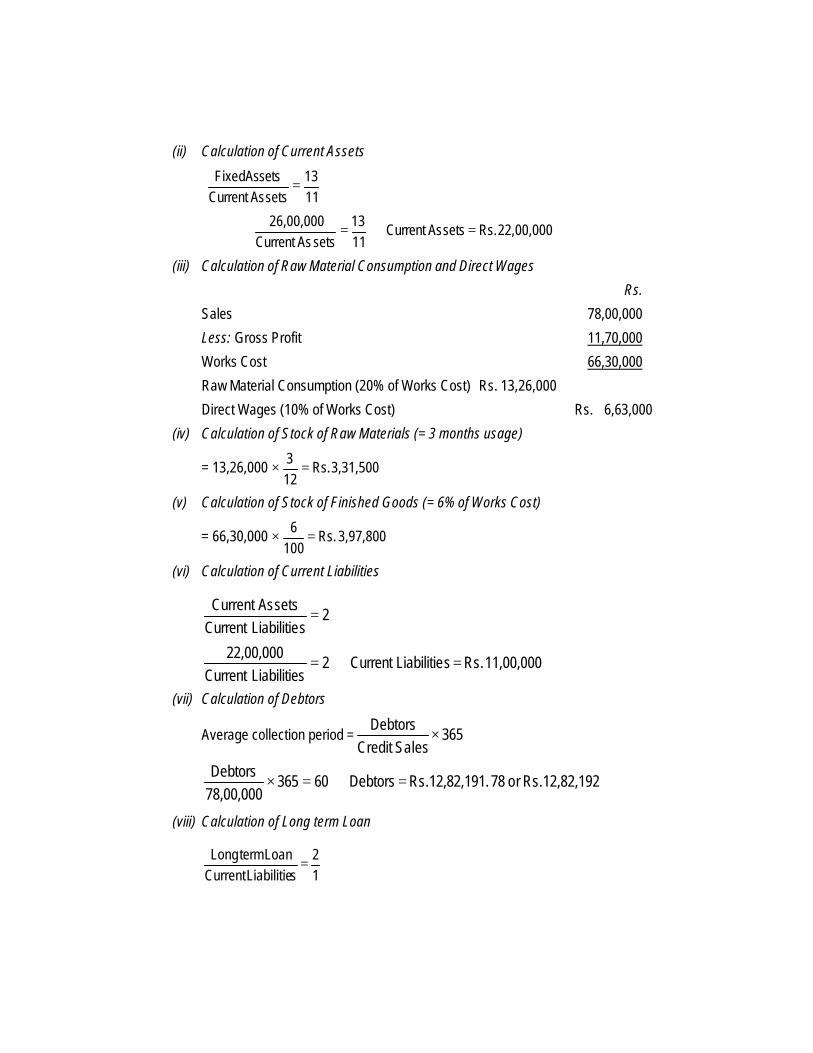
(ii) Calculation of Current Assets
1113
setsCurrent As AssetsFixed =
∴ 22,00,000 Rs. setsCurrent As 1113
setsCurrent As26,00,000 =⇒=
(iii) Calculation of Raw Material Consumption and Direct Wages
Rs.
Sales 78,00,000
Less: Gross Profit 11,70,000
Works Cost 66,30,000
Raw Material Consumption (20% of Works Cost) Rs. 13,26,000
Direct Wages (10% of Works Cost) Rs. 6,63,000
(iv) Calculation of Stock of Raw Materials (= 3 months usage)
= 13,26,000 × 3,31,500 Rs.123 =
(v) Calculation of Stock of Finished Goods (= 6% of Works Cost)
= 66,30,000 × 3,97,800 Rs.100
6 =
(vi) Calculation of Current Liabilities
2sLiabilitieCurrent
setsCurrent As=
11,00,000 Rs. sLiabilitieCurrent 2sLiabilitieCurrent
22,00,000=⇒=
(vii) Calculation of Debtors
Average collection period = 365 SalesCredit
Debtors×
12,82,192 Rs. or 7812,82,191. Rs. Debtors 60 365 78,00,000Debtors
=⇒=×
(viii) Calculation of Long term Loan
12
sLiabilitieCurrent
Loan term Long =

22,00,000. Rs. loan term Long 12
11,00,000
loan term Long=⇒=
(ix) Calculation of Cash Balance
Rs.
Current assets 22,00,000 Less: Debtors 12,82,192
Raw materials stock 3,31,500
Finished goods stock 3,97,800 20,11,492 Cash balance 1,88,508
(x) Calculation of Net worth
Fixed Assets 26,00,000
Current Assets 22,00,000 Total Assets 48,00,000
Less: Long term Loan 22,00,000
Current Liabilities 11,00,000 33,00,000 Net worth 15,00,000
Net worth = Share capital + Reserves = 15,00,000
3,00,000 Rs.51
15,00,000 Capital Share41
Surplus and ReservesCapital
=×=⇒=
12,00,000 Rs.54
15,00,000 Surplus and Reserves =×=
Profit and Loss Account of PQR Ltd. for the year ended 31st December, 2006
Particulars Rs. Particulars Rs. To Direct Materials 13,26,000 By Sales 78,00,000
To Direct Wages 6,63,000
To Works (Overhead) Balancing figure
46,41,000
To Gross Profit c/d
(15% of Sales)
11,70,000
________
78,00,000 78,00,000
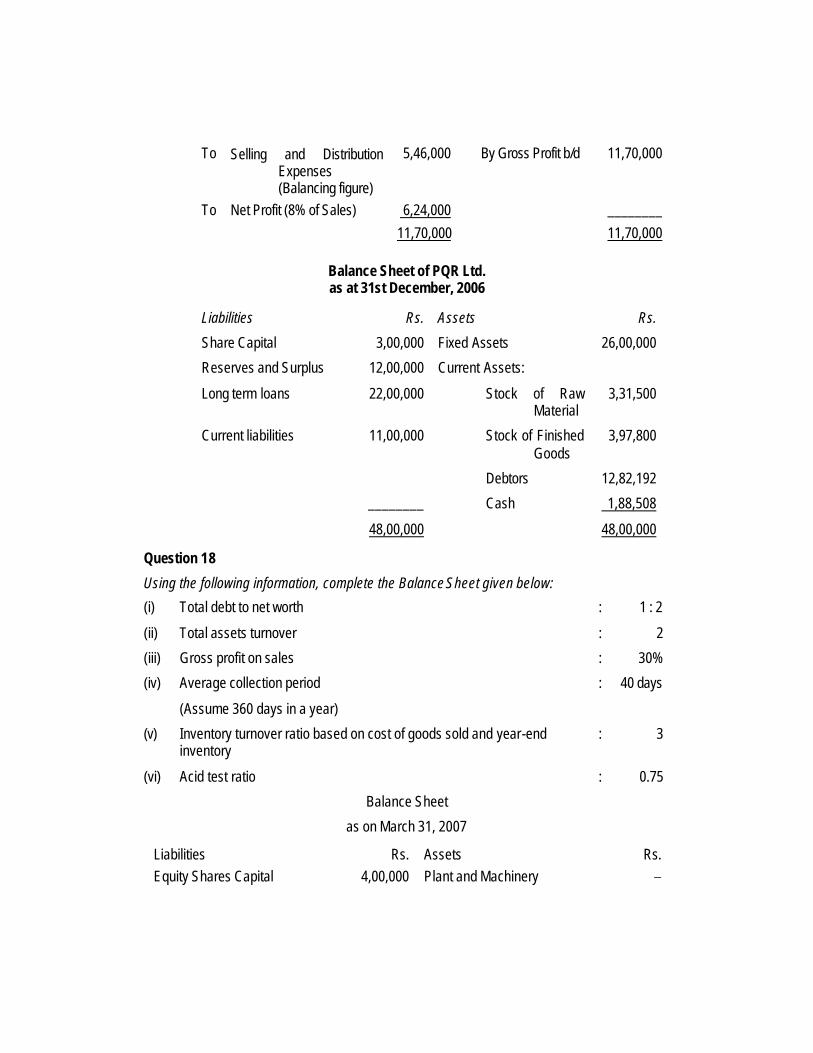
To Selling and Distribution Expenses (Balancing figure)
5,46,000 By Gross Profit b/d 11,70,000
To Net Profit (8% of Sales) 6,24,000 ________
11,70,000 11,70,000
Balance Sheet of PQR Ltd. as at 31st December, 2006
Liabilities Rs. Assets Rs.
Share Capital 3,00,000 Fixed Assets 26,00,000
Reserves and Surplus 12,00,000 Current Assets:
Long term loans 22,00,000 Stock of Raw Material
3,31,500
Current liabilities 11,00,000 Stock of Finished Goods
3,97,800
Debtors 12,82,192
________ Cash 1,88,508
48,00,000 48,00,000
Question 18
Using the following information, complete the Balance Sheet given below:
(i) Total debt to net worth : 1 : 2
(ii) Total assets turnover : 2
(iii) Gross profit on sales : 30%
(iv) Average collection period : 40 days
(Assume 360 days in a year)
(v) Inventory turnover ratio based on cost of goods sold and year-end inventory
: 3
(vi) Acid test ratio : 0.75
Balance Sheet
as on March 31, 2007
Liabilities Rs. Assets Rs. Equity Shares Capital 4,00,000 Plant and Machinery −

Reserves and Surplus 6,00,000 and other Fixed Assets
Total Debt: Current Assets: Current Liabilities − Inventory −
Debtors − Cash − _______ _______
(PE-II-Nov. 2007) (8 marks)
Answer
Networth = Capital + Reserves and surplus
= 4,00,000 + 6,00,000 = Rs. 10,00,000
21
Networth
Debt Total =
∴ Total debt = Rs. 5,00,000
Total Liability side = 4,00,000 + 6,00,000 + 5,00,000
= Rs. 15,00,000
= Total Assets
Total Assets Turnover = assets Total
Sales
2 = 15,00,000
Sales
∴ Sales = Rs. 30,00,000
Gross Profit on Sales : 30% i.e . Rs. 9,00,000
∴ COGS = Rs. 30,00,000 – Rs. 9,00,000
= Rs. 21,00,000
Inventory turnover = Inventory
COGS
3 = Inventory21,00,000
∴ Inventory = Rs. 7,00,000
Average collection period = day / Sales
debtors Average

40 = 360 / 30,00,000
Debtors
∴ Debtors = Rs. 3,33,333.
Acid test ratio = sliabilitieCurrent
Stock setsCurrent As −
0.75 = 5,00,0007,00,000 setsCurrent As −
∴ Current Assets = Rs. 10,75,000.
∴ Fixed Assets = Total Assets – Current Assets
= 15,00,000 – 10,75,000 = Rs. 4,25,000
Cash and Bank balance = Current Assets – Inventory – Debtors
= 10,75,000 – 7,00,000 – 3,33,333
= Rs. 41,667.
Balance Sheet as on March 31, 2007
Liabilities Rs. Assets Rs. Equity Share Capital
Reserves & Surplus
4,00,000
6,00,000 Plant and Machinery and other Fixed Assets
4,25,000
Total Debt: Current Assets:
Current liabilities
5,00,000 Inventory 7,00,000
Debtors 3,33,333
________ Cash 41,667
15,00,000 15,00,000
Question 19
Distinguish between Cash Flow and Fund Flow statement.(PE-II-Nov.2002, May 2004) (3 marks)
Answer
The points of distinction between cash flow and funds flow statement are as below:
Cash flow statement Funds flow statement
(i) It ascertains the changes in balance of cash in hand and bank.
(i) It ascertains the changes in financial position between two accounting periods.

(ii) It analyses the reasons for changes in balance of cash in hand and bank
(ii) It analyses the reasons for change in financial position between two balance sheets
(iii) It shows the inflows and outflows of cash.
(iii) It reveals the sources and application of finds.
(iv) It is an important tool for short term analysis.
(iv) It helps to test whether working capital has been effectively used or not.
(v) The two significant areas of analysis are cash generating efficiency and free cash flow.
Question 20
Discuss any three ratios computed for investment analysis.(PE-II--Nov.2004) (3 marks)
Answer
Three ratios computed for investment analysis are as follows;
(i) Earning per share = goutstandin sharesequity of Number
tax afterProfit
(ii) Dividend yield ratio = share per priceMarket
100 share per dividendEquity ×
(iii) Return on capital employed = employed Capital
100 tax andinterest beforeprofit Net ×
Question 21
Discuss the financial ratios for evaluating company performance on operating efficiency and liquidity position aspects. (PE-II-Nov. 2006) (4 marks)
Answer
Financial ratios for evaluating performance on operational efficiency and liquidity position aspects are discussed as:
Operating Efficiency: Ratio analysis throws light on the degree of efficiency in the management and utilization of its assets. The various activity ratios (such as turnover ratios) measure this kind of operational efficiency. These ratios are employed to evaluate the efficiency with which the firm manages and utilises its assets. These ratios usually indicate the frequency of sales with respect to its assets. These assets may be capital assets or working capital or average inventory. In fact, the solvency of a firm is, in the ultimate analysis, dependent upon the sales revenues generated by use of its assets – total as well as its components.
Liquidity Position: With the help of ratio analysis, one can draw conclusions regarding

liquidity position of a firm. The liquidity position of a firm would be satisfactory, if it is able to meet its current obligations when they become due. Inability to pay-off short-term liabilities affects its credibility as well as its credit rating. Continuous default on the part o f the business leads to commercial bankruptcy. Eventually such commercial bankruptcy may lead to its sickness and dissolution. Liquidity ratios are current ratio, liquid ratio and cash to current liability ratio. These ratios are particularly useful in credit analysis by banks and other suppliers of short-term loans.

4 CAPITAL BUDGETING
Question 1
Nine Gems Ltd. has just installed Machine-R at a cost of Rs. 2,00,000. The machine has a five year life with no residual value. The annual volume of production is estimated at 1,50,000 units, which can be sold at Rs. 6 per unit. Annual operating costs are estimated at Rs. 2,00,000 (excluding depreciation) at this output level. Fixed costs are estimated at Rs. 3 per unit for the same level of production.
Nine Gems Ltd. has just come across another model called Machine-S capable of giving the same output at an annual operating cost of Rs. 1,80,000 (exclusive of depreciation).There will be no change in fixed costs. Capital cost of this machine is Rs. 2,50,000 and the estimated life is for five years with nil residual value.
The company has an offer for sale of Machine-R at Rs. 1,00,000. But the cost of dismantling and removal will amount to Rs. 30,000. As the company has not yet commenced operations, it wants to sell Machine –R and purchase Machine-S.
Nine Gems Ltd. will be a zero-tax company for seven years in view of several incentives and allowances available.
The cost of capital may be assumed at 14%. P.V. factors for five years are as follows:
Year P.V. Factors 1 0.877 2 0.769 3 0.675 4 0.592 5 0.519
(i) Advise whether the company should opt for the replacement.
(ii) Will there be any change in your view if Machine-R has not been installed but the company is in the process of selecting one or the other machine?
Support your view with necessary workings. (Final-Nov. 1996) (12 marks)

Answer
(i) Replacement of Machine –R
Incremental cash out flow
(i) Cash out flow on Machine –S Rs. 2,50,000
Less: Sale Value of Machine –R
Less : Cost of dismantling and removal
(Rs. 1,00,000-Rs. 30,000)
Rs. 70,000
Net outflow Rs. 1,80,000
Incremental cash flow from Machine-S
Annual cash flow from Machine –S Rs. 2,70,000
Annual cash flow from Machine –R Rs. 2,50,000
Net incremental Cash in flow Rs. 20,000
Present value of incremental cash in flows
= Rs. 20,000 × (0.877 +0.769+0.675+0.592+0.519)
= 20,000 × 3.432 = Rs. 68,640
NPV of Machine -S = Rs. 68,640 – Rs. 1,80,000
= (-) Rs. 1,11,360
Rs. 2,00,000 spent on Machine –R is a sunk cost and hence it is not relevant for deciding the replacement.
Decision: Since Net present value of Machine –S is in the negative, replacement is not advised.
If the company is in the process of selecting one of the two machines, the decision is to be made on the basis of independent evaluation of two machines by comparing their Net-present values.
(ii) Independent evaluation of Machine –R and Machine –S:
Machine –R Machine –S Units produced 1,50,000 1,50,000 Selling price per unit (Rs.) 6 6 Sale value 9,00,000 9,00,000 Less: Operating Cost
(exclusive of depreciation) 2,00,000 1,80,000 Contribution 7,00,000 7,20,000
Less: Fixed Cost 4,50,000 4,50,000 Annual cash flow 2,50,000 2,70,000

Present value of cash flows for five years 8,58,000 9,26,640 Cash Outflow 2,00,000 2,50,000 Net Present Value 6,58,000 6,76,640 As the NPV of cash in flow of Machine –S is higher than that of Machine –R, the choice should fall on machine –S.
Note: As the company is a zero tax company for seven years (Machine life in both cases is only for five years), depreciation and the tax effect on the same are not relevant for consideration.
Question 2
(a) Following are the data on a capital project being evaluated by the management of X Ltd.:
Project M Annual cost saving Rs. 40,000 Useful life 4 years I.R.R 15% Profitability index (PI) 1,064 NPV ? Cost of capital ? Cost of project ? Payback ?
Salvage value 0
Find the missing values considering the following table of discount factor only:
Discount factor 15% 14% 13% 12%
1 Year 0.869 0.877 0.885 0.893
2 Years 0.756 0.769 0.783 0.797
3 Years 0.658 0.675 0.693 0.712
4 Years 0.572 0.592 0.613 0.636
2.855 2.913 2.974 3.038
(b) S Ltd. has Rs. 10,00,000 allocated for capital budgeting purposes. The following proposals and associated profitability indexes have been determined.
Project Amount Profitability Index 1 3,00,000 1.22 2 1,50,000 0.95 3 3,50,000 1.20 4 4,50,000 1.18 5 2,00,000 1.20

6 4,00,000 1.05
Which of the above investments should be undertaken? Assume that projects are indivisible and there is no alternative use of the money allocated for capital budgeting.
(Final-Nov. 1998) (12 + 8 marks)
Answer
(a) Cost of Project M
At 15% I.R.R., the sum total of cash inflows = Cost of the project i.e. Initial cash outlay 11 Given:
Annual cost saving Rs. 40,000 Useful life 4 years IRR 15%
Now, considering the discount factor table @ 15% cumulative present value of cash inflows for 4 years is 2.855
Therefore,
Total of cash inflows for 4 years for Project M is (Rs. 40,000 × 2.855) = Rs. 1,14,200
Hence, cost of the project is = Rs. 1,14,200
Payback period of the Project M
Payback period = =
=
= 2.855 or 2 years 11 months approximately
Cost of Capital
If the profitability index (PI) is 1, cash inflows and outflows would be equal. In this case, (PI) is 1.064. Therefore, cash inflows would be more by 0.64 than outflow.
Probability index (PI) =
or 0.064 =
or 1.064 × Rs. 1,14,200 = Rs. 1,21,509
Cost of the project Annual cost saving
Discounted cash inflows Cost of the Project
Discounted cash inflows
Rs.
Rs. 1,14,200 40,000

Hence discounted cash inflows =Rs. 1,21,509
Since, Annual cost saving is Rs. 40,000. Hence, cumulative discount factor for 4 years
= = 3.037725 or 3.038
Considering the discount factor table at discount rate of 12%, the cumulative discount factor for 4 years is 3.038
Hence, the cost of capital is 12%
Net present value of the project
N.P.V. = Total present values of cash inflows – Cost of the project
= Rs. 1,21,509 – Rs. 1,14,200
= Rs. 7,309
(b) Statement showing ranking of projects on the basis of Profitability Index
Project Amount (Rs.)
P.I. Rank
1 3,00,000 1.22 1 2 1,50,000 0.95 5 3 3,50,000 1.20 2 4 4,50,000 1.18 3 5 2,00,000 1.20 2 6 4,00,000 1.05 4
Assuming that projects are indivisible and there is no alternative use of the money allocated for capital budgeting on the basis of P.I. , the S Ltd. is advised to undertake investment in projects 1,3 and 5.
However, among the alternative projects the allocation should be made to the projects which adds the most to the shareholders wealth. The NPV method, by its definition, will always select such projects.
Statement showing NPV of the projects
Project
(i)
Amount (Rs.) (ii)
P.I.
(iii)
Cash inflows of project (Rs.)
(iv)=[(ii) × (iii)]
N.P.V. of project (Rs.)
(v)=[(iv)-(ii)] 1 3,00,000 1.22 3,66,000 66,000 2 1,50,000 0.95 1,42,500 (-) 7,500 3 3,50,000 1.20 4,20,000 70,000 4 4,50,000 1.18 5,31,000 81,000
1,21,509 40,000

5 2,00,000 1.20 2,40,000 40,000 6 4,00,000 1.05 4,20,000 20,000
The allocation of funds to the projects 1,3 and 5 (as selected above on the basis of PI) will give NPV of Rs. 1,76,000 and Rs. 1,50,000 will remain unspent.
However, the NPV of the projects 3,4 and 5 is Rs. 1,91,000 which is more than the N.P.V. of projects 1,3 and 5. Further, by undertaking projects 3,4 and 5 no money will remain unspent. Therefore, S Ltd. is advised to undertake investments in projects 3,4 and 5.
Question 3
A large profit making company is considering the installation of a machine to process the waste produced by one of its existing manufacturing process to be converted into a marketable product. At present, the waste is removed by a contractor for disposal on payment by the company of Rs. 50 lacs per annum for the next four years. The contract can be terminated upon installation of the aforesaid machine on payment of a compensation of Rs. 30 lacs before the processing operation starts. This compensation is not allowed as deduction for tax purposes.
The machine required for carrying out the processing will cost Rs. 200 lacs to be financed by a loan repayable in 4 equal installments commencing from the end of year 1. The interest rate is 16% per annum. At the end of the 4th year, the machine can be sold for Rs. 20 lacs and the cost of dismantling and removal will be Rs. 15 lacs.
Sales and direct costs of the product emerging from waste processing for 4 years are estimated as under:
(Rs. In lacs)
Year 1 2 3 4 Sales 322 322 418 418 Material consumption 30 40 85 85 Wages 75 75 85 100 Other expenses 40 45 54 70 Factory overheads 55 60 110 145 Depreciation (as per income tax rules) 50 38 28 21
Initial stock of materials required before commencement of the processing operations is Rs. 20 lacs at the start of year 1. The stock levels of materials to be maintained at the end of year 1, 2 and 3 will be Rs. 55 lacs and the stocks at the end of year 4 will be nil. The storage of materials will utilise space which would otherwise have been rented out for Rs. 10 lacs per annum. Labour costs include wages of 40 workers, whose transfer to this process will reduce idle time payments of Rs. 15 lacs in the year 1 and Rs. 10 lacs in the year 2. Factory overheads include apportionment of general factory overheads except to the extent of insurance charges of Rs. 30 lacs per annum payable on this venture. The company’s tax rate is 50%.

Present value factors for four years are as under:
Year 1 2 3 4 Present value factors 0.870 0.756 0.658 0.572
Advise the management on the desirability of installing the machine for processing the waste. All calculations should form part of the answer. (Final-May 1999) (20 marks)
Answer
Statement of Incremental Profit
(Rs. in lacs)
Years 1 2 3 4
Sales :(A) 322 322 418 418
Material consumption 30 40 85 85
Wages 60 65 85 100
Other expenses 40 45 54 70
Factory overheads (insurance) 30 30 30 30
Loss of rent 10 10 10 10
Interest 32 24 16 8
Depreciation (as per income tax rules) 50 38 28 21
Total cost: (B) 252 252 308 324
Incremental profit (C)=(A)-(B) 70 70 110 94
Tax (50% of (C)) 35 35 55 47
Statement of Incremental Cash Flows
(Rs. in lacs)
Years 0 1 2 3 4
Material stocks (20) (35) - - - Compensation for contract (30) - - - - Contract payment saved - 50 50 50 50 Tax on contract payment - (25) (25) (25) (25) Incremental profit - 70 70 110 94 Depreciation added back - 50 38 28 21 Tax on profits - (35) (35) (55) (47) Loan repayment - (50) (50) (50) (50) Profit on sale of machinery (net) - - - - 5
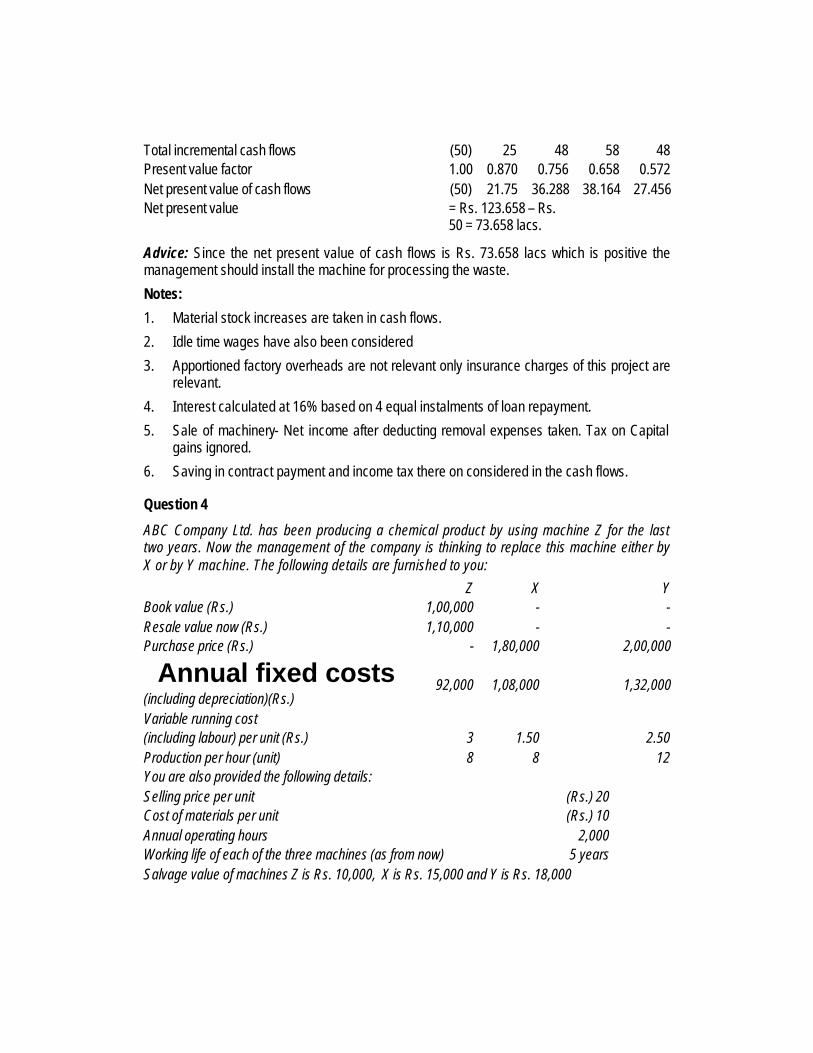
Total incremental cash flows (50) 25 48 58 48 Present value factor 1.00 0.870 0.756 0.658 0.572 Net present value of cash flows (50) 21.75 36.288 38.164 27.456 Net present value = Rs. 123.658 – Rs.
50 = 73.658 lacs.
Advice: Since the net present value of cash flows is Rs. 73.658 lacs which is positive the management should install the machine for processing the waste.
Notes:
1. Material stock increases are taken in cash flows.
2. Idle time wages have also been considered
3. Apportioned factory overheads are not relevant only insurance charges of this project are relevant.
4. Interest calculated at 16% based on 4 equal instalments of loan repayment.
5. Sale of machinery- Net income after deducting removal expenses taken. Tax on Capital gains ignored.
6. Saving in contract payment and income tax there on considered in the cash flows.
Question 4
ABC Company Ltd. has been producing a chemical product by using machine Z for the last two years. Now the management of the company is thinking to replace this machine either by X or by Y machine. The following details are furnished to you:
Z X Y Book value (Rs.) 1,00,000 - - Resale value now (Rs.) 1,10,000 - - Purchase price (Rs.) - 1,80,000 2,00,000
Annual fixed costs (including depreciation)(Rs.)
92,000
1,08,000
1,32,000
Variable running cost (including labour) per unit (Rs.)
3
1.50
2.50
Production per hour (unit) 8 8 12 You are also provided the following details: Selling price per unit (Rs.) 20 Cost of materials per unit (Rs.) 10 Annual operating hours 2,000 Working life of each of the three machines (as from now) 5 years Salvage value of machines Z is Rs. 10,000, X is Rs. 15,000 and Y is Rs. 18,000

The company charges depreciation using straight line method. It is anticipated that an additional cost of Rs. 8,000 per annum would be incurred on special advertising to sell the extra output of machine Y. Assume tax rate of 50% and cost of capital 10%. The present value of Rs. 1 to be received at the end of the year at 10% is as under:
Year 1 2 3 4 5 Present value .909 .826 .751 .683 .621
Required: Using NPV method, you are required to analyse the feasibility of the proposal and make recommendations. (Final-Nov.1999) (14 marks)
Answer
ABC Company Ltd.
Computation of yearly cash inflow
Machine Z X Y Sales (units) 16,000 16,000 24,000 Selling price per unit (Rs.)
20 20 20
Sales: (A) 3,20,000 3,20,000 4,80,000 Less: Costs Variable running costs
48,000 24,000 60,000
Material cost 1,60,000 1,60,000 2,40,000 Annual fixed cost
92,000 3,00,000 1,08,000 2,92,000 1,32,000 4,32,000
Additional cost (special advertising)
- - 8,000
Total Cost: (B) 3,00,000 2,92,000 4,40,000 Profit befor tax: (A)-(B)
20,000 28,000 40,000
Less: Tax (@ 50%)
10,000 14,000 20,000
Profit after tax 10,000 14,000 20,000 Add: Depreciation
20,000 33,000 36,400
Cash inflow 30,000 47,000 56,400
Computation of Cash Inflow in 5 th Year
Machine Z X Y
Cash inflow 30,000 47,000 56,400

Add: Salvage value of machines 10,000 15,000 18,000 Cash inflow 40,000 62,000 74,400
Computation of Net Present Value
Year Machine Z X Y Discounting
factor Cash
inflow Rs. P.V. of Cash
inflow Rs. Cash inflow
Rs.
P.V. of Cash
inflow Rs.
Cash inflow
Rs.
P.V. of Cash inflow
Rs. 1 0.909 30,000 27,270 47,000 42,723 56,400 51,267.60 2 0.826 30,000 24.780 47,000 38,822 56,400 46,586.40 3 0.751 30,000 22,530 47,000 35,297 56,400 42,356.40 4 0.683 30,000 20,490 47,000 32,101 56,400 38,521.20 5 0.621 40,000 24,840 62,000 38,502 74,400 46,202.40 1,19,910 1,87,445 2,24,934.00
Less: Purchase price 1,10,000 1,80,000 2,00,000.00 Net present value 9,910 7,445 24,934.00
Recommendations:
The net present value is higher in the case of machine Y. Therefore, it is advisable that the company should replace machine Z with machine Y.
However, as the cost of investment is not same for all machines, it would be better to base the decision on profitability index which is as under:
P.I. = Machine Z = = = 1.09 Machine X = = 1.041 Machine Y = = 1.12 Since the profitability index of machine Y is the highest therefore machine Z should be replaced by machine Y.
Question 5
(a) Company X is forced to choose between two machines A and B. The two machines are designed differently, but have identical capacity and do exactly the same job. Machine A costs Rs. 1,50,000 and will last for 3 years. It costs Rs. 40,000 per year to run. Machine
1,19,910 1,10,000
1,87,445 1,80,000
2,24,934 2,00,000
P.V. of cash inflow
P.V. of

B is an ‘economy’ model costing only Rs. 1,00,000, but will last only for 2 years, and costs Rs. 60,000 per year to run. These are real cash flows. The costs are forecasted in rupees of constant purchasing power. Ignore tax. Opportunity cost of capital is 10 per cent. Which machine company X should buy?
(b) Company Y is operating an elderly machine that is expected to produce a net cash inflow of Rs. 40,000 in the coming year and Rs. 40,000 next year. Current salvage value is Rs. 80,000 and next year’s value is Rs. 70,000. The machine can be replaced now with a new machine, which costs Rs. 1,50,000, but is much more efficient and will provide a cash inflow of Rs. 80,000 a year for 3 years. Company Y wants to know whether it should replace the equipment now or wait a year with the clear understanding that the new machine is the best of the available alternatives and that it in turn be replaced at the optimal point. Ignore tax. Take opportunity cost of capital as 10 percent. Advise with reasons. (Final-May 2000) (12 + 8 marks)
Answer
(a) Statement showing the Evaluation of Two Machines
Machines A B Purchase cost (Rs.): (i) 1,50,000 1,00,000 Life of machines (years) 3 2 Running cost of machine per year (Rs.): (ii) 40,000 60,000 Cumulative present value factor for 1-3 years @ 10%: (iii) 2.486 - Cumulative present value factor for 1-2 years @ 10%: (iv) - 1.735 Present value of running cost of machines (Rs.): (v) 99,440 1,04,100 [(ii) × (iii)] [(ii) × (iv)] Cash outflow of machines (Rs.): (vi)=(i) +(v) 2,49,440 2,04,100 Equivalent present value of annual cash outflow 1,00,338 1,17,637 [(vi)÷(iii)] [(vi) ÷(iv)] Decision: Company X should buy machine A since its equivalent cash outflow is less than machine B.
(b) Statement showing Present Value of Cash inflow of New Machine when it replaces Elderly Machine Now
Cash inflow of a new machine per year Rs. 80,000 Cumulative present value for 1-3 years @ Rs. 10% 2.486 Present value of cash inflow for 3 years (Rs. 80,000 × 2,486)
Rs. 1,98,880
Rs. Less: Cash Outflow
Purchase cost of new machine 1,50,000 Less: Salvage value of old machine 80,000 70,000
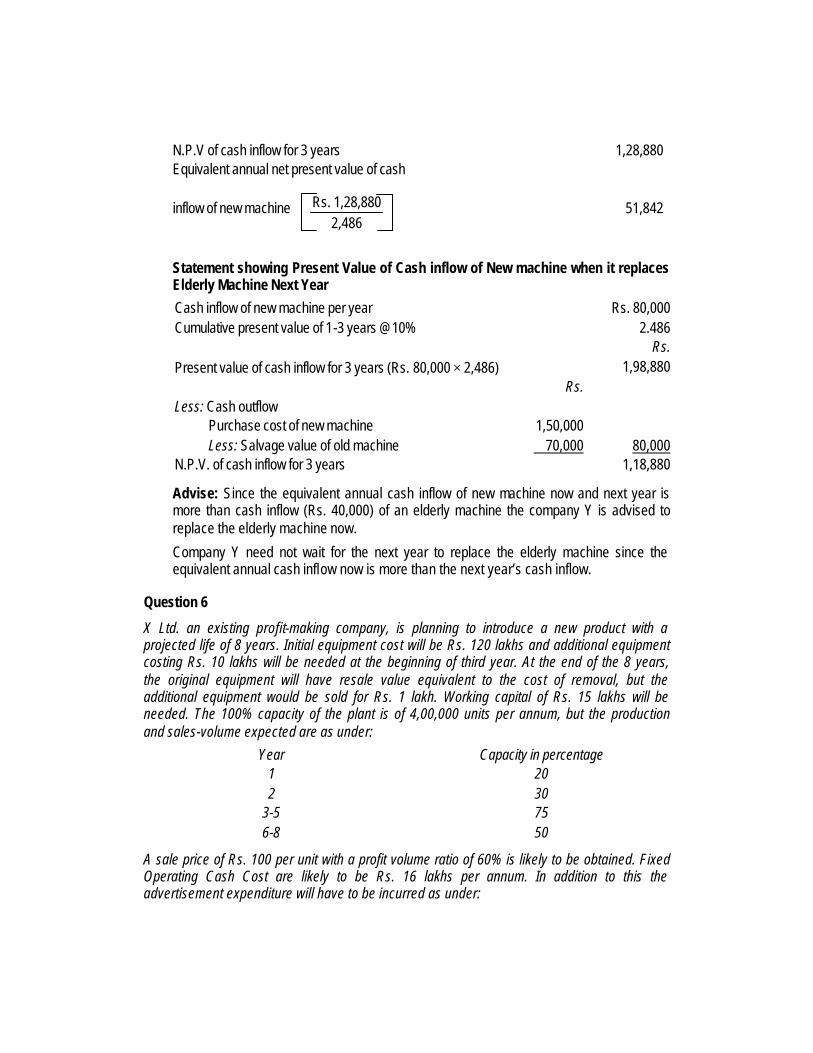
N.P.V of cash inflow for 3 years 1,28,880 Equivalent annual net present value of cash inflow of new machine
51,842
Statement showing Present Value of Cash inflow of New machine when it replaces Elderly Machine Next Year
Cash inflow of new machine per year Rs. 80,000 Cumulative present value of 1-3 years @10% 2.486 Rs. Present value of cash inflow for 3 years (Rs. 80,000 × 2,486) 1,98,880 Rs. Less: Cash outflow
Purchase cost of new machine 1,50,000 Less: Salvage value of old machine 70,000 80,000
N.P.V. of cash inflow for 3 years 1,18,880
Advise: Since the equivalent annual cash inflow of new machine now and next year is more than cash inflow (Rs. 40,000) of an elderly machine the company Y is advised to replace the elderly machine now.
Company Y need not wait for the next year to replace the elderly machine since the equivalent annual cash inflow now is more than the next year’s cash inflow.
Question 6
X Ltd. an existing profit-making company, is planning to introduce a new product with a projected life of 8 years. Initial equipment cost will be Rs. 120 lakhs and additional equipment costing Rs. 10 lakhs will be needed at the beginning of third year. At the end of the 8 years, the original equipment will have resale value equivalent to the cost of removal, but the additional equipment would be sold for Rs. 1 lakh. Working capital of Rs. 15 lakhs will be needed. The 100% capacity of the plant is of 4,00,000 units per annum, but the production and sales-volume expected are as under:
Year Capacity in percentage 1 20 2 30
3-5 75 6-8 50
A sale price of Rs. 100 per unit with a profit volume ratio of 60% is likely to be obtained. Fixed Operating Cash Cost are likely to be Rs. 16 lakhs per annum. In addition to this the advertisement expenditure will have to be incurred as under:
Rs. 1,28,880 2,486

Year 1 2 3-5 6-8 Expenditure in Rs. lakhs each year 30 15 10 4
The company is subjected to 50% tax, straight-line method of depreciation, (permissible for tax purposes also) and taking 12% as appropriate after tax cost of Capital, should the project be accepted? (Final-May 2002) (14 marks)
Answer
Computation of initial cash outlay
(Rs. in lakhs) Equipment Cost (0) 120 Working Capital (0) 15
135
Calculation of Cash Inflows:
Years 1 2 3-5 6-8 Sales in units 80,000 1,20,000 3,00,000 2,00,000 Rs. Rs. Rs. Rs. Contribution @ Rs. 60 p.u. 48,00,000 72,00,000 1,80,00,000 1,20,00,000 Fixed cost 16,00,000 16,00,000 16,00,000 16,00,000 Advertisement 30,00,000 15,00,000 10,00,000 4,00,000 Depreciation 15,00,000 15,00, 000 16,50,000 16,50,000 Profit /(loss) (13,00,000) 26,00,000 1,37,50,000 83,50,000 Tax @ 50% NIL 13,00,000 68,75,000 41,75,000 Profit/(Loss) after tax (13,00,000) 13,00,000 68,75,000 41,75,000 Add: Depreciation 15,00,000 15,00,000 16,50,000 16,50,000 Cash inflow 2,00,000 28,00,000 85,25,000 58,25,000
Computation of PV of CIF
Year CIF Rs.
PV Factor @ 12%
Rs.
1 2,00,000 .893 1,78,600 2 28,00,000 .797 22,31,600 3 85,25,000 .712 60,69,800 4 85,25,000 .636 54,21,900 5 85,25,000 .567 48,33,675 6 58,25,000 .507 29,53,275 7 58,25,000 .452 26,32,900 8 58,25,000 .404 29,99,700

WC 15,00,000 SV 1,00,000 __________
2,73,21,450 PV of COF 0 1,35,00,000
Additional Investment = Rs. 10,00,000 × .797 7,97,000 1,42,97,000 NPV 1,30,24,450
Recommendation: Accept the project in view of positive NPV.
Question 7
A company proposes to install a machine involving a Capital Cost of Rs.3,60,000. The life of the machine is 5 years and its salvage value at the end of the life is nil. The machine will produce the net operating income after depreciation of Rs.68,000 per annum. The Company’s tax rate is 45%.
The Net Present Value factors for 5 years are as under:
Discounting Rate : 14 15 16 17 18
Cumulative factor : 3.43 3.35 3.27 3.20 3.13
You are required to calculate the internal rate of return of the proposal.
(PE-II-Nov. 2002) (4 marks)
Answer
Computation of cash inflow per annum Rs.
Net operating income per annum 68,000 Less: Tax @ 45% 30,600 Profit after tax 37,400 Add: Depreciation 72,000 (Rs.3,60,000 / 5 years) Cash inflow 1,09,400
The IRR of the investment can be found as follows:
NPV = − Rs.3,60,000 + Rs.1,09,400 (PVAF5, r) = 0
or PVA F5 r ( Cumulative factor) =400,09,1.000,60,3.
RsRs = 3.29
Computation of internal rate of return
Discounting rate 15% 16% Cumulative factor 3.35 3.27

Total NPV(Rs.) 3,66,490 3,57,738 (Rs.1,09,400 × 3.35) (Rs.1,09,400 × 3.27) Internal outlay (Rs.) 3,60,000 3,60,000 Surplus (Deficit) (Rs.) 6,490 (2262)
IRR = 15 +
+ 262,2490,6490,6 = 15 + 0.74
= 15.74%
Question 8
A company has to make a choice between two projects namely A and B. The initial capital outlay of two Projects are Rs.1,35,000 and Rs.2,40,000 respectively for A and B. There will be no scrap value at the end of the life of both the projects. The opportunity Cost of Capital of the company is 16%. The annual incomes are as under:
Year Project A Project B Discounting
factor @ 16%
1 − 60,000 0.862
2 30,000 84,000 0.743
3 1,32,000 96,000 0.641
4 84,000 1,02,000 0.552
5 84,000 90,000 0.476 You are required to calculate for each project:
(i) Discounted payback period
(ii) Profitability index
(iii) Net present value (PE-II-Nov. 2002) (6 marks)
Answer
(1) Computation of Net Present Values of Projects Year Cash flows Discounting Discounted
factor @ 16 % Cash flow Project A Project B Project A Project B Rs. Rs. Rs. Rs. (1) (2) (3) (3) × (1) (3) × 2) 0 1,35,000 2,40,000 1.000 1,35,000 2,40,000 1 − 60,000 0.862 − 51,720 2 30,000 84,000 0.743 22,290 62,412 3 1,32,000 96,000 0.641 84,612 61,536

4 84,000 1,02,000 0.552 46,368 56,304 5. 84,000 90,000 0.476 39,984 42,840
Net present value 58,254 34,812
(2) Computation of Cumulative Present Values of Projects Cash inflows
Project A Project B Year PV of
cash inflows Cumulative
PV
PV of Cumulative
cash inflows PV
Rs. Rs. Rs. Rs.
1 − − 51,720 51,720
2 22,290 22,290 62,412 1,14,132 3 84,612 1,06,902 61,536 1,75,668 4 46,368 1,53,270 56,304 2,31,972
5 39,984 1,93,254 42,840 2,74,812
(i) Discounted payback period: (Refer to Working note 2)
Cost of Project A = Rs.1,35,000
Cost of Project B = Rs.2,40,000
Cumulative PV of cash inflows o f Project A after 4 years = Rs.1,53,270
Cumulative PV of cash inflows of Project B after 5 years = Rs.2,74,812
A comparison of projects cost with their cumulative PV clearly shows that the project A’s cost will be recovered in less than 4 years and that of project B in less than 5 years. The exact duration of discounted pay back period can be computed as follows:
Project A Project B
Excess PV of cash inflows over the 18,270 34,812
project cost (Rs.) (Rs.1,53,270 − Rs.1,35,000) (Rs.2,74,812 − Rs.2,40, 000)
Computation of period required 0.39 year 0.81 years
to recover excess amount of cumulative PV over project cost
(Rs.18,270 / Rs.46,368) (Rs.34,812 / Rs.42,840)
(Refer to Working note 2)
Discounted payback period 3.61 year 4.19 years
(4 − 0.39) years (5 − 0.81) years
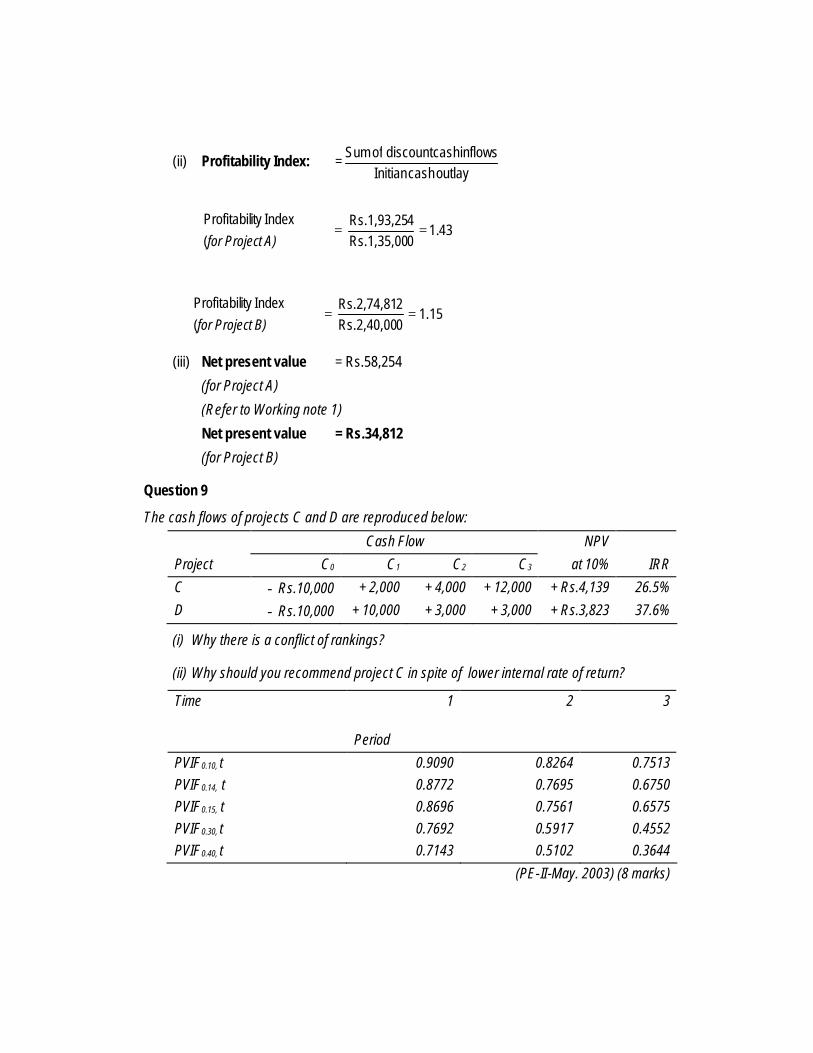
(ii) Profitability Index: =outlay cash Initian
inflows cashdiscount of Sum
43.10Rs.1,35,004Rs.1,93,25
(
Indexity Profitabil==
t A)for Projec
1.150Rs.2,40,002Rs.2,74,81
(
Indexity Profitabil==
t B)for Projec
(iii) Net present value = Rs.58,254
(for Project A)
(Refer to Working note 1)
Net present value = Rs.34,812
(for Project B)
Question 9
The cash flows of projects C and D are reproduced below:
Cash Flow NPV
Project C0 C1 C2 C3 at 10% IRR
C − Rs.10,000 + 2,000 + 4,000 + 12,000 + Rs.4,139 26.5%
D − Rs.10,000 + 10,000 + 3,000 + 3,000 + Rs.3,823 37.6%
(i) Why there is a conflict of rankings?
(ii) Why should you recommend project C in spite of lower internal rate of return?
Time 1 2 3
Period
PVIF0.10, t 0.9090 0.8264 0.7513 PVIF0.14, t 0.8772 0.7695 0.6750 PVIF0.15, t 0.8696 0.7561 0.6575 PVIF0.30, t 0.7692 0.5917 0.4552 PVIF0.40, t 0.7143 0.5102 0.3644
(PE-II-May. 2003) (8 marks)

Answer
(i) Net Present Value at different discounting rates Project 0% 10% 15% 30% 40% Rs. Rs. Rs. Rs. Rs. C 8,000 4,139 2,654 −632 −2,158 {Rs.2,000 {Rs.2,000 × 0.909 {Rs.2, 000 × 0.8696 {Rs.2,000 × 0.7692 {Rs.2,000 ×0.7143 +Rs.4,000 +Rs.4,000 ×
0.8264 + Rs.4,000 × 0.7561 + Rs.4,000 × 0.5917 + Rs.4,000 × 0.5102
+Rs.12,000 +Rs.12,000 × 0.7513
+ Rs.12,000 × 0.6575 +Rs.12,000 × 0.4552 + Rs.12,000 × 0.3644
−Rs.10,000} −Rs.10,000} − Rs.10,000} − Rs.10,000} − Rs.10,000} Ranking I I II II II D 6,000 3,823 2,937 833 − 233 {Rs.10,000 {Rs.10,000 × 0.909 {Rs.10,000 × 0.8696 {Rs.10,000 × 0.7692 {Rs.10,000 × 0.7143 +Rs.3,000 +Rs.3,000 ×
0.8264 +Rs.3,000 × 0.7561 + Rs.3,000 × 0.5917 +Rs.3,000 × 0.5102
+Rs.3,000 +Rs.3,000 × 0.7513
+Rs.3,000 × 0.6575 + Rs.3,000 × 0.4552 +Rs.3,000 × 0.3644
−Rs.10,000} − Rs.10,000} − Rs.10,000} − Rs.10,000} − Rs.10,000} Ranking II II I I I
The conflict in ranking arises because of skewness in cash flows. In the case of Project C cash flows occur more later in the life and in the case of Project D, cash flows are skewed towards the beginning.
At lower discount rate, project C’s NPV will be higher than that of project D. As the discount rate increases, Project C’s NPV will fall at a faster rate, due to compounding effect.
After break even discount rate, Project D has higher NPV as well as higher IRR.
(ii) If the opportunity cost of funds is 10%, project C should be accepted because the firm’s wealth will increase by Rs.316 (Rs.4,139 − Rs.3,823)
The following statement of incremental analysis will substantiate the above point.
Cash Flows (Rs.) NPV at IRR
Project C0 C1 C2 C3 10% 12.5%
Rs. Rs. Rs. Rs.
C−D 0 −8,000 1,000 9,000 316 0
{−8,000 × 0.909 {−8,000 × 0.88884
+1,000 × 0.8264 + 1,000 × 0.7898
+ 9,000 × 0.7513} + 9,000 × 0.7019}
Hence, the project C should be accepted, when opportunity cost of funds is 10%.

Question 10
Beta Company Limited is considering replacement of its existing machine by a new machine, which is expected to cost Rs.2,64,000. The new machine will have a life of five years and will yield annual cash revenues of Rs.5,68,750 and incur annual cash expenses of Rs.2,95,750. The estimated salvage value of the new machine is Rs.18,200. The existing machine has a book value of Rs.91,000 and can be sold for Rs.45,500 today.
The existing machine has a remaining useful life of five years. The cash revenues will be Rs.4,55,000 and associated cash expenses will be Rs.3,18,500. The existing machine will have a salvage value of Rs.4,550, at the end of five years.
The Beta Company is in 35% tax- bracket, and write off depreciation at 25% on written-down value method.
The Beta Company has a target debt to value ratio of 15%. The Company in the past has raised debt at 11% and it can raise fresh debt at 10.5%.
Beta Company plans to follow dividend discount model to estimate the cost of equity capital. The Company plans to pay a dividend of Rs.2 per share in the next year. The current market price of Company’s equity share is Rs.20 per equity share. The dividend per equity share of the Company is expected to grow at 8% p.a.
Required:
(i) Compute the incremental cash flows of the replacement decision.
(ii) Compute the weighted average cost of Capital of the Company.
(iii) Find out the net present value of the replacement decision.
(iv) Estimate the discounted payback period of the replacement decision.
(v) Should the Company replace the existing machine ? Advise.
(PE-II-Nov. 2003) (12 marks)
Answer
(i) Incremental Cash Flows Statements of the replacement decision
Description 0 1 2 3 4 5
Rs. Rs. Rs. Rs. Rs. Rs.
(a) Incremental sales (cash) − 1,13,750 1,13,750 1,13,750 1,13,750 1,13,750
(b) Incremental cash −
Operating cost (22,750) (22,750) (22,750) (22,750) (22,750)
Depreciation
− New machine 66,000 49,500 37,125 27,844 20,883
− Old machine 22,750 17,063 12,797 9,598 7,198
(c) Incremental depreciation 43,250 32,437 24,328 18,246 13,685

(d) EBIT (a−b−c) 93,250 1,04,063 1,12,172 1,18,254 1,22,815
(e) Tax 35% of (d) 32,638 36,422 39,260 41,389 42,985
(f) NOPAT : (d−e) 60,612 67,641 72,912 76,865 79,830
(g) Free operating 1,03,862 1,00,078 97240 95,111 93,515 cash in flows: (f+c) (h) Capital expenditure (2,18,500) − − − − − (i) Incremental salvage value 13,650 (Rs.18,200 − Rs.4,550)
(j) Tax saving incremental 9,591 (On loss of sale of machines (Rs.44,448−Rs.17,045) ×.35%
Incremental cash flows of the replacement decision (2,18,500) 1,03,862 1,00,078 97,240 95,111 1,16,756
(ii) Computation of weighted average cost of capital of the company (WACC):
Ke = 0P1D
+ g
= Rs.20Rs.2 + 8% = 18%
Kd = 10.5% ∗ ( 1− 0.35) = 6.825%
WACC = Kd × ED
E eK ED
D+
×++
= 6.825% ∗ 15% + 18% × 85% = 16.32% or 16.32375%
(iii) Computation of net present value of the replacement decision:
NPV = ∑= +
5
1t t0.1632375) (1tFCFF
− OI
= (2,18,500) + 89,287 + 73,961 + 61,779 + 51,948 + 54,820 = Rs.1,13,295
(iv) Discounted payback period of the replacement decision:
= 2 years 10 months 22 days approx. (v) Advise: The company should replace the existing machine with new machine.
Question 11
The cash flows of two mutually exclusive Projects are as under:
t0 t1 t2 t3 t4 t5 t6
Project ‘P’ (40,000) 13,000 8,000 14,000 12,000 11,000 15,000
(Rs.)

Project ‘J’ (Rs.)
(20,000) 7,000 13,000 12,000 − − −
Required:
(i) Estimate the net present value (NPV) of the Project ‘P’ and ‘J’ using 15% as the hurdle rate.
(ii) Estimate the internal rate of return (IRR) of the Project ‘P’ and ‘J’.
(iii) Why there is a conflict in the project choice by using NPV and IRR criterion?
(iv) Which criteria you will use in such a situation? Estimate the value at that criterion. Make a project choice.
The present value interest factor values at different rates of discount are as under:
t0 t1 t2 t3 t4 t5 t6 Rate of
discount
0.15 1.00 0.8696 0.7561 0.6575 0.5718 0.4972 0.4323 0.18 1.00 0.8475 0.7182 0.6086 0.5158 0.4371 0.3704 0.20 1.00 0.8333 0.6944 0.5787 0.4823 0.4019 0.3349 0.24 1.00 0.8065 0.6504 0.5245 0.4230 0.3411 0.2751 0.26 1.00 0.7937 0.6299 0.4999 0.3968 0.3149 0.2499
(PE-II-May. 2004) (7 marks)
Answer
(i) Estimation of net present value (NPV) of the Project ‘P’ and ‘ J ’ using 15% as the hurdle rate:
NPV of Project ‘P’ :
= − 40,000 + 654321 )15.1(
000,15
)15.1(
000,11
)15.1(
000,12
)15.1(
000,14
)15.1(
000,8
)15.1(
000,13+++++
= − 40,000 + 11,304.35 + 6,049.15 + 9,205.68 + 6,861.45 + 5,469.37 + 6,485.65 = Rs. 5,375.65 or Rs.5,376
NPV of Project ‘J ’ :
= − 20,000 +321 )15.1(
000,12
)15.1(
000,13
)15.1(
000,7++
= − 20,000 + 6,086.96 + 9,829.87 + 7,890.58
= Rs.3,807.41 (ii) Estimation of internal rate of return (IRR) of the Project ‘ P ‘ and ‘ J ‘

Internal rate of return r (IRR) is that rate at which the sum of cash inflows after discounting equals to the discounted cash out flows. The value of r in the case of given projects can be determined by using the following formula:
COo = nn
n
r
WCSV
r
CF
r
CF
r
CF
)1()1()1()1( 1
1
0
0
+
++
++−−−−−−−+
++
+
Where Co = Cash flows at the time O
CFt = Cash inflow at the end of year t
r = Discount rate
n = Life of the project
SV & WC = Salvage value and working capital at the end of n years.
In the case of project ‘P’ the value of r (IRR) is given by the following relation:
40,000 = 654321 % )1(
000,15
% )1(
000,11
% )1(
000,12
% )1(
000,14
% )1(
000,8
% )1(
000,13
rrrrrr ++
++
++
++
++
+
r = 19.73% Similarly we can determine the internal rate of return for the project ‘J’ . In the case of project ‘J’ it comes to:
r = 25.20%
(iii) The conflict between NPV and IRR rule in the case of mutually exclusive project situation arises due to re-investment rate assumption. NPV rule assumes that intermediate cash flows are reinvested at k and IRR assumes that they are reinvested at r. The assumption of NPV rule is more realistic.
(iv) When there is a conflict in the project choice by using NPV and IRR criterion, we would prefer to use “Equal Annualized Criterion”. According to this criterion the net annual cash inflow in the case of Projects ‘P’ and ‘J’ respectively would be:
Project ‘P’ = (Net present value/ cumulative present value of Re.1 p.a
@15% for 6 years)
= (Rs.5,375.65 / 3.7845)
= Rs.1,420.44
Project ‘J’ = (Rs.3807.41/2.2832)
= Rs.1667.58
Since the cash inflow per annum in the case of project ‘J’ is more than that of project ‘P’, so Project J is recommended.
Question 12
(a) PQR Limited has decided to go in for a new model of Mercedes Car. The cost of the vehicle is Rs.40 lakhs. The company has two alternatives:

(i) taking the car on finance lease; or
(ii) borrowing and purchasing the car.
LMN Limited is willing to provide the car on finance lease of PQR Limited for five years at an annual rental of Rs.8.75 lakhs, payable at the end of the year.
The vehicle is expected to have useful life of 5 years, and it will fetch a net salvage value of Rs.10 lakhs at the end of year five. The depreciation rate for tax purpose is 40% on written-down value basis. The applicable tax rate for the company is 35%. The applicable before tax borrowing rate for the company is 13.8462%.
What is the net advantage of leasing for the PQR Limited?
The values of present value interest factor at different rates of discount are as under:
t1 t2 t3 t4 t5 Rate of discount
0.138462 0.8784 0.7715 0.6777 0.5953 0.5229
0.09 0.9174 0.8417 0.7722 0.7084 0.6499
(PE-II-May. 2004) (8 marks)
Answer
Cash flow of lease contract is shown below: (Rs. in lakhs)
0 1 2 3 4 5
Cost of car 40
Depreciation 16 9.6 5.76 3.456 2.0736
−5.6 −3.36 −2.016 −1.2096 −0.7258
Loss of depreciation tax shield (Dep × tax rate)
Lease payment −8.75 −8.75 −8.75 −8.75 −8.75
3.0625 3.0625 3.0625 3.0625 3.0625 Tax shield on lease payment
Loss of salvage value −10
Cash flow of lease 40 −11.2875 −9.0475 −7.7035 −6.8971 −16.4133
Present value cash flow of −10.3551 −7.61528 −5.9486 −4.8859 −10.667

lease = Rs.39.47 lakhs
(−11.2875 × 0.9174)
(−9.0475 × 0.8417)
(−7.7035 × 0.7722)
(−6.8971 × 0.7084)
(−16.4133 × 0.6499)
Net Advantage of Leasing (Kd = 9%) = Rs.0.53 lakhs (Rs.40 lakhs − Rs.39.47 lakhs)
Question 13
PQR Ltd. is evaluating a proposal to acquire new equipment. The new equipment would cost Rs. 3.5 million and was expected to generate cash inflows of Rs. 4,70,000 a year for nine years. After that point, the equipment would be obsolete and have no significant salvage value. The company’s weighted average cost of capital is 16%.
The management of the PQR Ltd. seemed to be convinced with the merits of the investment but was not sure about the best way to finance it. PQR Ltd. could raise the money by issuing a secured eight-year note at an interest rate of 12%. However, PQR Ltd. had huge tax-loss carry forwards from a disastrous foray into foreign exchange options. As a result, the company was unlikely to be in a position of tax-paying for many years. The CEO of PQR Ltd. thought it better to lease the equipment than to buy it. The proposals for lease have been obtained from MGM Leasing Ltd. and Zeta Leasing Ltd. The terms of the lease are as under:
MGM Leasing Ltd. Zeta Leasing Ltd. Lease period offered 9 years 7 years Number of lease rental payments with initial lease payment due on entering the lease contract
10 8
Annual lese rental Rs. 5,44,300 Rs. 6,19,400 Lease terms equivalent to borrowing cost (Claim of lessor)
11.5% p.a. 11.41% p.a.
Leasing terms proposal coverage Entire Entire Rs. 3.5 million cost of
equipment Rs. 3.5 million cost of equipment
Tax rate 35% 35%
Both the Leasing companies were in a tax-paying position and write off their investment in new equipment using following rate:
Year 1 2 3 4 5 6
Depreciation rate 20% 32% 19.20% 11.52% 11.52% 5.76%
Required:
(i) Calculate the NPV to PQR Ltd. of the two lease proposals.
(ii) Does the new equipment have a positive NPV with (i) ordinary financing, (ii) lease financing ?
(iii) Calculate the NPVs of the leases from the lessors’ view points. Is there a chance that they could offer more attractive terms ?

(iv) Evaluate the terms presented by each of the lessors. (PE-II-Nov. 2004) (16 marks)
Answer
(i) NPV to PQR Ltd of MGM Leasing Ltd lease proposal.
Investment decision: Present value of Operating cash inflows
Present Value at 16% = Rs 4,70,000 × 4.6065 = Rs 21,65,055 (A)
Financing decision : Present value of cash outflows
Present value at 12 % = Rs 5,44,300 + Rs 5,44,300 × 5.3282
= Rs 34,44,439 (B)
Hence Net Present Value = (A) – (B) = (Rs 12,79,384)
NPV to PQR Ltd of Zeta Leasing Ltd lease proposal.
Investment decision :Present value of Operating cash inflows
Present Value at 16% = Rs 4,70,000 × 4.6065 = Rs 21,65,055 (A)
Financing decision : Present value of cash outflows
Present value at 12 % = Rs 6,19,400 + Rs 6,19,400 × 4.5638
= Rs 34,46,218. (B)
Hence Net Present Value = (A) – (B) = (Rs 12,81,163)
(ii) NPV of new equipment with ordinary financing
Investment decision :Present value of Operating cash inflows
Present Value at 16% = Rs 4,70,000 × 4.6065 = Rs 21,65,055 (A)
Financing decision : Present value of cash outflows
Rs 35,00,000 (B)
Hence Net Present Value = (A) – (B) = (Rs 13,34,945)
Conclusion : The company has a negative NPV with ordinary financing as well as lease financing.
(iii) NPV to MGM Leasing Ltd.
(Rs, 000)
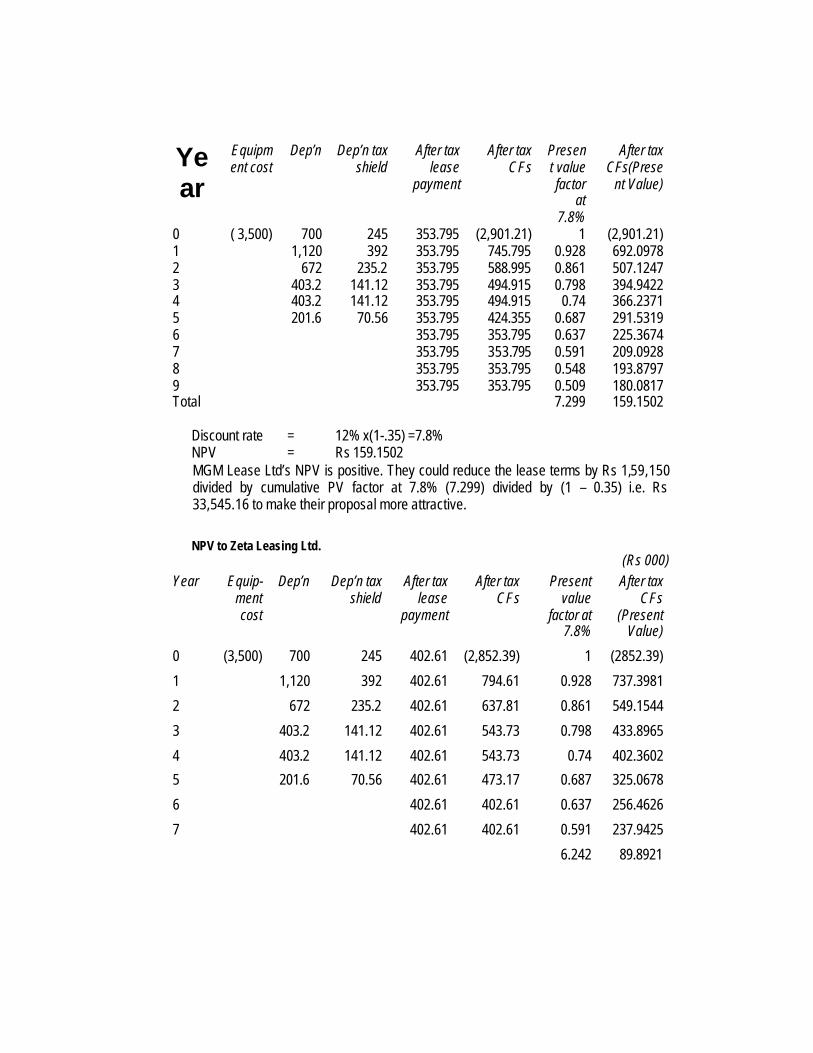
Year
Equipment cost
Dep’n Dep’n tax shield
After tax lease
payment
After tax CFs
Present value factor
at 7.8%
After tax CFs(Prese
nt Value)
0 ( 3,500) 700 245 353.795 (2,901.21) 1 (2,901.21) 1 1,120 392 353.795 745.795 0.928 692.0978 2 672 235.2 353.795 588.995 0.861 507.1247 3 403.2 141.12 353.795 494.915 0.798 394.9422 4 403.2 141.12 353.795 494.915 0.74 366.2371 5 201.6 70.56 353.795 424.355 0.687 291.5319 6 353.795 353.795 0.637 225.3674 7 353.795 353.795 0.591 209.0928 8 353.795 353.795 0.548 193.8797 9 353.795 353.795 0.509 180.0817 Total 7.299 159.1502
Discount rate = 12% x(1-.35) =7.8%
NPV = Rs 159.1502 MGM Lease Ltd’s NPV is positive. They could reduce the lease terms by Rs 1,59,150
divided by cumulative PV factor at 7.8% (7.299) divided by (1 – 0.35) i.e. Rs 33,545.16 to make their proposal more attractive.
NPV to Zeta Leasing Ltd. (Rs 000)
Year Equip-ment cost
Dep’n Dep’n tax shield
After tax lease
payment
After tax CFs
Present value
factor at 7.8%
After tax CFs
(Present Value)
0 (3,500) 700 245 402.61 (2,852.39) 1 (2852.39)
1 1,120 392 402.61 794.61 0.928 737.3981
2 672 235.2 402.61 637.81 0.861 549.1544
3 403.2 141.12 402.61 543.73 0.798 433.8965
4 403.2 141.12 402.61 543.73 0.74 402.3602
5 201.6 70.56 402.61 473.17 0.687 325.0678
6 402.61 402.61 0.637 256.4626
7 402.61 402.61 0.591 237.9425
6.242 89.8921
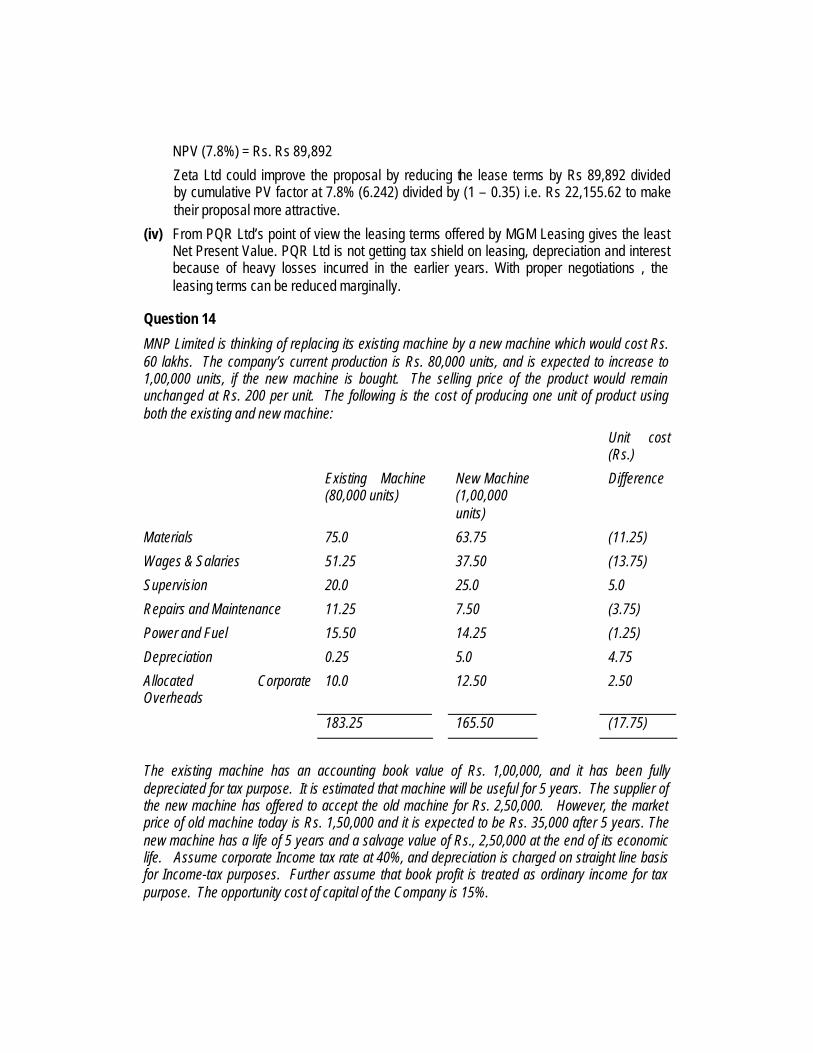
NPV (7.8%) = Rs. Rs 89,892
Zeta Ltd could improve the proposal by reducing the lease terms by Rs 89,892 divided by cumulative PV factor at 7.8% (6.242) divided by (1 – 0.35) i.e. Rs 22,155.62 to make their proposal more attractive.
(iv) From PQR Ltd’s point of view the leasing terms offered by MGM Leasing gives the least Net Present Value. PQR Ltd is not getting tax shield on leasing, depreciation and interest because of heavy losses incurred in the earlier years. With proper negotiations , the leasing terms can be reduced marginally.
Question 14
MNP Limited is thinking of replacing its existing machine by a new machine which would cost Rs. 60 lakhs. The company’s current production is Rs. 80,000 units, and is expected to increase to 1,00,000 units, if the new machine is bought. The selling price of the product would remain unchanged at Rs. 200 per unit. The following is the cost of producing one unit of product using both the existing and new machine:
Unit cost (Rs.)
Existing Machine (80,000 units)
New Machine (1,00,000 units)
Difference
Materials 75.0 63.75 (11.25)
Wages & Salaries 51.25 37.50 (13.75)
Supervision 20.0 25.0 5.0
Repairs and Maintenance 11.25 7.50 (3.75)
Power and Fuel 15.50 14.25 (1.25)
Depreciation 0.25 5.0 4.75
Allocated Corporate Overheads
10.0 12.50 2.50
183.25 165.50 (17.75)
The existing machine has an accounting book value of Rs. 1,00,000, and it has been fully depreciated for tax purpose. It is estimated that machine will be useful for 5 years. The supplier of the new machine has offered to accept the old machine for Rs. 2,50,000. However, the market price of old machine today is Rs. 1,50,000 and it is expected to be Rs. 35,000 after 5 years. The new machine has a life of 5 years and a salvage value of Rs., 2,50,000 at the end of its economic life. Assume corporate Income tax rate at 40%, and depreciation is charged on straight line basis for Income-tax purposes. Further assume that book profit is treated as ordinary income for tax purpose. The opportunity cost of capital of the Company is 15%.
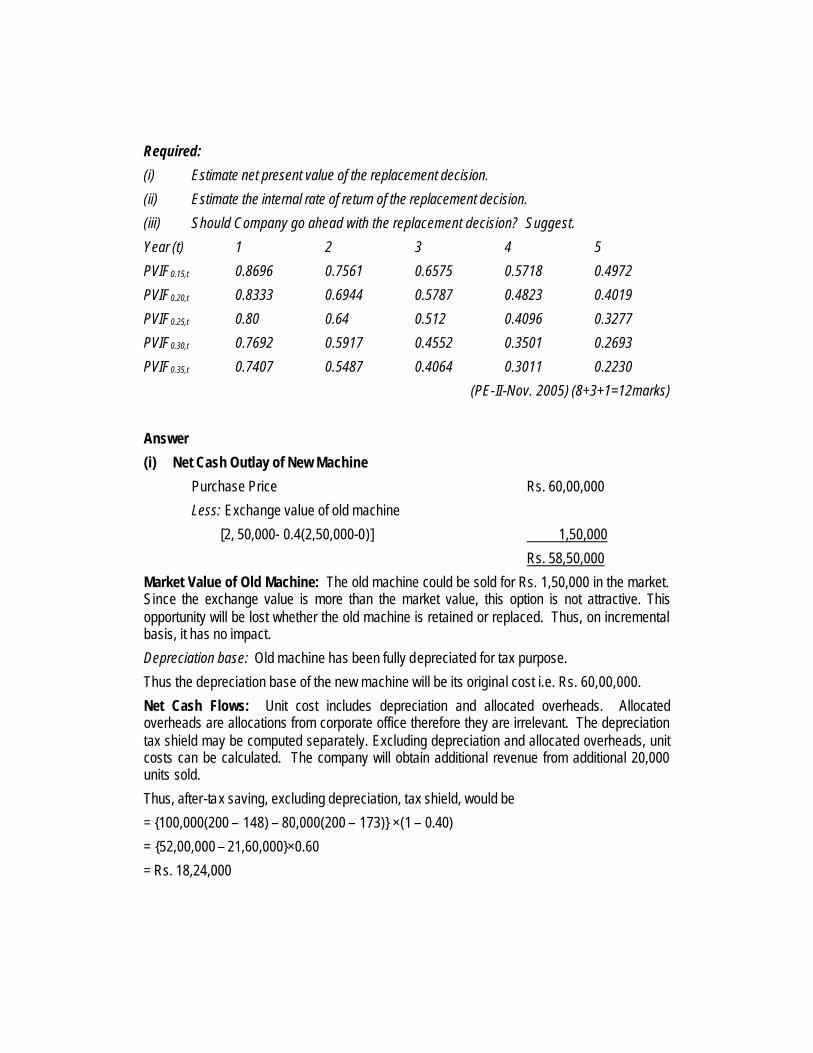
Required:
(i) Estimate net present value of the replacement decision.
(ii) Estimate the internal rate of return of the replacement decision.
(iii) Should Company go ahead with the replacement decision? Suggest.
Year (t) 1 2 3 4 5
PVIF0.15,t 0.8696 0.7561 0.6575 0.5718 0.4972
PVIF0.20,t 0.8333 0.6944 0.5787 0.4823 0.4019
PVIF0.25,t 0.80 0.64 0.512 0.4096 0.3277
PVIF0.30,t 0.7692 0.5917 0.4552 0.3501 0.2693
PVIF0.35,t 0.7407 0.5487 0.4064 0.3011 0.2230
(PE-II-Nov. 2005) (8+3+1=12marks)
Answer
(i) Net Cash Outlay of New Machine
Purchase Price Rs. 60,00,000
Less: Exchange value of old machine
[2, 50,000- 0.4(2,50,000-0)] 1,50,000
Rs. 58,50,000
Market Value of Old Machine: The old machine could be sold for Rs. 1,50,000 in the market. Since the exchange value is more than the market value, this option is not attractive. This opportunity will be lost whether the old machine is retained or replaced. Thus, on incremental basis, it has no impact.
Depreciation base: Old machine has been fully depreciated for tax purpose.
Thus the depreciation base of the new machine will be its original cost i.e. Rs. 60,00,000.
Net Cash Flows: Unit cost includes depreciation and allocated overheads. Allocated overheads are allocations from corporate office therefore they are irrelevant. The depreciation tax shield may be computed separately. Excluding depreciation and allocated overheads, unit costs can be calculated. The company will obtain additional revenue from additional 20,000 units sold.
Thus, after-tax saving, excluding depreciation, tax shield, would be
= {100,000(200 – 148) – 80,000(200 – 173)} ×(1 – 0.40)
= {52,00,000 – 21,60,000}×0.60
= Rs. 18,24,000

After adjusting depreciation tax shield and salvage value, net cash flows and net present value is estimated.
Calculation of Cash flows and Project Profitability
Rs. (‘000) 0 1 2 3 4 5 1 After- tax savings - 1824 1824 1824 1824 1824 2 Depreciation (Rs.
60,00,000 – 2,50,000)/5
- 1150 1150 1150 1150 1150
3 Tax shield on depreciation (Depreciation × Tax rate )
- 460 460 460 460 460
4 Net cash flows from operations (1+3)
- 2284 2284 2284 2284 2284
5 Initial cost (5850)
6 Net Salvage Value
(2,50,000 – 35,000)
- - - - - 215
7 Net Cash Flows
(4+5+6)
(5850) 2284 2284 2284 2284 2499
8 PVF at 15% 1.00 0.8696 0.7561 0.6575 0.5718 0.4972
9 PV (5850) 1986.166 1726.932 1501.73 1305.99 1242.50
10 NPV Rs. 1913.32
(ii) Rs.
(‘000)
0 1 2 3 4 5
NCF (5850) 2284 2284 2284 2284 2499
PVF at 20% 1.00 0.8333 0.6944 0.5787 0.4823 0.4019
PV (5850) 1903.257 1586.01 1321.751 1101.57 1004.35
PV of benefits 6916.94
PVF at 30% 1.00 0.7692 0.5917 0.4550 0.3501 0.2693
PV (5850) 1756.85 1351.44 1039.22 799.63 672.98

PV of benefits 5620.12
IRR = 20% + 10% ×82.129694.1066
= 28.23%
(iii) Advise: The company should go ahead with replacement project, since it is positive NPV decision.
Question 15
A Company is considering a proposal of installing a drying equipment. The equipment would involve a Cash outlay of Rs. 6,00,000 and net Working Capital of Rs. 80,000. The expected life of the project is 5 years without any salvage value. Assume that the company is allowed to charge depreciation on straight-line basis for Income-tax purpose. The estimated before-tax cash inflows are given below:
Before-tax Cash inflows (Rs. ‘000)
Year 1 2 3 4 5
240 275 210 180 160
The applicable Income-tax rate to the Company is 35%. If the Company’s opportunity Cost of Capital is 12%, calculate the equipment’s discounted payback period, payback period, net present value and internal rate of return.
The PV factors at 12%, 14% and 15% are:
Year 1 2 3 4 5
PV factor at 12% 0.8929 0.7972 0.7118 0.6355 0.5674 PV factor at 14% 0.8772 0.7695 0.6750 0.5921 0.5194
PV factor at 15% 0.8696 0.7561 0.6575 0.5718 0.4972 (PE-II-May 2006) (10 marks)
Answer
(i) Equipment’s initial cost = Rs. 6,00,000 + 80,000 = Rs. 6,80,000
(ii) Annual straight line depreciation = Rs. 6,00,000/5 = Rs. 1,20,000.
(iii) Net cash flows can be calculated as follows:
= Before tax CFs × (1 – Tc) + Tc × Depreciation
(Rs. ‘000)
CFs
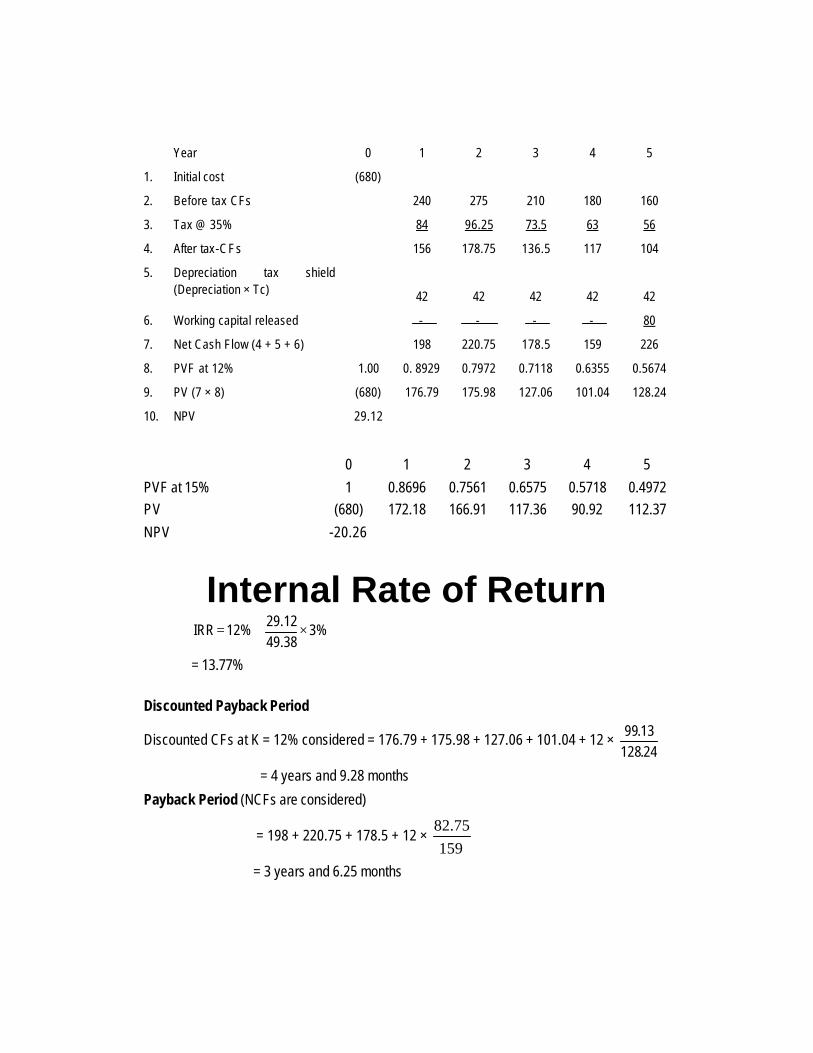
Year 0 1 2 3 4 5
1. Initial cost (680)
2. Before tax CFs 240 275 210 180 160
3. Tax @ 35% 84 96.25 73.5 63 56
4. After tax-CFs 156 178.75 136.5 117 104
5. Depreciation tax shield (Depreciation × Tc)
42
42
42
42
42
6. Working capital released - - - - 80
7. Net Cash Flow (4 + 5 + 6) 198 220.75 178.5 159 226
8. PVF at 12% 1.00 0. 8929 0.7972 0.7118 0.6355 0.5674
9. PV (7 × 8) (680) 176.79 175.98 127.06 101.04 128.24
10. NPV 29.12
0 1 2 3 4 5
PVF at 15% 1 0.8696 0.7561 0.6575 0.5718 0.4972 PV (680) 172.18 166.91 117.36 90.92 112.37
NPV -20.26
Internal Rate of Return 3%
49.3829.12
12% IRR ×+=
= 13.77%
Discounted Payback Period
Discounted CFs at K = 12% considered = 176.79 + 175.98 + 127.06 + 101.04 + 12 × 24.12813.99
= 4 years and 9.28 months
Payback Period (NCFs are considered)
= 198 + 220.75 + 178.5 + 12 × 159
75.82
= 3 years and 6.25 months

Question 16
Company UVW has to make a choice between two identical machines, in terms of Capacity, ‘A’ and ‘B’. They have been designed differently, but do exactly the same job.
Machine ‘A’ costs Rs. 7,50,000 and will last for three years. It costs Rs. 2,00,000 per year to run.
Machine ‘B’ is an economy model costing only Rs. 5,00,000, but will last for only two years. It costs Rs. 3,00,000 per year to run.
The cash flows of Machine ‘A’ and ‘B’ are real cash flows. The costs are forecasted in rupees of constant purchasing power. Ignore taxes. The opportunity cost of capital is 9%.
Required:
Which machine the company UVW should buy?
The present value (PV) factors at 9% are:
Year t1 t2 t3
PVIF0.09.t 0.9174 0.8417 0.7722 (PE-II-Nov. 2006) (8 marks)
Answer
Statement Showing the Evaluation of Two Machines
Machines A B (i) Purchase Cost Rs.
7,50,000 Rs.
5,00,000 (ii) Life of Machine 3 years 2 years (iii) Running Cost of Machine per
year Rs.
2,00,000 Rs.
3,00,000 (iv) PVIFA 0.09,3 2.5313
PVIFA 0.09, 2 1.7591 (v) PV of Running Cost of Machine Rs.
5,06,260 Rs.
5,27,730 (vi) Cash outflows of Machine {(i) +
(v)} Rs.
12,56,260 Rs.
10,27,730 (vii) Equivalent PV of Annual Cash
outflow (vi/iv) Rs.
4,96,290 Rs.
5,84,236

Recommendation: Company UVW should buy Machine ‘A’ since equivalent annual cash outflow is less than that of Machine B.
Question 17
A company is considering the proposal of taking up a new project which requires an investment of Rs. 400 lakh on machinery and other assets. The project is expected to yield the following earnings (before depreciation and taxes) over the next five years:
Year Earnings (Rs. in lakh)
1 160 2 160 3 180 4 180 5 150
The cost of raising the additional capital is 12% and assets have to be depreciated at 20% on ‘Written Down Value’ basis. The scrap value at the end of the five years’ period may be taken as zero. Income-tax applicable to the company is 50%.
You are required to calculate the net present value of the project and advise the management to take appropriate decision. Also calculate the Internal Rate of Return of the Project.
Note: Present value of Re. 1 at different rates of interest are as follows:
Year 10% 12% 14% 16% 1 0.91 0.89 0.88 0.86 2 0.83 0.80 0.77 0.74 3 0.75 0.71 0.67 0.64 4 0.68 0.64 0.59 0.55 5 0.62 0.57 0.52 0.48
(PE-II-May 2007) (8 marks)
Answer
(a) (i) Calculation of Net Cash Flow
(Rs. in lakhs)
Year Profit before
dep. and tax
Depreciation (20% on WDV)
PBT PAT Net cash flow
(1) (2) (3) (4) (5) (3) + (5)
1 160 400 × 20% = 80 80 40 120
2 160 (400 − 80)× 20% = 64 96 48 112
3 180 (320 − 64)× 20% = 51.2 128.8 64.4 115.6

4 180 (256 − 51.2)× 20% = 40.96 139.04 69.52 110.48
5 150 (204.8 − 40.96) = 163.84* −13.84 −6.92 156.92
*including depreciation and loss on disposal of assets.
(ii) Calculation of Net Present Value (NPV)
(Rs. in lakhs)
12% 14% 16% Year Net Cash
Flow D.F P.V D.F P.V D.F P.V
1 120 .89 106.8 .88 105.60 .86 103.2
2 112 .80 89.6 .77 86.24 .74 82.88
3 115.6 .71 82.08 .67 77.45 .64 73.98
4 110.48 .64 70.70 .59 65.18 .55 60.76
5 156.92 .57 89.44 .52 81.60 .48 75.32
438.62 416.07 396.14
Less: Initial Investment 400.00
400.00 400.00
NPV 38.62 16.07 −3.86
(iii) Advise: Since Net Present Value of the project at 12% = 38.62 lakhs, therefore the project should be implemented.
(iv) Calculation of Internal Rate of Return (IRR)
3.86)( 16.072% 16.07
14% IRR−−×
+=
19.9332.14
14% +=
= 14% + 1.61% = 15.61%.
Question 18
Consider the following mutually exclusive projects:
Cash flows (Rs.) Projects C0 C1 C2 C3 C4
A −10,000 6,000 2,000 2,000 12,000
B −10,000 2,500 2,500 5,000 7,500
C −3,500 1,500 2,500 500 5,000
D −3,000 0 0 3,000 6,000 Required:

(i) Calculate the payback period for each project.
(ii) If the standard payback period is 2 years, which project will you select? Will your answer differ, if standard payback period is 3 years?
(iii) If the cost of capital is 10%, compute the discounted payback period for each project. Which projects will you recommend, if standard discounted payback period is (i) 2 years; (ii) 3 years?
(iv) Compute NPV of each project. Which project will you recommend on the NPV criterion? The cost of capital is 10%. What will be the appropriate choice criteria in this case? The PV factors at 10% are:
Year 1 2 3 4 PV factor at 10% 0.9091 0.8264 0.7513 0.6830 (PV/F 0.10, t)
(PE-II-Nov. 2007) (10 marks)
Answer
(i) Payback Period of Projects
C0 C1 C2 C3
A − 10,000 + 6,000 + 2,000 + 2,000 = 3 years
B − 10,000 + 2,500 + 2,500 + 5,000 = 3 years
C − 3,500 + 1,500 + 2,500 = 1 year and 9.6 months
2,000 2,500
12i.e. ×
D − 3,000 + 0 + 0 + 3,000 = 3 years.
(ii) If standard payback period is 2 years, Project C is the only acceptable project. But if standard payback period is 3 years, all the four projects are acceptable.
(iii) Discounted Payback Period (Cash flows discounted at 10%)
A − 10,000 + 5,454.6 + 1,652.8 + 1,502.6 + 8,196
months 2 and years 3 1,390 8,196
12 years 3 =×+
B − 10,000 + 2,272.75 + 2,066 + 3,756.5 + 5,122.50
months 4.6 and years 3 1,904.75 5,122.55
12 years 3 =×+
C − 3,500 + 1,363.65 + 2,066 + 375.65 + 3,415

months 2.25 and years 2 70.35 375.65
12 years 2 =×+
D − 3,000 + 0 + 0 + 2,253.9 + 4,098
months 2.18 and years 3 746.10 4,098
12 years 3 =×+
If standard discounted payback period is 2 years, no project is acceptable on discounted payback period criterion.
If standard discounted payback period is 3 years, Project ‘C’ is acceptable on discounted payback period criterion.
(iv) Evaluation of Projects on NPV criterion
A = − 10,000 + 5,454.6 + 1,652.8 + 1,502.60 + 8,196
NPV = Rs. 6,806.2
B = − 10,000 + 2,272.75 + 2,066 + 3,756.5 + 5,122.5
NPV = Rs. 3,217.75
C = − 3,500 + 1,363.65 + 2,066 + 3, 75.65 + 3,415
NPV = Rs. 3,720.3
D =− 3,000 + 0 + 0 + 2,253.9 + 4,098
NPV = Rs. 3,351.9
Ranking of Projects on NPV Criterion
NPV Rank Rs.
A 6,806.2 I
B 3,217.75 IV C 3,720.3 II
D 3,351.9 III
Analysis: Project A is acceptable under the NPV method. The NPV technique is superior to any other technique of capital budgeting, whether it is PI or IRR. The best project is the one which adds the most, among available alternatives, to the shareholders wealth. The NPV method, by its very definition, will always select such projects. Therefore, the NPV method gives a better mutually exclusive choice than PI method. The NPV method guarantees the choice of the best alternative.

Question 19
A firm can make investment in either of the following two projects. The firm anticipates its cost of capital to be 10% and the net (after tax) cash flows of the projects for five years are as follows:
Figures in Rs. ‘000)
Year 0 1 2 3 4 5
Project-A (500) 85 200 240 220 70
Project-B (500) 480 100 70 30 20
The discount factors are as under:
Year 0 1 2 3 4 5
PVF (10%) 1 0.91 0.83 0.75 0.68 0.62
PVF (20%) 1 0.83 0.69 0.58 0.48 0.41
Required:
(i) Calculate the NPV and IRR of each project.
(ii) State with reasons which project you would recommend.
(iii) Explain the inconsistency in ranking of two projects. (PE-II-May 2008) (8 marks)
Answer
(i) Computation of NPV and IRR
For Project A:
Years Cash flows
Rs. ’000
PVF 10% P.V.
Rs. ’000
PVF 20% P.V.
Rs. ’000
0 -500 1.00 −500.00 1.00 −500.00
1 85 0.91 77.35 0.83 70.55
2 200 0.83 166.00 0.69 138.00
3 240 0.75 180.00 0.58 139.20
4 220 0.68 149.60 0.48 105.60
5 70 0.62 43.40 0.41 28.70
NPV +116.35 -17.95
NPV of Project A at 10% (Cost of Capital) is Rs. 1,16,350.
IRR of Project A may be calculated by interpolation method as under:
NPV at 20% is (-) 17.95 (Rs. ’000)

NPV a t 10% is + 116.35 (Rs. ’000)
∴ IRR = 10 + ( )% 102017.95) ( 116.35
116.35−
−− = 18.66%
For Project B:
Years Cash flows
(Rs. ’000)
PVF 10% P.V.
(Rs. ’000)
PVF 20% P.V.
(Rs. ’000)
0 −500 1.00 −500 1.00 −500
1 480 0.91 436.80 0.83 398.40
2 100 0.83 83.00 0.69 69.00
3 70 0.75 52.50 0.58 40.60
4 30 0.68 20.40 0.48 14.40
5 20 0.62 12.40 0.41 8.20
NPV +105.10 + 30.60
NPV of Project B at 10% (Cost of Capital) is Rs. 1,05,100.
IRR of Project B is calculated by interpolation method as under:
NPV at 10% = + 105.10 (Rs. ’000)
NPV at 20% = + 30.60 (Rs. ’000)
IRR = 10 + ( )% 102030.60105.10
105.10 −−
= 24.10
Note: Though in above solution discounting factors of 10% and 20% have been used. However, instead of 20%, students may assume any rate beyond 20%, say 26%, then NPV becomes negative. In such a case, the answers of IRR of Project may slightly varied from 24.10%.
(ii) The ranking of the projects will be as under:
NPV IRR
Project A 1 2
Project B 2 1
There is a conflict in ranking. IRR assumes that the project cash flows are reinvested at IRR whereas the cost of capital is 10%. The two projects are mutually exclusive. In the circumstances, the project which yields the larger NPV will earn larger cash flows. Hence the project with larger NPV should be chosen. Thus Project A qualifies for selection.
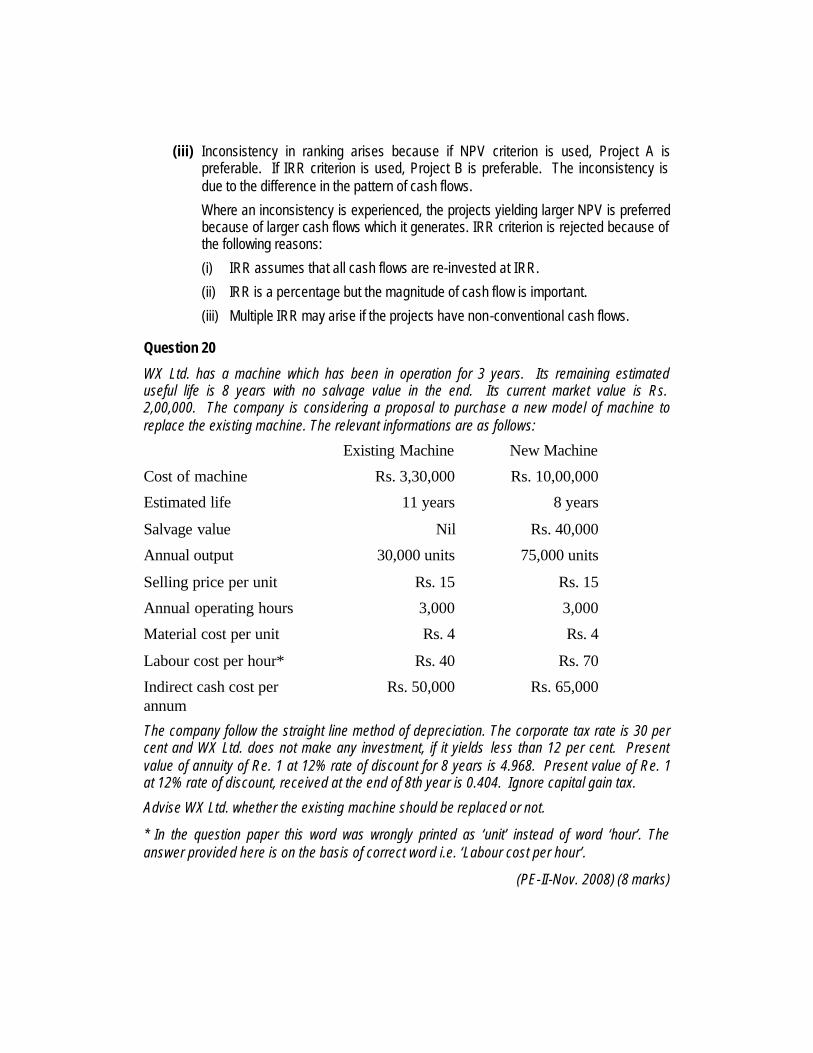
(iii) Inconsistency in ranking arises because if NPV criterion is used, Project A is preferable. If IRR criterion is used, Project B is preferable. The inconsistency is due to the difference in the pattern of cash flows.
Where an inconsistency is experienced, the projects yielding larger NPV is preferred because of larger cash flows which it generates. IRR criterion is rejected because of the following reasons:
(i) IRR assumes that all cash flows are re-invested at IRR.
(ii) IRR is a percentage but the magnitude of cash flow is important.
(iii) Multiple IRR may arise if the projects have non-conventional cash flows.
Question 20
WX Ltd. has a machine which has been in operation for 3 years. Its remaining estimated useful life is 8 years with no salvage value in the end. Its current market value is Rs. 2,00,000. The company is considering a proposal to purchase a new model of machine to replace the existing machine. The relevant informations are as follows:
Existing Machine New Machine
Cost of machine Rs. 3,30,000 Rs. 10,00,000
Estimated life 11 years 8 years
Salvage value Nil Rs. 40,000
Annual output 30,000 units 75,000 units
Selling price per unit Rs. 15 Rs. 15
Annual operating hours 3,000 3,000
Material cost per unit Rs. 4 Rs. 4
Labour cost per hour* Rs. 40 Rs. 70
Indirect cash cost per annum
Rs. 50,000 Rs. 65,000
The company follow the straight line method of depreciation. The corporate tax rate is 30 per cent and WX Ltd. does not make any investment, if it yields less than 12 per cent. Present value of annuity of Re. 1 at 12% rate of discount for 8 years is 4.968. Present value of Re. 1 at 12% rate of discount, received at the end of 8th year is 0.404. Ignore capital gain tax.
Advise WX Ltd. whether the existing machine should be replaced or not.
* In the question paper this word was wrongly printed as ‘unit’ instead of word ‘hour’. The answer provided here is on the basis of correct word i.e. ‘Labour cost per hour’.
(PE-II-Nov. 2008) (8 marks)

Answer
(i) Calculation of Net Initial Cash Outflows:
Rs.
Cost of new machine 10,00,000
Less: Sale proceeds of existing machine 2,00,000
Net initial cash outflows 8,00,000
(ii) Calculation of annual depreciation:
On old machine = annum. per 30,000 Rs. years 11
3,30,000 Rs.=
On new machine = annum. per 1,20,000 Rs. years 8
40,000 Rs. 10,00,000 Rs.=
−
(iii) Calculation of annual cash inflows from operation:
Particulars Existing machine
New Machine
Differential
(1) (2) (3) (4)
=(3) – (2)
Annual output 30,000 units 75,000 units 45,000 units Rs. Rs. Rs.
(A) Sales revenue @ Rs. 15 per unit 4,50,000 11,25,000 6,75,000
(B) Less: Cost of Operation Material @ Rs. 4 per unit 1,20,000 3,00,000 1,80,000
Labour
Old = 3,000 × Rs. 40 1,20,000 90,000
New = 3,000 × Rs. 70 2,10,000
Indirect cash cost 50,000 65,000 15,000
Depreciation 30,000 1,20,000 90,000
Total Cost (B) 3,20,000 6,95,000 3,75,000 Profit Before Tax (A – B) 1,30,000 4,30,000 3,00,000
Less: Tax @ 30% 39,000 1,29,000 90,000
Profit After Tax 91,000 3,01,000 2,10,000 Add: Depreciation 30,000 1,20,000 90,000
Annual Cash Inflows 1,21,000 4,21,000 3,00,000

(iv) Calculation of Net Present Value:
Rs.
Present value of annual net cash
Inflows: 1 – 8 years = Rs. 3,00,000 × 4.968 14,90,400
Add: Present value of salvage value of new machine at
the end of 8th year (Rs. 40,000 × 0.404)
16,160
Total present value 15,06,560
Less: Net Initial Cash Outflows 8,00,000
NPV 7,06,560
Alternative Solution:
Calculation of Net Present Value (NPV)
Particulars Period
(Year)
Cash Flow
(Rs.)
Present Value Factor (PVF)
@ 12%
Present Value (Rs.)
Purchase of new machine 0 −8,00,000 1.00 −8,00,000
Incremental Annual Cash Inflow 1 – 8 3,00,000 4.968 14,90,400
Salvage value of new machine 8 40,000 0.404 16,160
Net Present Value (NPV) 7,06,560
Hence, existing machine should be replaced because NPV is positive.
Question 21
Do the profitability index and the NPV criterion of evaluating investment proposals lead to the same acceptance-rejection and ranking decisions? In what situations will they give conflicting results? (Final-Nov. 1999) (6 marks)
Answer
In the most of the situations the Net Present Value Method (NPV) and Profitability Index (PI) yield same accept or reject decision. In general items, under PI method a project is acceptable if profitability index value is greater than 1 and rejected if it less than 1. Under NPV method a project is acceptable if Net present value of a project is positive and rejected if it is negative. Clearly a project offering a profitability index greater than 1 must also offer a net present value which is positive. But a conflict may arise between two methods if a choice between mutually exclusive projects has to be made. Consider the following example:

Project A Project B PV of Cash inflows 2,00,000 1,00,000 Initial cash outflows 1,00,000 40,000 Net present value 1,00,000 60,000 P.I
2000,00,1000,00,2
=
5.2000,40000,00,1
=
According to NPV method, project A would be preferred, whereas according to profitability index method project B would be preferred.
This is because Net present value gives ranking on the basis of absolute value of rupees. Whereas profitability index gives ranking on the basis of ratio. Although PI method is based on NPV, it is a better evaluation technique than NPV in a situation of capital rationing.
Question 22
Distinguish between Net Present Value and Internal Rate of Return.
(Final-May 2002) (2 marks)
Answer
NPV and IRR: NPV and IRR methods differ in the sense that the results regarding the choice of an asset under certain circumstances are mutually contradictory under two methods. In case of mutually exclusive investment projects, in certain situations, they may give contradictory results such that if the NPV method finds one proposal acceptable, IRR favours another. The different rankings given by the NPV and IRR methods could be due to size disparity problem, time disparity problem and unequal expected lives.
The net present value is expressed in financial values whereas internal rate of return (IRR) is expressed in percentage terms.
In the net present value cash flows are assumed to be re-invested at cost of capital rate. In IRR reinvestment is assumed to be made at IRR rates.
Question 23
Discuss the need for social cost benefit analysis. (PE-II-May 2003 & Nov. 2006) (4 marks)
Answer
Several hundred crores of rupees are committed every year to various public projects. Analysis of such projects has to be done with reference to social costs and benefits. Since they cannot be expected to yield an adequate commercial return on the funds employed, at least during the short run.
Social cost benefit analysis is important for the private corporations also who have a moral responsibility to undertake socially desirable projects.
The need for social cost benefit analysis arises due to the following:

(i) The market prices used to measure costs & benefits in project analysis, may not represent social values due to market imperfections.
(ii) Monetary cost benefit analysis fails to consider the external positive & negative effects of a project.
(iii) Taxes & subsidies are transfer payments & hence irrelevant in national economic profitability analysis.
(iv) The redistribution benefits because of project needs to be captured.
(v) The merit wants are important appraisal criteria for social cost benefit analysis.
Question 24
Write a short note on internal rate of return. (Final-May 1996 & Nov. 2008) (4 marks)
Answer
Internal Rate of Return: It is that rate at which discounted cash inflows are equal to the discounted cash outflows. In other words, it is the rate which discounts the cash flows to zero. It can be stated in the form of a ratio as follows:
1Outflows Cashinflows Cash =
This rate is to be found by trial and error method. This rate is used in the evaluation of investment proposals. In this method, the discount rate is not known but the cash outflows and cash inflows are known.
In evaluating investment proposals, internal rate of return is compared with a required rate of return, known as cut-off rate. If it is more than cut-off rate the project is treated as acceptable; otherwise project is rejected.
Question 25
Decision tree analysis is helpful in managerial decisions.” Explain with an example. (PE-II-May 2005) (5 marks)
Answer
Significance of Decision Tree Analysis: it is generally observed that the present investment decision may have several implications for future investments decisions. Such complex investment decisions involve a sequence of decisions over time. It is also argued that since present choices modify future alternatives, industrial activity can not be reduced to a single decision and must be viewed as a sequence of decisions extending from the present time into the future. These sequential decisions are taken on the bases of decision tree analysis. While constructing and using decision tree, some important steps to be considered are as follows:
(i) Investment proposal should be properly defined.

(ii) Decision alternatives should be clearly clarified.
(iii) The decision tree should be properly graphed indicating the decision points, chances, events and other data.
(iv) The results should be analysed and the best alternative should be selected.
Question 26
What is Capital rationing? Describe various ways of implementing it.
(PE-II-Nov. 2008) (4 marks)
Answer
Capital Rationing: Generally, firms fix up maximum amount that can be invested in capital projects during a given period of time, say a year. The firm then attempts to select a combination of investment proposals that will be within the specific limits providing maximum profitability and rank them in descending order according to their rate of return; such a situation is of capital rationing. A firm should accept all investment projects with positive NPV, with an objective to maximise the wealth of shareholders. However, there may be resource constraint due to which a firm may have to select from among various projects. Thus, capital rationing situation may arises when there may be internal or external constraints on procurement of necessary funds to invest in all investment proposals with positive NPVs. Ways of implementing Capital Rationing (i) It may be implemented through budgets.
(ii) It can be done by putting up a ceiling when it has been financing investment proposals only by way of retained earnings.
(iii) It can also be done by ‘Responsibility Accounting’, whereby management may authorise a particular department to make investment only up to a specified limit, beyond which the investment decisions are to be taken by higher-ups.

5 LEVERAGE
Question 1
Calculate the operating leverage, financial leverage and combined leverage from the following data under Situation I and II and Financial Plan A and B:
Installed Capacity 4,000 units Actual Production and Sales 75% of the Capacity Selling Price Rs. 30 Per Unit Variable Cost Rs. 15 Per Unit
Fixed Cost:
Under Situation I Rs. 15,000 Under Situation-II Rs.20,000
Capital Structure:
Financial Plan A B Rs. Rs. Equity 10,000 15,000 Debt (Rate of Interest at 20%) 10,000 5,000 20,000 20,000
(Final-May 1996) (14 marks)
Answer
Operating Leverage: Situation-I Situation-II Rs. Rs. Sales (s) 90,000 90,000 3000 units @ Rs. 30/- per unit Less: Variable Cost (VC) @ Rs. 15 per unit 45,000 45,000 Contribution (C) 45,000 45,000 Less: Fixed Cost (FC) 15,000 20,000 Operating Profit (OP) 30,000 25,000 (EBIT)

Operating Leverage:
OPC = Rs.
30,00045,000
Rs. 25,00045,000
= 1.5 1.8 (ii) Financial Leverages:
A
(Rs.) B
(Rs.) Situation 1 Operating Profit (EBIT) 30,000 30,000 Less: Interest on debt 2,000 1,000 PBT 28,000 29,000
Financial Leverage = PBTOP = 04.1
24,00030,000
Rs. 07.1 28,00030,000
Rs. ==
A
(Rs.) B
(Rs.) Situation-II Operating Profit (OP) 25,000 25,000 (EBIT) Less: Interest on debt 2,000 1,000 PBT 23,000 24,000
Financial Leverage = PBTOP = 04.1
24,00025,000
Rs. 09.1 23,00025,000
Rs. ==
(iii) Combined Leverages :
A B (Rs.) (Rs.) (a) Situation I 1.5 x 1.07 =1.6 1.5 x 1.04 = 1.56 (b) Situation II 1.8 x 1.09 =1.96 1.8 x 1.04 =1.87
Question 2
A firm has sales of Rs. 75,00,000 variable cost of Rs. 42,00,000 and fixed cost of Rs. 6,00,000. It has a debt of Rs. 45,00,000 at 9% and equity of Rs. 55,00,000.
(i) What is the firm’s ROI?
(ii) Does it have favourable financial leverage?
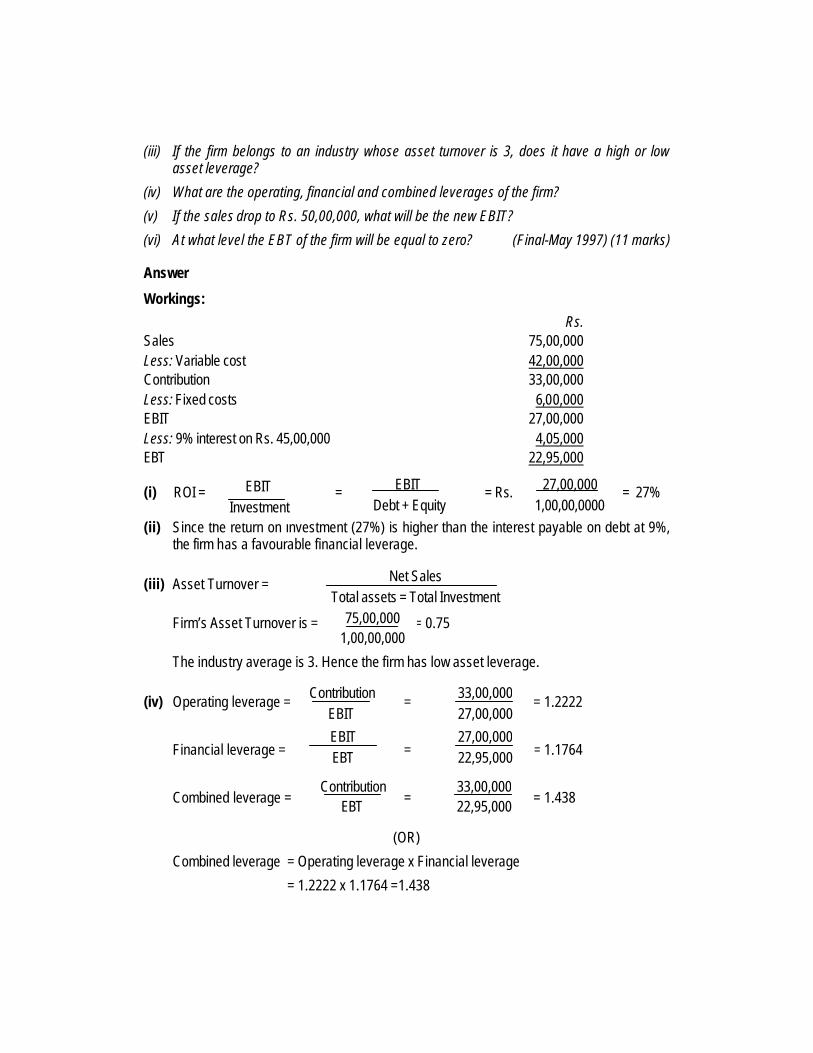
(iii) If the firm belongs to an industry whose asset turnover is 3, does it have a high or low asset leverage?
(iv) What are the operating, financial and combined leverages of the firm?
(v) If the sales drop to Rs. 50,00,000, what will be the new EBIT?
(vi) At what level the EBT of the firm will be equal to zero? (Final-May 1997) (11 marks)
Answer
Workings:
Rs. Sales 75,00,000 Less: Variable cost 42,00,000 Contribution 33,00,000 Less: Fixed costs 6,00,000 EBIT 27,00,000 Less: 9% interest on Rs. 45,00,000 4,05,000 EBT 22,95,000 (i) ROI = = = Rs. = 27% (ii) Since the return on investment (27%) is higher than the interest payable on debt at 9%,
the firm has a favourable financial leverage.
(iii) Asset Turnover =
Firm’s Asset Turnover is = = 0.75
The industry average is 3. Hence the firm has low asset leverage.
(iv) Operating leverage = = = 1.2222
Financial leverage = = = 1.1764
Combined leverage = = = 1.438
(OR)
Combined leverage = Operating leverage x Financial leverage
= 1.2222 x 1.1764 =1.438
EBIT Investment
EBIT Debt + Equity
27,00,000 1,00,00,0000
Net Sales Total assets = Total Investment
75,00,000 1,00,00,000
Contribution EBIT
33,00,000 27,00,000
EBIT EBT
27,00,000 22,95,000
Contribution EBT
33,00,000 22,95,000

(v) If the sales drop to Rs. 50,00,000 from Rs. 75,00,000, the fall is by 33.33% Hence EBIT will drop by 40.73%
(%Fall in sales x operating leverage)
Hence the new EBIT will be Rs. 27,00,000 x (1- 40.73%)
= Rs. 16,00,290 or rounded upto Rs. 16,00,000
(vi) EBT to become zero means 100% reduction in EBT. Since the combined leverage is 1.438, sales have to drop by 100/1.438 i.e. 69.54%. Hence the new sales will be Rs. 75,00,000 x (1- 69.54%) = Rs. 22,84,500 (approx.)
Question 3
From the following, prepare Income Statement of Company A, B and C. Briefly comment on each company’s performance:
Company A B C Financial leverage 3:1 4:1 2:1 Interest Rs. 200 Rs. 300 Rs. 1,000 Operating leverage 4:1 5:1 3:1 Variable Cost as a Percentage to Sales
%32
66 75% 50%
Income tax Rate 45% 45% 45% (Final-Nov. 1997) (12 marks)
Answer
Working Notes:
Company A
Financial leverage = = = or EBIT = 3 x EBT ……. (1)
Again EBIT – Interest = EBT
Or EBIT -200 = EBT ……..(2)
Taking (1) and (2) we get 3EBT -200 = EBT
or 2 EBT = 200 or EBT = Rs. 100
Hence EBIT = 3EBT = Rs. 300
Again we have operating leverage = =
EBIT EBT
3 1
Contribution EBIT
4 1
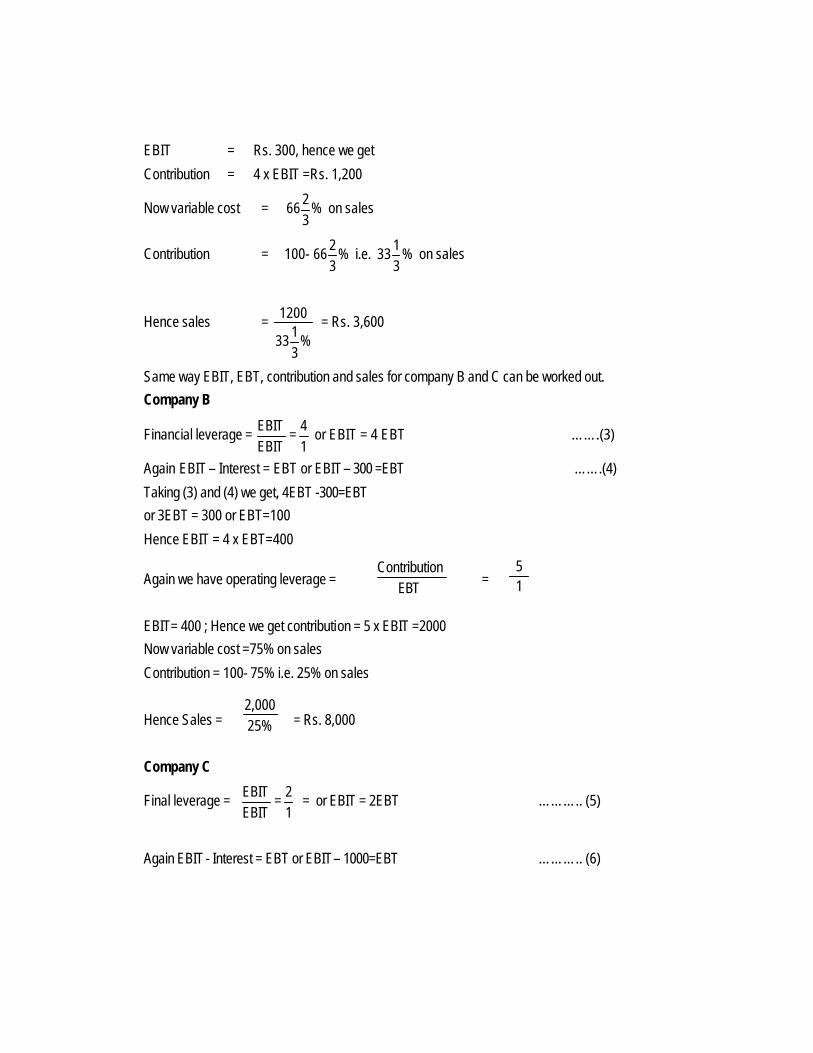
EBIT = Rs. 300, hence we get
Contribution = 4 x EBIT =Rs. 1,200
Now variable cost = %32
66 on sales
Contribution = 100- %32
66 i.e. %31
33 on sales
Hence sales = %
31
33
1200 = Rs. 3,600
Same way EBIT, EBT, contribution and sales for company B and C can be worked out.
Company B
Financial leverage = EBITEBIT =
14 or EBIT = 4 EBT …….(3)
Again EBIT – Interest = EBT or EBIT – 300 =EBT …….(4)
Taking (3) and (4) we get, 4EBT -300=EBT
or 3EBT = 300 or EBT=100
Hence EBIT = 4 x EBT=400
Again we have operating leverage = =
EBIT= 400 ; Hence we get contribution = 5 x EBIT =2000
Now variable cost =75% on sales
Contribution = 100- 75% i.e. 25% on sales
Hence Sales = = Rs. 8,000
Company C
Final leverage = EBITEBIT =
12 = or EBIT = 2EBT ……….. (5)
Again EBIT - Interest = EBT or EBIT– 1000=EBT ……….. (6)
Contribution EBT
5 1
2,000 25%
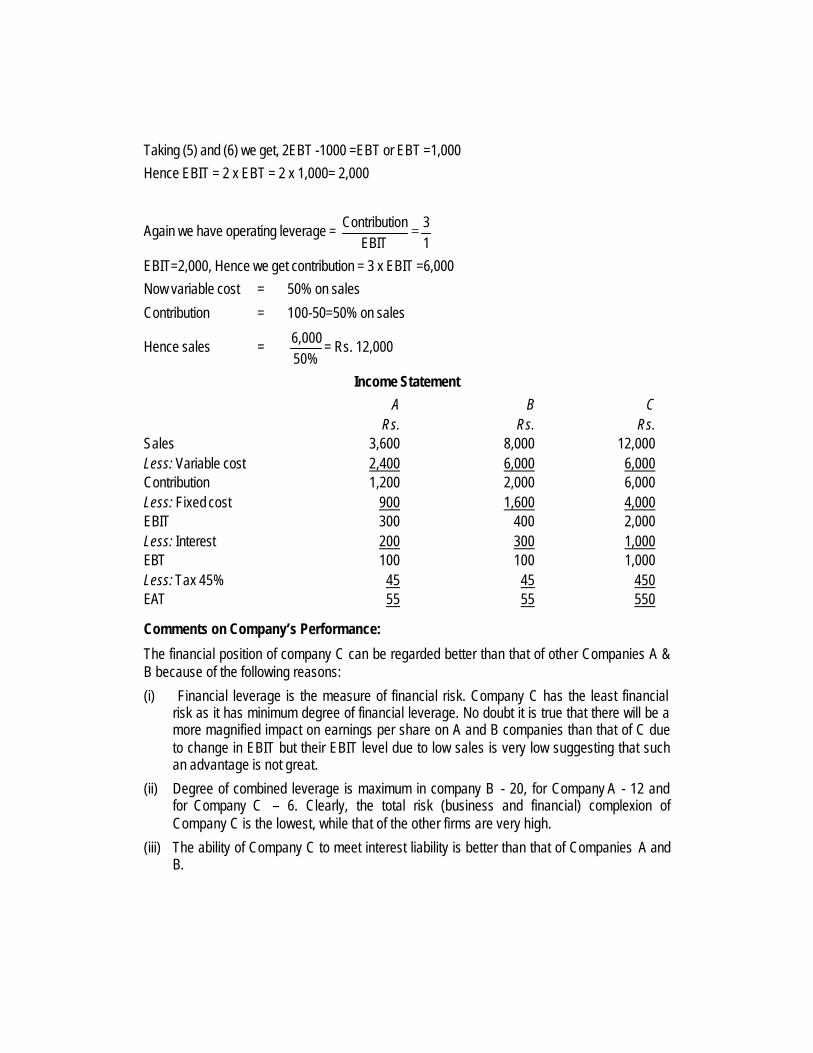
Taking (5) and (6) we get, 2EBT -1000 =EBT or EBT =1,000
Hence EBIT = 2 x EBT = 2 x 1,000= 2,000
Again we have operating leverage = 13
EBIT
onContributi =
EBIT=2,000, Hence we get contribution = 3 x EBIT =6,000
Now variable cost = 50% on sales
Contribution = 100-50=50% on sales
Hence sales = 50%6,000 = Rs. 12,000
Income Statement
A B C Rs. Rs. Rs. Sales 3,600 8,000 12,000 Less: Variable cost 2,400 6,000 6,000 Contribution 1,200 2,000 6,000 Less: Fixed cost 900 1,600 4,000 EBIT 300 400 2,000 Less: Interest 200 300 1,000 EBT 100 100 1,000 Less: Tax 45% 45 45 450 EAT 55 55 550
Comments on Company’s Performance:
The financial position of company C can be regarded better than that of other Companies A & B because of the following reasons:
(i) Financial leverage is the measure of financial risk. Company C has the least financial risk as it has minimum degree of financial leverage. No doubt it is true that there will be a more magnified impact on earnings per share on A and B companies than that of C due to change in EBIT but their EBIT level due to low sales is very low suggesting that such an advantage is not great.
(ii) Degree of combined leverage is maximum in company B - 20, for Company A - 12 and for Company C – 6. Clearly, the total risk (business and financial) complexion of Company C is the lowest, while that of the other firms are very high.
(iii) The ability of Company C to meet interest liability is better than that of Companies A and B.

EBIT/Interest ratio for three companies:
C = 2 1,0002,000
=
B = 1.33 300400 =
A = 1.5 200300 =
Question 4
Consider the following information for Strong Ltd:
EBIT 1,120 Rs. in lakh PBT 320 Rs. in lakh Fixed Cost 700 Rs. in lakh Calculate the percentage of change in earnings per share, if sales increased by 5 per cent.
(Final-Nov. 2001) (6 marks)
Answer
Computation of percentage of change in earnings per share, if sales increased by 5%
Degree of Combined leverage = sales in change %
(EPS) share per Earning in change %
or Degree of operating leverage x Degree of financial leverage =
sales in change %(EPS) share per Earning in change %
or 1.625 x 3.5 (Refer to working notes (i) and (ii) = 5
(EPS) share per Earning in change %
or 5.687 = 5
(EPS) share per Earning in change %
or % change in EPS = 5.687 x 5 = 28.4375%
Working Notes:
(i) Degree of operating leverage (DOC) = EBIT
onContributi
= ( )lakhs 120,1.Rs
lakhs 700.Rs120,1.Rs +
= 1.625

(ii) Degree of financial leverage (DOF) = PBTEBIT
= 320 Rs.
1,120 Rs.
= 3.5
Question 5
The net sales of A Ltd. is Rs. 30 crores. Earnings before interest and tax of the company as a percentage of net sales is 12%. The capital employed comprises Rs. 10 crores of equity, Rs. 2 crores of 13% Cumulative Preference Share Capital and 15% Debentures of Rs. 6 crores. Income-tax rate is 40%.
(i) Calculate the Return-on-equity for the company and indicate its segments due to the presence of Preference Share Capital and Borrowing (Debentures).
(ii) Calculate the Operating Leverage of the Company given that combined leverage is 3.
(Final-May 2002) (6 marks)
Answer
(i) Net Sales : Rs. 30 crores EBIT Rs. 3.6 crores @ 12% on sales
ROI = %201006210
6.3Employed Capital
EBIT =×++
=
Rs. in crores
EBIT 3.6 Interest on Debt 0.9 EBT 2.7 Less : Tax @ 40% 1.08 EAT 1.62 Less : Preference dividend 0.26 Earnings available for Equity Shareholders 1.36 Return on equity = 1.36/10x 100=13.6%
Segments due to the presence of Preference Share capital and Borrowing (Debentures)
Segment of ROE due to preference capital : [.20(1-.4)-.13] x .2 =-.002
Segment of ROE due to Debentures: [.20 (1-.4) - .15 (1-.4)] x .6 =-.018
or -.2% + 1.8% =1.6%

The weighted average cost of capital is as follows
Source Proportion Cost (%) WACC(%)
(i) Equity 10/18 13.60 7.56
(ii) Preference shares
2/18 13.00 1.44
(iii) Debt 6/18 9.00 3.00
Total 12.00
(ii) Degree of Financial Leverage = dividend Preference-Interest-EBIT
EBIT
= 4757.126.–9.– 3.6
3.6 =
Degree of Combined Leverage = DFL x DOL 3 = 1.4754 x DOL
∴ DOL = 1.4754
3
Degree of Operating Leverage =2.033
Question 6
The data relating to two Companies are as given below:
Company A Company B
Equity Capital Rs.6,00,000 Rs.3,50,000
12% Debentures Rs.4,00,000 Rs.6,50,000
Output (units) per annum 60,000 15,000
Selling price/ unit Rs.30 Rs.250
Fixed Costs per annum Rs.7,00,000 Rs.14,00,000
Variable Cost per unit Rs.10 Rs.75
You are required to calculate the Operating leverage, Financial leverage and Combined leverage of two Companies. (PE-II-Nov. 2002) (4 marks)
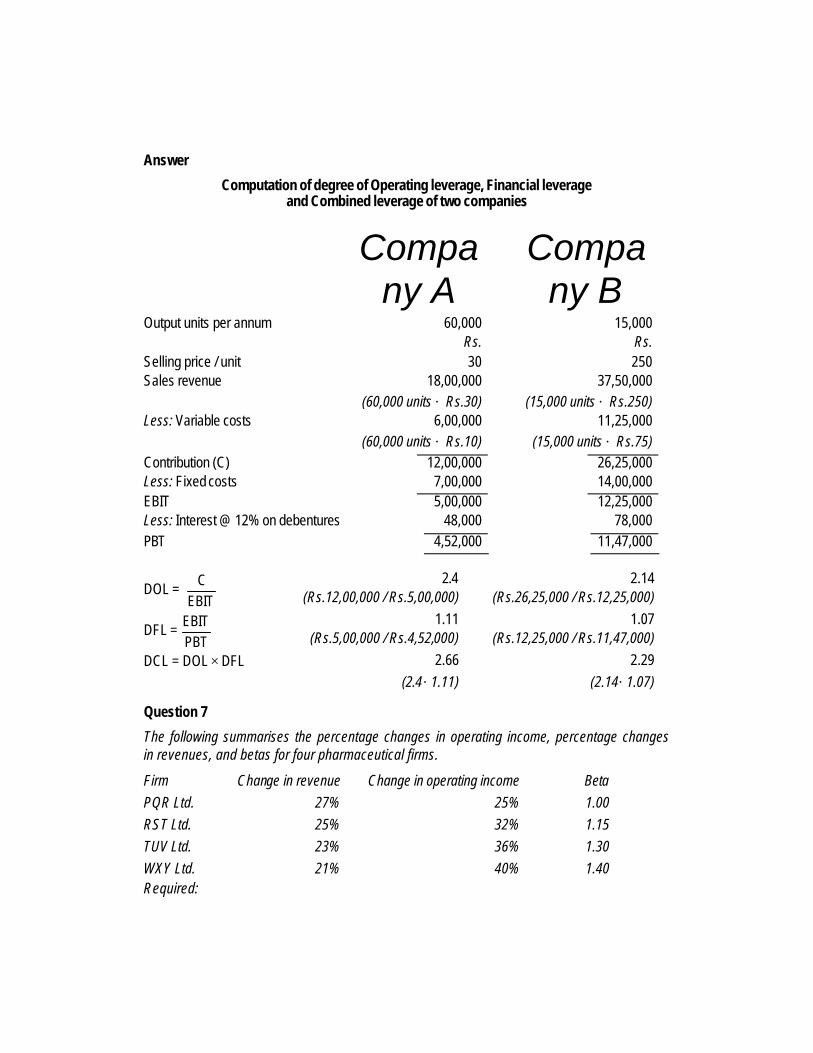
Answer
Computation of degree of Operating leverage, Financial leverage and Combined leverage of two companies
Company A
Company B
Output units per annum 60,000 15,000 Rs. Rs. Selling price / unit 30 250 Sales revenue 18,00,000 37,50,000 (60,000 units × Rs.30) (15,000 units × Rs.250) Less: Variable costs 6,00,000 11,25,000 (60,000 units × Rs.10) (15,000 units × Rs.75) Contribution (C) 12,00,000 26,25,000 Less: Fixed costs 7,00,000 14,00,000 EBIT 5,00,000 12,25,000 Less: Interest @ 12% on debentures 48,000 78,000 PBT 4,52,000 11,47,000
DOL = EBIT
C
2.4 (Rs.12,00,000 / Rs.5,00,000)
2.14 (Rs.26,25,000 / Rs.12,25,000)
DFL = PBTEBIT
1.11 (Rs.5,00,000 / Rs.4,52,000)
1.07 (Rs.12,25,000 / Rs.11,47,000)
DCL = DOL × DFL 2.66 2.29 (2.4×1.11) (2.14×1.07)
Question 7
The following summarises the percentage changes in operating income, percentage changes in revenues, and betas for four pharmaceutical firms.
Firm Change in revenue Change in operating income Beta PQR Ltd. 27% 25% 1.00 RST Ltd. 25% 32% 1.15 TUV Ltd. 23% 36% 1.30 WXY Ltd. 21% 40% 1.40 Required:

(i) Calculate the degree of operating leverage for each of these firms. Comment also.
(ii) Use the operating leverage to explain why these firms have different beta.
(PE-II-Nov. 2004) (6 marks)
Answer
(i) Degree of operating leverage =Revenues in Change %
income Operating in Change %
PQR Ltd . = 25% / 27% = 0.9259
RST Ltd. = 0.32 / 0.25 = 1.28
TUV Ltd. = 0.36 / 0.23 = 1.5652
WXY Ltd. = 0.40 / 0.21 = 1.9048
It is level specific.
(ii) High operating leverage leads to high beta. The sources of risk are the cyclic nature revenues, operating risk and financial risk.
Question 8
A Company had the following Balance Sheet as on March 31, 2006:
Liabilities and Equity Rs. (in crores) Assets Rs. (in crores)
Equity Share Capital (one crore shares of Rs. 10 each)
10
Fixed Assets (Net) Current Assets
25 15
Reserves and Surplus 2
15% Debentures 20 Current Liabilities 8 ___
40 40 The additional information given is as under:
Fixed Costs per annum (excluding interest) Rs. 8 crores
Variable operating costs ratio 65%
Total Assets turnover ratio 2.5
Income-tax rate 40%
Required:
Calculate the following and comment:
(i) Earnings per share
(ii) Operating Leverage
(iii) Financial Leverage
(iv) Combined Leverage. (PE-II-Nov. 2006)(8 marks)

Answer
Total Assets = Rs. 40 crores
Total Asset Turnover Ratio = 2.5
Hence, Total Sales = 40 × 2.5 = Rs. 100 crores
Computation of Profits after Tax (PAT) (Rs. in crores) Sales 100 Less: Variable operating cost @ 65% 65 Contribution 35 Less: Fixed cost (other than Interest) 8 EBIT 27 Less: Interest on debentures (15% × 20) 3 PBT 24 Less: Tax 40% 9.6 PAT 14.4 (i) Earnings per share
∴Rs. 14.4 crores
EPS = 1 crore equity shares
= Rs. 14.40
(ii) Operating Leverage
Contribution 35Operating leverage = = =1.296
EBIT 27
It indicates the choice of technology and fixed cost in cost structure. It is level specific. When firm operates beyond operating break-even level, then operating leverage is low. It indicates sensitivity of earnings before interest and tax (EBIT) to change in sales at a particular level.
(iii) Financial Leverage
EBIT 27
Financial Leverage = = =1.125PBT 24
The financial leverage is very comfortable since the debt service obligation is small vis-à-vis EBIT.
(iv) Combined Leverage
×Contribution EBIT
Combined Leverage = EBIT PBT
= 1.296 × 1.125
= 1.458

The combined leverage studies the choice of fixed cost in cost structure and choice of debt in capital structure. It studies how sensitive the change in EPS is vis-à-vis change in sales.
The leverages − operating, financial and combined are measures of risk.
Question 9
Consider the following information for Omega Ltd.:
Rs. in lakhs EBIT (Earnings before Interest and Tax) 15,750 Earnings before Tax (EBT): 7,000 Fixed Operating costs: 1,575 Required:
Calculate percentage change in earnings per share, if sales increase by 5%.
(PE-II-Nov. 2007) (3 marks)
Answer
Degree of Operating Leverage (DOL)
EBIT
Cost Fixed EBIT
EBITonContributi
+==
1.1 15,750
1,575 15,750 =
+=
Degree of Financial Leverage (DFL)
2.25 7,000
15,750
EBTEBIT
===
Degree of Combined Leverage (DCL)
= DOL × DFL
= 1.1 × 2.25
= 2.475
Percentage Change in Earnings per share
Sales in change %EPS in change %
DCL =
5%
EPS in change % 2.475 =
∴% change in EPS = 12.375%.

Question 10
Delta Ltd. currently has an equity share capital of Rs. 10,00,000 consisting of 1,00,000 Equity share of Rs. 10 each. The company is going through a major expansion plan requiring to raise funds to the tune of Rs. 6,00,000. To finance the expansion the management has following plans: Plan-I : Issue 60,000 Equity shares of Rs. 10 each.
Plan-II : Issue 40,000 Equity shares of Rs. 10 each and the balance through long- term borrowing at 12% interest p.a.
Plan-III : Issue 30,000 Equity shares of Rs.10 each and 3,000 Rs.100, 9% Debentures.
Plan-IV : Issue 30,000 Equity shares of Rs. 10 each and the balance through 6% preference shares.
The EBIT of the company is expected to be Rs. 4,00,000 p.a. assume corporate tax rate of 40%.
Required:
(i) Calculate EPS in each of the above plans.
(ii) Ascertain the degree of financial leverage in each plan. (PE-II-May 2008) (8 marks)
Answer
Computation of EPS and Financial Leverage
PLAN I PLAN II PLAN III PLAN IV
Present Equity Shares 1,00,000 1,00,000 1,00,000 1,00,000
New Issue 60,000 40,000 30,000 30,000
Equity share capital (Rs.) 16,00,000 14,00,000 13,00,000 13,00,000
No. of Equity shares 1,60,000 1,40,000 1,30,000 1,30,000
12% Long term loan (Rs.) − 2,00,000 − −
9% Debentures (Rs.) − − 3,00,000 −
6% Preference Shares (Rs.) − − − 3,00,000
EBIT (Rs.) 4,00,000 4,00,000 4,00,000 4,00,000
Interest on 12% Loan (Rs.) − 24,000 − −
Interest on 9% debentures (Rs.) − − 27,000 −
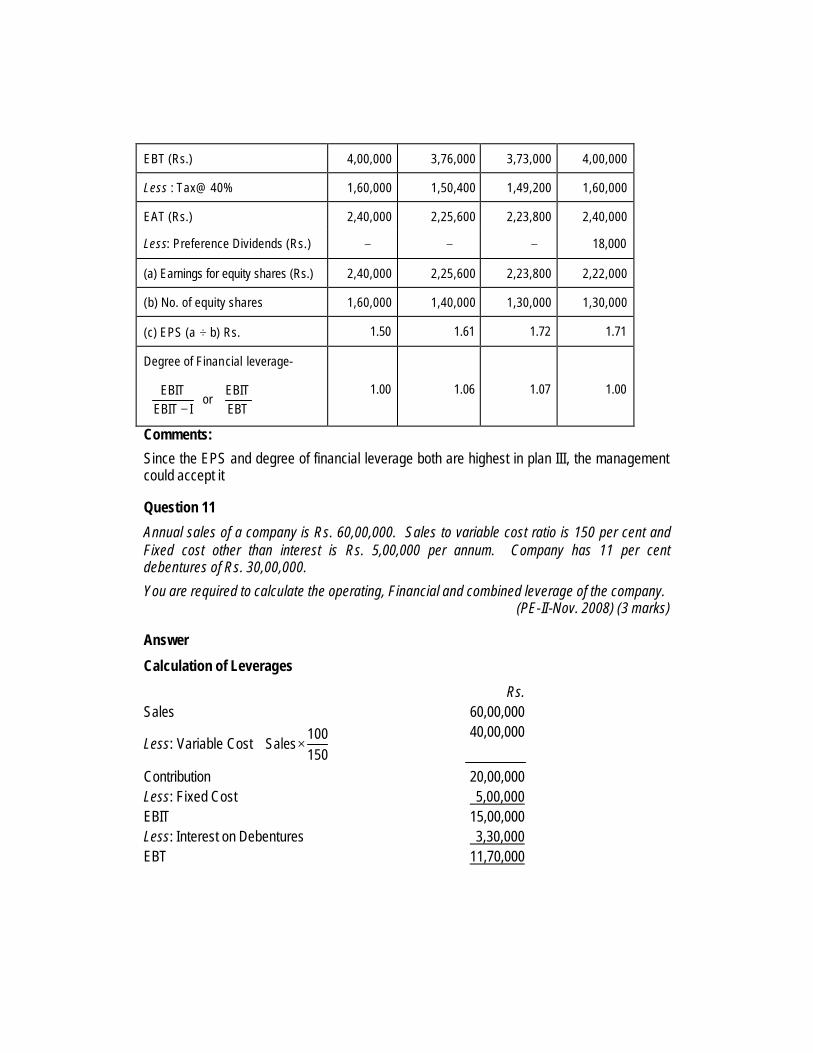
EBT (Rs.) 4,00,000 3,76,000 3,73,000 4,00,000
Less : Tax@ 40% 1,60,000 1,50,400 1,49,200 1,60,000
EAT (Rs.) 2,40,000 2,25,600 2,23,800 2,40,000
Less: Preference Dividends (Rs.) − − − 18,000
(a) Earnings for equity shares (Rs.) 2,40,000 2,25,600 2,23,800 2,22,000
(b) No. of equity shares 1,60,000 1,40,000 1,30,000 1,30,000
(c) EPS (a ÷ b) Rs. 1.50 1.61 1.72 1.71
Degree of Financial leverage-
− IEBITEBIT
or
EBTEBIT
1.00
1.06
1.07
1.00
Comments:
Since the EPS and degree of financial leverage both are highest in plan III, the management could accept it
Question 11
Annual sales of a company is Rs. 60,00,000. Sales to variable cost ratio is 150 per cent and Fixed cost other than interest is Rs. 5,00,000 per annum. Company has 11 per cent debentures of Rs. 30,00,000.
You are required to calculate the operating, Financial and combined leverage of the company. (PE-II-Nov. 2008) (3 marks)
Answer
Calculation of Leverages
Rs. Sales 60,00,000
Less: Variable Cost
×
150100 Sales
40,00,000
Contribution 20,00,000 Less: Fixed Cost 5,00,000 EBIT 15,00,000 Less: Interest on Debentures 3,30,000 EBT 11,70,000

EBIT
onContributi Leverage Operating =
15,00,000 Rs.20,00,000 Rs.
=
= 1.3333
EBTEBIT
Leverage Financial =
11,70,000 Rs.15,00,000 Rs.
=
= 1.2821
EBT
onContributi or FL OL Leverage Combined ×=
11,70,000 Rs.20,00,000 Rs.
or 1.2821 1.3333 ×=
= 1.7094.
Question 12
Discuss the impact of financial leverage on shareholders wealth by using return-on-assets (ROA) and return-on-equity (ROE) analytic framework. (PE-II-May 2003 & May 2004) (3 marks)
Answer
The impact of financial leverage on ROE is positive, if cost of debt (after-tax) is less than ROA. But it is a double-edged sword.
ROA = employed Capital
Sales
SalesNOPAT ×
ROE = ROA + ED (ROA − Kd) Where
NOPAT = EBIT * ( 1 − T c)
Capital employed = Shareholders funds + Loan funds
D = Debt amount in capital structure
E = Equity capital amount in capital structure
Kd = Interest rate * ( 1 − T c) in case of fresh loans of a company.
Kd = Yield to maturity *(1−T c) in case of existing loans of a company.
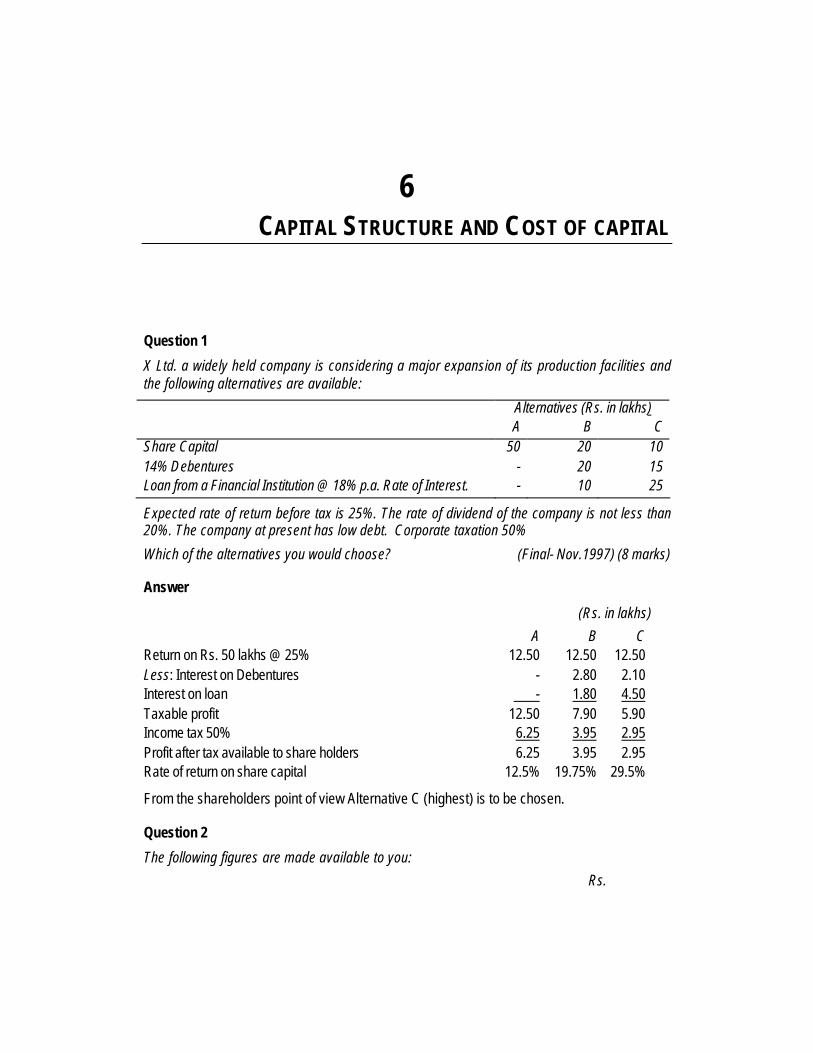
6 CAPITAL STRUCTURE AND COST OF CAPITAL
Question 1
X Ltd. a widely held company is considering a major expansion of its production facilities and the following alternatives are available:
Alternatives (Rs. in lakhs) A B C Share Capital 50 20 10 14% Debentures - 20 15 Loan from a Financial Institution @ 18% p.a. Rate of Interest. - 10 25
Expected rate of return before tax is 25%. The rate of dividend of the company is not less than 20%. The company at present has low debt. Corporate taxation 50%
Which of the alternatives you would choose? (Final- Nov.1997) (8 marks)
Answer
(Rs. in lakhs)
A B C Return on Rs. 50 lakhs @ 25% 12.50 12.50 12.50 Less: Interest on Debentures - 2.80 2.10 Interest on loan - 1.80 4.50 Taxable profit 12.50 7.90 5.90 Income tax 50% 6.25 3.95 2.95 Profit after tax available to share holders 6.25 3.95 2.95 Rate of return on share capital 12.5% 19.75% 29.5%
From the shareholders point of view Alternative C (highest) is to be chosen.
Question 2
The following figures are made available to you:
Rs.

Net profits for the year 18,00,000 Less: Interest on secured debentures at 15% p.a. (Debentures were issued 3 months after the commencement of the year) 1,12,500 16,87,500 Less: Income –tax at 35% and dividend distribution tax 8,43,750
Profit after tax 8,43,750 Number of equity shares (Rs. 10 each) 1,00,000 Market quotation of equity share Rs. 109.7
The company has accumulated revenue reserves of Rs. 12 lakhs. The company is examining a project calling for an investment obligation of Rs. 10 lakhs; this investment is expected to earn the same rate of return as funds already employed.
You are informed that a debt equity ratio (Debt divided by debt plus equity) higher than 60% will cause the price earning ratio to come down by 25% and the interest rate on additional borrowals will cost company 300 basic points more than on the current borrowal on secured debentures.
You are required to advise the company on the probable price of the equity share, if
(a) the additional investment were to be raised by way of loans; or
(b) the additional investment were to be raised by way of equity.
(Final-May 1998) (10 marks)
Answer
Working Note:
Present earning/share:
Rs. Profit before taxes 16,87,500 Less: Taxes at 35% 5,90,625 Profit after tax 10,96,875 No. of equity shares 1,00,000 E.P.S. =
E.P.S. = Rs. 10.97 Market Price = Rs. 109.70 Hence, P/E = = 10
Rs. 10,96,875 1,00,000
Rs. 10,96,875 1,00,000

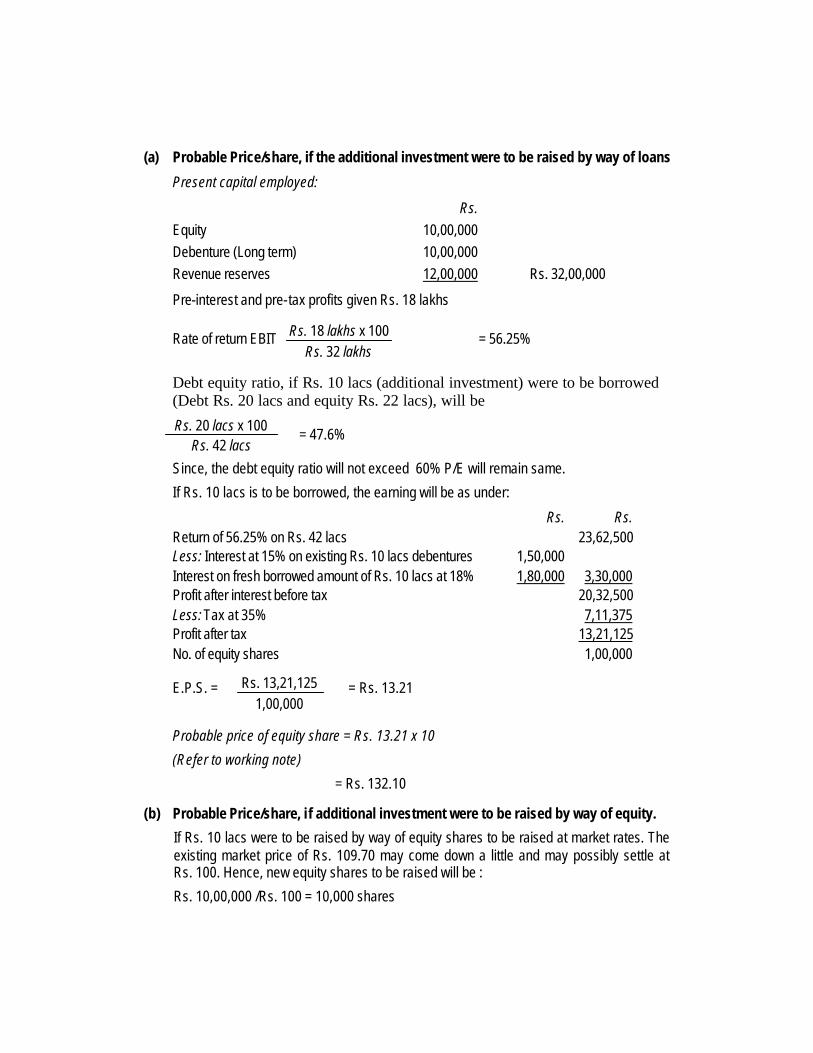
(a) Probable Price/share, if the additional investment were to be raised by way of loans
Present capital employed:
Rs. Equity 10,00,000 Debenture (Long term) 10,00,000 Revenue reserves 12,00,000 Rs. 32,00,000
Pre-interest and pre-tax profits given Rs. 18 lakhs
Rate of return EBIT = = 56.25%
Debt equity ratio, if Rs. 10 lacs (additional investment) were to be borrowed (Debt Rs. 20 lacs and equity Rs. 22 lacs), will be
= 47.6%
Since, the debt equity ratio will not exceed 60% P/E will remain same.
If Rs. 10 lacs is to be borrowed, the earning will be as under:
Rs. Rs. Return of 56.25% on Rs. 42 lacs 23,62,500 Less: Interest at 15% on existing Rs. 10 lacs debentures 1,50,000 Interest on fresh borrowed amount of Rs. 10 lacs at 18% 1,80,000 3,30,000 Profit after interest before tax 20,32,500 Less: Tax at 35% 7,11,375 Profit after tax 13,21,125 No. of equity shares 1,00,000
E.P.S. = = Rs. 13.21
Probable price of equity share = Rs. 13.21 x 10
(Refer to working note)
= Rs. 132.10
(b) Probable Price/share, if additional investment were to be raised by way of equity.
If Rs. 10 lacs were to be raised by way of equity shares to be raised at market rates. The existing market price of Rs. 109.70 may come down a little and may possibly settle at Rs. 100. Hence, new equity shares to be raised will be :
Rs. 10,00,000 /Rs. 100 = 10,000 shares
Rs. 18 lakhs x 100 Rs. 32 lakhs
Rs. 20 lacs x 100 Rs. 42 lacs
Rs. 13,21,125 1,00,000
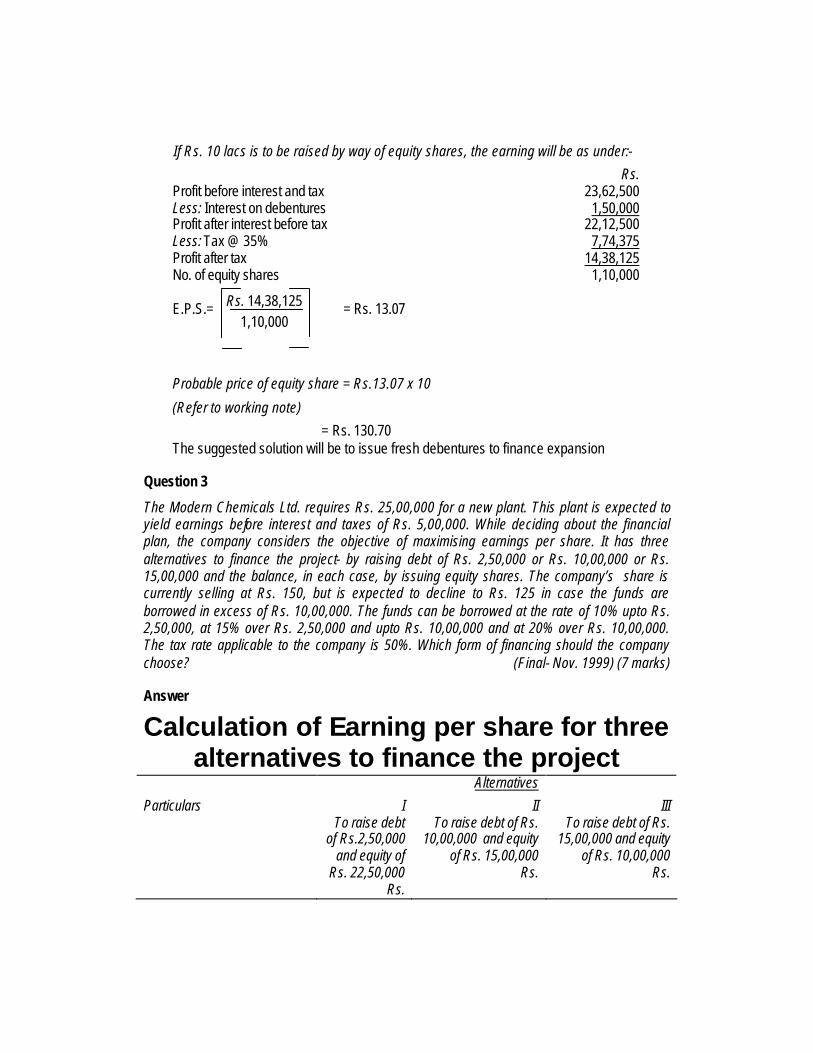
If Rs. 10 lacs is to be raised by way of equity shares, the earning will be as under:-
Rs. Profit before interest and tax 23,62,500 Less: Interest on debentures 1,50,000 Profit after interest before tax 22,12,500 Less: Tax @ 35% 7,74,375 Profit after tax 14,38,125 No. of equity shares 1,10,000 E.P.S.= = Rs. 13.07
Probable price of equity share = Rs.13.07 x 10
(Refer to working note)
= Rs. 130.70 The suggested solution will be to issue fresh debentures to finance expansion
Question 3
The Modern Chemicals Ltd. requires Rs. 25,00,000 for a new plant. This plant is expected to yield earnings before interest and taxes of Rs. 5,00,000. While deciding about the financial plan, the company considers the objective of maximising earnings per share. It has three alternatives to finance the project- by raising debt of Rs. 2,50,000 or Rs. 10,00,000 or Rs. 15,00,000 and the balance, in each case, by issuing equity shares. The company’s share is currently selling at Rs. 150, but is expected to decline to Rs. 125 in case the funds are borrowed in excess of Rs. 10,00,000. The funds can be borrowed at the rate of 10% upto Rs. 2,50,000, at 15% over Rs. 2,50,000 and upto Rs. 10,00,000 and at 20% over Rs. 10,00,000. The tax rate applicable to the company is 50%. Which form of financing should the company choose? (Final- Nov. 1999) (7 marks)
Answer
Calculation of Earning per share for three alternatives to finance the project
Alternatives
Particulars I To raise debt
of Rs.2,50,000 and equity of
Rs. 22,50,000 Rs.
II To raise debt of Rs.
10,00,000 and equity of Rs. 15,00,000
Rs.
III To raise debt of Rs.
15,00,000 and equity of Rs. 10,00,000
Rs.
Rs. 14,38,125 1,10,000
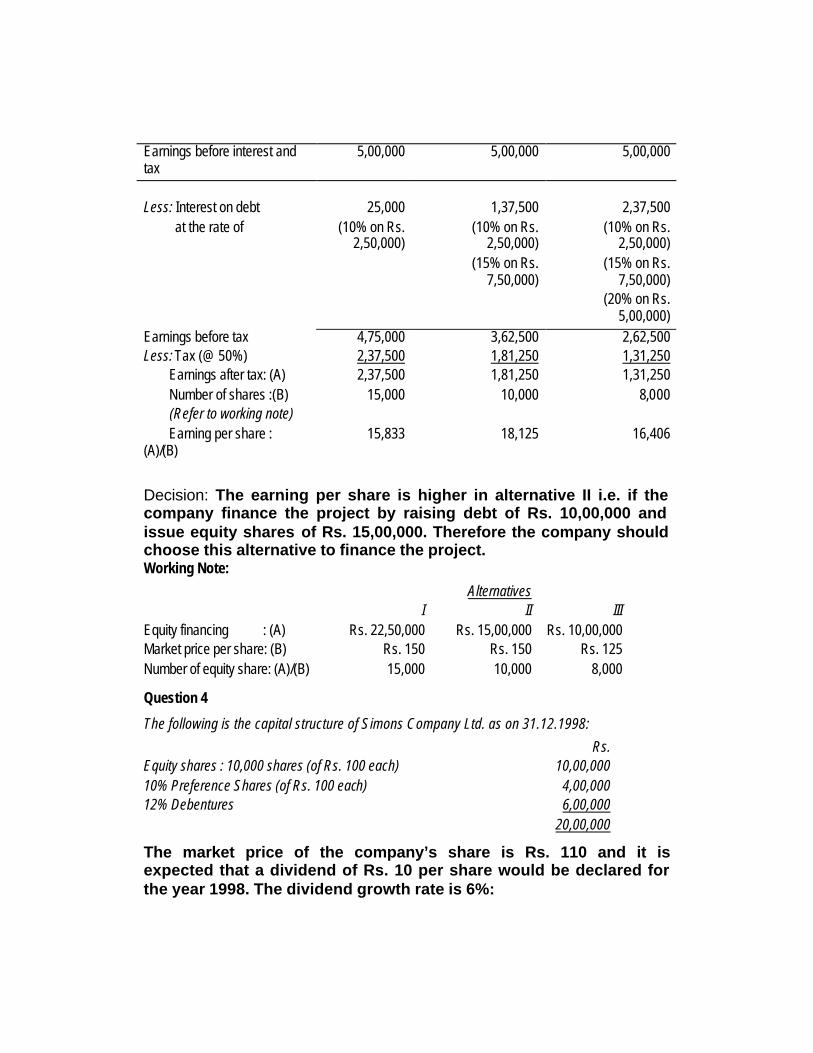
Earnings before interest and tax
5,00,000 5,00,000 5,00,000
Less: Interest on debt at the rate of
25,000 (10% on Rs.
2,50,000)
1,37,500 (10% on Rs.
2,50,000) (15% on Rs.
7,50,000)
2,37,500 (10% on Rs.
2,50,000) (15% on Rs.
7,50,000) (20% on Rs.
5,00,000) Earnings before tax 4,75,000 3,62,500 2,62,500 Less: Tax (@ 50%) 2,37,500 1,81,250 1,31,250 Earnings after tax: (A) 2,37,500 1,81,250 1,31,250 Number of shares :(B) 15,000 10,000 8,000 (Refer to working note) Earning per share : (A)/(B)
15,833 18,125 16,406
Decision: The earning per share is higher in alternative II i.e. if the company finance the project by raising debt of Rs. 10,00,000 and issue equity shares of Rs. 15,00,000. Therefore the company should choose this alternative to finance the project. Working Note:
Alternatives I II III Equity financing : (A) Rs. 22,50,000 Rs. 15,00,000 Rs. 10,00,000 Market price per share: (B) Rs. 150 Rs. 150 Rs. 125 Number of equity share: (A)/(B) 15,000 10,000 8,000
Question 4
The following is the capital structure of Simons Company Ltd. as on 31.12.1998:
Rs. Equity shares : 10,000 shares (of Rs. 100 each) 10,00,000 10% Preference Shares (of Rs. 100 each) 4,00,000 12% Debentures 6,00,000 20,00,000
The market price of the company’s share is Rs. 110 and it is expected that a dividend of Rs. 10 per share would be declared for the year 1998. The dividend growth rate is 6%:
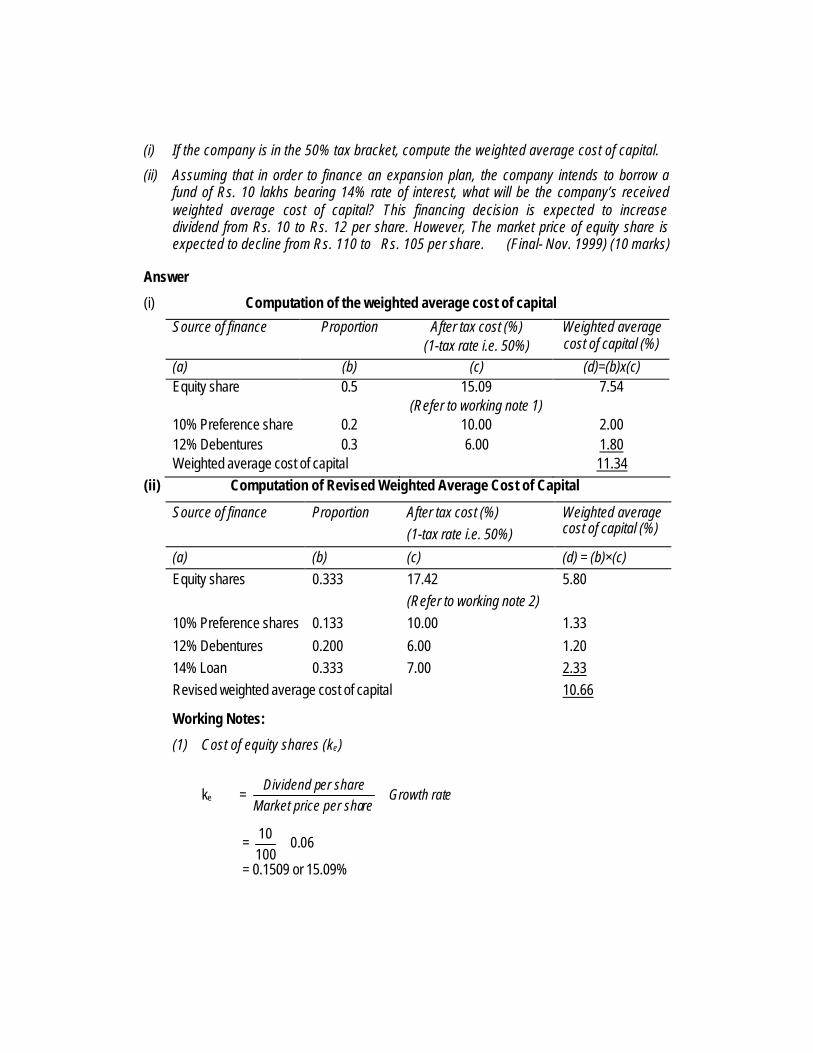
(i) If the company is in the 50% tax bracket, compute the weighted average cost of capital.
(ii) Assuming that in order to finance an expansion plan, the company intends to borrow a fund of Rs. 10 lakhs bearing 14% rate of interest, what will be the company’s received weighted average cost of capital? This financing decision is expected to increase dividend from Rs. 10 to Rs. 12 per share. However, The market price of equity share is expected to decline from Rs. 110 to Rs. 105 per share. (Final- Nov. 1999) (10 marks)
Answer
(i) Computation of the weighted average cost of capital
Source of finance Proportion After tax cost (%) (1-tax rate i.e. 50%)
Weighted average cost of capital (%)
(a) (b) (c) (d)=(b)x(c) Equity share 0.5 15.09 7.54 (Refer to working note 1) 10% Preference share 0.2 10.00 2.00 12% Debentures 0.3 6.00 1.80 Weighted average cost of capital 11.34
(ii) Computation of Revised Weighted Average Cost of Capital
Source of finance Proportion After tax cost (%) (1-tax rate i.e. 50%)
Weighted average cost of capital (%)
(a) (b) (c) (d) = (b)×(c) Equity shares 0.333 17.42 5.80 (Refer to working note 2) 10% Preference shares 0.133 10.00 1.33
12% Debentures 0.200 6.00 1.20 14% Loan 0.333 7.00 2.33 Revised weighted average cost of capital 10.66
Working Notes:
(1) Cost of equity shares (ke)
ke = eGrowth ratrece per shaMarket pri
er shareDividend p+
= 06.010010 +
= 0.1509 or 15.09%

(2) Revised cost of equity shares (ke)
Revised ke = 06.010512 +
= 0.1742 or 17.42%
Question 5
XYZ Ltd. has the following book value capital structure:
Equity Capital (in shares of Rs. 10 each, fully paid up- at par) Rs. 15 crores
11% Preference Capital (in shares of Rs. 100 each, fully paid up- at par) Rs. 1 crore
Retained Earnings Rs. 20 crores
13.5% Debentures (of Rs. 100 each) Rs. 10 crores
15% Term Loans Rs. 12.5 crores
The next expected dividend on equity shares per share is Rs. 3.60; the dividend per share is expected to grow at the rate of 7%. The market price per share is Rs. 40.
Preference stock, redeemable after ten years, is currently selling at Rs. 75 per share.
Debentures, redeemable after six years, are selling at Rs. 80 per debenture.
The Income tax rate for the company is 40%.
(i) Required
Calculate the weighted average cost of capital using:
(a) book value proportions; and
(b) market value proportions.
(ii) Define the weighted marginal cost of capital schedule for the company, if it raises Rs. 10 crores next year, given the following information:
(a) the amount will be raised by equity and debt in equal proportions;
(b) the company expects to retain Rs. 1.5 crores earnings next year;
(c) the additional issue of equity shares will result in the net price per share being fixed at Rs. 32;
(d) the debt capital raised by way of term loans will cost 15% for the first Rs. 2.5 crores and 16% for the next Rs. 2.5 crores. (Final- Nov. 2000) (12 marks)

Answer
(i) (a) Statement showing computation of weighted average cost of capital by using Bookvalue proportions
Source of finance Amount (Book value)
(Rs. in crores)
Weight (Book value proportion)
Cost of capital
Weighted cost of capital
(a) (b) (c)= (a)x(b) Equity capital 15 0.256 0.16 0.04096 (Refer to working note 1) 11% Preference capital
1 0.017 0.1543 0.00262
(Refer to working note 2) Retained earnings 20 0.342 0.16 0.05472 (Refer to working note 1) 13.5% Debentures 10 0.171 0.127 0.02171 (Refer to working note 3) 15% term loans 12.5 0.214 0.09 0.01926 ____ ___ (Refer to working note 4) 58.5 1.00 Weighted average cost of capital 0.013927 or 13.93%
(b) Statement showing computation of weighted average cost of capital by using market value proportions
Source of finance Amount (Rs. in crores)
Weight (Market value proportions)
Cost of capital
Weighted cost of capital
(a) (b) (c)=(a)x(b) Equity capital 60.00 0.739 0.16 0.11824
(Rs. 1.5 crores x Rs. 40) (Refer to working note 1) 11% Preference capital 0.75 0.009 0.1543 0.00138
(Rs. 1 lakh x Rs. 75) (Refer to working note 2) 13.5% Debentures 8.00 0.098 0.127 0.01245
(Rs. 10 lakhs x Rs. 80) (Refer to working note 3) 15% Term loans 12.50 0.154 0.09 0.01386 (Refer to working note 4) 81.25 1.00 Weighted average cost of capital 0.14593 or 14.59%
Note: Since retained earnings are treated as equity capital for purposes of calculation of cost of specific source of finance, the market value of the ordinary

shares may be taken to represent the combined market value of equity shares and retained earnings. The separate market values of retained earnings and ordinary shares may also be worked out by allocating to each of these a percentage of total market value equal to their percentage share of the total based on book value.
(ii) Statement showing weighted marginal cost of capital schedule for the company, if it raises Rs. 10 crores next year, given the following information:
Chunk Source of finance Amount (Rs. in crores)
Weight Cost of capital
Weighted cost of capital
(a) (b) (c)=(a)x(b) 1. Retained earnings 1.5 0.5 0.16 0.08 (Refer to working note 1) Debt 1.5 0.5 0.09 0.045 (Refer to working note 6)
Weighted average cost of capital 0.125 or 12.5% 2. Equity shares 1 0.5 0.1825 0.09125 (Refer to working note 5) Debt 1 0.5 0.09 0.045 (Refer to working note 6) Weighted average cost of capital 0.13625 or 13.625% 3. Equity shares 2.5 0.5 0.1825 0.09125 (Refer to working note 5) Debt 2.5 0.5 0.096 0.048 (Refer to working note 6) Weighted average cost of capital 0.13925 or 13.925%
Working Notes:
1. Cost of equity capital and retained earnings (Ke)
Ke = gPD +
0
1
Where, Ke = Cost of equity capital
D1 = Expected dividend at the end of year 1
P0 = Current market price of equity share
g = Growth rate of dividend
Now, it is given that D1 = Rs. 3.60, P 0 = Rs. 40 and g= 7%
Therefore, Ke = 07.040 Rs.
3.60 Rs. +
or Ke = 16%

2. Cost of preference capital (Kp)
Kp =
+
−
+
nPFn
PFD
Where, D = Preference dividend
F = Face value of preference shares
P = Current market price of preference shares
N = Redemption period of preference shares
Now, it is given that D= 11%, F=Rs. 100, P= Rs. 75 and n= 10 years
Therefore Kp = 100
275.100.
1075 Rs.– 100 Rs.
11×
+
+
nRsRs
= 15.43 %
3. Cost of debentures (Kd)
Kd =
+
−
−
nPF
nPF
tr )1(
Where, r = Rate of interest
t = Tax rate applicable to the company
F = Face value of debentures
P = Current market price of debentures
n = Redemption period of debentures
Now it is given that r= 13.5%, t=40%, F=Rs. 100, P=Rs. 80 and n=6 years
Therefore, Kd = 100
680 Rs. 100 Rs.
680 Rs. – 100 Rs.
)40.01(5.13×
+
+−
= 12.70%

4. Cost of term loans(Kt)
Kt = r(1-t)
Where, r = Rate of interest on term loans
t = Tax rate applicable to the company
Now, r = 15% and t= 40%
Therefore, Kt = 15% (1-0.40)
= 9%
5. Cost of fresh equity share (Ke)
Ke = gP
+
1D
Now, D1 = Rs. 3.60, P= Rs. 32 and g=0.07
Therefore, Ke = 07.032 Rs.
3.60 Rs.+
= 18.25%
6. Cost of debt (Kd)
Kd = r(1-t)
(For first Rs. 2.5 crores)
r = 15% and t= 40%
Therefore, Kd =15% (1-40%)
= 9%
(For the next 2.5 crores )
r = 16% and t= 40%
Therefore, Kd = 16% (1-40%)
= 9.6%
Question 6
A Company earns a profit of Rs.3,00,000 per annum after meeting its Interest liability of Rs.1,20,000 on 12% debentures. The Tax rate is 50%. The number of Equity Shares of Rs.10 each are 80,000 and the retained earnings amount to Rs.12,00,000. The company proposes to take up an expansion scheme for which a sum of Rs.4,00,000 is required. It is anticipated that after expansion, the company will be able to achieve the same return on investment as at present. The funds required for expansion can be raised either through debt at the rate of 12% or by issuing Equity Shares at par.
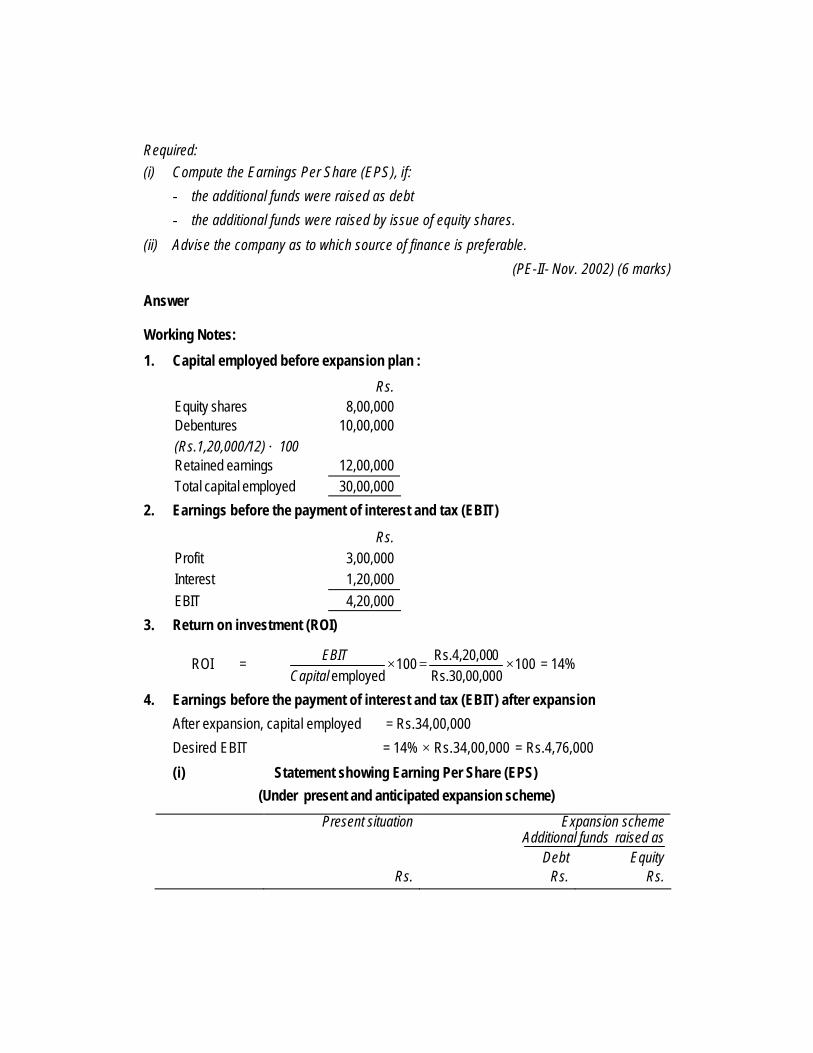
Required: (i) Compute the Earnings Per Share (EPS), if:
− the additional funds were raised as debt
− the additional funds were raised by issue of equity shares.
(ii) Advise the company as to which source of finance is preferable.
(PE-II- Nov. 2002) (6 marks)
Answer
Working Notes:
1. Capital employed before expansion plan :
Rs. Equity shares 8,00,000 Debentures 10,00,000 (Rs.1,20,000/12) × 100 Retained earnings 12,00,000 Total capital employed 30,00,000
2. Earnings before the payment of interest and tax (EBIT)
Rs. Profit 3,00,000 Interest 1,20,000 EBIT 4,20,000
3. Return on investment (ROI)
ROI = 10000Rs.30,00,00Rs.4,20,00
100employed
×=×Capital
EBIT = 14%
4. Earnings before the payment of interest and tax (EBIT) after expansion
After expansion, capital employed = Rs.34,00,000
Desired EBIT = 14% × Rs.34,00,000 = Rs.4,76,000
(i) Statement showing Earning Per Share (EPS)
(Under present and anticipated expansion scheme)
Present situation Expansion scheme Additional funds raised as
Debt Equity Rs. Rs. Rs.

EBIT: (A) 4,20,000 4,76,000 476,000 (Refer to Working note 2) (Refer to Working note 4) Interest − Old capital 1,20,000 1,20,000 1,20,000 − New capital − 48,000 − (Rs.4,00,000 × 12%) Total interest : (B) 1,20,000 1,68,000 1,20,000 EBT:{(A) − (B)} 3,00,000 3,08,000 3,56,000 Less: Tax 1,50,000 1,54,000 1,78,000 (50% of EBT) PAT 1,50,000 1,54,000 1,78,000 EPS 1.875 1.925 1.48 (Rs.1,50,000/
80,000) (Rs.1,54,000/
80,000) (Rs.1,78,000/
1,20,000)
(ii) Advise to the Company: Since EPS is greater in the case when company arranges additional funds as debt. Therefore, debt scheme is better.
Question 7
Calculate the level of earnings before interest and tax (EBIT) at which the EPS indifference point between the following financing alternatives will occur.
(i) Equity share capital of Rs.6,00,000 and 12% debentures of Rs.4,00,000
Or (ii) Equity share capital of Rs.4,00,000, 14% preference share capital of Rs.2,00,000 and
12% debentures of Rs.4,00,000.
Assume the corporate tax rate is 35% and par value of equity share is Rs.10 in each case
. (PE-II- May. 2003) (3 marks)
Answer
Computation of level of earnings before interest and tax (EBIT)
In case alternative (i) is accepted, then the EPS of the firm would be:
sharesequity of No. rate) tax(1 Interest)(EBIT
e(i)AlternativEPS−−
=
= 000,60
)35.01( )000,00,4.12.0( −×− RsEBIT
In case the alternative (ii) is accepted, then the EPS of the firm would be
40,000 0)Rs.2,00,00(0.14-)35.0(1 )000,00,4.Rs12.0(EBIT
e(ii)AlternativEPS×−×−
=

In order to determine the indifference level of EBIT, the EPS under the two alternative plans should be equated as follows:
40,0000)Rs.2,00,00(0.140.35)(1 0)Rs.4,00,000.12(EBIT
60,0000.35)(1 0)Rs.4,00,000.12(EBIT ×−−×−
=−×−
Or 2
Rs.59,200EBIT 0.65
3Rs.31,200EBIT 0.65 −=−
Or 1.30 EBIT − Rs.62,400 = 1.95 EBIT − Rs.1,77,600 Or (1.95 − 1.30) EBIT = Rs.1,77,600 − Rs.62,400 = Rs.1,15,200
Or EBIT = 0.65
0Rs.1,15,20
Or EBIT = Rs.1,77,231
Question 8
JKL Ltd. has the following book-value capital structure as on March 31, 2003.
Rs.
Equity share capital (2,00,000 shares) 40,00,000
11.5% preference shares 10,00,000
10% debentures 30,00,000
80,00,000
The equity share of the company sells for Rs.20. It is expected that the company will pay next year a dividend of Rs.2 per equity share, which is expected to grow at 5% p.a. forever. Assume a 35% corporate tax rate.
Required:
(i) Compute weighted average cost of capital (WACC) of the company based on the existing capital structure.
(ii) Compute the new WACC, if the company raises an additional Rs.20 lakhs debt by issuing 12% debentures. This would result in increasing the expected equity dividend to Rs.2.40 and leave the growth rate unchanged, but the price of equity share will fall to Rs. 16 per share.
(iii) Comment on the use of weights in the computation of weighted average cost of capital.
(PE-II- May. 2003) (8 marks)
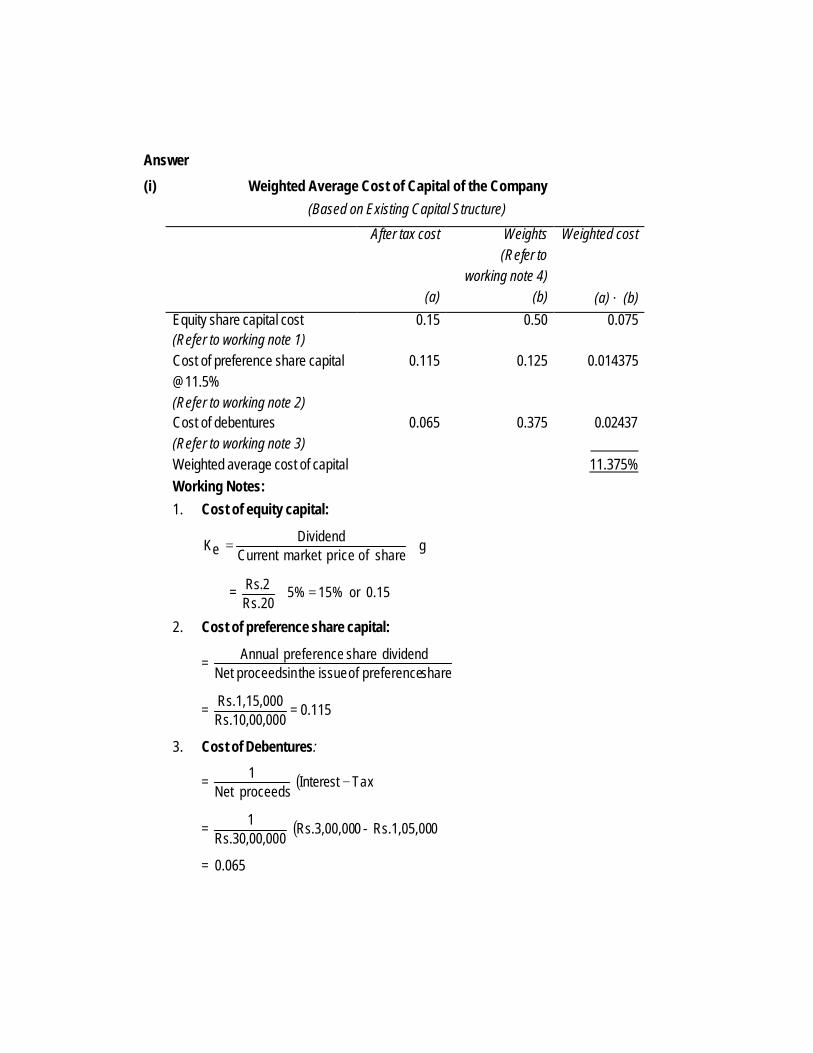
Answer
(i) Weighted Average Cost of Capital of the Company
(Based on Existing Capital Structure)
After tax cost Weights Weighted cost (Refer to working note 4) (a) (b) (a) × (b) Equity share capital cost 0.15 0.50 0.075 (Refer to working note 1) Cost of preference share capital 0.115 0.125 0.014375 @11.5% (Refer to working note 2) Cost of debentures 0.065 0.375 0.02437 (Refer to working note 3) Weighted average cost of capital 11.375%
Working Notes:
1. Cost of equity capital:
gshare of pricemarket Current
DividendeK +=
= 0.15 or 15%5%Rs.20Rs.2 =+
2. Cost of preference share capital:
= share preference of issue the in proceedsNet
dividend share preference Annual
= 00Rs.10,00,00Rs.1,15,00 = 0.115
3. Cost of Debentures:
= ( )TaxInterestproceedsNet
1−
= ( )0Rs.1,05,00 - 0Rs.3,00,0000Rs.30,00,0
1
= 0.065

4. Weights of equity share capital, preference share capital and debentures in total investment of Rs.80,00,000:
Weight of equity share capital = sinvestment Total
capital shareequity Total
= 00Rs.80,00,000Rs.40,00,0 = 0.50
Weight of preference share capital = sinvestment Totalamount share preference Total
= 00Rs.80,00,000Rs.10,00,0 = 0.125
Weight of debentures = sinvestment Total
debentures Total
= 00Rs.80,00,000Rs.30,00,0 = 0.375
(ii) New Weighted Average Cost of Capital of the Company
(Based on new capital structure)
After tax cost Weights Weighted cost (Refer to working note 4) (a) (b) (a) × (b) Cost of equity share capital 0.20 0.40 0.080 (Refer to working note 2) Cost of preference share 0.115 0.10 0.0115 Cost of debentures @ 10% 0.065 0.30 0.0195 Cost of debentures @12% 0.078 0.20 0.0156 Weighted average cost of capital 12.66%
Working Notes:
(1) Weights of equity share capital, preference share and debentures in total investment of Rs.100,00,000
Weight of equity share capital = 0.4,000Rs.1,00,0000Rs.40,00,0
=
Weight of preference share capital = 1.0000,00,00,1.Rs
000,00,10.Rs=
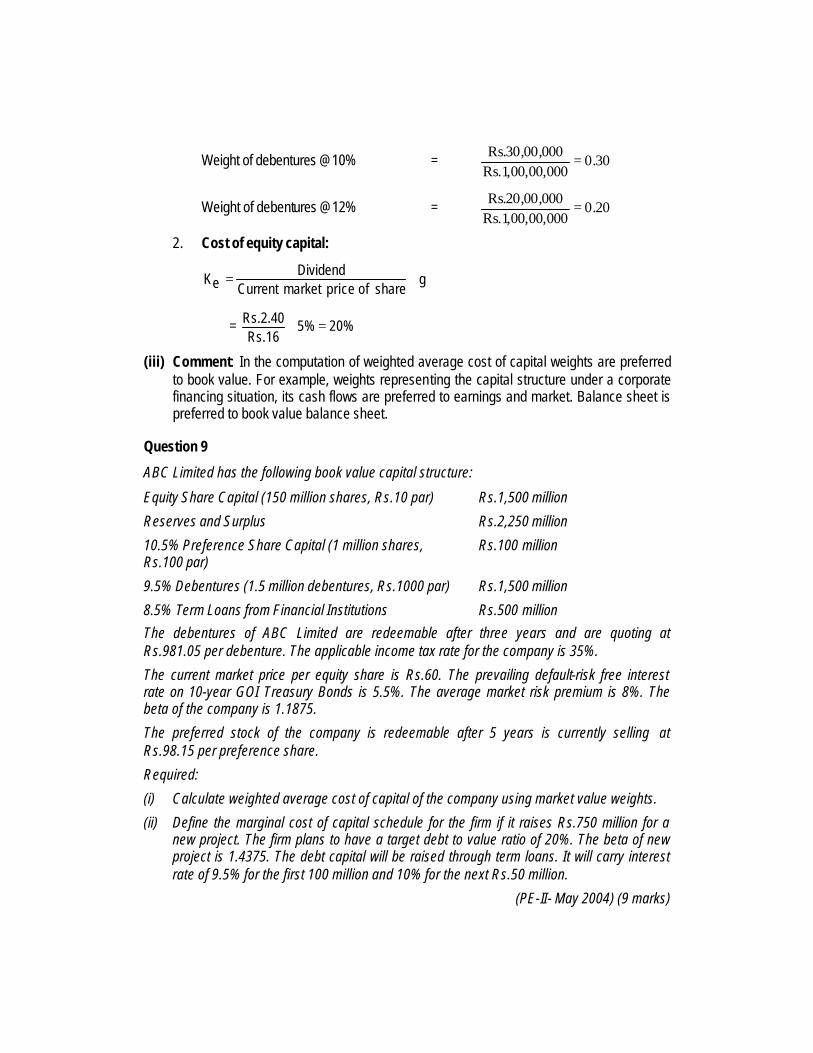
Weight of debentures @10% = 30.0000,00,00,1.Rs
000,00,30.Rs =
Weight of debentures @12% = 20.0000,00,00,1.Rs
000,00,20.Rs =
2. Cost of equity capital:
gshare of pricemarket Current
DividendeK +=
= 20%5%Rs.16
Rs.2.40 =+
(iii) Comment: In the computation of weighted average cost of capital weights are preferred to book value. For example, weights representing the capital structure under a corporate financing situation, its cash flows are preferred to earnings and market. Balance sheet is preferred to book value balance sheet.
Question 9
ABC Limited has the following book value capital structure:
Equity Share Capital (150 million shares, Rs.10 par) Rs.1,500 million
Reserves and Surplus Rs.2,250 million
10.5% Preference Share Capital (1 million shares, Rs.100 par)
Rs.100 million
9.5% Debentures (1.5 million debentures, Rs.1000 par) Rs.1,500 million
8.5% Term Loans from Financial Institutions Rs.500 million
The debentures of ABC Limited are redeemable after three years and are quoting at Rs.981.05 per debenture. The applicable income tax rate for the company is 35%.
The current market price per equity share is Rs.60. The prevailing default-risk free interest rate on 10-year GOI Treasury Bonds is 5.5%. The average market risk premium is 8%. The beta of the company is 1.1875.
The preferred stock of the company is redeemable after 5 years is currently selling at Rs.98.15 per preference share.
Required:
(i) Calculate weighted average cost of capital of the company using market value weights.
(ii) Define the marginal cost of capital schedule for the firm if it raises Rs.750 million for a new project. The firm plans to have a target debt to value ratio of 20%. The beta of new project is 1.4375. The debt capital will be raised through term loans. It will carry interest rate of 9.5% for the first 100 million and 10% for the next Rs.50 million.
(PE-II- May 2004) (9 marks)

Answer
Working Notes:
1) Computation of cost of debentures (Kd) :
981.05 = 321 ytm)(11095
ytm)(195
ytm)(195
++
++
+
Yield to maturity (ytm) = 10% (approximately)
Kd = ytm × (1 − Tc)
= 10% × (1− 0.35)
= 6.5%
2) Computation of cost of term loans (KT) :
= i × ( 1− T c)
= 8.5% ( 1− 0.35)
= 5.525%
3) Computation of cost of preference capital (KP) :
98.5 = 54321 YTM)(110.5
YTM)(110.5
YTM)(110.5
YTM)(110.5
YTM)(110.5
++
++
++
++
+
YTM = 11% (approximately)
Kp = 11%
4) Computation of cost of equity (KE) :
= rf + Average market risk premium × Beta
= 5.5%+ 8% × 1.1875
= 15%
5) Computation of proportion of equity capital, preference share, debentures and term loans in the market value of capital structure:
(Rs. in million) Market value of
capital structure Rs.
Proportion
Equity share capital (150 million share × Rs.60)
9,000 81.3000
98.15 0.889 10.5% Preferential share capital (1 million shares × 98.15)
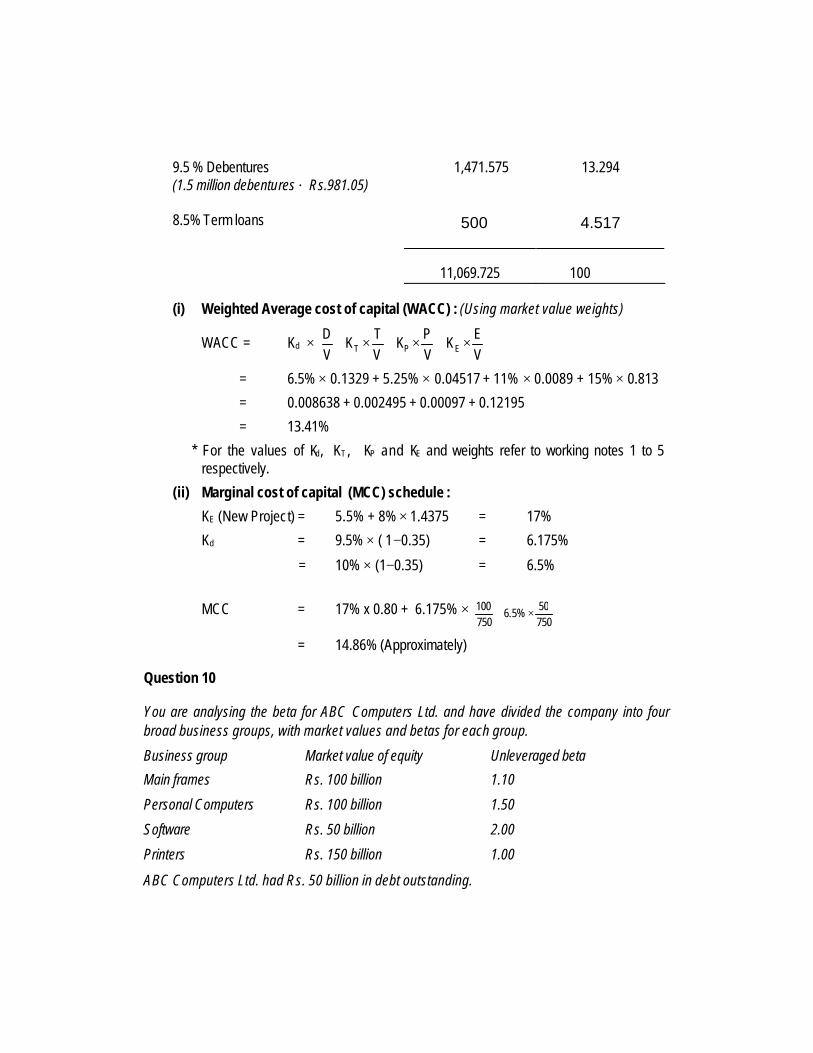
1,471.575 13.294 9.5 % Debentures
(1.5 million debentures × Rs.981.05) 8.5% Term loans 500 4.517
11,069.725
100
(i) Weighted Average cost of capital (WACC) : (Using market value weights)
WACC = Kd × VE
KVP
KVT
KVD
EPT ×+×+×+
= 6.5% × 0.1329 + 5.25% × 0.04517 + 11% × 0.0089 + 15% × 0.813
= 0.008638 + 0.002495 + 0.00097 + 0.12195
= 13.41%
* For the values of Kd, KT , KP and KE and weights refer to working notes 1 to 5 respectively.
(ii) Marginal cost of capital (MCC) schedule :
KE (New Project) = 5.5% + 8% × 1.4375 = 17%
Kd = 9.5% × ( 1−0.35) = 6.175%
= 10% × (1−0.35) = 6.5%
MCC = 17% x 0.80 + 6.175% × 75050%5.6
750100 ×+
= 14.86% (Approximately)
Question 10
You are analysing the beta for ABC Computers Ltd. and have divided the company into four broad business groups, with market values and betas for each group.
Business group Market value of equity Unleveraged beta
Main frames Rs. 100 billion 1.10
Personal Computers Rs. 100 billion 1.50
Software Rs. 50 billion 2.00
Printers Rs. 150 billion 1.00
ABC Computers Ltd. had Rs. 50 billion in debt outstanding.

Required: (i) Estimate the beta for ABC Computers Ltd. as a Company. Is this beta going to be equal
to the beta estimated by regressing past returns on ABC Computers stock against a market index. Why or why not ?
(ii) If the treasury bond rate is 7.5%, estimate the cost of equity for ABC Computers Ltd. Estimate the cost of equity for each division. Which cost of equity would you use to value the printer division ? The average market risk premium is 8.5%.
(PE-II-Nov. 2004) (6 marks)
Answer
(i) Beta of ABC Computers
= 1.10 × 2/8 + 1.50×2/8 + 2×1/8 + 1×3/8
= 1.275
Beta coefficient is a measure of volatility of securities return relative to the returns of a broad based market portfolio. Hence beta measures volatility of ABC Computers stock return against broad based market portfolio. In this case we are considering four business groups in computer segment and not a broad based market portfolio , therefore beta calculations will not be the same.
(ii) Cost of equity
= rf + av mkt risk premium×β
= 7.5% + 1.275×8.5% = 18.34%
Main frame KE = 7.5% + 1.10×8.5% = 16.85%
Personal KE = 7.5% + 1.5×8.5% = 20.25%
Computers
Software KE = 7.5% + 2×8.5% = 24.5%
Printers KE = 7.5% + 1×8.5% = 16%
To value printer division, the use of 16% KE is recommended.
Question 11
D Ltd. is foreseeing a growth rate of 12% per annum in the next two years. The growth rate is likely to be 10% for the third and fourth year. After that the growth rate is expected to stabilise at 8% per annum. If the last dividend was Rs. 1.50 per share and the investor’s required rate of return is 16%, determine the current value of equity share of the company.
The P.V. factors at 16%
Year 1 2 3 4

P.V. Factor .862 .743 .641 .552
(PE-II-May 2005) (6 marks)
Answer
The current value of equity share of D Ltd. is sum of the following:
(i) Presently value (PV) of dividends payments during 1-4 years; and
(ii) Present value (PV) of expected market price at the end of the fourth year based on constant growth rate of 8 per cent.
PV of dividends – year 1-4 Year Dividend PV factor at 16% Total PV (in Rs.)
1 1.50(1 + 0.12)=1.68 0.862 1.45
2 1.68 (1+0.12)= 1.88 0.743 1.40
3 1.88 (1 + 0.10)=2.07 0.641 1.33
4 2.07 (1 + 0.10)= 2.28 0.552 1.26
Total 5.44
Present value of the market price (P 4 ): end of the fourth year –
P 4 = D 5 / (Ke-g) = Rs. 2.28 (1.08) / (16% − 8%) = Rs. 30.78
PV of Rs. 30.78 = Rs. 30.78×0.552 = Rs. 16.99
Hence,
Value of equity shares Rs. 5.44 + Rs. 16.99 = Rs. 22.43
Question 12
The R&G Company has following capital structure at 31s t March 2004, which is considered to be optimum:
Rs.
13% debenture 3,60,000
11% preference share capital 1,20,000
Equity share capital (2,00,000 shares) 19,20,000
The company’s share has a current market price of Rs. 27.75 per share. The expected dividend per share in next year is 50 percent of the 2004 EPS. The EPS of last 10 years is as follows. The past trends are expected to continue:

Year 1995 1996 1997 1998 1999 2000 2001 2002 2003 2004
EPS
(Rs.) 1.00 1.120 1.254 1.405 1.574 1.762 1.974 2.211 2.476 2.773
The company can issue 14 percent new debenture. The company’s debenture is currently selling at Rs. 98. The new preference issue can be sold at a net price of Rs. 9.80, paying a dividend of Rs. 1.20 per share. The company’s marginal tax rate is 50%.
(i) Calculate the after tax cost (a) of new debts and new preference share capital, (b) of ordinary equity, assuming new equity comes form retained earnings.
(ii) Calculate the marginal cost of capital.
(iii) How much can be spent for capital investment before new ordinary share must be sold ? Assuming that retained earning available for next year’s investment are 50% of 2004 earnings.
(iv) What will be marginal cost of capital (cost of fund raised in excess of the amount calculated in part (iii))if the company can sell new ordinary shares to net Rs. 20 per share ? The cost of debt and of preference capital is constant.
(PE-II-May 2005) (2+1+2+2=7 marks)
Answer
The existing capital structure is assumed to be optimum.
Existing Capital Structure Analysis Type of capital Amount (Rs) Proportions
13% debentures 3,60,000 0.15
11% Preference 1,20,000 0.05
Equity 19,20,000 0.80
24,00,000 1.00
(i) (a) After tax cost of debt = K d = ×9814
(1 – 0.5)
= 0.07143
After tax cost of preference capital (new)
Kp= 80.920.1
= 0.122449
(b) After tax cost of retained earnings

K e = 75.27
3865.1+ g
(here ‘g’ is the growth rate)
= 0.05 + 0.12 = 0.17
(ii)
Types of capital
(1)
Proportion
(2)
Specific cost
(3)
Product
(2) × (3)
Debt .15 .07143 .0107
Preference .05 .122449 .0061
Equity .80 .17 .1360
Marginal cost of capital at existing capital structure
.1528 or 15.28%
(iii) The company can spend the following amount without increasing its MCC and without selling the new shares.
Retained earnings = 1.3865 × 2,00,000 =2,77,300
The ordinary equity (retained earnings in this case) is 80% of the total capital. Thus
investment before issuing equity ( ×80
300,77,2 100 ) = Rs 3,46,625
(iv) if the company spends more than Rs3, 46,625 , it will have to issue new shares . The cost of new issue of ordinary share is :
K e = 203865.1
+ 0.12 = 0.1893
The marginal cost of capital of Rs 3,46,625
Types of capital
(1)
Proportion
(2)
Specific cost
(3)
Product
(2) × (3)
Debt .15 .07143 .0107
Preference .05 .122449 .0061
Equity(new) .80 .1893 0.15144
Marginal cost of capital at existing
0.16824 or 16.82 %

capital structure
Question 13
A Company needs Rs. 31,25,000 for the construction of new plant. The following three plans are feasible:
I The Company may issue 3,12,500 equity shares at Rs. 10 per share.
II The Company may issue 1,56,250 ordinary equity shares at Rs. 10 per share and 15,625 debentures of Rs,. 100 denomination bearing a 8% rate of interest.
III The Company may issue 1,56,250 equity shares at Rs. 10 per share and 15,625 preference shares at Rs. 100 epr share bearing a 8% rate of dividend.
(i) if the Company's earnings before interest and taxes are Rs. 62,500, Rs. 1,25,000, Rs. 2,50,000, Rs. 3,75,000 and Rs. 6,25,000, what are the earnings per share under each of three financial plans ? Assume a Corporate Income tax rate of 40%.
(ii) Which alternative would you recommend and why?
(iii) Determine the EBIT-EPS indifference points by formulae between Financing Plan I and Plan II and Plan I and Plan III. (PE-II-Nov.2005) (6+1+3=10 marks)
Answer
(i) Computation of EPS under three-financial plans.
Plan I: Equity Financing
EBIT Rs. 62,500 Rs. 1,25,000 Rs. 2,50,000 Rs. 3,75,000 Rs. 6,25,000 Interest 0 0 0 0 0 EBT Rs. 62,500 Rs. 1,25,000 Rs. 2,50,000 Rs. 3,75,000 Rs. 6,25,000 Less: Taxes 40%
25,000 50,000 1,00,000 1,50,000 2,50,000
PAT Rs. 37,500 Rs. 75,000 Rs. 1,50,000 Rs. 2,25,000 Rs. 3,75,000
No. of equity shares
3,12,500 3,12,500 3,12,500 3,12,500 3,12,500
EPS Rs. 0.12 0.24 0.48 0.72 1.20
Plan II: Debt – Equity Mix
EBIT Rs. 62,500 Rs. 1,25,000 Rs. 2,50,000 Rs. 3,75,000 Rs. 6,25,000 Less: Interest 1,25,000 1,25,000 1,25,000 1,25,000 1,25,000
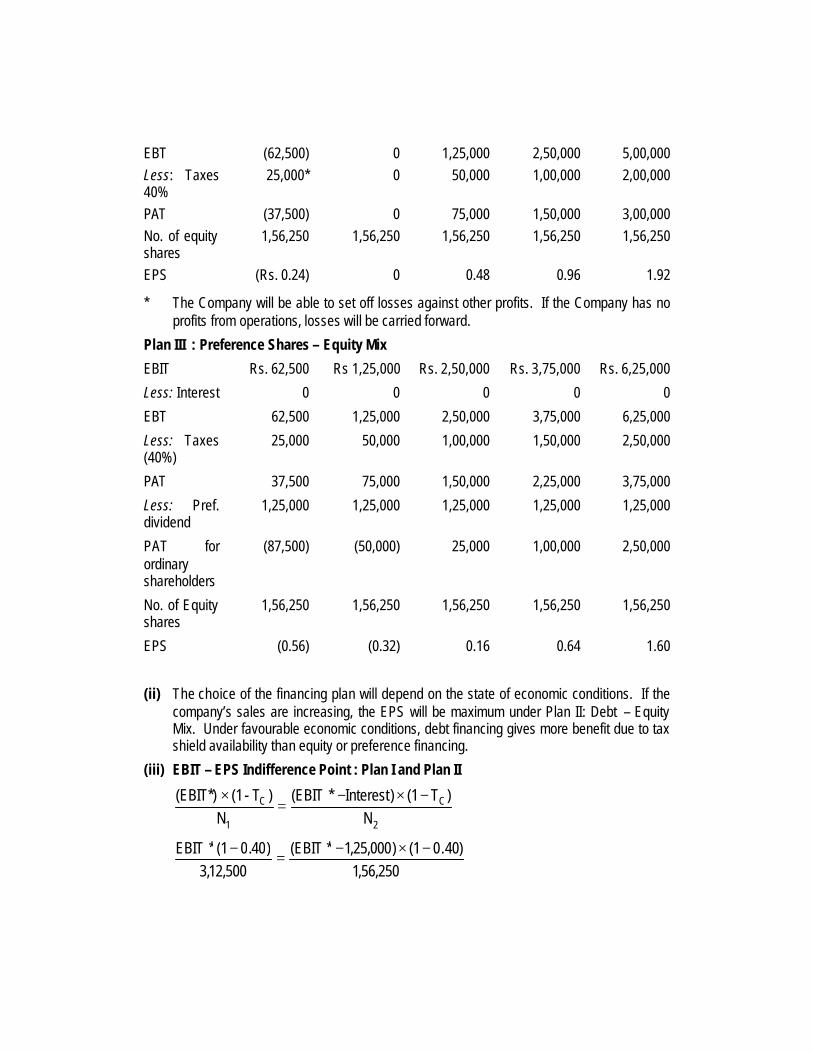
EBT (62,500) 0 1,25,000 2,50,000 5,00,000 Less: Taxes 40%
25,000* 0 50,000 1,00,000 2,00,000
PAT (37,500) 0 75,000 1,50,000 3,00,000 No. of equity shares
1,56,250 1,56,250 1,56,250 1,56,250 1,56,250
EPS (Rs. 0.24) 0 0.48 0.96 1.92
* The Company will be able to set off losses against other profits. If the Company has no profits from operations, losses will be carried forward.
Plan III : Preference Shares – Equity Mix
EBIT Rs. 62,500 Rs 1,25,000 Rs. 2,50,000 Rs. 3,75,000 Rs. 6,25,000
Less: Interest 0 0 0 0 0
EBT 62,500 1,25,000 2,50,000 3,75,000 6,25,000
Less: Taxes (40%)
25,000 50,000 1,00,000 1,50,000 2,50,000
PAT 37,500 75,000 1,50,000 2,25,000 3,75,000
Less: Pref. dividend
1,25,000 1,25,000 1,25,000 1,25,000 1,25,000
PAT for ordinary shareholders
(87,500) (50,000) 25,000 1,00,000 2,50,000
No. of Equity shares
1,56,250 1,56,250 1,56,250 1,56,250 1,56,250
EPS (0.56) (0.32) 0.16 0.64 1.60
(ii) The choice of the financing plan will depend on the state of economic conditions. If the company’s sales are increasing, the EPS will be maximum under Plan II: Debt – Equity Mix. Under favourable economic conditions, debt financing gives more benefit due to tax shield availability than equity or preference financing.
(iii) EBIT – EPS Indifference Point : Plan I and Plan II
2
C
1
C
N)T1()Interest*EBIT(
N)T-(1(EBIT*) −×−
=×
250,56,1
)40.01()000,25,1*EBIT(500,12,3
)40.01(*EBIT −×−=
−

EBIT* = 000,25,1250,56,1500,12,3
500,12,3×
−
= Rs. 2,50,000
EBIT – EPS Indifference Point: Plan I and Plan III
( )2
c
1
c
NDiv. Pref.T1*EBIT
N)T1(*EBIT −−=−
EBIT* = C21
1
T-1Div. Pref.
NNN ×−
= 4.01
000,25,1250,56,1500,12,3
500,12,3−
×−
= Rs. 4,16,666.67
Question 14
A Company issues Rs. 10,00,000 12% debentures of Rs. 100 each. The debentures are redeemable after the expiry of fixed period of 7 years. The Company is in 35% tax bracket.
Required:
(i) Calculate the cost of debt after tax, if debentures are issued at
(a) Par
(b) 10% Discount
(c) 10% Premium.
(ii) If brokerage is paid at 2%, what will be the cost of debentures, if issue is at par?
(PE-II-May 2006)(6 marks)
Answer
+
−+−
=
2NP RV
NNP) (RV
)T (1 I K
c
d
Where,
I = Annual Interest Payment
NP = Net proceeds of debentures
RV = Redemption value of debentures
T c = Income tax rate
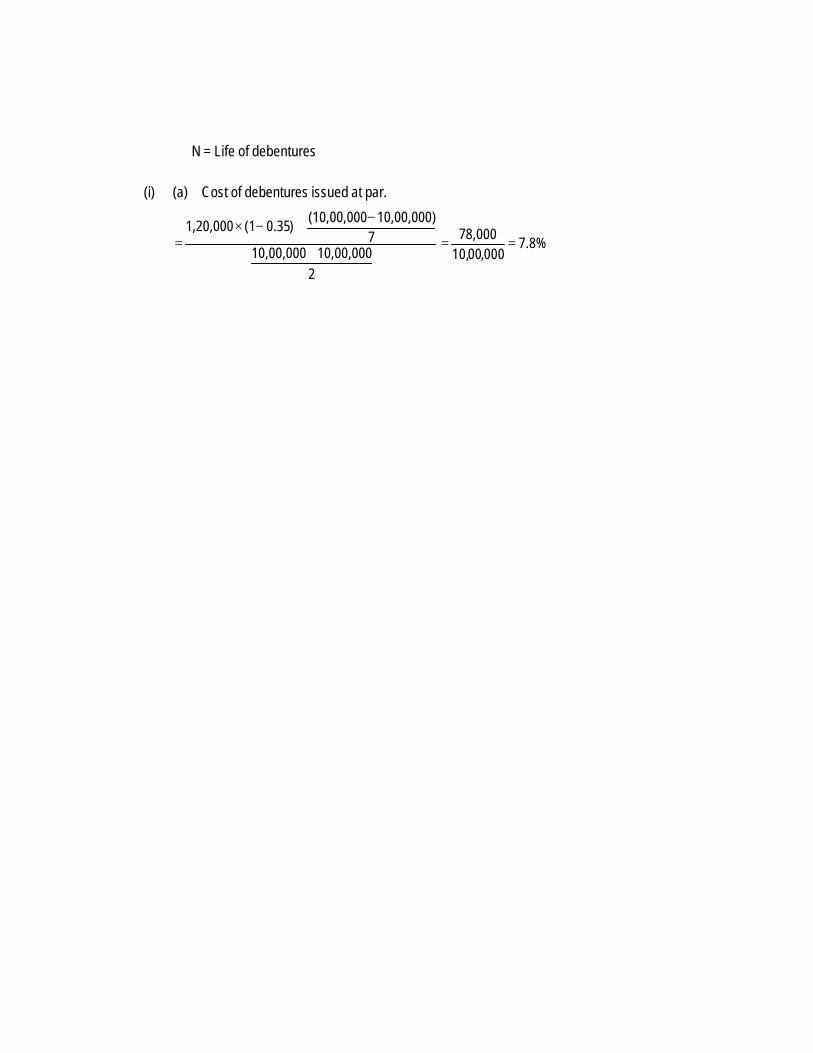
N = Life of debentures
(i) (a) Cost of debentures issued at par.
+
−+−×
=
210,00,000 10,00,000
710,00,000) (10,00,000
)0.35 (1 1,20,000 7.8%
000,00,10 78,000
==

(b) Cost of debentures issued at 10% discount
+
−+−×
=
29,00,000 10,00,000
79,00,000) (10,00,000
)0.35 (1 1,20,000
9.71% 000,50,914,286 78,000
=+
=
(c) Cost of debentures issued at 10% Premium
+
−+−×
=
211,00,000 10,00,000
711,00,000) (10,00,000
)0.35 (1 1,20,000 Kd
6.07% 000,50,1014,286 78,000
=−
=
(ii) Cost of debentures, if brokerage is paid at 2% and debentures are issued at par
+−
−+−×
=
210,00,000 20,000) (10,00,000
79,80,000) (10,00,000
)0.35 (1 1,20,000 Kd
8.17% 000,90,9
80,857 ==
Question 15
You are required to determine the weighted average cost of capital of a firm using (i) book-value weights and (ii) market value weights. The following information is available for your perusal: Present book value of the firm’s capital structure is:
Rs.
Debentures of Rs. 100 each 8,00,000
Preference shares of Rs. 100 each 2,00,000
Equity shares of Rs. 10 each 10,00,000
20,00,000
All these securities are traded in the capital markets. Recent prices are:

Debentures @ Rs. 110, Preference shares @ Rs. 120 and Equity shares @ Rs. 22.
Anticipated external financing opportunities are as follows:
(i) Rs. 100 per debenture redeemable at par : 20 years maturity 8% coupon rate, 4% floatation costs, sale price Rs. 100.
(ii) Rs. 100 preference share redeemable at par : 15 years maturity, 10% dividend rate, 5% floatation costs, sale price Rs. 100.
(iii) Equity shares : Rs. 2 per share floatation costs, sale price Rs. 22.
In addition, the dividend expected on the equity share at the end of the year is Rs. 2 per share; the anticipated growth rate in dividends is 5% and the firm has the practice of paying all its earnings in the form of dividend. The corporate tax rate is 50%.
(PE-II-May 2007) (9 marks)
Answer
(a) Working Notes:
Determination of Specific Costs:
(i) Cost of Debentures before tax (kd )
kd =
2NP) (PnNP) (P
I
+
−+
Where,
I = Annual interest payment
P = Redeemable/payable value of debenture at maturity
NP = Net sale value from issue of debenture/face value – expenses
kd =
296) (100
2096) (100
8
+
−+
= 8.36% or .0836 98
.208 =+
Cost of debenture after tax = Kd (1– t)
= 8.36 (1–.50) = 4.18%.

(ii) Cost of Preference Shares (kp )
kp =
2NP) (PnNP) (P
D
+
−+
Where,
D = Fixed annual dividend
P = Redeemable value of preference shares
n = Number of years to maturity.
Kp =
295) (100
1595) (100
10
+
−+ = 10.59% or .1059
97.510.33 =
(iii) Cost of Equity (ke )
ke = gNP
D +
Where,
D = Expected dividend per share
NP = Net proceeds per share
g = Growth expected in dividend
ke = 15%. or .15 .05 .10 .05202
.052 22
2 =+=+=+−
(i) Computation of Weighted Average Cost of Capital based on Book Value Weights
Source of Capital Book Value
Rs.
Weights to Total
Capital
Specific Cost
Total Cost
Debentures (Rs. 100 per debenture)
8,00,000 0.40 0.0418 0.0167
Preference Shares (Rs. 100 per share)
2,00,000 0.10 0.1059 0.0106
Equity Shares (Rs. 10 per share) 10,00,000 0.50 0.1500 0.0750
20,00,000 1.00 0.1023
Cost of Capital = 10.23%

(ii) Computation of Weighted Average Cost of Capital based on Market Value Weights
Source of Capital Market Value Rs.
Weights to Total Capital
Specific Cost
Total Cost
Debentures (Rs. 110 per debenture) 8,80,000 0.2651 0.0418 0.01108
Preference Shares (Rs. 120 per share)
2,40,000 0.0723 0.1059 0.00766
Equity Shares (Rs. 22 per share) 22,00,000 0.6626 0.1500 0.09939 33,20,000 1.00 0.11813
Cost of Capital = 11.81%
Question 16
A new project is under consideration in Zip Ltd., which requires a capital investment of Rs. 4.50 crore. Interest on term loan is 12% and Corporate Tax rate is 50%. If the Debt Equity ratio insisted by the financing agencies is 2 : 1, calculate the point of indifference for the project.
(PE-II-May 2008) (4 marks) Answer
If financing agencies insist 2 : 1 Debt equity ratio then company has two options: (i) To Arrange whole amount the company can issue equity shares.
(ii) Company should arrange 3 crores by 12% term loan and 1.50 crore through equity share so that 2:1 Debt-equity ratio can be maintained.
In first option interest will be Zero and in second option the interest will be Rs. 36,00,000 Point of Indifference ( )( )
1
1
NT1 Rx −− = ( )( )
2
2
NT1 Rx −−
or ( )( )Lakhs 450
0.51 0 x −− = ( )( )Lakhs 150
0.51 Lakhs 36x −−
or 150
180.5x4500.5x −=
or 75x = 225x – 8100
or 8100 = 225x – 75x

or 8100 = 150x
x = Lakhs 541508100 =
EBIT at point of Indifference will be Rs.54 Lakhs.
Note: The aforesaid solution is based on the assumption that the face value of a share is Re. 1. Hence, the number of shares in denominator being 450 lakhs and 150 lakhs respectively. However, if a student assumes face values being Rs. 10 per share and Rs. 100 per share, the conclusion will remain the same.
Alternative presentations are as follows:
(A) Point of Indifference at share value being Rs. 10.
( )( )1
1
NT1 Rx −− = ( )( )
2
2
NT1 Rx −−
or ( )( )Lakhs 45
0.51 0 x −− = ( )( )Lakhs 15
0.51 Lakhs 36x −−
or 15
180.5x45
0.5x −=
or 7.5 x = 22.5x – 810
or 810 = 22.5x – 7.5x
or 810 = 15x
x = Lakhs 5415810 =
EBIT at point of Indifference will be Rs.54 Lakhs.
(B) Point of Indifference at share value being Rs. 100.
( )( )1
1
NT1 Rx −− = ( )( )
2
2
NT1 Rx −−
or ( )( )Lakhs 4.50
0.51 0 x −− = ( )( )Lakhs 1.50
0.51 Lakhs 36x −−
or 1.50
180.5x4.500.5x −=
or 0.75x = 2.25x – 81
or 81 = 2.25x – 0.75x
or 81 = 1.5x
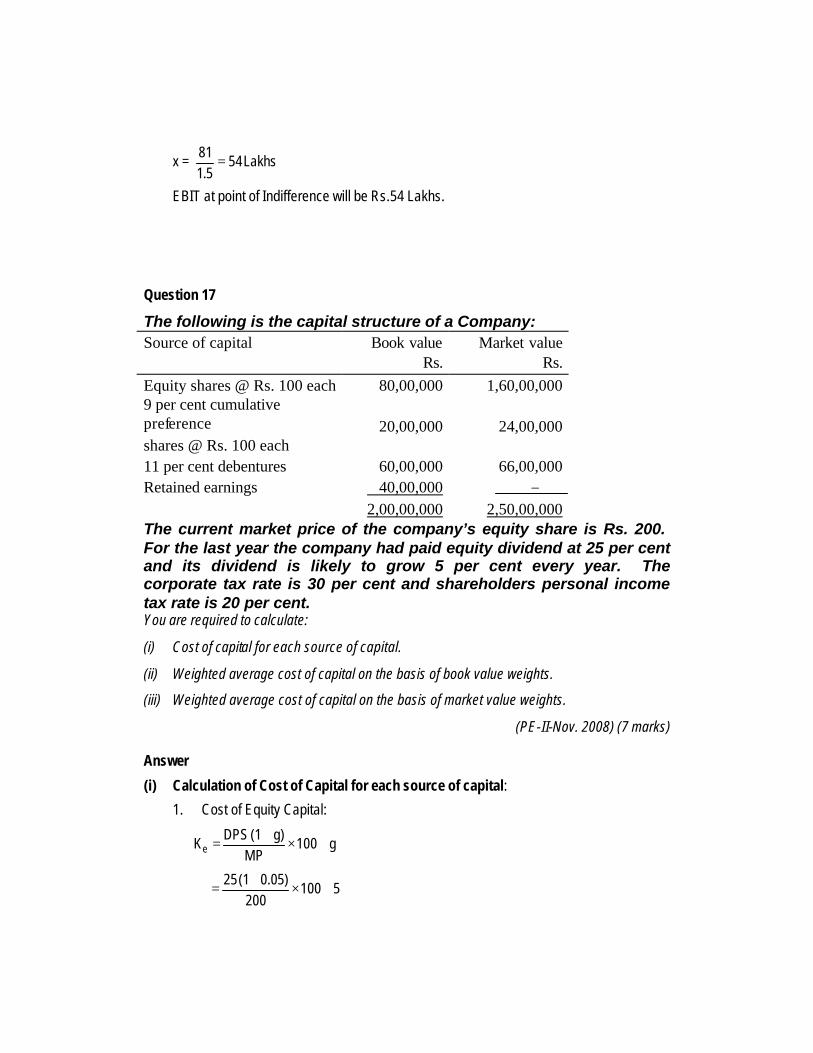
x = Lakhs 541.581 =
EBIT at point of Indifference will be Rs.54 Lakhs.
Question 17
The following is the capital structure of a Company: Source of capital Book value Market value Rs. Rs. Equity shares @ Rs. 100 each 80,00,000 1,60,00,000 9 per cent cumulative preference shares @ Rs. 100 each
20,00,000
24,00,000
11 per cent debentures 60,00,000 66,00,000 Retained earnings 40,00,000 − 2,00,00,000 2,50,00,000 The current market price of the company’s equity share is Rs. 200. For the last year the company had paid equity dividend at 25 per cent and its dividend is likely to grow 5 per cent every year. The corporate tax rate is 30 per cent and shareholders personal income tax rate is 20 per cent. You are required to calculate:
(i) Cost of capital for each source of capital.
(ii) Weighted average cost of capital on the basis of book value weights.
(iii) Weighted average cost of capital on the basis of market value weights.
(PE-II-Nov. 2008) (7 marks)
Answer
(i) Calculation of Cost of Capital for each source of capital:
1. Cost of Equity Capital:
g 100 MP
g) (1 DPS Ke +×+=
5 100 200
0.05) (1 25 +×+=

5 100 200
26.25 +×=
= 13.125 + 5
= 18.125%.
2. Cost of preference capital or Kp = 9%.
3. Cost of Debentures: Kd (after tax) = r (1 – T)
= 11 (1 – 0.3)
= 7.7%.
4. Cost of Retained Earnings: K r = Ke (1 – T p)
= 18.125 (1 – 0.2)
= 14.5%.
(ii) Weighted average cost of capital
(On the basis of Book Value Weights)
Source Amount (Book Value)
(Rs.)
Weights Cost of Capital (after tax)
(%)
WACC (%)
(1) (2) (3) (4) (5) = (3) × (4) Equity Capital 80,00,000 0.4 18.125 7.25 Preference Capital 20,00,000 0.1 9 0.90 Debentures 60,00,000 0.3 7.7 2.31 Retained earnings 40,00,000 0.2 14.5 2.90 2,00,00,000 1.00 13.36 Hence, WACC on the basis of Book Value Weights = 13.36%.
(iii) Weighted Average Cost of Capital
(On the basis of Market value weights) Source Amount
(Market Value) (Rs.)
Weights Cost of Capital (after tax)
(%)
WACC (%)
(1) (2) (3) (4) (5) = (3) × (4) Equity Capital 1,60,00,000 0.640 18.125 11.600 Preference Capital 24,00,000 0.096 9 0.864 Debentures 66,00,000 0.264 7.7 2.033 Retained earnings − − − − 2,50,00,000 1.000 14.497 Hence, WACC on the basis of Market Value Weights = 14.497%
Question 18
Discuss briefly the impact of taxation on Corporate Financing. (Final-Nov. 1996) (8 marks)
Answer
Impact of Taxation on Corporate Financing: Tax is levied on the profits of the company. Tax is also levied on the dividends received by the shareholders in their hands though such dividends are declared out of after tax profits. Thus the corporate entity and the owners suffer tax twice in a sense. This pushes the cost of equity capital. On the other hand interest paid on the debt capital is a deductible expenditure and hence company does not pay tax on interest on debt capital. This reduces the cost of debts. Debt is a less costly source of funds and if the finance manager prudently mixes debt and equity, the weighted average cost of capital will get greatly reduced.
Depreciation is not an outgo in cash but it is deductible in computing the income subject to tax. There will be saving in tax on depreciation and such savings could be profitably employed. Thus both interest and depreciation provide tax shield and have a tendency to increase EPS. Further the unabsorbed depreciation can be carried forward indefinitely and this will be helpful for loss making concerns which start earning profits in future. The depreciation loss of one company can be carried forward for set off in another company’s profits in the case of amalgamations in specified circumstances and such a provision will help growth of companies and rehabilitation of sick units. The finance manager of amalgamating company will bear this benefit for the tax shield it carries in planning the activities.
Thus the impact of tax will be felt in cost of capital, earnings per share and the cash inflows which are relevant for capital budgeting and in planning the capital structure.
Tax considerations are important as they affect the liquidity of the concerns. They are relevant in deciding the leasing of the assets, transactions of sale and lease back, and also in floating joint venture in foreign countries where tax rate and concessions may be advantageous. Tax implications will be felt in choosing the size and nature of industry and in its location as the tax laws give fillip to small units producing certain products and incentives are given for backward areas. Tax considerations in these matters are relevant for purposes of preserving and protecting internal funds.
Question 19
Explain, briefly, Modigliani and Miller approach on Cost of Capital
(Final May 1997)(PE-II-Nov. 2002 & May 2007) (10 marks)
Answer
Modigliani and Miller approach to Cost of Capital: Modigliani and Miller’s argue that the total cost of capital of a particular corporation is independent of its methods and level of financing. According to them a change in the debt equity ratio does not affect the cost of capital. This is because a change in the debt equity ratio changes the risk element of the company which in turn changes the expectations of the shareholders from the particular

shares of the company. Hence they contend that leverages has little effect on the overall cost of capital or on the market price.
Modigliani and Miller made the following assumptions and the derivations there from:
Assumptions:
(i) Capital markets are perfect. Information is costless and readily available to all investors, there are no transaction costs; and all securities are infinitely divisible. Investors are assumed to be rational and to behave accordingly.
(ii) The average expected future operating earnings of a firm are represented by a subjective random variable. It is assumed that the expected values of the probability distributions of all investors are the same. Implied in the MM illustration is that the expected values of the probability distributions of expected operating earnings for all future periods are the same as present operating earnings.
(iii) Firms can be categorised into “equivalent return” classes. All firms within a class have the same degree of business risk.
(iv) The absence of corporate income taxes is assumed.
Their three basic propositions are :
(i) The total market value of the firm and its cost of capital are independent of its capital structure. The total market value of a firm is given by capitalising the expected stream of operating earnings at a discount rate appropriate for its risk class.
(ii) The expected yield of a share of stock, Ke is equal to the capitalisation rate of a pure equity stream, plus a premium for financial risk equal to the difference between the pure equity capitalization rate and Kg times the ratio B/S. In other words, Ke increases in a manner to exactl y offset the use of cheaper debt funds.
(iii) The cut-off rate for investment purposes is completely independent of the way in which an investment is financed. This proposition alongwith the first implies a complete separation of the investment and financing decisions of the firm.
Conclusion: The theory propounded by them is based on the prevalence of perfect market conditions which are rare to find. Corporate taxes and personal taxes are a reality and they exert appreciable influence over decision making whether to have debt or equity.
Question 20
Discuss the relationship between the financial leverage and firms required rate of return to equity shareholders as per Modigliani and Miller Proposition II.
(PE-II-May 2003 & May 2004) (3 marks)
Answer
Relationship between the financial leverage and firm’s required rate of return to equity shareholders with corporate taxes is given by the following relation :
rE = r0 + )r(r )T(1ED
BOC −−
Where,
rE = required rate of return to equity shareholders
r0 = required rate of return for an all equity firm
D = Debt amount in capital structure
E = Equity amount in capital structure
T C = Corporate tax rate
r B = required rate of return to lenders
Question 21
Discuss the major considerations in capital structure planning.
(PE-II-Nov. 2003, May 2006 & Nov. 2007) (6 marks)
Answer
Major considerations in capital structure planning
There are three major considerations, i.e. risk, cost of capital and control, which help the finance manager in determining the proportion in which he can raise funds from various sources.
Although, three factors, i.e., risk, cost and control determine the capital structure of a particular business undertaking at a given point of time.
Risk: The finance manager attempts to design the capital structure in such a manner, so that risk and cost are the least and the control of the existing management is diluted to the least extent. However, there are also subsidiary factors also like − marketability of the issue, maneuverability and flexibility of the capital structure, timing of raising the funds. Risk is of two kinds, i.e., Financial risk and Business risk. Here we are concerned primarily with the financial risk. Financial risk also is of two types: • Risk of cash insolvency • Risk of variation in the expected earnings available to equity share-holders
Cost of Capital: Cost is an important consideration in capital structure decisions. It is obvious that a business should be at least capable of earning enough revenue to meet its cost of capital and finance its growth. Hence, along with a risk as a factor, the finance manager has to consider the cost aspect carefully while determining the capital structure.
Control: Along with cost and risk factors, the control aspect is also an important consideration in planning the capital structure. When a company issues further equity shares, it

automatically dilutes the controlling interest of the present owners. Similarly, preference shareholders can have voting rights and thereby affect the composition of the Board of Directors, in case dividends on such shares are not paid for two consecutive years. Financial institutions normally stipulate that they shall have one or more directors on the Boards. Hence, when the management agrees to raise loans from financial institutions, by implication it agrees to forego a part of its control over the company. It is obvious, therefore, that decisions concerning capital structure are taken after keeping the control factor in mind.
Question 22
Discuss the dividend-price approach, and earnings price approach to estimate cost of equity capital. (PE-II-Nov. 2006) (2 marks)
Answer
In dividend price approach, cost of equity capital is computed by dividing the current dividend by average market price per share. T his ratio expresses the cost of equity capital in relation to what yield the company should pay to attract investors. It is computed as:
o
1e P
DK =
Where,
D1 = Dividend per share in period 1
P0 = Market price per share today
Whereas, on the other hand, the advocates of earnings price approach co-relate the earnings of the company with the market price of its share. Accordingly, the cost of ordinary share capital would be based upon the expected rate of earnings of a company. This approach is similar to dividend price approach, only it seeks to nullify the effect of changes in dividend policy.
Question 23
Write a short note on Pecking order theory of capital structure. (Final- Nov. 2000) (5 marks)
Answer
Pecking order Theory of Capital Structure: The pecking order theory was proposed by Donaldson in 1961. The pecking order theory suggests that firm rely for finance, as much as they can, on internally generated funds. If internally generated funds are not enough then they will move to additional debt finance then equity. This is because the issue cost of internally generated funds have the lowest issue cost and cost of new equity is the highest. Myers has suggested that the firm follows a ‘modified pecking order’ in their approach to financing. Myers has suggested asymmetric information as a reason for heavy reliance on internal generated funds. He demonstrates that with asymmetric information, equity shares are interpreted by the market as bad news since managers are only motivated to issue equity share when share markets are undeveloped. Further, the use of internal finance ensures that there is regular

source of finance which might be in line with company’s expansion programme. If additional funds are required over and above internally generated funds, then borrowings will be next alternative in this theory.
Thus, pecking order theory rests on:
(i) Stickly dividend policy,
(ii) A preference for internal funds,
(ii) An aversion to issue equity shares.

7 SOURCES OF FINANCE
Question 1
Explain the importance of trade credit and accruals as source of working capital. What is the cost of these sources? (PE-II-May 2003) (2 marks)
Answer
Trade credit and accruals as source of working capital refers to credit facility given by suppliers of goods during the normal course of trade. It is a short term source of finance. SSI firms in particular are heavily dependent on this source for financing their working capital needs. The major advantages of trade credit are − easy availability, flexibility and informality.
There can be an argument that trade credit is a cost free source of finance. But it is not. It involves implicit cost . The supplier extending trade credit incurs cost in the form of opportunity cost of funds invested in trade receivables. Generally, the supplier passes on these costs to the buyer by increasing the price of the goods or alternatively by not extending cash discount facility.
Question 2
What is debt securitisation? Explain the basics of debt securitisation process.
(PE-II-May 2004, Nov. 2004, May 2006 & May 2007) (6 marks)
Answer
Debt Securitisation : It is a method of recycling of funds. It is especially beneficial to financial intermediaries to support the lending volumes. Assets generating steady cash flows are packaged together and against this asset pool, market securities can be issued, e.g. housing finance, auto loans, and credit card receivables.
Process of Debt Securitisation
(i) The origination function – A borrower seeks a loan from a finance company, bank, HDFC. The credit worthiness of borrower is evaluated and contract is entered into with repayment schedule structured over the life of the loan.
(ii) The pooling function – Similar loans on receivables are clubbed together to create an underlying pool of assets. The pool is transferred in favour of Special purpose Vehicle (SPV), which acts as a trustee for investors.
(iii) The securitisation function – SPV will structure and issue securities on the basis of asset pool. The securities carry a coupon and expected maturity which can be asset-

based/mortgage based. These are generally sold to investors through merchant bankers. Investors are – pension funds, mutual funds, insurance funds.
The process of securitization is generally without recourse i.e. investors bear the credit risk and issuer is under an obligation to pay to investors only if the cash flows are received by him from the collateral. The benefits to the originator are that assets are shifted off the balance sheet, thus giving the originator recourse to off-balance sheet funding.
Question 3
Discuss the risk-return considerations in financing of current assets.
(PE-II-Nov. 2004) (4 marks)
Answer
The financing of current assets involves a trade off between risk and return. A firm can choose from short or long term sources of finance. Short term financing is less expensive than long term financing but at the same time, short term financing involves greater risk than long term financing.
Depending on the mix of short term and long term financing, the approach followed by a company may be referred as matching approach, conservative approach and aggressive approach.
In matching approach, long-term finance is used to finance fixed assets and permanent current assets and short term financing to finance temporary or variable current assets. Under the conservative plan, the firm finances its permanent assets and also a part of temporary current assets with long term financing and hence less risk of facing the problem of shortage of funds.
An aggressive policy is said to be followed by the firm when it uses more short term financing than warranted by the matching plan and finances a part of its permanent current assets with short term financing.
Question 4
Discuss the eligibility criteria for issue of commercial paper. (PE-II-May 2005)(3 marks)
Answer
Eligibility criteria for issuer of commercial paper
The companies satisfying the following conditions are eligible to issue commercial paper.
♦ The tangible net worth of the company is Rs. 5 crores or more as per audited balance sheet of the company.
♦ The fund base working capital limit is not less than Rs. 5 crores.
♦ The company is required to obtain the necessary credit rating from the rating agencies such as CRISIL, ICRA etc.

♦ The issuers should ensure that the credit rating at the time of applying to RBI should not be more than two moths old.
♦ The minimum current ratio should be 1.33:1 based on classification of current assets and liabilities.
♦ For public sector companies there are no listing requirement but for companies other than public sector, the same should be listed on one or more stock exchanges.
♦ All issue expenses shall be borne by the company issuing commercial paper.
Question 5
Write short notes on the following:
(a) Global Depository Receipts or Euro Convertible Bonds.
(Final–May 1996, 1998)(PE-II-May 2003, May 2004 & May 2008) (3 marks))
(b) American Depository Receipts (ADRs)
(Final–Nov. 1996)(PE-II-May 2003, May 2004, May 2006 & May 2008) (6 marks)
(c) Bridge Finance (Final–Nov. 1997)(PE-II-May 2003, May 2006 & Nov. 2008) (6 marks)
(d) Packing Credit (Final–Nov. 1998) (6 marks))
(e) Methods of Venture Capital Financing (Final– May 1999)(PE-II-Nov. 2002) (6 marks) (f) Advantages of Debt Securitisation
(Final–May 2001)(PE-II-May 2003 ) (3 marks)
(g) Deep Discount Bonds vs. Zero Coupon Bonds (PE-II-May 2004) (3 marks)
(h) Venture capital financing (PE-II-May 2005) (2 marks)
(i) Seed capital assistance (PE-II-May 2005 & Nov. 2008) (3 marks)
(j) Global Depository Receipts vs. American Depository Receipts
(PE-II-May 2007) (4 marks)
Answer
(a) Global Depository Receipts (GDRs): It is a negotiable certificate denominated in US dollars which represents a Non-US company’s publically traded local currency equity shares. GDRs are created when the local currency shares of an Indian company are delivered to Depository’s local custodian Bank against which the Depository bank issues depository receipts in US dollars. The GDRs may be traded freely in the overseas market like any other dollar-expressed security either on a foreign stock exchange or in the over-the-counter market or among qualified institutional buyers.
By issue of GDRs Indian companies are able to tap global equity market to raise foreign currency funds by way of equity. It has distinct advantage over debt as there is no repayment of the principal and service costs are lower.

(or)
Euro Convertible Bond: Euro Convertible bonds are quasi-debt securities (unsecured) which can be converted into depository receipts or local shares. ECBs offer the investor an option to convert the bond into equity at a fixed price after the minimum lock in period. The price of equity shares at the time of conversion will have a premium element. The bonds carry a fixed rate of interest. These are bearer securities and generally the issue of such bonds may carry two options viz. call option and put option. A call option allows the company to force conversion if the market price of the shares exceed a particular percentage of the conversion price. A put option allows the investors to get his money back before maturity. In the case of ECBs, the payment of interest and the redemption of the bonds will be made by the issuer company in US dollars. ECBs issues are listed at London or Luxemberg stock exchanges.
An issuing company desirous of raising the ECBs is required to obtain prior permission of the Department of Economic Affairs, Ministry of Finance, Government of India, Companies having 3 years of good track record will only be permitted to raise funds. The condition is not applicable in the case of projects in infrastructure sector. The proceeds of ECBs would be permitted only for following purposes:
(i) Import of capital goods
(ii) Retiring foreign currency debts
(iii) Capitalising Indian joint venture abroad
(iv) 25% of total proceedings can be used for working capital and general corporate restructuring.
The impact of such issues has been to procure for the issuing companies finances at very competitive rates of interest. For the country a higher debt means a forex outgo in terms of interest.
(b) American Depository Receipts (ADRs): These are depository receipts issued by a company in USA and are governed by the provisions of Securities and Exchange Commission of USA. As the regulations are severe, Indian companies tap the American market through private debt placement of GDRs listed in London and Luxemberg stock exchanges.
Apart from legal impediments, ADRs are costlier than Global Depository Receipts (GDRs). Legal fees are considerably high for US listing. Registration fee in USA is also substantial. Hence ADRs are less popular than GDRs.
(c) Bridge Finance: Bridge finance refers, normally, to loans taken by the business, usually from commercial banks for a short period, pending disbursement of term loans by financial institutions, normally it takes time for the financial institution to finalise procedures of creation of security, tie-up participation with other institutions etc. even though a positive appraisal of the project has been made. However, once the loans are approved in principle, firms in order not to lose further time in starting their projects arrange for bridge finance. Such temporary loan is normally repaid out of the proceeds of

the principal term loans. It is secured by hypothecation of moveable assets, personal guarantees and demand promissory notes. Generally rate of interest on bridge finance is higher as compared with that on term loans.
(d) Packing Credit: Packing credit is an advance made available by banks to an exporter. Any exporter, having at hand a firm export order placed with him by his foreign buyer on an irrevocable letter of credit opened in his favour, can approach a bank for availing of packing credit. An advance so taken by an exporter is required to be liquidated within 180 days from the date of its commencement by negotiation of export bills or receipt of export proceeds in an approved manner. Thus Packing Credit is essentially a short-term advance.
Normally, banks insists upon their customers to lodge the irrevocable letters of credit opened in favour of the customer by the overseas buyers. The letter of credit and firms’ sale contracts not only serve as evidence of a definite arrangement for realisation of the export proceeds but also indicate the amount of finance required by the exporter. Packing Credit, in the case of customers of long standing may also be granted against firm contracts entered into by them with overseas buyers. Packing credit may be of the following types:
(i) Clean Packing credit: This is an advance made available to an exporter only on production of a firm export order or a letter of credit without exercising any charge or control over raw material or finished goods. It is a clean type of export advance. Each proposal is weighted according to particular requirements of the trade and credit worthiness of the exporter. A suitable margin has to be maintained. Also, Export Credit Guarantee Corporation (ECGC) cover should be obtained by the bank.
(ii) Packing credit against hypothecation of goods: Export finance is made available on certain terms and conditions where the exporter has pledgeable interest and the goods are hypothecated to the bank as security with stipulated margin. At the time of utilising the advance, the exporter is required to submit, alongwith the firm export order or letter of credit, relative stock statements and thereafter continue submitting them every fortnight and whenever there is any movement in stocks.
(iii) Packing credit against pledge of goods: Export finance is made available on certain terms and conditions where the exportable finished goods are pledged to the banks with approved clearing agents who will ship the same from time to time as required by the exporter. The possession of the goods so pledged lies with the bank and are kept under its lock and key.
(e) Methods of Venture Capital Financing: The venture capital financing refers to financing and funding of the small scale enterprises, high technology and risky ventures. Some common methods of venture capital financing are as follows:
(i) Equity financing: The venture capital undertakings generally requires funds for a longer period but may not be able to provide returns to the investors during the initial stages. Therefore, the venture capital finance is generally provided by way of

equity share capital. The equity contribution of venture capital firm does not exceed 49% of the total equity capital of venture capital undertakings so that the effective control and ownership remains with the entrepreneur.
(ii) Conditional Loan: A conditional loan is repayable in the form of a royalty after the venture is able to generate sales. No interest is paid on such loans. In India Venture Capital Financers charge royalty ranging between 2 to 15 per cent; actual rate depends on other factors of the venture such as gestation period, cash flow patterns, riskiness and other factors of the enterprise. Some Venture Capital financers give a choice to the enterprise of paying a high rate of interest (which could be well above 20 per cent) instead of royalty on sales once it becomes commercially sound.
(iii) Income Note: It is a hybrid security which combines the features of both conventional loan and conditional loan. The entrepreneur has to pay both interest and royalty on sales but at substantially low rates. IDBI’s Venture Capital Fund provides funding equal to 80-87.5% of the project’s cost for commercial application of indigenous technology or adopting imported technology to domestic applications.
(iv) Participating Debenture: Such security carries charges in three phases- in the start- up phase, no interest is charged, next stage a low rate of interest is charged upto a particular level of operations, after that, a high rate of interest is required to be paid.
(f) Advantages of Debt Securitisation: Debt securitisation is a method of recycling of funds and is especially beneficial to financial intermediaries to support lending volumes. Simply stated, under debt securitisation a group of illiquid assets say a mortgage or any asset that yields stable and regular cash flows like bank loans, consumer finance, credit card payment are pooled together and sold to intermediary. The intermediary then issue debt securities.
The advantages of debt securitisation to the originator are the following:
(i) The asset are shifted off the Balance Sheet, thus giving the originator recourse to off balance sheet funding.
(ii) It converts illiquid assets to liquid portfolio.
(iii) It facilitates better balance sheet management, assets are transferred off balance sheet facilitating satisfaction of capital adequacy norms.
(iv) The originator’s credit rating enhances.
For the investors securitisation opens up new investment avenues. Though the investor bears the credit risk, the securities are tied up to definite assets.
(g) Deep Discount Bonds vs. Zero Coupon Bonds: Deep Discount Bonds (DDBs) are in the form of zero interest bonds. These bonds are sold at a discounted value and on maturity face value is paid to the investors. In such bonds, there is no interest payout during lock-in period.

IDBI was first to issue a Deep Discount Bonds (DDBs) in India in January 1992. The bond of a face value of Rs.1 lakh was sold for Rs. 2,700 with a maturity period of 25 years.
A zero coupon bond (ZCB) does not carry any interest but it is sold by the issuing company at a discount. The difference between discounted value and maturing or face value represent the interest to be earned by the investor on such bonds.
(h) Venture Capital Financing: The term venture capital refers to capital investment made in a business or industrial enterprise, which carries elements of risks and insecurity and the probability of business hazards. Capital investment may assume the form of either equity or debt or both as a derivative instrument. The risk associated with the enterprise could be so high as to entail total loss or be so insignificant as to lead to high gains.
The European Venture Capital Association describes venture capital as risk finance for entrepreneurial growth oriented companies. It is an investment for the medium or long term seeking to maximise the return.
Venture Capital, thus, implies an investment in the form of equity for high-risk projects with the expectation of higher profits. The investments are made through private placement with the expectation of risk of total loss or huge returns. High technology industry is more attractive to venture capital financing due to the high profit potential. The main object of investing equity is to get high capital profit at saturation stage.
In broad sense under venture capital financing venture capitalist makes investment to purchase debt or equity from inexperienced entrepreneurs who undertake highly risky ventures with potential of success.
(i) Seed Capital Assistance: The seed capital assistance has been designed by IDBI for professionally or technically qualified entrepreneurs. All the projects eligible for financial assistance from IDBI, directly or indirectly through refinance are eligible under the scheme. The project cost should not exceed Rs. 2 crores and the maximum assistance under the project will be restricted to 50% of the required promoters contribution or Rs 15 lacs whichever is lower.
The seed capital Assistance is interest free but carries a security charge of one percent per annum for the first five years and an increasing rate thereafter.
(j) Global Depository Receipts and American Depository Receipts: Global Depository Receipts (GDR) are basically negotiable certificates denominated in US dollars, that represent a non-US company’s publicly traded local currency equity shares. These are created when the local currency shares of Indian company are delivered to the depository’s local custodian bank, against which the depository bank issues Depository Receipts in US dollars.
Whereas, American Depository Receipts (ADR) are securities offered by non-US companies who want to list on any of the US exchange. Each ADR represents a certain number of a company's regular shares. ADRs allow US investors to buy shares of these companies without the costs of investing directly in a foreign stock exchange. ADRs are

issued by an approved New York bank or trust company against the deposit of the original shares. These are deposited in a custodial account in the US. Such receipts have to be issued in accordance with the provisions stipulated by the SEC USA which are very stringent.
The Indian companies have preferred the GDRs to ADRs because the US market exposes them to a higher level or responsibility than a European listing in the areas of disclosure, costs, liabilities and timing.