Foreword · State of Food and Agriculture in Syria 2010 I Foreword The Agricultural and Food...
427
Transcript of Foreword · State of Food and Agriculture in Syria 2010 I Foreword The Agricultural and Food...


State of Food and Agriculture in Syria 2010
I
Foreword
The Agricultural and Food Policies Division (AFPD) of the National Agricultural Policy
Center (NAPC), which belongs to the Ministry of Agriculture and Agrarian Reform
(MAAR), is pleased to publish the fourth issue of its periodical report, the “State of Food
and Agriculture in Syria (SOFAS) 2010”. This report gives an idea about the current
situation and main issues characterizing the agricultural development in Syria. Therefore, it
is considered as one of the main outputs of the NAPC.
Consequently, in recognition of the significant role of the agricultural sector in Syria, the
NAPC issues periodically the SOFAS to provide policy makers, researchers and
stakeholders with an updated review of agricultural issues and related information and to
contribute to the implementation of the “Social Market Economy (SME)”. This edition of
the SOFAS focuses on the analysis of the data related to agriculture, agro-industries and
food security over the 1999-2009 period. In addition, it includes some important statistics
and policy issues related to 2010. Hence, it was called SOFAS 2010.
The SOFAS 2010 was accomplished by the staff of the AFPD: Mr Samir Jrad, chief, Ms
Basima Atieh, deputy chief, Mr Mouzad Karkout, Mr Fayez Mansour, Mr Nouman Al-
Amouri, Mr Mohanad Rezmi, Mrs Najla Wardi, and Mrs Basima Al-Halabi. In addition,
Mr Bashar Nahas of the Information and Communication Division (ICD) of the NAPC and
Ms Hajar Baghasa of the Tade Policy Division (TPD) of the NAPC contributed to the
accomplishment of Chapter 6 (food security). Mr Mahmoud Babili of the TPD of the
NAPC and Ms Hajar Baghsa offered additionally international trade data. The contribution
of the TPD, which provided trade data, and the ICD, which supplied data and was involved
in the finalization of the present publication, has also to be acknowledged. Moreover, the
report was reviewed by Mr Samir Jrad and Mr Haitham Al-Ashkar, Deputy Director of the
NAPC for studies, to produce a sound report. Additionally, coordination, orientation and
general supervision of the various phases of this activity were performed by Mr Atieh El-
Hindi, Director of the NAPC, to add important comments and to accomplish a coherent
publication.
The NAPC also wishes to express a deep gratitude to the departments and staff of the
MAAR, the Ministry of Economy and Trade (MET), the Central Bureau of Statistics

State of Food and Agriculture in Syria 2010
II
(CBS) and all the other institutions, which made this periodical possible by facilitating
access to data and information. Besides, the NAPC is especially thankful for the
contribution of the “Arab Fund for Economic and Social Development (AFESD)”, which
enriched this bulletin by its financial assistance to the NAPC, which was used to conduct
some studies.
A special gratefulness is directed as well to Mr. Dr. Adel Safar, the Minister of the MAAR,
for both his due attention and his instructions to put the NAPC activities into practice, and
to Mr. Dr. Nabi Rasheed Mohamed, Deputy Minister of the MAAR, for his facilities to
enable performing the tasks of the NAPC.
Finally, the NAPC will be grateful when comments, opinions and suggestions are
submitted to www.napcsyr.org ([email protected]) to improve this circular.

State of Food and Agriculture in Syria 2010
Table of Contents
Foreword ............................................................................................................................. I Abbreviations and Acronyms (A&A) ........................................................................... VII Brief Summary and Report Organization .................................................................... XI Chapter 1 – Country Development Opportunities for Agriculture and Agro-Industries ............................................................................................................................ 1
1.1. Geography and location ............................................................................................ 1 1.2. Climatic conditions.................................................................................................... 2 1.3. Natural resources ...................................................................................................... 4
1.3.1. Land...................................................................................................................... 4 1.3.2. Water .................................................................................................................... 7 1.3.3. Steppes and pastures ............................................................................................ 9 1.3.4. Forestry .............................................................................................................. 10 1.3.5. Fishery................................................................................................................ 11 1.3.6. Quarrying industries .......................................................................................... 13
1.4. Human resources ..................................................................................................... 13 1.5. Agricultural intermediate consumption ................................................................ 15 1.6. Agricultural supporting services ........................................................................... 18
1.6.1. Agricultural credits ............................................................................................ 18 1.6.2. Agricultural scientific research .......................................................................... 20 1.6.3. Agricultural extension, training and education ................................................. 21 1.6.4. Veterinary and livestock services ....................................................................... 22 1.6.5. Other services..................................................................................................... 23
1.7. Country opportunities in the next period ............................................................. 23 Chapter 2 – Agriculture in the national economy ......................................................... 25
2.1. Contribution of agriculture to the gross output ................................................... 25 2.2. Contribution of agriculture to production inputs ................................................ 26 2.3. Contribution of agriculture to the gross domestic product ................................. 28 2.4. Contribution of agriculture to employment and income ..................................... 30 2.5. Contribution of agriculture to trade ..................................................................... 31 2.6. Contribution of agriculture to investment ............................................................ 32 2.7. Backward and forward linkages of agriculture ................................................... 34 2.8. Factors constraining the performance of the agricultural sector ....................... 36 2.9. Agricultural sector in the next period ................................................................... 37
Chapter 3 – Agricultural and food strategies and policies ........................................... 39 3.1. Strategies .................................................................................................................. 39
3.1.1. SAS and the 10th FYP ......................................................................................... 40 3.1.2. STI and the 10th FYP .......................................................................................... 42 3.1.3. Nutrition strategy (NS) ....................................................................................... 43 3.1.4. Investment strategy............................................................................................. 44 3.1.5. Social Market Economy (SME) .......................................................................... 44
3.2. General objectives of agricultural policies ............................................................ 45 3.3. Macro and agricultural policies ............................................................................. 47
3.3.1. Monetary and fiscal policies .............................................................................. 47 3.3.2. Trade policy ....................................................................................................... 52

State of Food and Agriculture in Syria 2010
3.3.3. Investment policy ............................................................................................... 54 3.4. Other agricultural policies ..................................................................................... 59
3.4.1. Planning and production policies ...................................................................... 59 3.4.2. Pricing and marketing policies .......................................................................... 63 3.4.3. Policies related to supporting services .............................................................. 65 3.4.4. Policies related to agricultural production inputs ......................................... 66 3.4.5. Policies related to agricultural resources ......................................................... 68
3.4.5.1. Land resources ............................................................................................ 68 3.4.5.2. Water resources .......................................................................................... 70 3.4.5.3. Natural pastures and Al-Badia (Syrian Steppe) ......................................... 72 3.4.5.4. Forestry ....................................................................................................... 73 3.4.5.5 Fishery ......................................................................................................... 74 3.4.5.6. Human resources ........................................................................................ 74
3.5. Agro-industrial policies .......................................................................................... 75 3.6. Policies related to food security ............................................................................. 77 3.7. Support policies ....................................................................................................... 80 3.8. Policies related to food quality and safety ............................................................ 81 3.9. Agricultural and food policies in the next period ................................................ 82
Chapter 4 – Agricultural production ............................................................................. 85 4.1. Crop production ...................................................................................................... 85
4.1.1. Development of some economic aggregates related to crop production ........... 87 4.1.2. Cereals ............................................................................................................... 91 4.1.3. Dry legumes ....................................................................................................... 94 4.1.4. Grazing crops (green fodder) ............................................................................ 97 4.1.5. Industrial crops .................................................................................................. 98 4.1.6. Vegetables ........................................................................................................ 101 4.1.7. Fruit trees......................................................................................................... 103
4.2. Livestock production ............................................................................................ 107 4.2.1. Development of the number of livestock .......................................................... 107 4.2.2. Development of the livestock productivity ....................................................... 108 4.2.3. Development of the production of livestock products ...................................... 109 4.2.4. Value of the livestock production ..................................................................... 110
4.3. Costs of the agricultural produce ........................................................................ 112 4.4. Prices of the agricultural produce ....................................................................... 116 4.5. Agricultural trade and markets ........................................................................... 118 4.6. Factors constraining crop production ................................................................. 123 4.7. Factors constraining livestock production.......................................................... 124 4.8. Agricultural production in the next period ........................................................ 125
Chapter 5 – Agro-industries ......................................................................................... 127 5.1. Contribution of agro-industries to the gross output .......................................... 128 5.2. Contribution of agro-industries to the net domestic product ........................... 132 5.3. Contribution of agro-industries to investment and employment ..................... 134 5.4. Contribution of agro-industries to trade ............................................................ 137 5.5. Prices of agro-industrial products ....................................................................... 138 5.6. Enabling environments for competitive agro-industries ................................... 138 5.7. The need for adopting inclusive business models for small holders ................. 141
5.7.1. Background ...................................................................................................... 141 5.7.2. Important definitions ........................................................................................ 142 5.7.3. A business model defined ................................................................................. 142 5.7.4. Types of business models ................................................................................. 143

State of Food and Agriculture in Syria 2010
5.7.5. Adjusting business models in favor of small holders ....................................... 146 5.7.6. Considerations to work successfully with small holders ................................. 146
5.8. Agro-industries in the next period ....................................................................... 147 Chapter 6 – Food security ............................................................................................. 149
6.1. Food security definition and measurement......................................................... 149 6.2. Food availability .................................................................................................... 150
6.2.1. Aggregate food availabilities ........................................................................... 150 6.2.2. Aggregate per capita food availabilities .......................................................... 153
6.3. Access to food ......................................................................................................... 154 6.4. Stability of food supplies and access .................................................................... 158 6.5. Aggregate per capita daily food utilization ......................................................... 159
6.5.1. Background ...................................................................................................... 159 6.5.2. Methodological guidelines ............................................................................... 159 6.5.3. Expenditure on food ......................................................................................... 160 6.5.4. Calorie intakes ................................................................................................. 160 6.5.5. Protein intakes ................................................................................................. 162 6.5.6. Fat intakes ........................................................................................................ 163 6.5.7. Carbohydrate intakes ....................................................................................... 164 6.5.8. Vitamin C intakes ............................................................................................. 165 6.5.9. Vitamin A intakes ............................................................................................. 167 6.5.10. Vitamin B1 intakes ......................................................................................... 168 6.5.11. Vitamin B2 intakes ......................................................................................... 169 6.5.12. Vitamin B6 intakes ......................................................................................... 170 6.5.13. Vitamin B12 intakes ....................................................................................... 171 6.5.14. Iron intakes ..................................................................................................... 173 6.5.15. Iodine intakes ................................................................................................. 174 6.5.16. Calcium intakes .............................................................................................. 175
6.6. Food safety and quality ......................................................................................... 176 6.7. Undernourishment and malnutrition in the total population ........................... 177
Special Issue: National Programme for Food Security .............................................. 181 II.1. General overview.................................................................................................. 181 II.2. Background and justification .............................................................................. 182 II.3. The need for a coherent, cost and time bounded NPFS ................................... 185 II.4. NPFS linked to other national and international food security related initiatives ....................................................................................................................... 186 II.5. Objectives and framework of the NPFS ............................................................ 187 II.6. Prioritization criterions, beneficiaries and cost ................................................ 188
Annexes ........................................................................................................................... 190 References and data sources ......................................................................................... 406

State of Food and Agriculture in Syria 2010
VII
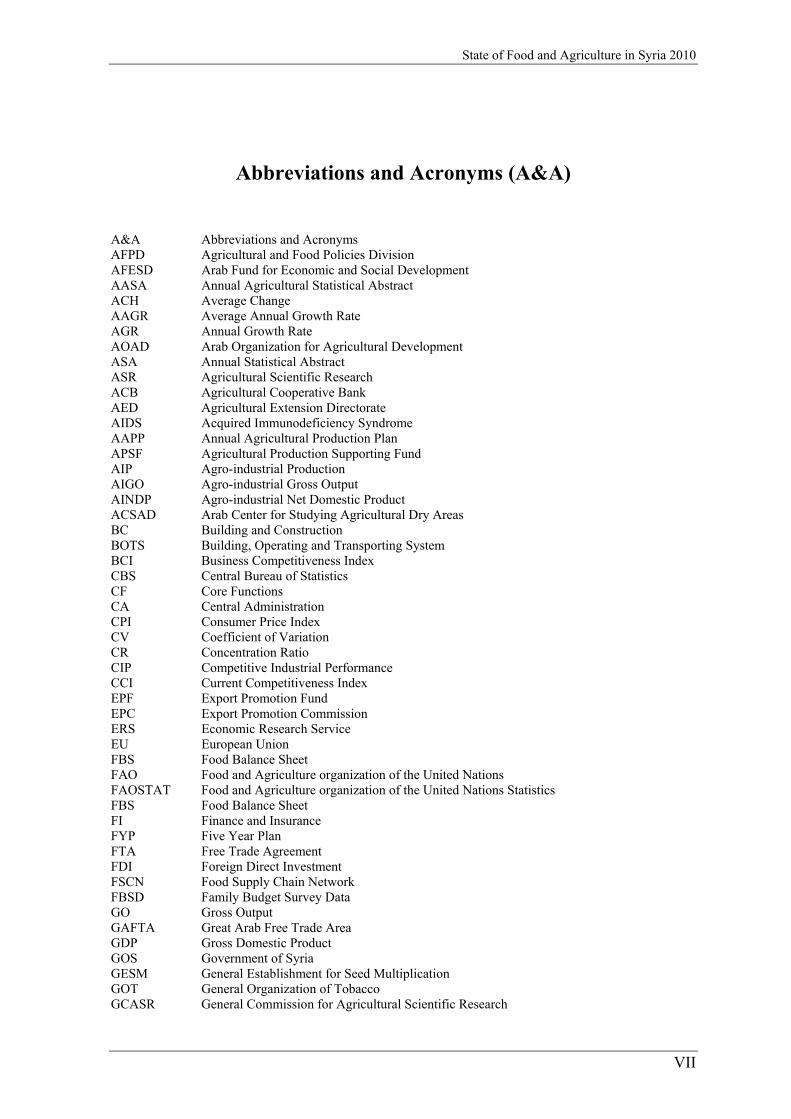
Abbreviations and Acronyms (A&A)
A&A Abbreviations and Acronyms AFPD Agricultural and Food Policies Division AFESD Arab Fund for Economic and Social Development AASA Annual Agricultural Statistical Abstract ACH Average Change AAGR Average Annual Growth Rate AGR Annual Growth Rate AOAD Arab Organization for Agricultural Development ASA Annual Statistical Abstract ASR Agricultural Scientific Research ACB Agricultural Cooperative Bank AED Agricultural Extension Directorate AIDS Acquired Immunodeficiency Syndrome AAPP Annual Agricultural Production Plan APSF Agricultural Production Supporting Fund AIP Agro-industrial Production AIGO Agro-industrial Gross Output AINDP Agro-industrial Net Domestic Product ACSAD Arab Center for Studying Agricultural Dry Areas BC Building and Construction BOTS Building, Operating and Transporting System BCI Business Competitiveness Index CBS Central Bureau of Statistics CF Core Functions CA Central Administration CPI Consumer Price Index CV Coefficient of Variation CR Concentration Ratio CIP Competitive Industrial Performance CCI Current Competitiveness Index EPF Export Promotion Fund EPC Export Promotion Commission ERS Economic Research Service EU European Union FBS Food Balance Sheet FAO Food and Agriculture organization of the United Nations FAOSTAT Food and Agriculture organization of the United Nations Statistics FBS Food Balance Sheet FI Finance and Insurance FYP Five Year Plan FTA Free Trade Agreement FDI Foreign Direct Investment FSCN Food Supply Chain Network FBSD Family Budget Survey Data GO Gross Output GAFTA Great Arab Free Trade Area GDP Gross Domestic Product GOS Government of Syria GESM General Establishment for Seed Multiplication GOT General Organization of Tobacco GCASR General Commission for Agricultural Scientific Research

State of Food and Agriculture in Syria 2010
VIII
GEF General Establishment for Fodder GECTP General Establishment for Cereal Trade and Processing GCG General Commission for Al-Ghab Development GCGMD General Commission for Al-Ghab Management and Development GPU General Peasant Union GIS Geographical Information System GECG General Establishment for Consumption Goods GERT General Establishment for Retail Trade GEM General Establishment for Military GAP Good Agricultural Practices GOFI General Organization for Food Industries GOSI General Organization for Sugar Industries GOTI General Organization for Textile Industries GOCGW General Organization for Cotton Ginning and Weaving GCMDB General Commission for the Management and Development of Al-Badia GCDFR General Commission for the Development of Fishery Resources GOEI General Organization for Engineering Industries GOCI General Organization for Chemical Industries GCI Global Competitiveness Index g gram HACCP Hazard Analysis Critical Control Points HIV Human Immunodeficiency Virus ha hectare ICD Information and Communication Division IPM Integrated Pest Control Management IC Investment Commission IPR Intellectual Property Rights IDR Import Dependency Ratio IFAD International Fund for Agricultural Development ICE Italian Trade Commission I.E International Equivalent JAESA Joint Arab Economic and Social Act kg kilogram kcal kilocalorie km kilometer mkwh Million kilo watt hour MAAR Ministry of Agriculture and Agrarian Reform MET Ministry of Economy and Trade MI Ministry of Irrigation MOI Ministry of Industry Max Maximum MDGs Millennium Development Goals Min Minimum MICS Multiple Indicator Cluster Survey MM Mining and Manufacturing MOH Ministry of Health ME Monitoring and Evaluation mg milligram microg microgram NAPC National Agricultural Policy Center NPFS National Programme for Food Security NS Nutrition Strategy NP Number of Trading Partners NDP Net Domestic Product NDPTI Net Domestic Product of the Transformation Industries NGO Non-government Organization OR Organizational Results PE Production Establishments PAM Policy Analysis Matrix R and D Research and Development

State of Food and Agriculture in Syria 2010
IX
RCA Revealed Comparative Advantage RCAI Revealed Comparative Advantage Indicator REE Real Estate Establishment RUV Relative Unit Value RPGDP Real per Capita Gross Domestic Product RRA Rapid Rural Appraisal RE Retinol Equivalent SAR Syrian Arab Republic SOFAS State of Food and Agriculture in Syria SME Social Market Economy SG Syrian Government SPC State Planning Commission SADS Syrian Agricultural Development Strategy SAS Syrian Agricultural Strategy SP Syrian Pound STI Strategy of the Transformation Industries SSME Strategy of the Social Market Economy SO Strategic Objectives SCE Supreme Council for Export SIO Speed Intervention Office SIPA Syrian Intellectual Property Rights Association SCM Supply Chain Management SSR Self-Sufficiency Ratio STDEV Standard Deviation SOFI State of Food Insecurity SAM Social Accounting Matrix SEBC Syrian European Business Center SMSE Small-Medium Sized Enterprises TPD Trade Policy Division TCS Transport, Communication and Storage USD or US$ United States Dollar UNDAF United Nations Development Assistance Framework UNDP United Nations Development Programme UNFPA United Nations Food Programme Assistance UAE United Arab Emirate USA United States of America USDA United States Department of Agriculture UNICEF United Nations Children’ Fund UNIDO United Nations Industrial Development Organization VAT Value Added Tax VOCP Value of Crop Production VOAP Value of Agricultural Production WFS World Food Summit WIPO World Intellectual Property Rights Organization WTO World Trade Organization WHO World Health Organization WB World Bank WFP World Food Programme


State of Food and Agriculture in Syria 2010
XI
Brief Summary and Report Organization
Syria is still undergoing the reform process to modernize and develop its economy
focusing on its structural adjustment and its integration with the world economy. This will
strengthen the overall economic and social development in Syria, accelerate growth and
boost the performance of the economy complying with the needs of the economic and
social situation of the country.
The aforementioned focus also applies to the agricultural development in Syria because it
is considered as a major pillar of the sustainable development. It focuses on both the
development of human and the accomplishment of an agricultural progress that aligns with
the relatively high population growth and the increasing demand. This is possible because
Syria is characterized by a vagary of agro-climates that enables the country to produce all
agricultural products spreading out in the Mediterranean and to diversify both crops and
livestock in line with the demand for domestic consumption, processing and export. In
addition, it enhances employment and income generation and contributes soundly to food
security, trade and support of the other sectors of the economy. The aforementioned central
roles of Agriculture can be explained by its sound contribution to some economic
aggregates over the 1999-2009 period. Over this era, its share amounted to 17-23% of the
total gross output (GO) at current prices, 17-22% of the total GO at constant prices1, 19-
25% of the gross domestic product (GDP) at current prices, 18-26% of the GDP at constant
prices, 17-29% of the labour force, 9.1-20.5% of total trade, 6.6-20.3% of total exports,
11.3-20.6% of total imports, 7.8-16.2% of total investment at current prices and 8.2-16.4%
of total investment at constant prices. This indicates that the agricultural sector didn’t
receive the investment it deserves in line with its contribution to the gross domestic
product. This epoch was also characterized by the following:
The private agricultural investment was the major driving force of agricultural
activities; its donation accounted for 98.5% of total agricultural production,
1 Constant prices of 2000.
State of Food and Agriculture in Syria 2010
XII
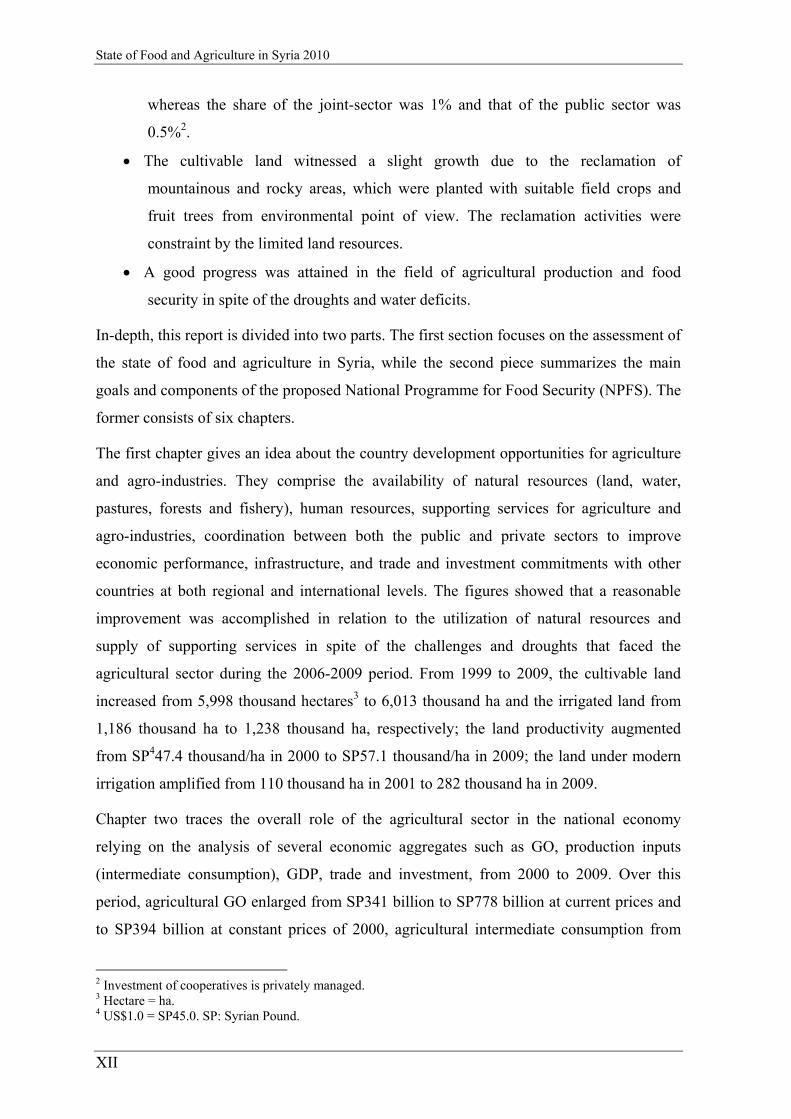
whereas the share of the joint-sector was 1% and that of the public sector was
0.5%2.
The cultivable land witnessed a slight growth due to the reclamation of
mountainous and rocky areas, which were planted with suitable field crops and
fruit trees from environmental point of view. The reclamation activities were
constraint by the limited land resources.
A good progress was attained in the field of agricultural production and food
security in spite of the droughts and water deficits.
In-depth, this report is divided into two parts. The first section focuses on the assessment of
the state of food and agriculture in Syria, while the second piece summarizes the main
goals and components of the proposed National Programme for Food Security (NPFS). The
former consists of six chapters.
The first chapter gives an idea about the country development opportunities for agriculture
and agro-industries. They comprise the availability of natural resources (land, water,
pastures, forests and fishery), human resources, supporting services for agriculture and
agro-industries, coordination between both the public and private sectors to improve
economic performance, infrastructure, and trade and investment commitments with other
countries at both regional and international levels. The figures showed that a reasonable
improvement was accomplished in relation to the utilization of natural resources and
supply of supporting services in spite of the challenges and droughts that faced the
agricultural sector during the 2006-2009 period. From 1999 to 2009, the cultivable land
increased from 5,998 thousand hectares3 to 6,013 thousand ha and the irrigated land from
1,186 thousand ha to 1,238 thousand ha, respectively; the land productivity augmented
from SP447.4 thousand/ha in 2000 to SP57.1 thousand/ha in 2009; the land under modern
irrigation amplified from 110 thousand ha in 2001 to 282 thousand ha in 2009.
Chapter two traces the overall role of the agricultural sector in the national economy
relying on the analysis of several economic aggregates such as GO, production inputs
(intermediate consumption), GDP, trade and investment, from 2000 to 2009. Over this
period, agricultural GO enlarged from SP341 billion to SP778 billion at current prices and
to SP394 billion at constant prices of 2000, agricultural intermediate consumption from
2 Investment of cooperatives is privately managed. 3 Hectare = ha. 4 US$1.0 = SP45.0. SP: Syrian Pound.

State of Food and Agriculture in Syria 2010
XIII
SP117 billion to SP212 billion at current prices and to SP129 billion at constant prices of
2000, agricultural GDP from SP224 billion to SP566 billion at current prices and to SP265
billion at constant prices of 2000, and agricultural investment5 from SP24.4 billion to
SP39.5 billion at current prices and to SP26.9 billion at constant prices of 2000,
respectively; from 2002 to 2009, total agricultural trade augmented from US$2,368 million
to US$2,885 million, total agricultural imports from US$1,034 million to US$1,423
million, and total agricultural exports from US$1,333 million to US$1,462 million,
respectively. As a consequence, from 2000 to 2009, the indicator of economic efficiency of
agriculture6 improved from 0.85 to 1.17 at current prices and to 0.97 at constant prices of
2000 and that of return to agricultural investment7 from 916% to 1,435% at current prices
and to 985% at constant prices of 2000, respectively.
Strengthening the role of agriculture in the national economy and enhancing agricultural
production, agro-industries and food security rely heavily on the strategies and policies
governing these areas. Therefore, chapter three addresses the latter at both macro and
micro levels and those underlying regulations.
Chapter four presents in-depth analysis of the development of agricultural production from
1999 to 2009 using various measures. These indicators include the cropped area, level of
production, yield, value of agricultural production, prices of agricultural products, costs of
agricultural products and agricultural trade. From 1999 to 2009, the cropped area decreased
from 4,633 thousand ha to 4,499 thousand ha, the irrigated cropped area increased from
1,283 thousand ha to 1,391 thousand ha and the rain-fed cropped area declined from 3,350
thousand ha to 3,108 thousand ha, respectively. At the same time, agricultural production
enhanced during the same period. From 1999 to 2009, crop production (plant production)8
augmented from 10,673 thousand tonnes to 13,965 thousand tonnes indicating an increase
in the average yield, meat production from 348 thousand tonnes to 459 thousand tonnes,
and milk production from 1,656 thousand tonnes to 2,409 thousand tonnes, respectively;
from 2000 to 2009, agricultural GO enlarged from SP337 billion to SP778 billion at
current prices and to SP394 billion at constant prices of 2000, the value of crop production
from SP215 billion to SP483 billion at current prices and to SP248 billion at constant
prices of 2000, and the value of livestock production (animal production) from SP122 5 Includes both investment related to the MAAR and that related to the Ministry of Irrigation (MI). 6 Indicator of economic efficiency of agriculture = share of agriculture in GDP /share of agriculture in work force. 7 Indicator of return to agricultural investment = agricultural GDP/agricultural investment * 100. 8 Crop production comprises field crops, vegetables and fruits.

State of Food and Agriculture in Syria 2010
XIV
billion to SP296 billion at current prices and to SP146 billion at constant prices of 2000,
respectively.
Chapter five reports the development of agro-industries from 1999 to 2009 relying on some
selected economic aggregates at current prices such as GO, net GDP, investment,
employment, trade and prices of processed products. From 2001 to 2009, the agro-
industrial GO increased from SP179 billion to SP280 billion and the agro-industrial net
GDP from SP45 billion to SP94 billion, respectively.
Chapter six focuses on the assessment of achieving the four food security dimensions
agreed upon internationally compared with the progress made in those in other countries
and the compliance to nutritional daily requirements per capita. These pillars comprise
food availability, access to food, stability of supplies and access, and food utilization, food
quality and food safety. The data from 1999 to 2009 showed that there was a reasonable
improvement in attaining these measures, but, there was still a deficiency in the acquisition
of some micro nutrients. Comparing the average of (1999-2001) with the average of (2006-
2008), the Syrian calorie intake increased from 3,056 kcal/capita/day to 3,116
kcal/capita/day and protein intake from 73.9 g/capita/day to 82.1 g/capita/day, while that of
fat decreased from 106.8 g/capita/day to 97.5 g/capita/day, respectively9. In this regard, it’s
worthy to note that the aforementioned estimates were calculated relying on the data of the
Syrian Food Balance Sheet (FBS) prepared by the MAAR. These values will be higher
when the actual consumption data are considered.
Finally, to strengthen the food security situation of the country and to target the less
privileged groups of the Syrian population in the context of reducing poverty, the Syrian
Government proposed a recent NPFS and approved it to be included in the 11th Tenth Five
Year Plan (FYP), 2011-2015 and the 12th FYP. This programme is the subject of the
special issue of this report.
9 kcal = kilocalorie; g = gram.

State of Food and Agriculture in Syria 2010
XV
Part I
Assessment of the State of Food and Agriculture


State of Food and Agriculture in Syria 2010
1
Chapter 1 – Country Development Opportunities for Agriculture and Agro-Industries
Seeking to enhance the utilization of resources related to agriculture and agro-industries,
the Syrian Government (SG) provides both supporting services and public investment. At
the same time, it promotes private investment to improve the performance of both
agricultural production, comprising both crops and livestock, and agro-processing. This is
in line with the ultimate goals of the sustainable development process currently going on in
Syria: assuring sufficient food complying with the needs of both food security and food
industry, creating new jobs for the labour force and producing food surplus for export. This
chapter contributes to the aforementioned subjects by giving an idea about geography and
location as well as the development of climatic conditions, agricultural resources, some
policy issues, production inputs, revenue streams and country development opportunities to
enhance agricultural and agro-industrial activities. This analysis focuses on the 1999-2009
period.
1.1. Geography and location
Syria is a Mediterranean country (Figure A1.1)10. It can be divided into four distinct
geographic regions: the coastal region, the mountainous region, the interior region and Al-
Badia. The coastal region, lying between the mountains and the sea, is characterized by a
high rate of relative humidity, heavy rainfall in winter and moderate temperatures in
summer; in the mountainous region, which includes the mountains stretching from north to
south in the western part of the country, rainfall may exceed 1,000 mm and the climate in
summer is moderate; the interior region, composed of the interior plains and located to the
east of the mountainous region, is distinguished by rainy winters and hot and dry summers
with considerable differences between the maximum and minimum intra-day temperatures;
and finally, the Al-Badia, in the south and east, consists of semi desert plains where rainfall
in winter is low and the summers are dry.
10 A denotes annex.

State of Food and Agriculture in Syria 2010
2
Syria can also be classified into: the northeastern region, including Al-Hassake, Al-
Raqqa11, Dair-ezzor, Idleb and Aleppo, the coastal region, comprising Lattakia and
Tartous, the middle region, incorporating Homs and Hama, and the southern region,
consisting of Damascus, Dar'a, Sweida and Quneitra12 (Figure A1.1).
1.2. Climatic conditions
Syria is a characterized by Mediterranean climate of rainy winters and hot summers
separated by two short transitional seasons (autumn and spring). It can be divided into five
stabilization zones, which are referred to different quantities of rainfall, diverse crops and
varied land altitudes (Figure A1.1 and Box A1.1).
From the rainfall point of view, the country can also be clustered as follows: it
regularly snows on all the regions exceeding 1,500 m above sea level;
snows and rains on the regions which their heights are between 800 and 1,500 m
above sea level;
rains on the regions their altitudes less than 800 m above sea level, but rarely snows
it;
rains in little amounts in Al-Badia (Syrian steppe).
Hence, the level of rainfall, its timing and its distribution affect considerably the
performance of both agricultural production and agricultural activities. This is especially
relevant for Syria because rain-fed agriculture accounted for about 71% of the cultivated
area in 2009.
In detail, Figure 1.1 indicates the development of the magnitude of the annual precipitation
from 1999 to 2008 considering the various stabilization zones (Table A1.1). It shows that
the amount of rain increased to reach its peak in 2003, then decreased thereafter to attain its
lowest level in 2008 because of the severe droughts over the 2006-2008 period. This of
course impacted negatively the performance of Syrian Agriculture and as a consequence
the livelihood of the rural population. The figure also implies that the First Ecological Zone
acquires the highest precipitation rate and subsequently the other zones.
The distribution of rain also varies across governorates and regions (southern, middle,
coastal and northern areas), Figure 1.2 and Table A1.2. Figure 1.2 points out to the same
11 Can be written with Al or without. 12 Can be written with Al or without.

State of Food and Agriculture in Syria 2010
3
trend as shown in Figure 1.1 and clarifies that the coastal and middle areas receive the
highest amount of precipitation, whereas the other regions obtain the lowest level.
Figure 1.1. Development of the annual rainfall by stabilization zones, 1999-2008 (mm/year)
0
200
400
600
800
1,000
1,200
1999 2000 2001 2002 2003 2004 2005 2006 2007 2008
mm
Average
First Ecological Zone
Second Ecological Zone
Third Ecological Zone
Fourth Ecological Zone
Fifth Ecological Zone
Source: Elaborated from NAPC database. mm: millimeter.
Figure 1.2. Development of the annual rainfall by regions, 1999-2008 (mm/year)
0
500
1,000
1,500
1999 2000 2001 2002 2003 2004 2005 2006 2007 2008
mm
Southern area
Middle area
Coastal area
Northern area
Source: Elaborated from NAPC database. mm: millimeter.
As indicated above, Syria had a declining rate of rainfall from 2003 to 2008 because of the
repeated droughts, which influenced adversely both crop production, especially the rain-fed
crops, and the groundwater, which is used for irrigated agriculture. Therefore, the
Government has established the Project of Artificial Rainfall, which induced the amount of
rain by 6-16%13. In addition, it has initiated a Drought Response Plan since 2009 in
collaboration with the United Nations to mitigate the drought impact that has started since
2006. While the 2007-2008 droughts were very severe and had a wider geographical reach,
the current droughts have again affected a population that already suffering from the
impacts of previous drought spells. Some 1.3 million inhabitants of eastern Syria have been
affected by this disaster, out of which 803,000 have lost almost all of their livelihoods and
faced extreme hardship. These families are not able to sustain or restore their livelihood
without emergence support including food aid, farming inputs and animal feeds,
13 MAAR, Directorate of Artificial Rainfall.

State of Food and Agriculture in Syria 2010
4
supplemented by other types of assistance14. Concurrently with the drought spells, Syria is
subject to temperature variations, which in turn influence unfavorably Syrian agriculture15.
1.3. Natural resources
1.3.1. Land
Land is a natural fortune upon which agricultural activities depend. However, land
available for agriculture is actually rare and limited especially in developing countries
where it is not optimally exploited, is overpopulated and is being urbanized. Hence, many
countries are seeking to improve the land use and productivity so that agricultural
production is optimized and its cost per unit of area is reduced.
In relation to Syria, the SG gives due attention to optimize the utilization of land resources.
Therefore, it tries both to expand the cultivable land horizontally through reclamation and
rehabilitation activities and to increase the productivity of land (vertical utilization) by
encouraging the agricultural scientific research (ASR). The ASR focuses on the
development of suitable, high yielding and drought resisting varieties, which are
diversified by regions, and the adoption of appropriate crop rotations. Both horizontal and
vertical expansions (utilization) are important, but, the latter ranks first because of the
limited availability of land resources. The aforementioned actions are governed not only by
state strategies and policies but also by its cooperation with regional and international
institutions. In spite of these efforts, the productivity of Syrian land is still low as compared
to that of other countries. Therefore, it is advisable that the coordination with foreign
agencies concentrates on the improvement of the ASR.
In-depth, the area of the Syrian Arab Republic (SAR) amounts to 18,518 thousand ha. It’s
divided into cultivable land, uncultivable land, steppes and pastures, and forests. The
cultivable land comprises both invested and un-invested lands. The invested land consists
of irrigated, rain-fed (non-irrigated) and fallow lands. In 2009, the total area of Syria was
composed of 32.5% cultivable land, 30.6% invested land, 23.4% actually cultivated land,
7.2% fallow land, 1.9% un-invested land, 19.9% uncultivable land, 44.5% steppes and
pastures, and 3.1% forests (Table A1.3). The evolution of its structure is depicted in Figure
1.3 from 1999 to 2009. Figure 1.3 indicates an increase in the contribution of irrigated,
fallow and forest lands and a decrease in the share of the other lands. The cultivable land
14 Syrian Drought Response Plan (2009). 15 Central Bureau of Statistics (CBS), the Annual Statistical Abstract (ASA), various issues.

State of Food and Agriculture in Syria 2010
5
increased from 5,998 thousand ha in 1999 to 6,013 thousand ha in 2009, while the
cultivated land declined from 4,541 thousand ha in 1999 to 4,339 thousand ha in 2009. In
addition, Table 1.1 traces the development of the land use during the 1999-2009 period.
From 2003 to 2009, it showed an upward trend for cultivable, invested and fallow lands
from and a downward trend for the other lands because of the 2006-2009 drought spells.
Figure 1.3. Development of the composition of the land use, 1999-2009 (%)
0%
20%
40%
60%
80%
100%
1999 2000 2001 2002 2003 2004 2005 2006 2007 2008 2009
Forests
Steppes and pastures
Uncultivable land
Un-invested land
Fallow land
Rain-fed land
Irrigated land
Source: Elaborated from the MAAR. The Annual Agricultural Statistical Abstract (AASA). Various issues.
Table 1.1. Evolution of the land use, 1999-2009 (000 ha, %)
Item Average
1999-2001 Average
2003-2005 Average
2007-2009 Change %2003-2009
Change % 1999-2009
AAGR % 1999-2009
Cultivable land 5,964 5,902 6,025 2.1 1.0 0.2 Invested land 5,435 5,522 5,671 2.7 4.3 0.7 Irrigated land 1,221 1,409 1,330 -5.6 8.9 1.4 Rain-fed land 3,324 3,346 3,226 -3.6 -3.0 -0.5 Fallow land 890 768 1,115 45.2 25.3 3.8 Cultivated land 4,546 4,754 4,556 -4.2 0.2 0 Un-invested land 529 380 354 -6.8 -33.0 -6.5 Uncultivable land 3,699 3,729 3,684 -1.2 -0.4 -0.1 Steppes and pastures 8,299 8,293 8,230 -0.8 -0.8 -0.1 Forests 556 594 579 -2.5 4.0 0.7
Source: Elaborated from the MAAR. The AASA. Various issues. AAGR: Average annual growth rate.
Table 1.1 also indicates that rain-fed, un-invested, uncultivable, steppes and pastures lands
declined from 1999 to 2009, while the other lands augmented; this implies that the
Government has succeeded in both conducting the reclamation activities and substituting
the rain-fed lands through irrigated lands. An increased irrigated land leads to higher land
productivity and a relatively enhanced fallow land in correspondence to drought maintains
it by rain-fed land. This productivity relies on several factors such as the level of
production, farming type (irrigated or rain-fed), holding size, soil type, degree of land
degradation, technological stand and the level of provided supporting services16. The
average impact of these determinants on the land productivity and the average area
16 See NAPC, SOFAS 2007, for more details.

State of Food and Agriculture in Syria 2010
6
development per capita are shown in Table 1.2 from 2000 to 2009 (Table A1.4) indicating
an increased productivity and a declined cultivable land per capita.
The aforementioned land use differs across governorates (Table A1.5 and Table A1.6) as
illustrated in Figure 1.4.
Table 1.2. Evolution of the land productivity and the land per capita, 2000-2009
Item Unit Average
2000-2002 Average
2007-2009 Change % 2000-2009
Land productivity 000 SP/ha 50.6 50.9 0.55
Cultivable land per capita ha/person 0.355 0.303 -14.61
Rural cultivable land per capita ha/person 0.711 0.655 -7.91 Source: Elaborated by the Rapporteur. Land productivity = value of crop production at constant prices/cultivated area.
Figure 1.4. Structure of the land use by governorates, 2009 (%)
0%
20%
40%
60%
80%
100%
Forests
Steppes and pastures
Uncultivable land
Cultivable land
Source: Elaborated from the MAAR. The AASA. 2009.
According to Figure 1.4, in 2009, the highest share of cultivable land was achieved in
Quneitra, Hassake and Aleppo, where the highest portion of uncultivable area prevailed in
Dair-Ezzor, Dar,a and Sweida.
Furthermore, land resources are managed by public, cooperative and private sectors (Table
1.3). Table 1.3 shows that the public sector has a minor share in the cultivable land,
whereas the cooperative and private sectors take the lead; the private sector acquires the
highest portion of the cultivable land.
Table 1.3. Evolution of the cultivable land by sectors, 2004-2008 (000 ha, %)
Item Public sector
Cooperative sector
Private sector
Total Share %
Public Cooperative Private 2004 12.0 2,495 3,402 5,909 0.21 42.22 57.57 2005 15.0 2,507 3,412 5,934 0.25 42.25 57.5 2006 1.0 2,515 3,433 5,949 0.01 42.28 57.71 2007 0.8 2,513 3,525 6,039 0.01 41.61 58.38 2008 0.8 2,501 3,521 6,023 0.01 41.52 58.47 Source: Elaborated from the MAAR. The AASA. 2008.
Finally, land use is still subject to the following constraints:

State of Food and Agriculture in Syria 2010
7
The productivity of some parts of the land is decreasing because of fertility
reduction, salinity and contamination resulting from the intensification
programmes. Therefore, these areas have to be rehabilitated.
The un-invested land requires great efforts to be invested, which implies a
challenge for the operations of horizontal development17 and a shift towards
vertical expansion18.
The land is fragmented to the extent that investment and mechanization are
constrained. In spite of this challenge, no serious actions are taken.
A great attention isn’t being given to applying appropriate crop rotations that
maintain soil fertility and improve the competitiveness of Syrian agricultural
products.
1.3.2. Water
Syria is classified internationally among the countries that have meager water resources
(less than 1,000 m3/ person/ year). Therefore, the GOS places high consideration on the
implementation of water-harvesting and water-saving technologies. In spite of these
efforts, Syria is still subject to water deficit in the amount of 3.5 billion m3 annually. This
water shortage relates to increased water consumption in the various sectors exceeding the
renewable water supply and to recent climatic changes Syria has been undergoing. These
environmental variations, which have impacted negatively the water level, comprise high
temperatures, limited rainfall and exclusion of some rivers and springs. The
aforementioned water deficiency is limited to Dajleh and Al-Kabour basins (2.3 billion m3/
year) and to Orientes Basin (1.2 billion m3/ year), see Figure A1.1. In this regard,
agriculture consumes about 90% of the available water, whereas the respective shares of
drink water and water for industrial uses amount to 8% and 2% respectively. Hence, the
available water for agriculture accounts for about 16 billion m3 annually. This water supply
is distributed differently across water basins (Figure A1.1) and is decreasing per capita
owing to the relatively high population growth.
Consequently, the Government puts high emphasis on the transformation of modern
irrigation technologies into agriculture and cooperates closely with regional and
international agencies to make a better use of the available water resources and to improve
17 Area increase. 18 Yield increase.

State of Food and Agriculture in Syria 2010
8
both water management and water harvesting. This fact is confirmed in Table 1.4, which
indicates the development of the irrigated area diversified by both water sources and
irrigation methods from 2001 to 2009 (Table A1.7).
Table 1.4. Evolution of the irrigated area by sources and methods, 2001-2009 (ha, %)
Item Average
1 01-03
Average 2
04-06
Average 3
07-09
Change % 3/2
Change % 3/1
AAGR % 3/1
Total irrigated area 1,320,294 1,422,366 1,330,391 -6.5 0.8 0.2 Out of which (sources) Irrigated from wells by pumping 808,736 860,419 743,399 -13.6 -8.1 -2.1 Irrigated from Government projects by pumping
315,444 333,968 370,416 10.9 17.4 4.1
Irrigated from river and springs by gravity
196,114 227,979 216,576 -5.0 10.4 2.5
Out of which (methods) Sprinkler irrigation 112,664 151,125 168,420 11.4 49.5 10.6 Drip irrigation 57,575 71,533 91,699 28.2 59.3 12.3 Total modern irrigation 170,239 222,658 260,119 16.8 52.8 11.2 Source: Elaborated from the MAAR. The AASA. 2009.
Table 1.4 also shows that the total irrigated area and the irrigated land from wells, springs
and rivers declined from 2004 to 2009, while the irrigated area from governmental projects
and the area under modern irrigation increased. Over the 2001-2009 period, on the other
hand, only the irrigated land from wells diminished. The decrease in the irrigated area can
be related to the drought spells during the 2006-2009 period and to the increase in fuel
prices, which influenced negatively the irrigated area from wells. In contrast, the
augmentation of the irrigated area from governmental projects refers to both Government
policies, which focus on the storage of water in dams, and the very low irrigation cost of
state projects as compared to that of wells.
Furthermore, Table A1.7 illustrates the distribution of the irrigated area by governorates
from 2001 to 2009 considering both irrigation sources and irrigation methods. It illustrates
that the irrigated area by sources is concentrated in the northern regions (Aleppo, Al-
Raqqa, Dair-Ezzor and Al-Hassake), where the irrigated area under modern irrigation is
intense in the provinces of Hama, Idleb, Aleppo and Al-Hassake (Figure 1.5).

State of Food and Agriculture in Syria 2010
9
Figure 1.5. Structure of the irrigated area under modern irrigation by regions, 2009 (%)
0%
20%
40%
60%
80%
100%
Al-Sweid
aDar
'a
Al-Qun
eitra
R. Dam
ascu
s
Homs
Hama
Al-Gha
bId
leb
Tarto
us
Lattak
ia
Alepp
o
Al-Raq
qa
Dair-E
zzor
Al-Has
sake
Irrigated by sprinklers Irrigated by drip
Source: Elaborated from the MAAR. The AASA. 2009. R: Rural.
Finally, the water sector is still subject to the following obstacles:
Decrease of all water sources especially ground water as a result of an unorganized
wells digging and water pumping, a deficit between supply and demand and a
deterioration of irrigation water quality. In addition, there is a slowdown in switching
towards advanced irrigation technologies.
Domination of traditional irrigation schemes given that the project of modern irrigation
is still subject to difficulties by its implementation because of the lack of credits,
licenses and requirements.
Contamination of water in almost all water basins due to agricultural intensification
strategies, industrial residues and salinity (in Al-Badia for example).
1.3.3. Steppes and pastures
Al-Badia (Syrian steppe) covers around 55% of the total area of the country. It is usually
affected negatively by the desertification in many parts of it due to low rainfall,
overgrazing, erosion, and degradation of fodder crops used for animal feeding. Therefore,
various programmes focusing on the conservation and rehabilitation of Al-Badia land
resources are being implemented to address the aforementioned major environmental and
economic problems. In addition, regulations and decrees have been issued to reverse this
situation and preserve natural pastures in the Syrian steppe. For example, crop cultivation
in Al-Badia has been prohibited and protection zones have been established. Furthermore,
the Government has executed a series of projects to develop Al-Badia and to enhance the
livelihood of its population.
Nevertheless, the area of steppes and pastures declined slightly from 8,299 thousand ha
(average (1999-2001)) to 8,230 thousand ha (average (2007-2009)), Table A1.3. This area

State of Food and Agriculture in Syria 2010
10
is allocated differently across governorates as indicated in Figure 1.6, which points out to
its concentration in the regions of Homs, Dair-Ezzor, Rural Damascus and Aleppo.
Figure 1.6. Distribution of steppes and pastures by regions, 2009 (%)
Dar'a0.35%
Al-Ghab0.03%
Idleb0.52% Tartous
0.03%
Al-Sweida2.55%
Al-Quneitra0.15%
Al-Hassake6.53%Dair-Ezzor
22.84%
Al-Raqqa11.91%
Aleppo2.74%
Lattakia0.02%
Hama3.81%
Rural Damascus15.95%
Homs32.57%
Source: Elaborated from the MAAR. The AASA. 2009.
Finally, the constraints facing Al-Badia utilization and deteriorating its performance can be
summarized as follows:
Weak infrastructures accompanied with uncooperative efforts to its development in
various fields: health, education, police posts, fodder stores, drink water, wells, roads,
pasture cultivations, protection zones, etc. Therefore, it is necessary to manage steppes
and pastures so that they will be sustainable.
Shortage in the provision of inputs that are used for sheep breeding because of both Al-
Badia overgrazing and droughts.
Salinity of water, which impacts negatively the performance of the livestock sector and
needs to be removed.
Weakness in processing and marketing operations related to livestock products and in
the training and education activities of the local communities.
Degradation and erosion of Al-Badia resources as a consequence of natural phenomena
especially winds.
1.3.4. Forestry
Syrian forests constitute on average 3% of the total area of the country; their main products
are forestry seedlings, charcoal, fuel wood and industrial wood. They are characterized by
several weaknesses such as low tree density, high tree mortality rate because of droughts,
fire degradation, overgrazing and accomplishment of forest roads. Therefore, the
Government has proposed numerous comprehensive policies19 as indicated in the Syrian
19 See chapter three.

State of Food and Agriculture in Syria 2010
11
Agricultural Strategy (SAS), 10th FYP and 11th FYP to improve the performance of the
forestry sector. These policies seek to maintain and develop forestry resources, increase
productivity of these assets, improve the income of local communities, retain the
environment, attain efficient forestry resource management in cooperation with local
communities, enhance the forestation of deteriorated and new areas to expand forests
according to ecological conditions and raise the role of forest products in achieving food
security.
As a consequence, the forest area increased by an AGR of 0.7% from 556 thousand ha
(average (1999-2001)) to 579 thousand ha (average (2007-2009)), Table A1.3. This area
was mostly concentrated in Hassake, Lattakia and Idleb in 2009 as shown in Figure 1.7.
Figure 1.7. Distribution of forests by regions, 2009 (%)
Idleb13.8%
Al-Ghab6.4%
Hama6.7%
Homs9.8%
Damascus10.0%
Dar'a1.8%
Al-Quneitra0.6%
Al-Sweida1.4%
Al-Hassake16.0%
Al-Raqqa2.8%
Dair-Ezzor1.5%
Aleppo9.3%
Lattakia14.7%
Tartous5.4%
Source: Elaborated from the MAAR. The AASA. 2009.
1.3.5. Fishery
The increasing number of the population has actually led to the hunger phenomenon in
many developing countries. Consequently, efforts have been directed to find alternative
food sources and to improve the productivity of them. Aquacultures, in particular fishery,
are considered as one of these most important sources to supplement food economically
and efficiently for human beings.
In relation to Syria, the Syrian coast extends over 183 km and the continental shelf covers
1,373 square miles. Its fish stock is estimated at 0.9 tonnes/mile2, which is very low as
compared to that of other countries. In addition, internal lakes and rivers are under-utilized
in the field of fishing. The total area covered by lakes totaled 1,017 km2, out of which only
about a half is used for fishing or fish farming. Therefore, fish production in Syria is limited.
As a result, fish play a minor role in the traditional Syrian diet, with a per capita
consumption less than 1 kg/year.

State of Food and Agriculture in Syria 2010
12
Hence, the SG has given due attention to raise the efficiency of fish production in all
sources through establishing both a project for the development of fishery in the interior
water and the General Commission for Fishery. Besides, it encourages all sectors (public,
cooperative, private and joint sectors) to invest in the fish sector, organizes fishing in both
the Syrian coast and the internal water and provides the needed inputs to develop
aquacultures.
The aforementioned actions of the Government resulted in a satisfactory growth in fish
production during the 1999-2009 period as depicted in Table 1.5 (Table A1.8). Table 1.5
reveals that total fish production increased from 14 thousand tonnes (average (1999-2001))
to 16 thousand tonnes (average (2007-2009)).
Table 1.5. Development of fish production by sectors, 1999-2009 (tonne, %) Item Public sector Cooperative sector Private sector Joint sector Total
Average (1999-2001) 1 1,424 3,873 8,589 17 13,904 Average (2007-2009) 2 1,213 1,922 12,736 88 15,959 Average change % 2/1 --14.9 -50.4 48.3 415.7 14.8 AAGR % (2/1) -2.6 -11.0 6.8 31.4 2.3 Source: Elaborated from MAAR, the AASA, various issues.
Table 1.5 also indicates that the production of both the private and joint sectors augmented
while that of the public and cooperative sectors declined, the private sector dominated fish
production, and the joint sector enhanced its production at a high pace.
The total fish production presented in Table 1.5 is further diversified in Figure 1.8 into fish
types (Table A1.8) during the 1999-2009 period. Figure 1.8 makes clear that farm fish
dominated other fish, there was an increase in both farm and sea fish while fish of lakes,
dams and rivers declined, and fish production increased to attain its peak in 2007 and
diminished thereafter.
Figure 1.8. Development of fish production by types, 1999-2009 (tonne)
05,000
10,00015,00020,000
1999 2000 2001 2002 2003 2004 2005 2006 2007 2008 2009
tonneSea fish
Fish of lakes, dams andriversFarm fish
Source: Elaborated from the MAAR. The AASA. Various issues.
Figure 1.9 presents the production of the aforesaid fish types by governorates (Table 1.8). It
shows that fish farming is absent in both Sweida and Rural Damascus while it concentrates
in Al-Ghab (28.1%), Lattakia (20.1%), Raqqa (14.3%) and Aleppo (12.3%). Furthermore,

State of Food and Agriculture in Syria 2010
13
sea fish is mostly located in Lattakia (82.2%) and Tartous (17.8%); farm fish in Al-Ghab
(57.3%); fish of lakes, dams and rivers in Aleppo (30.1%) and Raqqa (30.4%).
Figure 1.9. Distribution of fish production by governorates, 2009 (%)
0%
20%
40%
60%
80%
100%
Sea fish Farm fish Fish of lakes, dams andrivers
Total fish
Sweida Dar'a Quneitra Rural Damascus Homs
Hama Al-Ghab Idleb Tartous Lattakia
Aleppo Raqqa Dair-Ezzor Hassake
Source: Elaborated from the MAAR. The AASA. Various issues.
1.3.6. Quarrying industries
This section focuses on petroleum and phosphate owing to their importance for agriculture
and economic development. Fuel and natural gas as the former derivatives are considered
as the most important energy sources in the country. Their economic importance also
results from the fact that they contribute to a fifth of the GDP, ¾ of the export earnings and
a half of the Government budget20. These resources, however, are diminishing. Petroleum
production decreased from 540 thousand barrel/day in 2000 to 425 thousand barrel/day in
recent years21. Therefore, the Government tries to enhance other revenue sources especially
agriculture. Table 1.6 traces the evolution of the production of the aforementioned
quarrying products from 2004 to 2009 confirming their drop.
Table 1.6. Development of the production of petroleum and phosphate, 2004-2008 Item Unit 2004 2005 2006 2007 2008 2009 AGR %
Petroleum 000 m3 25,721 23,961 22,417 21,420 21,614 21,241 -3.8 Phosphate 000 tonnes 2,882 2,925 2,904 2,900 2,629 2,128 -5.9 Source: Elaborated from CBS, the ASA, various issues.
1.4. Human resources
The Syrian population consists of about 51% females and 49% males. It is also divided
into about 54% urban and 46% rural and is dominated by a young structure. The people
below 24 of age amount to about 62% of the inhabitants. Table 1.7 gives an idea about the
evolution of some indicators related to these human resources during the 2000-2009 period
(Table A1.9). It indicates that the number of population increased on average by an annual
20 Elaborated from the State Planning Commission (SPC), the 10th FYP. 21 Elaborated from the SPC, the 10th FYP.

State of Food and Agriculture in Syria 2010
14
growth rate of 3.5% and rural residents augmented by a rate lower than that of the total
population while urban citizen grew faster than the total population.
Table 1.7. Development of some indicators related to population, 2000-2009 (000 persons, %)
Item Average
(2000-2002) Average
(2007-2009) Average change %
(2000-2009) AAGR %
(2000-2009) Total population 16,723 19,889 18.9 3.5
Rural population 8,351 9,211 10.3 2.0
Urban population 8,373 10,678 27.5 5.0
Total labour force 5,224 4,829 -7.6 -1.9 Agricultural labour force 1,455 946 -35.0 -10.2 Source: Elaborated from CBS, the ASA, various issues.
Table 1.7 also shows that the urban and rural populations have an approximately equal
share, which leads to the conclusion that a high share of the inhabitants is involved in
agricultural activities. The number of this agricultural labour force decreased by a higher
rate than that of the total labour force during the considered period owing to the 2006-2009
droughts spells, introduction of modern technologies and immigration from the country
side to the city. As a consequence, the real annual agricultural per capita GDP declined
from SP15 thousand in 2002 to SP13 thousand in 2009 in reference to the total population
and from SP31 thousand to SP28 thousand, respectively, in relation to the rural population,
while it increased from SP178 thousand to SP280 thousand, respectively, when agricultural
labour force is considered.
Finally, the human resources are subject to the following constraints:
The relatively high population growth impacts negatively the performance of the
national economy in general and the natural resources utilization in particular.
There is a decrease in the provision of job opportunities due to adverse climatic
conditions and water scarcity because of droughts and irrational use of water
resources, which affects negatively the agricultural seasonal labor.
The share of agricultural investment in total investment is low due the long
recovery period of agricultural investments and risk, which limits the creation of
the required jobs.
The increase in the rural immigration and changes in consumption habits induce an
urgent need to enhance domestic production and imports, to provide competitive
goods and to expand the services supplied to cities especially those related to folk
parts of the city.

State of Food and Agriculture in Syria 2010
15
1.5. Agricultural intermediate consumption
Since the 1990s agricultural input policies have generally moved towards a gradual
elimination of subsidies of some inputs such as fuel, irrigation cost for state projects, and
electricity, while the prices of other inputs have been liberalized such as chemical
fertilizers, pesticides, machinery and some seed varieties. At the same time, they have
continued to facilitate the provision of agricultural inputs for private sector agencies who
took part in producing, importing, and trading most of these inputs especially pesticides,
fertilizers, seeds of vegetables, seedlings, machinery, and agricultural tools, in addition to
livestock production inputs such as veterinary care and fodder, etc. A more in-depth
investigation of those is presented below.
Governmental policies towards agriculture still give focused attention to the provision of
improved seeds for strategic crops (wheat, barley, cotton, sugar beet and tobacco) in
addition to some quantities of lentils, chickpeas , beans, corn, and potato. These seeds are
provided by the General Establishment for seed Multiplication (GESM) with the exception
of tobacco seeds, which are supplied by the General Organization for Tobacco (GOT).
Both establishments are owned by the state. The GESM, however, covers only 35-50% of
wheat seeds requirement, and only 1% of barley seeds demand. Therefore, the remaining
quantities of these seeds are supplied by farmers or by the private sector. On the other
hand, production and marketing of seeds related to cotton and sugar beet are confined to
the GESM, which intends to attain self-sufficiency of these seeds in addition to potato
seeds to substitute imports and to save foreign currency. The GESM increased the
aforementioned capacities of seed multiplication after acquiring 11 centers for sieving and
disinfection of seeds from the General Establishment for Silos complying with demand for
seeds. In this regard, Table 1.8 indicates the evolution in the production of improved seeds
related to wheat, cotton and potato during the 2003-2008 period. It shows that there was an
improvement in the production of wheat seeds, whereas that associated with cotton and
potato seeds decreased owing to the droughts, reduction of the cultivated area linked to
cotton and variation in the demand for seeds.
Table 1.8. Evolution in the production of the most important improved seeds of the GESM, 2003-2008 (000 tonnes)
Item 2003 2004 2005 2006 2007 2008 Average
03-05 Average
06-08 ACH %
03-08 AGR %
03-08 Wheat 85.7 139.3 134.3 124.0 72.3 193.4 119.8 129.9 8.5 17.7 Cotton 18.7 20.7 19.4 18.0 17.9 17.9 19.6 17.9 -8.5 -0.9 Potato 26.4 25.5 20.5 18.8 15.3 20.8 24.1 18.3 -24.2 -4.7 Source: Elaborated from MAAR, Achievement Report, 1970-2006, and Analysis of the Current Situation, 2004-2008. ACH: Average change. AGR: Annual growth rate.

State of Food and Agriculture in Syria 2010
16
In addition, fruit bearing seedlings are grown by both the MAAR and the private sector.
For this purpose, the MAAR has specialized nurseries, which expand or reduce their
production according to their annual plan. Pastoral and forestry seedlings, on the other
hand, are produced exclusively by the MAAR also according to an annual plan. Table 1.9
clarifies the production of the aforementioned seedlings related to the MAAR from 2003 to
2008 indicating on average an increase in the production of fruit bearing and pastoral
seedlings and a decline in that of forestry seedlings.
Table 1.9. Evolution in the production of seedlings related to the MAAR, 2003-2008 (million seedlings)
Item 2003 2004 2005 2006 2007 2008 Average
03-05 Average
06-08 ACH %
03-08 AGR %
03-08 Fruit bearing 7.9 8.3 5.4 7.9 7.6 8.3 7.2 7.9 10.2 1.0 Forestry 21.9 20.9 18.9 20.0 11.9 18.1 20.6 16.7 -19.0 -3.7 Pastoral 15.4 14.3 15.1 15.3 15.0 14.7 14.9 15.0 0.4 -0.9 Source: Elaborated from MAAR, Achievement Report, 1970-2006, and Analysis of the Current Situation, 2004-2008.
Furthermore, fertilizers play a substantial role in the vertical expansion22 of the agricultural
production to increase productivity, especially because of the limited agricultural land,
which induces a difficulty to expand horizontally. Therefore, during the last three decades,
the state occupied a prominent position in the provision of essential fertilizers, which were
distributed solely by the Agricultural Cooperative Bank (ACB) and its branches to the
public, cooperative and private sectors, complying with the strategic orientation to promote
the introduction of modern production techniques in the agricultural sector and to increase
agricultural production. At a later stage, Agricultural policies have shifted towards the
rationalization of the use of these fertilizers by implementing “fertilizers criteria” upon
analyzing agricultural soil and identifying the required quantity of chemicals. In spite of
these actions, fertilizers use increased on average over the 1999-2009 period as illustrated
in Table 1.10 and Figure 1.10 (Table A1.10) due to the expansion of the cultivated area and
the increase in the irrigated area. Figure 1.110 clarifies further that nitrogen fertilizers are
the most widely used chemicals, followed by phosphate, then by potash.
Table 1.10. Evolution in fertilizer use, 1999-2009 (000 tonnes) Item Nitrogen (N) Phosphate (P) Potash (K) Total
Average (1999-2001) 1 210 104 8 321 Average (2003-2005) 2 245 112 9 365 Average (2007-2009) 3 248 109 10 367 Average change % (3/2) 1.2 -2.7 11.1 0.5 Average change % (3/1) 18.1 4.8 25.0 14.3 AAGR % (3/1) 2.8 0.8 3.8 2.3 Source: Elaborated from MAAR, the AASA, various issues.
22 It focuses on making a better use of agricultural land to increase return and efficiency.

State of Food and Agriculture in Syria 2010
17
Figure 1.10. Evolution in fertilizer use, 1999-2009 (000 tonnes)
0
100
200
300
400
500
1999 2000 2001 2002 2003 2004 2005 2006 2007 2008 2009
000 tonnes
Potash (K)
Phosphate (P)
Nitrogen (N)
Source: Elaborated from MAAR, the AASA, various issues.
The above-mentioned fertilizer use varies among governorates as depicted in Figure 1.11
owing to the prevailing cultivations and their size. Figure 1.11 also indicates that fertilizer
acquisition concentrates in the provinces of Hassake, Aleppo and Raqqa.
Figure 1.11. Distribution of fertilizer use by regions, 2009 (%) Sweida 0.2%
Dar'a 2.4%
Quneitra 0.4%
Rural Damascus 1.6%
Homs 6.0%
Hama 8.3%
Al-Ghab 3.1%
Idleb 7.8%
Tartous 3.9%
Lattakia 4.7%
Aleppo 19.4%
Raqqa 10.6%
Dair-Ezzor 6.6%
Hassake 25.0%
Source: Elaborated from MAAR, the AASA, 2009.
The Government also places high value on the provision of control materials and their
rational use. However, it provides only compulsory chemicals, where the private sector
supplies the rest. Table 1.11 illustrates the controlling activities conducted by the state
represented by the MAAR over the 2003-2008 period. It indicates that these actions
followed a declining trend complying with the state policy that focuses on the reduction
and rationalization of control substances.
Table 1.11. Evolution in controlling activities of the MAAR, 2003-2008 (000 ha, value: 000 SP)
Item 2003 2004 2005 2006 2007 2008 Average
03-05 Average
06-08 ACH %
03-08 Insects 386 589 226 167 265 131 400 188 -53.1 Diseases 178 161 116 102 3 5 152 37 -75.8 Weeds 1,284 742 492 852 158 18 839 343 -59.2 Field mouse 1,161 916 548 569 766 319 875 551 -37.0 Value 629,874 341,196 211,506 90,235 57,388 39 394,192 49,221 -87.5 Source: Elaborated from MAAR Achievements Report, 1970-2006 and Analysis of the Current Situation, 2004-2008.
In contrast to the aforementioned state interventions, the private sector administers fully
the prerequisite of agricultural machinery. Its supply of agricultural equipment increased in
line with the enlargement of agricultural operations excluding fixed threshers and dusters

State of Food and Agriculture in Syria 2010
18
(Table A1.11). The number of machines augmented from 485 thousand (average (1999-
2001)) to 588 thousand (average (2006-2008)). In 2008, the number of these machines was
fairly distributed by governorates in line with the size of regional agricultural activities
(Figure 1.12).
Figure 1.12. Distribution of agricultural equipment by governorates, 2008 (%)
Quneitra1%
Dar'a5%
Sweida4%
Hassake10%
Raqqa5%
Dair-Ezzor4%
Aleppo16%
Lattakia6%
Tartous8%
Idleb8%
Al-Ghab5%
Hama7%
Homs10%
Rural Damascus11%
Source: Elaborated from the MAAR, the AASA, 2008.
Finally, the Government provides additionally agricultural producers with feed for the
livestock through both domestic production and imports, and with containers especially for
strategic crops.
1.6. Agricultural supporting services
Agricultural supporting services include many activities provided by the public sector
particularly by the MAAR. The objective of these services in the middle and long run is to
increase production and productivity. They comprise the provision of credit, agricultural
research and extension services, education and training programmes, activities focusing on
agricultural and rural women development, control services, agricultural infrastructure, and
services related to livestock such as veterinary care, vaccination, etc. In addition, the
government provides other services that enhance agriculture, agro-industries and food
security like industrial services, academic research, general infrastructure, health and
education, facilitation of the movement of goods within and outside the country, and
information technologies.
1.6.1. Agricultural credits
Loans are considered very important supporting services for the agricultural sector to push,
facilitate and enhance the economic development process through:

State of Food and Agriculture in Syria 2010
19
Enhancing capital formation especially by the means of medium and long term
loans, which are mainly directed towards constructions, machinery purchase, and
establishment of new productive projects or expansion of the existing enterprises to
reap the benefit of economies of scales.
Increasing production efficiency by facilitating, substituting and modernizing
production tools, using fertilizers and improved seeds, introducing mechanization
and modern techniques, and inducing a cost decline.
Helping farmers combat unfavorable economic and seasonal conditions, risk in
agricultural production, and seasonality of income and expenditure.
Enabling producers to own production tools in relatively short periods of time to
avoid price risk.
Therefore, the Government gives focused attention to the provision of agricultural loans.
This is explained by the considerably increased volume of these credits provided by the
ACB. The ACB loans increased from SP 10,209 million in 1999 to SP79,992 million in
2009. Figure 1.13 clarifies the development of the structure of these credits from 1999 to
2009 (Table A1.12). It indicates over this period that there were an increasing trend of
these assets, a prevalence of short-term loans, a declining share of the medium-term credits
and a high supply of credits in 2009 as compared to the previous years. This of course
complies with the long-term objectives of agricultural development that requires the
enlargement of long-term loans to enhance capital formation.
Figure 1.13. Development of agricultural credits, 1999-2009 (000 SP)
010,000,00020,000,00030,000,00040,000,00050,000,00060,000,00070,000,00080,000,00090,000,000
1999 2000 2001 2002 2003 2004 2005 2006 2007 2008 2009
000 SP
Long-term loans
Medium-term-loans
Short-term loans
Source: Elaborated from the MAAR, the AASA, various issues.
The aforesaid credits are supplied for the public, private and cooperative sectors. In detail
(Table A1.12), from 1999 to 2009, short-term loans augmented for all sectors; medium-
term loans were absent for the public sector, declined sharply for the cooperative sector
and amplified for the private sector; long-term credits were again not granted for the public
sector, diminished substantially for the cooperative sector and enhanced considerably for
the private sector.

State of Food and Agriculture in Syria 2010
20
Finally, Figure 1.14 illustrates the loan structure by governorates in 2009. It points out that
Rural Damascus, Aleppo and Hassake regions acquired the highest share of loans as
compared to other provinces complying with their level of production.
Figure 1.14. Loan structure by regions, 2009 (%)
Sweida 0%
Dar'a 0% Quneitra
0%
Rural Damascus 41%
Homs 1%
Hama 1%
Al-Ghab 0%
Idleb 1%
Tartous 1%
Lattakia 0%
Aleppo 31%
Raqqa 2%
Dair-Ezzor 1%
Hassake 21%
Source: Elaborated from the MAAR, the AASA, 2009.
1.6.2. Agricultural scientific research
For three decades substantial efforts have been in place to establish the scientific
infrastructure and to transform advanced technologies in the form of highly developed
machinery and equipment, superior technologies and technical expertise. However, this
evidence has been not accompanied with the required investment and the involvement of
the private sector. The state has been the single player in research and development
activities (R and D). Therefore, the current initiatives of the Government are focusing on
the enhancement of the private sector actions in this field. In spite of the aforesaid efforts,
the Syrian expenditure on R and D doesn’t exceed 0.18% of the GDP thus falling short to
comply with the internationally recommended rate of at least 1% of the GDP and that of
developed countries of 2.3%. Furthermore, despite the improvement of the role of agro-
universities in R and D, the actions of those are miniscule in this field due to old
laboratories, low salaries and limited number of dedicated people to research. Hence, the
Government founded both the Overall General Commission for Scientific Research by
Decision no. 68 dated 08/17/2005, to coordinate research activities and to enhance
scientific research in general, and the General Commission for Agricultural Scientific
Research (GCASR) by Law no. 42 dated 2001, which was amended in 2005, to upgrade
the ASR in particular.

State of Food and Agriculture in Syria 2010
21
In-depth, the GCASR consists of 7 administrations (natural resources, crops, horticulture,
cotton, plant control, livestock and economic research) to develop the ASR. The main tasks
of this institution are creating high yielding varieties (wheat, barley, lentil, cotton, maize,
sorghum, etc.), conducting research in the field of fruit trees (olives, citrus, apples) and
improving animal breeds (cattle, sheep and goats). Its current research activities focus on
the priorities of the SAS such as droughts and water management, resource protection,
integrated control, improved quality, productivity increase and cost reduction. Table 1.12
traces the development of the conducted activities related to these areas over the 2004-
2008 period.
Table 1.12. Development of the performed activities of the GCASR, 2004-2008 Item Unit 2004 2005 2006 2007 2008
Plant production research stations Station 48 63 63 63 66 Livestock production research stations Station 16 13 18 18 15 Irrigation and land use research stations Station 25 30 30 30 30 Crop production researches accomplished Research 892 854 910 872 849 Livestock production researches accomplished Research 49 40 54 41 48 Natural resources researches accomplished Research 225 242 258 225 190 Number of centrally analyzed samples Sample 10,541 5,458 227,000 14,798 132,200 Source: Elaborated from MAAR, Analysis of the Current Situation, 2004-2008.
Finally, the ASR suffers from several constraints especially those related to the
qualification of its labour force and to the introduction of modern technologies, confined to
a predetermined schedule.
1.6.3. Agricultural extension, training and education
Agricultural extension is executed by the Agricultural Extension Directorate (AED) of the
MAAR. It focuses on transforming know-how, skills, new techniques, and agricultural
research findings to farmers so that crop and livestock productions are enhanced and
problems of the agricultural sector are tackled. To do so, the AED provides extension
services free of charge through a countrywide network of extension units. These services
seek to help producers adopt general control programmes, especially on insects and
diseases as well as on the Integrated Pest Control Management (IPM), to encourage the use
of biological control and veterinary care, and to enhance agricultural production activities.
In addition, extension service aims at identifying farmers’ needs by applying the
participatory approach to involve them in solving their problems and devising suitable
solutions. The aforementioned services are set in place through extension fields, seminars,
and field visits. At the same time, the AED cooperates and coordinates its tasks with the
GCSAR, universities, international organizations, and public and private establishments, to
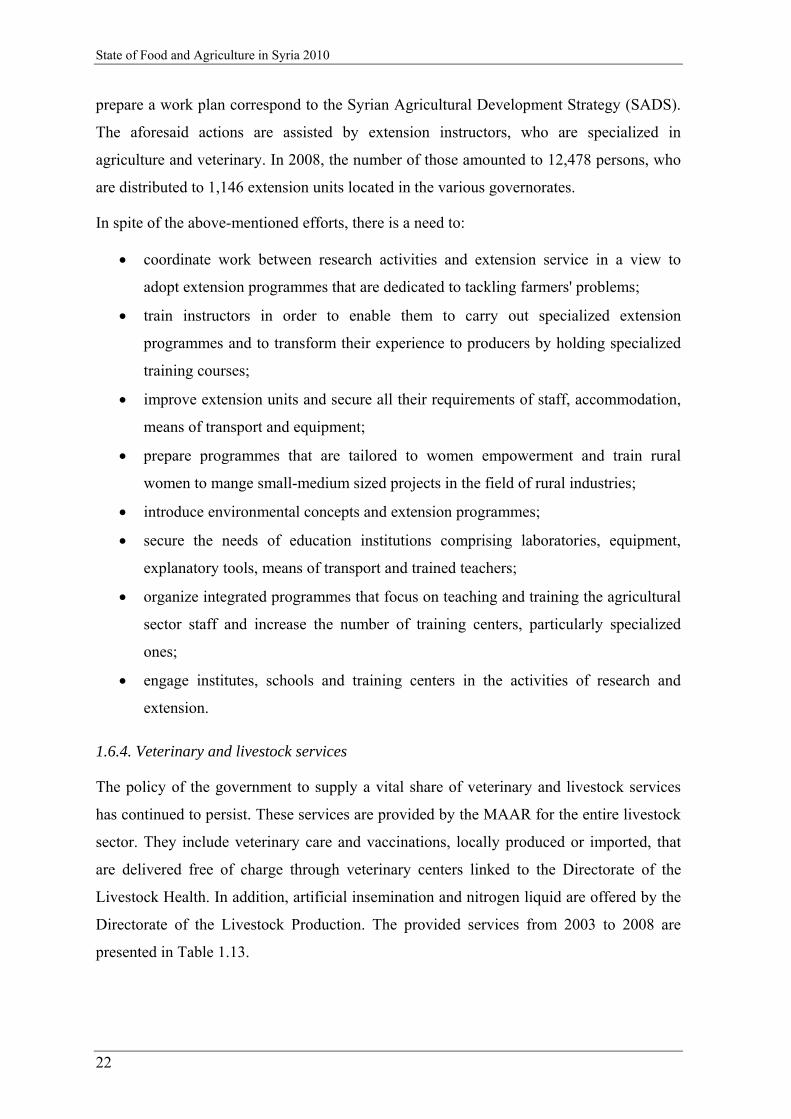
State of Food and Agriculture in Syria 2010
22
prepare a work plan correspond to the Syrian Agricultural Development Strategy (SADS).
The aforesaid actions are assisted by extension instructors, who are specialized in
agriculture and veterinary. In 2008, the number of those amounted to 12,478 persons, who
are distributed to 1,146 extension units located in the various governorates.
In spite of the above-mentioned efforts, there is a need to:
coordinate work between research activities and extension service in a view to
adopt extension programmes that are dedicated to tackling farmers' problems;
train instructors in order to enable them to carry out specialized extension
programmes and to transform their experience to producers by holding specialized
training courses;
improve extension units and secure all their requirements of staff, accommodation,
means of transport and equipment;
prepare programmes that are tailored to women empowerment and train rural
women to mange small-medium sized projects in the field of rural industries;
introduce environmental concepts and extension programmes;
secure the needs of education institutions comprising laboratories, equipment,
explanatory tools, means of transport and trained teachers;
organize integrated programmes that focus on teaching and training the agricultural
sector staff and increase the number of training centers, particularly specialized
ones;
engage institutes, schools and training centers in the activities of research and
extension.
1.6.4. Veterinary and livestock services
The policy of the government to supply a vital share of veterinary and livestock services
has continued to persist. These services are provided by the MAAR for the entire livestock
sector. They include veterinary care and vaccinations, locally produced or imported, that
are delivered free of charge through veterinary centers linked to the Directorate of the
Livestock Health. In addition, artificial insemination and nitrogen liquid are offered by the
Directorate of the Livestock Production. The provided services from 2003 to 2008 are
presented in Table 1.13.
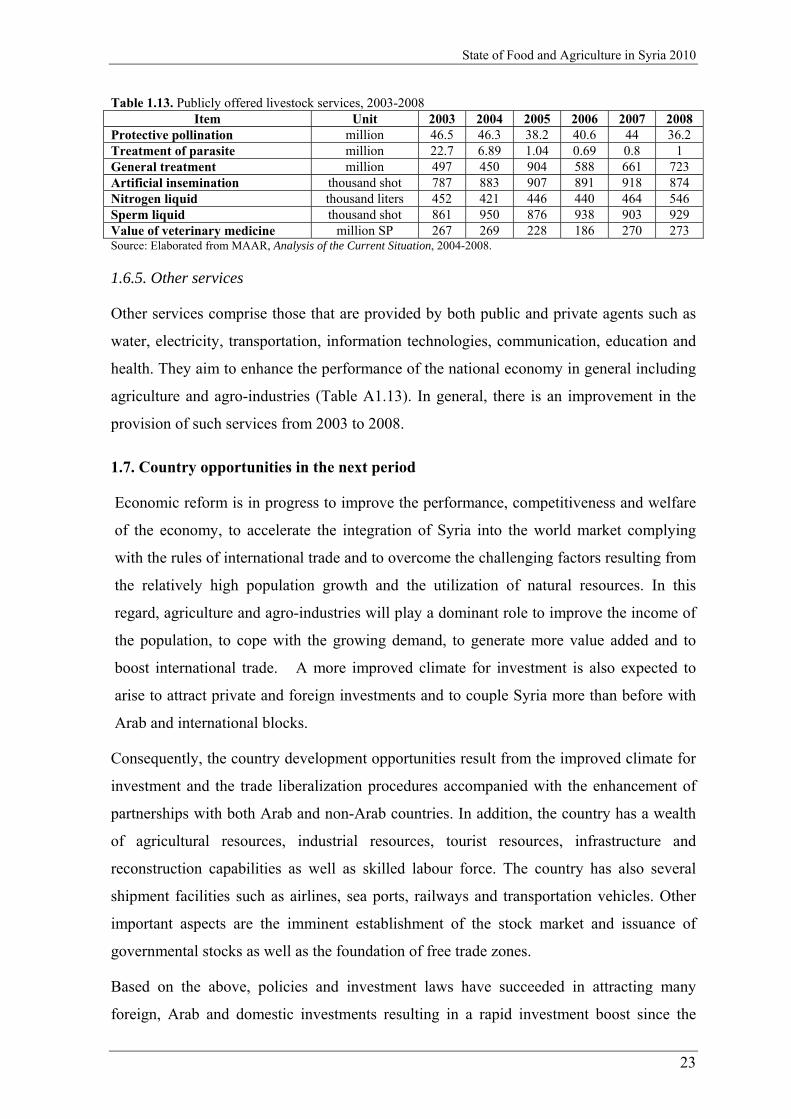
State of Food and Agriculture in Syria 2010
23
Table 1.13. Publicly offered livestock services, 2003-2008 Item Unit 2003 2004 2005 2006 2007 2008
Protective pollination million 46.5 46.3 38.2 40.6 44 36.2 Treatment of parasite million 22.7 6.89 1.04 0.69 0.8 1 General treatment million 497 450 904 588 661 723 Artificial insemination thousand shot 787 883 907 891 918 874 Nitrogen liquid thousand liters 452 421 446 440 464 546 Sperm liquid thousand shot 861 950 876 938 903 929 Value of veterinary medicine million SP 267 269 228 186 270 273 Source: Elaborated from MAAR, Analysis of the Current Situation, 2004-2008.
1.6.5. Other services
Other services comprise those that are provided by both public and private agents such as
water, electricity, transportation, information technologies, communication, education and
health. They aim to enhance the performance of the national economy in general including
agriculture and agro-industries (Table A1.13). In general, there is an improvement in the
provision of such services from 2003 to 2008.
1.7. Country opportunities in the next period
Economic reform is in progress to improve the performance, competitiveness and welfare
of the economy, to accelerate the integration of Syria into the world market complying
with the rules of international trade and to overcome the challenging factors resulting from
the relatively high population growth and the utilization of natural resources. In this
regard, agriculture and agro-industries will play a dominant role to improve the income of
the population, to cope with the growing demand, to generate more value added and to
boost international trade. A more improved climate for investment is also expected to
arise to attract private and foreign investments and to couple Syria more than before with
Arab and international blocks.
Consequently, the country development opportunities result from the improved climate for
investment and the trade liberalization procedures accompanied with the enhancement of
partnerships with both Arab and non-Arab countries. In addition, the country has a wealth
of agricultural resources, industrial resources, tourist resources, infrastructure and
reconstruction capabilities as well as skilled labour force. The country has also several
shipment facilities such as airlines, sea ports, railways and transportation vehicles. Other
important aspects are the imminent establishment of the stock market and issuance of
governmental stocks as well as the foundation of free trade zones.
Based on the above, policies and investment laws have succeeded in attracting many
foreign, Arab and domestic investments resulting in a rapid investment boost since the

State of Food and Agriculture in Syria 2010
24
beginning of the nineties. Syria has also signed many agreements with Arab countries
(Great Arab Free Trade Area (GAFTA)), European countries (partnership with the
European Union signed with the first letters), free trade agreement with Turkey and many
bilateral agreements to establish free trade zones in order to improve the performance of
foreign trade. Hence, eight groups of countries are considered: Arab countries, EU25, Asia
excluding Arab countries, North America, South America, Africa excluding Arab
countries, Oceania, and Other Countries.

State of Food and Agriculture in Syria 2010
25
Chapter 2 – Agriculture in the national economy
Agriculture plays a major role in the national economy because of its multiple
contributions to the economic and social development process of the country comprising
GO, production inputs, GDP, employment, investment, total trade, the activities of
marketing, processing and providing the raw materials necessary for agro-industries,
achievement of food security and environment sustainability. Therefore, the recent
orientation of the Government is focusing on strengthening the position of agriculture in
the country especially because oil resources are declining. Some of the aforementioned
indicators were used to assess the importance of Syrian agriculture as compared to that of
the other sectors of the economy as presented below.
2.1. Contribution of agriculture to the gross output
Agricultural production, comprising both crops and livestock, contributes considerably to
the GO. This contribution results from its high diversity due to the vagary in agro-climates.
Its value increased from SP341 billion in 2000, to SP778 billion at current prices and to
SP394 billion at constant prices of 2000 in 2009. Its share in GO, however, declined from
22% in 2000 to 16-18% in 2009 because, on average, the other sectors of the economy
grew at a substantially higher rate than that of agriculture (Table A2.1 and Table A2.2) as
confirmed in Table 2.1 from 2002 to 2009.
Table 2.1. Contribution of agriculture to GO, 2002-2009 (SP million, %)
Item At current prices At constant prices of 2000
Average 2002-2004
Average 2007-2009
Average Change %
Average 2002-2004
Average 2007-2009
Average Change %
Total GO 1,922,381 3,969,807 106.5 1,773,803 2,300,575 29.7 Agricultural GO 406,258 663,786 63.4 376,314 376,284 0.0 Share of agriculture % 21.1 16.7 -20.9 21.1 16.3 -22.2 Source: Elaborated from the CBS, the ASA, various issues.
According to Table 2.1, both total GO and agricultural GO amplified at current prices
owing to the boost in international world prices. The latter, on the other hand, remained
stable at constant prices owing to the drought spells from 2007 to 2009. Both measures are

State of Food and Agriculture in Syria 2010
26
strongly related as indicated from Figure 2.1 and the correlation coefficient between them,
which amounted to 0.9623.
Figure 2.1. Development of the total GO and agricultural GO, 2000-2009 (million SP)
At current prices
0
1,000,000
2,000,000
3,000,000
4,000,000
5,000,000
2000 2002 2003 2004 2005 2006 2007 2008 2009
SP million
Total GO Agricultural GO
At constant prices
0
1,000,000
2,000,000
3,000,000
2000 2002 2003 2004 2005 2006 2007 2008 2009
SP million
Total GO Agricultural GO
Source: Elaborated from CBS, the ASA, various issues.
Finally, Figure 2.2 clarifies the structure of the total GO by major sectors of the economy
at current and constant prices from 2000 to 2009. It makes clear that the agricultural sector
is placed second (16-23% at current prices and 16-22% at constant prices) after the mining
and manufacturing sector (35-42% at current prices and 33-39% at constant prices). It also
indicates that the contribution of agriculture decreased.
Figure 2.2. Structure of the total GO by sectors, 2000-2009 (%)
At current prices
0%
20%
40%
60%
80%
100%
2000 2002 2003 2004 2005 2006 2007 2008 2009OthersTransport communication and storageWholesale and retail tradeBuilding and constructionMining and manufacturingAgriculture
At constant prices
0%
20%
40%
60%
80%
100%
2000 2002 2003 2004 2005 2006 2007 2008 2009
OthersTransport, communication and storageWholesale and retail tradeBuilding and constructionMining and manufacturingAgriculture
Source: Elaborated from CBS, the ASA, various issues.
2.2. Contribution of agriculture to production inputs
The contribution of Agriculture to production inputs (intermediate consumption) is higher
than that of the other sectors of the economy with the exception of the mining and
manufacturing sector, which comes first (Table A2.3 and Table A2.4). It amplified from
SP117 billion in 2000, to SP212 billion at current prices and to SP129 billion at constant
prices of 2000 in 2009. Furthermore, when average values are used to compare between
agricultural inputs and total inputs as illustrated in Table 2.2, they indicate that the latter
23 The correlation coefficient varies from -1 to +1. The minus sign indicates an inverse relationship, whereas the plus sign points out to a positive association.

State of Food and Agriculture in Syria 2010
27
grew at substantially higher rate than the former leading to a declined share of agriculture
in total inputs at both current and constant prices from 2002 to 2009; they also point out to
enormous impact of the world crisis on the prices of inputs. Table 2.2 also makes clear that
both total and agricultural inputs were subject to upward sloping trend. As consequence,
the competitiveness indicator24 of the agricultural sector as compared to that of sectors’
average improved at constant prices, while it worsened at current prices. In this regard, the
Government gives due attention to the provision of agricultural inputs in the required
quantities and fair prices as well as on time.
Table 2.2. Contribution of agriculture to intermediate consumption, 2002-2009 (SP million, %)
Item At current prices At constant prices of 2000
Average 2002-2004
Average 2007-2009
Average Change %
Average 2002-2004
Average 2007-2009
Average Change %
Total inputs 1 808,746 1,541,795 90.6 739,919 951,332 28.6 Agricultural inputs 2 139,525 193,808 38.9 122,528 125,359 2.3 Share of agriculture % 17.3 12.6 -27.1 16.6 13.2 -20.4 1/GO %* 42.1 38.8 -7.7 41.7 41.4 -0.9 2/agricultural GO %* 34.3 29.2 -15.0 32.6 33.3 2.3 Source: Elaborated from the CBS, the ASA, various issues. * Competitiveness indicator.
Figure 2.3 and Figure 2.4 illustrate a further deliberation of the figures presented in Table
2.2 by main sectors of the economy at both current and constant prices from 2000 to 2009.
Figure 2.3 points out that an increase occurred in the intermediate consumption for all
sectors of the economy, but it was slower in agriculture than in the other sectors. It also
indicates that agriculture occupies the second place in acquiring production inputs (12-
20% at current prices and 13-18% at constant prices) after the mining and manufacturing
sector (48-56% at current prices and 49-52% at constant prices).
Figure 2.3. Intermediate consumption by sectors, 2000-2009 (SP million)
At current prices
0500000
100000015000002000000
2000 2002 2003 2004 2005 2006 2007 2008 2009
SP million
Others
Transport, communication and storage
Wholesale and retail trade
Building and construction
Mining and manufacturing
Agriculture
At constant prices
0
500000
1000000
1500000
2000 2002 2003 2004 2005 2006 2007 2008 2009
SP million
OthersTransport, communication and storageWholesale and retail tradeBuilding and constructionMining and manufacturingAgriculture
Source: Elaborated from CBS, the ASA, various issues.
24 Competitiveness indicator = value of inputs/GO * 100. It has been derived from comparative advantage indicators evaluated at private prices. This indicator is too simple to assess competitiveness because it is very complicated to evaluate competitive performance. Therefore, several measures and methodologies are used to identify competitive behaviors (see Annex 9).

State of Food and Agriculture in Syria 2010
28
Figure 2.4 illustrates the variation in the competitiveness indicator. It clarifies that
agriculture is more competitive than the mining and manufacturing, and building and
construction sectors, but, it is less competitive than the wholesale and retail trade; this
measure improved only in agriculture and transport, communication and storage during the
considered period.
Figure 2.4. Competitiveness indicator by sectors, 2000-2009 (%)
At current prices
0
20
40
60
80
2000 2002 2003 2004 2005 2006 2007 2008 2009
%
Agriculture
Mining and manufacturing
Building and constructionWholesale and retail trade
Transport, communication and storage
Average
At constant prices
0
20
40
60
80
2000 2002 2003 2004 2005 2006 2007 2008 2009
%
AgricultureMining and manufacturingBuilding and constructionWholesale and retail tradeTransport, communication and storageAverage
Source: Elaborated from CBS, the ASA, various issues.
2.3. Contribution of agriculture to the gross domestic product
The share of agriculture in the GDP is higher than its portion in the GO and in the
intermediate consumption, which explains its importance in income generation. This can
be related to Government policies that focus on achieving an improved integration between
outputs, inputs and pricing policies in the agricultural sector25 so that the best possible
profitability is attained. Hence, the agricultural GDP enhanced from SP224 billion in 2000
to SP566 billion at current prices and to SP265 billion at constant prices of 2000 in 2009.
As a result, agriculture came third in income creation (19-25% at current prices and 18-
25% at constant prices of total GDP) after the mining and manufacturing sector (24-32% at
current prices and 23-30% at constant prices of total GDP) and wholesale and retail trade
(Table A2.5 and Table A2.6). The aforesaid trend also prevailed over the 2002-2009 period
when average values are considered as depicted in Table 2.3. Table 2.3 also reveals that the
agricultural GDP grew slower the total GDP leading to a declined share of the former in
the latter over the considered period and that the agricultural profitability was higher than
the average profitability26.
25 See chapter 3. 26 Profitability = GDP/intermediate consumption * 100 (see also Annex 9).

State of Food and Agriculture in Syria 2010
29
Figure 2.5 shows a further diversification of the GDP by major sectors of the economy
from 2000 to 2009 at current prices and at constant prices of 2000. It clarifies that prices
had a substantial impact on the GDP and that the GDP was subject to a steady increase. In
addition, Figure 2.6 presents a disaggregation of the profitability indicator by major sectors
over the same period at both current and constant prices. It indicates that agriculture and
transport, communication and storage alternate in occupying the second place after the
wholesale and retail trade.
Table 2.3. Contribution of agriculture to GDP, 2002-2009 (SP million, %)
Item At current prices At constant prices of 2000
Average 2002-2004
Average 2007-2009
Average Change %
Average 2002-2004
Average 2007-2009
Average Change %
Total GDP 1 1,000,363 2,327,345 132.7 978,685 1,349,243 37.9 Agricultural GDP 2 247,590 469,978 89.8 246,278 250,925 1.9 Share of agriculture % 24.8 20.2 -18.4 25.2 18.6 -26.1 1/inputs %* 123.7 141.8 14.6 132.3 141.8 7.2 2/agricultural inputs %* 177.5 242.5 36.7 201.0 200.2 -0.4 Source: Elaborated from the CBS, the ASA, various issues. * Profitability indicator.
Figure 2.5. Contribution of agriculture to GDP, 2000-2009 (SP million)
At current prices
0500000
10000001500000200000025000003000000
2000 2002 2003 2004 2005 2006 2007 2008 2009
SP million
OthersFinance and insuranceTransport, communication and storageWholesale and retail tradeBuilding and constructionMining and manufacturingAgriculture
At constant prices
0
500000
1000000
1500000
2000 2002 2003 2004 2005 2006 2007 2008 2009
SP million
OthersFinance and insuranceTransport, communication and storageWholesale and retail tradeBuilding and constructionMining and manufacturingAgriculture
Source: Elaborated from CBS, the ASA, various issues.
Figure 2.6. Development of the profitability by sectors, 2000-2009 (%)
At current prices
0
200
400
600
2000 2002 2003 2004 2005 2006 2007 2008 2009
%
Agriculture
Mining and manufacturing
Building and construction
Wholesale and retail trade
Transport, communication and storage
Average
At constant prices
0
200
400
600
2000 2002 2003 2004 2005 2006 2007 2008 2009
%
Agriculture
Mining and manufacturing
Building and construction
Wholesale and retail trade
Transport, communication and storage
Average
Source: Elaborated from CBS, the ASA, various issues.

State of Food and Agriculture in Syria 2010
30
2.4. Contribution of agriculture to employment and income
The labour force 15 years and over amounted to 5,442 thousand workers in 2009, of which
4,638 thousand workers are males (85%) and 804 thousand workers are females (15%). In
the same year, the total labour force constituted 27% of the total population; the male
labour force accounted for 45% of the male inhabitants and the female labour force
attained 8% of the female residents. The employed workers 15 years and over, on the other
hand, totaled 4,999 thousand persons in 2009 that were divided into 4,374 thousand males
(87%) and 625 thousand females (13%). The private sector absorbs 71% of these
employees, while the public sector employs the rest. In this regard, agriculture contributes
considerably to employment. It employed 758 thousand workers in 2009, which constitute
15% of the employees. This figure is divided into 636 thousand males (15% of the male
employees) and 122 thousand females (20% of the female employees). The public sector
absorbs only 1.4% of these agricultural employees, whereas the private sector employs the
rest because the most of agricultural activities are performed privately. Figure 2.7
illustrates a further clarification of this agricultural employment as compared to that of the
other sectors of the economy (Table A2.7) confirming the importance of agricultural
occupation in job creation to comply with the relatively high population growth.
Figure 2.7. Distribution of employees by sectors, 2009 (employee)
0
200,000
400,000
600,000
800,000
1,000,000
1,200,000
1,400,000
Employee
Source: Elaborated from CBS, the ASA, 2010.
Furthermore, Table 2.4 includes some performance indicators related to employment from
2002 to 2009 (Table A2.8). It indicates that the average per capita real income increased,
while that in agriculture decreased. It also clarifies that agricultural labour profitability
enhanced at a substantially higher rate than that of the average labour profitability and that

State of Food and Agriculture in Syria 2010
31
there was an improvement in the indicator of economic efficiency27 of agriculture due to
both the enhancement in agricultural GDP and the decline in agricultural labour force. The
value of the aforementioned indicators was affected positively by the occurred price
increase over the considered period.
Table 2.4. Some labour force indicators, 2002-2009
Item Unit Average
2002-2004 Average
2007-2009 Average change 2002-2009 (%)
Real per capita GDP SP/capita 59,069 67,812 14.8 Real per capita agricultural GDP SP/capita 29,619 27,243 -8.0 At current prices Average labour profitability* SP/employee 214,259 481,196 124.6 Labour profitability of agriculture** SP/employee 183,290 496,464 170.9 Economic efficiency of agriculture 0.9 1.0 20.0 At constant prices of 2000 Average labour profitability SP/employee 199,247 279,313 40.2 Labour profitability of agriculture SP/employee 174,487 265,197 52.0 Economic efficiency of agriculture 0.88 0.95 8.4 Source: Elaborated from CBS, The ASA, various issues. *Average labour profitability = Real GDP/total labour force. **Labour profitability of agriculture = real agricultural GDP/agricultural labour force.
2.5. Contribution of agriculture to trade
The Government seeks to enhance and liberalize both total and agricultural trades so that
the overall performance is improved. Both trades have substantial impact on the
improvement of the balance of payment, GDP, income, economic efficiency of domestic
production and food security situation of the country. Agricultural trade influences
considerably total trade (Table A2.9). Its impact, however, relies heavily on the goodness
of agricultural seasons that is affected extensively by the level of rainfall and drought
spells. This is illustrated in Table 2.5 for the 1999-2009 period. Table 2.5 indicates that
there was an improvement in both total and agricultural trades over the considered period,
but, total trade grew at a higher rate than that of agricultural trade leading to a decreased
share of the latter in the former and in GDP (Figure 2.8).
27 Indicator of economic efficiency of agriculture = share of agriculture in GDP/share of agriculture in labour force. Again, this indicator is too simple to assess economic efficiency because efficiency is a very complicated phenomenon. Therefore, several measures and methodologies are used for its assessment (Annex 9).

State of Food and Agriculture in Syria 2010
32
Table 2.5. Evolution of total and agricultural trades, 1999-2009 (US$ million, %)
Item Average
1999-2001 Average
2002-2004 Average
2007-2009 ACH %
2002-2009 ACH %
1999-2009 Total trade (1) 8,687 12,530 28,407 126.7 227.0 Agricultural trade (2) 1,666 2,329 3,071 31.9 84.3 Share of agricultural trade % (2/1) 19.2 18.9 11.0 -42.1 -42.9 Total exports (3) 4,486 6,478 12,555 93.8 179.9 Agricultural exports (4) 801 1,179 1,283 8.9 60.2 Share of agricultural exports % (4/3) 17.9 18.3 10.7 -41.7 -40.3 Total imports (5) 4,201 6,053 15,852 161.9 277.3 Agricultural imports (6) 864 1,150 1,788 55.5 106.9 Share of agricultural imports % (6/5) 20.6 19.4 11.4 -41.2 -44.6 Source: Elaborated from the NAPC, Annual Report of Syrian Agricultural Trade, 2008-2009, and CBS, the ASA, 2009.
Figure 2.8. Evolution of the respective shares of total and agricultural trades in GDP, 2002-2009 (%)
0.010.020.030.040.050.060.070.0
2002 2003 2004 2005 2006 2007 2008 2009
%
Share of total trade in GDP
Share of agricultural trade inagricultural GDP
Source: Elaborated by the Rapporteur from NAPC and CBS databases. 2009 data are still provisional.
Finally, in 2008, the number of trading partners amounted to 21 countries for exports and
11 states for imports, the most important of which are Arab countries and the European
Union (EU); as a consequence, the trade volume valued US$10,529 million with Arab
countries accounting for 31.7% of total trade and US$10,369 million with the EU
amounting to 31.2% of total trade. In line with this progress the revealed comparative
advantage indicator28 (RCAI) improved, but, Syrian exports and imports remained heavily
concentrated as indicated in the share of the most important five trading partners, which
amounted to 92% for exports and 94% for imports in 2008.
2.6. Contribution of agriculture to investment
Syria has attempted to reach an economic environment that enhances, fosters, increases,
diversifies and supports investment so that sustainable growth is achieved. As a result,
Syria is aware of providing best facilitates to encourage investment. These promotions
comprise issuing new regulations, introducing many tax exemptions and providing several
investment incentives to attract both local and foreign investors in the country especially
28 See Annex 9 and NAPC, Syrian Agricultural Trade (SAT), 2008-2009.

State of Food and Agriculture in Syria 2010
33
Arab business men in the context of the execution of the GAFTA. These investments are
managed either by the public sector or by the private sector. The latter comprises private,
cooperative and joint-venture agents. All the aforementioned investments have to comply
with the objectives of the economic, social and rural development in Syria. In this regard,
agricultural investment plays a dominant role owing to its importance for both food
production and the enhancement of the performance of the national economy. Table 2.6
illustrates the development of the aforesaid investments and their return considering
current and constant prices (base 2000) from 2002 to 2009 (Table A2.10, Table A2.11 and
Table A2.12).
Table 2.6. Development of investment, 2002-2009 (SP million, %)
Item At current prices At constant prices of 2000
Average 2002-2004
Average 2007-2009
ACH % 2002-2009
Average 2002-2004
Average 2007-2009
ACH % 2002-2009
Total investment 243,532 424,209 74.2 228,346 282,229 23.6 Public investment 142,217 177,330 24.7 134,286 130,986 -2.5 Private investment 101,315 246,879 143.7 94,060 151,243 60.8 Agricultural investment* 35,181 36,387 3.4 33,223 25,017 -24.7 Share % Public investment 58.8 41.8 -29.0 59.2 46.3 -21.7 Private investment 41.2 58.2 41.3 40.8 53.7 31.5 Agricultural investment 14.6 8.6 -41.2 14.7 8.9 -39.6 Return to investment %** Total investment 462 536 16.0 459 478 4.1 Agricultural investment 760 1,289 69.5 771 1,001 29.8 Source: Elaborated from CBS, the ASA, various issues. * Agricultural investment includes investment related to both the MAAR and the Ministry of Irrigation. ** Return to investment = GDP/investment * 100.
At current prices, Table 2.6 reveals in terms of value that all kinds of investment improved
and private investment enlarged substantially as compared to public investment; as a
consequence, the share of private investment in total investment increased, whereas that
related to public and agricultural investments decreased; on the return side, return to
agricultural investment augmented at a considerably higher rate than that referred to total
investment. At constant prices, on the other hand, public and agricultural investments
declined in terms of value, while private investment maintained its improvement; this trend
also applies to the share of the various investments in total investment. In-depth, Figure 2.9
verifies the total investment by the various sectors of the economy from 2000 to 2009. It
also confirms that the share of agricultural investment in total investment declined over the
considered period, thus, contradicting the Government orientation to increase this kind of
investment complying with its contribution to the GDP.

State of Food and Agriculture in Syria 2010
34
Figure 2.9. Development of investment by sectors, 2000-2009 (%)
0%
10%
20%
30%
40%
50%
60%
70%
80%
90%
100%20
0020
0220
0320
0420
0520
0620
0720
0820
09
At current prices
Other sectors
Dwellings
Transport,communicationand storage
Mining andmanufacturing
Agriculture
0%
10%
20%
30%
40%
50%
60%
70%
80%
90%
100%
2000
2002
2003
2004
2005
2006
2007
2008
2009
At constant prices of 2000
Other sectors
Dwellings
Transport,communicationand storage
Mining andmanufacturing
Agriculture
Source: Elaborated from CBS, the ASA, various issues.
2.7. Backward and forward linkages of agriculture
There are numerous players in the Syrian agricultural sectors comprising cooperative and
private farmers, public institutions, public establishments, private firms, joint-venture
companies and private associations (Annex 8).
According to the various Agricultural Censuses conducted by the CBS, 1970, 1981, 1994
and 2004, the number of agricultural holders increased from 528 thousand in 1970 to 660
thousand in 2004 resulting in a decline in the holding size of the cultivable land from 11.1
ha/holder in 1970 to 8.3 ha/holder in 2004. Of course, this holding size varies among
governorates, where the smallest holding size prevails in Lattakia (about 2 ha/holder) and
the largest one is in Al-Raqqa (about 28 ha/holder). Furthermore, the northeastern
governorates are characterized by large holdings comprising Al-Raqqa (27.8 ha/holder),
Al-Hassakeh (18.2 ha/holder) and Aleppo (12.2 ha/holder), whereas the holding size in the
other governorates varies from small to medium.
The aforementioned farmers are linked backward to the rest of the world and local public
and private input suppliers. The input suppliers provide improved seeds, chemicals,
fertilizers, equipment, machinery, credits, livestock services, energy and others. Public
agents provide improved seeds through the GESM and the GCASR, which are related to
the MAAR, feed through the General Establishment for Fodder (GEF), which is related to
the MET, chemical fertilizers, credits and containers through the ACB, containers through
the General Establishment for Grain Trade and Processing (GEGTP); compulsory control
materials and other services through the MAAR, the General Peasant Union, public
fertilizer companies and public companies for machinery and agricultural equipment, and

State of Food and Agriculture in Syria 2010
35
energy through the establishments of both the Ministry of Industry (MOI) and the Ministry
of Electricity. Moreover, additional services are supplied by Agricultural Chambers and
cooperatives. In contrast, private input suppliers are many totaling 656 agents29 and are
operating in the field of imported seeds, fertilizers, pesticides and bulbs (60 agents),
imported irrigation equipment (26 agents), imported agricultural machinery (82 agents),
locally produced fertilizers and insecticides (25 firms), locally produced irrigation
equipment (23 firms), locally produced agricultural equipment and tools (59 firms),
locally produced containers and packing materials (36 firms), landscaping (21
companies), consulting and marketing (28 agents), locally produced one-day-old broiler
and layer chicks (55 firms), poultry equipment (13 firms), traded veterinary products (45
agents), veterinary medicines and materials (26 firms), traded feed and additives (29
agents), processed feed (115 establishments) and processed production inputs (13 firms).
Furthermore, there are numerous national, regional and international research authorities
operating in the agricultural sector to provide services. Accordingly, it can be said that
input supplies are subject to a competitive environment.
On the other hand, agriculture is linked forward to agro-industrial firms, wholesale and
retail markets, storage facilities, slaughter houses, packing, sorting and grading
establishments and rest of the world. Therefore, farmers deal with many traders in the
district and central wholesale markets as well as in the retail markets30. They are also
linked to the GEGTP and the GEF, which are involved in the marketing of grain products.
Additionally, a minor outlet for farmers is the General Organization for Storage and
Marketing (state company), which nowadays plays a minor role in the market. In this
regard, the number of registered exporters and importers for fruits and vegetables amounts
to 87 agents and the number of registered exporters and importers for agricultural crops
accounts for 28 agents. These players deal with many establishments specialized in sorting,
grading and packing. Furthermore, a typical wholesale market is Souq el Hal, the general
market for fruits and vegetables present in each governorate capital. In Damascus Souq el
Hal, around 400 traders operate, of which about 50% are commissioners and 50%
wholesalers or semi-wholesalers. Hence, shipping agricultural products to domestic and
foreign markets occurs under a competitive environment.
29 Syria Farming Directory 2002 and NAPC Database. 30 See Rama (2000).

State of Food and Agriculture in Syria 2010
36
Finally, the chain coordination is conducted either through open market operations or
through contracts.
2.8. Factors constraining the performance of the agricultural sector
The agricultural sector faces many domestic and foreign constraints and challenges, which
affect its performance and sustainable development, such as:
Decrease in the execution rates of agricultural products as compared to the planned
targets due to the drought spells especially over the 2006-2009 period and to the
changing climatic conditions.
Limited availability of water resources following the decline in the precipitation
rate. This evidence is exaggerated by the slow adoption of advanced irrigation
technologies because of the lack of credits and administrative obstacles.
Continuous degradation and desertification of natural pastures in Al-Badia (Syrian
steppe) as result of the intense tillages and overgrazing, spontaneously moving
machinery and droughts, which affect negatively the availability of the fodder for
the sheep population. Al-Badia also suffers from the weak infrastructure and the
lack of integrated efforts to develop it (health, education, farming, fodder storage
establishments, water, wells, roads, pastoral farming, protection zones, etc.).
Fragmentation of some agricultural holdings to the extent that investment and the
introduction of mechanization are restraint. Serious actions to limit the impact of
this phenomenon are limited.
Non-compliance of regulations with the development of agricultural production.
Increase in the international prices of agricultural inputs, which impacts negatively
the performance of agricultural production comprising both crop and livestock
productions.
Augmentation of fuel prices, which leads to a decreased execution rate of irrigated
agriculture especially that is performed on deep wells.
Expansion of buildings and constructions so that agricultural lands are replaced in
spite of the presence of regulations that prohibit this action.
Weakness of marketing channels as compared to the development of agricultural
production and international marketing specifications.

State of Food and Agriculture in Syria 2010
37
The relatively high population growth, limited employment opportunities for
agricultural labour and low farmers’ income as compared to the other sectors of the
economy, which induce a continuous emigration from rural to urban areas.
Low execution rate of land reclamation by fruit trees projects due to the absence of
incentives.
Absence of a security fund for farmers to help them in the case of unfair
agricultural conditions such as droughts, frost, flood, etc.
Limited agricultural investment in the private and joint sectors as the result of both
weak financial resources and investors’ fear to invest the agricultural sector due to
risk and long duration of the capital recovery.
Lack of coordination between the numerous institutions responsible for the
management of the agricultural sector.
2.9. Agricultural sector in the next period
Agriculture has performed well over the 1999-2009 period owing to the economic reform
and adjustment programmes undertaken by the Government. However, there has been a
series of challenges that still impacting the outcomes of the agricultural sector negatively.
Therefore, there is an urgent need to mitigate the negative impacts of these constraints to
upgrade the efficiency of agriculture, to make more coherence between agriculture and the
backward and forward stages of the value chain and to comply with the needs of regional
and international markets through the:
enhancement of agricultural production both plant and animal productions and
economic growth of the sector to achieve an overall rural development that
improves producers’ income, reduces poverty, supplies the national economy with
major food products and accomplishes food security;
economic and rational use of natural resources (land, water, forestry, pastures and
fishery) considering their sustainability to avoid their deterioration, excessive use
and contamination;
provision of agricultural products for both agro-industry and exports and
improvement of agricultural marketing and processing to increase the value added
and exports, to improve the domestic and traditional industries and to create
income-generating projects in rural areas;

State of Food and Agriculture in Syria 2010
38
modernization of production tools, expansion and implementation of modern
technologies considering their better use, supply and distribution of production
inputs taking into account their better quality and their provision on time and in
fair prices, development of the ASR, extension service and capacity building, and
improvement of the infrastructure and services in rural areas;
improvement of the finance system to enhance and modernize agricultural
production and to attract domestic, regional and international investments into the
agricultural sector;
adoption of pricing and marketing policies that focus on increasing agricultural
production and its availability, improving quality and competitiveness and
supporting the agricultural sector complying with the procedures adopted by other
countries and WTO; and
implementation of institutional and structural adjustments complying with the
progress attained by the agricultural rural development, improvement of the
standard of living of producers and poverty reduction.
The achievement of the above mentioned objectives has been considered in the 11th FYP
(2011-2015).

State of Food and Agriculture in Syria 2010
39
Chapter 3 – Agricultural and food strategies and
policies
Economic reforms have speeded up in recent years due to economic policies followed by
Syria to improve competitiveness, to strengthen the integration in the world economy and
to attain a balance between remarkable economic outcomes and social justice.
Additionally, these policies have started to comply with fast economic developments by
strengthening the role of the private sector in the national economy and improving the
legislative environment. As a consequence, the GDP has been enhanced, unemployment
rate has been reduced, exports and investments have been promoted, infrastructure has
been improved, productivity has been upgraded, and many regulations have been issued.
The latter have dealt with fiscal, monetary, tax, and banking issues, the improvement of the
investment environment, the liberalization of foreign trade, the simplification of trade
constraints, the facilitation of currency exchange procedures, the achievement of
institutional modernization and administrative reforms.
Based on the above, many strategies and policies have been proposed, which are presented
below.
3.1. Strategies
Strategies in place have helped agriculture and agro-industries increase their contribution
to production, processing, trade and several economic aggregates. In this regard, special
emphasis is placed on the SAS (2001-20100), which was approved by the Memo no. 85
dated 12/24/2000, Strategy of the Transformation Industries (STI), 10th FYP (2006-2010),
which was approved by Law no. 25 dated 5/7/2006, Investment Strategy and Strategy of
the Social Market Economy (SME). These strategies are impacted to a great extent by the
United Nations Assistance Development Framework (UNDAF), Strategy of the Food and
Agriculture Organization of the United Nations (FAO) to develop agriculture, forestry and
fishery, and Arab Strategy for Agricultural Development until 2025 (Annex A3.1, Annex
A3.2 and Annex A3.3).

State of Food and Agriculture in Syria 2010
40
3.1.1. SAS and the 10th FYP
The major focus areas of the SAS are: agricultural policies, crop production, livestock
production and animal health, agricultural resources and rural development policies,
agricultural production inputs and agricultural supporting services. The Government
focuses on these priority areas to attain the following aims:
improvement of producers’ income;
enlargement of the contribution of agriculture to the GDP;
expansion of the cultivated area comprising both irrigated and rain-fed farming
systems;
optimal utilization and conservation of natural resources;
self-sufficiency of the main staple foods;
enhancement of the Syrian product competitiveness and introduction of alternative
crops;
introduction of modern technologies;
development of agro-processing and marketing activities;
enhanced value added and exports.
In line with the above, the 10th FYP includes a specific chapter to develop agriculture and
irrigation. This chapter incorporates qualitative and quantitative targets, which are followed
by both the MAAR and the MI.
The qualitative aims comprise the following:
enhancement of the agricultural production and economic growth of the sector to
achieve an overall rural development that focuses on improving producers’ income,
reducing poverty, supplying the national economy with major food products and
achieving food security;
efficient and sustainable use of natural resources (land, water, forestry, pastures and
fishery);
provision of agricultural products for both agro-industries and exports and
improvement of post-harvest operations so that the value added, exports and the
traditional industries are improved, and income-generating projects in rural areas
are enhanced;

State of Food and Agriculture in Syria 2010
41
amelioration of production tools, expansion and introduction of modern techniques
considering their better use, distribution of production inputs taking into account
better quality, time and fair prices, development of the ASR, extension service and
capacity building, and enhancement of the rural infrastructure;
improvement of the finance system to enhance and modernize agricultural
production and to attract domestic, regional and international investments into the
agricultural sector;
adoption of pricing and marketing policies that enhance the performance of the
agricultural sector complying with the procedures adopted by other countries and
the World Trade Organization (WTO);
introduction of institutional and structural adjustments in the sector.
The quantitative targets focus on:
achieving an AGR of 4 percent by investment in place. This induces an
employment rate of 9.2 percent annually by the MAAR;
increasing the cultivated land by 0.8 percent annually because of the limited ability
to add additional areas, while the area of rain-fed fruit trees can be expanded by 2.1
percent annually;
enhancing the production of wheat, cotton and sugar beet by 2.6 percent, 0.49
percent and 1.6 percent annually, respectively;
enlarging the production of some fruit trees by 3.5-11 percent annually and
decreasing the production of grapes by 6 percent annually;
ameliorating the yield by 3-5 percent annually for some irrigated crops and by 1-2
percent annually for some non-irrigated produce;
attaining an annual increase of 2.4 percent for red meat, 5 percent for milk, 4.4
percent for poultry, 1.7 percent for fish, 7 percent for honey and 4.7 percent for
eggs;
transforming about 50 percent of the land irrigated by traditional irrigation schemes
into areas irrigated by modern technologies;
developing the rate of the irrigation water utilization from 50 percent to 80 percent
in the lands undergoing modern irrigation methods;
expanding the drainage nets by 10 percent annually in the lands exposed to
drainage constraints and salinity especially in Euphrates Basin;

State of Food and Agriculture in Syria 2010
42
reducing the excessive use of ground water by 10 percent annually by decreasing
the irrigated land from non-renewable ground water and unlicensed wells,
cultivating rain-fed crops and improving the efficiency of water harvesting;
increasing the number of technicians, experts and analysts by 25 percent,
considering that they are able to deal with the integrated water management and its
related softwares;
To put the above-mentioned objectives into practice, the 10th FYP adopted a successful
policy to manage natural resources, control their distribution and quality, maintain their
sustainability and enhance their efficient use complying with the economic reform
programmes of the Government. This overall policy consists of seven major objectives, 32
strategies and 107 sub-policies. Accordingly, the MAAR proposed 34 sub-objectives and
78 indicators to be followed quarterly.
3.1.2. STI and the 10th FYP
The STI focuses on the development of the agro-industrial sector to be more:
able to contribute to the economic and social development of the country and to job
creation;
capable to compete relying on innovations and diversity;
stable and efficient backward and forward;
technologically powerful to increase the value added by enhancing R and D,
training and adequate management;
competent to increase the GDP and the balance of payments;
focused on the improvement of the livelihood of its labour force;
efficient in sustaining the environment;
active in producing high value-added products;
placed on the establishment of new and advanced work relations, employment and
training of the new staff, efficient resource management and production of high
quality products complying with international standards;
contributing to the development of the least-developed areas.
The 10th FYP of the industrial sector, which is based on the STI, is followed up by the
MOI. Again, this plan aims at upgrading the performance of the agro-industrial sector both
qualitatively and quantitatively.

State of Food and Agriculture in Syria 2010
43
The qualitative indications are as follows:
increase the contribution of the sector to the GDP by strengthening the institutional
capacity of the public industrial sector and training its staff, expanding the role of
the private sector comprising national, Arab and international agencies in agro-
industrial development and providing an attractive investment environment;
develop both the structure and the productive capacity of the Syrian industries;
reform the structure of the current industrial establishments to operate according to
profitability rules;
enhance the industrial competitiveness so that the export ability is upgraded;
create job opportunities in general and new jobs with high education in particular,
and improve the income and income distribution especially in rural areas;
raise the share of contributing and cooperative companies.
The quantitative goals focus on:
increasing the industrial GDP by 15 percent annually;
enhancing the contribution of the sector to the GDP to be 15 percent by 2010;
enlarging the investment by 7 percent annually according to the first scenario and
by 5 percent owing to the second scenario;
amplifying employment by 10 percent annually over the 2006-2010 period,
improving the educational level so that the share of graduates from general and
vocational secondary schools, middle institutes and universities attains 60 percent
of the labour force;
enlarging industrial exports by 10 percent annually over the 2006-2010 period
considering those achieving medium and high value added;
3.1.3. Nutrition strategy (NS)
The NS is followed up by the Ministry of Health (MOH) to attain the following:
improving the nutritional status of the most vulnerable groups that are frequently
exposed to malnutrition such as children, students, pregnant and breast feeding
women, and elderly;
attaining the MDGs by eliminating abject poverty and hunger, achieving complete
basic education for both sexes, reducing child mortality, improving gender equity,

State of Food and Agriculture in Syria 2010
44
enabling women, combating HIV/AIDS31, malaria and other diseases, providing
sustainable environment and enhancing international partnerships;
enhancing breast and complementary feeding;
continuosely investigating the nutritional status of the population and taking actions
to improve it;
combating micro nutrients deficiency especially vitamin A, iron and iodine.
3.1.4. Investment strategy
Since the 1980s, market-led growth has been in place to enhance the performance of the
Syrian economy. Following this footstep, the focus has been on the enhancement of private
investment, efficacy and livelihoods of the population. In this regard, investment
promotion has been instrumental.
Therefore, policies have identified investment priorities, provided facilities, support and
special treatment such as land provision and tax exemption on business profit, and have
promoted investment that take care of sustainable agricultural and agro-industrial
development. Parallel, priority has also been given to the establishment of projects that
supply agricultural and agro-industrial inputs. In this context, the most important
underpinnings for project approval are:
project coherence with the development objectives of the country;
project use of indigenous resources- projects sourcing most of their inputs locally
are highly favored;
project contribution to employment creation and development of the national
economy;
project involvement in increasing exports and/ or reducing imports;
introduction of advanced technologies that comply with national economy needs.
3.1.5. Social Market Economy (SME)
The idea of the SME has both social and economic dimensions. Basically, it relies on
balancing between the market regime resulting from the interaction between supply and
demand, and the principles of competition and profit making, on the one hand, and the
welfare regime and social development on the other. However, this situation is restricted
from two sides: the economic side, which is individually profitable, is driven by the
31 HIV: Human Immunodeficiency Virus; AIDS: Acquired Immunodeficiency Syndrome.

State of Food and Agriculture in Syria 2010
45
capitalist market; and the social side, governed by the collective interest, is linked to the
priorities given to society over the market. As for achieving the balancing process, it
should be based on strategic planning, management and education that in the long and
medium terms can affect the factors that connect economy and society. In a truly free
market, central state planning is not possible or effective. Nevertheless, in a social market
economy, state intervention is required to set certain balances between private profits and
public social development objectives, and to rationally control the market mechanism
according to the social development targets. That is to say, the state role is to attain social
justice by changing the economic and social consequences of the market system, which
discriminates by polarizing profits and welfare. In another sense, the social market is
considered as a socio-economic regime targeting economic and social growth. Thus,
balancing both dimensions (the market and society - individual gain and social welfare) is a
must to increase gains and social development. High economic growth may not always
lead to social development, thus state intervention is needed in planning and managing the
economy. Flexibility of the social market economic management is also needed because
the growing pressures for social development increase the economic requirements that
support that development, continuously renewing demands for enhanced productivity,
value added, and general economic development. Currently, the world problem of
balancing wages and profits (the present labour problems in France and Germany are
examples) proves the close connection between the market and society and requires
balancing the profits and welfare comprehensively and institutionally, taking into account
the effects of globalization.
Hence, both agriculture and agro-industries have been transformed from a relatively closed
market to a more open environment that enables both sectors to integrate with the world
economy at a high pace. As a result, export and import restrictions were eliminated for
GAFTA countries. This action also applies to other countries that have bilateral trade
agreements with Syria such as Turkey and the EU. As a consequence, numerous free trade
zones have been established between these countries and Syria. This enabled Syria to be
accepted as an observer in the WTO in 5/4/2010.
3.2. General objectives of agricultural policies
The general orientation of agricultural policies in Syria can be presented as follows:

State of Food and Agriculture in Syria 2010
46
Enhancing capacity in the field of environmental and cost-benefit analysis of
service-oriented projects and enterprises. This task requires conducting specialized
training courses to acquire the needed staff and providing finance for those in the
amount of 3% of the Government budget dedicated to the development of the
agricultural sector. Parallel, the execution of feasibility studies for these projects is
needed to link their performance to the proposed production-oriented and financial
objectives.
Setting up economic priorities for the production of agricultural products.
Producing according the comparative advantage principle considering all
production areas, sustainability of natural resources and economic and social
aspects.
Increasing the productivity of all agricultural products by adopting an integrated
approach to use agricultural inputs.
Introducing cropping structures that yield high economic returns especially per unit
of water. This has to be coupled with improving the economic and technical
efficiency of water use and establishing water treatment stations of the drainage
water to use it safely for irrigation and to reduce the water deficit.
Improving the integration of the agricultural sector with the other sectors of the
economy and providing the former with the needed investment complying with its
contribution to the GDP. At the same time, a gradual approach has to be adopted to
adapt to the changing environment in both the region and the world to avoid the
negative impact on agricultural production resulting from these alterations.
Enhancing the ASR, extension service, education and training accompanied with
introducing advanced technologies. Simultaneously, strengthening the coordination
of the aforesaid activities is required so that the ability of extension instructors is
upgraded to enable them conducting specialized extension programmes by
producers.
Continuously changing regulations especially those related to the fragmentation of
the size of holding.
Promoting the establishment of specialized marketing agencies by all sectors
(public, private, cooperative and joint) to improve marketing opportunities,
competiveness and efficiency.

State of Food and Agriculture in Syria 2010
47
Enhancing the contribution of farmers’ organizations and agricultural chambers to
production and marketing.
Encouraging the production of export-oriented, competitive products as well as
organic products and facilitating the marketing of those.
Producing high yielding varieties and races to be used by agricultural producers.
Inducing livestock production and strengthening its integration with crop
production especially in the field of fodder provision, development of pastures and
protection of pastoral zones.
Ensuring biodiversity and sustainability.
Strengthening the coordination with Arab, regional and international agencies
concerned with the development of agriculture to enhance the execution of the
proposed policies and capacity building.
3.3. Macro and agricultural policies
These policies comprise aspects related to money, finance, trade, investment and others.
3.3.1. Monetary and fiscal policies
The Government has attempted over the 10th FYP to develop the monetary regime and to
facilitate the exchange of foreign currency. These policies during the 2004 – 2008 period
aimed at liberalising the monetary sector from one hand and attaining a balance between
monetary and commodity flows and stabilization of prices on the other. Therefore, many
decrees and decisions have been issued with the purpose of improving monetary policies to
be consistent with economic reform requirements. Some of these regulations focused on
establishing the Credit and Monetary Council to oversee monetary, credit, and banking
policies and to regulate related institutions and administrations according to the state
general strategy and national economy needs, giving larger space to the Central Bank of
Syria to participate in designing the monetary policy, monitor its implementation and
ensure monetary stability by the means of regulating the monitory market, controlling
foreign exchange supply, ensuring a balance between the banks available resources and
uses of foreign currencies and stabilizing the SP exchange rate against other currencies.
In line with the above, the multiple exchange rates were unified to reach an exchange rate
that is based on scientific basis and close to the real one, thus, reflecting the actual
exchange rate for the SP according to the actual market situation within a balanced

State of Food and Agriculture in Syria 2010
48
economy. In this regard, Decision no. 5787 dated 12/20/2006 stipulates that a unified
exchange rate has to be used for Government transactions, whereas the exchange rate for
the private sector is determined by international exchange rate. In addition, a surplus of
foreign currency was secured, a decoupling of the SP with the United States dollar was
initiated in 2007 to be linked to a basket of foreign currencies32 and the Central Bank of
Syria has been given the authority to intervene in the currency market and to identify the
currency fluctuations. The aforementioned actions contributed to the stability of both the
exchange rate of the SP and the Syrian economy.
Another positive impact on monetary policies resulted from the increased number of banks
from 2006 to 2009 especially after issuing the Law of Establishing Private Banks. The
number of banks and their branches enlarged by 39.2% over this period, while the number
of private banks and their branches amplified by 230% for the same period (Table 3.1).
Table 3.1. Development of banks and their branches, 2006-2009 (bank)
Item Central Bank
Commercial Bank
of Syria
IndustrialBank
AgriculturalCooperative
Bank
Real EstateBank
PopularCredit Bank
Savings Bank
Private Banks
Total
2006 11 53 17 106 19 63 13 50 332 2007 11 56 17 106 20 63 13 78 364 2008 12 58 17 106 20 63 13 105 394 2009 12 63 17 106 22 64 13 165 462 Source: Elaborated from CBS, the ASA, various issues.
Several regulations and agreements have been initiated to enhance the contribution of the
aforementioned banks to the national economic development process, mainly:
Decision no. 348 of 2008 that allows banks providing foreign currency loans to
investment projects licensed under the Investment Promotion Law, provided the
utilization of these loans is tailored to specific project needs.
Decision of the Monetary and Credit Council no. 460 of 2009 that authorizes banks
to request the support of the Central Bank of Syria if they have a liquidity deficit
resulting from funding investment projects.
Law no. 25 of 2009 that permitted increasing the nominal capital of the Real Estate
Bank, the Saving Bank, the Popular Credit Bank and the Industrial Bank from
SP1.5 billion to SP10 billion over three years’ time after its issuance.
A decision was made to increase at least the capital of private banks to SP10 billion
and that of the Islamic banks to SP15 billion over 3-5 years.
32 The relative weights are 44% for the United States dollar, 34% for the Euro and 11% for pound sterling and yen (Syriasteps.com).

State of Food and Agriculture in Syria 2010
49
The Institution for Credit Risk Guarantee was established in 2009 aiming at
encouraging banks to finance important investments as well as small and medium
enterprises.
A loan agreement has been concluded with the Arab Monetary Fund to provide
US$45 million to support the financial and banking sector reform in Syria.
Moreover, an agreement has been accomplished to open Turkish banking
representation offices in Syria and to establish a Syrian-Turkish bank with a capital
of US$100 million to enhance trade flow between the two countries.
As for agriculture, agricultural activities are funded by the ACB, which provides short,
medium and long-term loans for public, cooperative, and private agents. These loans are
used for financing both plant and livestock productions, poultry farms, irrigation, land
reclamation, greenhouses, tractors, harvesters, and other agricultural machines and
equipment. The ACB is also concerned with natural resource development and
preservation; it finances activities that enhance the adoption of modern irrigation
technologies (sprinkle and drip) as well as the establishment of water tanks for wells-
irrigated lands. The aforementioned credits are supplied in-kind and/or in-cash. In-kind
loans are provided mainly for seasonal activities, where in-cash ones are dedicated to
medium and long-term investments in agriculture.
In-depth, short-term loans are given in-kind for seeds and fertilizers and in-cash for
agricultural operations. Their reimbursement has to occur within a period not exceeding
300 days. Their interest rates vary according to both the volume of the credit and the
customer as follows: 6% for public and cooperative sectors and 8% for individuals and the
joint sector. These credits have to be repaid by the first of August for winter crops and by
the first of December for summer crops. Another possibility to acquire credits is the
medium-term loans (maximum duration of 5 years). They are used to finance greenhouses,
animal purchase, construction of irrigation channels, poultry farm equipment, land
reclamation, fence and terrace construction, and banana plantations. These loans bear an
interest rate of 7-10%. Additionally, long-term loans are provided for a period not
exceeding 10 years. They are intended for land development and improvement, storage
facilities including cold storage units, forestation projects and fruit trees crops and have an
interest rate of 8-11%. In this regard, in order to help farmers overcome the effects of
drought spells, the ACB reschedules or shifts the repayments of credits accompanied with

State of Food and Agriculture in Syria 2010
50
waiving all overdue interests and deferral penalties. This action was in place in 2002 and in
the 2007-2009 period.
The interest rate of the aforementioned loans is subject to continuous changes. The last
adjustment was in 2008 as presented in Table 3.2.
Table 3.2. Interest rate of the ACB (%)
Credit type Public and cooperative
sector Cooperative
members Private individuals
and joint sector Short-term 6 7 8 Medium-term 7-8 8-9 9-10 Long-term 8-9 9-10 10-11 Delay interest 12 12 12 Source: Elaborated from the ACB, Decision 64 of 2008.
Additionally, the ACB provided credits for adopting new irrigation techniques, enabling
women and reducing poverty in the amount of SP316 million in 2008, where this sum of
money valued SP125 million in 2007.
The aforesaid loans of the ACB increased from SP7.7 billion (average (1999-2001)) to
SP9.4 billion (average (2006-2008)), and from SP6.9 billion in 2005 to SP80 billion in
200933.
Besides the ACB as a sole governmental source for agricultural credits, the private sector is
considered as another donor for producers and households. The reasons behind resorting to
this sector are: the overdue installments and loans to the ACB, which deprive producers
from demanding other loans, or induce them to escape the routine and red tape procedures,
which waste the time and effort of the borrower, or constitute a constraint to extend
guarantees for the repayment on the due date. This source of funding is used to purchase
tools, equipment, machinery, and production inputs such as fertilizer, seeds and pesticides
from traders on a credit basis, confirmed in a simple contract which includes the price and
way of payment. A relatively high interest rate is added to the price in this case. In this
regard, exporters, traders and investors of cold storage units may finance producers in
exchange for buying the production in preferable prices. In addition, the Industrial Bank
and private banks provide credits.
Several regulations related to the abovementioned macro and agricultural monetary
policies were issued over the 2007-2011 period such as:
Decree no. 15 of 2007, which allows the Monetary and Credit Council to license
the creation of social banking agencies.
33 Also see chapter 1.
State of Food and Agriculture in Syria 2010
51
Decree no. 28 of 2009, which exempts the not repaid loans of the ACB until
12/31/2011 from penalties.
Decree no. 30 of 2009, which waives the overdue interests related to the loans
drawn from the Fodder Fund when these credits are repaid.
The official inauguration of the Syrian stock market in March 2009, which is
considered as an important step towards creating a modern financial system and an
essential element of economic growth and development.
Legislative Decree no. 60 of 2007, by which the treasury bonds market was
established to issue state treasury bonds.
The Syrian fiscal policy, on the other hand, intends to increase the state treasury resources,
control and rationalize the public expenditure, enhance economic growth rate, reform the
financial and taxation systems so as to be used as a tool for investment attraction, and
achieve a fair taxation management that helps control tax evasion. This policy also aims at
addressing the state budget deficit instead of direct banking borrowing and the optimal use
of financial resources to cover the needs of investment and development.
Hence, the most significant change was the modification of the taxation system by the
means of the General Commission for Taxes and Fees, which was established by Decree
no. 41 of 2007 to propose the taxation policy in Syria in light of the general financial and
economic policy of the Government and to support the economic and social development
plans. As a result, the Ministry of Finance reduced the number of fees and taxes collected
for the State Treasury from 45 to 32 as well as their rate from 58.5% to 28% particularly
those related to income taxes. Currently, action is being taken to introduce a unified
income tax. These actions resulted in increasing the tax returns from SP176 billion in 2000
to around SP364 billion in 2008 owing to the increase in the number of tax payers
declaring their tax liabilities. In this respect, the Ministry of Finance is currently
implementing with the EU a project to reform the financial and taxation systems as well as
to improve the institutional performance. The aforementioned procedures were
accompanied with a number of regulations to enhance the fiscal and tax policy
performance including:
Decree no. 61 of 2007 that allowed the reassessment of the fixed assets of
individual firms and companies so as to enable owners to declare transparently their

State of Food and Agriculture in Syria 2010
52
activities and their actual financial situation without fearing being overburdened by
additional liabilities.
Decree no. 22 of 2009 that exempted tax payers from all the overdue penalties until
2008 if they pay the taxes of those years before 10/31/2009.
Decree no. 33 of 2009 related to the reduction of the tax imposed on public
employees’ salaries.
Finally, the Government has concluded a number of fiscal cooperation agreements with
several countries in recent years, mainly:
Agreement with Croatia to avoid income double taxation.
Agreement with Czech Republic to eliminate double taxation.
Agreement with Saudi Arabia to overcome double taxation on income and capital.
Agreement with Turkey to prevent double taxation.
Agreement with Romania to invalidate double taxation and to exempt diplomatic
missions from the value added tax (VAT).
3.3.2. Trade policy
Over the last ten years, Syria has introduced comprehensive changes to its trade policy
following its economic reform process to ensure its potential integration with the
international market on the one hand and to meet economic growth and social development
needs on the other. To this end, major modifications are: (i) elimination of most of the
trade barriers; (ii) issuance of many regulations to liberalize commodity trade; (iii) and
introduction of economic and finance measures to support this orientation including: the
improvement of the administrative and legislative environment, simplification of customs
clearance procedures, reduction of custom tariffs on agricultural and industrial raw
materials to 1%34.
On the import side, Syria has opened its markets to import from Arab Countries and
Turkey after signing free trade agreements with them on one hand and from other countries
on the other. Therefore, trade flows between Syria and these countries have been
characterized by tariffs reduction and removal of non-trade barriers35. They focus on the
import of intermediary goods and production inputs so as to enhance the economic
34 NAPC, SAT, various issues. 35 NAPC, SAT, various issues.

State of Food and Agriculture in Syria 2010
53
development process. Syria has also allowed the import of all agricultural products except
some sensitive commodities, which may have a negative impact on local production. At the
same time, the import of specific products may be provisionally suspended to protect
national production or to address an emergency. More specifically, the Government has
recently opened the import of all kinds of fertilizers, as well as wheat import from the
Russian Federation and Bulgaria to substitute the reduction in strategic reserves which
resulted from the bad climatic conditions and the drought spells. On the other hand, the
import of citrus from all countries except Arab countries and Turkey, due to the FTAs, was
banned. This is due to the availability of local production of good qualities around the year
in these countries. Furthermore, the MAAR banned the import of shelled and unshelled
almonds due the availability of sufficient local production. Later on, powder milk
originating in China was prohibited as a precautionary measure after the death of Chinese
children who consumed polluted milk.
Finally, main regulations pertaining to agricultural imports can be presented as follows:
Decree no. 300 of 2009 related to the reduction of tariffs on some agricultural
imports such as chickpeas and lentils, so as to increase imports and overcome the
local production gap resulting from the unfavorable weather conditions.
Expansion of the FTA with Turkey to include tariff free agricultural products.
As exports as concerned, Syria is striving to enhance and diversify its exports to
international markets in spite of the increasingly severe competition. Therefore, Syria is
taking serious actions to strengthen its relations with trade partners through signing
cooperation and association agreements with various countries and blocs and enhancing
accession to the WTO in order to benefit from the trade opportunities and the access to new
markets. Some of these actions are: setting up a Supreme Council for Export (SCE),
Exports Development Fund (EDF), an Export Promotion Commission (EPC) and the Speed
Intervention Office (SIO) to solve exporters’ problems36. In this regard, more attention is
being given to the product quality, adoption of modern agricultural marketing techniques,
commitment to quality standards and good packing and packaging in order to improve
export returns; the main agreements signed in 2009 are:
Three economic agreements with Italy, namely: industrial modernization, increase
of the volume of trade and enhancement of the relations between the Syrian EPC
36 NAPC, SAT, various issues.

State of Food and Agriculture in Syria 2010
54
and the Italian Commercial Delegation. Also a memorandum of understanding was
signed to establish an Italian Technology Center in Syria.
A cooperation programme between the Jordanian Association for Project
Development and the Syrian EPC for the years 2010-2011.
3.3.3. Investment policy
In general, the Syrian investment policy aims at improving the investment environment,
creating the required infrastructure to facilitate investment implementation, attracting
Syrian, Arab and foreign capitals, eliminating the constraints impeding investment inflow
into Syria, and enhancing the investment contribution to the Syrian GDP. Several actions
have been taken to attain these goals.
First, the SG enhances the contribution of the private sector to the establishment of the
Syrian infrastructure that needs gigantic funding. Such participatory approach is promoted
by the introduction of the Building, Operating and Transporting System (BOTS), which is
in place. It is a form of project funding under which the Government grants a private
company a concession to carry out an infrastructure investment and to invest it for several
years before it is transferred to the state ownership. This legislation will promote private
sector engagement in executing service projects which foster the infrastructure, generate
employment and create development investments.
Second, after the creation of the Investment Commission (IC) to act as the single unit
responsible for the management of investment projects, several steps have been introduced
to facilitate and simplify licensing local and foreign investment projects including: (i)
establishing a special directorate to follow investment licensing and implementation and to
address investors’ problems, (ii) setting up the investment map to identify potential
projects to be presented to investors, (iii) creating the single window system to reduce
investors visits to pubic offices and to smooth the licensing procedures, (iv) modifying the
tax rate on investment projects so as to make the taxation and fee system an encouraging
factor for investment, (v) automating all the commission procedures to reduce contacts
with employees and to connect the software with the Customs Department in a view to
facilitate the entry of the investment projects imported requirements, (vi) launching a
programme to motivate and encourage investments and offer the required support, and (vii)
appointing officers in the Syrian embassies all over the world to act as focal points
connecting investors with Syria and to the IC.
State of Food and Agriculture in Syria 2010
55
Third, the SG concluded various economic cooperation agreements with several countries
in 2008 and 2009 to enhance investments and attract Foreign Direct Investment (FDI) into
the country and to push forward the sustainable and balanced development37.
Fourth, several regulations were passed over the 2008-2009 period to simplify and
facilitate the customs clearance procedures for local and foreign investments38.
Fifth, Syria has joined a number of Arab and international organizations concerned with
investment with the aim of promoting its investments and benefiting from the advantages
offered by these organizations, namely: the International Centre for Dispute Settlement on
Investment, Arab Association for Investment Guarantee, Agreement for Capital
Movement in Arab Countries, Agreement of Dispute Settlement on Investments between
countries hosting Arab investments and Arab citizen from other countries, United
Agreement to Invest Arab Capitals in Arab States, and Washington Agreement about
Investment Conflicts.
Sixth, Syria has been expanding its industrial cities that will facilitate launching new
projects in areas with enhanced services and facilities. For instance, these cities include
sections for migration and passports to facilitate procedures for Syrians, Arabs and
foreigners present there. Furthermore, the Government is preparing for the establishment of
a new industrial city to the south of Rural Damascus to serve Sweida and Dar’a
governorates in addition to the existing industrial cities of Adra in Rural Damascus, Hessia
in Homs, Sheikh Najjar in Aleppo, Dair-Ezzor established under Decree no. 110 of 2007
and opened for shareholding on 11 May 2008 and Raas Al Ain in Al-Hassake, which was
inaugurated in 2009.
Seventh, a new free zone will be established in Bab Al Hawa of Idleb governorate and
another one in Dair-Ezzor, while the free zone of Adra will be expanded by 318 dunums
over 190 blocks to accommodate more investments. Additionally, the Industrial Bank
approved funding the industrial and handicraft firms in the regions where no industrial
cities are available. The related loans bear the same interest rates applied by the industrial
cities.
Eighth, the SG tries to enhance the competitiveness of the Syrian industries to be able to
compete with international products. Therefore, several proposals have been initiated to
37 See NAPC, 2008-2009. 38 NAPC, SAT, 2008-2009.

State of Food and Agriculture in Syria 2010
56
reduce the cost of production. These tasks included the reduction of fuel and electricity
fees, custom tariffs and other levies, facilitation of the access to credits, exemption of
industrialists from deferrals penalties and interests, and promotion of export-oriented
industries to benefit from the value added and generate employment. The Government also
made a decision to reform and to improve the performance of the public industrial sector,
which accounts for 20% of the Syrian industries. To make this resolution effective, several
suggestions have been made to address the situation of the stumbling companies that have
incurred losses after opening the Syrian markets to foreign products due to the high
production cost and low product quality. They comprise: (i) changing the type of activities
conducted by these companies, (ii) opening them for private investment or partnership with
the private sector after the assessment of their fixed assets and (iii) suspending their
activities without jeopardizing the labourers rights, which can be ensured by transferring
the employees to other public institutions. In a positive step, these public companies have
been allowed to seek the assistance of the private sector to improve their situation.
In particular, Syria is considered one of the countries which places high value on the
development of the agricultural and agro-industrial sector because a large portion of the
population is relying on agriculture and agro-industries to improve its livelihood, and the
climatic conditions and natural resources to develop this sector are favorable. Hence,
agricultural, rural and agro-industrial development plays a key role in the strategy of the
GOS to induce economic and social advancements. Recently, the need for agricultural and
agro-industrial investment has emerged as a consequence of food security problems, the
gap between food supply and demand and the decrease in oil resources. In this regard,
Syria encourages all sectors (public, private, cooperative and joint-venture) to be engaged
in forming the investment policy of the country especially the private sector. To enhance
private investment in agriculture, public investment is oriented to establish and improve the
agricultural infrastructure including dams, canals, irrigation nets and land reclamation, and
to support agricultural research.
Agricultural public investment in Syria is distributed between:
Services: they aim at developing the infrastructure including dams, canals,
irrigation nets and land reclamation, providing services related to both crops and
livestock especially those connected to research and extension, and training and
educating of the staff to improve the efficiency and performance of the agricultural
sector as well as to make optimal use of domestic resources.

State of Food and Agriculture in Syria 2010
57
And production activities: they are performed by several public firms, which are
economically and financially independent. These establishments are the General
Establishment for feed, General Establishment for Poultry, General Establishment
for Cattle, General Commission for Fishery, and General Establishment for Seed
Multiplication (GESM). They have been established to create jobs, to provide
commodities at reasonable prices for consumers, to promote the private sector to
enter the industry and to provide extension service for private firms to improve
their efficiency. They, however, constitute only 1.5% of agricultural activities.
The expenditure linked to the above-mentioned public investment increased from SP7,465
million in 2004 to SP7,624 million in 2008 (Table A3.1). This increase accounts for an
AGR of 0.96%. This AGR, however, doesn’t comply with the relatively high population
growth to generate jobs and with the needed investment for the agricultural sector. The
aforementioned expenditure is more clarified in Figure 3.1 considering the budget
dedicated to the MAAR and its distribution by expenditure entities from 2006 to 2008;
further disaggregation is presented in Table A3.1 by individual projects. These projects
attained a set of intermediate goals over the 10th FYP to enhance the efficiency of the
agricultural sector (Table A3.2).
Figure 3.1. Investment of the MAAR by investment entities, 2006-2008 (SP million)
0
5,000
10,000
15,000
20,000
25,000
30,000
CA GCASR GCMDG REE PE Total of theMAAR
SP million
Budget
Expenditure
Source: Elaborated from MAAR database. CA: Central Administration; GCASR: General Commission for Agricultural Scientific Research; GCMDG: General Commission for Al-Ghab Management and Development; REE: Real Eastate Establishment; PE: Production Establishments.
In addition, the positive impact on the private investment related to agriculture and agro-
industries has resulted from issuing several investment decrees and laws, the most
important of which are:
Decree no. 10 of 1986, which allows the establishment of agricultural joint-
ventures between the private and public sectors. As a result, there are recently five

State of Food and Agriculture in Syria 2010
58
agricultural join-venture companies in place namely: Barakeh, Nama’a, Kadack,
Al-Qalamoun and Al-Sham. The MAAR, which represents the public sector,
contributes to 25% of the capital of these companies (Table A3.3)39.
Investment Law no. 10 of 1991, which applies to all sectors of the economy. This
law was amended by Decree no. 7 of 2006 and Decree no. 8 of 2008. It stipulates
that the value of the investment has not to be below SP10 million40.
Decree no. 47 of 1952 and its amendment by Decree no 52 of 1953, Decree no. 103
of 1952, Law no. 21 of 1958 and Law no. 24 of 2010 for protecting the national
infant industry41. These regulations govern the organization of the industrial sector
investment and propose no restrictions on the investment value to encourage small-
medium enterprises.
As a consequence of Law no. 10 and its amendments, the number of executed private
projects related to agriculture and agro-industries totaled 383 enterprises over the 2004-
2008 period (Table A3.4 and Table A3.5). These projects valued SP182 billion and
provided 23 thousand jobs. The structure of these investments and their distribution by
governorates are presented in Figure 3.2 and Figure 3.3 from 2005 to 2008. These figures
show that livestock and fodder businesses are the most likely implemented activities and
that the projects, on average, are fairly distributed among governorates when the size of
both the population and agricultural deeds are considered.
Figure 3.2. Number of private projects related to agriculture and agro-industries under Law no. 10 of 1991by type, 2005-2008
050
100150200250300350400
Number of projects Fodder
Crop production
Livestock production
Food industries
Olive oil extraction
Agricultural production inputs
Total
Source: Elaborated from the MAAR database.
39 www. Syrianindustry.org. 40 www. Syrianindustry.org. 41 www. Syrianindustry.org.

State of Food and Agriculture in Syria 2010
59
Figure 3.3. Percentage distribution of private agricultural and agro-industrial projects and their contribution to employment by governorates, 2005-2008 (%)
Rural Damascus
15%
Dar'a 6%
Sweida 7%
Quneitra 0%
Homs 6%
Hama 14%
Idleb 10%
Aleppo 6%
Lattakia 5%
Tartous 4%
Raqqa 8%
Dair-Ezzor 12%
Hassake 7%
Number of projects of total (% ) Rural
Damascus 16%
Dar'a 5% Sweida
4%
Quneitra 1%
Homs 10%
Hama 11% Idleb
9% Aleppo
5%
Lattakia 5%
Tartous 4%
Raqqa 12%
Dair-Ezzor 10%
Hassake 8%
Employment of total (% )
Source: Elaborated from the MAAR database.
3.4. Other agricultural policies
Other agricultural policies are related to planning, production, pricing, marketing,
supporting services, production inputs and natural resources. They aim to:
attain a paramount contribution of the agricultural sector to the GDP and economic
stability by increasing production and providing job opportunities;
improve self-sufficiency of the basic food stables, narrow the food gap and
upgrade the agricultural trade balance by increasing exports and decreasing
imports;
achieve adequate integration between the agricultural sector and the other sectors
of the economy, where the agricultural sector provides a substantial share of the
inputs and raw materials needed for the industrial sector and consumes
increasingly the industrial products such as machinery and fertilizers.
3.4.1. Planning and production policies
Since the 1960s, the SG has adopted a central planning system. But, starting from the 6th
FYP, 1986-1990, it has switched towards the indicative planning. The latter principle has
had an enormous positive impact on the indications of the annual plans owing to the
adoption of the participatory approach in setting up these plans considering the
involvement of all relevant parties (A3.4). Thus, the state maintains its role in controlling
the resource utilization, partial provision of inputs and marketing some main crops on the
one hand and allows the private sector to be increasingly involved in the production,
marketing and processing activities on the other.

State of Food and Agriculture in Syria 2010
60
In line with the above, the AAPP is established according to the Legislative Decree no. 59
of 2005, and is endorsed due to the Decision no. 3964 of 2005 taking into account the
following:
Orientations of the SADS.
Analysis of the agricultural current situation.
Problems facing the agricultural sector as well as the application of the relevant
policies.
Indications of the FYP.
Requirements of the project concerned with the institutional and sectorial
modernization.
Adoption of the indicative planning by the major groups of agricultural products
and preservation of the planned areas related to wheat, cotton and sugar beet.
Enhancement of the coordination with all relevant parties.
The aforesaid AAPP comprises policies related to both crops and livestock.
Crop production policies:
This sub-sector has several strengths such as the availability of diverse agro-ecosystems,
which enable the production of different farming system products adequate for promoting
agro-industries, presence of abundant manpower at low cost, accessibility to fair
infrastructure and supporting services, and the existence of the potential to enhance
productivity. At the same time, it has numerous weaknesses42. Therefore, the GOS has
proposed the following deliberate policies, which are ongoing currently to a great extent, in
line with indications of both the SAS and the 10th FYP to solve the arising problems and to
strengthen the development opportunities of the sector:
Adopt vertical expansion policies (increase the yield) such as applying Good
Agricultural Practices, using improved inputs to enhance the productivity and reduce
costs, introducing drought resisting and high yielding varieties, implementing organic
and leave fertilizers, adding micro nutrients, and increasing the share of legume crops
in the crop rotation.
Implement cropping structures and crop rotations complying with the comparative
advantage of the land considering the demand for pastoral crops, the crops adequate for
42 See chapter 4.

State of Food and Agriculture in Syria 2010
61
processing and export and ornament and medical plants, the cost reduction and the
return per one liter of water.
Expand the adoption of the IPM and bio-control taking into account the provision of
the requirements needed for these processes.
Extend the establishment of early warning systems liked to droughts and other weather
phenomena taking into consideration the development of the existing foundations.
Develop the agricultural guardianship and the current laboratories, and establish new
facilities.
Found a marketing information system to provide data about external markets
concerning types of commodities needed, marketing agenda, prices and standards.
Study the movement of agricultural products in the Syrian wholesale markets to identify
quantities, qualities and prices.
Enhance the establishment of marketing agencies by all sectors (state, private,
cooperative and joint).
Establish a state agency concerned with the export of agricultural products to open
external markets, promote and control exports, assure quality, establish advanced
laboratories and certify the products before export.
Promote the foundation of marketing producers’ associations to improve the
competitiveness and efficiency of post-harvest operations, to reduce costs and to
enhance the negotiation potential.
Enhance agro-processing activities both traditional and advanced complying with
international standards.
Supply agricultural raw materials with high quality complying with industry needs
such as expanding the cultivation of processing varieties and introducing new crops
adequate for processing.
Adopt new support schemes in line with international procedures and WTO.
Livestock production policies:
Even though this sub-sector is subject to many obstacles43, it is characterized by numerous
positive signs such as the existence of a varied animal production suitable for improving
agro-industries, availability of plentiful labour force at low expenses, access to appropriate
infrastructure and supporting services and presence of the potential to increase
43 See chapter 4.

State of Food and Agriculture in Syria 2010
62
productivity. Consequently, the Government gives due attention to the following
disaggregated policies, the most of which are in place, considering the orientations of both
the SAS and the10th FYP to improve the efficiency of livestock production and to brace its
activities and development opportunities:
Improve the integration between crop and animal productions.
Conduct research to identify the various improved breeds (local and acquired) in order
to expand and widespread them.
Develop the livestock productivity (meat, milk, wool and eggs) by the means of the
introduction of high yielding breeds, improvement of the fodder provision by
increasing the share of both green and grain fodder in the crop rotation and fodder
stocking, development of Al-Badia pastures accompanied with their improved
management and enhancement of the Awasi sheep productivity.
Encourage the livestock breeding in the second and third climatic zones especially that
related to small-adapted animals (goats, sheep, poultry and rabbits).
Supply the required veterinary medications to protect the livestock from diseases and
joint illnesses, and enhance the local production of veterinary medicine.
Introduce a programme to investigate livestock diseases and an early warning system
of trans-boundary illnesses.
Ameliorate the laboratories and the prevention systems related to livestock.
Enhance the rural industries of livestock products, the establishment of processing
units in high production areas and the compliance with international standards.
Promote the cooperative activities among livestock producers such as cooperatives and
specialized unions to coordinate their businesses, to introduce shared services among
them, to manage the livestock and to avoid fodder crises. This of course reduces the
cost of production and improves the returns of the cooperative work.
Found marketing information system to provide data about external markets
concerning types of commodities needed, marketing agenda, prices and standards.
Study the livestock products’ movement in the Syrian wholesale markets to identify
quantities, qualities and prices.
Enhance the establishment of marketing agencies by all sectors (state, private,
cooperative and joint).

State of Food and Agriculture in Syria 2010
63
Establish a state agency concerned with the export of livestock products to open
external markets, promote and control exports, assure quality, establish advanced
laboratories and certify the products before export.
Refine the drink water in Al-Badia and found new stations.
Adopt new support schemes complying with international procedures and WTO.
3.4.2. Pricing and marketing policies
The agricultural pricing policy has been subject to several adjustments. As a result, the
current policy is shaping the implementation of the agricultural production plans especially
those related to the major crops. These crops are: wheat, barley, maize, cotton, sugar beet
and tobacco. Pricing of these crops relies on assessing the actual costs by the MAAR and
adding up a profit margin of 25% to the estimated total cost.
The prices of the above-mentioned crops have started to increase since 2005 complying
with the augmentation of international prices, fuel prices and fertilizer prices. The
evolution of these prices is presented in Table 3.3 from 1999 to 2008 (Table A3.6). To this
end, the price of sugar beet is determined according to the degree of sweetness, whereas
pricing seed cotton considers the delivery time and quality as well as the over execution of
the plan. The seed cotton resulting from the additionally cultivated areas over the plan is
priced owing to the international price if it is less than the official price.
Table 3.3. Development of the official prices of the crops purchased by the Government, 1999-2008 (SP/kg, %)
Item Hard wheat
Soft wheat
Barley Maize Seed
cotton Sugar beet
Tobacco
Average (1999-2001) 1 11.80 10.80 7.50 8.00 30.75 2.25 69.27 Average (2003-2005) 11.80 10.80 8.00 8.00 30.75 2.25 77.13 Average (2006-2008) 2 13.53 12.70 11.00 12.00 34.17 2.75 112.88 Average change % (2/1) 14.7 17.6 46.7 50.0 11.1 22.2 63.0 Source: Elaborated from the MAAR, the AASA, 2008 and the CBS, the ASA, various issues.
Table 3.4 presents further increases in the above-mentioned official prices from 2008 to
2010.
Table 3.4. Development of the official prices of selected crops, 2008-2010 (SP/kg)
Item First increase Second increase Third increase
Price Decision Number
Date Price Decision Number
Date Price Decision Number
Date
Hard wheat 16.5
27 4/15/08
20.0 87 9/18/08
20.5 852 12/7/2009
Soft wheat 16.0 19.5 20.0 Seed cotton 36.0 41.0
31 5/13/08 42.0 73 4/16/2009
Sugar beet 3.5 3.75 4.5 46 5/24/2010 Barley 15.0 16.0 87 9/18/08 Maize 15.0 17.0 31 5/13/08 Source: Elaborated from various decisions.

State of Food and Agriculture in Syria 2010
64
Parallel, marketing policies have also underwent a set of changes as a consequece of
allowing the private sector to contribute more profoundly to marketing, processing and
exporting numerous agricultural products and to providing agricultural inputs such as
fertilizers and chemicals. The public sector, on the other hand, has limited its activities to
marketing and processing seed cotton, sugar beet, tobacco and wheat.
Based on the above, the current agricultural marketing policies can be characterized as
follows:
The obligatory delivery of agricultural products, even the major crops, to the state
has been removed excluding those products that are marketed to Government
processing units (seed cotton, sugar beet and tobacco).
The private sector is allowed to export all agricultural products with the exception
of seed cotton and wheat. At the same time, it is permitted to import all goods
especially those that are locally not produced or their domestic production is
insufficient to cover the national demand.
Government official prices are considered indicative, but, obligatory to those want
to sell to the state. This doesn’t apply to state monopolized products.
Hence, agricultural products are classified according to the Government intervention in the
process of pricing and marketing into strategic and non-strategic crops. There are eight
crops that are considered as strategic namely: cotton, wheat, barley, sugar beet, tobacco,
lentils, chickpeas and maize. They are further divided into two sub-groups in light of the
differences of the Government involvement in their marketing. Cotton, sugar beet and
tobacco farmers have to sell all the quantities produced in the licensed area at the centrally
determined price to public sector agencies that have the monopoly of marketing and
processing. In contrast, wheat, barley, lentils, chickpeas and maize farmers have the choice
of selling their production either to the public or to the private sector. Therefore, the
procurement price determines to a large extent the share of the public sector in the market.
Non-strategic crops, on the other hand, comprise vegetables, fruits, animal products and
others. They are marketed freely in local or central wholesale markets. A part of those is
purchased by the public sector such as fruits and vegetables (5% of total), which are bought
by the General Establishment of Storage and Marketing, to be sold through its market
outlets in urban areas, and conserve state companies, and fresh milk, which is delivered to
state dairy companies.

State of Food and Agriculture in Syria 2010
65
3.4.3. Policies related to supporting services
In spite of the great efforts in the field of agricultural supporting services (research,
extension, education and training) to develop agricultural production and the ASR, there is
still a series of challenges and weaknesses as mentioned below:
The ASR has been not able to educate and train human resources adequately and to
adopt modern technologies due a specific agenda, which has induced a gap in
proposing fair solutions for all problems combined with agricultural production.
Therefore, more attention is needed to enhance this activity.
The extension service has been not capable to transform the results of the ASR to
agricultural extension instructors that are in touch with rural communities and farmers
because of the lack of adequate requirements and specialized technicians. This implies
that there is an urgent need to train the staff working in this field.
The agricultural secondary schools and institutes require better capability concerning
agricultural fieldwork, laboratories and education programmes to have graduated staff
adapted to fieldwork, modern technologies and research and extension activities.
For the reasons above, the following decisive policies, owing to the SAS and the 10th FYP,
have been proposed to relax constraints:
Set up a clear strategy for the ASR complying with the SAS, which comprises the
prioritization of the research areas and readjustment of the research programmes so that
agricultural resources are sustained and the environment is improved.
Find fair substitutes for the cultivated crops, which are drought and salinity resistant,
have better economic outcomes and comply with the needs of the national economy
and the population given that they don’t affect negatively the salinity and sustainability.
Develop the genetic sources and their conservation for all varieties using advanced
scientific methods and issuing a legislation to organize their circulation and license.
Cooperate with local, Arab, regional and international institutions to develop the
research activities.
Coordinate research activities with those of the extension service.
Educate the extension instructors to enable them implementing specialized extension
programmes to transform them to producers by conducting scientific, technical and
specialized training courses.

State of Food and Agriculture in Syria 2010
66
Support the extension units with the needed requirements comprising staff, residence,
transportation vehicles, audio and visual equipment, etc.
Prepare programmes to improve the performance of rural women, which enable them
managing family and rural industry projects.
Provide the educational institutions with the needed requirements such as laboratories,
equipment, illustration means, transportation vehicles and educated instructors.
Set up an integrated programme to educate and train the people operating in the
agricultural sector and increase the number of training centers to comply with the needs
of training including the training before and on the job.
Establish specialized and advanced training centers in the locations of agricultural
importance that are equipped with reading halls, restaurants, laboratories, residence for
the trained staff, explanation means, etc.
Incorporate the secondary schools, institutes and training centers in the activities of
agricultural research and extension.
Establish the Directorate of Rural Women within the MAAR (Annex 8), which is in
place.
Found the Support Fund of Agricultural Production within the MAAR (Annex 8),
which was established owing to Decree no. 29 dated 5/5/2008.
3.4.4. Policies related to agricultural production inputs
Since the 1990s, agricultural input policies have been generally geared towards a gradual
elimination of subsidies of some inputs such as fuel, irrigation cost for state projects and
electricity, while the price of other inputs has been liberalized such as chemical fertilizers,
pesticides, machinery and some seed varieties. At the same time, these policies have
continued to facilitate the provision of agricultural inputs for private sector producers such
as pesticides, fertilizers, seed of vegetables, seedlings, machinery, agricultural tools, inputs
related to livestock, etc.
The aforesaid policies focus on the following:
Providing agricultural inputs in high quality and on time considering elimination of
intermediaries who increase the costs, determination of the regular specifications to be
implemented, reduction of waste and loss and improvement of the distribution
schemes.

State of Food and Agriculture in Syria 2010
67
Eliminating gradually the monopoly of the state in the field of the provision of
agricultural inputs, initiating the competition among all sectors to reduce prices and
improve the quality and allowing the private sector to provide these materials taking
into account the Government controls their quality.
Enhancing the role of the GESM to provide improved seeds for all crops especially
those linked to the major crops focusing on their adaptation to the environment and the
achievement of a high yield.
Supplying certified, healthy, and high yielding seedlings suitable for domestic and
international competition and introducing new varieties adapted to the environment.
Establishing genetic laboratories to test the imported seeds and identify their origin and
issuing a law to circulate seeds.
Developing the domestic industry of fertilizers both quantitatively and qualitatively to
be able to compete with the imported fertilizers.
Expanding the establishment of soil laboratories and making them available for the
extension units.
Adjusting the fertilizer equation diversified by agricultural districts and designing
agricultural rotations that make rational use of fertilizers.
Based on the above, the public sector sets the prices of the main inputs such as seeds,
fertilizers, and feed; determining these prices is based on the cost of production plus a
profit margin. For example, seed prices of the GESM are determined by its management
board to be approved by the MAAR. In addition, in bad and low production seasons,
governmental agencies provide extra fodder supply to enable sheep breeders to preserve
their herds. For the private sector, on the other hand, the MET determines the wholesale
and retail prices for agricultural inputs after verifying and checking the cost items
submitted by the producer or importer. In this regard, there are numerous input suppliers
available. This multiplicity of producing and marketing bodies ensures an appropriate
competitive environment.
Finally, Table 3.5 and Table A3.7 give an idea about the development of input prices.
Furthermore, the liberalization of fuel and fertilizer prices was accompanied with direct
transfers to farmers. The fuel price was raised from SP7/liter to SP20-25/liter in 2008. As a
result, the seed cotton farmers irrigating their land from deep wells received a direct
support totaling SP25,000/ha when the this price amounted to SP20/liter, and SP30,000/ha
when it accounted for SP25/liter. Moreover, due to Decision no. 73 dated 4/16/2009, seed

State of Food and Agriculture in Syria 2010
68
cotton farmers were supported in the value of SP8,000/ha, and due to Decision no. 3163
dated 6/24/2009 farmers received grants in the value of SP10,000/ha for maize, SP6,000/ha
for potatoes, and SP5,000/ha for tomatoes. Subsequently, this kind of support has been
removed to be considered in the actual production cost.
Table 3.5. Development of the prices of fertilizers supplied by the ACB, 2009-2010 (SP/tonne)
Item Old
Price
2009 2010 Decision no. 5102 Decision no. 3518 Decision no. 6960 Price Date Price Date Price Date
Urea 46% 8,900 16,680
11/12/2009
16,680
5/17/2010
16,260
10/28/2010 Ammonium nitrate 33.5% 6,500 12,160 12,160 11,840 Ammonium nitrate 30% 5,800 10,880 10,880 10,600 Supper phosphate 46% 8,160 21,000 19,000 19,100 Potash sulfate 50% 12,500 57,000 40,000 40,000 Source: Elaborated from various decisions.
3.4.5. Policies related to agricultural resources
These policies focus on improving the utilization of the following resources: land, water,
forestry, fishery and population.
3.4.5.1. Land resources
The Government undertakes the following intentional policies according to the SAS and
the 10th FYP to upgrade the utilization of land resources:
Design an agricultural, environmental and economic map of the country, which
determines the best production areas for crops and fruit trees complying with the
classifications and comparative advantages of Syrian lands using the Geographical
Information System (GIS).
Increase the irrigated areas through irrigation projects, land reclamation and increase
the wells in the allowed zones so that the renewable water resources of the various
water basins are maintained.
Expand the rain-fed areas through the reclamation of mountainous and hilly lands to be
cultivated with crops and fruit trees.
Determine the lands subject to fertility degradation and productivity decrease because
of the lack of nutrients and other factors of negative impact and design programmes to
improve their fertility by either the improvement of crop sequence or addition of the
deficient nutrients.
Propose programmes to develop the agricultural technologies in remote and
inaccessible areas, where the population relies on agricultural activities, by the

State of Food and Agriculture in Syria 2010
69
introduction of adaptable improved seeds varieties, high yielding breeds and fair
profitable cultivations.
Set up a legislative framework to amalgamate the fragmented lands in the context of
adopting cooperative investments and services.
Cooperate with international agencies to provide additional funds and capacity
building.
Consequently, both the MI and the MAAR conduct land reclamation. The former reclaims
land in the irrigated areas totaling about 20 thousand ha/year, while the latter restores
mountainous and hilly areas, which amounted to about 24 thousand ha per year in recent
years to plant fruit trees and crops complying with the environmental conditions of these
zones. The MAAR accomplishes this action by a series of projects concerned with land
reclamation, overall rural development and the provision of credits for the targeted areas
(Table A3.8). These projects also rely on foreign credits. Table 3.6 gives an idea about the
development of the rehabilitated area by the means of these projects from 1999 to 2009.
Table 3.6. Development of the reclaimed land related to rural development projects, 1999-2009 (000 ha)
Item Average
1999-2001 Average
2003-2005 Average
2007-2009
Average Change % 2003-2009
Average Change % 1999-2009
AAGR % 1999-2009
Crops 3.4 8.2 6.2 -23.5 84.2 10.7 Fruit trees 22.1 18.8 17.3 -7.6 -21.4 -3.9 Total 25.5 27.0 23.6 -12.4 -7.4 -1.3 Source: Elaborated from the MAAR, the AASA, various issues.
Table 3.6 reveals that the overall reclaimed land decreased during the considered period in
both the short run (2003-2009) and the long run (1999-2009); this trend also applies to fruit
trees, while the area related to crops declined in the short run and increased in the long run.
Finally, Some of Syrian lands suffer from degradation and desertification due to water and
wind erosion and pollution. Other land dilemmas are related to unorganized urbanization
and land fragmentation. Therefore, the Government has committed itself to provide
financial support for those projects that are concerned with combating desertification,
developing natural resources and ensuring resource sustainability. These financial
resources are transferred to the relevant institutions after considering them in the FYP. The
most important projects in this regard are: Development of Al-Badia, Land Reclamation of
Salty Lands in Euphrates Basin, Environmental Survey of Natural Resources in Syria, Bio-
Diversity Conservation, Establishment of a Network for Meteorological Monitoring
Stations, Foundation of Permanent Environmental Stations in Syria, Development of
Forests, Protection of Forests and Combating Fire, and Expansion and Improvement of

State of Food and Agriculture in Syria 2010
70
Forests. Furthermore, the Government amended Law no. 134 related to agricultural
relations by Law no. 56 dated 12/29/2004 to alleviate land fragmentation problems and
issued Law no. 2730 dated 5/31/2006 to prohibit random housing. Other important actions
related to land organization can be: joining Syria the Stockholm Assembly for Property
Right in 2002, declaring the membership of Syria in the International Organization for
Property Right in 2004 and establishing the Syrian Union for Property Right in 2005.
3.4.5.2. Water resources
The Government tries to improve the efficiency of water use complying with the
premeditated indications of the SAS and the 10th FYP through the following:
Improve the management of the water used for irrigation by using the irrigation water
according to the renewable water resources, organizing its investment and improving
its various uses.
Adopt agricultural policies aiming at limiting the excessive use of water resources,
improving the efficiency of water use by all sectors especially the agricultural sector
and using of treated drainage water in agriculture.
Introduce modern irrigation technologies (drip, sprinkle, in place and under soil) to
make rational use of surface and ground water resources. These techniques have to be
implemented by all water sources especially ground water through facilitating their
implementation by providing credits, technical expertise, extension and institutional
requirements due to the type of land and crops cultivated.
Ban the unorganized digging of wells, adjust the situation of the unlicensed wells,
organize ground water use, limit the water quota complying with the renewable water
and demand and control water consumption.
Protect water resources from all kinds of pollutions comprising chemicals, drainage
water and salinity (e.g. Al-Badia).
Enhance the establishment of water community associations and incorporate them in
the design of irrigation programmes to limit the degradation of water quality.
Study and develop the artificial rainfall methods to increase water availability for
agricultural production.
Based on the above, the MI, which was established by Law no. 16 in 1982 to replace the
different institutions controlling water resources, is currently in charge of following up,
managing and planning both the use of water resources and coordination among water use

State of Food and Agriculture in Syria 2010
71
associations. At the same time, it is responsible for licensing wells as well as for
establishing the irrigation infrastructure comprising dams and irrigation public canals; until
2008, the number of the founded dams amounted to about 160 with a storage capacity of
18.4 billion m3; to cover partially the maintenance cost of the public irrigation channels,
farmers pay an annual fee of 600SP/ha when they cultivate only winter crops, or
SP3,500/ha for the whole agricultural season when they grow winter, summer and
intensive crops.
The Government also focuses on improving the water quality because water analysis has
revealed that both surface and ground waters are polluted by the industrial drainage water.
Therefore, it has established a series of stations for the treatment of drainage water in cities
and villages, but, the number of these establishments is still insufficient.
Finally, the Government introduced and implemented a series of procedures to reduce
water deficit and to maintain the sustainability of water resources as follows:
A Water Law was issued to organize the use of water resources.
Public irrigation canals have been rehabilitated.
Planning of agricultural products has been adjusted to comply with the available
and renewed water resources.
A programme for the adoption of modern irrigation has been initiated to save water,
energy and expenses.
Water and drought management has been introduced and improved.
In more details, a fund for the adoption of modern irrigation technologies was established
within the MAAR owing to Decree no. 91 dated 2005. Its capital amounts to about SP52.2
billion. It provides long-term credits for farmers without any interest. These loans have to
be repaid within 10 years after a grace period of two years. In general, this fund contributes
to 50% of the cost in addition to the payment of the interest owing to the ACB (7% of the
credit value), where the farmer bears the rest; but, if the beneficiary pays 40% of the cost in
cash, it covers 60% of the cost. To enhance the aforementioned action, the minister
president, the head of the Overall Commission for the Implementation of Modern
Irrigation, issued Decision no. 122 dated 1/13/2008 which obligates the application of
modern irrigation techniques on both licensed wells and compressed public irrigation
canals, and assigned the governors to put this decision in practice. As a result, the number
of beneficiaries of this fund has amounted to 2,161 farmers until January 2009, who

State of Food and Agriculture in Syria 2010
72
received a sum of SP1 billion for 14,366 ha. This project, however, is still subject to the
following constraints: (i) absence of specialized laboratories to test the quality of irrigation
equipment, (ii) shortage in the adjustment of the situation of unlicensed wells and (iii)
deficiency in the rehabilitation of public irrigation canals to adapt to modern irrigation.
Furthermore, the MAAR has established the Directorate for Artificial Rainfall, which is
currently dealing with water and drought management issues, to increase the precipitation
rate, and the Government has initiated a drought response plan since 2009 in cooperation
with the United Nations.
3.4.5.3. Natural pastures and Al-Badia (Syrian Steppe)
In line with the SAS and the 10th FYP, the Government has proposed the following
policies:
Improvement of the services related to Al-Badia population, communities and
infrastructure (especially roads).
Implementation of water harvesting techniques.
Enhancement of the number of wells to provide water for the population and livestock
and establishment of water treatment stations.
Use of alternative energy sources to maintain the plant and pasture cover.
Development of pasture cultivations and production of pasture seedlings and seeds, as
well as provision of the needed requirements related to those.
Rationalization of pastures, sheep and water management.
Provision of veterinary services for the livestock, movable veterinary units to
implement the sheep health care programmes and assistance by marketing of products
and supplying of fodder.
Introduction of regulations to organize cooperate grazing, establishment of protection
zones and protection of Al-Badia from aggression.
Enhancement of food industries related to animal products to create jobs and to
generate income and development of marketing operations related to those.
Promotion of the cooperation among scientific and research institutions to produce an
encyclopedia of Al-Badia plants to be used in medicine.
In line with the above, the investment plan of the MAAR includes several projects to
develop Al-Badia namely: Development of Research Activities related to Natural Pastures,
Digging and Equipping of Wells in Al-Badia, Development of the Syrian Steppe,

State of Food and Agriculture in Syria 2010
73
Improvement of Natural Pastures and Establishment of Natural Protection Zones, Overall
Improvement of the Syrian Steppe and Natural Protection Zone in Al-Taleeleh. The
activities of these projects have been unified under the umbrella of the General
Commission for the Management and Development of Al-Badia due to Decree no. 24
dated 8/13/2006. This commission aims to develop and improve Al-Badia resources,
ensure the sustainability of Al-Badia wealth, maintain the rational utilization of Al-Badia
assets, introduce the community approach, grow pastoral seeds and seedlings and apply Al-
Badia Protection Law no. 62 dated 12/24/2006, which replaced Law no. 13 of 1973.
3.4.5.4. Forestry
The Government has proposed numerous comprehensive policies complying with the SAS
and the 10th FYP to develop forestry resources as indicated below:
Improve forests’ management to utilize forests economically and to protect them from
attack and fire.
Continue on forestation activities in the suitable locations considering their
development and support with the needed requirements, patching operations and
building forestry roads in the forestation areas.
Set up an integrated programme to manage the forests cooperatively between the
Government and local communities in order to improve the forests and the livelihood
of the local population taking into account their benefit from forestry products such as
wood, fodder, fuel wood, fruits, etc.
Evaluate the results of the forestry programmes and the lessons acquired to determine
subsequently the area to be cultivated.
Study and adjust the forestry Law to benefit effectively from the forestry resources
(economically, environmentally and tourism based).
Draw a new map of the forestry resources relying on airplane photography to identify
the current situation, attack and unofficial investments.
Study the possibility of benefiting from wooden and non-wooden forestry products to
achieve food security.
The MAAR implements the above-mentioned policies by the means of three projects
namely: Development of Forests, Expansion and Improvement of Forests, and Protection
of Forests and Combating Fire. These projects rely on both foreign and local funding and
contribute to agricultural production through several activities as shown in Table 3.7
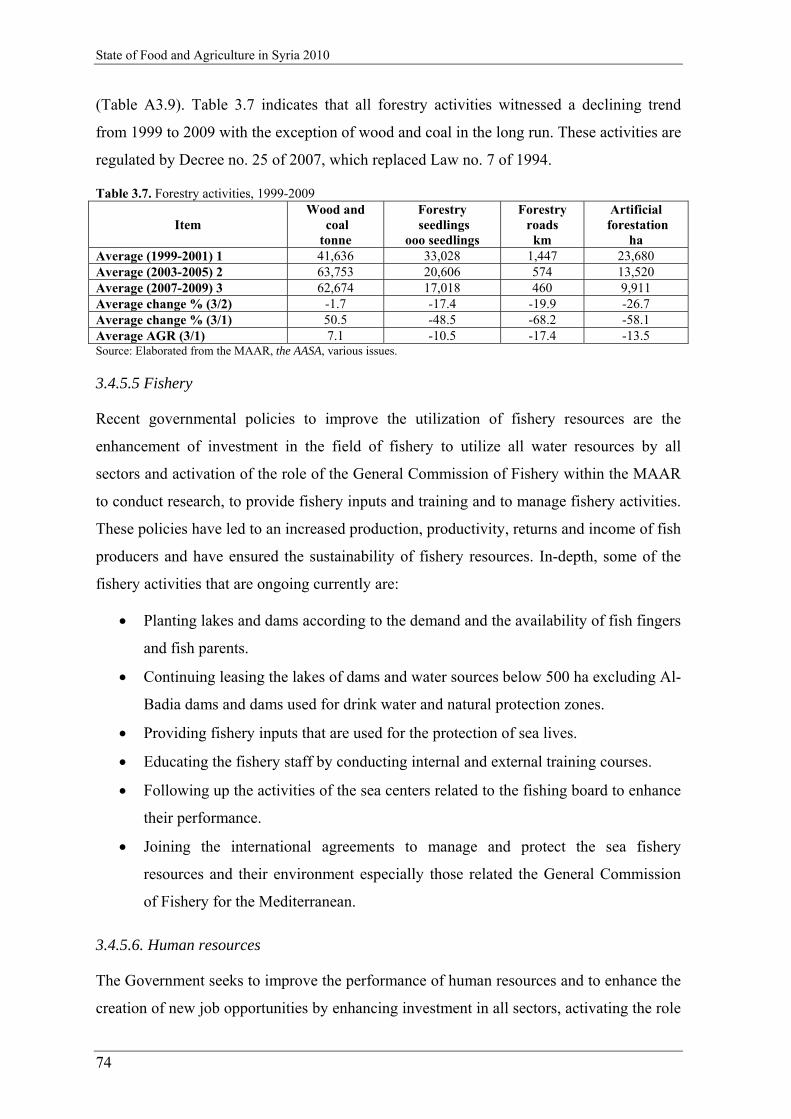
State of Food and Agriculture in Syria 2010
74
(Table A3.9). Table 3.7 indicates that all forestry activities witnessed a declining trend
from 1999 to 2009 with the exception of wood and coal in the long run. These activities are
regulated by Decree no. 25 of 2007, which replaced Law no. 7 of 1994.
Table 3.7. Forestry activities, 1999-2009
Item Wood and
coal tonne
Forestry seedlings
ooo seedlings
Forestry roads km
Artificial forestation
ha Average (1999-2001) 1 41,636 33,028 1,447 23,680 Average (2003-2005) 2 63,753 20,606 574 13,520 Average (2007-2009) 3 62,674 17,018 460 9,911 Average change % (3/2) -1.7 -17.4 -19.9 -26.7 Average change % (3/1) 50.5 -48.5 -68.2 -58.1 Average AGR (3/1) 7.1 -10.5 -17.4 -13.5 Source: Elaborated from the MAAR, the AASA, various issues.
3.4.5.5 Fishery
Recent governmental policies to improve the utilization of fishery resources are the
enhancement of investment in the field of fishery to utilize all water resources by all
sectors and activation of the role of the General Commission of Fishery within the MAAR
to conduct research, to provide fishery inputs and training and to manage fishery activities.
These policies have led to an increased production, productivity, returns and income of fish
producers and have ensured the sustainability of fishery resources. In-depth, some of the
fishery activities that are ongoing currently are:
Planting lakes and dams according to the demand and the availability of fish fingers
and fish parents.
Continuing leasing the lakes of dams and water sources below 500 ha excluding Al-
Badia dams and dams used for drink water and natural protection zones.
Providing fishery inputs that are used for the protection of sea lives.
Educating the fishery staff by conducting internal and external training courses.
Following up the activities of the sea centers related to the fishing board to enhance
their performance.
Joining the international agreements to manage and protect the sea fishery
resources and their environment especially those related the General Commission
of Fishery for the Mediterranean.
3.4.5.6. Human resources
The Government seeks to improve the performance of human resources and to enhance the
creation of new job opportunities by enhancing investment in all sectors, activating the role

State of Food and Agriculture in Syria 2010
75
of the General Commission of Employment and Project Empowerment and Rural
Development Projects by job creation, providing training and education, and skill
upgrading. Important regulations in this regard are Decree no. 363 dated 8/30/2007 to add
2000 new agricultural jobs, Decree no. 364 dated 8/30/2007 to introduce 550 new jobs
related to agricultural supervisors and Law no. 34 dated 12/9/2007 to organize the
retirement of veterinary doctors.
3.5. Agro-industrial policies
The SAS and the 10th FYP focus on developing agro-industries highlighting the role of
rural industries in line with the development of agricultural production comprising both
crops and livestock to increase the value added.
Based on the above, it can be distinguished between two stages to develop agro-industries
in Syria: before and after announcing Law no. 10 of 1991.
The first period was characterized by agro-industries relying mainly on the public sector in
addition to some small and simple firms of the private sector. The products of these
industries can be described as follows; they:
have high quality, are free of fraud and are trustworthy by the consumers because
they comply with the national standards;
are typical without any creative components;
are characterized by relatively administered fixed prices determined according to
predetermined prices for raw materials, production costs and a profit margin.
The aforementioned products met the basic needs of the consumers without considering the
development in consumers' tastes due to the absence of competition in the market and
excess demand. Thus, the main aim of the firms was to produce and to comply with the
production plans, while marketing was conducted by other agents such as the General
Establishment for Consumption Goods (GECG), the General Establishment for Retail
Trade (GERT) and the General Establishment for Military (GEM). As a consequence, the
domestic produce was protected by both the administered prices and the import ban.
To enhance the performance of the above- mentioned industrial scheme and to expand the
size and diversity of the industry, since the mid-1980s, a new orientation of the economy
has been set up to improve the economic environment and to attract foreign capital. It was
characterized by issuing several regulations. Decree no. 10 of 1986 has been issued to

State of Food and Agriculture in Syria 2010
76
found agricultural joint-venture companies; Investment Law no. 10 of 1991, which was
adjusted by Decree no. 7 of 2000 and was replaced by Decree no. 8 of 2007, has been
announced to establish large companies; small and middle firms were established by Law
no. 103 of 1952. This development can be identified as the basis for initiating the second
epoch of agro-industries, where a vast of firms has been established either licensed or un-
licensed. This led to internal market dumping with a variety of products, which were
behind the exit of many small firms due to the unfair price competition. This stage is
distinguished by the following:
The established industries were not of a great economic impact such as gum, chips,
biscuit, etc.
Quality cheating due to price competition, excess supply and greediness of the
firms' owners led to the violation of standards and to unhealthy products.
There was unclear economic policy to attract investors to different industries
relying on statistics about actual needs and required capacities, which led to
unbalanced distribution of the firms.
Therefore, it has been urgent to follow a fair economic policy aiming at enhancing the
integration and coordination among producers and public institutions to attain the
following:
Enhancing middle and large projects of major economic impact on food security
and market stability especially those enterprises relying on domestic raw materials
such as vegetables, fruits and dairies without attaining a market dumping.
Ensuring the use of advanced technologies by the industry to be competitive, to
produce high quality products and to access Arab and foreign markets.
Adopting both modern and flexible management practices and quality assurance
systems (ISO44 9000 family, HACCP45 and Administration Performance Systems)
to accelerate the decision making process and to behave according to market needs
and demand.
Giving more attention to the operations of filling and packaging to ensure
diversification into suitable sizes relying on the per capita income and purchasing
power of social classes.
44 ISO: International Standardization Organization. 45 HACCP: Hazard Analysis and Critical Control Points.
State of Food and Agriculture in Syria 2010
77
Improving marketing techniques and advertising and customer services to enhance
the consumption of processed and healthy goods, which are tested against bacterial
capacity and standards’ compliance, instead of the traditional products, which don't
comply with technical and safety specifications.
Adopting modern and advanced technologies to increase the production capacity
per unit of time and productivity, to reduce cost and to have competitive fair prices
complying with those related to GAFTA and foreign markets.
3.6. Policies related to food security
Food security has been constantly a major and fundamental objective of the SAS. Up to the
mid-80s, agricultural strategies and policies were strictly geared towards assuring self-
sufficiency in important and strategic food commodities. Large-scale exploitation of
natural resources for agricultural production and Government intervention in both
agricultural activities under a central planning system and marketing led to the
achievement of self-sufficiency in strategic food crops. These intervention measures
introduced serious distortions which induced inefficiencies in resource use and proved
ineffective in ensuring high levels of overall self-sufficiency. They represented also a
heavy burden on government budget.
Therefore, the policy reform programme, introduced thereafter, aimed at removing or
reducing the aforementioned distortions, thus ensuring increasing efficiency in domestic
resources use. Subsequently, toward the 90s, trade liberalization started to occur at a higher
pace. Crop diversification policies were also promoted and increased attention was given to
the comparative advantages of Syrian agriculture. The concept of self-reliance has also
been gradually substituting the concept of self-sufficiency, implying a more active
participation of the country in international trade. Agricultural trade expanded and played a
more important role than in the past in achieving food security. Policies aiming at making
exports more competitive in international markets were implemented with success. At
present, agricultural trade is considered an essential element in ensuring national food
security.
Furthermore, the SG, in light of the general policy orientation to adopt the SME, has
executed a series of economic and institutional reforms to enhance the integration with the
world economy, to ease the implementation of the assigned agreements and to prepare for
joining the WTO. As a result, Syria is now an observe member in the WTO. In this regard,
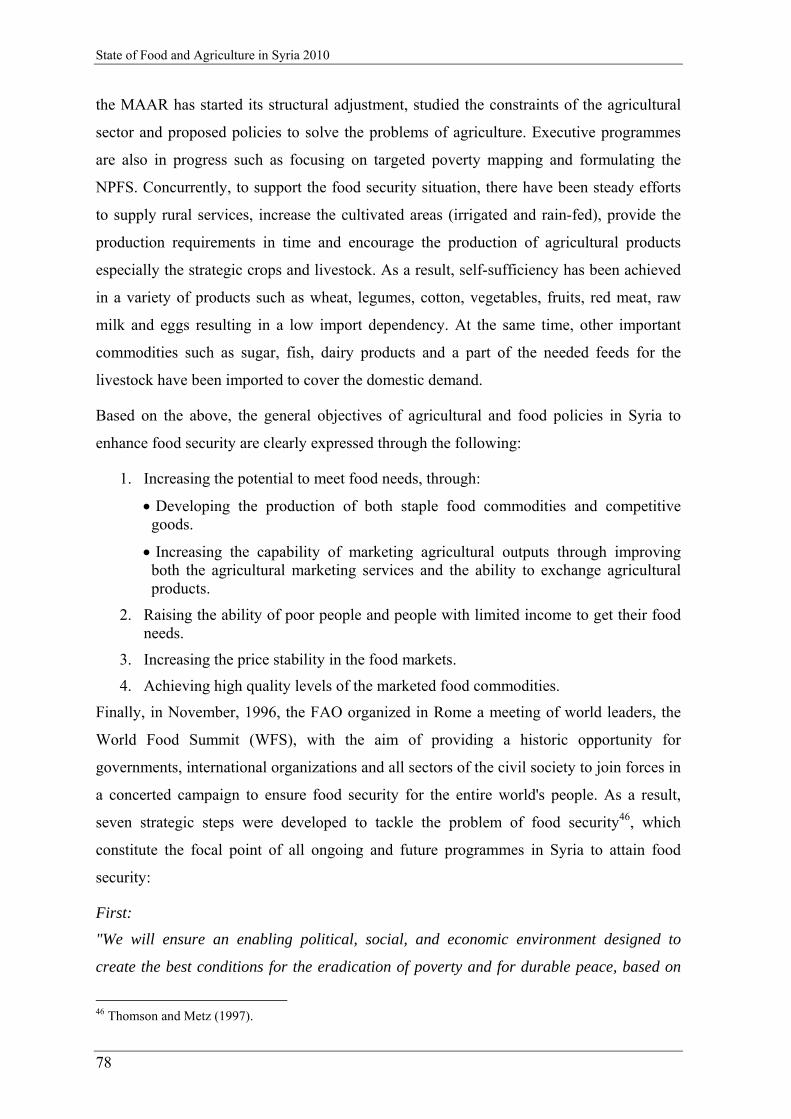
State of Food and Agriculture in Syria 2010
78
the MAAR has started its structural adjustment, studied the constraints of the agricultural
sector and proposed policies to solve the problems of agriculture. Executive programmes
are also in progress such as focusing on targeted poverty mapping and formulating the
NPFS. Concurrently, to support the food security situation, there have been steady efforts
to supply rural services, increase the cultivated areas (irrigated and rain-fed), provide the
production requirements in time and encourage the production of agricultural products
especially the strategic crops and livestock. As a result, self-sufficiency has been achieved
in a variety of products such as wheat, legumes, cotton, vegetables, fruits, red meat, raw
milk and eggs resulting in a low import dependency. At the same time, other important
commodities such as sugar, fish, dairy products and a part of the needed feeds for the
livestock have been imported to cover the domestic demand.
Based on the above, the general objectives of agricultural and food policies in Syria to
enhance food security are clearly expressed through the following:
1. Increasing the potential to meet food needs, through:
Developing the production of both staple food commodities and competitive goods.
Increasing the capability of marketing agricultural outputs through improving both the agricultural marketing services and the ability to exchange agricultural products.
2. Raising the ability of poor people and people with limited income to get their food needs.
3. Increasing the price stability in the food markets.
4. Achieving high quality levels of the marketed food commodities.
Finally, in November, 1996, the FAO organized in Rome a meeting of world leaders, the
World Food Summit (WFS), with the aim of providing a historic opportunity for
governments, international organizations and all sectors of the civil society to join forces in
a concerted campaign to ensure food security for the entire world's people. As a result,
seven strategic steps were developed to tackle the problem of food security46, which
constitute the focal point of all ongoing and future programmes in Syria to attain food
security:
First:
"We will ensure an enabling political, social, and economic environment designed to
create the best conditions for the eradication of poverty and for durable peace, based on
46 Thomson and Metz (1997).

State of Food and Agriculture in Syria 2010
79
full and equal participation of women and men, which is most conductive to achieving
sustainable food security for all".
Second:
"We will implement policies aimed at eradicating poverty and inequality and improving
physical and economic access by all, at all times, to sufficient, nutritionally adequate and
safe food and its effective utilization".
Third:
"Pursue participatory and sustainable food, agriculture, fisheries, forestry and rural
development policies and practices in high and low potential areas, which are essential to
adequate and reliable food supplies at the household, national, regional and global levels,
and combat pests, drought and desertification, considering the multifunctional character of
agriculture".
Fourth:
"We will strive to ensure that food, agricultural trade and overall trade policies are
conductive to fostering food security for all through a fair and market oriented world trade
system".
Fifth:
"We will endeavor to prevent and be prepared for natural disasters and man-made
emergencies and to meet transitory and emergency food requirements in ways that
encourage recovery, rehabilitation and development and a capacity to satisfy future
trends".
Sixth:
"Promoting optimal allocation and use of public and private investments to foster human
resources, sustainable food, agriculture, fisheries and forestry systems, and rural
development, in high and low potential areas".
Seventh:
"We will implement, monitor, and follow-up this plan of action at all levels in cooperation
with the international community".
The 11th FYP (2011-2015) and the NPFS focus heavily on the aforementioned strategic
steps.

State of Food and Agriculture in Syria 2010
80
3.7. Support policies
Support policies focus on both producers and consumers.
On the producer side, the offered state subsidy for production inputs in the past contributed
to the considerable growth rates in the agricultural production especially that refers to the
strategic crops whose input costs account for a paramount portion of the cost of production.
It has enhanced the use of improved seeds and chemical fertilizers especially by wheat,
seed cotton and potatoes. Generally speaking, the offered subsidies aimed at:
Expanding the use of modern inputs in the production of the main crops.
Striking a balance between the prices of agricultural products and the relevant
inputs.
Stabilizing the input prices and, consequently, the profit margins and farmers’
income.
Soothing the prices of agricultural products and, accordingly, restricting the price
fluctuation influence on consumption expenditure, particularly for low income
population.
To make the aforementioned growth more efficient, since the 1990s, the Government has
started a policy aiming at a gradual reduction of subsidies taking into account
counterbalancing the negative impact on producers and ensuring the supply of food
products at reasonable prices. In general, subsidies have been reduced with the aim of
releasing the pressure on the state budget. But, subsidies on fuel prices, cost of irrigation
from public schemes, fertilizers and wheat seeds have been maintained. The subsequent
policy postulates that the support has to comply with international schemes and to rely on
direct transfers instead of price support. For this purpose, the Agricultural Production
Supporting Fund (APSF) has been established. As a result the following support policies
were or have been in place:
State prices of wheat, seed cotton and sugar beet are determined according to the
actual cost plus a profit margin of 25% of the total cost. This kind of price support
is dedicated to the GEGTP, General Establishment for Cotton Marketing and
Ginning and General Establishment of Sugar. Another type of support is provided
by the APSF. It provided direct support for the following crops during the 2009-
2010 period: maize (SP10,000/ha), potatoes (SP6,000/ha), field tomatoes

State of Food and Agriculture in Syria 2010
81
(SP5,000/ha), green house tomatoes (SP1,000/house), apples (SP10,000/ha), olives
(SP5,000/ha) and citrus (SP14,000/ha).
Subsidy on fertilizers was removed due to Decision no. 5912 dated 2009 and the
support for fertilizers and fuel was considered in the transfers from the APSF.
Control materials are not subsidized, but, the Government provides compulsory
control free of charge especially for wheat and cotton.
The GESM supplies the improved seeds of wheat, cotton, sugar beet, potatoes,
barley, lentils and chickpeas with a price equal to the cost. Other seeds are not
supported.
Fuel and electricity are subsidized by all sectors.
As for consumer subsidy, the Government has adopted a programme for subsidizing food
staples, particularly wheat flour and bread. Consumers pay reduced prices for normal
wheat flour used for bakeries and normal bread. In addition, ration cards are used to
provide consumers with subsidized sugar and rice (1/2 kg of rice and 1 kg of sugar per
person per month).
3.8. Policies related to food quality and safety
Food control cannot be ensured without the active cooperation among all the relevant
parties starting with farmers, processing relevant authorities47, up to the consumers. These
relationships are governed by regulations and others.
In-depth, the commodity distribution, handling, and supply control system can be
summarized as follows:
Control system on products within the country.
Export control system.
Import control system.
Circular no. 137 related to the coordination among the parties involved in
monitoring violations of product regulations.
The relevant laws and decrees include the following:
Food control Law known as “Cheating and Fraudulence Prevention Law” no. 158
of 1960 and its amending Law no. 47 of 2001.
47 Country paper on the policies related to food control in Syria: coordination and development on the local and Arab level, 4/16-18/2007.

State of Food and Agriculture in Syria 2010
82
Supply and Pricing Law no. 123 of 1960 and its amending Law no. 22 of 2000.
Agricultural and Veterinary Quarantine Law no. 237 of 1960 and its amending
Law no. 26 dated 11/19/2007.
Legislative Decree no. 1457 of 1945 related to sanitary control of establishments.
Customs Law no. 9 of 1945 related import control.
Food safety Law.
Consequently, several authorities are involved in food quality control such as: People
Assembly, MAAR, MET, MOH, Ministry of Finance, Ministry of Tourism, Ministry of
Local Administration, Ministry of Internal Affair, Ministry of Justice, MOI, Consumer
Protection Association and Popular Organizations. They assure quality control relying on
national specifications for raw and processed materials. These standards were set up
considering Arab and international indications. They are considered by applying
international quality assurance systems, which are adopted currently by Syrian companies.
Concurrently, they are improved constantly to comply with the specifications of other
countries.
Finally, Decree no. 6 of 2009 was issued to found the General Commission for Developing
and Advertising Exports and the Overall Council of Exports. They focus on improving
product quality and competitiveness.
3.9. Agricultural and food policies in the next period
The 11th FYP (2011-2015) consists of five main goals to enhance the performance of the
agricultural sector. The implementation of each aim is maintained through numerous
strategies, policies, sub-goals and programmes. In total, the 11th FYP comprised 22
strategies, 35 policies, 29 sub-goals and 86 programmes. A summary of those is presented
below:
First goal: Achieving food security and ensuring the availability of basic food goods
complying with the domestic demand.
The strategies underlying this aim are: expansion of both cultivable and invested lands as
well as enhancement of productivity, support of marginal producers, compliance of crop
rotation with the available resources, adoption of both modern technologies and the results
of the ASR, introduction of new profitable crops, and preservation of the integration
between crops and livestock.

State of Food and Agriculture in Syria 2010
83
The policies shaping the above-mentioned strategies are: ensuring the water supply,
enhancing the vertical expansion of agricultural production (enhanced productivity),
improving both quantity and quality of production, enhancing the performance of the rural
sector, increasing comparative advantage products, achieving self-sufficiency in the basic
staple foods, providing production inputs with fair prices, supporting the introduction of
alternative energy sources, reducing of wastages and losses alongside the whole value
chain, ensuring resources, enhancing the introduction of modern technologies, and
promoting the farmers to adopt integrated productions (crops and livestock).
Second goal: Ensuring the sustainability of natural resources (land, water, forestry,
pastures and fishery) as well as their rational use, and preserving them from degradation,
excessive use and pollution.
Third goal: improving the marketing of agricultural products.
The strategies that help implementing this aim are: promoting the establishment of
advanced marketing agencies as well as the organization of contractual relationships with
producers, organizing the quality certification issuance for agricultural products, granting
quality certifications based on the geographical origin of agricultural products, awarding
quality documentations for organic products and developing processing capacities of
agricultural goods produced locally.
The policies underlying the aforementioned strategies are: organizing the relationship
between producers and marketing agencies, implementing specifications related to
agricultural products, promoting the cultivation of agricultural varieties by regions,
enhancing the cultivation of organic products and supplying agricultural goods complying
with processing requirements.
Fourth goal: expanding the role of the banking sector in the field of finance and
agricultural insurance.
Fifth goal: alleviating poverty by adopting an overall rural development that enables
improving the income of producers as well as maintaining the integration between the
rural sector and the other sectors of the economy.
The strategies related to the above-mentioned aim are: adopting an overall rural
development to achieve social equity, to improve the income of producers and to
strengthen the role of finance linked to small-medium enterprises, enhancing the role of

State of Food and Agriculture in Syria 2010
84
rural women in production activities, and improving the integration between the rural
sector and the other sectors of the economy.
The policies that are in line with the previous strategies are: providing the infrastructure
and services related to targeted rural areas, focusing on the areas that are subject to severe
poverty, developing small-medium projects, enabling the role of women in rural
development, and enhancing the coordination between the agricultural sector and the other
sectors of the economy.
Finally, the implementation of the aforesaid strategies and policies will be supported by the
activities of the NPFS and the high level of governmental investment dedicated to the
MAAR during the 2011-2015 period as compared to that of the 2006-2010 period (Table
A3.10)48.
48 The budget of the 2011-2015 period is about 3.5 folds of that of the 2006-2010 period.

State of Food and Agriculture in Syria 2010
85
Chapter 4 – Agricultural production
Starting from the 1990s, agricultural production in Syria comprising both crops and
livestock has witnessed a considerable improvement following the increase in the
cultivated area particularly the irrigated land, the number of livestock, and the use of
improved seeds, fertilizers, advanced agricultural technologies and high productivity
livestock species. All these factors have been coupled with agricultural policies promoting
agricultural production in compliance with the Government orientation that focuses heavily
on attaining enhanced agricultural development, overall rural development and Good
Agricultural Practices (GAP) so that the living standard of the population especially that of
rural inhabitants is improved. As a consequence from 2000 to 2009, the value of
agricultural production increased from SP337 billion to SP778 billion at current prices and
to SP394 billion at constant prices of 2000, respectively. This increase was due to the
improvement in crop production, livestock production, forestry and fishery, which
constitute the four pillars of agricultural production in Syria.
To analyze the aforementioned progress in agricultural production, this chapter focuses
mainly on averaging the various indicators related to this production over the 2006-2008
period or over 2007-2009 period to be compared with the averages of the 2003-2005
period, to assess the medium-term effect, and with the averages of the 1999-2001 period or
of the 2000-2002 period, to evaluate the long-term impact.
4.1. Crop production
Crop production comprises field crops, vegetables, fruits and forestry products. In turn,
field crops consist of cereals, legumes, grazing and industrial crops. Hence, crop
production can be classified as well as follows: cereals, legumes, grazing crops (green
fodder), industrial crops, vegetables and fruits. These groups are planted as winter and
summer crops in both irrigated and rain-fed lands and play a key role in achieving food
security. Their production size is determined by the cultivated area and the level of the
yield achieved. The attained level of the cultivated area, in turn, relies on prices, costs of
production and foreign trade, while the accomplished yield depends on climatic conditions,

State of Food and Agriculture in Syria 2010
86
applied technologies and farming types. Accordingly, the value of crop production can be
estimated. Some facts related to the aforesaid clusters are presented below.
Cereals include food grains, comprising hard and soft wheat, as well as feed grains,
incorporating barley, maize, sorghum, and oats. Due to the importance of this group for
food security and the development of the livestock sector, it has been receiving a
paramount attention from the Government. Therefore, the state intervenes alongside the
whole value chain of wheat and barley to ensure the production, marketing, and
distribution of these products. For example, it announces indicative prices for wheat and
manages the marketing, distribution and processing of wheat products49. This cluster is also
characterized by both its low labour needs because most of the agricultural operations are
done mechanically and its small water consumption. As a consequence, farmers tend to
increase the share of these crops in the crop rotation when a depressed rainfall and limited
water resources are in place.
Both the Government and farmers are interested in increasing the share of legumes in the
crop rotation because these crops represent an important protein source for humans, a feed
basis for the livestock and a soil fertility agitator. The main legume crops grown in Syria
are lentils land chickpeas. Other crops comprise dry broad beans, haricot dry beans, dry
peas, dry kidney beans, bitter vetch, flowering sern and rambling vetch.
Grazing crops play a key role in both the livestock breeding and the achievement of the
integration between crops and livestock. Therefore, the state gives due attention to
increasing their share in the crop rotation. They incorporate the following crops: barley,
maize, flowering sern, alf-alfa, clover and others.
The importance of industrial crops results from the fact that they include products
delivered to public processing plants such as cotton, sugar beet, tobacco, peanuts, oily
sunflower and aniseeds, as well as to private companies such as soya beans, oily sunflower,
peanut, aniseeds and sesame. This group comprises also important crops such as cumin and
black cumin as well as the aforementioned aniseeds and sesame, which are used as spices
or for the production of medicines. The aforementioned crops also play an important role
in foreign trade as foreign currency suppliers, employment and income generation. Hence,
this group is classified into three sub-groups. The first category denoted as the Strategic
Industrial Crops encompasses seed cotton, sugar beet and tobacco. In this regard, the
49 For more details see Michael Westlake, National Agricultural Policy Center, 2000.

State of Food and Agriculture in Syria 2010
87
MAAR tries to improve the performance of seed cotton farming by conducting research
through the Cotton Bureau. At the same time, it coordinates with the General
Establishment for Cotton Ginning and Marketing to improve the seed cotton industry. It
also cooperates with the General Establishment of Sugar and the General Establishment of
Tobacco to improve both the sugar beet and tobacco industries. The second cluster
identified as the High Value Crops involves cumin, aniseeds, sesame and black cumin. The
third class assigned as Other Industrial Crops contains soya beans, oily sun flower, sun
flower, peanuts, Indian millet and lupines.
Vegetables also attract the attention of both the Government and farmers because they are
considered as a main source of income for producers and labourers and as employment
generator. They also play a foremost role in the alternative crops strategy, foreign trade and
provision of raw material for both advanced and traditional food industries. Vegetable
crops, however, are characterized by high water consumption. Therefore, the state tries to
introduce modern technologies to vegetable cultivations, especially modern irrigation
technologies, to enhance their performance. Furthermore, vegetables are regarded as an
essential element of the food security strategy because they have high nutritional value.
Finally, like vegetables, fruit trees crops account for a considerable portion of employment,
income generation, inputs for food industries both advanced and traditional, foreign trade
and nutrients supply. Therefore, the Government has established several specialized
bureaus within the MAAR to enhance fruit trees farming namely: Olive Bureau, Citrus
Bureau, Apple Bureau and Pistachio Bureau.
4.1.1. Development of some economic aggregates related to crop production
The selected economic aggregates are the total cropped area, total crop production and
value of crop production.
Development of the total cropped area:
The total cropped area increased slightly from 4,671 thousand ha (average (1999-2001)) to
4,709 thousand ha (average (2007-2009)). On average, over this period, this area was
composed of 79% field crops, 3% vegetables and 18% fruit trees. These cultivations are
grown as irrigated and rain-fed crops. The total irrigated area augmented from 1,324
thousand ha (average (1999-2001)) to 1,478 thousand ha (average (2007-2009)), whereas

State of Food and Agriculture in Syria 2010
88
the rain-fed land decreased from 3,347 thousand ha to 3,231 thousand ha, respectively
(Table 4.1 and Table A4.1).
Table 4.1. Development of the average cropped area by cultivation type, 1999-2009 (000 ha, %)
Item Average
1999-2001 Average
2003-2005 Average
2007-2009
Average Change % 2003-2009
Average Change % 1999-2009
AAGR % 1999-2009
Field crops 3,755 3,890 3,585 -7.8 -4.5 -0.8 Irrigated 1,116 1,281 1,172 -8.5 5.1 0.8 Non-irrigated 2,639 2,609 2,413 -7.5 -8.6 -1.5 Vegetables 115 158 172 9.6 48.3 6.8 Irrigated 84 119 138 16.3 63.6 8.6 Non-irrigated 31 39 34 -12.9 7.4 1.2 Fruit trees 801 848 952 12.3 18.9 2.9 Irrigated 124 145 168 16.1 35.1 5.1 Non-irrigated 677 703 784 11.5 15.9 2.5 Total 4,671 4,896 4,709 -3.8 0.8 0.1 Irrigated 1,324 1,545 1,478 -4.3 11.6 1.9 Non-irrigated 3,347 3,351 3,231 -3.6 -3.5 -0.6 Source: Elaborated from the MAAR, the AASA, various issues.
In-depth, in the medium term (2003-2009), Table 4.1 indicates that the total cropped area
and that of field crops were characterized by a decreasing trend due to the droughts
prevailed from 2006-2009, while the cropped areas of vegetables and fruit trees followed
an increasing trend with the exception of that related to rain-fed vegetables. In the long
term (1999-2009), on the other hand, it shows that there was an improvement in the
cropped area especially for irrigated crops when the changes between periods are
compared. It also explains that farmers switched to more nutritious, income generating and
exportable crops. Furthermore, Figure 4.1 clarifies the annual variations in the cropped
area from 1999 to 2009. On average, it indicates small changes in this area between years
with the exception of vegetables. This implies the prevalence of a stable crop production.
Figure 4.1. Annual variations in the cropped area, 1999-2009 (%)
-10.0
-5.0
0.0
5.0
10.0
15.0
20.0
25.0
30.0
2000 2001 2002 2003 2004 2005 2006 2007 2008 2009
%
Field crops
Vegetables
Fruit trees
Total
Source: Elaborated from the MAAR, the AASA, various issues.
Finally, Figure 4.2 shows the cropped area by governorates in 2009 (Table A4.1). It
illustrates that this area is concentrated in both Aleppo and Al-Hassake, which acquire the
highest share of the area related to field crops as well; vegetable cultivations are mostly

State of Food and Agriculture in Syria 2010
89
located in Aleppo, Idleb and Al-Raqqa; fruit trees farming is prevailing highly in Aleppo,
Homs and Idleb.
Figure 4.2. Diversification of the cropped area by governorates, 2009 (ha, %)
Al-Sweida 2%
Dar'a 3% Al-Quneitra
0%
Damascus 2% Homs
7%
Hama 7%
Al-Ghab 2%
Idleb 8%
Tartous 3%
Lattakia 2%
Aleppo 25%
Al-Raqqa 9%
Dair-Ezzor 5%
Al-Hassake 25%
Total area
0
200,000
400,000
600,000
800,000
1,000,000
1,200,000
1,400,000
Al-
Sw
eid
a
Dar
'a
Al-
Qu
nei
tra
Dam
ascu
s
Hom
s
Ham
a
Al-
Gh
ab
Idle
b
Tar
tou
s
Lat
tak
ia
Ale
pp
o
Al-
Raq
qa
Dai
r-E
zzo
r
Al-
Has
sake
ha Area by governorates
Fruit trees
Vegetables
Field crops
Source: Elaborated from the MAAR, the AASA, 2009.
Development of the total crop production:
The total crop production improved from 12,334 thousand tonnes (average (1999-2001)) to
13,196 thousand tonnes (average (2007-2009)). On average, over this period, the structure
of this production was formed of 60% field crops, 20% vegetables and 20% fruits. It is
related to irrigated and non-irrigated farming systems. The total production of irrigated
farming enlarged from 8,791 thousand tonnes (average (1999-2001)) to 10,601 thousand
tonnes (average (2007-2009)), while that of rain-fed cultivations declined from 3,543
thousand tonnes to 2,595 thousand tonnes, respectively. Table 4.2 (Table A4.2) presents
the aforesaid development in-depth indicating the same trend of the cropped area.
Table 4.2. Development of the average crop production by cultivation type, 1999-2009 (000 tonnes, %)
Item Average
1999-2001 Average
2003-2005 Average
2007-2009
Average Change % 2003-2009
Average Change % 1999-2009
AAGR % 1999-2009
Field crops 7,838 9,012 7,119 -21.0 -9.2 -1.6 Irrigated 5,596 6,661 5,840 -12.3 4.3 0.7 Non-irrigated 2,242 2,352 1,279 -45.6 -43.0 -8.9 Vegetables 1,970 2,952 3,085 4.5 56.6 7.8 Irrigated 1,780 2,528 2,914 15.3 63.7 8.6 Non-irrigated 191 424 170 -59.9 -10.8 -1.9 Fruits 2,525 2,658 2,993 12.6 18.5 2.9 Irrigated 1,415 1,435 1,846 28.7 30.5 4.5 Non-irrigated 1,110 1,223 1,146 -6.3 3.2 0.5 Total 12,334 14,622 13,196 -9.8 7.0 1.1 Irrigated 8,791 10,624 10,601 -0.2 20.6 3.2 Non-irrigated 3,543 3,998 2,595 -35.1 -26.8 -5.1 Source: Elaborated from the MAAR, the AASA, various issues.
Moreover, Figure 4.3 illustrates the annual changes in the crop production from 1999 to
2009. On average, it makes clear that the annual changes of this production are

State of Food and Agriculture in Syria 2010
90
substantially higher than those of the cropped area due to the high share of the rain-fed
agriculture and the effect of the drought spells.
Figure 4.3. Annual changes in the crop production, 1999-2009 (%)
-40.0
-20.0
0.0
20.0
40.0
60.0
2000 2001 2002 2003 2004 2005 2006 2007 2008 2009
%
Field crops
Vegetables
Fruits
Total
Source: Elaborated from the MAAR, the AASA, various issues.
Finally, Figure 4.4 shows a disaggregation of the crop production by governorates in 2009
(Table A4.2). In general, it clarifies that this production is concentrated in Aleppo, Al-
Hassake and Al-Raqqa and that of field crops as well; vegetable production is mostly
located in Aleppo, Idleb and Al-Raqqa; fruit production constitutes a high share in
Lattakia, Homs and Aleppo.
Figure 4.4. Diversification of the crop production by governorates and farming type, 2009 (tonne, %)
Al-Sweida
1%
Dar'a 6%
Al-Quneitra
1%
Damascus 5%
Homs 6%
Hama 6%
Al-Ghab 5%
Idleb 9%
Tartous 4%
Lattakia 8%
Aleppo 19%
Al-Raqqa 10%
Dair-Ezzor 7%
Al-Hassake
13%
Total crop production
0
500,000
1,000,000
1,500,000
2,000,000
2,500,000
3,000,000
Al-S
wei
da
Dar
'a
Al-Q
unei
tra
Dam
ascu
s
Hom
s
Ham
a
Al-G
hab
Idle
b
Tarto
us
Latta
kia
Ale
ppo
Al-R
aqqa
Dai
r-Ez
zor
Al-H
assa
ke
tonne Farming type
Field crops Vegetables Fruits
Source: Elaborated from the MAAR, the AASA, 2009.
Value of the crop production:
The value of the crop production (VOCP) increased from SP215 billion in 2000, to SP483
billion at current prices and to SP248 billion at constant prices of 2000 in 2009. On
average, this value constituted 64% of the value of the agricultural production (VOAP)
over this period. This trend also prevailed in the medium and long runs when the average
values at current prices are considered as presented in Table 4.3 (Table A4.3, Table A4.4
and Table A4.5). At constant prices of 2000, however, the VOCP declined in the medium

State of Food and Agriculture in Syria 2010
91
term and increased slightly in the long run. This indicates that price increases had the
substantial impact on the value enlargement.
Table 4.3. Development of the average value of crop production, 2000-2009 (SP million, %)
Item Average
2000-2002 Average
2003-2005 Average
2007-2009
Average Change % 2003-2009
Average Change % 2000-2009
AAGR % 2000-2009
At current prices 240,792 273,682 407,038 48.7 69.0 11.1 At constant prices 231,001 236,188 231,253 -2.1 0.1 0.02 Source: Elaborated from the CBS, the ASA, various issues.
Furthermore, Figure 4.5 presents the development of the structure of the VOCP from 2000
to 2009 at both constant and current prices. It reveals at constant prices that this value
attained its peak in 2006 and decreased thereafter owing to the impact of the drought spells
over the 2006-2009 period. At current prices, on the contrary, there was a continuous
augmentation in this value from 2000 to 2009. This figure also makes clear that fruits had
the highest contribution to the VOCP.
Figure 4.5. Development of the structure of the VOCP, 2000-2009 (SP million)
0
100,000
200,000
300,000
400,000
500,000
600,000
2000
2001
2002
2003
2004
2005
2006
2007
2008
2009
SP million At current prices
Others
Grazing crops
Dry legumes
Vegetables
Fruits
Industrial crops
Cereals0
50,000
100,000
150,000
200,000
250,000
300,000
2000
2001
2002
2003
2004
2005
2006
2007
2008
2009
SP million At constant prices
Others
Grazing crops
Dry legumes
Vegetables
Fruits
Industrial crops
Cereals
Source: Elaborated from the CBS, the ASA, various issues.
The above-mentioned indicators were used to conduct more in-depth analysis considering
the various groups of the crop production presented in Figure 4.5 as shown below.
4.1.2. Cereals
Development of the cropped area:
Table A4.6 specifies that the cropped area of cereals amounted to 2,772 ha in 2009
indicating a substantial decrease in this area as compared to that of the previous years. On
average, this area increased from 3,060 thousand ha (average (1999-2001)) to 3,073
thousand ha (average (2006-2008)), thus constituting about 65% of the total cultivated area
and 82% of the cropped area related to field crops. The most of it is devoted to wheat,
which is grown as soft wheat (53% of the wheat area) and hard wheat (47% of the wheat

State of Food and Agriculture in Syria 2010
92
area), and barley. Table 4.4 presents further information about its structure over the 1999-
2008 period (Table A4.6, Table A4.7 and Table A4.8).
Table 4.4. Development of the cereal cropped area, 1999-2008 (ha, %)
Item Average
1999-2001 Average
2003-2005 Average
2006-2008
Average Change % 2003-2008
Average Change % 1999-2008
AAGR % 1999-2008
Wheat 1,655,200 1,843,689 1,646,794 -10.7 -0.5 -0.1 Irrigated 682,397 842,624 777,273 -7.8 13.9 2.6 Non-irrigated 972,803 1,001,065 869,521 -13.1 -10.6 -2.2 Barley 1,344,627 1,290,451 1,367,786 6 1.7 0.3 Irrigated 16,742 34,921 65,795 88.4 293 31.5 Non-irrigated 1,327,885 1,255,530 1,301,991 3.7 -2 -0.4 Maize 56,314 56,472 55,483 -1.8 -1.5 -0.3 Irrigated 56,300 56,398 55,460 -1.7 -1.5 -0.3 Non-irrigated 14 75 23 -69 61.4 10 Others 3,840 4,500 3,322 -26.2 -13.5 -2.9 Total 3,059,981 3,195,112 3,073,385 -3.8 0.4 0.1 Source: Elaborated from the MAAR, the AASA, 2008.
In detail, in the medium term, Table 4.4 indicates that the cropped area of cereals decreased
excluding that related to barley. This decline can be related to the impact of the drought
spells from 2006 to 2009, which in turn induced a decrease in this area over this period
thus contrasting the proposed goal of the 10th FYP which aims to increase the area. This
conclusion doesn’t apply to barley and rain-fed maize. In the long run, however, it
increased slightly in addition to that linked to irrigated wheat, irrigated barley and rain-fed
maize. Furthermore, cereals are mostly grown in the governorates of Al-Hassake (36%),
Aleppo (30%) and Al-Raqqa (18%).
Development of the yield:
Table A4.9 illustrates the development of the yield related to cereal crops from 1999 to
2009. In addition, Table 4.5 shows the yield development for the most important cereal
crops cultivated in Syria over the 1999-2008 period (Table A4.9, Table A4.10 and Table
A4.11).
Table 4.5. Development of the yield for selected cereal crops, 1999-2008 (kg/ha, %)
Item Average
1999-2001 Average
2003-2005 Average
2006-2008
Average Change % 2003-2008
Average Change % 1999-2008
AAGR % 1999-2008
Wheat 2,116 2,555 2,208 -13.6 4.4 0.9 Irrigated 3,518 4,071 3,687 -9.4 4.8 0.9 Non-irrigated 1,130 1,279 885 -30.8 -21.7 -4.8 Barley 654 616 559 -9.2 -14.5 -3.1 Source: Elaborated from the MAAR, the AASA, 2008.
Table 4.5 reveals that the yield linked to above-mentioned crops declined in the medium
term. In the long run, however, the wheat yield improved owing to the enhancement of the

State of Food and Agriculture in Syria 2010
93
yield related to irrigated wheat. Moreover, considering the 2006-2008 period, the same
crops underwent a yield decline in contrast to the proposed aim of the 10th FYP. When
their yield is disaggregated by Syrian governorates, substantial differences are to observe
due to varied climatic conditions, farming structures and seed varieties as indicated in
Table 4.6, which points out to the prevalence of yield variations by countries as well. This
implies that more ASR in Syria is needed to improve the yield and to narrow yield
dissimilarities.
Table 4.6. Yield of cereals by governorates and countries, 2008 (kg/ha) Yield 1 Yield 2
Governorate Wheat Barley Country Wheat Barley Al-Sweida 34 4 Syria 1,440 182 Dar'a 763 16 Lebanon 2,201 2,102 Al-Quneitra 971 869 Jordan 629 380 Damascus 3,076 175 Egypt 6,501 1,977 Homs 1,369 94 Morocco 1,319 620 Hama 1,298 140 European Union 5,672 4,537 Al-Ghab 3,440 2,547 United States 3,018 3,418 Idleb 1,510 715 World 3,086 2,777 Tartous 1,443 848 Lattakia 1,327 918 Aleppo 1,269 274 Al-Raqqa 2,269 49 Dair-Ezzor 2,885 54 Al-Hassake 1,055 130 Source: Elaborated from the MAAR, the AASA, 2008 and FAO database.
Development of the cereal production:
The achieved levels of the area and yield impact the quantity produced of cereals. As a
result, cereal production totaled 4,735 thousand tonnes in 2009 (Table A4.12). On average,
this quantity increased from 4,576 thousand tonnes (average (1999-2001)) to 4,662
thousand tonnes (average (2006-2008)), Table A4.12, Table A4.13 and Table A4.14. The
development of its average structure is shown in Table 4.7. In the medium term, Table 4.7
also indicates that it followed a diminishing trend with the exception of that related to
irrigated barley due to the droughts prevailed in the 2006-2008 period. This led to not
achieving the target of the 10th FYP over the 2006-2008 period, which proposes an annual
increase in wheat production by 2.6%. In contrast, cereal production pursued upward trend
in general from 1999 to 2008.

State of Food and Agriculture in Syria 2010
94
Table 4.7. Development of the cereal production, 1999-2008 (tonne, %)
Item Average
1999-2001 Average
2003-2005 Average
2006-2008
Average Change % 2003-2008
Average Change % 1999-2008
AAGR % 1999-2008
Wheat 3,513,872 4,706,399 3,703,979 -21.3 5.4 1.1 Irrigated 2,402,086 3,428,400 2,890,529 -15.7 20.3 3.8 Non-irrigated 1,111,786 1,278,000 813,450 -36.3 -26.8 -6.1 Barley 864,336 791,225 749,339 -5.3 -13.3 -2.8 Irrigated 38,171 50,170 114,106 127.4 198.9 24.5 Non-irrigated 826,165 741,056 635,233 -14.3 -23.1 -5.1 Maize 195,722 208,036 205,781 -1.1 5.1 1 Irrigated 195,713 207,894 205,735 -1 5.1 1 Non-irrigated 10 142 46 -67.8 372.4 36.4 Others 2,494 3,855 3,358 -12.9 34.6 6.1 Total 4,576,424 5,709,514 4,662,457 -18.3 1.9 0.4 Source: Elaborated from the MAAR, the AASA, 2008.
Value of the cereal production:
The value of the cereal production amplified from SP39 billion in 2000, to SP90 billion at
current prices and to SP51 billion at constant prices of 2000 in 2009, thus, forming on
average 21% at current prices and 24% at constant prices of the VOCP during the 2000-
2009 period. This implies that this group contributes substantially to the VOCP. Table 4.8
presents further information about the development of this value from 2000 to 2009 (Table
A4.3, Table A4.4 and Table A4.5). It shows that it decreased in the medium term when
evaluated at both current and constant prices. In the long run, on the other hand, it clarifies
that it increased at current prices and declined at constant prices implying that this value
increase is solely related to price augmentation and that there was a decrease in the
quantity produced. This of course impacts negatively the food security situation. To reduce
this negative effect to some extent, the Government compensated the quantity deficit
through stocks.
Table 4.8. Development of the average value of the cereal production, 2000-2009 (SP million, %)
Item Average
2000-2002 Average
2003-2005 Average
2007-2009
Average Change % 2003-2009
Average Change % 2000-2009
AAGR % 2000-2009
At current prices 57,488 63,862 63,845 -0.03 11.1 2.1 At constant prices 58,099 63,006 44,271 -29.7 -23.8 -5.3 Source: Elaborated from the CBS, the ASA, various issues.
4.1.3. Dry legumes
Development of the cropped area:
Table A4.6 reveals that the cropped area of dry legume crops amounted to 215 thousand ha
in 2009. On average, this area enlarged from 266 thousand ha (average (1999-2001)) to
272 thousand ha (average (2006-2008)), thus constituting about 6% of the total cultivated
area and 7% of the cropped area related to field crops. The development of its rough

State of Food and Agriculture in Syria 2010
95
structure is presented in Table 4.9 over the 1999-2008 period (Table A4.6, Table A4.7 and
Table A4.8). Table 4.9 shows that the cropped area of legume crops declined in the
medium term excluding that related to lentils and increased in the long run with the
exception of that committed to chickpeas and feed legumes. Moreover, considering the
2006-2008 period indicates that the area devoted to this group diminished in opposition to
both the quantitative and qualitative targets of the 10th FYP that proposed an expansion of
the area in general and an increase in the share of legume crops in the crop rotation.
Table 4.9. Development of the legume cropped area, 1999-2008 (ha, %)
Item Average
1999-2001 Average
2003-2005 Average
2006-2008
Average Change % 2003-2008
Average Change % 1999-2008
AAGR % 1999-2008
Food legumes 227,714 247,667 241,289 -2.6 6 1.2 Lentils 136,502 139,690 144,988 3.8 6.2 1.2 Chickpeas 79,737 87,225 74,631 -14.4 -6.4 -1.3 Feed legumes 38,394 34,374 31,045 -9.7 -19.1 -4.2 Total 266,108 282,041 272,334 -3.4 2.3 0.5 Source: Elaborated from the MAAR, the AASA, 2008.
Finally, in 2008, legume cultivations were mostly located in the governorates of Aleppo
(33%), Idleb (12.3%), Homs (11.2%) and Al-Hassake (10.8%).
Development of the yield
Table A4.9 presents a disaggregation of the yield connected to legume crops from 1999 to
2009. Furthermore, Table 4.10 clarifies the development of the average yield for the major
legume crops in Syria over the 1999-2008 (Table A4.9, Table A4.10 and Table A4.11).
Table 4.10. Development of the yield for selected legume crops, 1999-2008 (kg/ha, %)
Item Average
1999-2001 Average
2003-2005 Average
2006-2008
Average Change % 2003-2008
Average Change % 1999-2008
AAGR % 1999-2008
Lentils 722 1,067 729 -31.7 1 0.2 Chickpeas 632 742 591 -20.4 -6.5 -1.3 Source: Elaborated from the MAAR, the AASA, 2008.
Table 4.10 makes clear that the yield of the selected crops fell considerably in the medium
term, where in the long run the yield of lentils increased and that of chickpeas decreased. In
addition, Table 4.11 shows that the yields of the aforesaid crops vary noticeably among
Syrian governorates and that the achieved yield level in Syria is very low as compared to
that of other countries.

State of Food and Agriculture in Syria 2010
96
Table 4.11. Yield of legumes by governorates and countries, 2008 (kg/ha) Yield 1 Yield 2
Governorate Lentils Chickpeas Country Legumes Al-Sweida - 12 Syria 436 Dar'a 10 319 Lebanon 2,439 Al-Quneitra - 1,000 Egypt 2,015 Damascus 190 382 Morocco 535 Homs 344 900 European Union 2,751 Hama 169 581 World 767 Al-Ghab 1,241 1,513 Idleb 169 862 Tartous 580 810 Lattakia 649 578 Aleppo 518 215 Al-Raqqa - 2,000 Dair-Ezzor - - Al-Hassake 40 34 Source: Elaborated from the MAAR, the AASA, 2008 and FAO database.
Development of the legume production:
The produced quantity of legume crops totaled 222 thousand tonnes in 2009. On average, it
enlarged from 192 thousand tonnes (average (1999-2001)) to 213 thousand tonnes (average
(2006-2008)). The evolution of its average structure from 1999 to 2008 is shown in Table
4.12 (Table A4.12, Table A4.13 and Table A4.14). Accordingly, it can be concluded that
the legume production decreased from 2003 to 2008 owing to the drought spells over the
2006-2008 period. In the long run, however, it increased owing to the improvement in the
lentil production.
Table 4.12. Development of the legume production, 1999-2008 (tonne, %)
Item Average
1999-2001 Average
2003-2005 Average
2006-2008
Average Change % 2003-2008
Average Change % 1999-2008
AAGR % 1999-2008
Food legumes 169,872 255,556 190,858 -25.3 12.4 2.4 Lentils 97,985 149,134 107,957 -27.6 10.2 2 Chickpeas 51,157 65,814 43,011 -34.6 -15.9 -3.4 Feed legumes 22,321 26,311 21,892 -16.8 -1.9 -0.4 Total 192,193 281,867 212,750 -24.5 10.7 2.1 Source: Elaborated from the MAAR, the AASA, 2008. AAGR: Average annual growth rate.
Value of legume crops:
The value of the legume production augmented from SP3.3 billion in 2000, to SP8.5
billion at current prices and to SP4.9 billion at constant prices of 2000 in 2009, thus
making on average 2% of the VOCP over the 2000-2009 period (Table A4.3, Table A4.4
and Table A4.5). The average development of this value is presented in Table 4.13 from
2000 to 2009. Table 4.13 reveals that this value declined in the medium term when
evaluated at both current and constant prices. In the long run, on the other hand, it indicates
that it increased at current prices and diminished at constant prices implying that the value

State of Food and Agriculture in Syria 2010
97
enlargement is solely linked to price augmentation and that there was a decrease in the
quantity produced.
Table 4.13. Development of the average value of the legume production, 2000-2009 (SP million, %)
Item Average
2000-2002 Average
2003-2005 Average
2007-2009
Average Change % 2003-2009
Average Change % 2000-2009
AAGR % 2000-2009
At current prices 4,882 7,250 6,720 -7.3 37.6 6.6 At constant prices 4,907 5,580 4,139 -29.7 -15.6 -3.3 Source: Elaborated from the CBS, the ASA, various issues.
4.1.4. Grazing crops (green fodder)
Development of the cropped area:
The cropped area of grazing crops amounted to 92 thousand ha in 2009. On average, it
augmented from 50 thousand ha (average (2003-2005)) to 63 thousand ha (average (2006-
2008)), and declined from 67 thousand ha (average (199-2001)) to 63 thousand ha (average
(2006-2008)), Table A4.6, Table A4.7 and Table A4.8, thus accounting for 1.3% of the
total cropped area and 1.6% of the cropped area of field crops. It increased by 14% over
the 2006-2008 period, complying with the quantitative and qualitative goals of the 10th
FYP. In 2008, it was mostly allocated in Dair-Ezzor (45.3%), Al-Raqqa (18.4%) and Al-
Hassake (15.3%).
Development of the green fodder production:
The green fodder production attained 974 thousand tonnes in 2009. On average, it
amplified from 728 thousand tonnes (average (1999-2001)) and 779 thousand tonnes
(average (2003-2005) to 919 thousand tonnes (average (2006-2008)), Table A4.12, Table
A4.13 and Table A4.14, thus constituting about 6% of the crop production and 10% of the
production of the field crops. As a result, the average yield was 11 tonne/ha (average
(1999-2001)), increased to 16 tonne/ha (average (2003-2005)), and then declined to 15
tonne/ha (average (2006-2008)), Table A4.9, Table A4.10 and Table A4.11; it totaled 11
tonne/ha in 2009.
Value of the green fodder production:
The value of the green fodder production enlarged from SP1.5 billion in 2000, to SP4.4
billion at current prices and to SP1.7 billion at constant prices of 2000 in 2009, thus
forming on average 0.8% of the VOCP over the 2000-2009 period ( Table A4.3, Table
A4.4 and Table A4.5). Its average evolution is presented in Table 4.14, which shows an

State of Food and Agriculture in Syria 2010
98
upward trend in both the medium and long terms at both current and constant prices. This
development is considered good for the enhancement of the livestock production because
of the increased availability of the green fodder. At the same time, it has a negative impact
on the livestock resulting from the high increase in fodder prices.
Table 4.14. Development of the average value of the green fodder production, 2000-2009 (SP million, %)
Item Average
2000-2002 Average
2003-2005 Average
2007-2009
Average Change % 2003-2009
Average Change % 2000-2009
AAGR % 2000-2009
At current prices 1,585 1,841 3,920 113 147.3 19.9 At constant prices 1,499 1,478 1,644 11.2 9.7 1.9 Source: Elaborated from the CBS, the ASA, various issues.
4.1.5. Industrial crops
Development of the cropped area:
The cropped area of industrial crops totaled 271 thousand ha in 2009. On average, it
declined from 360 thousand ha (average (1999-2001)) to 332 thousand ha (average (2006-
2008)) owing to the drought spells and the limited water resources over the 2006-2008
period, thus amounting to about 7% of the total cultivated area and 9% of the cropped area
related to field crops. Its decline also prevailed over the 2006-2008 period, thus,
contrasting the quantitative goal of the 10th FYP, which proposes an area increase. Table
4.15 presents a diversification of this area into the various groups of industrial crops
considering some selected products (Table A4.6, Table A4.7 and Table A4.8).
Table 4.15. Development of the cropped area of industrial crops, 1999-2008 (ha, %)
Item Average
1999-2001 Average
2003-2005 Average
2006-2008
Average Change % 2003-2008
Average Change % 1999-2008
AAGR % 1999-2008
Strategic crops 301,481 268,983 239,699 -10.9 -20.5 -4.5 Sugar beet 28,009 27,267 30,093 10.4 7.4 1.4 Seed cotton 257,063 225,770 194,960 -13.6 -24.2 -5.4 Tobacco 16,409 15,946 14,647 -8.2 -10.7 -2.2 High value crops 37,597 75,405 74,666 -1 98.6 14.7 Sesame 5,787 9,211 5,618 -39 -2.9 -0.6 Cumin 29,155 62,077 59,019 -4.9 102.4 15.1 Aniseeds 1,395 1,542 2,215 43.7 58.8 9.7 Black cumin 1,260 2,575 7,814 203.5 520.4 44.1 Other crops 21,256 17,427 17,152 -1.6 -19.3 -4.2 Total 360,333 361,815 331,517 -8.4 -8 -1.7 Source: Elaborated from the MAAR, the AASA, 2008.
In the medium term, Table 4.15 reveals that the cropped area for all selected groups and
products declined with the exception of that related to sugar beet due to encouraging state
prices, aniseeds and black cumin. This trend was also in place in the long run with the
difference that the area of the high value crops increased owing to the augmentation in the

State of Food and Agriculture in Syria 2010
99
area of cumin, small decline in the sesame area and high increase in the area related to
aniseeds and black cumin because of opening new export markets.
Finally, in 2008, the highest allocation to industrial crops was in the governorates of
Aleppo (23.5%), Al-Hassake (20.4%), Al-Raqqa (18.6%), Dair-Ezzor (11.9%) and Idleb
(10.7%).
Development of the yield:
Table A4.9 shows a diversification of the yield by the various industrial crops from 1999 to
2009. In addition, Table 4.16 illustrates the yield development for the major industrial
crops grown in Syria over the 1999-2008 period (Table A4.9, Table A4.10 and Table
A4.11). On average, it shows the prevalence of a diminishing trend over this period.
Table 4.16. Development of the yield for selected industrial crops, 1999-2008 (kg/ha, %)
Item Average
1999-2001 Average
2003-2005 Average
2006-2008
Average Change % 2003-2008
Average Change % 1999-2008
AAGR % 1999-2008
Sugar beet 44,297 43,006 43,350 0.8 -2.1 -0.4 Seed cotton 3,910 4,214 3,608 -14.4 -7.7 -1.6 Tobacco 1,617 1,693 1,570 -7.3 -2.9 -0.6 Source: Elaborated from the MAAR, the AASA, 2008.
Moreover, Table 4.17 presents a comparison of the yield of the aforesaid crops among
Syrian governorates and with other countries in 2008.
Table 4.17. Yield of industrial crops by governorates and countries, 2008 (kg/ha) Yield 1 Yield 2
Governorate Sugar beet
Seed cotton
Tobacco Country Sugar beet
Seed cotton
Tobacco
Al-Sweida - - - Syria 37,421 3,955 1,452 Dar'a - - 2,300 Lebanon 71,860 - 1,106 Al-Quneitra - - - Egypt 47,409 2,333 - Damascus - - - Tunisia - 1,500 1,364 Homs 38,809 2,591 1,929 Morocco 51,600 1,176 1,433 Hama 42,702 3,491 2,123 European Union 65,690 2,622 2,264 Al-Ghab 43,148 3,345 3,544 United States 66,011 2,250 2,537 Idleb 47,313 3,883 1,407 World 51,886 2,099 1,861 Tartous - - 961 Lattakia - - 1,288 Aleppo 50,694 3,720 2,056 Al-Raqqa 35,269 3,950 - Dair-Ezzor 9,580 3,153 - Al-Hassake - 4,597 - Source: Elaborated from the MAAR, the AASA, 2008 and FAO database.
Table 4.17 clarifies that the yield varies noticeably between Syrian provinces and
countries, which implies that more ASR is needed in Syria to narrow yield differences.
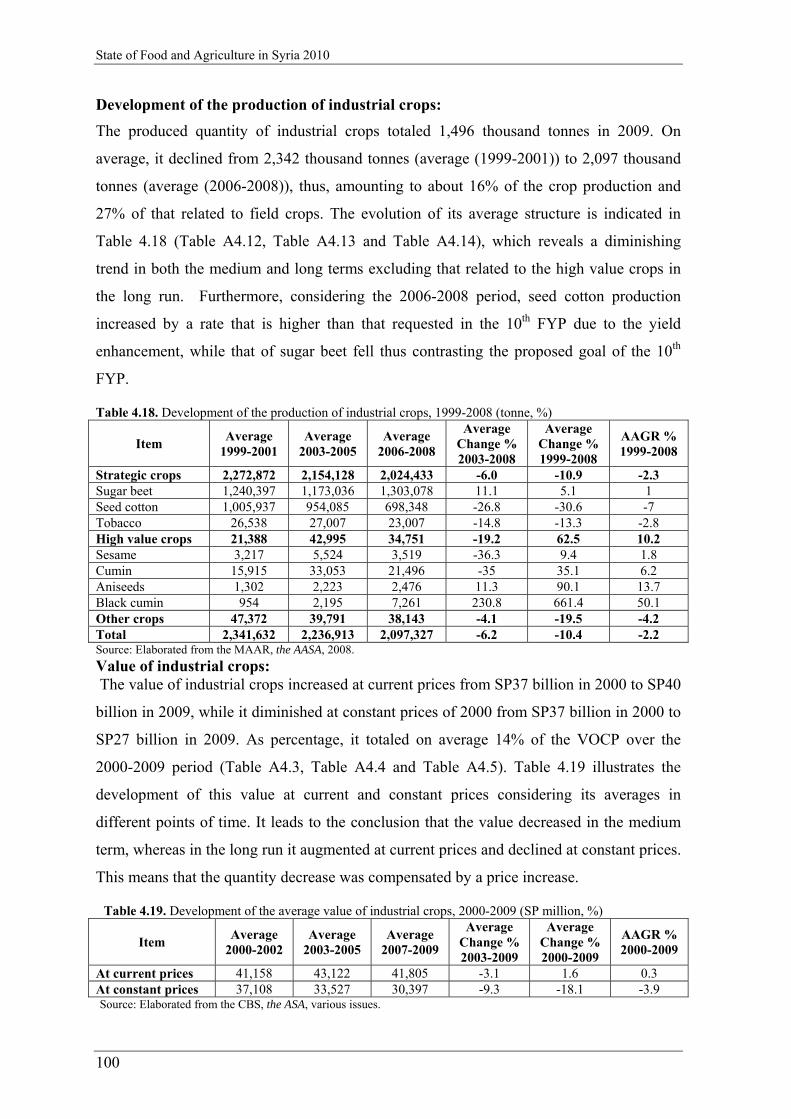
State of Food and Agriculture in Syria 2010
100
Development of the production of industrial crops:
The produced quantity of industrial crops totaled 1,496 thousand tonnes in 2009. On
average, it declined from 2,342 thousand tonnes (average (1999-2001)) to 2,097 thousand
tonnes (average (2006-2008)), thus, amounting to about 16% of the crop production and
27% of that related to field crops. The evolution of its average structure is indicated in
Table 4.18 (Table A4.12, Table A4.13 and Table A4.14), which reveals a diminishing
trend in both the medium and long terms excluding that related to the high value crops in
the long run. Furthermore, considering the 2006-2008 period, seed cotton production
increased by a rate that is higher than that requested in the 10th FYP due to the yield
enhancement, while that of sugar beet fell thus contrasting the proposed goal of the 10th
FYP.
Table 4.18. Development of the production of industrial crops, 1999-2008 (tonne, %)
Item Average
1999-2001 Average
2003-2005 Average
2006-2008
Average Change % 2003-2008
Average Change % 1999-2008
AAGR % 1999-2008
Strategic crops 2,272,872 2,154,128 2,024,433 -6.0 -10.9 -2.3 Sugar beet 1,240,397 1,173,036 1,303,078 11.1 5.1 1 Seed cotton 1,005,937 954,085 698,348 -26.8 -30.6 -7 Tobacco 26,538 27,007 23,007 -14.8 -13.3 -2.8 High value crops 21,388 42,995 34,751 -19.2 62.5 10.2 Sesame 3,217 5,524 3,519 -36.3 9.4 1.8 Cumin 15,915 33,053 21,496 -35 35.1 6.2 Aniseeds 1,302 2,223 2,476 11.3 90.1 13.7 Black cumin 954 2,195 7,261 230.8 661.4 50.1 Other crops 47,372 39,791 38,143 -4.1 -19.5 -4.2 Total 2,341,632 2,236,913 2,097,327 -6.2 -10.4 -2.2 Source: Elaborated from the MAAR, the AASA, 2008.
Value of industrial crops: The value of industrial crops increased at current prices from SP37 billion in 2000 to SP40
billion in 2009, while it diminished at constant prices of 2000 from SP37 billion in 2000 to
SP27 billion in 2009. As percentage, it totaled on average 14% of the VOCP over the
2000-2009 period (Table A4.3, Table A4.4 and Table A4.5). Table 4.19 illustrates the
development of this value at current and constant prices considering its averages in
different points of time. It leads to the conclusion that the value decreased in the medium
term, whereas in the long run it augmented at current prices and declined at constant prices.
This means that the quantity decrease was compensated by a price increase.
Table 4.19. Development of the average value of industrial crops, 2000-2009 (SP million, %)
Item Average
2000-2002 Average
2003-2005 Average
2007-2009
Average Change % 2003-2009
Average Change % 2000-2009
AAGR % 2000-2009
At current prices 41,158 43,122 41,805 -3.1 1.6 0.3 At constant prices 37,108 33,527 30,397 -9.3 -18.1 -3.9 Source: Elaborated from the CBS, the ASA, various issues.

State of Food and Agriculture in Syria 2010
101
4.1.6. Vegetables
Development of the cropped area:
The cropped area of vegetables enlarged from 116 thousand ha (average (1999-2001)) to
172 thousand ha (average (2007-2009)). It also increased over the 2006-2008 period to be
in line with the quantitative goal of the 10th FYP. Its share amounted on average to about
3% of the total cultivated area and 4% of the cropped area related to field crops over the
1999-2009 period. In this regard, the most important crops grown in Syria are tomato,
potato and water melon. The development of the average area devoted to these crops and
total vegetables is shown in Table 4.20 for the 1999-2008 period (Table A4.6, Table A4.7
and Table A4.8). Table A4.6 provides additionally information about the cropped area
related to vegetable crops in 2009.
Table 4.20. Development of the cropped area of vegetables, 1999-2008 (ha, %)
Item Average
1999-2001 Average
2003-2005 Average
2006-2008
Average Change % 2003-2008
Average Change % 1999-2008
AAGR % 1999-2008
Total vegetables 115,768 157,064 167,755 6.8 44.9 7.7 Field tomato 15,691 13,867 15,146 9.2 -3.5 -0.7 Potato 22,935 27,147 31,674 16.7 38.1 6.7 Water melon 12,779 26,815 28,777 7.3 125.2 17.6 Source: Elaborated from the MAAR, the AASA, 2008.
Table 4.20 indicates that the area dedicated to vegetables amplified owing to the high
returns, new export markets and introduction of vegetables as alternative crops in the crop
rotation. It also specifies that the area assigned to all selected crops increased in the
medium term, where in the long run the area of field tomato declined because the other
crops are less water consuming. Other factors that led to a decrease of the field tomato area
can be the switch of farmers to using high yielding varieties and adopting greenhouse
cultivations, which are characterized by the use of advanced irrigation technologies and
very high yielding varieties, low demand for land resources and high returns. In this regard,
it is worthy to note that tomatoes and potatoes are grown in three seasons to cover the
demand for fresh produce, export and food processing.
Development of the yield:
Table A4.9 specifies a diversification of the yield by vegetable crops from 1999 to 2009.
Moreover, Table 4.21 furnishes the yield development for the major vegetable crops grown
in Syria from 1999 to 2008 (Table A4.9, Table A4.10 and Table A4.11). It explains that the

State of Food and Agriculture in Syria 2010
102
yield of tomato improved where the yield of potato and water melon diminished in both the
medium and long terms.
Table 4.21. Development of the yield for selected vegetable crops, 1999-2008 (kg/ha, %)
Item Average
1999-2001 Average
2003-2005 Average
2006-2008
Average Change % 2003-2008
Average Change % 1999-2008
AAGR % 1999-2008
Field tomato 25,972 39,380 43,428 10.3 67.2 10.8 Potato 20,923 20,068 19,998 -0.4 -4.4 -0.9 Water melon 18,157 25,956 17,635 -32.1 -2.9 -0.6 Source: Elaborated from the MAAR, the AASA, 2008.
Table 4.22 provides additionally a comparison of the yield among Syrian provinces and
countries in 2008. It points out to substantial yield differences among regions especially by
tomato. These dissimilarities also exist among countries. Such yield variations indicate that
there is a potential to increase the level of the yield in Syria.
Table 4.22. Yield of vegetable crops by governorates and countries, 2008 (kg/ha) Yield 1 Yield 2
Governorate Field tomato Potato Country Vegetables Potato Al-Sweida 95,286 - Syria 16,889 19,918 Dar'a 95,990 28,433 Lebanon 10,725 25,602 Al-Quneitra 90,000 - Jordan 32,273 23,924 Damascus 75,739 26,673 Egypt 18,125 10,894 Homs 28,267 17,150 Tunisia 12,188 14,919 Hama 14,386 16,944 Morocco 13,647 24,468 Al-Ghab 26,619 19,218 European Union 17,039 28,767 Idleb 18,324 21,088 United States 79,328 44,240 Tartous 13,428 24,632 World 14,339 17,268 Lattakia 18,326 17,088 Aleppo 20,883 20,541 Al-Raqqa 27,707 17,500 Dair-Ezzor 20,148 18,070 Al-Hassake 15,842 9,710 Source: Elaborated from the MAAR, the AASA, 2008 and FAO database.
Development of the vegetable production:
The produced quantity of vegetables increased from 1,970 thousand tonnes (average (1999-
2001)) to 3,085 thousand tonnes (average (2007-2009)), thus accounting for about 19% of
the crop production and 32% of that related to field crops over the 2006-2008 period. Its
evolution considering the most important crops is presented in Table 4.23 (Table A4.12,
Table A4.13 and Table A4.14). Table 4.23 shows that the total vegetable production
increased in the medium and long terms. This trend was also in place for the selected crops
with the exception of water melon in the medium term. Table 4.23 also points out to a high
contribution of greenhouse tomatoes to total tomato production.

State of Food and Agriculture in Syria 2010
103
Table 4.23. Development of the production of vegetables, 1999-2008 (tonne, %)
Item Average
1999-2001 Average
2003-2005 Average
2006-2008
Average Change % 2003-2008
Average Change % 1999-2008
AAGR % 1999-2008
Total vegetables 1,970,416 2,951,924 2,980,122 1.0 51.2 8.6 Total tomato 711,727 948,609 1,143,854 20.6 60.7 10 Field tomato 409,346 544,245 657,790 20.9 60.7 10 Greenhouse tomato 302,381 404,364 486,064 20.2 60.7 10 Potato 479,139 545,609 631,344 15.7 31.8 5.7 Water melon 229,331 691,526 511,966 -26 123.2 17.4 Source: Elaborated from the MAAR, the AASA, 2008.
Value of vegetable crops:
Vegetable production valued SP19 billion in 2000, SP76 billion at current prices in 2009
and SP29 billion at constant prices of 2000 in 2009. As percentage, this value contributed
on average to 12.5% of the VOC at current prices and to about 10.6% of the VOCP at
constant prices of 2000 over the 2000-2009 period (Table A4.3, Table A4.4 and Table
A4.5). Considering the averages of different periods of time, Table 4.24 indicates an
increase in the aforementioned value at both current and constant prices in the medium and
long runs. The augmentation at current prices, however, is substantially higher than that at
constant prices. This means, in turn, that the produced quantity of vegetables increased,
which reveals a positive sign for food security. But, at the same time, the prices of
vegetables increased considerably at a higher rate than that related to quantities, which
impacts negatively the nutritional status of the Syrian population.
Table 4.24. Development of the average value of vegetable crops, 2000-2009 (SP million, %)
Item Average
2000-2002 Average
2003-2005 Average
2007-2009
Average Change % 2003-2009
Average Change % 2000-2009
AAGR % 2000-2009
At current prices 21,524 29,455 72,827 147.3 238.4 27.6 At constant prices 20,409 24,518 29,170 19 42.9 7.4 Source: Elaborated from the CBS, the ASA, various issues.
4.1.7. Fruit trees
Development of the cropped area:
The cropped area of fruit trees enhanced from 801 thousand ha (average (1999-2001)) to
952 thousand ha (average (2007-2009)). This trend was also in place over the 2006-2008
period to be in line with the quantitative goal of the 10th FYP. Its share formed on average
about 18% of the total cultivated area and 23% of the cropped area related to field crops
over the 1999-2009 period. This area is mostly dedicated to Olives, grapes, pistachios,
apples, almonds and citrus trees as shown in Table 4.25 for the 1999-2008 period (Table
A4.6, Table A4.7 and Table A4.8). Table 4.25 also indicates that there was an increase in
the area committed to fruit trees in the medium and long runs. This is mostly due to

State of Food and Agriculture in Syria 2010
104
opening new export markets. In-depth, the cropped area of all selected crops increased in
the medium term with the exception of that related to pistachios owing to the drought
spells over the 2006-2008 period. In the long run, however, in addition to pistachios the
cropped area of grapes and apples declined. The decrease in the cropped area of grapes can
be explained by substituting grape trees with others that are more profitable.
Table 4.25. Development of the cropped area of fruit trees, 1999-2008 (ha, %)
Item Average
1999-2001 Average
2003-2005 Average
2006-2008
Average Change % 2003-2008
Average Change % 1999-2008
AAGR % 1999-2008
Total fruit trees 801,053 847,910 926,204 9.2 15.6 2.9 Olives 478,936 530,998 594,166 11.9 24.1 4.4 Grapes 69,326 52,430 55,069 5 -20.6 -4.5 Pistachios 58,816 57,023 56,496 -0.9 -3.9 -0.8 Apples 49,171 44,568 46,817 5 -4.8 -1 Almonds 41,058 58,874 61,607 4.6 50 8.5 Citrus 27,544 30,786 35,758 16.2 29.8 5.4 Source: Elaborated from the MAAR, the AASA, 2008.
Development of the yield
Table A4.9 presents the evolution of the yield by fruit trees crops from 1999 to 2009. Table
4.26, on the other hand, explains only the yield evolution for the major fruit trees crops
grown in Syria over the 1999-2008 period (Table A4.9, Table A4.10 and Table A4.11). It
indicates that there was an overall improvement in the yield of the selected crops over the
considered period. Accordingly, only the yield related to grapes and almonds decreased in
the medium term. The decline in the grape yield also prevailed in the long run in addition
to that of citrus, where the yield of the other crops improved.
Table 4.26. Development of the yield for selected fruit trees crops, 1999-2008 (kg/ha, %)
Item Average
1999-2001 Average
2003-2005 Average
2006-2008
Average Change % 2003-2008
Average Change % 1999-2008
AAGR % 1999-2008
Olives 1,227 1,375 1,424 3.6 16.1 3 Grapes 5,700 5,439 5,388 -0.9 -5.5 -1.1 Pistachios 609 662 1,049 58.3 72.1 11.5 Apples 5,651 7,186 7,226 0.6 27.9 5 Almonds 1,377 2,768 1,431 -48.3 3.9 0.8 Citrus 28,457 24,580 27,205 10.7 -4.4 -0.9 Source: Elaborated from the MAAR, the AASA, 2008.
Table 4.27 adds further information to enable a yield comparison among Syrian provinces
and with other countries in 2008. It points out to substantial yield differences among Syrian
regions. As for other countries, Syria is in a good position only as citrus yield as
concerned. This implies that there is a potential to increase the yield in Syria.

State of Food and Agriculture in Syria 2010
105
Table 4.27. Yield of fruit trees crops by governorates and countries, 2008 Yield 1 (kg/tree) Yield 2 (kg/ha)
Governorate Olives Apples Citrus Country Olives Apples Citrus Al-Sweida 2 35 - Syria 1,340 7,616 27,890 Dar'a 12 - 17 Lebanon 1,300 12,396 23,415 Al-Quneitra 11 29 - Jordan 1,554 15,239 13,503 Damascus 12 24 15 Egypt 6,360 9,685 9,092 Homs 10 58 28 Tunisia 394 3,929 12,000 Hama 7 27 12 Morocco 1,398 15,113 15,449 Al-Ghab 19 22 19 European Union 2,510 21,780 18,797 Idleb 12 44 45 United States 4,857 31,278 34,463 Tartous 15 24 75 World 1,668 14,358 14,007 Lattakia 25 37 104 Aleppo 8 27 28 Al-Raqqa 16 44 35 Dair-Ezzor 21 24 24 Al-Hassake 11 10 - Source: Elaborated from the MAAR, the AASA, 2008 and FAO database.
Development of the fruit production:
The fruit production amplified considerably from 2,525 thousand tonnes (average (1999-
2001)) to 2,993 thousand tonnes (average (2007-2009)). On the contrary, this production
decreased over the 2006-2008 period thus contradicting the proposed goal of the 10th FYP.
This opposition doesn’t apply to grapes and citrus. On average, the aforementioned
produced quantity amounted to about 20% of the crop production and 33% of that related
to field crops over the 1999-2008 period. Its development considering selected crops is
illustrated in Table 4.28 (Table A4.12, Table A4.13 and Table A4.14) over the 1999-2008
period. Table 4.28 shows that the fruit production followed an upward trend in general
excluding almonds in the medium term and grapes in the long run. Of course, this
production relies heavily on the number of fruit bearing trees and the yield per tree as
shown in Table A4.15.
Table 4.28. Development of the fruit production, 1999-2008 (tonne, %)
Item Average
1999-2001 Average
2003-2005 Average
2006-2008
Average Change % 2003-2008
Average Change % 1999-2008
AAGR % 1999-2008
Total fruit production 2,525,211 2,658,210 3,030,513 14 20 3.7 Olives 587,838 730,555 837,708 14.7 42.5 7.3 Grapes 395,142 285,489 296,907 4 -24.9 -5.6 Pistachios 35,831 37,791 59,268 56.8 65.4 10.6 Apples 277,816 320,312 338,424 5.7 21.8 4 Almonds 56,491 164,103 88,609 -46 56.9 9.4 Citrus 784,356 758,148 973,447 28.4 24.1 4.4 Source: Elaborated from the MAAR, the AASA, 2008.
Table A4.15 indicates that there was an increase in both the number of trees and the tree
productivity from 1999 to 2008 (Figure 4.6) and that substantial yield differences exist
among governorates for both irrigated and non-irrigated fruit trees.
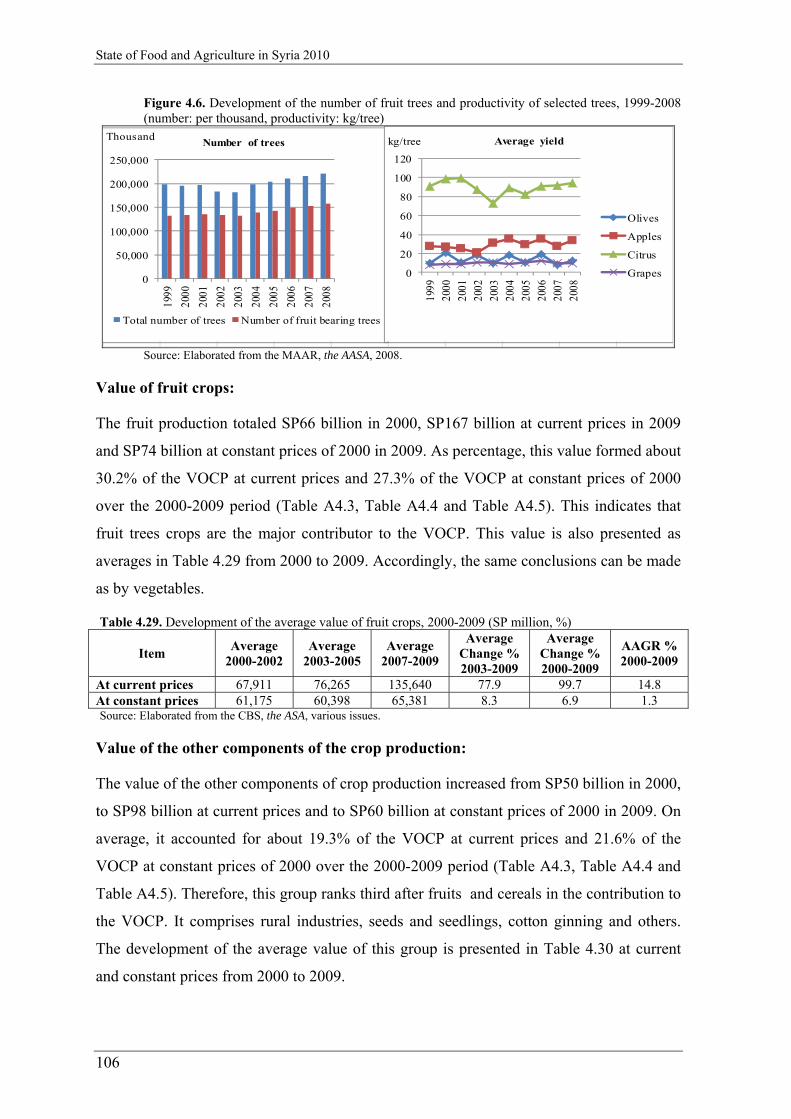
State of Food and Agriculture in Syria 2010
106
Figure 4.6. Development of the number of fruit trees and productivity of selected trees, 1999-2008 (number: per thousand, productivity: kg/tree)
0
50,000
100,000
150,000
200,000
250,00019
99
2000
2001
2002
2003
2004
2005
2006
2007
2008
Thousand Number of trees
Total number of trees Number of fruit bearing trees
0
20
40
60
80
100
120
1999
2000
2001
2002
2003
2004
2005
2006
2007
2008
kg/tree Average yield
Olives
Apples
Citrus
Grapes
Source: Elaborated from the MAAR, the AASA, 2008.
Value of fruit crops:
The fruit production totaled SP66 billion in 2000, SP167 billion at current prices in 2009
and SP74 billion at constant prices of 2000 in 2009. As percentage, this value formed about
30.2% of the VOCP at current prices and 27.3% of the VOCP at constant prices of 2000
over the 2000-2009 period (Table A4.3, Table A4.4 and Table A4.5). This indicates that
fruit trees crops are the major contributor to the VOCP. This value is also presented as
averages in Table 4.29 from 2000 to 2009. Accordingly, the same conclusions can be made
as by vegetables.
Table 4.29. Development of the average value of fruit crops, 2000-2009 (SP million, %)
Item Average
2000-2002 Average
2003-2005 Average
2007-2009
Average Change % 2003-2009
Average Change % 2000-2009
AAGR % 2000-2009
At current prices 67,911 76,265 135,640 77.9 99.7 14.8 At constant prices 61,175 60,398 65,381 8.3 6.9 1.3 Source: Elaborated from the CBS, the ASA, various issues.
Value of the other components of the crop production:
The value of the other components of crop production increased from SP50 billion in 2000,
to SP98 billion at current prices and to SP60 billion at constant prices of 2000 in 2009. On
average, it accounted for about 19.3% of the VOCP at current prices and 21.6% of the
VOCP at constant prices of 2000 over the 2000-2009 period (Table A4.3, Table A4.4 and
Table A4.5). Therefore, this group ranks third after fruits and cereals in the contribution to
the VOCP. It comprises rural industries, seeds and seedlings, cotton ginning and others.
The development of the average value of this group is presented in Table 4.30 at current
and constant prices from 2000 to 2009.

State of Food and Agriculture in Syria 2010
107
Table 4.30. Development of the average value of the other products of the crop production, 2000-2009 (SP million, %)
Item Average
2000-2002 Average
2003-2005 Average
2007-2009
Average Change % 2003-2009
Average Change % 2000-2009
AAGR % 2000-2009
At current prices 46,245 51,887 82,281 58.6 77.9 12.2 At constant prices 47,805 47,680 56,251 18 17.7 3.3 Source: Elaborated from the CBS, the ASA, various issues.
4.2. Livestock production
The livestock and its related products have a dominant role in Syria because they
contribute considerably to food security, income generation and employment. Therefore,
the government provides the required services to livestock producers to improve the
performance of this sub-sector. In this regard, the Government focuses heavily on the
development of sheep, goats, cattle and poultry populations, livestock products and
livestock based industries. This can be assessed using various measures such as the number
of livestock, per head productivity, production level and value of the produce.
4.2.1. Development of the number of livestock
This section focuses on assessing the evolution of the number of cattle, sheep, goats and
poultry, which is presented in Table 4.31 (Table A4.16). Table 4.31 shows that the
livestock number witnessed on average a considerable growth from 1999 to 2009 with the
exception of that related to poultry in the medium term. This progress is due to
governmental policies promoting livestock activities. The decline in the poultry number, on
the other hand, can be related to price increases of fodder and layer chicks.
Table 4.31. Development of the number of livestock, 1999-2009 (thousand, %)
Item Average
1999-2001 Average
2003-2005 Average
2007-2009
Average Change % 2003-2009
Average Change % 1999-2009
AAGR % 1999-2009
Total cattle 933 1,015 1,121 10.4 20.1 3.1 Milked cows 446 516 614 19.0 37.7 5.5 Total sheep 13,289 17,503 20,146 15.1 51.6 7.2 Milked sheep 8,572 11,601 13,792 18.9 60.9 8.2 Total goats 1,025 1,148 1,549 35.0 51.2 7.1 Milked goats 710 775 1,053 35.9 48.4 6.8 Total poultry 21,253 25,905 24,576 -5.1 15.6 2.5 Layers 13,900 18,577 16,451 -11.4 18.4 2.8 Source: Elaborated from the MAAR, the AASA, various isuues.
The aforementioned livestock races are managed by the private, cooperative and public
sectors. The public sector has a very minor role; the cooperative sector focuses on cattle,
sheep and goats breeding, where the private sector is specialized in poultry rearing. These
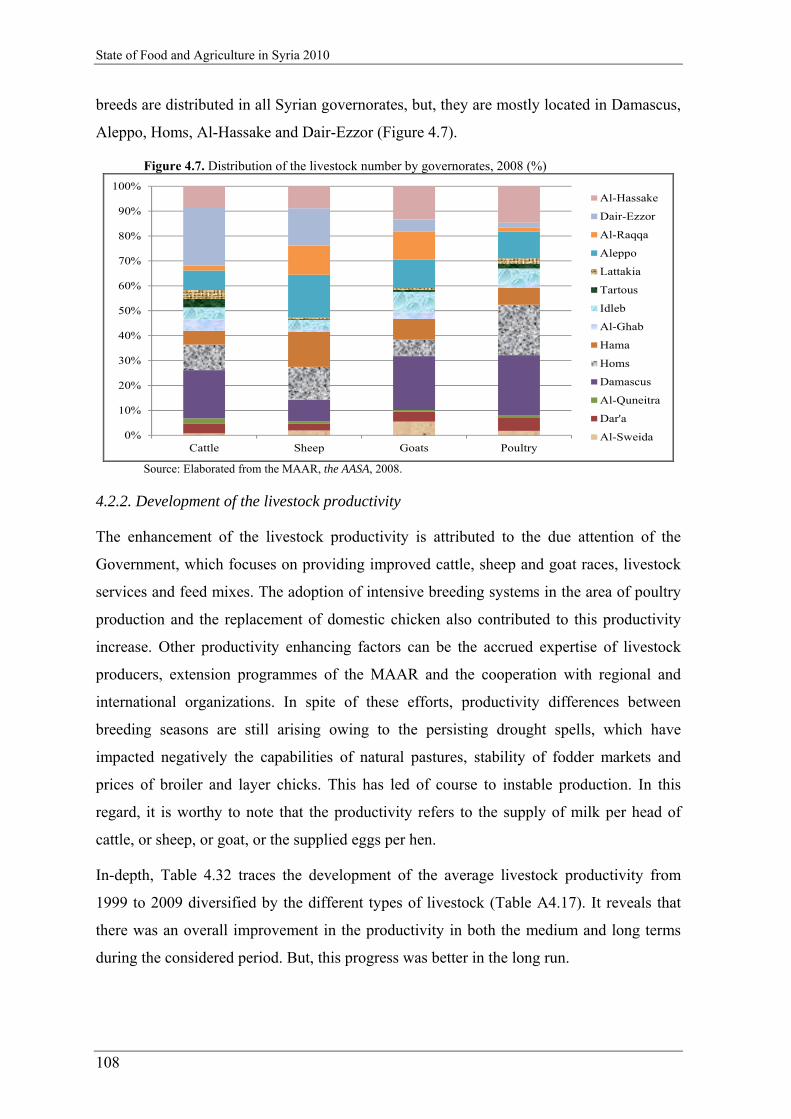
State of Food and Agriculture in Syria 2010
108
breeds are distributed in all Syrian governorates, but, they are mostly located in Damascus,
Aleppo, Homs, Al-Hassake and Dair-Ezzor (Figure 4.7).
Figure 4.7. Distribution of the livestock number by governorates, 2008 (%)
0%
10%
20%
30%
40%
50%
60%
70%
80%
90%
100%
Cattle Sheep Goats Poultry
Al-Hassake
Dair-Ezzor
Al-Raqqa
Aleppo
Lattakia
Tartous
Idleb
Al-Ghab
Hama
Homs
Damascus
Al-Quneitra
Dar'a
Al-Sweida
Source: Elaborated from the MAAR, the AASA, 2008.
4.2.2. Development of the livestock productivity
The enhancement of the livestock productivity is attributed to the due attention of the
Government, which focuses on providing improved cattle, sheep and goat races, livestock
services and feed mixes. The adoption of intensive breeding systems in the area of poultry
production and the replacement of domestic chicken also contributed to this productivity
increase. Other productivity enhancing factors can be the accrued expertise of livestock
producers, extension programmes of the MAAR and the cooperation with regional and
international organizations. In spite of these efforts, productivity differences between
breeding seasons are still arising owing to the persisting drought spells, which have
impacted negatively the capabilities of natural pastures, stability of fodder markets and
prices of broiler and layer chicks. This has led of course to instable production. In this
regard, it is worthy to note that the productivity refers to the supply of milk per head of
cattle, or sheep, or goat, or the supplied eggs per hen.
In-depth, Table 4.32 traces the development of the average livestock productivity from
1999 to 2009 diversified by the different types of livestock (Table A4.17). It reveals that
there was an overall improvement in the productivity in both the medium and long terms
during the considered period. But, this progress was better in the long run.

State of Food and Agriculture in Syria 2010
109
Table 4.32. Development of the livestock productivity, 1999-2009
Item Unit Average
99-01 Average
03-05 Average
07-09
Average Change %
03-09
Average Change %
99-09
AAGR %99-09
Total cows kg/head 2,488 2,632 2,669 1.4 7.3 1.2 Local cows kg/head 819 806 1,226 52.2 49.7 7.0 Shami cows kg/head 2,006 2,068 2,391 15.6 19.2 3.0 Improved cows kg/head 2,500 2,677 2,604 -2.7 4.2 0.7 Foreign cows kg/head 3,795 4,193 4,295 2.4 13.2 2.1 Sheep kg/head 54 59 56 -5.9 2.8 0.5 Total goats kg/head 93 97 93 -4.3 -0.2 0.0 Shami goats kg/head 246 360 392 8.9 59.3 8.1 Mountainous goats kg/head 87 89 85 -4.5 -2.3 -0.4 Total layers egg/hen 185 190 197 3.5 6.3 1.0 Farm layers egg/hen 208 195 184 -5.8 -11.7 -2.1 Local layers egg/hen 101 92 106 14.9 4.6 0.8 Source: Elaborated from the MAAR, the AASA, various issues.
The productivity shown in Table 4.32 varies between governorates owing to varied
conditions of livestock breeding and experience. These productivity differences are
indicated in Figure 4.8.
Figure 4.8. Livestock productivity by governorates, 2008 (kg/head, egg/hen)
0500
1,0001,5002,0002,5003,0003,5004,000
Al-
Swei
daD
ar'a
Al-
Qun
eitr
aD
amas
cus
Hom
sH
ama
Al-
Gha
bId
leb
Tar
tous
Lat
taki
aA
lepp
oA
l-R
aqqa
Dai
r-E
zzor
Al-
Has
sake
kg/head Cattle
0
20
40
60
80
100
120
140
Al-
Swei
daD
ar'a
Al-
Qun
eitr
aD
amas
cus
Hom
sH
ama
Al-
Gha
bId
leb
Tar
tous
Lat
taki
aA
lepp
oA
l-R
aqqa
Dai
r-E
zzor
Al-
Has
sake
kg/head Sheep and goats
Sheep Goats
0
50
100
150
200
250
Al-
Swei
daD
ar'a
Al-
Qun
eitr
aD
amas
cus
Hom
sH
ama
Al-
Gha
bId
leb
Tar
tous
Lat
taki
aA
lepp
oA
l-R
aqqa
Dai
r-E
zzor
Al-
Has
sake
egg/hen Layers
Source: Elaborated from the MAAR, the AASA, 2008.
Productivity dissimilarities also exist between countries. Table 4.33 shows such variations. From this table it can be concluded that there is still a potential to increase the livestock productivity in Syria. Table 4.33. Development of the livestock productivity by countries, 2008 (milk: kg/head, eggs: kg/hen) Item Syria Jordan Egypt Morocco Austria United States European Union World
Cattle 2,653 6,190 1,728 1,133 5,337 9,343 6,107 2,343 Sheep 53 62 - 36 - - 121 46 Goats 91 70 14 30 - - 241 85 Layers 10 24 10 6 11 16 14 10 Source: Elaborated from the MAAR, the AASA, 2008 and FAO database.
4.2.3. Development of the production of livestock products
Table 4.34 indicates the development of the major livestock products from 1999 to 2009
(Table A4.18). It shows that a good progress was achieved by producing the various
livestock products in both the medium and long terms excluding eggs in the medium run.

State of Food and Agriculture in Syria 2010
110
This fall in egg production from 2003 to 2009 can be related to the high production cost
and a diminishing demand due to price increase. In addition, when the evolution of the
livestock produce over the 2006-2008 period is considered, it can be concluded that the
proposed goals of the 10th FYP were not attained. The growth rates of red and poultry
meats were low as compared to the planned quantitative aims50; these rates were even
negative for milk, eggs and fish (Table A4.18).
Table 4.34. Development of the livestock products, 1999-2009 (000 tonnes, %)
Item Average
1999-2001 Average
2003-2005 Average
2007-2009
Average Change % 2003-2009
Average Change % 1999-2009
AAGR % 1999-2009
Total meat 350 404 462 14.2 31.9 4.7 Red meat 227 222 266 19.8 17.1 2.7 White meat 123 182 196 7.4 59.3 8.1 Milk 1,636 2,121 2,505 18.1 53.1 7.4 Eggs (million) 2,565 3,518 3,235 -8.1 26.1 3.9 Source: Elaborated from the MAAR, the AASA, various issues.
4.2.4. Value of the livestock production
The value of the livestock production (VOLP) improved from SP122 billion in 2000, to
SP296 billion at current prices and to SP146 billion at constant prices of 2000 in 2009. As
percentage, it amounted on average to 36-40.4% of the value of agricultural production
(VOAP) over the 2000-2009 period. This trend continued to prevail when the averages are
considered as presented in Table 4.35 (Table A4.3, Table A4.4 and Table A4.5). Table
4.35 reveals that the VOLP increased at both current and constant prices, but, it augmented
substantially faster at current prices. This means that price increases shaped this value to a
great extent.
Table 4.35. Development of the average value of the livestock production, 2000-2009 (SP million, %)
Item Average
2000-2002 Average
2003-2005 Average
2007-2009
Average Change % 2003-2009
Average Change % 2000-2009
AAGR % 2000-2009
At current prices 125,864 149,187 256,749 72.1 104 15.3 At constant prices 120,489 135,338 145,031 7.2 20.4 3.8 Source: Elaborated from the CBS, the ASA, various issues.
The aforementioned development has positive and negative consequences. The positive
connotations result from an increased availability of the livestock produce. The negative
impact, however, is related to high prices, which affect negatively the food security
situation.
Figure 4.9 presents further information about the development of the VOLP considering its
structure from 2000 to 2009 at constant and current prices. At constant prices, this value
50 See chapter three.

State of Food and Agriculture in Syria 2010
111
has continued to decline until 2003, then increased to reach its peak in 2006, and decreased
thereafter to have its trough in 2008. Its variations are linked to varied production levels.
They impacted at first place by meat products and then by dairies. At current prices, on the
other hand, it has witnessed a continuous increase. Again, meat and dairy products were
the major contributors to this value.
Figure 4.9. Development of the value of the livestock production, 2000-2009 (SP million)
0
50,000
100,000
150,000
200,000
250,000
300,000
350,000
2000
2001
2002
2003
2004
2005
2006
2007
2008
2009
SP million At current prices
Others
Fish
Eggs
Meat
Daries
0
20,000
40,000
60,000
80,000
100,000
120,000
140,000
160,000
180,000
2000
2001
2002
2003
2004
2005
2006
2007
2008
2009
SP million At constant prices
Others
Fish
Eggs
Meat
Dairies
Source: Elaborated from the CBS, the ASA, various issues.
Value of meat products:
The value of meat products enlarged from SP67 billion in 2000, to SP129 billion at current
prices and to SP74 billion at constant prices of 2000 in 2009. This increase enabled this
group to contribute on average to about 18% of the VOAP and to about 49% of the VOLP
over the 2000-2009 period. These high shares indicate the economic importance of this
cluster. The aforementioned figures are further explained in Table 4.36 considering
different periods of time and averages.
Table 4.36. Development of the average value of meat products, 2000-2009 (SP million, %)
Item Average
2000-2002 Average
2003-2005 Average
2007-2009
Average Change % 2003-2009
Average Change % 2000-2009
AAGR % 2000-2009
At current prices 70,650 77,693 110,819 45.7 59.8 9.8 At constant prices 65,291 64,877 69,955 10.5 9.4 1.8 Source: Elaborated from the CBS, the ASA, various issues. AAGR: Average annual growth rate.
Table 4.36 shows that the value of this category increased at both current and constant
prices in the medium and long terms, but the amplification at current prices was
substantially higher than that at constant prices. This means that a simultaneous
enhancement of both quantities and prices occurred.

State of Food and Agriculture in Syria 2010
112
Value of dairies:
This group valued SP42 billion in 2000, SP 142 billion at current prices in 2009 and SP57
billion at constant prices of 2000 in 2009. As percentage, the average share of this cluster
amounted to about 15.5% of the VOAP and to 14.5% of the VOAP and to 40% of the
VOLP. This indicates that this class represents the second major source for the value
creation of the livestock production. Table 4.37 presents the aforementioned value as
averages over different periods of time. The same conclusions apply here as by meat
products.
Table 4.37. Development of the average value of dairies, 2000-2009 (SP million, %)
Item Average
2000-2002 Average
2003-2005 Average
2007-2009
Average Change % 2003-2009
Average Change % 2000-2009
AAGR % 2000-2009
At current prices 43,600 55,066 122,363 122.2 180.6 22.9 At constant prices 43,744 56,233 59,425 5.7 35.8 6.3 Source: Elaborated from the CBS, the ASA, various issues.
4.3. Costs of the agricultural produce
This section focuses only on explaining the development of the costs related to the major
crops of crop production owing to the absence of the data related to the costs of the
livestock production. These costs are linked to products that are characterized by a
compulsory delivery to the state, goods that are priced by the state, but, their marketing can
be freely performed either to the state or to the market, and commodities that are priced by
market forces and their marketing is free relying on the supply and demand in the market.
In this regard, the cost level and the price of the agricultural produce determine its degree
of competitiveness. This implies in this era of globalization that there is an urgent need to
reduce the cost of production because of the increased competition at regional and
international levels.
Products that have to be delivered to the state:
Table 4.38 illustrates the development of the total cost, unit cost and average yield51 for the
products subject to compulsory delivery to the state from 1999 to 2009 (Table A4.19). It
shows that the total cost increased at substantially higher rate than that of the average yield
leading to an enhanced unit cost owing to the enlargement in both the liberalized fuel and
fertilizer prices.
51 Five years average.

State of Food and Agriculture in Syria 2010
113
Table 4.38. Development of the costs of the products delivered to the state, 1999-2009
Item Average
1999-2001 Average
2003-2005 Average
2007-2009
Average Change % 2003-2009
Average Change % 1999-2009
AAGR % 1999-2009
Total cost (SP/ha) Sugar beet 104,875 109,120 161,517 48.0 54.0 7.5 Seed cotton 98,016 103,621 161,306 55.7 64.6 8.7 Average yield (kg/ha) Sugar beet 44,333 45,400 44,683 -1.6 0.8 0.1 Seed cotton 3,567 3,962 3,924 -1.0 10.0 1.6 Unit cost (SP/kg) Sugar beet 2.4 2.4 3.6 50.9 50.9 7.1 Seed cotton 27.5 26.2 36.7 40.2 33.6 4.9 Source: Elaborated from the MAAR, the AASA, various issues. AAGR: Average annual growth rate.
The state, however, provided direct support for farmers to compensate the cost
enhancement. In addition, the Government increased the prices related to the products of
this group to enhance their competitiveness index52 and continued this policy after 2008
considering the inclusion of the updated fuel and fertilizer costs in the price. To improve
the aforementioned indicator, the state also promotes the introduction of advanced
irrigation technologies. Figure 4.10 clarifies the development of this indicator from 1999 to
2008 indicating in general that sugar beet is uncompetitive and seed cotton is competitive.
But, seed cotton switched to be uncompetitive in 2009.
Figure 4.10. Development of the competitiveness index of sugar beet and seed cotton at official prices, 1999-2009
0
0.2
0.4
0.6
0.8
1
1.2
1999 2000 2001 2002 2003 2004 2005 2006 2007 2008 2009
Sugar beet
Seed cotton
Source: Elaborated from the MAAR, the AASA, various issues.
Products that are freely delivered to the state:
Table 4.39 presents the evolution of the total cost, unit cost and average yield53 for the
products that can be delivered freely to the state from 1999 to 2009 (Table A4.19).
52 Competitiveness index = total cost/revenue. An index greater than unity means that the product is uncompetitive. Otherwise, it is competitive. Again, this indicator is too simple to assess competitiveness (see Annex 9). 53 Five years average.

State of Food and Agriculture in Syria 2010
114
Table 4.39. Development of the costs of the products delivered freely to the state, 1999-2009
Item Average
1999-2001 Average
2003-2005 Average
2007-2009
Average Change % 2003-2009
Average Change % 1999-2009
AAGR % 1999-2009
Total cost (SP/ha) Irrigated wheat 39,758 39,212 49,853 27.1 25.4 3.8 Rain-fed hard wheat 11,438 11,832 14,218 20.2 24.3 3.7 Rain-fed barley 6,481 6,243 7,601 21.8 17.3 2.7 Rain-fed lentils 15,707 15,748 24,625 56.4 56.8 7.8 Rain-fed chickpeas 15,693 15,570 22,170 42.4 41.3 5.9 Irrigated maize 50,299 41,145 51,032 24.0 1.5 0.2 Average yield (kg/ha) Irrigated wheat 3,435 3,842 4,041 5.2 17.6 2.7 Rain-fed hard wheat 830 1,326 1,342 1.2 61.7 8.3 Rain-fed barley 600 683 595 -12.9 -0.9 -0.1 Rain-fed lentils 664 830 986 18.8 48.4 6.8 Rain-fed chickpeas 650 735 699 -4.9 7.6 1.2 Irrigated maize 4,300 3,658 3,719 1.7 -13.5 -2.4 Unit cost (SP/kg) Irrigated wheat 11.6 10.2 12.5 22.1 7.3 1.2 Rain-fed hard wheat 14 8.9 10.8 21.5 -22.7 -4.2 Rain-fed barley 10.8 9.2 13.3 44.8 23.4 3.6 Rain-fed lentils 22.4 15.3 25.1 64.0 12.0 1.9 Rain-fed chickpeas 24.1 21.2 32.7 54.1 35.5 5.2 Irrigated maize 11.8 11.3 13.7 21.4 16.2 2.5 Source: Elaborated from the MAAR, the AASA, various issues.
According to Table 4.39, the total and unit costs increased in the medium term owing to the
same factors mentioned by the first group. This trend also prevailed in the long run
excluding the unit cost of irrigated wheat, which declined owing to the yield improvement.
Unlike the first cluster, farmers received support only for fertilizers. But, similar to the first
category, prices were raised for all products with the exception of lentils and chickpeas.
The Government policy to price the products according to the actual costs and to introduce
modern irrigation technologies also applies here. As a result, the competitiveness index at
official prices improved for all products excluding lentils and chickpeas over the
considered period (Figure 4.11).
Figure 4.11. Development of the competitiveness index of selected products at official prices, 1999-2009
0
0.5
1
1.5
2
1999 2000 2001 2002 2003 2004 2005 2006 2007 2008 2009
Irrigated wheat
Rainfed wheat
Rainfed barley
Rainfed lentils
Rainfed chickpeas
Irrigated maize
Source: Elaborated from the MAAR, the AASA, various issues.

State of Food and Agriculture in Syria 2010
115
Products subject to market forces:
Table 4.40 shows the evolution of the total cost, average yield and unit cost for the most
important vegetable crops over the 1999-2009 period.
Table 4.40. Development of the costs of potato and tomato, 1999-2009
Item Average
1999-2001 Average
2003-2005 Average
2007-2009
Average Change % 2003-2009
Average Change % 1999-2009
AAGR % 1999-2009
Total cost (SP/ha) Potato 168,797 168,039 277,137 64.9 64.2 8.6 Tomato 169,075 201,353 292,429 45.2 73.0 9.6 Average yield (kg/ha) Potato 21,000 21,471 22,300 3.9 6.2 1.0 Tomato 31,667 42,834 50,957 19.0 60.9 8.3 Unit cost (SP/kg) Potato 8.1 7.9 12.6 59.8 55.8 7.7 Tomato 5.4 4.7 5.7 22.0 6.2 1.0 Source: Elaborated from the MAAR, the AASA, 2008.
According to Table 4.40, all the indicators of the chosen products witnessed an increasing
trend in the medium and long terms. These crops are also subject to Government direct
support54 and assistance to introduce advanced irrigation technologies.
Table 4.41, on the other hand, indicates the development of the measures presented in
Table 4.40 for major fruit trees crops over the 2007-2009 period (Table A4.20). All these
indicators augmented from 2007 to 2009 excluding the yield of rain-fed olives that
decreased. Among these crops, only apples benefit from the Government direct support,
but, all irrigated cultivations of these crops receive assistance from the state to adopt
modern irrigation technologies.
Table 4.41. Development of the costs of selected fruit trees crops, 1999-2009
Item 2007 2009 Change % 2007-2009
Total cost (SP/ha) Rainfed olives 44,439 77,385 74.1 Rainfed juice grapes 38,830 53,934 38.9 Irrigated apples 206,582 312,949 51.5 Rainfed apples 112,460 124,566 9.4 Average yield (kg/ha) Rainfed olives 1,317 1,767 -33.3 Rainfed juice grapes 5,000 5,000 0.0 Irrigated apples 11,408 13,822 5.5 Rainfed apples 4,828 7,448 5.7 Unit cost (SP/kg) Rainfed olives 33.7 43.8 160.7 Rainfed juice grapes 7.8 10.8 38.3 Irrigated apples 18.1 22.6 43.3 Rainfed apples 23.3 16.7 4.0 Source: Elaborated from the MAAR, the AASA, various issues.
54 See chapter 3.

State of Food and Agriculture in Syria 2010
116
4.4. Prices of the agricultural produce
Prices of agricultural products play a substantial role in both enhancing and directing
agricultural production to achieve the production targets. In this sense, Marion (1986)
emphasized that market prices are the major driving forces to coordinate the exchange
among the various stages of the food system. In addition, Rama (2001) stressed out the
importance of prices in attaining efficiency and coordinating the supply chain to reallocate
resources, to distribute income, to encourage investments and to enhance the
competitiveness of the agricultural produce. These prices in Syria are divided into official
(state) prices and free market prices. Chapter 3 of this report dealt with the official prices to
a great extent. Therefore, this section focuses heavily on the free market prices. These
prices comprise farm prices (producer prices), which can include a mixture of official and
free market prices, wholesale prices and retail prices. Their development is presented
below from 1999 to 2009 or 2010 using tables and figures.
Table 4.42 presents the evolution of farm prices for the major groups of agricultural
products over the 2000-2009 period (Table A4.21). These prices increased considerably at
different rates in the medium and long terms. Their increases were lowest for meat
products and highest for vegetables and are related to high production costs, the drought
spells over the 2006-2009 period and the international food crisis, which has started in
2007.
Table 4.42. Development of farm prices for the major groups of agricultural products, 2000-2009 (SP/kg)
Item Average
2000-2002 Average
2003-2005 Average
2007-2009
Average Change % 2003-2009
Average Change % 2000-2009
AAGR % 2000-2009
Cereals 10.6 11.2 15.9 41.8 49.8 8.4 Dry legumes 19.2 26.1 36.6 40.3 90.7 13.8 Vegetables 9.9 10 23.9 139.1 141.5 19.3 Fruits 25.2 28.7 45.0 56.8 78.5 12.3 Meat excluding fish 215 196.5 248.9 26.7 15.8 3.0 Fish 91.5 97 121.9 25.7 33.2 5.9 Dairies 26.1 25.9 48.4 86.8 85.4 13.1 Source: Elaborated from the CBS, the ASA, various issues and the MAAR, the AASA, various issues.
Table A4.22 gives an idea about the level of wholesale prices for selected commodities,
which are subject to market forces, in 2008 and 2009.
Table 4.43 explains the development of free market retail prices for selected products over
the 1999-2010 period (Table A4.23). It indicates that these prices increased substantially
over the considered periods. Moreover, Figure 4.12 illustrates their overall evolution using
the retail price indices from 2000 to 2009 (Table A4.24). It shows that the food price index

State of Food and Agriculture in Syria 2010
117
increased at a rate that is higher than that of the general CPI, which impacted negatively
food and non-food consumption and led to an increased share of food expenditure in total
expenditure.
Table 4.43. Development of free market retail prices for selected products, 1999-2010 (SP/kg, %)
Item Average
1999-2001 Average
2003-2005 Average
2008-2010
Average Change % 2003-2010
Average Change % 1999-2010
AAGR % 1999-2010
Lentils 30.5 33.1 70.0 111.3 129.3 12.6 Chickpeas 38.3 39.5 75.0 89.9 96.0 10.1 Cumin 126.1 146.9 303.8 106.8 140.9 13.4 Potatoes 13.4 15.8 34.3 116.4 155.7 14.4 Tomatoes 14.0 16.3 34.2 110.0 143.9 13.6 Apples 35.1 35.6 58.3 63.8 66.3 7.5 Oranges 19.2 23.5 32.1 36.9 67.1 7.6 Boned sheep meat 256.3 333.3 494.7 48.5 93.0 9.8 Chicken meat 71.9 71.3 120.2 68.6 67.2 7.6 Cow milk 14.9 15.3 27.1 77.1 81.9 8.9 Source: Elaborated from the CBS, the ASA, various issues; the MAAR, the AASA, various issues; and NAPC database.
Figure 4.12. Development of the CPI, 2000-2009 (%)
0
50
100
150
200
250
2000 2001 2002 2003 2004 2005 2006 2007 2008 2009
%
General CPI
CPI of food stuff
CPI of cereals
CPI of dry legumes
CPI of fruits and nuts
Source: Elaborated from the CBS, the ASA, various issues.
Food retail prices vary not only over years but also among governorates. The variations
among provinces are illustrated in Figure 4.13 for selected products in 2008.
Figure 4.13. Retail prices for selected products by governorates, 2008 (SP/kg)
0
20
40
60
80
100
120
140
SP/kg
Lentils
Potatoes
Apples
Chicken meat
Source: Elaborated from the NAPC database.
Figure 4.13 indicates small price differences among regions pointing out to good market
integration and stable prices. This is confirmed by the low coefficient of variation (CV)55
of prices as indicated in Table 4.44, which provides information about the development of 55 CV = standard deviation/mean*100.

State of Food and Agriculture in Syria 2010
118
the CV of prices for chosen products among governorates from 1999 to 2008 and points
out to improved market integration among provinces over the considered period because
the CV decreased.
Table 4.44. Development of the CV of prices for selected products, 1999-2008 (%)
Item Average
1999-2001 Average
2003-2005 Average
2006-2008
Average Change % 2003-2008
Average Change % 1999-2008
AAGR % 1999-2008
Lentils 12.5 16 5.6 -64.8 -54.7 -14.7 Potatoes 13.3 8.6 9.7 12.9 -27.5 -6.2 Apples 16.1 11.5 9.8 -15.5 -39.3 -9.5 Chicken meat 11.9 10.4 6.9 -33.5 -41.8 -10.3 Source: Elaborated from the NAPC database.
Finally, Syrian food prices enlarged by 52% when comparing average (2006-2008) to
average (2001-2003). They prices were close to international food prices (lower or higher)
until 2006 and were below those in 2007 and 2008, where the international food crisis has
started, due to the Government policy aiming at attaining stable food prices in agricultural
markets and sustainable food security situation (Figure 4.14).
Figure 4.14. Evolution of Syrian and world food price indices, 2000-2008 (%)
0
50
100
150
200
250
2000 2001 2002 2003 2004 2005 2006 2007 2008
Index (% )
World food price index Syrian food price index
Source: Elaborated from NAPC database and FAO Food Outlook (2009). Base: 2003.
4.5. Agricultural trade and markets
An improved trade performance can be related to an increased relative unit value (RUV) of
exports, a reduced RUV of imports, an enhanced revealed comparative advantage (RCA)
indicator56 (RCAI), a reduced degree of concentration (CR)57 and an enlarged number of
trading partners (NP). Otherwise, it can be said that trade performance is worsening.
Generally speaking, it can be said that Syrian exports and imports are heavily concentrated
as indicated by the CR1, CR2 and NP (TA4.25 and TA4.26). The NP of export declined
56 RCAI = (value of the Syrian export of the commodity/value of the world export of the commodity)/(value of the total Syrian export/value of the total world export). A value greater than one denotes that the commodity has a revealed comparative advantage. 57 The degree of concentration can be measured by the market share of both the five major trading partners (CR1) and that of the ten major trading partners (CR2). These ratios are inversely related to the number of trading partners.

State of Food and Agriculture in Syria 2010
119
between 2007 and 2008 indicating an increased degree of concentration, while that related
to import increased pointing out to a more diversified import. The aforementioned
measures are presented below in-depth for the major groups of agricultural products.
Cereals:
Cereal exports focus on both soft and hard wheat. They are monopolized by the GECTP
and increased considerably from 59 thousand tonnes (average (1999-2001)) to 770
thousand tonnes (average (2006-2008)). They were characterized by a reduced RUV from
US$222/tonne in the first period to US$166/tonne in the second period, a decreased NP
from 12 countries in 2007 to 7 countries in 2008, an enlarged CR1 from 94.8% in 2007 to
99.7 in 2008, and an enhanced RCAI from 0.1 in 1998 to 4.1 in 2007. Further explanation
is presented in Figure 4.15, which indicates the evolution of the shares of various
destination countries in the Syrian wheat exports from 2004 to 2008 and points out that
Arab countries are the major wheat importers especially Egypt, Jordan and Yemen. Yemen
arose as a major partner in 2008.
Figure 4.15. Syrian wheat export by countries, 2004-2008 (%)
0%
10%
20%
30%
40%
50%
60%
70%
80%
90%
100%
2004 2005 2006 2007 2008
Others
Turkey
Italy
North Korea
Yemen
Lebanon
Algeria
Tunisia
Iraq
Jordan
Egypt
Source: Elaborated from NAPC database.
Cereal imports, on the other hand, consist mainly of barley, maize, rice, bran and crushed
cereals. They increased from 1.6 million tonnes (average (1999-2001)) to 2.2 million
tonnes (average (2006-2008)). This trend also applies to the RUV, which augmented from
US$130/tonne in the first period to US$207/tonne in the second period and to the NP,
which enlarged from 10 countries in 2007 to 18 countries in 2008. As a result, the CR1
declined from 99% to 88% in 2008 implying more diversification of cereal imports. In
2008, barley was imported mainly from Ukraine (57.6%) and Russia (18.3%), maize from
Argentina (42%), USA (31.7%) and Ukraine (11%), rice from Egypt (39.2%), Thailand
(22.4%) and USA (12%), and crushed cereals from Ukraine (45.8%), Russia (34.3%) and
Turkey (19%). These imports were performed by both the private and public sectors.

State of Food and Agriculture in Syria 2010
120
Dry legumes:
Lentils and chickpeas are exported to several countries. Their total exported quantity
increased from 37 thousand tonnes (average (1999-2001)) to 44 thousand tonnes (average
(2006-2008)), while their RUV declined from US$650/tonne in the first period to
US$549/tonne in the second period. This development was accompanied with an increase
of both the RCAI from 1.8 in 1998 to 54 in 2007 and the CR1 from 79.9% in 2007 to
92.1% in 2008, as well as with a decline of the NP from 34 countries in 2007 to 30
countries in 2008. The respective shares of some of these countries in the export of both
crops are shown in Figure 4.16. Figure 4.16 indicates that both crops are exported mainly
to Arab countries. In addition, they are characterized by a high export potential and their
export is performed solely by the private sector. Imports related to these products, on the
other hand, are considered miniscule.
Figure 4.16. Syrian exports of lentils and chickpeas by countries, 2008 (%)
Egypt51%
Saudi Arabia21%
Bangladish8%
Kuwait6%
Jordan3%
UAE3%
Others8%
Lentils export
Saudi Arabia18%
Kuwait15%
Germany14%
Iraq10%
Greece10%
Romania7%
United Kingdom
4%
Others22%
Chickpeas export
Source: Elaborated from NAPC database. UAE: United Arab Emirate.
Industrial crops:
The industrial crops related to this section are seed cotton, cumin, aniseeds, sesame, sun
flowers and soya beans.
On the export side, the quantity exported of seed cotton decreased from 174 thousand
tonnes (average (1999-2001)) to 65 thousand tonnes (average (2006-2008)), whereas its
RUV increased from US$1,069/tonne over the first period to US$1,376/tonne over the
second period. In 2008, the respective shares of destination countries that imported seed
cotton were 22.2% for Tunisia, 15.3% for Egypt, 14.2% for China and 11.2% for Japan.
Cumin exports, on the other hand, increased from 20 thousand tonnes (average (1999-
2001)) to 31 thousand tonnes (average (2006-2008)), while their RUV diminished from
US$2,204/tonne over the first period to US$1,029/tonne over the second period. This trend

State of Food and Agriculture in Syria 2010
121
of cumin exports was characterized by an increase of the CR1 from 49.9% in 2007 to
65.4% in 2008 and a decline in the NP from 54 countries to 44 countries in 2008. This
indicates that this product still has a high degree of export diversification. In 2008, cumin
was mainly shipped to Morocco (26.3%), Egypt (17.1%) and Saudi Arabia (14.4%). Like
cumin, aniseeds exports augmented from 2 thousand tonnes (average (1999-2001)) to 5
thousand tonnes (average (2006-2008), where their unit value fell from US$2,144/tonne
over the first period to US$1,208/tonne over the second period. Furthermore, the
Government takes care of seed cotton exports, where the private sector is exclusively
responsible for cumin and aniseeds exports.
On the import side, the private sector imports the entire quantities of sesame, sunflowers
and soya beans needed for the domestic industries. The imports of sesame and sunflowers
improved from 41 thousand tonnes (average (1999-2001)) to 54 thousand tonnes (average
(2006-2008)) and their RUV as well from US$529/tonne to US$799/tonne, respectively.
This development was accompanied with an enlargement of the CR1 from 94% in 2007 to
98.1% in 2008 and a decline in the NP from 17 countries in 2007 to 16 countries in 2008.
In 2008, Syria imported these products mainly from Nigeria (50.1%) and Sudan (26.8%).
Like the aforesaid products, soya beans imports enhanced from 63 thousand tonnes
(average (1999-2001)) to 127 thousand tonnes (average (2006-2008)) and also their RUV
from US$228/tonne to US$279/tonne, respectively. These imports are considered very
heavily concentrated because the CR1 amounted to 100% distributed between two
countries namely: the USA (82.8%) and Argentina (17.2%).
Vegetables:
Tomato and potato are considered the main exported vegetables. Tomato exports declined
from 167 thousand tonnes (average (1999-2001)) to 155 thousand tonnes (average (2006-
2008)) and their RUV as well from US$484/tonne to US$284/tonne, respectively. This
development was characterized by an increased RCAI from 0.6 in 1998 to 20.8 in 2007, an
enhanced NP from 15 countries in 2007 to 16 countries in 2008 and an augmented CR1
from 92.5% in 2007 to 93.5% in 2008. Like tomato, potato exports decreased from 31
thousand tonnes (average (1999-2001)) to 18 thousand tonnes (average (2006-2008)) and
also their RUV from US$441/tonne to US$216/tonne, respectively. Nevertheless, their
RCAI improved from 0.1 in 1998 to 1.3 in 2007 and their CR1 enlarged from 91.4% in
2007 to 98.6% in 2008. But, their NP remained stable between 2007 and 2008 amounting

State of Food and Agriculture in Syria 2010
122
to 12 countries. Figure 4.17 gives an idea about the respective shares of some destination
countries that imported the aforementioned products in 2008. It shows that Arab countries
were the major importers of these products, Saudi Arabia was the main importer of tomato
(58%) and Jordan was the chief importer of potato (47%). In this regard, it is worth
mentioning that the foreign trade of vegetables is governed exclusively by the private
sector. But, as for internal trade of those, the Government plays a tiny role.
Figure 4.17. Syrian exports of tomato and potato by countries, 2008 (%)
Saudi Arabia
58%
Lebanon 13%
Iraq 10%
UAE 8% Oman
5%
Kuwait 4% Others
2%
Tomato exports
Jordan 48%
UAE 21%
Iraq 21%
Others 10%
Potato exports
Source: Elaborated from NAPC database.
Fruits:
Exported fruits comprise mainly varied fruits such as apples, apricots, cherries, pears,
peaches and plums, citrus like oranges, lemon and mandarin, pistachios and grapes. Their
marketing follows the same pattern as vegetables. Imported fruits, on the other hand,
consist mainly of bananas.
As export as concerned, varied fruit exports declined from 60 thousand tonnes (average
(1999-2001)) to 47 thousand tonnes (average (2006-2008) and their RUV as well from
US$830/tonne to US$490/tonne, respectively. On the contrary, their RCAI increased from
0.4 in 1998 to 3.6 in 2007, their CR1 from 84.8% in 2007 to 95.1% in 2008, and their NP
from 16 countries in 2007 to 19 countries in 2008. These fruits were solely exported to
Arab countries, where Egypt (68.9%) and Jordan (16.5%) represented the major
destinations. Like varied fruits, citrus exports decreased from 41 thousand tonnes (average
(1999-2001)) to 31 thousand tonnes (average (2006-2008)), their RUV from US$595/tonne
to US$472/tonne, respectively, and their RCAI from 3 in 2006 to 1.8 in 2007. In contrast,
their CR1 enlarged from 92% in 2007 to 95% in 2008 and their NP from 13 countries in
2007 to 28 countries in 2008. Pistachio exports also fell from six thousand tonnes (average
(1999-2001)) to one thousand tonnes (average (2006-2008)) and their NP from 24
countries in 2007 to 19 countries in 2008. Nevertheless, their RUV increased from

State of Food and Agriculture in Syria 2010
123
US$1,534/tonne (average (1999-2001)) to US$2,849/tonne (average (2006-2008)), their
RCAI from 0.4 in 1998 to 2.1 in 2007, and their CR1 from 85.1% in 2007 to 95.3% in
2008. In addition, grape exports were subject to a decline from 30 thousand tonnes
(average (1999-2001)) to five thousand tonnes (average (2006-2008)), their RUV from
US$803/tonne to US$349/tonne, respectively, and their NP from 13 countries in 2007 to
seven countries in 2008. But, their RCAI enhanced from 0.2 in 1998 to one in 2007.
On the import side, banana imports amplified substantially from 65 thousand tonnes
(average (1999-2001)) to 238 thousand tonnes (average (2006-2008)) and their CR1 as
well from 94% in 2007 to 98.9% in 2008. On the other hand, their RUV decreased from
US$338/tonne (average (1999-2001)) to US$182/tonne (average (2006-2008)) and their
NP from 18 countries in 2007 to 17 countries in 2008. In 2008, the major trading partners
were Ecuador (60.2%) and Lebanon (22.9%).
Live sheep:
Live sheep exports improved from 27 thousand tonnes (average (1999-2001)) to 71
thousand tonnes (average (2006-2008)), their RUV from US$2,340/tonne to
US$2,740/tonne, respectively and their RCAI from 1.4 in 1998 to 146.8 in 2007. But, their
NP declined from 10 countries in 2007 to 7 countries in 2008. Therefore, live sheep
exports are considered very heavily concentrated with a CR1 of 99.7%. In 2008, the most
important export destinations were Saudi Arabia (88.2%) and Qatar (8.4%). In this regard,
it is worthy to note that sheep exports are performed exclusively by the private sector.
4.6. Factors constraining crop production
Currently, crop production is subject to the following constraints:
There are obstacles by increasing the share of legumes crops and introducing
alternative crops in the crop rotation
Crop production suffers from low productivity owing to unfair climatic conditions
(droughts, frost, floods …) and the lack of early warning systems to predict these
phenomena given that the rain-fed agriculture is dominant.
Constraints are to observe by creating high yielding and drought resisting varieties
adapted to the climatic conditions by regions.
State of Food and Agriculture in Syria 2010
124
The adoption of the IPM and the focus on the biological control to secure healthy
products for internal and external markets are challenging the sector. This clearly
expressed by the high share of residuals related to fertilizers and chemicals.
The activities of marketing, export and processing do not comply with the development
of the agricultural production to market or process surplus supplies in the context of
adding value to primary commodities. These operations underlie the following
constraints:
Infrastructure difficulties such as limited transportation, weak grading and
packaging plants, and inadequate storage facilities concerning capacity, cold
storage and storing and cooling technologies.
Market bottlenecks such as advertisement, standards, market information,
shipment, and market research.
Production challenges related to cost and quality awareness of international
standards especially those related to particular markets.
Hindrance related to the processing of agricultural products such as low
coordination between the MAAR and the MOI to cultivate processing varieties,
old machines and equipment and quality of processed products in relation to
international standards.
Development of agricultural guardianship centers, establishment of prevention
zones (detention gardens) and foundation of laboratories capable of issuing
internationally accepted certificates to facilitate the entrance of Syrian products
into international markets.
Support of agricultural products in other countries, which impacts negatively the
capability of Syrian products to compete in international markets.
Land fragmentation has a negative impact on agricultural investment related to crop
production.
4.7. Factors constraining livestock production
Livestock production underlies currently the following constraints:
There is a deficiency in the ASR in general and productivity research in particular,
which require a special attention to improve the performance of this sub-sector.
There is a lack in the provision of the fodder needed for the livestock, which needs
focused actions to enhance the integration between crop and livestock productions.

State of Food and Agriculture in Syria 2010
125
There is a shortage in the protection of the livestock against diseases and epidemic
attacks and the prevention programmes.
Paucity is to observe in the investigation of animal diseases and joint illnesses.
Provision of veterinary services and their requirements (veterinary medicine and
others) complying with international standards induces a challenging factor.
Development of the production of local veterinary medicines, the enhancement of all
sectors to produce them and the medication control constitute difficulties.
Post-harvest operations constraints exist especially in the field of the development of
the rural industries related to animal products, fodder industries, information systems
and capacity building.
Prevention centers and laboratories related to livestock production are characterized by
a weak performance.
There are obstacles concerning the provision of the drink water needed for the livestock
in Al-Badia (Syria steppe).
The small holding size constrains the performance of the livestock sector.
4.8. Agricultural production in the next period
The 11th FYP proposes the following actions to enhance the performance of the agricultural
production: expansion of both cultivable and invested lands, enhancement of the
productivity, support of marginal producers, compliance of the crop rotation with the
available resources, adoption of both modern technologies and the results of the ASR,
introduction of new profitable crops, preservation of the integration between crop and
livestock productions, maintenance of water supply, improvement of both the quantity and
quality of production, promotion of comparative advantage products, provision of
production inputs with fair prices, introduction of alternative energy sources, upgrading of
post-harvest operations, determination of fair prices for strategic crops, improvement of
backward and forward linkages of agriculture, compliance with the needs of domestic and
international markets, etc.

State of Food and Agriculture in Syria 2010
127
Chapter 5 – Agro-industries
The agricultural sector in Syria is considered as a major and important sector for other
economic sectors and a key supplier of inputs needed for many agro-industries, such as
food, textile, fodder, leather, vegetal oils, soap, wood, paper and others. These industries
extend the date of expiry for agricultural products by converting them to processed
products with an increasing demand in domestic and foreign markets, enable farmers to
avoid production and price crises and motivate and improve production, sustain food
security, enhance exports and ameliorate the generation of the value added.
Therefore, the SG has stimulated the expansion of agro-industries to increase the value
added, motivated the private sector to be engaged in such activities through providing
incentives and relaxing obstacles, and introduced a series of procedures to develop the
agro-industrial sector as follows:
Providing agro-industries with a high share of the expenditure devoted to the
transformation industries.
Introducing many plans and agricultural development programmes to achieve a
surplus in agricultural production.
Reducing tariffs on imported raw materials necessary for food industries.
Decreasing the transport cost for domestic industries by railways.
Supplying loans with low interest rates for agro processing projects.
Furthermore, Syria has the advantage of producing many varieties of crops and livestock
such as cotton, sugar beet, olive, wheat, poultry and sheep meat, which are considered as a
good base for both the competitiveness of the Syrian agro-industries and the increase in
the surplus of agro-industrial products.
Consequently, over the last three decades the Syrian agro-industries have attained a
substantial development to become a pillar in the national economy, an important income
source and a major contributor to both the industrial GDP and the GDP of the
transformation industries. The Government commitment to enhance this agro-industrial
role is documented in both the 10th and 11th FYP. Accordingly, this sector has to be

State of Food and Agriculture in Syria 2010
128
competitive, market- oriented both domestically and internationally, socially and
environmentally effective, and more focused on improving the standard of living and food
security.
Finally, Syrian agro-industries consist of four sub-sectors namely: food, beverages and
tobacco industries, textile, clothing and leather industries, wood and furniture industries
and paper, printing and publishing industries. Both the private and public sectors
contribute to these industries. An idea about the development of these industries and their
performance is presented below.
5.1. Contribution of agro-industries to the gross output
Due to varied agro-climates, Syrian agro-industries are highly diversified. Their major
products amount to about 51 commodities (Table A5.1). These goods in turn are further
heavily differentiated in size and packaging complying with consumers’ preferences and
their purchasing power. They are processed by both the public and private sectors. More
in-depth investigation of these industries is presented below.
On average, agro-industrial production increased considerably from 2000 to 2008. The
quantity produced of some products, however, declined such as butter and ghee,
pasteurized milk, dried onion, wine, molasses, sugar beet sediment, tanned hides box and
tanned hides owing to the reduced performance of the public sector.
As for the public sector, most of its agro-industrial products followed a declining trend
from 2000 to 2009 (Table A5.2). But, looking at the production index related to this sector
(Table A5.3), it can be concluded that the production of its major agro-industrial sub-
sectors increased from 2000 to 2009, where that of the minor sectors declined over the
same period (Figure 5.1).
Figure 5.1. Production index of the agro-industrial public sector, 2000-2009 (%)
0
20
40
60
80
100
120
140
160
2000 2001 2002 2003 2004 2005 2006 2007 2008 2009
% Food staff and beverages
Tobacco
Textile and yarn
Clothes
Tanning and preperation ofhides
Wood and wooden products
Paper and paper products

State of Food and Agriculture in Syria 2010
129
Source: Elaborated from the CBS, the ASA, various issues.
Furthermore, the public sector dominates several agro-industries (Table A5.4). These
businesses encompass flour, dried onion, mineral water, beer, sugar, yeast, mixed woolen
yarns and leather. For the other industries, however, either its share is declining or it has
been ruled out to the benefit of the private sector.
The products of the agro-industrial private sector, on the other hand, underwent
considerable increases from 2000 to 2008 (Table A5.5). Like the public sector, this sector
governs numerous agro-industries like olive oil, chocolate, fruit juice, synthetic and silk
textiles, varied tricot, bed sheets, towels and kaflas, plywood and hygienic paper. But,
unlike the public sector, its market share is increasing for the other products excluding
those governed by the state (Table A5.6).
The aforementioned development of the agro-industrial production (AIP) accompanied
with the changes in its current prices impacted the level of the agro-industrial gross output
(AIGO) and in turn its share in total gross output (GO), industrial GO and the GO of the
transformation industries from 2001 to 2009 (Table A5.7). The AIGO valued SP179
billion in 2001 and SP280 billion in 2009 at current prices, while its share declined from
10.9% to 6.5% in the total GO, from 30.6% to 17.9% in the industrial GO, and from
50.8% to 36.2% in the GO of the transformation industries, respectively. This trend also
persisted when three years averages were considered over the same period as shown in
Table 5.1. The declining shares of the AIGO in various economic aggregates can be
explained by increasing the latter at a higher rate than that of the former. Table 5.1 also
shows that the high increase in the AIGO was related to the high augmentation in this
measure related to the various agro-industrial sub-sectors and that the AIGO contributed
considerable to the industrial GO and the GO of the transformation industries.
Table 5.1. Development of the AIGO and its contribution to various economic aggregates, 2001-2009
Item Unit Average
2001-2003 Average
2007-2009
Average Change % 2001-2009
Total AIGO SP million 190,265 268,070 40.9 Food stuff, beverages and tobacco SP million 93,669 130,580 39.4 Textiles, clothing and leather SP million 79,464 103,667 30.5 Wood and furniture SP million 11,239 20,981 86.7 Paper, printing and publishing SP million 5,893 12,842 117.9 Share of the total AIGO in Total GO % 11 6.8 -38.1 Industrial GO % 31 17.2 -44.6 GO of the transformation industries % 52 32.8 -36.9 Source: Elaborated from CBS, the ASA, various issues. h

State of Food and Agriculture in Syria 2010
130
Figure 5.2 illustrates further the structure of the AIGO considering single years as well as
three years averages from 2001 to 2009. It indicates that food stuff, beverages and tobacco
occupied the first rank followed by textiles, clothing and leather. These sub-sectors are
considered as the major contributors to the AIGO, which is generated by both the public
and private sectors. Their contribution to the AIGO declined over the considered period to
the benefit of the other sub-sectors.
Figure 5.2. Development of the structure of the AIGO at current prices, 2001-2009 (%)
0%10%20%30%40%50%60%70%80%90%
100%
Paper, printing and publishing
Wood and furniture
Textiles, clothing and leather
Food stuff, beverages andtobacco
Source: Elaborated from the CBS, the ASA, various issues.
The public sector contributed positively to the aforementioned development of the AIGO
in absolute term. Its AIGO increased from SP59 billion in 2001 to SP85 billion in 2009.
Its relative contribution, however, decreased from 10% to 5.4% in the industrial GO, from
14.4% to 7.2% in the industrial GO of the public sector, and from 33.3% to 21.5% in the
GO of the public transformation industries, respectively. This trend was also in place when
average values were considered as depicted in Table 5.2.
Table 5.2. Development of the public AIGO and its contribution to various economic aggregates, 2001-2009 (SP million, %)
Item Unit Average
2001-2003 Average
2007-2009
Average Change % 2001-2009
Total public AIGO SP million 65,816 76,701 16.5 Food stuff, beverages and tobacco SP million 49,496 56,126 13.4 Textiles, clothing and leather SP million 15,664 19,492 24.4 Wood and furniture SP million 279 409 46.5 Paper, printing and publishing SP million 377 674 78.9 Share of the total public AIGO in Total industrial GO % 10.7 4.9 -54.1 Public industrial GO % 15.4 6.4 -58.2 Public GO of the transformation industries % 35.7 17.1 -52 Source: Elaborated from CBS, the ASA, various issues.
Figure 5.3 illustrates further the structure of the public AIGO considering single years and
three years averages. It reveals that the public sector focuses mainly on food stuff,
beverages and tobacco industries and its AIGO peaked in 2009.

State of Food and Agriculture in Syria 2010
131
Figure 5.3. Development of the structure of the public AIGO at current prices, 2001-2009 (SP million)
010,00020,00030,00040,00050,00060,00070,00080,00090,000SP million
Paper, printing and publishing
Wood and furniture
Textiles, clothing and leather
Food stuff, beverages and tobacco
Source: Elaborated from the CBS, the ASA, various issues.
The private AIGO, on the other hand, valued SP121 billion in 2001 and SP195 billion in
2009 (Table A5.6). Consequently, from 2001 to 2009, its share declined from 20.6% to
12.5% in the industrial GO, from 67.5% to 51.1 in the industrial private GO and from
68.1% to 51.2% in the GO of the private transformation industries, respectively. This trend
also persisted when average values were considered as shown in Table 5.3. Table 5.3
points out that the private AIGO increased at a higher rate than that of the public sector, its
contribution to economic aggregates declined at lower rate than that of the public sector
and is considerably higher than that of the public sector.
Table 5.3. Development of the private AIGO and its contribution to various economic aggregates, 2001-2009 (SP million, %)
Item Unit Average
2001-2003 Average
2007-2009
Average Change % 2001-2009
Total private AIGO SP million 124,449 191,369 53.8 Food stuff, beverages and tobacco SP million 44,173 74,453 68.5 Textiles, clothing and leather SP million 63,800 84,175 31.9 Wood and furniture SP million 10,960 20,572 87.7 Paper, printing and publishing SP million 5,516 12,168 120.6 Share of the total private AIGO in Total industrial GO % 20.2 12.3 -39.9 Private industrial GO % 66.9 52.5 -21.7 Private GO of the transformation industries % 67.6 52.7 -22.3 Source: Elaborated from CBS, the ASA, various issues.
Moreover, Figure 5.4 clarifies the structure of the private AIGO considering single years
and three years averages from 2001 to 2009. It indicates that the private sector gives due
attention to both textiles, clothing and leather industries and food stuff, beverages and
tobacco industries, but, its focus is more on the former. Unlike the public sector, its AIGO
increased continuously.

State of Food and Agriculture in Syria 2010
132
Figure 5.4. Development of the structure of the private AIGO at current prices, 2001-2009 (SP million)
0
50,000
100,000
150,000
200,000
250,000SP million
Paper, printing and publishing
Wood and furniture
Textiles, clothing and leather
Food stuff, beverages and tobacco
Source: Elaborated from the CBS, the ASA, various issues.
5.2. Contribution of agro-industries to the net domestic product
The level of the agro-industrial net domestic products (AINDP) relies on the levels of the
AIP, prices and costs. Hence, the AINDP at current prices increased from SP45 billion in
2001 to SP94 billion in 2009 (Table A5.8). Its share, however, declined respectively from
4.8% to 3.9% in the total net domestic product (NDP) and from 15.7% to 14.9% in the
industrial NDP. But, its share enlarged respectively from 59.5% to 60.4% in the NDP of
the transformation industries (NDPTI). The aforesaid trend also persevered when average
values were considered for the same period (Table 5.4) because the AINDP growth was
slower than that of the total NDP and industrial NDP and its contribution to the NDPTI
amplified in absolute term. Table 5.4 also shows that agro-industries are the major
contributor to the NDPTI.
Table 5.4. Development of the AINDP and its contribution to various economic aggregates, 2001-2009
Item Unit Average
2001-2003 Average
2007-2009
Average Change % 2001-2009
Total AINDP SP million 45,652 82,761 81.3 Food stuff, beverages and tobacco SP million 18,975 35,382 86.5 Textiles, clothing and leather SP million 21,421 36,164 68.8 Wood and furniture SP million 3,575 7,277 103.6 Paper, printing and publishing SP million 1,681 3,938 134.3 Share of the total AINDP in Total NDP % 4.6 3.7 -19.4 Industrial NDP % 16.2 12.5 -23.1 NDPTI % 61 61.1 0.2 Source: Elaborated from CBS, the ASA, various issues.
Furthermore, Figure 5.5 clarifies the structure of the AINDP disaggregated by single years
as well as by three years averages from 2001 to 2009. It points out that the contribution of
food stuff, beverages and tobacco came at the second place after that of textiles, clothing

State of Food and Agriculture in Syria 2010
133
and leather. The former, however, occupied the first place in 2009 in relative term. It also
indicates that all sub-sectors witnessed an increased share over the considered period
excluding textiles, clothing and leather. The aforementioned AINDP is created by both the
public and private sectors.
Figure 5.5. Development of the structure of the AINDP at current prices, 2001-2009 (%)
Source: Elaborated from the CBS, the ASA, various issues.
The AINDP of the public sector valued SP13 billion in 2001 and SP26 billion in 2009. It
followed the same pattern of the total AINDP as illustrated in Figure 5.6. Figure 5.6 also
shows that the public sector focuses heavily on food stuff, beverages and tobacco.
Figure 5.6. Development of the structure of the public AINDP at current prices and its contribution to selected economic aggregates, 2001-2009 (%, SP million)
0102030405060708090
In totalindustrial NDP
In total publicindustrial NDP
In total NDP ofthe public
transformationindustries
% Share of the public AINDP in various economic aggregates
Average (2001-2003) Average (2007-2009)
05,000
10,00015,00020,00025,00030,000
SP million
Development of the public AINDP
Paper, printing and publishingWood and furnitureTextiles, clothing and leatherFood stuff, beverages and tobacco
Source: Elaborated from the CBS, the ASA, various issues.
The AINDP of the private sector, on the other hand, totaled SP32 billion in 2001 and SP68
billion in 2009 thus exceeding considerably that of the public sector. But, in relative term,
its contribution to all selected economic aggregates declined from 2001 to 2009. This is
shown in Figure 5.7, which also shows that the private sector gives due attention to

State of Food and Agriculture in Syria 2010
134
textiles, clothing and leather industries at first place, then, to food stuff, beverages and
tobacco industries.
Figure 5.7. Development of the structure of the private AINDP at current prices ant its contribution to various economic aggregates, 2001-2009 (%, SP million)
0
10
20
30
40
50
60
70
In totalindustrial NDP
In total privateindustrial NDP
In total NDP ofthe private
transformationindustries
% Share of the private AINDP in various economic aggregates
Average (2001-2003) Average (2007-2009)
0
20,000
40,000
60,000
80,000
SP million
Development of the private AINDP
Paper, printing and publishingWood and furnitureTextiles, clothing and leatherFood stuff, beverages and tobacco
Source: Elaborated from the CBS, the ASA, various issues.
5.3. Contribution of agro-industries to investment and employment
As mentioned before, Syrian agro-industries are performed by both the public and private
sectors. The number of agro-industrial plants related to both sectors amounted to about
7,340 firms in 200958. These businesses are distributed in the various Syrian governorates
relying on the level of the agricultural production. Some of their characteristics are
presented below.
The public institutions59 that manage state companies are: the General Organization for
Food Industries (GOFI), which supervises 22 firms, the General Organization for Sugar
(GOSI), which administers 10 firms, the General Organization for Textile Industries
(GOTI), which manages 26 firms, the GOT, which runs six firms, the General
Organization for Cotton Ginning and Marketing (GOCGM), which controls 17 firms, the
General Company for Mills, which is in charge of 32 mills, the General Company for
Bakeries, which is responsible for 175 bakeries, and five companies specialized in wood
and leather processing, which belong to chemical and engineering industries. Thus, the
public firms amount to 293 plants. These establishments are characterized by their large
size and high employment potential as compared to those of the private sector. The
58 Syria Food Processing Directory, 2003; the MAAR, the AASA, various issues; the CBS, the ASA, various issues; and the MAAR, Analysis of the Current Situation of the Agricultural Sector, 2004-2008. 59 See Annex 8.

State of Food and Agriculture in Syria 2010
135
technologies applied in these businesses, however, are considered relatively old as
compared to those implemented in the private industries in spite of the introduction of
modernization activities in some processing lines or the addition of some new processing
capacities. The accumulated invested capital in the aforementioned public companies
increased from SP41 billion (average (2000-2002)) to SP73 billion (average (2007-2009))
leading to increasing its share in that of the industrial public sector from 9.9% to 11.5%,
respectively (Table A5.9). This development is illustrated in Figure 5.8, which indicates
that the investment in textile industries and food stuff, beverages and tobacco industries
enlarged considerably.
Figure 5.8. Development of the accumulated invested capital of the public agro-industries by sectors and its contribution to that of the industrial public sector, 2000-2009 (%, SP million)
02468
101214
% Share of public agro-industries in the total accumulated invested capital of the public
industrial sector
0
20,000
40,000
60,000
80,000
100,000
SP million
Accumulated invested capital of the public agro-industries
Textile industries
Food stuff, beverages and tobacco
Source: Elaborated from the CBS, the ASA, various issues.
The employment in the aforementioned public companies, on the other hand, declined
from 65,852 employees (average (2000-2002)) to 62,403 employees (average (2007-
2009). This occupation is further clarified by sectors in Figure 5.9, which also illustrates
the contribution of the public agro-industries to the total workers employed in the
industrial public sector and the public transformation industries, considering single years
and three years averages. In addition, Figure 5.9 shows that food stuff, beverages and
tobacco and textile industries absorb most of the labour force operating in agro-industries,
agro-industries contribute considerably to the employment in both the industrial public
sector and the public transformation industries, and the variations in agro-industrial
employment are small.
Relying on the aforementioned public AINDP, investment and employment, Figure 5.10
traces the development of selected performance indicators related to the public agro-

State of Food and Agriculture in Syria 2010
136
industries from 2001 to 2009. It indicates that all these measures witnessed an upward
trend.
Figure 5.9. Development of the number of employees of the agro-industrial public sector and its share in that of selected public sectors, 2000-2009 (%, worker)
010203040506070
% Share of public agro-industries in employment
Share of public agro-industries in the employmentof the industrial public sector
Share of public agro-industries in the employmentof the public transformation industries
0
20,000
40,000
60,000
80,000
Worker Employment in the public agro-industries
Paper, printing and publishingWood and furnitureTextiles, clothing and leatherFood stuff, beverages and tobacco
Source: Elaborated from the CBS, the ASA, various issues.
Figure 5.10. Development of selected performance indicators of the public agro-industries, 2001-2009
0
0.1
0.2
0.3
0.4
0.5
0.6
2001
2002
2003
2004
2005
2006
2007
2008
2009
General indicators
Return toinvestment
Indicator ofeconomicefficiency inrelation tothe publicindustrialsector
0
0.2
0.4
0.6
0.8
1
1.2
2001 2002 2003 2004 2005 2006 2007 2008 2009
Economic efficiency indicator in relation to the public transformation industries
Source: Elaborated from the CBS, the ASA, various issues.
As for the agro-industrial private sector, the number of its establishments has been about
7,047 firms until 2009. This number amounted to 4,530 businesses over the 2000-2009
period (Table A5.10). Over this period, these projects accounted for 59% of the total
executed private projects, 48% of the invested private capital and 52% of the provided
private job opportunities (Figure 5.11). Their number enlarged from 371 projects (average
(2000-2002)) to 396 projects (average (2007-2009)), their capital amplified from SP1,802
million to SP9,162 million, respectively, and their employment augmented from 2,041
workers to 2,753 workers, respectively.

State of Food and Agriculture in Syria 2010
137
Figure 5.11. Development of the contribution of the private agro-industrial projects to total executed private projects, 2000-2009
0
20
40
60
80
2000 2001 2002 2003 2004 2005 2006 2007 2008 2009
%
In relation to the number
In relation to the capital
In relation to employees
Source: Elaborated from the CBS, the ASA, various issues.
5.4. Contribution of agro-industries to trade
Agro-industrial trade increased at a higher rate than that of total trade from US$1,109
million (average (1999-2001)) to US$3,857 million (average (2006-2008)) leading to
increasing its share in total trade from 12.8% to 14.3%, respectively, Table A5.11. Figure
5.12 traces the evolution of this trade diversified by agro-industrial sub-sectors in absolute
and relative terms from 1999 to 2008. It shows that this trade relies heavily on food stuff,
beverages, tobacco and textile industries. The level of the aforementioned agro-industrial
trade is determined by the level of exports and imports.
Figure 5.12. Development of the agro-industrial trade by sub-sectors, 1999-2008 (US$ million, %)
01,0002,0003,0004,0005,0006,000
US$ million
Agro-industrial trade
Textiles
Food stuff, beverages and tobacco
0
20
40
60
80% Contribution of agro-industries to trade
Share of agro-industries in total trade
Share of food stuff, beverages and tobacco in agro-industrialtradeShare of textiles in agro-industrial trade
Source: Elaborated from the NAPC database.
Like total trade, agro-industrial exports enlarged at a higher rate than that of total exports
from US$333 million (average (1999-2001) to US$2,538 million (average (2006-2008)).
Consequently, their share in total exports improved from 7.4% to 19.9%, respectively.
These exports are composed mainly of commodities related to food stuff, beverages,
tobacco and textile industries. These goods comprise cattle cheese, cotton lint, olive oil,
leather, apricot dried sheets, gaseous beverages and mineral water (Table A5.12). They

State of Food and Agriculture in Syria 2010
138
were characterized by high CR1 and CR2 as well as by improved RCAI over the
considered period. Agro-industrial imports, on the other hand, increased at a lower rate
than that of total imports from US$776 million (average (1999-2001) to US$1,319 million
(average (2006-2008)) leading to declining their share in total imports from 18.5% to
9.5%, respectively. Like agro-industrial exports, these imports focus mainly on food stuff,
beverages, tobacco and textile industries. They consist chiefly of sugar, milk powder,
canned fish and butter and ghee (Table A5.13) and are considered heavily concentrated.
5.5. Prices of agro-industrial products
Table A5.14 traces the development of the prices of agro-industrial products by
governorates from 2006 to 2010. It indicates high price increases due to the drought spells
and international food crisis over the considered period. Furthermore, Figure 5.13
illustrates the development of the unit value for selected exported and imported products
over the 1999-2008 period. Accordingly, this unit value followed a downward trend for
exports and an upward trend for imports.
Figure 5.13. Development of the unit value for selected exported and imported agro-industrial products, 1999-2008 (US$/tonne)
0500
1,0001,5002,0002,5003,0003,5004,000
US$/tonne Export
Cattle cheese Olive oil
Apricot dried sheet Mineral water
010002000300040005000600070008000
US$/ tonne
Import
Sugar Powder milk
Source: Elaborated from the NAPC database.
5.6. Enabling environments for competitive agro-industries
An enabling environment focuses on the improvement of four pillars namely: firm strategy
and rivalry, factor (input) conditions, demand situation and related supporting industries.
The first dimension comprises: (i) a local context and rules that encourage investment and
sustained upgrading (e.g. intellectual property protection), (ii) meritocratic incentive
systems across institutions, and (iii) open and vigorous competition among locally based
rivals. The second pillar addresses providing high-quality, specialized inputs to firms
State of Food and Agriculture in Syria 2010
139
including human, capital, and natural resources as well as physical, administrative,
information, scientific, and technological infrastructures. The third base includes: (i)
sophisticated and demanding local customers, (ii) local customer needs that anticipate
those elsewhere, and (iii) unusual local demand in specialized segments that can be served
nationally and globally. The fourth component incorporates access to capable, locally
based suppliers and firms in related fields as well as presence of clusters instead of
isolated industries. In this sense, essential enablers are land tenure and property rights,
infrastructure, trade policy and policies, tariffs and quotas for imported products;
important enablers are norms, standards, regulations and services related to production,
research and development, and financial services for agro-industries; useful enablers are
ease of doing business, business development services and business linkages. The
aforementioned principal components have been constantly a major focus of the SG. Some
actions of the state in this regard are presented below.
First, the Syrian economy enjoys stability because of the wealth of resources available to
support agribusiness and the regional and international integration with many partners
especially Arab countries in the context of the GAFTA, neighboring countries and
Mediterranean states. Recently, this cooperation is strengthened by signing several
bilateral agreements and enhancing the partnership with the EU. As a result, Syria is
currently an observe member in the WTO. In addition, the SG places high value on
structural adjustment programmes to enhance the performance of the economy in general
and to upgrade institutional capacities in particular.
Second, in July 2002, Syria joined officially the 1967 Stockholm Convention on
Intellectual Property Rights (IPR). Subsequently, the authorities have begun to enforce the
protection of IPR through raids and confiscations of pirated goods from a number of local
vendors and producers. In May 2004, Syria became a member of the World Intellectual
Property Organization (WIPO). In late 2005, the Syrian Intellectual Property Rights
Association (SIPA), an NGO, was established with a US$50,000 grant from the UNDP. In
November 2006, the NGO became an observer in the WIPO. Its main objectives include
increasing public awareness about IPR issues and supporting the execution of IPR laws and
regulations. To do so, it issues a quarterly newsletter, a geographical indicator list to
protect national industries (e.g. Ifrin oils, Aleppo soap) and certificates regarding
compliance with non-pirating/counterfeiting laws as well as evaluates the protection rights
in public and private companies in cooperation with the MOI.

State of Food and Agriculture in Syria 2010
140
Third, the Syrian economy is standing before a new era that is characterized by openness
on the world economy after a decision has been made to reconstruct the economy. This
stage is full of challenges due to international changes and economic polarity, that caused
by the initiation of great economic coalitions. Big steps have been made in reforming the
economy, through which numerous regulations were modified to concord with the new
resolve of achieving integration with international economy, and encouraging economic
competitiveness by improving the financial institutions and decreasing barriers to trade. In
the meanwhile, steps have been made to further involve the private sector both domestic
and foreign to contribute to building the economy, and activate its role in accelerating the
development of trade, industry and agriculture through intensive investment in these
sectors. The efforts started to show some positive results reflected in the improvement of
the trade performance, when trade volume increased and agriculture trade almost doubled
in the last decade, and the GDP growth.
Fourth, for three decades, substantial efforts have been in place to establish the scientific
infrastructure and to transform advanced technologies in the form of highly developed
machinery and equipment, and technical expertise. However, this evidence has been not
accompanied with the required investment and the involvement of the private sector. The
state has been the single player in R and D. Therefore, the current initiatives of the
Government are focusing on the enhancement of the private sector actions in this field.
Moreover, the Syrian expenditure on R and D doesn’t exceed 0.18% of the GDP, thus
falling short to comply with the internationally recommended rate of at least 1% of the
GDP and that of developed countries of 2.3%60.
Fifth, the Government helps provide the services that enhance agro-industries such as
water, electricity, energy, transportation vehicles, storage facilities, medical services,
education and training, adequate inputs, industrial cities and zones, free trade zones, private
banks, communication technologies and roads. The state also tries to increase private and
public universities. In addition, the MOI has many capacity building facilities located in
many governorates61.
Finally, in spite of the aforementioned efforts, the rating of Syria is 75/88 in the
competitive industrial performance (CIP), 56/88 in the per capita share of industrial value
added, 69/88 in the per capita share of industrial exports and 87/88 in the share of medium
60 Source: the 10th FYP. 61 www.syrianindustry.org.

State of Food and Agriculture in Syria 2010
141
and high value products in the total value added62. Therefore, the Government promotes
the implementation of Quality Assurance Systems to enhance the performance and to
comply with international specifications and tries to remove all kinds of constraints.
5.7. The need for adopting inclusive business models for small holders
This section describes a range of business models for inclusive market development in line
with agro-food restructuring and modernization63. It focuses specifically on models that
improve the inclusiveness, fairness, durability and financial sustainability of trading
relationships between small farmers on the one hand and downstream agribusiness
(processors, exporters and retailers) on the other. It also alerts us to the needs of external
providers, such as financiers and training agents.
5.7.1. Background
Small-scale farmers, who form the bedrock for global agro-food supply, are faced with
markets in unprecedented state of flux. Domestic markets are undergoing rapid but uneven
modernization, and higher value and export markets are increasingly the preserve of large-
scale suppliers.
The aforementioned changes are generating intense policy debate, particularly regarding
the opportunities facing small farmers and the rural poor as well as the rising urban-rural
income gap. Therefore, growth in agriculture and the rural non-farm economy is needed to
reduce rural poverty and narrow the urban-rural divide.
In line with the above, market modernization can offer increased economic opportunities
for producers, consumers, entrepreneurs and other actors in the food chain. Some of these
opportunities include a reduction in entry barriers to traditionally protected industries,
stronger access to services and the potential for entrepreneurial farmers to combine
resources and realize the collective worth of their land. In some areas, new market entrants
are stimulating competition for farmers’ produce, thus, helping increase the value retained
in rural economies.
Furthermore, inclusive business models are defined as those which do not leave behind
small-scale farmers and in which the voices and needs of those actors in rural areas are
recognized.
62 Source: the 10th FYP. 63 This section draws heavily on FAO and UNIDO (2009).

State of Food and Agriculture in Syria 2010
142
5.7.2. Important definitions
Ago-food chains and networks play an important role in providing access to markets for
producers from developing countries, as well as for local, regional and export markets. Any
change in those impacts the ability of agro-industrial enterprises to compete; small and
large alike will have to innovate and reduce costs, while being more responsive to
consumers’ needs. This is where Supply Chain Management (SCM) can help. In this
context, it is necessary to distinguish between several definitions, which are presented
below.
“Value chain” or “supply chain” is defined as a series of physical and decision-making
activities connected by material and information flows and associated flows of money and
property rights that cross organizational boundaries. Under this view, the supply chain
doesn’t include only the producers and their suppliers; depending on the logistical flows it
also considers processors, transporters (delivery), warehouses, wholesalers, retailers,
service organizations and consumers. Thus, a value chain analysis comprises four main
domains: technical, distributional (value added), international trade and institutional set-up.
SCM, on the other hand, is defined as the integrated planning, implementation,
coordination and control of all business processes and activities necessary to produce and
deliver, as efficiently as possible, products that satisfy market requirements. Hence, in a
Food Supply Chain Network (FSCN) different companies collaborate strategically in one
or more areas while preserving their own identity and autonomy. As stated, in a FSCN
more than one supply chain and more than one business process can be identified, both
parallel and sequential in time. In brief, chain actors may be involved in different supply
chains in different FSCNs and participate in a variety of business processes that change
over time and in which dynamically changing vertical and horizontal partnerships are
required.
5.7.3. A business model defined
A business model is the way by which a business creates and captures value within a
market network of producers, suppliers and customers (Figure 5.14). Its concept is linked
to business strategy and business operations. The business strategy incorporates the
business model design, whereas the later represent the implementation of the model into
organizational structures and systems. Hence, the partner network – the supply chain and
its coordination – is a vitally important source of competitive advantage. It also follows

State of Food and Agriculture in Syria 2010
143
that the model is highly sensitive to any addition of costs and risks, and it is around this
apex that the question of market inclusion ultimately revolves.
Figure 5.14. Template of a business model
Core Customer capabilities segment
Revenue streamsSuccess or failure
Value proposition(products and services)
Customer relationship
Distribution channel
Value configuration(activities and resources)
Partner network
Cost structure Source: Adopted from Osterwalder, 2006
Based on the above, it is crucial for the discussion of the inclusion of small-scale holders
that the aforementioned collaborative partner networks are usually built around a small
number of preferred suppliers. This requires co-investment and knowledge sharing
between producers, suppliers, processors and retailers. In this sense, adapted business
models are called for, where small-scale holders (farmers and others) can cooperate to
compete as one single supplier, and where their customers are responsive to the realities of
small-holder production.
5.7.4. Types of business models
Organization of production is central to overcoming the costs associated with dispersion of
producers, diseconomies of scale, poor access to information, technology and finance,
inconsistent volume and quality, lack of traceability and management of risk.
Consequently, emerging models tend to fall into three general categories: (i) those that
focus on developing and supporting producer organization; (ii) those that give attention to
specialized intermediaries; and (iii) those that are driven by buyers. Selecting the
appropriate model of those depends on the existing actors and skills. Despite the
differences in entry points and emphasis, all the models seek to connect actors to facilitate
effective market integration.
Producer-driven models:
Producer-driven models such as cooperatives and farmer-owned businesses aim to access
new markets, get higher market price, stabilize market position, provide extra supply
volumes and assure supply.
Therefore, collective action is an important strategy to increase small-scale producer
participation in emerging modern markets and to generate sustained commercial flows of

State of Food and Agriculture in Syria 2010
144
high-quality products. In this regard, effective business organizations are critical. Such
economic and business-focused organizations may build on existing informal networks of
farmers and traders, as well as support from buyers or other chain actors.
In Syria, such models are in practice. The farmers work together within cooperatives or
with agricultural chambers to concentrate the supply and to access new markets.
Buyer-driven models:
Buyer-driven models seek efficiencies in the chain to the benefit of processing and retail.
There are some very promising cases where the necessity of organizing the supply from a
small farm base, often the case with milk procurement, for example, has led to sustained
inclusion of small-scale farms.
In general, the classic model is where the buyer integrates backwards and coordinates
production. Both the producer and buyer ends of value chains usually want to cut out the
middleman and would like more competitive buying markets to make a shift from a
dependency on traditional wholesale markets in pursuit of value, improved quality and
product assurance. Thus, direct procurement is often presented as win-win-win for
customers, business and producers. Improved information flow among the supply chain
segments can also help reduce the marketing risk faced by both the company and farmers.
Another reason for businesses to organize their own supply base is the lack of collective
actions by producers, often due to suspicion of cooperatives or laws that insulate producers
from the market by obliging farmers to trade through local government-controlled
wholesale markets.
In particular, contract farming can be successfully used by businesses to link small-scale
producers to modern markets where capital, technology and market access constitute key
limiting factors. Contracts provide benefits to traders and processors by removing the risk
of periodic shortages and volatile prices, which can be costly if they are servicing large
downstream contracts written in advance of a season, or by allowing access to land, which
may not be available to expand plantation-scale production. Contract farming can also be
an effective mechanism for risk management, because a well-run contract scheme with
proven technology and guaranteed markets can help reduce risks normally faced by
unorganized farmers. It, however, can be only an intermediate step in the
commercialization of small-farmer production, as farmers innovate and reconnect with
more traditional system of brokers, but on their own terms.
State of Food and Agriculture in Syria 2010
145
Such types of models are applied in Syria in the dairy and conserve industries.
Models of intermediation:
Integrating forward (for producers) or backward (for retailers or processors) is time-
demanding and expensive. Despite the attractions of cutting out the middleman, organizing
direct procurement can have high transaction costs for private players, and have mixed
outcomes. Given these costs, a business model that work with chain intermediaries can
offer the opportunity to be profitable in high competitive, price-sensitive markets. It is
much easier for retailers setting up in emerging economies to procure from traditional
wholesalers, and leave the wholesaler to grade for physical quality, unless there are strong
market incentives for retailers to guarantee product quality, consistency, safety and
traceability. Accordingly, there are some very promising models of upgraded or new
intermediaries that are introducing food safety, consistent quality, year-round supply and
innovation, at a competitive price. Private companies are emerging as important
intermediaries that enable small-scale farmers to supply to supermarkets; much more
common at present are market-oriented but traditional traders taking steps to improve
quality in their supply chains, where suppliers produce to the traders’ specifications (crop
management, harvesting, packaging, etc.); export-oriented companies setting up in new
supplier countries almost always rely on intermediation to simplify decision making,
reduce risk and lower transaction costs.
These kinds of models are the most frequently applicable in Syria because Syrian traders
are very active in the market and are adaptive to new market changes.
Alternative trade models:
Alternative trade models cover a range of initiatives that make use of third party
certifications to monitor compliance with selected indicators valued by diverse members of
the supply chain. These models can be divided by their principal focus: (i) environment;
(ii) social; (iii) benefits to the local economy and community; and (iv) food safety and
quality. In this regard, the chain actors try to upgrade the value chain performance through
the cooperation with international agencies or their representatives in the country to access
international, regional and new emerging markets, which have specific standards or
requirements.

State of Food and Agriculture in Syria 2010
146
5.7.5. Adjusting business models in favor of small holders
It sets out the biggest challenge for modern agrifood business to work with small-scale
farmers as being to organize supply to deliver the benefits of logistics, economies of scale,
traceability and private sector standards (Table 5.5).
Table 5.5. The business case for and against procuring from small-scale producers For Against
Small holders’ comparative advantages (premium quality, access to land, etc.).
Securing supply in volatile markets. Spreading portfolio geographically. Reducing risk of undersupply as well as localized
pest and disease problems. New business, clients for other products and
services. New technologies available. Capacity to ramp up or ramp down production
without incurring fixed costs (contract farming). Access to donor assistance, corporate
responsibility, community good will and political capital.
Costs and risks in organizing supply from dispersed producers:
quantity, quality, consistency; safety, traceability, packaging; compliance with rising standards; loyalty and fulfillment of
commitments by farmers; negotiation time and costs; political opposition to
commercialization of peasant agriculture
Source: FAO and UNIDO, 2009.
5.7.6. Considerations to work successfully with small holders
Chain actors have to induce several actions to work successfully with small holders as
presented below.
Preparing small holders to participate:
From a business model perspective, small-scale farmers require skill upgrading to
participate in dynamic and more profitable market segments, in the fields of: (i) market
linkages for goods and services; (ii) increased internal and bridging social capital; and (iii)
the development of professional management capacities. The enhancement of these skills
entails access to effective support services, efficient alliances with other chain actors and a
helpful enabling environment.
Support services can be technical, managerial or financial in nature, provided by different
types of formal and informal service providers. These services aim to eliminate bottlenecks
that induce exclusion, to guarantee sustainability over time, to introduce flexibility linked
to client needs and to initiate provision by operators close to the clients. Financial services
are crucial for farmers to access dynamic markets and sustain their participation in them.
Another important point in times of high and volatile market prices is the development of
models of reciprocal responsibility between buyers and producers to avoid contract break

State of Food and Agriculture in Syria 2010
147
and to establish a sustainable relationship. Other focal aspects to consider are upgrading
mainstream procurement, better standards and pan-industry initiatives.
Priorities for the public sector:
There is a vitally important role for the public sector to facilitate alliances between small
holders and large businesses through introducing proactive policies such as infrastructure,
finance and support services. A priority area is that of the enabling environment. It can
include, for example, the investment in traditional and wholesale markets to be a bridge for
small-scale farmers to increase their capacity and to eventually link to modern markets.
Such an investment can focus on the modernization of wholesale markets and their
procurement networks. In addition, donors are increasingly interested in facilitating the
bridge between the majority of small-scale producers and modern markets. This means that
businesses can develop effective initiatives in partnership with governments, donors and
NGOs to learn as much from successes and failures of development agencies and NGOs as
the latter can learn from business. The public sector can also facilitate partnership and
chain-wide learning. A key pattern in successful linkages between small-scale farmers and
dynamic markets is the collaborative arrangement between: (i) trained and organized
farmers; (ii) a receptive business sector; and (iii) conductive public policies and
programmes. The development of collaboration among actors requires linking actors in
ways that facilitate discussions and information exchange among them. In addition, the
public sector can encourage the procurement from small and family-scale farmers. For
instance, a policy pressure or incentives to agribusiness and retail for pro-poor procurement
can be used to require supermarkets to provide adequate space in their shelves for small-
scale farmers’ products.
5.8. Agro-industries in the next period
The agro-industrial sector witnessed considerable improvement over the 2000-2009 period.
However, there are still a lot of blocking factors on both macro and micro levels
challenging the performance of this sector. Therefore, the SG intends to remove these
constraints through a series of procedures:
Increase the ability of the sector to contribute more to socio-economic
development and job creation, GDP growth and balance of payment.

State of Food and Agriculture in Syria 2010
148
Improve the competitiveness of the industry relying on innovation, diversification
and upgrading the ability of the least developed regions
Enhance the sector coherence backward and forward with the other sectors of the
economy.
Strengthen the industry technological and productive capacity through R and D,
training and improved management.
Ameliorate the sector capability to produce high value added products.
Upgrade internal and external marketing activities emphasizing the enhancement
of the quality and conformity to specifications.
Promote the private sector involvement in the aforementioned steps.
The above-mentioned actions constitute the focus of the 11th FYP.

State of Food and Agriculture in Syria 2010
149
Chapter 6 – Food security
This section reviews the state of food security in Syria over the 1999-2009 period
considering the four dimensions of food security. This analysis focuses mainly on the
macro assessment of food security pillars; such analysis is important, but it is limited in
scope with respect to what it can reveal about the food security situation. However, some
micro elements are included in the analysis (regional aspects) to make it more powerful.
6.1. Food security definition and measurement
Food security exists when all people, at all times, have physical and economic access to
sufficient, safe and nutritious food to meet their dietary needs and food preferences for an
active and healthy life64. This definition implies four principal components of food security
namely: availability of food, access to food, stability of supplies and access, and food
utilization and food safety. These four domains have to be achieved simultaneously at
individual, household, and national/sub-national levels.
The above-mentioned four pillars can be measured as follows:
Food availability is assessed by estimating total and per capita availabilities.
Access to food includes physical and economic components. Physical access can be
evaluated using various indicators such as political stability, road connections,
remoteness, natural disasters, etc. Economic access, on the other hand, can be
assessed relying on income level and its distribution, prices, employment, etc.
The stability of supplies and access relies on the steadiness of production, trade,
stocks, consumption fluctuations, income variations, and transitional versus chronic
hunger.
Food exploitation and food safety comprise several measures such as health, water
quantity and quality, and the nutritional status (macro and micro nutrients)
diversified by adults and children.
Based on the above, three methods to measure food security are used namely: the FBS,
which is constructed based on official data, Household Food Consumption drawn from
64 Göttingen University (2009).

State of Food and Agriculture in Syria 2010
150
Family Budget Survey Data (FBSD) and anthropometric measures. This chapter focuses on
the first two tools.
6.2. Food availability
Food availability is analyzed here using two concepts: aggregate food availabilities and per
capita food availabilities.
6.2.1. Aggregate food availabilities
"Aggregate Availability for Consumption" is defined as Production + Imports – Exports,
according to the definition used in the annual commodity balances prepared by the MAAR.
Therefore, the aggregate quantities "Available for Consumption" include both food
components and other uses such as feed, seeds, industry, losses and wastages. But, because
the focus is to analyze the trend of food availability and the fluctuations around it in order
to assess the performance of agriculture and there are no accurate data available especially
about wastages and losses and change in stocks, the methodology mentioned above was
adopted. Furthermore, in the absence of comprehensive supply/utilization accounts for
agricultural commodities, these data remain the best indicator available for the review of
the evolution of food supply in Syria. In this regard, upward trends point out to a good
outcome and relatively large variations indicate a critical food security situation. Relying
on this definition, several measures related to the major groups of agricultural products
were estimated such as change between periods, AGR, AAGR, CV, self-sufficiency ratio
(SSR) and import dependency ratio (IDR)65. Some of these indicators are presented in
Table 6.1 and Table A6.2. Table 6.1 traces the development of total availabilities for
selected groups of agricultural products over the 1999-2008 period.
Table 6.1. Evolution in total availabilities for selected food groups, 1999-2008 (000 tonnes)
Item Average 1 1999-2001
Average 2003-2005
Average 2 2006-2008
Change % 2/1
AAGR % 2/1
Food cereals 3,671 4,430 3,650 -0.6 -0.1 Food legumes 129 170 138 7.3 1.4 Vegetables 1,739 2,721 2,624 50.9 8.6 Fruits 2,388 2,554 3,004 25.8 4.7 Meat 347 379 451 29.9 5.4 Eggs (million) 2,541 3,460 3,403 33.9 6.0 Fresh milk 1,635 2,121 2,588 58.3 9.6 Source: Elaborated from the MAAR, the AASA, various issues and NAPC database.
Table 6.1 shows that a good overall progress in food availabilities was achieved from 1999
to 2008 despite the severe droughts over the 2006-2008 period. Only food cereals
65 See Annex 9.

State of Food and Agriculture in Syria 2010
151
underwent a slight annual decrease over this period owing to an increased export. These
total availabilities are influenced by domestic production, imports and exports. The
considerable growth in agricultural production realized in the last decades enabled Syria to
meet the fast growing demand for both food and agro-industries. The main drivers of the
demand for food are the relatively high population growth and income improvement. More
specifically, Figure 6.1 indicates the development of domestic production for the aforesaid
food groups from 1999 to 2008. It confirms that domestic production augmented over this
period (Table A6.1).
Figure 6.1. Development of domestic production for selected food groups, 1999-2008 (000 tonnes)
0
1,000
2,000
3,000
4,000
5,000000 tonnes
Average 1999-2001
Average 2003-2005
Average 2006-2008
0
100
200
300
400
500
Foodlegumes
Meat
000 tonnes
Average 1999-2001
Average 2003-2005
Average 2006-2008
Source: Elaborated from the MAAR, the AASA, various issues and NAPC database.
In addition, trade liberalization policies started in Syria in the mid-1980s led to
considerable increases in both total and agricultural trades. Export earnings grew at a fast
rate enabling Syria to finance the increased imports needed to ensure the stability of food
and non-food supplies. Another push has been the switching in objectives from self-
sufficiency, pursued in the past, to self-reliance, currently in place. This means that more
attention is being given to the comparative advantages of Syrian agriculture to access
foreign markets and to diversify trading partners. Other important achievements have been
executing the GAFTA, signing the partnership with the EU, attempting to join the World
Trade Organization (WTO), enhancing the role of the private sector in foreign trade and
removing or reducing custom duties to reform foreign trade. As a result, Syria is currently
an observe member in the WTO. The aforementioned progress is presented in Figure 6.2,
which shows the evolution in total agricultural trade, agricultural exports and agricultural
imports for selected food groups from 1999 to 2008 (Table A6.1). Figure 6.2 indicates an
overall enhancement in agricultural trade. This development influenced self-sufficiency
ratios of food products over the same period (Table A6.3). The SSR improved by food
cereals and meat, remained stable by vegetables, fresh milk and eggs, decreased slightly by
fruits and declined considerably by food legumes. Food legumes were impacted negatively

State of Food and Agriculture in Syria 2010
152
by the drought spells from 2006 to 2008. At the same time, an increased dependency on
imports of food products occurred, but, this dependency is still low (Figure 6.3 and Table
A6.4).
Figure 6.2. Development of agricultural trade for selected food groups, 1999-2008 (000 tonnes)
0200400600800
1,0001,200
000 tonnes
Total trade
Average 1999-2001
Average 2003-2005
Average 2006-2008
050
100150200250300350400450500
Food
cer
eals
Food
legu
mes
Veg
etab
les
Frui
ts
000 tonnes Import
Average 1999-2001
Average 2003-2005
Average 2006-2008
0200400600800
000 tonnes
Export
Average 1999-2001
Average 2003-2005
Average 2006-2008
Source: Elaborated from the MAAR, the AASA, various issues and NAPC database.
Figure 6.3. Development of the SSR and IDR for selected food groups, 1999-2008 (%)
0.050.0
100.0150.0200.0250.0
Food
cer
eals
Food
legu
mes
Veg
etab
les
Frui
ts
Mea
t
% Self-sufficiency ratios
Average 1999-2001 Average 2003-2005
Average 2006-2008
0.05.0
10.015.0
Food
cer
eals
Food
legu
mes
Veg
etab
les
Frui
ts
Mea
t
% Import dependency ratios
Average 1999-2001 Average 2003-2005Average 2006-2008
Source: Elaborated from the MAAR, the AASA, various issues and NAPC database.
Figure 6.2 and Figure 6.3 also indicate that domestic production is the major pillar of food
availability. The regional distribution of this production for the major groups of
agricultural products in 2008 is presented in Figure 6.4 (Table A6.5).
Figure 6.4. Distribution of domestic production by governorates, 2008 (%)
0%
10%
20%
30%
40%
50%
60%
70%
80%
90%
100%
Wheat Foodlegumes
Vegetables Fruits Meat Milk Eggs
Hassake
Dair-Ezzor
Raqqa
Aleppo
Lattakia
Tartous
Idleb
Al-Ghab
Hama
Homs
Damascus
Quneitra
Dar'a
Sweida Source: Elaborated from the MAAR, the AASA, various issues and NAPC database.

State of Food and Agriculture in Syria 2010
153
Figure 6.4 shows that domestic production is spreading out overall governorates and
underlies a regional concentration. Provincial food availability, however, is maintained by
a good market integration among the various regions, which results in small price
differences among them, governmental stock and state distribution policies66.
6.2.2. Aggregate per capita food availabilities
Food security situation can be better assessed on per capita basis because non-food uses,
change in stocks and wastages and losses are considered to some extent. In this sense,
considering the 2003-2008 period, there was an adverse impact on the per capita
availability of food legumes, vegetables and eggs because of the drought spells, increased
openness of international trade and relatively high population growth, whereas the per
capita availability of the other food groups increased (Table 6.2 and Table A6.6).
Consumption data67, however, revealed that the aforementioned decline in food availability
didn’t affect negatively the per capita food consumption as indicated in Table A6.7.
Accordingly, the per capita consumption of food legumes exceeded the per capita
availability, the per capita availability of eggs surpassed the per capita consumption and the
per capita consumption of vegetables is substantially higher than the per capita aggregate
availability; this indicates that households store likely legumes and vegetables. The
difference between availability and consumption of vegetables can also be related to
undeclared production and imports.
Table 6.2. Per capita availability of the major groups of agricultural products, 2003-2008 (kg/person/year, %)
Item Average
(2003-2005) Average
(2006-2008) Change % 2003-2008
Food cereals 211.1 218.4 3.5 Food legumes 9.1 6.1 -33.4 Vegetables 115.6 100.8 -12.8 Fruits 110.3 117.1 6.2 Milk 105.6 116.7 10.5 Meat 19.4 20.9 7.7 Eggs (eggs/person) 177.7 158.2 -11.2 Source: Elaborated from the NAPC and MAAR database.
Finally, Syria is in a good position regarding the food supply from vegetal origin as
compared to other countries, but, it is deficient on food intakes from animal sources
(Figure 6.5 and Table A6.6).
66 See chapter 3 and chapter 4. 67 CBS, Family Budget Survey, 2004 and 2007.

State of Food and Agriculture in Syria 2010
154
Figure 6.5. Per capita availability by countries, 2003-2008 (kg/person/year)
0
50
100
150
Syria
USA EU
Wor
ldkg/ c
apita
/yea
r
Fruits
Average 2003-2005Average 2006-2008
0
200
400
600
Syria
USA EU
Wor
ldkg /
capi
ta /y
ear
Milk, meat and eggs
Average 2003-2005
Average 2006-2008
0
100
200
300
kg /
capi
ta /y
ear
Vegetables
Average 2003-2005Average 2006-2008
0
100
200
300
Syria
USA EU
Wor
ldkg /
capi
ta /y
ear
Food cereals
Average 2003-2005Average 2006-2008
Source: Elaborated from the MAAR, the AASA, various issues, NAPC, FAO, AOAD and USDA databases. Estimates for other countries are provisional because FAO data have been not published yet; USA: United States of America.
6.3. Access to food
Syria is characterized by political stability. Other aspects of an improved physical access
are expressed in an improved infrastructure and attempts of the government to provide
facilities for remote area as well as to compensate the Syrian citizens in the case of natural
disasters.
The ability of the less privileged groups of the population to continue having access to
food they need also depends on other factors among which price, income and income
distribution are very important. In fact, the evolution of prices and income affects not only
the quantities of food consumed but also the structure of this consumption through the
substitution effect.
Therefore, data on the CPI and the index of the real per capita GDP were reviewed to
assess the possible effects of the evolution in prices and income on the access to food in the
2000-2009 period (Table 6.3).
Table 6.3. Evolution of the consumer price and real per capita GDP indices, 2000-2009 (%)
Item 2000* 2001 2002 2003 2004 2005 2006 2007 2008 2009 AGR %
General CPI 100 103 104 109 114 123 135 141 163 168 5.9 CPI of food 100 105 103 107 113 122 138 150 181 182 6.9 Index of RPGDP 100 109 105 110 114 117 121 123 127 2.7 Source: Elaborated from the CBS, the ASA, various issues. RPGDP: Real per capita GDP. * Base year. AGR: Simple annual growth rate, which compares between target year (2009) and base year (2000).
According to Table 6.3, Syria witnessed a fair growth in food prices until 2005 because the
CPI of food was lower than the general CPI, resulting in a positive income effect; this trend
reversed after 2005, leading to more expenditure on food (negative impact). Comparing the
CPI of food with the index of the RPGDP, on the other hand, indicates that food prices
increased at a substantially higher rate than that of the RPGDP, causing an adverse impact

State of Food and Agriculture in Syria 2010
155
on income. The spike in food prices was mostly related to the high international food prices
and the drought spells over the 2006-2008 period68.
The aforementioned facts indicate that the income of the Syrian population has to be
enhanced. To do so, the Government promotes the creation of new job opportunities
especially by private investments and foreign direct investments to comply with the
relatively high population growth. In addition, it contributes soundly to job creation
through both the General Commission for Employment and Project Operation and various
rural development projects. Besides, it tries to enhance a good supply chain management
and market integration practices in a view to improve both the accessibility to food and job
opportunities.
In-depth, Figure 6.6 traces the per capita income69 at constant prices of 2000 by major
sectors of the Syrian economy in 2008 and 2009 and the Lorenz curve70 for these sectors. It
shows that the rural sector ranked fifth in income generation. This means in turn that the
labour force in rural and urban areas had different abilities to access food due to varied
income. It also points out that the rural income improved considerably between the two
years as compared to that of the other sectors of the economy indicating an improved food
access by the rural population. The per capita income in the rural sector increased from
SP288.5 thousand in 2008 to SP349.5 thousand in 2009 or by 21.2%, whereas the average
income augmented only by 2.8% between the same years.
Figure 6.6. Evolution of the per capita income at constant prices of 2000 by sectors and its distribution, 2008 and 2009 (SP/capita/year, %)
Per capita GDP
0200,000400,000600,000800,000
BC
Others
Agricu
lture
WRT
MM
TCS FI
SP/person
2008
2009
Lorenz curve
020406080
100120
14 17 24 51 67 84 100
Cumulative Labour force (%)
Cum
ulat
ive
inco
me
(%)
Source: Elaborated from the CBS, ASA, 2009. BC: Building and construction; WRT: Wholesale and retail Trade; MM: Mining and manufacturing; TCS: Transport, communication and storage; FI: Finance and insurance.
The aforementioned income differences also prevailed in the various Syrian provinces
comprising both rural and urban populations from 2004 to 2009 (Table A6.8, Table A6.9
68 See chapter 4. 69 See chapter 2. 70 See Annex 9.
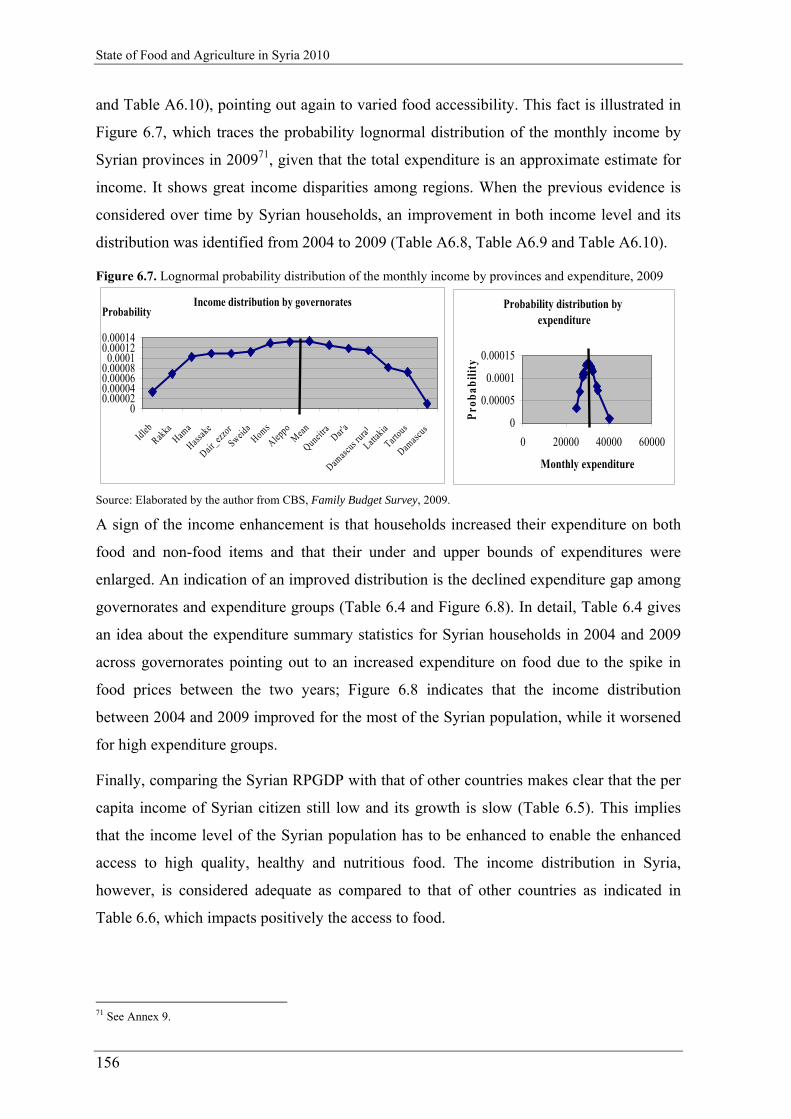
State of Food and Agriculture in Syria 2010
156
and Table A6.10), pointing out again to varied food accessibility. This fact is illustrated in
Figure 6.7, which traces the probability lognormal distribution of the monthly income by
Syrian provinces in 200971, given that the total expenditure is an approximate estimate for
income. It shows great income disparities among regions. When the previous evidence is
considered over time by Syrian households, an improvement in both income level and its
distribution was identified from 2004 to 2009 (Table A6.8, Table A6.9 and Table A6.10).
Figure 6.7. Lognormal probability distribution of the monthly income by provinces and expenditure, 2009
Income distribution by governorates
00.000020.000040.000060.00008
0.00010.000120.00014
Idleb
Rakka
Hama
Hassak
e
Dair_ez
zor
Sweida
Homs
Aleppo
Mea
n
Quneitra
Dar'a
Damasc
us rural
Lattak
ia
Tartous
Damasc
us
ProbabilityProbability distribution by
expenditure
0
0.00005
0.0001
0.00015
0 20000 40000 60000
Monthly expenditureP
rob
abili
ty
Source: Elaborated by the author from CBS, Family Budget Survey, 2009.
A sign of the income enhancement is that households increased their expenditure on both
food and non-food items and that their under and upper bounds of expenditures were
enlarged. An indication of an improved distribution is the declined expenditure gap among
governorates and expenditure groups (Table 6.4 and Figure 6.8). In detail, Table 6.4 gives
an idea about the expenditure summary statistics for Syrian households in 2004 and 2009
across governorates pointing out to an increased expenditure on food due to the spike in
food prices between the two years; Figure 6.8 indicates that the income distribution
between 2004 and 2009 improved for the most of the Syrian population, while it worsened
for high expenditure groups.
Finally, comparing the Syrian RPGDP with that of other countries makes clear that the per
capita income of Syrian citizen still low and its growth is slow (Table 6.5). This implies
that the income level of the Syrian population has to be enhanced to enable the enhanced
access to high quality, healthy and nutritious food. The income distribution in Syria,
however, is considered adequate as compared to that of other countries as indicated in
Table 6.6, which impacts positively the access to food.
71 See Annex 9.
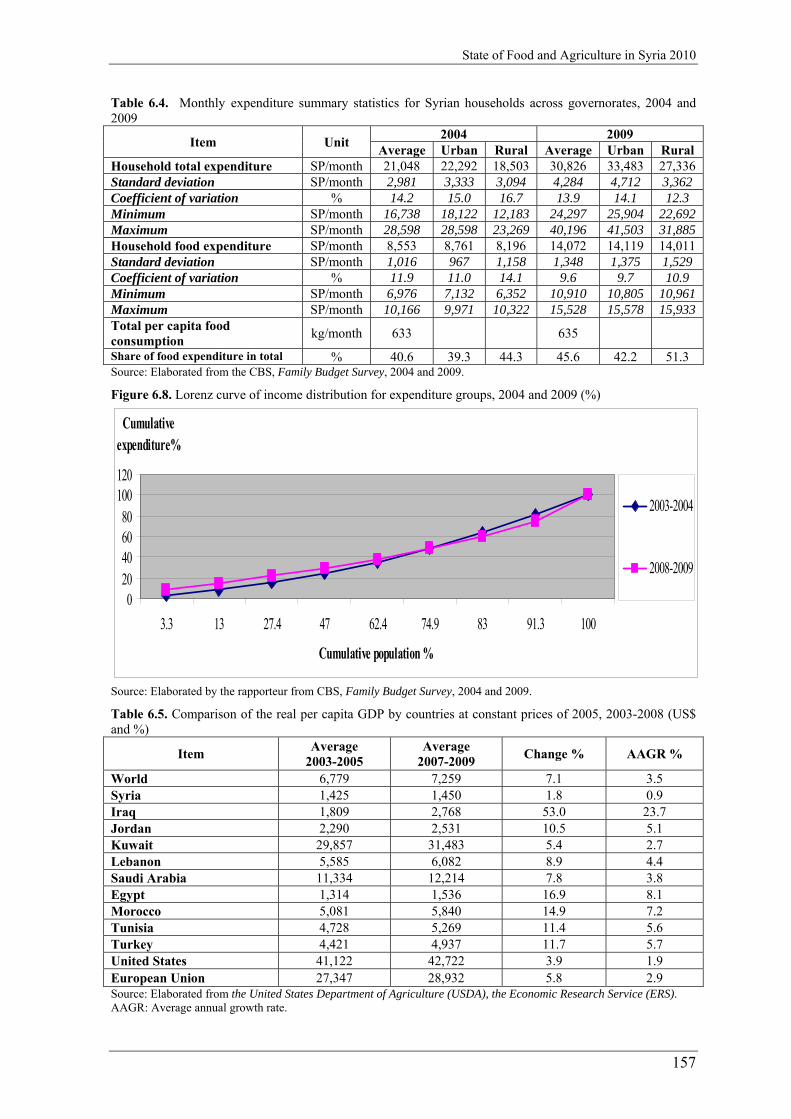
State of Food and Agriculture in Syria 2010
157
Table 6.4. Monthly expenditure summary statistics for Syrian households across governorates, 2004 and 2009
Item Unit 2004 2009
Average Urban Rural Average Urban Rural Household total expenditure SP/month 21,048 22,292 18,503 30,826 33,483 27,336 Standard deviation SP/month 2,981 3,333 3,094 4,284 4,712 3,362 Coefficient of variation % 14.2 15.0 16.7 13.9 14.1 12.3 Minimum SP/month 16,738 18,122 12,183 24,297 25,904 22,692 Maximum SP/month 28,598 28,598 23,269 40,196 41,503 31,885 Household food expenditure SP/month 8,553 8,761 8,196 14,072 14,119 14,011 Standard deviation SP/month 1,016 967 1,158 1,348 1,375 1,529 Coefficient of variation % 11.9 11.0 14.1 9.6 9.7 10.9 Minimum SP/month 6,976 7,132 6,352 10,910 10,805 10,961 Maximum SP/month 10,166 9,971 10,322 15,528 15,578 15,933 Total per capita food consumption
kg/month 633 635
Share of food expenditure in total % 40.6 39.3 44.3 45.6 42.2 51.3 Source: Elaborated from the CBS, Family Budget Survey, 2004 and 2009.
Figure 6.8. Lorenz curve of income distribution for expenditure groups, 2004 and 2009 (%)
020406080
100120
3.3 13 27.4 47 62.4 74.9 83 91.3 100
Cumulative population %
Cumulative expenditure%
2003-2004
2008-2009
Source: Elaborated by the rapporteur from CBS, Family Budget Survey, 2004 and 2009.
Table 6.5. Comparison of the real per capita GDP by countries at constant prices of 2005, 2003-2008 (US$ and %)
Item Average
2003-2005 Average
2007-2009 Change % AAGR %
World 6,779 7,259 7.1 3.5 Syria 1,425 1,450 1.8 0.9 Iraq 1,809 2,768 53.0 23.7 Jordan 2,290 2,531 10.5 5.1 Kuwait 29,857 31,483 5.4 2.7 Lebanon 5,585 6,082 8.9 4.4 Saudi Arabia 11,334 12,214 7.8 3.8 Egypt 1,314 1,536 16.9 8.1 Morocco 5,081 5,840 14.9 7.2 Tunisia 4,728 5,269 11.4 5.6 Turkey 4,421 4,937 11.7 5.7 United States 41,122 42,722 3.9 1.9 European Union 27,347 28,932 5.8 2.9 Source: Elaborated from the United States Department of Agriculture (USDA), the Economic Research Service (ERS). AAGR: Average annual growth rate.
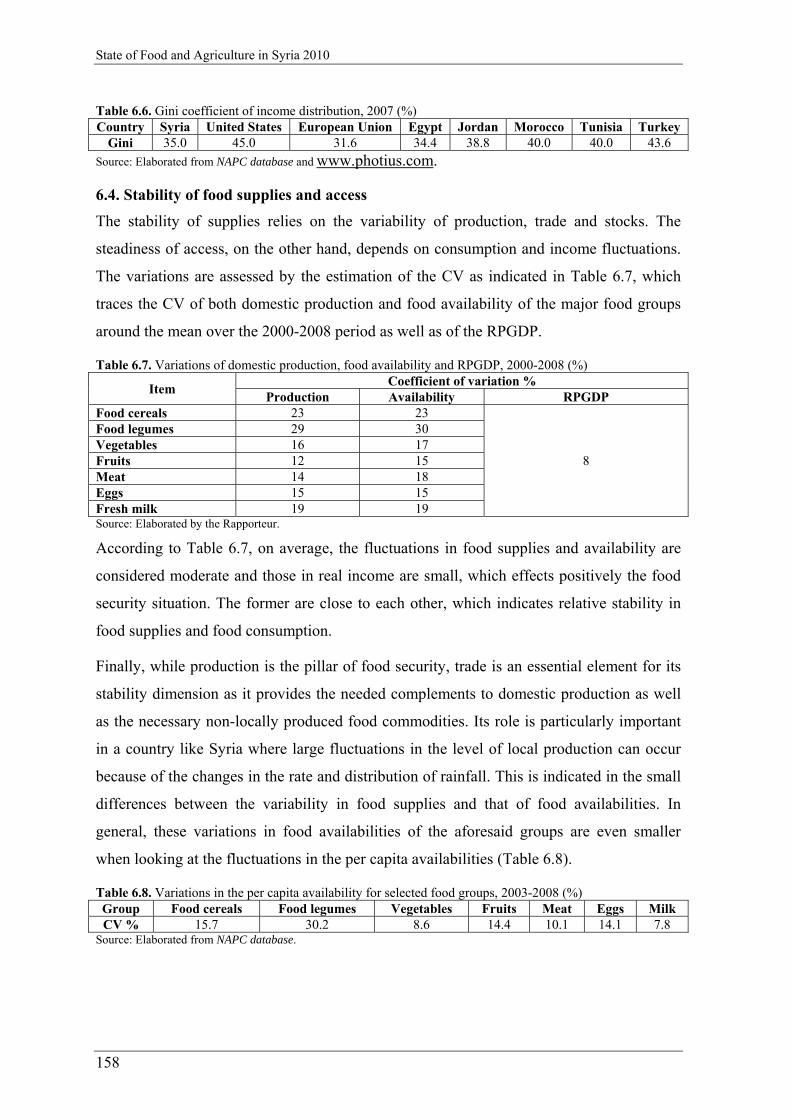
State of Food and Agriculture in Syria 2010
158
Table 6.6. Gini coefficient of income distribution, 2007 (%) Country Syria United States European Union Egypt Jordan Morocco Tunisia Turkey
Gini 35.0 45.0 31.6 34.4 38.8 40.0 40.0 43.6
Source: Elaborated from NAPC database and www.photius.com.
6.4. Stability of food supplies and access
The stability of supplies relies on the variability of production, trade and stocks. The
steadiness of access, on the other hand, depends on consumption and income fluctuations.
The variations are assessed by the estimation of the CV as indicated in Table 6.7, which
traces the CV of both domestic production and food availability of the major food groups
around the mean over the 2000-2008 period as well as of the RPGDP.
Table 6.7. Variations of domestic production, food availability and RPGDP, 2000-2008 (%)
Item Coefficient of variation %
Production Availability RPGDP Food cereals 23 23
8
Food legumes 29 30 Vegetables 16 17 Fruits 12 15 Meat 14 18 Eggs 15 15 Fresh milk 19 19 Source: Elaborated by the Rapporteur.
According to Table 6.7, on average, the fluctuations in food supplies and availability are
considered moderate and those in real income are small, which effects positively the food
security situation. The former are close to each other, which indicates relative stability in
food supplies and food consumption.
Finally, while production is the pillar of food security, trade is an essential element for its
stability dimension as it provides the needed complements to domestic production as well
as the necessary non-locally produced food commodities. Its role is particularly important
in a country like Syria where large fluctuations in the level of local production can occur
because of the changes in the rate and distribution of rainfall. This is indicated in the small
differences between the variability in food supplies and that of food availabilities. In
general, these variations in food availabilities of the aforesaid groups are even smaller
when looking at the fluctuations in the per capita availabilities (Table 6.8).
Table 6.8. Variations in the per capita availability for selected food groups, 2003-2008 (%) Group Food cereals Food legumes Vegetables Fruits Meat Eggs Milk CV % 15.7 30.2 8.6 14.4 10.1 14.1 7.8
Source: Elaborated from NAPC database.

State of Food and Agriculture in Syria 2010
159
6.5. Aggregate per capita daily food utilization
The improvement in both the macro and micro environments and the economic push of the
Syrian economy from 1985 to 2008, due to economic reform and structural adjustment
programmes, affected positively food consumption and as a consequence the nutritional
status of the population. However, a part of the Syrian population still can’t get its basic
food needs (poor people). Therefore, this section focuses on the nutritional status of the
Syrian population in the form of macro and micro nutrients to identify strengths and
weaknesses of food utilization in Syria over the 1999-2009 period.
6.5.1. Background
Food utilization expresses the ability of the human body to make efficient use of macro and
micro nutrients included in ingested foods. Macro nutrients comprise energy, proteins, fats
and carbohydrates, whereas micro nutrients encompass vitamins and minerals, the most
important of which are vitamin C, vitamin A, vitamin B1, vitamin B2, vitamin B6, vitamin
B12, calcium, iron and iodine. Both nutrient categories are considered important for the
body to carry out its physiological functions. These nutrients are found in foods from
vegetal and animal origins. Therefore, it is preferable to acquire the required nutrients from
both sources because each source has its special benefits. Some foods related to livestock
are better suited than those linked to crops because they have a higher nutritional value
than the latter. Nevertheless, they are difficult to ingest and poor on fibers. Vegetal
products, on the other hand, are rich on fibers and have particular nutrients that are not
available in the former. Fibers consist of large particles that enhance the feeling of
satiation.
6.5.2. Methodological guidelines
Two types of models were used to assess the evolution in the nutritional status of the
Syrian population expressed in the form of macro and micro nutrients. The first model
enabled the comparison of daily nutrient intakes in Syria with those of other countries as
well as with the daily reference intakes per capita (Table A6.11 and Table A6.12). It relied
on food composition values diversified by countries (Table A6.13). These values were
estimated based on FAO, USDA, AOAD and NAPC official data and calibrated according
to both FAO and USDA estimates of macro and micro nutrients. The second model was
used to assess the nutrient intakes differentiated by the Syrian regions and their population
strata, which consist of both urban and rural populations. The food composition table

State of Food and Agriculture in Syria 2010
160
adopted in this model was assessed relying on both FAO and Syrian data sources (Table
A6.14). FAO food composition tables were used only to calculate calorie, protein and fat
intakes. Hence, the estimated nutrient intakes relied on the official consumption data
published by the CBS about the 2004, 2007 and 2009 Family Budget Surveys.
6.5.3. Expenditure on food
Table 6.9 illustrates the structure of the Syrian food consumed in 2004 and 2009. In terms
of percentage, it indicates a decreased share of the most important food groups in food
expenditure. Looking at the quantities consumed, however, points out to an increased
consumption of cereals, food of animal origin and fruits and nuts. These expenditures and
quantities vary by Syrian provinces, thus influencing differently the nutritional status of the
population living there (Table 6.9, Table A6.7, Table A6.8 and Table A6.15).
Table 6.9. Evolution of the structure of the food expenditure, 2004 and 2009 (kg/person, %)
Item
2004 2009 Index % on food
expenditure
Quantity kg/person
% on food
expenditure
Quantity kg/person
Share in food
expenditure Quantity
Cereals and its derivatives
14.5 194 13.5 208 0.93 1.07
Meat, fish, eggs and dairies
29.7 94 28.7 95 0.97 1.01
Vegetables and legumes
18.6 247 16.7 218 0.90 0.88
Fruits and nuts 7.7 46 7.2 55 0.94 1.20 Other foods 29.5 52 33.9 59 1.15 1.13 Source: Elaborated from CBS. Family Budget Survey, 2004 and 2009. Other foods include vegetal oils, sugar and sweets, drinks and others.
6.5.4. Calorie intakes
The body needs the energy to perform its physiological functions. The amount of this
energy varies owing to work intensity, age, size of the person and environmental
conditions. Hence, the minimum energy daily requirements amount to 1,800
kcal/capita/day on average (full rest), Table A6.11. The body acquires this energy from
proteins, fats and carbohydrates that are available in ingested foods (Table A6.14).
As for Syria, relying on the data of the FBS, the average calorie intake increased from
3,056 kcal/capita/day over the 1999-2001 period to 3,116 kcal/capita/day over the 2006-
2008 period (Table A6.16), thus exceeding the recommended level of the daily energy
requirement per capita, which amounts to 2,125-2,700 kcal/capita/day (Table A6.11 and
Table A6.12). This attained level of the energy is considered good as compared to that of
the world average and those of selected countries (Figure 6.9 and Table A6.16).
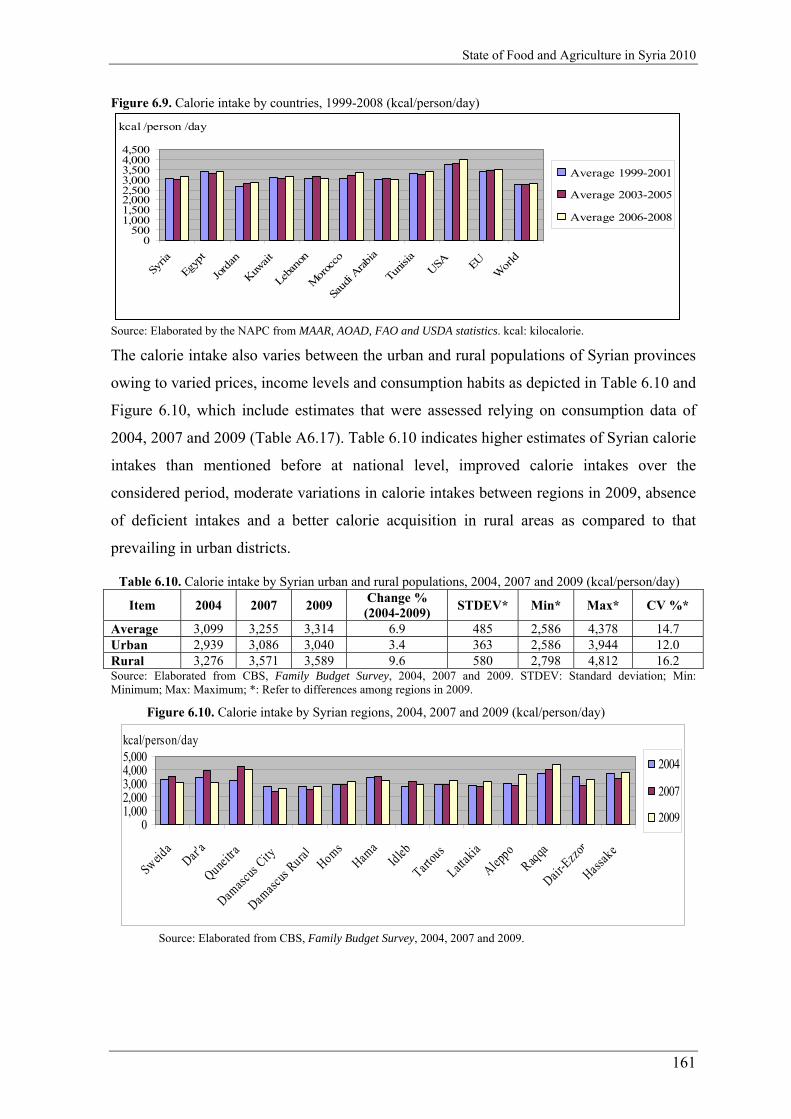
State of Food and Agriculture in Syria 2010
161
Figure 6.9. Calorie intake by countries, 1999-2008 (kcal/person/day)
kcal /person /day
0500
1,0001,5002,0002,5003,0003,5004,0004,500
Syria
Egypt
Jord
an
Kuw
ait
Leban
on
Mor
occo
Saud
i Arabi
a
Tunisi
aUSA EU
Wor
ld
Average 1999-2001
Average 2003-2005
Average 2006-2008
Source: Elaborated by the NAPC from MAAR, AOAD, FAO and USDA statistics. kcal: kilocalorie.
The calorie intake also varies between the urban and rural populations of Syrian provinces
owing to varied prices, income levels and consumption habits as depicted in Table 6.10 and
Figure 6.10, which include estimates that were assessed relying on consumption data of
2004, 2007 and 2009 (Table A6.17). Table 6.10 indicates higher estimates of Syrian calorie
intakes than mentioned before at national level, improved calorie intakes over the
considered period, moderate variations in calorie intakes between regions in 2009, absence
of deficient intakes and a better calorie acquisition in rural areas as compared to that
prevailing in urban districts.
Table 6.10. Calorie intake by Syrian urban and rural populations, 2004, 2007 and 2009 (kcal/person/day)
Item 2004 2007 2009 Change % (2004-2009)
STDEV* Min* Max* CV %*
Average 3,099 3,255 3,314 6.9 485 2,586 4,378 14.7 Urban 2,939 3,086 3,040 3.4 363 2,586 3,944 12.0 Rural 3,276 3,571 3,589 9.6 580 2,798 4,812 16.2 Source: Elaborated from CBS, Family Budget Survey, 2004, 2007 and 2009. STDEV: Standard deviation; Min: Minimum; Max: Maximum; *: Refer to differences among regions in 2009.
Figure 6.10. Calorie intake by Syrian regions, 2004, 2007 and 2009 (kcal/person/day)
01,0002,0003,0004,0005,000
Sweida
Dar'a
Quneitr
a
Damasc
us City
Damasc
us Rural
HomsHam
aIdleb
Tartou
s
Lattak
ia
Aleppo
Raqqa
Dair-E
zzor
Hassak
e
kcal/person/day
2004
2007
2009
Source: Elaborated from CBS, Family Budget Survey, 2004, 2007 and 2009.

State of Food and Agriculture in Syria 2010
162
6.5.5. Protein intakes
Proteins are necessary for the body to provide the amino-acids that the body can’t produce,
the nitric substances required for producing the amino-acids that the body can create and
the nitric vitamins such as thiamin and riboflavin. Therefore, the nutritional value of
proteins differs from food to another owing to the degree of its inclusion of particular
amino-acids. In this regard, it is worth mentioning that the body can’t rely only on proteins
to capture its energy requirements in spite of their importance thus neglecting fats and
carbohydrates. This is because the body can’t ingest all the proteins required for producing
the entire energy requirement and because the over-consumption of proteins causes lever
and kidney diseases.
In relation to Syria, the average protein intake augmented from 73.9 g/capita/day (average (1999-2001)) to 82 g/capita/day (average (2006-2008)) thus exceeding the daily protein reference intake per capita, which accounts for 41.4-75 g/capita/day (Table A6.11, Table A6.12 and Table A6.18), and that of the world average. It is still, however, below those of all selected states excluding Jordan (Figure 6.11). It differs as well among urban and rural populations of Syrian regions as illustrated in Table 6.11 and Figure 6.12 (Table A6.19). Table 6.11 explains that small protein intake differences were in place between regions in 2009, rural populations were better off than those living in urban areas, paucities in protein intakes were absent as compared to the daily reference intake per capita and higher protein estimates as mentioned before at national level were attained. Figure 6.11. Protein intake by countries, 1999-2008 (g/person/day)
g/capita /day
0
20
40
60
80
100
120
140
Syria
Egypt
Jordan
Kuwait
Leban
on
Moroc
co
Saud
i Arabia
Tunisi
aUSA EU
Wor
ld
Average 1999-2001
Average 2003-2005
Average 2006-2008
Source: Elaborated by the NAPC from MAAR, AOAD, FAO and USDA statistics. g: gram.
Table 6.11. Protein intake by Syrian urban and rural populations, 2004, 2007 and 2009 (g/person/day)
Item 2004 2007 2009 Change % (2004-2009)
STDEV Min Max CV %
Average 83 91 91 9.6 8.6 74 102 9.4 Urban 83 89 87 4.8 7.5 74 98 8.7 Rural 82 95 96 17.1 9.9 80 110 10.3 Source: Elaborated from CBS, Family Budget Survey, 2004, 2007 and 2009.

State of Food and Agriculture in Syria 2010
163
Figure 6.12. Protein intake by Syrian regions, 2004, 2007and 2009 (g/person/day)
0
20
40
60
80
100
120
Sweid
aDar
'a
Qunei
tra
Damas
cus C
ity
Damas
cus R
ural
Homs
Hama
Idleb
Tarto
us
Lattak
ia
Alepp
o
Raqqa
Dair-E
zzor
Hassa
ke
g/person/day
2004
2007
2009
Source: Elaborated from CBS, Family Budget Survey, 2004, 2007 and 2009.
6.5.6. Fat intakes
Fats have more potential to provide energy for the body than proteins and carbohydrates
do. But, the body can’t exclusively rely on fats thus neglecting carbohydrates and proteins
because they are difficult to ingest and because the over-consumption of fats without
commutation them with carbohydrates leads to acidosis. In addition, in spite of the fact that
the exclusion of fats is theoretically possible using carbohydrates, it is not advisable to
perform this habit because such behaviour causes a reduction in both cholesterol absorption
and vitamins that are soluble in fats.
Linked to Syria, the average fat intake decreased from 107 g/capita/day (average (1999-
2001)) to 98 g/capita/day (average (2006-2008)), but, still lying above the recommended
level of the daily fat requirement per capita, which is 41.4-75 g/capita/day (Table A6.11,
Table A6.12 and Table A6.20), and that of the world average. It is also considered
adequate when compared to those of other countries (Figure 6.13).
Figure 6.13. Fat intake by countries, 1999-2008 (g/person/day)
g/capita /day
020406080
100120140160180
Syria
Egypt
Jordan
Kuwait
Leban
on
Moroc
co
Saud
i Arabia
Tunisi
aUSA EU
Wor
ld
Average 1999-2001
Average 2003-2005
Average 2006-2008
Source: Elaborated by the NAPC from MAAR, AOAD, FAO and USDA statistics.

State of Food and Agriculture in Syria 2010
164
Fat intake is diverse as well among urban and rural populations of Syrian provinces as
explained in Table 6.12 and Figure 6.14 (Table A6.21). Table 6.12 and Figure 6.14 show
an increased fat consumption diversified by both urban and rural populations from 2004 to
2009, even higher fat estimates as indicated before at national level, moderate fat intake
differences among regions and population strata and governorates intakes over the daily
reference intake per capita. Like calories and proteins, rural population consumes more fat
than civilian. Finally, it is worthy to note that Syrian populations prefer to source out their
fat supply from vegetal sources. This means that the Syrian citizen perform a healthy life
especially because a half of the vegetal oil consumption is formed of olive oil, which is
known for its nutritional properties.
Table 6.12. Fat intake by Syrian urban and rural populations, 2004, 2007 and 2009 (g/person/day)
Item 2004 2007 2009 Change % (2004-2009)
STDEV Min Max CV %
Average 101 108 109 7.9 14.1 88 137 12.9 Urban 102 105 103 1.0 11.5 85 126 11.1 Rural 99 113 115 16.2 19.0 84 140 16.6 Source: Elaborated from CBS, Family Budget Survey, 2004, 2007 and 2009.
Figure 6.14. Fat intake by Syrian regions, 2004, 2007 and 2009 (g/person/day)
050
100150200
Sweida
Dar'a
Quneitr
a
Damasc
us City
Damasc
us Rural Homs
Hama
Idleb
Tartou
s
Lattak
ia
Aleppo
Raqqa
Dair-E
zzor
Hassak
e
g/capita/day
2004
2007
2009
Source: Elaborated from CBS, Family Budget Survey, 2004, 2007 and 2009.
6.5.7. Carbohydrate intakes
Carbohydrates are considered as a major energy generator. But, relying solely on them to
generate the required energy without using fats requires the consumption of large quantities
of those, which leads to diabetes and tooth cavity.
Connected to Syria, the average carbohydrate intake enhanced from 483 g/capita/day
(average (1999-2001)) to 514 g/capita/day (average (2006-2008)), but, it is still above the
daily reference intake per capita, which is 360 g/capita/day (Table A6.11, Table A6.12 and
Table A6.22), and that of the world average. It is also considered reasonable as compared
to those widespread in other countries (Figure 6.15). It is as well different among urban

State of Food and Agriculture in Syria 2010
165
and rural populations of Syrian governorates as identified in Table 6.13 and Figure 6.16
(Table A6.23). Table 6.13 and Figure 6.17 indicate increased carbohydrate consumption
from 2004 to 2009, moderate carbohydrate intake variances among regions and population
strata and a carbohydrate acquisition more than the daily reference intake per capita in all
regions.
Figure 6.15. Carbohydrate intake by countries, 1999-2008 (g/person/day)
g/capita /day
0
100
200
300
400
500
600
700
Syria
Egypt
Jord
an
Kuw
ait
Leban
on
Mor
occo
Saud
i Arabia
Tunisi
aUSA EU
Wor
ld
Average 1999-2001
Average 2003-2005
Average 2006-2008
Source: Elaborated by the NAPC from MAAR, AOAD, FAO and USDA statistics.
Table 6.13. Carbohydrate intake by Syrian urban and rural populations, 2004, 2007 and 2009 (g/person/day)
Item 2004 2007 2009 Change % (2004-2009)
STDEV Min Max CV %
Average 457 472 496 8.5 86 366 705 17.5 Urban 417 438 446 7.0 63 366 614 14.2 Rural 502 536 546 8.8 103 443 796 18.9 Source: Elaborated from CBS, Family Budget Survey, 2004, 2007 and 2009.
Figure 6.16. Carbohydrate intake by Syrian regions, 2004, 2007 and 2009 (g/person/day)
0100200300400500600700800
Sweid
aDar
'a
Qunei
tra
Damas
cus C
ity
Damas
cus R
ural
Homs
Hama
Idleb
Tarto
us
Lattak
ia
Alepp
o
Raqqa
Dair-E
zzor
Hassa
ke
g/capita/day
2004
2007
2009
Source: Elaborated from CBS, Family Budget Survey, 2004, 2007 and 2009.
6.5.8. Vitamin C intakes
The average vitamin C intake in Syria increased from 75 mg/person/day (average (1999-
2001)) to 81 mg/capita/day (average (2006-2008)), thus remaining above the daily vitamin
C requirement per capita, which is 47.9-75 mg/capita/day (Table A6.11, Table A6.12 and
Table A6.24). However, it fell below that of the world average and those of selected states

State of Food and Agriculture in Syria 2010
166
(Figure 6.17). It is also disparate among urban and rural populations of Syrian regions as
shown in Table 6.14 and Figure 6.18, which show substantially better results than those
attained at national level, regions intakes exceeding considerably the daily reference intake
per capita and moderate variations among provinces in 2009.
Figure 6.17. Vitamin C intake by countries, 1999-2008 (mg/person/day)
mg/capita /day
020406080
100120140160180
Syria
Egypt
Jord
an
Kuwait
Leban
on
Mor
occo
Saudi
Arab
ia
Tunisi
aUSA EU
Wor
ld
Average 1999-2001
Average 2003-2005
Average 2006-2008
Source: Elaborated by the NAPC from MAAR, AOAD, FAO and USDA statistics; mg: milligram.
Table 6.14. Vitamin C intake by Syrian urban and rural populations, 2004, 2007 and 2009 (mg/person/day)
Item 2004 2007 2009 Change % (2004-2009)
STDEV Min Max CV %
Average 152 142 142 -6.6 18 116 185 12.4 Urban 153 140 138 -9.8 19 113 183 13.8 Rural 152 146 146 -3.9 18 119 188 12.5 Source: Elaborated from CBS, Family Budget Survey, 2004, 2007 and 2009.
Figure 6.18. Vitamin C intake by Syrian regions, 2004, 2007 and 2009 (mg/person/day)
0
50
100
150
200
SweidaDar'
a
Quneitra
Damascus C
ity
Damascus R
uralHoms
Hama
Idleb
Tartous
Lattakia
Aleppo
Raqqa
Dair-E
zzor
Hassake
mg/capita/day
2004
2007
2009
Source: Elaborated from CBS, Family Budget Survey, 2004, 2007 and 2009.
Finally, sources of vitamin C are green pepper, cabbage, citrus, tomatoes and all vegetal
and animal tissues. Paucity of this vitamin induces tooth cavity, loss of appetite, gingival,
tendency to bleeding, non-cure of wound, ingestion and growth discrepancies, laziness,
fatigue, weariness, infection and inflammation.

State of Food and Agriculture in Syria 2010
167
6.5.9. Vitamin A intakes
FAO classifies countries into three categories according to vitamin A intake. The first
group consumes less than 300 microg72/capita/day; the second class ingests 300-600
microg/capita/day; and the third cluster has a level of vitamin A intake greater than 600
microg/capita/day. Syria lies in the second stratum (Table A6.26).
In line with the above, vitamin A intake in Syria diminished from 451 microg/capita/day
(average (1999-2001)) to 438 microg/capita/day (average (2006-2008)) thus lying
considerably below the recommended level of the daily vitamin A intake per person, which
is 757-1,500 microg/capita/day (Table A6.11 and Table A6.12), and those of selected
countries (Table A6.26 and Figure 6.19).
Figure 6.19. Vitamin A intake by countries, 1999-2008 (microg/person/day)
microg/capita /day
0200
400600800
1000
12001400
Syria
Egypt
Jord
an
Kuwai
t
Leban
on
Mor
occo
Saud
i Ara
bia
Tunisi
aUSA EU
Wor
ld
Average 1999-2001
Average 2003-2005
Average 2006-2008
Source: Elaborated by the NAPC from MAAR, AOAD, FAO and USDA statistics.
The aforementioned intake of vitamin A in Syria also varies among the urban and rural
populations of Syrian provinces as depicted in Table 6.15, which reveals that this intake
decreased considerably from 2004 to 2009, both population strata were deficient on
vitamin A intake especially rural citizens as compared to the daily reference intake and
there were moderate intake variations among Syrian regions in 2009.
Table 6.15. Vitamin A intake by Syrian urban and rural populations, 2004, 2007 and 2009 (microg/person/day)
Item 2004 2007 2009 Change % (2004-2009)
STDEV Min Max CV %
Average 561 452 358 -36.2 52 279 457 14.9 Urban 630 522 370 -41.3 72 278 510 18.8 Rural 492 382 344 -30.1 49 279 433 14.3 Source: Elaborated from CBS. Family Budget Survey, 2004, 2007 and 2009.
Figure 6.20 confirms additionally the under-provision of vitamin considering all Syrian
governorates. This deficiency exists especially in the southern and northern areas, which
deserve a great attention.
72 microg: microgram.

State of Food and Agriculture in Syria 2010
168
Figure 6.20. Vitamin A intake by Syrian regions, 2009 (microg/person/day)
0100200300400500600
Sweida
Dar'a
Quneitr
a
Damas
cus C
ity
Damas
cus R
ural
HomsHam
aId
leb
Tartou
s
Lattak
ia
Aleppo
Raqqa
Dair-E
zzor
Hassa
keM
ean
microg/capita/day
Urban
Rural
Average
Source: Elaborated from CBS. Family Budget Survey, 2009.
Finally, vitamin A exists in whale-lever oil, fish, calf lever, spinach, parsley, cabbage,
butter, carrots, tomatoes, eggs and women milk. Its shortage causes a decrease of the
vision, night blindness, skin deterioration, eye diseases, teeth diseases, prevention of
growth especially child bones, pregnancy disturbance, color paleness and stone formation.
6.5.10. Vitamin B1 intakes
Vitamin B1 intake in Syria increased from 2 mg/capita/day (average (1999-2001)) to 2.2
mg/capita/day (average (2006-2008)), thus surpassing the daily requirement, which varies
between 0.9 and 1.5 mg/capita/day, and that of the world average (Table A6.11, Table
A6.12, Table A6.27 and Figure 6.22). But, it is still lower than those prevailing in most of
the selected states (Figure 6.21).
Figure 6.21. Vitamin B1 intake by countries, 1985-2008 (mg/person/day)
mg/capita /day
0
0.5
1
1.5
2
2.5
3
3.5
Syria
Egyp
t
Jordan
Kuw
ait
Leba
non
Moroc
co
Saud
i Arabia
Tuni
siaUSA EU
Wor
ld
Average 1999-2001
Average 2003-2005
Average 2006-2008
Source: Elaborated by the NAPC from MAAR, AOAD, FAO and USDA statistics.
Vitamin B1 intake also differs among urban and rural populations of Syrian governorates
as illustrated in Table 6.16 and Figure 6.22 (Table A6.28). Table 6.16 and Figure 6.22
clarify that there was an intake improvement over the considered period, both population
strata and all regions consumed sufficiently of this nutrient as compared to the daily
reference intake, and intake variations among regions were moderate in 2009.

State of Food and Agriculture in Syria 2010
169
Table 6.16. Vitamin B1 intake by Syrian urban and rural populations, 2004, 2007 and 2009 (mg/person/day)
Item 2004 2007 2009 Change % (2004-2009)
STDEV Min Max CV %
Average 2.0 2.0 2.2 10.0 0.3 1.7 2.8 13.2 Urban 1.9 1.9 2.0 5.3 0.2 1.7 2.5 12.3 Rural 2.2 2.2 2.3 4.5 0.3 1.9 3.0 13.6 Source: Elaborated from CBS. Family Budget Survey, 2004, 2007 and 2009.
Figure 6.22. Vitamin B1 intake by Syrian regions, 2004, 2007 and 2009 (mg/person/day)
0.01.02.03.0
Swei
da
Dar
'a
Qun
eitr
a
Dam
ascu
sC
ity
Dam
ascu
sR
ural
Hom
s
Ham
a
Idle
b
Tar
tous
Lat
taki
a
Ale
ppo
Raq
qa
Dai
r-E
zzor
Has
sake
Ave
rage
mg/capita/day2004
2007
2009
Source: Elaborated from CBS. Family Budget Survey, 2003-2009.
Finally, the most important sources of vitamin B1 are beer yeast, crushed wheat, wheat
bread, fats, vegetables, seeds, seed vegetables, lever, kidney, peanuts, maize and paddy
rice. The lack of this vitamin brings about the prevention of the absorption of fats in the
intestine, brie berry disease, nerve inflammation, troubles in the stomach and intestine
functions, loss of appetite, vomit, giddiness, problems in the blood circuit and heart and
loss of concentration.
6.5.11. Vitamin B2 intakes
The average vitamin B2 intake in Syria remained stable from 1999 to 2008 in the amount
of 1.4 mg/capita/day complying with both the daily requirement (0.9-2 mg/capita/day) and
the world average (Table A6.11, Table A6.12 and Table A6.29). Figure 6.23 presents an
intake comparison among countries indicating a lower mean intake of this vitamin in Syria
as compared to those of other countries excluding Jordan. This acquired intake also
underwent dissimilarities among urban and rural populations of Syrian governorates as
explained in Table 6.17 and Figure 6.24 (Table A6.30). Table 6.17 and Figure 6.24 make
clear that there was an intake enhancement over the considered period, both population
strata and all regions had sufficient intakes as compared to the daily reference intake, and
intake variations among regions were small in 2009.
Finally, vitamin B2 can be sourced out mostly from beer yeast, meat extract, kidney and
lever, vegetable leaves, wheat bread, peanuts and rice. Its shortage induces hindrance of

State of Food and Agriculture in Syria 2010
170
growth especially by embryo skeleton, inflammation of lips and mouth corner,
deterioration of skin, discrepancies of eye functions and food transformation, and fatigue.
Figure 6.23. Vitamin B2 intake by countries, 1999-2008 (mg/person/day)
mg/capita /day
00.5
11.5
22.5
33.5
Syria
Egypt
Jorda
n
Kuwait
Leban
on
Moro
cco
Saudi
Arabia
Tunisi
aUSA EU
World
Average 1999-2001
Average 2003-2005
Average 2006-2008
Source: Elaborated by the NAPC from MAAR, AOAD, FAO and USDA statistics.
Table 6.17. Vitamin B2 intake by Syrian urban and rural populations, 2004, 2007 and 2009 (mg/person/day)
Item 2004 2007 2009 Change % (2004-2009)
STDEV Min Max CV %
Average 2.0 2.0 2.1 5.0 0.2 1.8 2.4 9.0 Urban 2.0 1.9 2.0 0.0 0.2 1.8 2.3 8.0 Rural 2.0 2.0 2.2 10.0 0.2 1.8 2.6 10.5 Source: Elaborated from CBS. Family Budget Survey, 2004, 2007 and 2009.
Figure 6.24. Vitamin B2 intake by Syrian regions, 2004, 2007 and 2009 (mg/person/day)
0.00.51.01.52.02.53.0
Sweida
Dar'a
Quneitr
a
Damas
cus C
ity
Damas
cus R
uralHoms
Hama
Idleb
Tartou
s
Lattak
ia
Aleppo
Raqqa
Dair-E
zzor
Hassa
ke
Average
mg/capita/day
2004
2007
2009
Source: Elaborated from CBS. Family Budget Survey, 2004, 2007 and 2009.
6.5.12. Vitamin B6 intakes
The average vitamin B6 intake in Syria enhanced from 1.2 mg/capita/day (average (1999-
2001)) to 1.3 mg/capita/day (average (2006-2008)), thus complying with the daily
requirement (1.1-3 mg/capita/day), Table A6.11 and Table A6.31. However, it fell below
that of the world average and those of selected countries over the considered period (Table
A6.31 and Figure 6.25). It also varies among urban and rural populations of Syrian
provinces as depicted in Table 6.18 and Figure 6.26 (Table A6.32). Table 6.18 and Figure
6.26 show an enhancement in vitamin B6 intake over the considered period, small intake
disparities among population strata in the various provinces in 2009, substantially higher

State of Food and Agriculture in Syria 2010
171
intake as mentioned before at national level, and sufficient intakes in all regions as
compared to the daily reference intake.
Figure 6.25. Vitamin B6 intake by countries, 1999-2008 (mg/person/day)
mg/capita /day
00.5
11.5
22.5
33.5
44.5
5
Syria
Egypt
Jordan
Kuwait
Leban
on
Moroc
co
Saud
i Arabia
Tunisi
aUSA EU
Wor
ld
Average 1999-2001
Average 2003-2005
Average 2006-2008
Source: Elaborated by the NAPC from MAAR, AOAD, FAO and USDA statistics.
Table 6.18. Vitamin B6 intake by Syrian urban and rural populations, 2004, 2007 and 2009 (mg/person/day)
Item 2004 2007 2009 Change % (2004-2009)
STDEV Min Max CV %
Average 2.3 2.3 2.4 4.3 0.3 2.0 3.0 10.8 Urban 2.2 2.3 2.3 4.5 0.2 2.0 2.8 10.7 Rural 2.4 2.4 2.5 4.2 0.3 2.1 3.2 11.1 Source: Elaborated from CBS. Family Budget Survey, 2004, 2007 and 2009.
Figure 6.26. Vitamin B6 intake by Syrian regions, 2004, 2007 and 2009 (mg/person/day)
00.5
11.5
22.5
33.5
Sweida
Dar'a
Quneitr
a
Damas
cus C
ity
Damas
cus R
uralHoms
Hama
Idleb
Tartou
s
Lattak
ia
Aleppo
Raqqa
Dair-E
zzor
Hassa
ke
Average
mg/capita/day
2004
2007
2009
Source: Elaborated from CBS. Family Budget Survey, 2004, 2007 and 2009.
Finally, the major providers of vitamin B6 are yeasts, lever, animal intestine and stomach,
milk, cereals, potatoes, maize, fish, meat and vegetables. Lack of this vitamin leads to
blood anemia, irritation, anxiety, fear, weakness and discrepancies in fat transformation.
6.5.13. Vitamin B12 intakes
The average vitamin B12 intake in Syria augmented from 2.01 microg/capita/day (average
(1999-2001)) to 2.1 microg/capita/day (average (2006-2008)) complying with the daily
reference intake (1.9-2 microg/capita/day), Table A6.11 and Table A6.33. Nevertheless, it
fell below that of the world average and those of selected countries over the same period
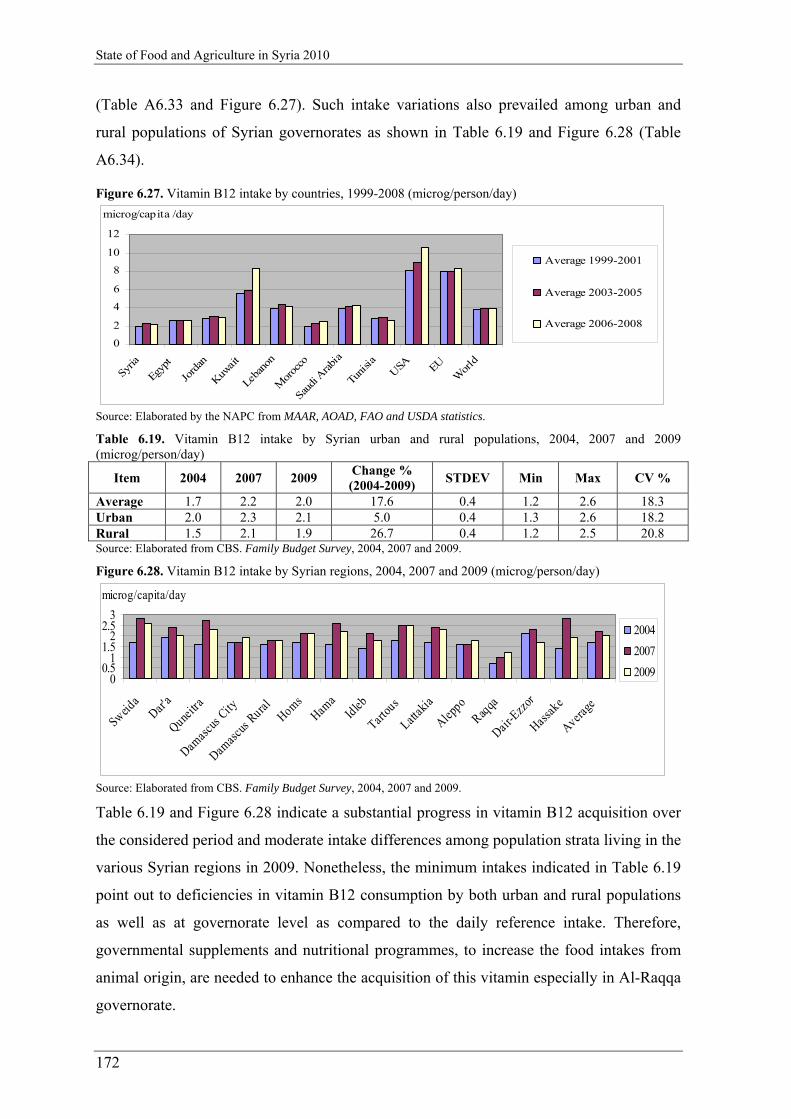
State of Food and Agriculture in Syria 2010
172
(Table A6.33 and Figure 6.27). Such intake variations also prevailed among urban and
rural populations of Syrian governorates as shown in Table 6.19 and Figure 6.28 (Table
A6.34).
Figure 6.27. Vitamin B12 intake by countries, 1999-2008 (microg/person/day)
microg/capita /day
0
2
4
6
8
10
12
Syria
Egypt
Jord
an
Kuw
ait
Leban
on
Mor
occo
Saudi A
rabi
a
Tunisi
aUSA EU
Wor
ld
Average 1999-2001
Average 2003-2005
Average 2006-2008
Source: Elaborated by the NAPC from MAAR, AOAD, FAO and USDA statistics.
Table 6.19. Vitamin B12 intake by Syrian urban and rural populations, 2004, 2007 and 2009 (microg/person/day)
Item 2004 2007 2009 Change % (2004-2009)
STDEV Min Max CV %
Average 1.7 2.2 2.0 17.6 0.4 1.2 2.6 18.3 Urban 2.0 2.3 2.1 5.0 0.4 1.3 2.6 18.2 Rural 1.5 2.1 1.9 26.7 0.4 1.2 2.5 20.8 Source: Elaborated from CBS. Family Budget Survey, 2004, 2007 and 2009.
Figure 6.28. Vitamin B12 intake by Syrian regions, 2004, 2007 and 2009 (microg/person/day)
00.5
11.5
22.5
3
Sweida
Dar'a
Quneitr
a
Damas
cus C
ity
Damas
cus R
uralHoms
Hama
Idleb
Tartou
s
Lattak
ia
Aleppo
Raqqa
Dair-E
zzor
Hassa
ke
Average
microg/capita/day
2004
2007
2009
Source: Elaborated from CBS. Family Budget Survey, 2004, 2007 and 2009.
Table 6.19 and Figure 6.28 indicate a substantial progress in vitamin B12 acquisition over
the considered period and moderate intake differences among population strata living in the
various Syrian regions in 2009. Nonetheless, the minimum intakes indicated in Table 6.19
point out to deficiencies in vitamin B12 consumption by both urban and rural populations
as well as at governorate level as compared to the daily reference intake. Therefore,
governmental supplements and nutritional programmes, to increase the food intakes from
animal origin, are needed to enhance the acquisition of this vitamin especially in Al-Raqqa
governorate.

State of Food and Agriculture in Syria 2010
173
Finally, vitamin B12 is found in all animal tissues, lever and milk. Its deficiency brings
about non-formation of red-blood cells, anemia, impediment of cell and brain functions and
difficulties in the creation of albumin materials.
6.5.14. Iron intakes
The average iron intake in Syria enlarged from 24.9 mg/capita/day (average (1999-2001))
to 27 mg/capita/day (average (2006-2008)), thus exceeding the daily requirement (12-18
mg/capita/day) and the world average (Table A6.11 and Table A6.35). It is also considered
acceptable as compared to those of selected countries (Figure 6.29). The intake differences
among countries also apply to urban and rural populations of Syrian governorates as shown
in Table 6.20 and Figure 6.30(Table A6.36).
Figure 6.29. Iron intake by countries, 1999-2008 (mg/person/day) mg/capita /day
05
10152025303540
Syria
Egyp
t
Jordan
Kuw
ait
Leba
non
Moroc
co
Saud
i Arabia
Tunisia
USA EU
Wor
ld
Average 1999-2001
Average 2003-2005
Average 2006-2008
Source: Elaborated by the NAPC from MAAR, AOAD, FAO and USDA statistics.
Table 6.20. Iron intake by Syrian urban and rural populations, 2004, 2007 and 2009 (mg/person/day)
Item 2004 2007 2009 Change % (2004-2009)
STDEV Min Max CV %
Average 23 24 24 4.3 3 19 29 11.3 Urban 22 23 23 4.5 2 19 27 10.6 Rural 24 25 26 8.3 3 22 32 11.1 Source: Elaborated from CBS. Family Budget Survey, 2004, 2007 and 2009.
Figure 6.30. Iron intake by Syrian regions, 2004, 2007 and 2009 (mg/person/day)
05
101520253035
Sweida
Dar'a
Quneitr
a
Damas
cus C
ity
Damas
cus R
uralHoms
Hama
Idleb
Tartou
s
Lattak
ia
Aleppo
Raqqa
Dair-E
zzor
Hassa
ke
Average
mg/capita/day
2004
2007
2009
Source: Elaborated from CBS. Family Budget Survey, 2004, 2007 and 2009.

State of Food and Agriculture in Syria 2010
174
Table 6.20 and Figure 6.30 illustrate that iron intake increased over the considered period,
small intake divergence among population strata was in place in 2009 and all governorates
were characterized by a higher intake than the daily reference intake.
Finally, iron deficiency causes blood anemia, which is considered as a serious matter in the
public health. It affects growth, behaviours and performance. It reduces the rate of physical
activities, weakens the education capability, leads to growth and behaviour failures and
decreases the resistance against infection.
6.5.15. Iodine intakes
The average iodine intake in Syria increased from 85.8 microg/capita/day (average (1999-
2001)) to 101 microg/capita/day (average (2006-2008)), thus falling below the daily
requirement (134 microg/capita/day), exceeding the world average and becoming less than
those of the most selected states (Figure 6.31), Table A6.37, Table A6.11 and Table A6.12.
Figure 6.31. Iodine intake by countries, 1999-2008 (microg/person/day)
microg/capita /day
0
50
100
150
200
250
Syria
Egypt
Jord
an
Kuwait
Leban
on
Mor
occo
Saudi
Arab
ia
Tunisi
aUSA EU
Wor
ld
Average 1999-2001
Average 2003-2005
Average 2006-2008
Source: Elaborated by the NAPC from MAAR, AOAD, FAO and USDA statistics.
As indicated in Figure 6.31, countries are characterized by different iodine intakes. These
differences also apply to urban and rural inhabitants existing in the various Syrian
governorates as illustrated in Table 6.21 and Figure 6.32 (Table A6.38). Table 6.21 and
Figure 6.32 reveal that these intakes were higher than those estimated before from the
Syrian FBS, both population strata in all regions acquired iodine more than the daily
reference intake and small variations in iodine intakes were in place among regions in
2009.
Finally, iodine deficiency gives rise to stunting, abortion, embryo death, slow brain growth,
reduced productivity and gland disease.

State of Food and Agriculture in Syria 2010
175
Table 3.21. Iodine intake by Syrian urban and rural populations, 2004, 2007 and 2009 (microg/person/day)
Item 2004 2007 2009 Change % (2004-2009)
STDEV Min Max CV %
Average 187 190 194 3.7 18 155 217 9.3 Urban 182 182 182 0.0 15 155 205 8.4 Rural 192 198 205 6.8 17 173 229 8.2 Source: Elaborated from CBS. Family Budget Survey, 2004, 2007 and 2008.
Figure 6.32. Iodine intake by Syrian regions, 2004, 2007 and 2009 (microg/person/day)
050
100150200250300
Sweida
Dar'a
Quneitr
a
Damasc
us City
Damasc
us Rural Homs
Hama
Idleb
Tartou
s
Lattak
ia
Aleppo
Raqqa
Dair-E
zzor
Hassak
e
Average
microg/capita/day
2004
2007
2009
Source: Elaborated from CBS. Family Budget Survey, 2004, 2007 and 2009.
6.5.16. Calcium intakes
The average calcium intake in Syria enlarged from 452 mg/capita/day (average (1999-
2001)) to 542 mg/capita/day (average (2006-2008)) thus falling below the daily
requirement (840-999 mg/capita/day), surpassing the world average and becoming
acceptable as compared to those of selected countries (Table A6.39, Table A6.11, Table
A6.12 and Figure 6.33). Figure 6.33 presents a diversification of the aforesaid calcium
intake by countries indicating the existence of intake differences among these states. Such
intake variations also prevail among urban and rural citizens staying in Syrian regions as
clarified in Table 6.22 and Figure 6.34 (Table A6.40).
Figure 6.33. Calcium intake by countries, 1999-2008 (mg/person/day)
mg/capita /day
0
200
400
600
800
1000
1200
Syria
Egypt
Jord
an
Kuwait
Leban
on
Mor
occo
Saudi
Arab
ia
Tunisi
aUSA EU
Wor
ld
Average 1999-2001
Average 2003-2005
Average 2006-2008
Source: Elaborated by the NAPC from MAAR, AOAD, FAO and USDA statistics.

State of Food and Agriculture in Syria 2010
176
Table 6.22. Calcium intake by Syrian urban and rural populations, 2004, 2007 and 2009 (mg/person/day)
Item 2004 2007 2009 Change % (2004-2009)
STDEV Min Max CV %
Average 903 891 869 -3.8 65 769 984 7.4 Urban 958 937 870 -9.2 81 767 1,027 9.3 Rural 833 846 868 4.2 85 758 1,088 9.8 Source: Elaborated from CBS. Family Budget Survey, 2004, 2007 and 2009.
Figure 6.34. Calcium intake by Syrian regions, 2004, 2007 and 2009 (mg/person/day)
0200400600800
1,0001,2001,400
Sweida
Dar'a
Quneitr
a
Damas
cus C
ity
Damas
cus R
ural
HomsHam
aId
leb
Tartou
s
Lattak
ia
Aleppo
Raqqa
Dair-E
zzor
Hassa
ke
Average
mg/capita/day
2004
2007
2009
Source: Elaborated from CBS. Family Budget Survey, 2004, 2007 and 2009.
Table 6.22 and Figure 6.34 tell that calcium intakes were higher than those assessed before
based on the Syrian FBS, both population strata consumed enough calcium as compared to
the daily reference intake and small intake differences in calcium intake were in place
among Syrian regions in 2009. The minimum intakes of this nutrient, however, point out to
the presence of calcium paucity at province level as compared to the daily requirement.
Hence, it is advisable to include this element in governmental supplementation and
nutrition programmes.
Finally, calcium shortage provokes skeletal abnormalities, insomnia, tooth decay, weak
bones, reduced bone density, poor growth in children, cramps, increased blood pressure,
pale skin, dry scaly skin, brittle nails, fatigue, etc.
6.6. Food safety and quality
The government places high value on food safety to ensure both healthy food and life.
Therefore, several authorities are involved in food quality control such as: the MAAR,
Ministry of Economy and Trade, MOH, Ministry of Industry, other ministries, Consumer
Protection Association, Producers Associations, Popular Organizations and NGOs.
The aforementioned food quality control can’t be ensured without the active cooperation
among all the relevant parties starting with farmers, processing relevant authorities73, up to
the consumers. These relationships are governed through regulations, legislation and
73 Country paper on polices and legislation related to food control in Syria: coordination and development on the local and Arab levels (2007).
State of Food and Agriculture in Syria 2010
177
others. This means that an integrated approach has to be followed alongside the supply
chain to prevent contaminated foods comprising: training and education of personnel, good
hygiene practices, enhanced consumer practice, improved retail and food service practices,
better manufacturing practices, superior agricultural practices, hazard analysis critical
control points (HACCP) implementation and microbiological risk assessment.
Recently, food safety becomes a global issue. This affects Syria in two directions. First, its
exports will be exposed to increasingly demanding food safety standards. Second, attitudes
and standards prevailing in the developed world will spill over to the local market.
In line with the above, the SG emphasizes the application of both national standards and
quality assurance systems to ensure national food safety and strengthens the capability of
the laboratories at the borders to comply with international standards. In addition, it takes
care of the environment to be clean and healthy so that the nutritional status of the
population improves. This was confirmed by the results of the MICS about the compliance
with the MDGs (Table A6.41).
6.7. Undernourishment and malnutrition in the total population
The previous analysis revealed in general that there was a high prevalence of food security
in Syria. In particular, however, it indicated that there were deficiencies in vitamin A,
vitamin B12 and calcium, which require additional government actions, and that there were
problems causing undernourishment and malnutrition. The aforesaid weaknesses arose
from uneven income distribution, lack of access to food due to poverty, shortage in food
intakes of animal origin and inadequate consumption habits.
In-depth, undernourishment refers to the condition of people whose dietary energy
consumption is continuously below a minimum dietary energy requirement for maintaining
a healthy life (food deprivation)74. Thus, the intensity of food deprivation indicates how
much food-deprived people fall short of minimum food needs in terms of dietary energy. It
is measured as the difference between the minimum dietary energy and the average dietary
energy intake of the undernourished population (food-deprived). Hence, it is low when it is
less than 200 kilocalories per person per day and high when it is higher than 300
kilocalories per person per day. The greater the food deficit, the greater the susceptibility
for health risks related to under-nutrition. According to FAO assessment for the 2004-2006
period, food deficit in Syria amounted to 130 kcal/person/day. 74Source: FAOSTAT and SOFI (State of Food Insecurity).

State of Food and Agriculture in Syria 2010
178
Furthermore, several studies and surveys that give more insights in the state of
undernourishment and income distribution in the country were conducted in Syria. The
main focus of those is presented below.
According to the assessment of the UNDP (2005), there is 11.4% out of the population in
Syria (2.02 millions) can’t get their basic needs of food and other products (poor people) in
spite of the considerable progress achieved in food production and its stability as well as in
the improvement of the individual income. This evidence was also more intense over the
2007-2008 period, where the drought spells were severe and substantial increases in food
prices were in place. Hence, the state of poor people exaggerated in the southern, northern
and middle areas, and in the rural and urban populations. This fact was approved by a
recent Rapid Rural Appraisal (RRA) conducted by the MAAR in 17 villages in 2009,
which identified deficiency in micro-nutrients by the surveyed population, as well as by the
exploration of the MOH. Therefore, the MOH tries to improve the nutritional status of the
people in cooperation with the relevant institutions through supplementation of micro-
nutrients, application of nutrition programmes, provision of high care for children and
pregnant women and assurance of healthy food and water.
The Multiple Indicator Cluster Survey (MICS) performed by the CBS and the United
Nations Children’ Fund (UNICEF) in 2006 and published in 2008 showed that the
prevalence of underweight amounted to 9.7%, of stunting 22.4%, of wasting 8.6%, and of
low birth weight infants 9.4%. Relying on the results of this survey, FAO published the
figures presented in Table 6.23 about the child nutritional status.
Table 6.23. Child nutritional status, 2006 (%)
Country Prevalence of under-nutrition in children under five (%)
Children overweight (%)Severe
Underweight Stunting wasting Moderate Severe Moderate Severe Moderate Severe
Syria 10 2 22 10 9 2 18.7 Source: CBS, the MICS, 2008.
A recent study of the MOH in 2007 identified that iron deficiency did exist as indicated in
Table 6.24.
Table 6.24. Iron deficiency, 2007 (%) Item Non-pregnant women Pregnant women Children less than 5 years of age
Damascus 54 58 32 Middle area 49 50 17 Western area 42 39 15 Northern area 41 81 23 Eastern area 43 69 28 Southern area 35 43 14 Average 44 57 22 Source: Elaborated from the Strategy of the MOH.

State of Food and Agriculture in Syria 2010
179
Therefore, the MOH started a project in 2004 to provide iron and folic acid supplements in
cooperation with the UNICEF and World Health Organization (WHO). It aims to:
reduce iron deficiency by a third of its current value;
inform 90% of the households about iron deficiency and its prevention;
engage 3-75% of the flour mills in the supplementation of flour with iron and folic
acid;
provide the supplemented flour for 4-80% of the households.
The MOH also conducted several studies to evaluate the situation of iodine deficiency. The
results of these studies confirm the existence of iodine deficiency in Syria (Table 6.25).
Table 6.25. Evaluation of iodine deficiency by several studies of the MOH (% of the population) Item 1993 study 2000 study 2006 study
Severe iodine deficiency 19 1 0 Moderate iodine deficiency 36 8 13 Low iodine deficiency 36 33 28 Existence of enough iodine 9 57 60 Source: Elaborated from the Strategy of the MOH.
The policy goals that emerged from the above mentioned studies are to:
reduce the moderate iodine deficiency to 4.1%;
provide iodized salt for 80% of the households (79.5% recently);
educate 100% of the households about iodine deficiency and its prevention.
A technical report to assess income distribution and poverty using a detailed Social
Accounting Matrix (SAM) of the Syrian economy was published by the NAPC in 2008. Its
results highlight the existence of structural asymmetries in income distribution. The whole
richer and urban households are favored by multiplier effects, thus improving their relative
position in income distribution in presence of exogenous increases in final demand.
In addition to the aforementioned actions, the Government tries to execute rigorous
poverty mapping in order to initiate programmes targeting poor people so that uneven
distribution of income is reduced, livelihood of poor people improved and poverty
alleviated. In this regard, there are several ongoing activities in the framework of rural
development projects, General Commission for Employment and Project Management and
Directorate for Rural Women. The aforementioned actions also constitute the focus of the
11th FYP and the forthcoming NPFS

State of Food and Agriculture in Syria 2010
180
Part II
Special Issue
National Programme for Food Security

State of Food and Agriculture in Syria 2010
181
Special Issue: National Programme for Food
Security
The following United Nations/FAO World Food Summit (WFS)75 definition of food
security and its associated dimensions is generally accepted in Syria and adopted for the
purpose of preparing the National Programme for Food Security (NPFS): all people, at all
times, have physical, social, and economic access to sufficient, safe and nutritious food to
meet their dietary needs and food preferences for an active and healthy life. The main
elements of food security accepted in this section are: food availability; access to food
(physical and economical); stability of supplies and access; and food utilization (nutrition
and food safety). The Government of Syria (GOS) is attempting to simultaneously
achieving these four pillars at the individual, household, and national levels.
II.1. General overview
This part was prepared to abreast partners in development about the key elements of the
NPFS and to be a base for further discussion concerning their possible contribution to
support the Government in its implementation. Some background information about this
programme is presented below.
The NPFS has the concurrence of the Government and will be implemented and monitored
through the SPC. 58 percent of its needed budget is provided over the 11th FYP (2011-
2015), while the rest will be made available over the 12th FYP (2016-2020).
The NPFS is considered as a comprehensive and coherent national programme, which was
prepared by a national team, and funded by the FAO. Its formulation process was
coordinated by the NAPC of the MAAR, Syria and followed a participatory approach,
which was adopted at all stages. In this regard, the experience of international
organizations, mainly FAO, in ensuring effective contribution from all stakeholders was
instrumental. Exploiting the intense experiences of earlier national and international
75 Rome 1996.

State of Food and Agriculture in Syria 2010
182
projects was also taken into consideration. These projects have contributed to achieving
food security, have adopted the participatory approach and have been implemented by the
support of our Partners in Development. Therefore, lessons learned from the design and
implementation of these projects was useful in formulating the current NPFS, which
introduces a new orientation by focusing on sustainable management of natural resources
combined with using modern production techniques that increase the income through
enhancing efficiencies by increasing production, reducing cost or both. This formulation
was based on a systematic process to identify the neediest geographical areas, targeted poor
and vulnerable groups. To do so, an assessment was made for the available survey data and
information from the CBS and the SPC on poverty and vulnerable groups. Hence, after
identifying the governorates and the areas within governorates that need special attention,
brain storming sessions were planned and held in each governorate. They were attended by
stakeholders in each governorate including farmers, herders, traders, government officials
and representatives from the civil society comprising private investors and NGOs. Lively
discussions and exchange of information took place during these meetings to assess
demographic, social, economic and environmental characteristics of the selected villages
and identify the other villages in the governorate or other governorates that have similar
properties. As a result, multidisciplinary teams were formed to visit the selected villages
where an in-depth assessment of the constraints and needs was carried out. After that, the
overall objectives and dimensions of the envisaged coherent programme and prioritization
criterion were identified and applied to consider projects for achieving the goals of the
NPFS. Targeting the project to the neediest area and having the possibility of replication in
several sites and governorates were among the prioritization criterion.
II.2. Background and justification
The agricultural and rural sector has a vital role in the national economy of Syria because it
contributes to about 20-25 percent of the GDP, is considered as the main source of
employment and income for 47 percent of the population, generates about 16-20% of non-oil
exports and is a major source of raw materials needed for agro-industries. Recently, however,
its contribution to the aforementioned measures has been declining due to the occurrence
of frequent droughts. Therefore, water resources management constitutes a serious
challenge to sustainable agricultural development and food security in Syria.

State of Food and Agriculture in Syria 2010
183
In general, Syria is considered as a dry and semi-arid country, where the precipitation rate
is less than 350 mm in more than 90% of the overall area. The rainfall increases in coastal
and mountainous areas owing to the existence of a range of mountains parallel to the coast
and declines towards the east. Hence, Syria is characterized by limited water capacity of
about 15.5 billion m3. This capacity is experiencing an increasing shortage in most water
basins because of the growing demand and the frequent droughts affecting most of the
country. In recent years, the average water deficit has amounted to about 3.5 billion m3.
Consequently, this situation led to reducing groundwater tables, declining the capacity of
some rivers, drying springs, and hence negatively affecting the agricultural production.
Therefore, Government policies are oriented towards enhancing the efficiency of water
utilization. While several policies have been adopted to improve the demand management
of water resources, investment has been also accelerating and more than 166 dams have
been built until 2008 with a total storage capacity of about 19 billion m3. Currently, more
than 10 additional dams and many other governmental irrigation projects are under
construction.
In addition, Syria suffers from limited land resources and relatively high population growth
characterized by young population structure that is increasingly demanding for new jobs.
Arable land in Syria represents 32% of the total area, non-arable land 20%, steppes and
pastures 45%, and forests 3%. The total actual cultivated land is about 4.7 million hectares,
of which 70% is grown rain-fed and 30% is under irrigated schemes. On the population
side, people grow at an annual average growth rate of 2.45%. Therefore, total population
reached 22 million in 2009, of whom 51% are males, 62% are under the age of 24 and 47%
are rural.
In spite of the aforesaid constraints, Syria has attained self-sufficiency by most
commodities such as wheat, legumes, vegetables and fruits. This has impacted positively
the nutritional status of the Syrian population. The daily calorie intake per capita increased
from 3,056 kcal (average (1999-2001)) to 3,116 kcal (average (2006-2008)) and the daily
protein intake per capita enlarged from 74 grams to 82 grams, respectively. These
estimates were assessed relying on the FBS prepared by the MAAR. They are even
higher76, thus exceeding considerably the daily reference intake per capita, when
consumption data are considered. Nonetheless, these intakes were mostly sourced out of
vegetal sources as compared to those of other countries. This explains the deficiency in
76 See chapter 6.

State of Food and Agriculture in Syria 2010
184
some micro nutrients that are frequently available in food of animal origin. Therefore, there
is an urgent need to promote projects that focus on livestock production.
Despite the progress achieved in food supply and its stability and the improvement of
individual income, there is still a part of the population subject to food insecurity. This
segment of the inhabitants differs widely between the southern, northern, central and
coastal areas and between rural and urban regions. The northeastern region (Idleb, Aleppo,
Al-Raqqa, Dair-Ezzor and AL-Hassake governorates) is considered as the poorest area in
Syria. Using the lower poverty line (less than US$1/day), the poverty incidence is highest
in the northeastern rural region (17.9 percent), followed by the northeastern urban region
(11.2 percent). This phenomenon is less widespread in the southern urban region
(Damascus, Rural Damascus, Dar’a, Al-Sweida and Al-Quneitra governorates), where it
amounts to 5.8 percent. Therefore, the GOS has embarked since 1987 on gradual market-
oriented agricultural reforms. These alterations have been accelerated by 2000 as clearly
outlined in the 10th FYP (2006-2010). The government’s commitment to these structural
adjustments is further re-iterated in the coming 11th FYP (2011-2015) to align economic
reforms with the state of food security.
The 10th FYP includes the major objectives and future orientation of the agriculture sector.
Also, a draft of a strategic framework for sustainable agricultural development in Syria has
been developed (MAAR, 2000). In addition, the draft of the 11th FYP contains directives
about agricultural development until 2015. In all these efforts, the GOS has focused on
achieving food security at the household, regional and national levels, while improving the
livelihood of the Syria citizens through a sustainable utilization of the scarce natural
resources. Meanwhile, Syria is committed to fulfill the WFS decisions to half the number
of starving and undernourished people in the world by 2015 and the MDGs adopted in
2000 to make the world more peaceful, prosperous, and equitable to free people from
extreme poverty and hunger. As a consequence, agricultural and food policies in Syria
continue to pay the utmost attention to food security placing it at the top of national
priorities.
Finally, the GOS has collaborated with partners in development to initiate and implement
effective investment and development programmes and projects to achieve the goals of
food security. Most of these policies, reform measures, programmes and projects, however,
were planned and implemented separately and provided piece-meal solutions to the
integrated and multifaceted challenge of sustainable food security. Therefore, there seems

State of Food and Agriculture in Syria 2010
185
to be yet a great need for a coherent, time and cost bounded programme for food security in
Syria.
II.3. The need for a coherent, cost and time bounded NPFS
The GOS has decided to formulate a comprehensive NPFS to address all elements and
dimensions of food security and to contribute to sustainable agricultural and rural
development and poverty alleviation. As a result, it has identified major areas with respect
to food security interventions that can be considered as gaps requiring specific attention in
the NPFS. They include so far:
a. Development of a coherent strategic framework for sustainable agricultural and
rural development taking into consideration natural resources and water aspects
that could constitute the policy environment needed for the implementation of the
NPFS.
b. Wider adoption of modern irrigation system to contribute to sustainable
development in agriculture.
c. Enhancement of food safety including standards and prevention of trans-boundary
diseases.
d. Introduction of market oriented risk management measures to contribute to food
stability.
e. Empowerment of women role in agricultural and rural development.
f. Adoption of technological packages appropriate to smallholder to improve
productivity and diversify on and off-farm income.
g. Statistics on poverty and food insecurity.
h. Promotion of appropriate policies and research initiatives to tackle the long term
effects of climate change that seems to affect food availability and stability.
i. Improvement of technical and institutional capacities that have become even more
pressing under the current decentralized and social market economy framework.
The envisaged NPFS need to capture all the above elements and build on the existing
efforts by national institutions to provide a comprehensive package for tackling the multi-
dimensions of food security in Syria. As a result, its added value as compared to the
previous National Plans and Strategic Frameworks will be that it gives priority to food
security issues and dimensions within a coordinated and actionable investment framework
that is characterized by a set of prioritized actions, implementation modalities and

State of Food and Agriculture in Syria 2010
186
indicative investment costs, which will be funded by the Government, private sector and
donors/International Financial Institutions. This framework will combine efforts of
different parties under one umbrella linked to one body whose ultimate objective is
achieving food security. This authority will monitor the programme implementation, make
adjustment when necessary and tackle obstacles that face the programme by
communicating with the leadership of the country. In this sense, the NPFS in Syria will be
a comprehensive programme targeting the entire food insecure population. It proposes
actions oriented towards developing a broader based approach to food security and
targeting directly poor people, small farmers, the most vulnerable groups and the food
insecure. It puts in place activities to enhance productivity, diversify livelihoods and build
the capacities of food insecure people to achieve sustainable food security, while
simultaneously assisting those in immediate need through safety net programmes.
II.4. NPFS linked to other national and international food security related initiatives
Close considerations were given to related initiatives in Syria while formulating the NPFS.
All attempts were made to link the NPFS to the on-going initiatives to ensure
complementarity as presented below.
The NPFS has been linked to the global MDGs and the WFS goals. Therefore,
reducing poverty and food insecurity constitute the overall envisaged impact of the
programme and decreasing the number of poor and insecure population is the
principle performance indicator for monitoring the implementation of the
programme.
The on-going efforts with the World Bank, FAO and other partners in development
concerning the assessment of the impact of the climate change at the national and
regional levels were closely considered in formulating the projects aiming at
improving the sustainable management of the scarce natural resources as well as in
proposing the safety nets and support projects to enhance the livelihood of the poor
and the vulnerable groups including those affected by the climate change.
The NPFS benefited from the existing attempts of the one UN system and the
UNDAF. Hence, several projects were proposed to scale-up the successful
experiences gained form projects implemented earlier at a pilot phase by UN
partners and other agencies.

State of Food and Agriculture in Syria 2010
187
The NPFS took into consideration the on-going experiences related to supporting
the vulnerable groups with special reference to children and women. As a
consequence, several projects were identified to improve the livelihood and the
nutritional status of these vulnerable groups and women empowerment.
The strategic orientation of the GOS in adopting the principles of the social market
economy and gradual reform was among the guiding principles governing the
formulation of the NPFS.
The priority given by the GOS for improving the management of natural resources
with special consideration to water, land, forests and environment was closely
considered.
The attention given by the political leadership of the country to agricultural
development and supporting the small farmers and poor segment of the society
necessitated linking the NPFS to improving the ongoing social and economic array
of social safety nets provided to poor and vulnerable groups in rural and urban
areas.
The NPFS is consistent with the guidance provided by the directives of the 10th
FYP and 11th FYP.
II.5. Objectives and framework of the NPFS
The NPFS in Syria is contributing to the overall impact of “achieving sustainable agricultural and
rural development and reducing poverty”. Thus, its overall expected outcome is “to achieve and
enhance food security in Syria”. This outcome will be achieved through realizing the following
specific objectives:
1. improve the sustainable management of natural resources;
2. enhance agricultural production and productivity;
3. promote agricultural policies, institutional capacities and supporting services;
4. induce food stability and risk management capabilities; and
5. ameliorate food access, quality and safety.
Accordingly, the coherent NPFS includes 5 major outputs/components/pillars to achieve
the objectives stated above (Figure A7.1). These outputs has to be achieved through 54
specific, well defined and complementary priority projects (Table A7.1) that were selected
based on specific criterion. These enterprises can be presented as follows:
1. sustainable management of natural resources and environment;

State of Food and Agriculture in Syria 2010
188
1.1. water management (8 projects – Table A7.2 );
1.2. environment (2 projects – Table A7.3);
1.3. forestry development (3 projects – Table A7.4);
2. agricultural production and productivity;
2.1. crop production (7 projects – Table A7.5);
2.2. livestock production (13 projects – Table A7.6);
3. policies, institutions and supporting services (4 projects – Table A7.7);
4. food stability and risk management;
4.1. drought management (3 projects – Table A7.8);
4.2. household food security and livelihood (5 projects – Table A7.9);
5. food access, quality and safety (9 projects – Table A7.10).
II.6. Prioritization criterions, beneficiaries and cost
The projects constituting the programme elements were selected among a wider set of
projects and actions. The chosen projects to achieve the objectives of the NPFS represent
priority investment and technical proposals. The following criterions were used for
selecting these priority projects:
1. multiple effect on the identified objectives and expected outputs;
2. clarity of institutional responsibility;
3. human absorption capacities;
4. sequencing pre-requisites for other projects (satisfying pre-conditions for other
projects);
5. continuation of on-going programmes/projects;
6. availability of funds.
The selected projects according to the above-mentioned principles target the food insecure
population in Syria with special emphasis on the poor people, small farmers and other most
vulnerable groups. These beneficiaries account for about 2.24 million households.
Finally, the approximate cost of the NPFS is about US$4.07 billion (Table A7.1). This
coherent programme will cover most of the geographical areas of Syria and takes into
account the sustainable management of natural and economic resources. Its management
unit and the involved organizations will set a definite applicable timetable for the

State of Food and Agriculture in Syria 2010
189
programme implementation. This of course requires a budget for Monitoring and
Evaluation (ME). The allocated budget for this purpose accounts for about 2% of the total
cost thus totaling approximately US$80 million. For this task, a unit within the SPC was
established to manage the implementation of the NPFS. This unit may provide in kind
contribution to cover the bulk of the needed funds for the ME.

State of Food and Agriculture in Syria 2010
190
Annexes

State of Food and Agriculture in Syria 2010
191
Annex One
Country Development Opportunities for
Agriculture and Agro-industries

State of Food and Agriculture in Syria 2010
192
Annex 1. Country development opportunities for agriculture and agro-industries
Figure A1.1. Syria map
Source: Elaborated from NAPC, SOFAS 2007.
Box A1.1. Agricultural stabilization zones
First Climatic Zone: Its precipitation rate exceeds 350 mm annually. It constitutes 14.6% of the total area of the country and is divided into two Zones:
Zone A: Its precipitation rate exceeds 600 mm annually. Therefore, rain-fed crops are planted safely. Zone B: Its precipitation rate varies between 350 and 600 mm annually. The observed precipitation rate
is not less than 300 mm annually for 2/3 of the observed years. As a result, two seasons are assured each three years. The major cultivated crops in this zone are wheat, legumes and summer crops.
Second Climatic Zone: Its precipitation rate varies between 250 and 350 mm annually and is not less than 250 mm for 2/3 of the observed years. It forms 13.3% of the total area of the country. As a consequence, two barley seasons can be safely planted each 3 years. The major cultivated crops in this zone are barley, wheat, legumes and summer crops.
Third Climatic Zone: Its precipitation rate doesn’t exceed 250 mm annually and is not less than 250 mm for a half of the observed years. It amounts to 7.1% of the total area of the country. Consequently, 1-2 barley seasons are secured each 3 years. The major cultivated crop in this area is barley. Wheat and legumes can be also cultivated.
Fourth Climatic Zone (marginal land): Its precipitation rate varies between 200 and 250 mm annually and is not less than 200 mm for a half of the observed years. It accounts for 9.9% of the total area of the country. Hence, it is allocated for barley and pastures.
Fifth Climatic Zone (steppe): It encompasses the rest of the land of the country. Rain-fed crops can‘t be cultivated in this area. Source: Elaborated from NAPC, SOFAS 2007.

State of Food and Agriculture in Syria 2010
193
Table A1.1. recipitation rate by stabilization zones, 1999-2008 (mm) Item 1999 2000 2001 2002 2003 2004 2005 2006 2007 2008
Average 371 407 475 545 755 575 490 483 444 349 First stabilization zone 586 633 662 819 1111 850 722 713 634 543 Second stabilization zone 175 193 316 296 432 318 283 272 274 161 Third stabilization zone 111 214 177 270 474 266 198 223 220 195 Fourth stabilization zone 103 122 229 192 304 222 194 183 198 95 Fifth stabilization zone 69 83 196 134 179 174 139 146 146 58 Source: Elaborated from NAPC database.
Table A1.2. Precipitation rate by regions, 1999-2008 (mm) Item 1999 2000 2001 2002 2003 2004 2005 2006 2007 2008
Al-Sweida 134 226 292 337 571 274 344 283 324 183 Dar'a 130 235 204 315 533 298 258 245 242 202 Al-Quneitra 438 638 544 832 1,387 746 722 593 645 487 Damascus 131 177 214 269 517 315 267 220 266 166 Southern area 208 319 314 438 752 408 398 335 369 259 Homs 417 506 587 608 1,109 699 642 665 595 525 Hama 493 569 624 738 1,229 875 751 658 575 497 Al-Ghab 789 783 992 1,111 1,410 1,288 1,086 1,061 975 791 Middle area 566 619 734 819 1,249 954 826 795 715 604 Lattakia 940 935 752 1,222 1,104 979 811 803 721 708 Tartous 978 1,067 841 1,255 1,646 1,165 980 1,185 925 849 Coastal area 959 1,001 796 1,239 1,375 1,072 896 994 823 779 Idleb 463 416 584 569 683 680 485 467 429 407 Aleppo 262 247 397 378 429 386 325 332 309 241 Al-Hassake 175 193 380 289 380 345 320 327 330 88 Dair-Ezzor 59 73 239 123 142 161 154 166 128 44 Al-Raqqa 124 114 254 206 211 234 176 174 156 78 Northern area 155 157 318 249 290 282 243 250 231 113 Source: Elaborated from NAPC database. Al-Sweida = Sweida; Al-Quneitra = Quneitra; Al-Hassake = Hassake; Al-Raqqa = Raqqa.

State of Food and Agriculture in Syria 2010
194
Table A1.3. Land use, 1999-2009 (000 ha)
Item 1999 2000 2001 2002 2003 2004 2005 2006 2007 2008 2009 Average
99-01 Average
07-09 ACH %
99-09 AAGR %
99-09 Cultivable land 5,998 5,906 5,988 5,911 5,863 5,909 5,934 5,949 6,039 6,023 6,013 5,964 6,025 1 0.2 Invested land 5,503 5,353 5,450 5,421 5,478 5,525 5,563 5,587 5,682 5,666 5,665 5,435 5,671 4.3 0.7 Irrigated land 1,186 1,211 1,267 1,333 1,361 1,439 1,426 1,402 1,396 1,356 1,238 1,221 1,330 8.9 1.4 Rain-fed land 3,355 3,336 3,282 3,258 3,300 3,290 3,447 3,340 3,323 3,254 3,101 3,324 3,226 -3 -0.5 Fallow land 962 806 901 830 817 796 690 845 963 1,056 1,326 890 1,115 25.3 3.8 Cultivated land 4,541 4,547 4,549 4,591 4,661 4,729 4,873 4,742 4,719 4,610 4,339 4,546 4,556 0.2 0 Un-invested land 495 553 538 490 385 384 371 362 357 357 348 529 354 -33 -6.5 Uncultivable land 3,709 3,696 3,691 3,694 3,730 3,737 3,720 3,678 3,689 3,684 3,680 3,699 3,684 -0.4 -0.1 Steppes and pastures 8,265 8,359 8,273 8,338 8,335 8,279 8,266 8,290 8,214 8,232 8,244 8,299 8,230 -0.8 -0.1 Forests 546 557 566 575 590 593 598 601 576 579 581 556 579 4 0.7 Total 18,518 18,518 18,518 18,518 18,518 18,518 18,518 18,518 18,518 18,518 18,518 18,518 18,518 Source: Elaborated from MAAR, the AASA, various issues. AAGR: Average annual growth rate. Table A1.4. Land use indicators, 2000-2009
Item Unit 2000 2001 2002 2003 2004 2005 2006 2007 2008 2009 AAGR
% 99-09
Crop production SP million 215,383 233,476 244,145 226,714 233,014 248,835 272,163 227,271 218,686 247,803 0.02 Cultivated land 000 ha 4,547 4,549 4,591 4,661 4,729 4,873 4,742 4,719 4,610 4,339 -0.03 Cultivable land 000 ha 5,906 5,988 5,911 5,863 5,909 5,934 5,949 6,039 6,023 6,013 0.3 Population 000 person 16,320 16,720 17,130 17,550 18,138 18,356 18,941 19,405 19,644 20,619 3.53 Rural population 000 person 8,177 8,344 8,531 8,744 8,433 8,536 8,808 8,915 9,133 9,586 1.98 Land productivity 000 SP/ha 47.4 51.3 53.2 48.6 49.3 51.1 57.4 48.2 47.4 57.1 0.11 Cultivable land per capita (total) ha/person 0.362 0.358 0.345 0.334 0.326 0.323 0.314 0.311 0.307 0.292 -3.11 Cultivable land per capita (rural) ha/person 0.722 0.718 0.693 0.671 0.701 0.695 0.675 0.677 0.659 0.627 -1.63 Source: Elaborated from MAAR, the AASA, various issues and the CBS, the ASA, various issues. Land productivity = production at constant prices/cultivated land.

State of Food and Agriculture in Syria 2010
195
Table A1.5. Land use by governorates, 2009 (000 ha)
Item Sweida Dar'a Quneitra Rural
Damascus Homs Hama
Al-Ghab
Idleb Tartous Lattakia Aleppo Raqqa Dair-Ezzor
Hassake Total
Cultivable 195 232 158 212 349 395 87 359 121 109 1,227 799 213 1,558 6,012 Invested 158 231 31 136 349 368 87 357 121 103 1,175 792 205 1,553 5,664 Irrigated 2 33 4 56 52 67 78 58 28 36 207 170 134 313 1,238 Rain-fed 84 106 18 47 258 243 8 295 92 61 904 179 28 778 3,101 Fallow 72 92 9 33 39 57 2 4 0 5 64 443 43 462 1,325 Cultivated 86 139 22 103 310 310 85 353 121 97 1,111 349 162 1,091 4,339 Un-invested 37 1 127 76 0 28 0 1 0 6 52 7 8 5 348 Uncultivable 142 102 13 229 1,001 129 14 128 35 34 343 165 1,202 145 3,681 Steppes pastures
210 29 12 1,315 2,685 314 3 43 3 1 226 982 1,883 538 8,244
Forests 8 10 3 58 57 39 37 80 31 85 54 16 9 93 581 Total 555 373 186 1,814 4,092 877 141 610 190 230 1,850 1,962 3,306 2,333 18,518 Source: Elaborated from MAAR, the AASA, 2009. Table A1.6. Structure of the Land use by governorates, 2009 (%)
Item Sweida Dar'a Quneitra Rural
Damascus Homs Hama
Al-Ghab
Idleb Tartous Lattakia Aleppo Raqqa Dair-Ezzor
Hassake Total
Cultivable 35.2 62.2 84.9 11.7 8.5 45.0 61.9 58.9 63.6 47.3 66.3 40.7 6.4 66.8 32.5 Invested 28.5 61.8 16.6 7.5 8.5 41.9 61.9 58.6 63.6 44.7 63.5 40.4 6.2 66.6 30.6 Irrigated 0.4 8.9 2.1 3.1 1.3 7.7 55.1 9.6 14.9 15.6 11.2 8.7 4.0 13.4 6.7 Rain-fed 15.1 28.4 9.8 2.6 6.3 27.7 5.6 48.3 48.7 26.8 48.9 9.1 0.8 33.3 16.7 Fallow 13.0 24.6 4.7 1.8 1.0 6.6 1.2 0.7 0.0 2.3 3.4 22.6 1.3 19.8 7.2 Cultivated 15.5 37.3 11.9 5.7 7.6 35.3 60.7 57.9 63.6 42.3 60.1 17.8 4.9 46.8 23.4 Un-invested 6.7 0.4 68.2 4.2 0.0 3.1 0.0 0.2 0.0 2.6 2.8 0.4 0.2 0.2 1.9 Uncultivable 25.5 27.3 6.8 12.6 24.5 14.7 9.9 20.9 18.4 15.0 18.6 8.4 36.4 6.2 19.9 Steppes and pastures
37.9 7.8 6.6 72.5 65.6 35.8 1.9 7.1 1.5 0.6 12.2 50.0 57.0 23.1 44.5
Forests 1.4 2.7 1.8 3.2 1.4 4.4 26.4 13.1 16.5 37.1 2.9 0.8 0.3 4.0 3.1 Total 100.0 100.0 100.0 100.0 100.0 100.0 100.0 100.0 100.0 100.0 100.0 100.0 100.0 100.0 100.0 Source: Elaborated from MAAR, the AASA, 2009.

State of Food and Agriculture in Syria 2010
196
Table A1.7. Development of the irrigated land by irrigation sources and methods, 2001-2009 (ha)
Item Total irrigated area Distribution by irrigation sources Distribution by irrigation methods
From rivers Governmental irrigation projects From wells Sprinkle Drip Total 2001 1,266,889 169,762 342,845 754,282 66,155 44,154 110,309 2002 1,332,781 201,387 314,123 817,271 138,500 76,421 214,921 2003 1,361,211 217,192 289,364 854,655 133,338 52,149 185,487 2004 1,439,134 234,161 340,230 864,743 130,170 57,487 187,657 2005 1,425,811 234,331 326,113 865,367 159,940 84,433 244,373 2006 1,402,152 215,446 335,560 851,146 163,264 72,679 235,943 2007 1,396,340 224,856 358,563 812,921 164,109 79,721 243,830 2008 1,356,485 208,308 387,098 761,079 162,232 92,351 254,583 2009 1,238,348 216,564 365,588 656,196 178,919 103,025 281,944
Average 1(2001-2003) 1,320,294 196,114 315,444 808,736 112,664 57,575 170,239 Average 2 (2007-2009) 1,330,391 216,576 370,416 743,399 168,420 91,699 260,119 Average change % (2/1) 0.8 10.4 17.4 -8.1 49.5 59.3 52.8 AAGR % (2/1) 0.2 2.5 4.1 -2.1 10.6 12.3 11.2
Distribution by governorates in 2009 (ha) Al-Sweida 2,299 0 43 2,256 127 2,127 2,254 Dar'a 33,088 150 19,770 13,168 5,036 16,738 21,774 Al-Quneitra 3,867 0 1,745 2,122 90 2,250 2,340
Rural Damascus 56,318 14,055 0 42,263 2,923 17,188 20,111 Homs 51,630 2,976 25,726 22,928 6,476 12,600 19,076 Hama 67,407 5,061 6,943 55,403 32,863 3,442 36,305 Al-Ghab 77,538 0 44,791 32,747 14,966 1,005 15,971 Idleb 58,443 3,013 11,025 44,405 28,917 9,780 38,697 Tartous 28,165 2,447 15,201 10,517 501 8,171 8,672 Lattakia 35,752 2,596 26,182 6,974 1,029 10,542 11,571 Aleppo 207,092 28,116 83,541 95,435 30,575 14,370 44,945 Al-Raqqa 169,678 28,146 93,749 47,783 4,693 774 5,467 Dair-Ezzor 133,836 83,701 36,872 13,263 33 80 113 Al-Hassake 313,235 46,303 0 266,932 50,690 3,958 54,648
Total 1,238,348 216,564 365,588 656,196 178,919 103,025 281,944 Source: Elaborated from MAAR, the AASA, various issues.

State of Food and Agriculture in Syria 2010
197
Table A1.8. Development of the fish production, 1999-2009 (tonne)
Item Grand total
Marine fish Farm fish Fish of dams, lakes and rivers Public Cooperative Private Total Public Cooperative Private Joint Total Public Cooperative Private Total
1999 14,171 90 318 2,192 2,600 1,230 65 4,938 0 6,233 0 3,690 1,648 5,338 2000 13,369 90 176 2,315 2,581 1,375 0 5,399 23 6,797 1 2,833 1,157 3,991 2001 14,171 77 269 1,976 2,322 1,410 0 4,442 28 5,880 0 4,269 1,700 5,969 2002 15,166 70 315 2,438 2,823 1,721 0 4,155 112 5,988 0 3,770 2,585 6,355 2003 16,128 48 172 2,840 3,060 1,601 0 5,493 123 7,217 0 2,627 3,224 5,851 2004 17,210 25 147 2,905 3,077 1,871 0 6,688 123 8,682 0 2,255 3,196 5,451 2005 16,980 0 239 3,438 3,677 1,550 0 6,870 113 8,533 0 2,633 2,137 4,770 2006 17,167 0 225 3,170 3,395 1,790 0 6,988 124 8,902 0 1,539 3,331 4,870 2007 17,880 0 396 2,984 3,380 1,297 0 7,028 100 8,425 0 1,853 4,222 6,075 2008 15,590 0 447 2,765 3,212 1,307 0 7,197 90 8,594 0 1,415 2,369 3,784 2009 14,408 0 379 2,728 3,107 1,027 0 5,966 73 7,066 7 1,278 2,950 4,235
Average 1 (99-01) 13,904 86 254 2,161 2,501 1,338 22 4,926 17 6,303 0 3,597 1,502 5,099 Average 2 (07-09) 15,959 0 407 2,826 3,233 1,210 0 6,730 88 8,028 2 1,515 3,180 4,698 Average change % (2/1) 14.8 60 30.8 29.3 -9.6 36.6 415.7 27.4 -57.9 111.8 -7.9 AAGR % (2/1) 2.3 8.2 4.6 4.4 -1.7 5.3 31.4 4.1 -13.4 13.3 -1.4
Distribution by governorates in 2009 (tonne) Al-Sweida 0 0 0 0 0 0 0 0 0 0 0 0 0 0 Dar'a 113 0 0 0 0 0 0 64 0 64 0 0 49 49 Al-Quneitra 31 0 0 0 0 31 0 0 0 31 0 0 0 0
Rural Damascus 0 0 0 0 0 0 0 0 0 0 0 0 0 0 Homs 745 0 0 0 0 0 0 130 73 203 0 0 542 542 Hama 833 0 0 0 0 0 0 583 0 583 0 0 250 250 Al-Ghab 4,050 0 0 0 0 350 0 3,700 0 4,050 0 0 0 0 Idleb 635 0 0 0 0 10 0 375 0 385 0 0 250 250 Tartous 669 0 308 245 553 25 0 82 0 107 7 0 2 9 Lattakia 2,892 0 71 2,483 2,554 289 0 15 0 304 0 24 10 34 Aleppo 1,775 0 0 0 0 0 0 500 0 500 0 1,000 275 1275 Al-Raqqa 2,056 0 0 0 0 322 0 447 0 769 0 0 1,287 1287 Dair-Ezzor 256 0 0 0 0 0 0 44 0 44 0 0 212 212 Al-Hassake 353 0 0 0 0 0 0 26 0 26 0 254 73 327
Total 14,408 0 379 2,728 3,107 1,027 0 5,966 73 7,066 7 1,278 2,950 4,235 Source: Elaborated from MAAR, the AASA, various issues.

State of Food and Agriculture in Syria 2010
198
Table A1.9. Development of human resources, 2000-2009 (000 persons)
Item 2000 2001 2002 2003 2004 2005 2006 2007 2008 2009 Average
2000-2002 Average
2007-2009 AAGR % 2000-2009
Population 16,320 16,720 17,130 17,550 18,138 18,356 18,941 19,405 19,644 20,619 16,723 19,889 3.5 Rural population 8,177 8,344 8,531 8,744 8,433 8,536 8,808 8,915 9,133 9,586 8,351 9,211 2.0 Urban population 8,143 8,376 8,599 8,806 9,705 9,820 10,133 10,490 10,511 11,033 8,373 10,678 5.0 Total labour force 4,937 5,275 5,459 4,821 4,302 4,680 4,860 4,946 4,848 4,999 5,224 4,931 -1.1 Agricultural labour force 1,430 1,473 1,462 1,462 734 940 952 947 814 758 1,455 840 -10.4 Source: Elaborated from MAAR, the AASA, various issues and the CBS, the ASA, various issues.
Table A1.10. Development of the fertilizer use, 1999-2009 (tonne) Item Nitrogen (N) Phosphate (P) Potash (K) Total 1999 218,436 105,068 7,360 330,864 2000 250,565 113,829 8,253 372,647 2001 160,047 93,236 7,371 260,654 2002 194,502 102,875 7,772 305,149 2003 241,249 101,520 8,031 350,800 2004 226,386 112,530 9,207 348,123 2005 266,418 121,897 8,807 397,122 2006 275,613 109,639 9,555 394,807 2007 263,117 109,023 9,797 381,937 2008 270,207 131,201 12,057 413,465 2009 210,362 86,428 8,730 305,520
Distribution by governorates in 2009 (tonne) Southern area 8,314 4,660 1,243 14,217 Homs 11,966 4,976 1,294 18,236 Hama and Al-Ghab 22,917 10,203 1,469 34,589 Idleb 16,301 6,563 908 23,772 Tartous 7,880 2,548 1,471 11,899 Lattakia 10,753 2,317 1,310 14,380 Aleppo 39,581 18,982 801 59,364 Al-Raqqa 23,778 8,542 140 32,460 Dair-Ezzor 14,619 5,590 94 20,303 Al-Hassake 54,253 22,047 0 76,300 Source: Elaborated from MAAR, the AASA, various issues.

State of Food and Agriculture in Syria 2010
199
Table A1.11. Development of agricultural machines, 1999-2008 (machine)
Item Tractors Combined threshers harvesters
Fixed threshers
Ploughs Seeders Pumps Sprayers Dusters Total
1999 95,649 5,038 5,303 106,007 16,272 161,521 95,085 10,154 495,029 2000 97,660 4,734 5,278 108,459 15,652 159,447 95,338 9,814 496,382 2001 101,389 4,500 4,850 84,824 15,305 145,246 96,627 9,641 462,382 2002 103,636 4,786 4,842 95,555 15,260 170,729 97,451 9,256 501,515 2003 103,626 5,249 4,829 110,900 17,209 188,696 98,719 9,500 538,728 2004 104,583 5,335 4,816 111,943 17,828 184,998 99,220 8,669 537,392 2005 106,131 5,651 4,831 113,624 18,669 205,481 101,707 8,911 565,005 2006 107,946 5,724 4,717 113,779 19,933 217,731 104,562 8,962 583,354 2007 108,425 5,845 4,752 115,328 20,752 218,436 108,069 10,523 592,130 2008 109,890 5,669 5,135 114,336 19,687 215,309 110,227 7,686 587,939
Average 1 (1999-2001) 98,233 4,757 5,144 99,763 15,743 155,405 95,683 9,870 484,598 Average 2 (2006-2008) 108,754 5,746 4,868 114,481 20,124 217,159 107,619 9,057 587,808 Average change % (2/1) 10.7 20.8 -5.4 14.8 27.8 39.7 12.5 -8.2 21.3 AAGR % (2/1) 2.1 3.8 -1.1 2.8 5 6.9 2.4 -1.7 3.9
Distribution by governorates in 2008 (machine) Al-Sweida 3,896 52 125 3,885 98 944 9,674 4,213 22,887 Dar'a 10,772 73 575 10,112 444 3,279 5,657 605 31,517 Al-Quneitra 975 1 18 830 0 642 730 117 3,313
Rural Damascus 8,869 11 418 6,903 64 39,782 10,215 382 66,644 Homs 11,353 180 875 11,561 630 20,507 14,070 1,030 60,206 Hama 7,598 240 267 6,842 1,729 15,874 9,148 50 41,748 Al-Ghab 3,359 504 212 3,425 545 16,012 2,636 354 27,047 Idleb 12,491 574 425 7,475 2,202 13,048 8,872 182 45,269 Tartous 4,686 19 152 4,067 24 16,131 23,171 16 48,266 Lattakia 4,831 26 75 4,077 1 12,389 12,247 0 33,646 Aleppo 19,144 1,713 982 31,560 5,981 29,953 5,752 29 95,114 Al-Raqqa 7,382 294 158 8,414 2,877 6,853 2,183 591 28,752 Dair-Ezzor 6,757 182 839 5,807 245 7,973 1,209 117 23,129 Al-Hassake 7,777 1,800 14 9,378 4,847 31,922 4,663 0 60,401 Source: Elaborated from MAAR, the AASA, 2008.

State of Food and Agriculture in Syria 2010
200
Table A1.12. Development of agricultural credits, 1999-2009 (SP million)
Item Grand total Public sector Cooperative sector Private sector
Short Medium Long Total Short Medium Long Total Short Medium Long Total 1999 10,209 189 0 0 189 3,981 454 53 4,488 4,580 881 70 5,531 2000 8,703 216 2 0 218 3,431 241 33 3,705 4,206 503 71 4,780 2001 7,527 80 0 0 80 2,861 277 29 3,167 3,567 645 68 4,280 2002 6,759 62 7 0 69 2,352 548 17 2,917 2,723 1,020 29 3,772 2003 6,948 73 1 0 74 2,720 262 20 3,002 3,170 675 27 3,872 2004 6,362 60 0 0 60 2,704 181 13 2,898 2,883 499 23 3,405 2005 6,919 56 0 0 56 2,914 177 19 3,110 3,229 495 29 3,753 2006 8,371 555 0 0 555 2,862 173 24 3,059 3,748 837 173 4,758 2007 8,877 801 0 0 801 2,625 234 44 2,903 3,604 1,028 540 5,172 2008 11,087 1,645 0 0 1,645 3,502 186 29 3,717 4,635 781 308 5,724 2009 79,992 63,013 0 0 63,013 6,158 137 17 6,312 7,427 906 2,334 10,667
Average 1 (1999-2001) 8,813 162 1 0 162 3,424 324 38 3,787 4,118 676 70 4,864 Average 2 (2007-2009) 33,319 21,820 0 0 21,820 4,095 186 30 4,311 5,222 905 1,061 7,188 Average change % (2/1) 278 13,392 13,341 20 -43 -22 14 27 34 1424 48 AAGR % (2/1) 24.8 126.5 126.3 3.0 -8.9 -4.1 2.2 4.0 5.0 57.4 6.7
Distribution by governorates in 2009 (000 SP) Al-Sweida 103.6 0.0 0.0 0.0 0 0.8 4.9 1.2 7 4.8 51.1 40.8 97 Dar'a 154.3 0.0 0.0 0.0 0 90.9 12.7 0.4 104 14.7 18.3 17.4 50 Al-Quneitra 10.0 0.6 0.0 0.0 1 0.2 1.5 0.0 2 0.0 7.4 0.3 8
Rural Damascus 33074.3 33000.0 0.0 0.0 33,000 21.0 2.8 0.2 24 7.7 14.8 27.9 50 Homs 343.9 0.0 0.0 0.0 0 176.7 19.7 3.6 200 46.8 63.0 34.0 144 Hama 1054.9 2.5 0.0 0.0 3 524.8 7.1 0.0 532 308.5 77.4 134.6 521 Al-Ghab 0.0 0.0 0.0 0.0 0 0.0 0.0 0.0 0 0.0 0.0 0.0 0 Idleb 600.6 0.0 0.0 0.0 0 146.5 8.8 3.2 159 273.6 105.4 63.1 442 Tartous 327.9 0.0 0.0 0.0 0 18.5 49.2 6.9 75 89.5 101.6 62.1 253 Lattakia 147.0 0.0 0.0 0.0 0 1.8 2.7 0.0 5 20.7 87.4 34.5 143 Aleppo 24809.7 23000.0 0.0 0.0 23,000 650.5 16.7 1.1 668 844.8 235.3 61.4 1,142 Al-Raqqa 1803.3 0.0 0.0 0.0 0 811.0 0.0 0.0 811 835.7 72.5 84.0 992 Dair-Ezzor 595.7 0.0 0.0 0.0 0 474.7 6.6 0.0 481 93.0 20.7 0.8 115 Al-Hassake 16967.2 7010.2 0.0 0.0 7,010 3240.9 4.4 0.0 3,245 4887.6 50.9 1773.2 6,712
Total 79992.4 63013.3 0.0 0.0 63,013 6158.4 137.1 16.7 6,312 7427.3 905.7 2334.0 10,667 Source: Elaborated from MAAR, the AASA, various issues.

State of Food and Agriculture in Syria 2010
201
Table A1.13. Development of other supporting services, 2003-2008 Item Unit 2003 2004 2005 2006 2007 2008 Index
Water produced Million m3 1,129 1,298 1,188 1,197 1,183 1.05 Electrical energy produced mkwh 37,499 41,170 1.1 Electrical energy consumed mkwh 25,639 26,892 1.05 Roads km 47,414 48,767 49,977 51,967 55,041 64,983 1.37 Asphalted roads km 35,092 36,412 37,554 38,923 40,032 41,071 1.17 Paved non-asphalted roads km 9,289 9,711 9,999 10,833 11,146 18,085 1.95 Leveled roads km 3,033 2,644 2,424 2,211 3,863 5,827 1.92 Length of railways km 2,799 2,833 2,833 2,833 2,833 2,833 1.01 Transportation vehicle by roads vehicle 880,176 938,334 1,067,529 1,213,034 1,367,767 1,537,206 1.75 Transportation vehicle by railways vehicle 6,523 6,227 6,220 6,246 6,246 5,935 0.91 Airports number 5 5 1 Ports number 3 3 1 Phone lines 000 lines 3,389 3,496 3,952 4,077 4,147 4,147 1.22 Public phone rooms room 2,110 2,038 1,989 1,819 1,726 1,726 0.82 Mobile subscribers subscriber 1,185,000 2,345,768 2,950,000 4,674,915 6,234,682 8,314,859 7.02 Integrated subscribers digital network - ISDN subscriber 1,914 5,584 6,961 11,259 13,948 17,279 9.03 E-mail and internet subscribers subscriber 124,000 160,000 216,000 309,367 694,539 1,559,263 12.57 Share of education in total state budget % 17 15 16 18 17 19 1.13 Basic education schools school 14,875 15,095 15,640 15,693 16,190 16,579 1.11 Public school 14,433 14,763 15,270 15,307 15,774 16,137 1.12 Private school 323 221 258 273 298 326 1.01 Secondary schools school 1,140 1,159 1,359 1,479 1,617 1,688 1.48 Public school 1,073 1,090 1,287 1,407 1,535 1,590 1.48 Private school 67 69 72 72 82 98 1.46 High and intermediate institutes institute 185 193 195 187 188 188 1.02 Vocational schools and centers Number 165 174 173 173 173 183 1.11 Public universities and colleges Number 62 66 66 91 107 109 1.76 Private universities university 11 11 1 Local medicine factories plant 47 52 54 56 59 66 1.4 Public hospitals hospital 76 78 85 110 114 117 1.54 Private hospitals hospital 364 376 373 353 355 365 1 Clinics clinic 2,291 2,393 2,486 2,652 2,682 2,754 1.2 Source: Elaborated from CBS, the ASA, various issues.

State of Food and Agriculture in Syria 2010
202
Annex Two
Agriculture in the National Economy

State of Food and Agriculture in Syria 2010
203
Annex 2. Agriculture in the national economy
Table A2.1. Development of the gross output by sectors at current prices, 2000-2009 (SP million, %)
Item 2000 2002 2003 2004 2005 2006 2007 2008 2009 ACH %
2002-2009 Agriculture 340,570 394,851 404,494 419,428 452,361 506,538 562,805 650,164 778,390 63.4 Mining and manufacturing 611,948 608,748 640,372 811,344 1,056,320 1,254,959 1,419,593 1,735,181 1,561,795 128.9 Building and construction 76,777 85,846 115,132 119,657 158,557 180,926 199,836 216,458 216,486 97.4 Wholesale and retail trade 159,463 220,247 216,882 269,943 365,687 353,787 487,874 664,980 760,380 170.6 Transport, communication and storage 176,202 205,604 228,990 209,206 235,763 258,960 286,630 326,351 357,446 50.7 Finance, insurance and properties 35,210 40,007 44,203 54,353 75,490 95,191 125,319 144,039 145,579 199.5 Social and personal services 43,111 51,888 57,157 64,619 75,226 87,112 96,694 107,330 123,430 88.6 Government services 113,927 129,117 147,848 202,127 211,188 197,986 252,307 279,904 306,801 75.1 Private non-profit services 592 746 820 943 1,089 1,261 1,324 1,390 1,599 71.9 Custom duties 0 0 0 22,572 22,904 32,877 33,405 33,112 32,821 340.1 Total gross output 1,557,800 1,737,054 1,855,898 2,174,192 2,654,585 2,870,000 3,465,787 4,158,909 4,284,726 106.5
Structure % Agriculture 22 23 22 19 17 17 16 16 18 Mining and manufacturing 39 35 35 37 40 42 41 41 37 Building and construction 5 5 6 6 6 6 6 5 5 Wholesale and retail trade 10 13 12 13 13 12 14 16 18 Transport, communication and storage 12 12 12 10 9 9 8 8 8 Finance, insurance and properties 2 2 2 2 3 3 4 3 3 Social and personal services 3 3 3 3 3 3 3 3 3 Government services 7 7 8 9 8 7 7 7 7 Private non-profit services 0 0 0 0 0 0 0 0 0 Custom duties 0 0 0 1 1 1 1 1 1 Total 100 100 100 100 100 100 100 100 100 Source: Elaborated from CBS, the ASA, various issues. ACH: Average change.

State of Food and Agriculture in Syria 2010
204
Table A2.2. Development of the gross output by sectors at constant prices of 2000, 2000-2009 (SP million, %)
Item 2000 2002 2003 2004 2005 2006 2007 2008 2009
ACH %
2002-2009
Agriculture 340,570 384,005 371,442 373,494 398,112 432,713 378,378 356,210 394,265 0 Mining and manufacturing
611,948 627,560 616,595 695,488 723,752 731,012 754,497 779,571 802,733 20.5
Building and construction
76,777 81,950 102,784 107,190 126,668 142,220 145,516 134,609 140,623 44.1
Wholesale and retail trade
159,463 206,165 206,109 232,840 275,346 267,884 320,126 366,047 374,531 64.4
Transport, communication and storage
176,202 200,219 216,313 169,245 183,944 198,126 220,648 247,725 247,503 22.2
Finance, insurance and properties
35,210 39,538 41,616 46,958 56,057 63,631 77,468 81,704 87,037 92.2
Social and personal services
43,111 51,224 52,296 56,683 65,160 74,282 82,644 92,450 100,771 72.2
Government services
113,927 124,180 135,855 159,836 162,858 163,816 202,464 201,501 236,148 52.5
Private non-profit services
592 753 762 827 995 1,159 1,210 1,269 1,383 64.9
Custom duties 0 0 0 19,483 17,500 23,040 23,870 24,823 24,000 273.1 Total gross output
Structure % Agriculture 22 22 21 20 20 21 17 16 16 Mining and manufacturing
39 37 35 37 36 35 34 34 33
Building and construction
5 5 6 6 6 7 7 6 6
Wholesale and retail trade
10 12 12 12 14 13 15 16 16
Transport, communication and storage
12 12 13 9 9 9 10 10 10
Finance, insurance and properties
12 12 13 16 15 15 17 18 19
Social and personal services
2 2 2 3 3 3 3 4 4
Government services
3 3 3 3 3 3 4 4 4
Private non-profit services
7 7 8 9 8 8 9 9 10
Custom duties 0 0 0 0 0 0 0 0 0 Total 0 0 0 1 1 1 1 1 1
Source: Elaborated from CBS, the ASA, various issues.

State of Food and Agriculture in Syria 2010
205
Table A2.3. Development of production inputs by sectors at current prices, 2000-2009 (SP million, %)
Item 2000 2002 2003 2004 2005 2006 2007 2008 2009
ACH %
2002-2009
Agriculture 116,821 140,670 139,654 138,251 147,010 159,177 172,977 196,418 212,030 38.9 Mining and manufacturing 339,434 343,640 380,630 479,385 637,432 711,013 791,450 947,751 933,134 122 Building and construction 47,879 53,091 71,303 74,698 99,428 113,974 127,251 136,284 137,840 101.6 Wholesale and retail trade 25,010 41,448 39,144 48,550 63,082 67,430 114,980 151,888 182,603 248 Transport, communication and storage 62,351 70,562 77,988 67,607 74,912 76,765 85,474 101,194 107,587 36.1 Finance, insurance and properties 2,084 2,324 3,006 6,067 7,654 9,407 12,030 15,659 18,217 302.8 Social and personal services 21,916 26,615 28,964 33,198 38,064 44,601 48,387 53,709 61,765 84.6 Government services 37,535 36,214 40,840 48,083 51,728 47,408 51,645 55,600 63,077 36.1 Private non-profit services 148 187 206 237 294 353 370 388 446 91.1 Others 11,225 28,541 34,495 43,398 52,958 48,875 331.3 Total inputs 653,178 714,751 781,735 907,301 1,148,145 1,264,623 1,447,962 1,713,849 1,765,575 90.6
Structure % Agriculture 18 20 18 15 13 13 12 12 12 Mining and manufacturing 52 48 49 53 56 56 55 55 53
Building and construction 7 7 9 8 9 9 9 8 8
Wholesale and retail trade 4 6 5 5 5 5 8 9 10
Transport, communication and storage 10 10 10 8 7 6 6 6 6
Finance, insurance and properties 0 0 0 1 1 1 1 1 1
Social and personal services 3 4 4 4 3 3 3 3 3
Government services 6 5 5 5 4 4 3 3 4
Private non-profit services 0 0 0 0 0 0 0 0 0
Others 0 0 0 1 2 3 3 3 3 Total 100 100 100 100 100 100 100 100 100
Share of inputs in gross output % Agriculture 34.3 35.6 34.5 33 32.5 31.4 30.7 30.2 27.2 Mining and manufacturing 55.5 56.5 59.4 59.1 60.3 56.7 55.8 54.6 59.7
Building and construction 62.4 61.8 61.9 62.4 62.7 63 63.7 63 63.7
Wholesale and retail trade 15.7 18.8 18 18 17.3 19.1 23.6 22.8 24
Transport, communication and storage 35.4 34.3 34.1 32.3 31.8 29.6 29.8 31 30.1
Total 41.9 41.1 42.1 41.7 43.3 42.6 41.8 41.2 41.2 Source: Elaborated from CBS, the ASA, various issues.

State of Food and Agriculture in Syria 2010
206
Table A2.4. Development of production inputs by sectors at constant prices of 2000, 2000-2009 (SP million, %)
Item 2000 2002 2003 2004 2005 2006 2007 2008 2009
ACH %
2002-2009
Agriculture 116,821 122,997 117,364 127,224 132,608 140,256 125,522 121,338 129,217 2.3 Mining and manufacturing 339,434 362,576 367,690 400,119 437,223 442,872 455,436 468,917 481,456 24.4 Building and construction 47,879 50,528 63,736 66,714 79,118 89,494 92,420 85,812 89,224 47.8 Wholesale and retail trade 25,010 37,673 42,252 38,208 41,401 45,654 70,309 76,240 80,799 92.5 Transport, communication and storage 62,351 67,689 68,894 54,761 58,480 61,224 68,084 80,478 75,557 17.1 Finance, insurance and properties 2,084 2,273 2,703 4,993 5,335 6,080 7,559 8,906 10,515 170.6 Social and personal services 21,916 23,989 24,766 29,121 33,901 38,647 42,997 42,976 46,844 70.5 Government services 37,535 34,955 37,468 42,178 42,055 35,117 36,628 34,110 48,551 4.1 Private non-profit services 148 188 191 295 355 413 431 452 493 104.2 Others 9,404 23,202 23,044 23,400 25,165 24,159 157.8 Total inputs 653,178 702,868 725,064 773,016 853,678 882,801 922,786 944,393 986,816 28.6
Structure % Agriculture 18 17 16 16 16 16 14 13 13 Mining and manufacturing 52 52 51 52 51 50 49 49 49
Building and construction 7 7 9 9 9 10 10 9 9
Wholesale and retail trade 4 6 6 5 5 5 8 8 8
Transport, communication and storage 10 10 10 7 7 7 7 8 8
Finance, insurance and properties 0 0 0 1 1 1 1 1 1
Social and personal services 3 3 3 4 4 4 5 5 5
Government services 6 5 5 5 5 4 4 4 5
Private non-profit services 0 0 0 0 0 0 0 0 0
Others 0 0 0 1 3 3 2 3 2 Total 100 100 100 100 100 100 100 100 100
Share of inputs in gross output % Agriculture 34.3 32 31.6 34.1 33.3 32.4 33.2 34.1 32.8 Mining and manufacturing 55.5 57.8 59.6 57.5 60.4 60.6 60.4 60.2 60
Building and construction 62.4 61.7 62 62.2 62.5 62.9 63.5 63.7 63.4
Wholesale and retail trade 15.7 18.3 20.5 16.4 15 17 22 20.8 21.6
Transport, communication and storage 35.4 33.8 31.8 32.4 31.8 30.9 30.9 32.5 30.5
Total 41.9 41 41.6 41.5 42.5 42.1 41.8 41.3 41

State of Food and Agriculture in Syria 2010
207
Source: Elaborated from CBS, the ASA, various issues.
Table A2.5. Development of the gross domestic product by sectors at current prices, 2000-2009 (SP million, %)
Item 2000 2002 2003 2004 2005 2006 2007 2008 2009
ACH %
2002-2009
Agriculture 223,749 254,181 264,840 281,177 305,351 347,361 389,828 453,746 566,360 89.8 Mining and manufacturing 272,514 265,108 259,742 331,959 418,888 543,946 628,143 787,430 628,661 156.4 Building and construction 28,898 32,755 43,829 44,959 59,129 66,952 72,585 78,174 78,646 117.5 Wholesale and retail trade 134,453 178,799 177,738 221,393 302,605 286,357 372,894 513,092 577,777 198.1 Transport, communication and storage 113,851 135,042 151,002 141,599 160,851 182,195 201,156 225,157 249,859 69.1 Finance, insurance and properties 33,126 37,683 41,197 48,286 67,836 85,784 113,289 128,380 127,362 229.5 Others 98,031 118,735 135,815 197,518 191,780 192,379 239,930 259,081 290,486 123.9 Total GDP 904,622 1,022,303 1,074,163 1,266,891 1,506,440 1,704,974 2,017,825 2,445,060 2,519,151 132.7
Structure % Agriculture 25 25 25 22 20 20 19 19 22 Mining and manufacturing 30 26 24 26 28 32 31 32 28
Building and construction 3 3 4 4 4 4 4 3 3
Wholesale and retail trade 15 18 16 17 20 17 18 21 23
Transport, communication and storage 13 13 14 11 11 11 10 10 10
Finance, insurance and properties 4 4 4 4 5 5 6 5 5
Others 10 11 13 16 12 11 12 10 9 Total 100 100 100 100 100 100 100 100 100
GDP/inputs % Agriculture 192 181 190 203 208 218 225 231 267 36.7 Mining and manufacturing 80 77 68 69 66 77 128 83 67 15.5 Building and construction 60 62 62 60 60 59 57 57 57 7.9 Wholesale and retail trade 538 431 454 456 480 425 324 338 316 -14.3 Transport, communication and storage 183 191 194 209 215 237 235 223 232 24.2 Finance, insurance and properties 1,590 1,622 1,371 796 886 912 942 820 699 -18.2 Others 139 143 137 140 131 135 139 143 143 14.6 Total 192 181 190 203 208 218 225 231 267 36.7
Source: Elaborated from CBS, the ASA, various issues.

State of Food and Agriculture in Syria 2010
208
Table A2.6. Development of the gross domestic product by sectors at constant prices of 2000, 2000-2009 (SP million, %)
Item 2000 2002 2003 2004 2005 2006 2007 2008 2009
ACH %
2002-2009
Agriculture 223,749 261,008 254,078 246,270 265,504 292,457 252,856 234,872 265,048 1.9 Mining and manufacturing 272,514 264,984 248,905 295,369 286,529 288,140 299,061 310,654 321,277 18.4 Building and construction 28,898 31,422 39,048 40,476 47,550 52,726 53,096 48,797 51,399 54.3 Wholesale and retail trade 134,453 168,492 163,857 194,632 233,945 222,230 249,817 289,807 293,732 78.5 Transport, communication and storage 113,851 132,530 147,419 114,484 125,464 136,902 152,564 167,247 171,946 24.9 Finance, insurance and properties 33,126 37,265 38,913 41,965 50,722 57,551 69,909 72,798 76,521 100.6 Others 98,031 117,025 126,488 155,831 147,000 165,076 206,732 217,341 242,255 95.1 Total GDP 904,622 1,012,726 1,018,708 1,089,027 1,156,714 1,215,082 1,284,035 1,341,516 1,422,178 37.9
Structure % Agriculture 25 26 25 23 23 24 20 18 19 Mining and manufacturing 30 26 24 27 25 24 23 23 23
Building and construction 3 3 4 4 4 4 4 4 4
Wholesale and retail trade 15 16 16 18 20 18 20 22 21
Transport, communication and storage 13 13 14 10 11 11 12 12 12
Finance, insurance and properties 4 4 4 4 4 5 5 5 5
Others 10 12 13 14 13 14 16 16 16 Total 100 100 100 100 100 100 100 100 100
GDP/inputs % Agriculture 192 212 217 194 200 209 201 194 205 -0.4 Mining and manufacturing 80 73 68 74 66 65 66 66 67 -4.8 Building and construction 60 62 61 61 60 59 58 57 58 4.4 Wholesale and retail trade 538 447 388 509 565 487 355 380 364 -7.2 Transport, communication and storage 183 196 214 209 215 224 224 208 228 6.6 Finance, insurance and properties 1,590 1,640 1,440 841 951 947 925 817 728 -25.9 Others 139 144 141 141 136 138 139 142 144 7.2 Total 192 212 217 194 200 209 201 194 205 -0.4
Source: Elaborated from CBS, the ASA, various issues.

State of Food and Agriculture in Syria 2010
209
Table A2.7. Labour force 15 years and over by sectors, 2009 (employee, %)
Item Public sector Private sector Others Total
Males Females Total Males Females Total Males Females Total Males Females Total
Agriculture 12,650 2,695 15,345 630,586 165,234 795,820 2,452 494 2,946 645,688 168,423 758,286
Mining and manufacturing 128,209 17,532 145,741 595,341 35,138 630,479 5,973 626 6,599 729,523 53,296 818,208
Building and construction 46,796 3,426 50,222 630,323 3,539 633,862 3,348 0 3,348 680,467 6,965 808,668
Traleant, hotels and restaurants 18,986 3,369 22,355 729,203 33,465 762,668 9,293 1,145 10,438 757,482 37,979 819,006
TCS 60,015 9,528 69,543 285,003 3,201 288,204 1,109 0 1,109 346,127 12,729 380,187
FIP 13,324 6,316 19,640 91,325 11,335 102,660 422 85 507 105,071 17,736 112,299
Services 738,347 324,252 1,062,599 168,870 50,411 219,281 3,788 744 4,532 911,005 375,407 1,302,406
Total labour force 1,018,327 367,118 1,385,445 3,130,651 302,323 3,432,974 26,385 3,094 29,479 4,175,363 672,535 4,999,229
Structure %
Agriculture 1.2 0.7 1.1 20.1 54.7 23.2 9.3 16 10 15.5 25 16.8
Mining and manufacturing 12.6 4.8 10.5 19 11.6 18.4 22.6 20.2 22.4 17.5 7.9 16.1
Building and construction 4.6 0.9 3.6 20.1 1.2 18.5 12.7 0 11.4 16.3 1 14.2
Traleant, hotels and restaurants 1.9 0.9 1.6 23.3 11.1 22.2 35.2 37 35.4 18.1 5.6 16.4
TCS 5.9 2.6 5 9.1 1.1 8.4 4.2 0 3.8 8.3 1.9 7.4
FIP 1.3 1.7 1.4 2.9 3.7 3 1.6 2.7 1.7 2.5 2.6 2.5
Services 72.5 88.3 76.7 5.4 16.7 6.4 14.4 24 15.4 21.8 55.8 26.5
Total 100 100 100 100 100 100 100 100 100 100 100 100 Source: Elaborated from CBS, the ASA, 2010. TCS: Transport, communication and storage; FIP: Finance, insurance and properties

State of Food and Agriculture in Syria 2010
210
Table A2.8. Development of some economic aggregates related to population and labour force, 2000-2009
Item Unit 2000 2002 2003 2004 2005 2006 2007 2008 2009 ACH % (02-
09) At current prices
Per capita GDP SP/person 55,430 59,679 61,206 69,847 82,068 90,015 103,985 124,469 122,176 83.8 Agricultural per capita GDP SP/person 156,468 177,749 179,796 192,324 208,858 473,244 414,711 476,624 598,057 170.9 Average labour profitability SP/employee 183,233 207,070 203,633 232,074 312,475 396,321 431,159 503,099 509,331 124.6 Agricultural labour profitability SP/employee 156,468 177,749 179,796 192,324 208,858 473,244 414,711 476,624 598,057 170.9 Economic efficiency of agriculture 0.85 0.86 0.88 0.83 0.67 1.19 0.96 0.95 1.17 20.0
At constant prices of 2000 Per capita GDP SP/person 55,430 59,120 58,046 60,041 63,016 64,151 66,170 68,291 68,974 14.8 Agricultural per capita GDP SP/person 27,363 30,595 29,057 29,203 31,104 33,204 28,363 25,717 27,649 -8.0 Average labour profitability SP/employee 183,233 205,130 193,120 199,492 239,932 282,446 274,366 276,032 287,541 40.2 Agricultural labour profitability SP/employee 156,468 182,523 172,490 168,447 181,603 398,443 268,996 246,714 279,882 52.0 Economic efficiency of agriculture SP/person 0.85 0.89 0.89 0.84 0.76 1.41 0.98 0.89 0.97 8.4 Source: Elaborated by the reporter. Profitability = GDP/labour. Economic efficiency = share of agriculture in GDP/share of agriculture in labour force.
Table A2.9. Development of total and agricultural trades, 1999-2009 (US$ million, %
Item Average
1999-2001
2002 2003 2004 2005 2006 2007 2008 2009 Average
2002-2004
Average 2007-2009
ACH % 2002-2009
ACH % 1999-2009
Total trade (1) 8,687 11,625 10,854 15,111 18,533 20,727 25,272 33,225 26,723 12,530 28,407 126.7 227.0 Agricultural trade (2) 1,666 2,368 2,223 2,396 2,559 2,506 3,297 3,031 2,885 2,329 3,071 31.9 84.3 Share of agriculture % (2/1) 19.2 20.4 20.5 15.9 13.8 12.1 13.0 9.1 10.8 18.9 11.0 -42.1 -42.9 Total exports (3) 4,486 6,556 5,762 7,115 8,486 10,100 11,581 15,231 10,852 6,478 12,555 93.8 179.9 Agricultural exports (4) 801 1,333 1,137 1,066 1,115 1,222 1,386 1,002 1,462 1,179 1,283 8.9 60.2 Share of agriculture % (4/3) 17.9 20.3 19.7 15.0 13.1 12.1 12.0 6.6 13.5 18.3 10.7 -41.7 -40.3 Total imports (5) 4,201 5,070 5,092 7,996 10,047 10,626 13,691 17,994 15,871 6,053 15,852 161.9 277.3 Agricultural imports (6) 864 1,034 1,086 1,330 1,443 1,284 1,911 2,030 1,423 1,150 1,788 55.5 106.9 Share of agriculture % (6/5) 20.6 20.4 21.3 16.6 14.4 12.1 14.0 11.3 9.0 19.4 11.4 -41.2 -44.6 Share of (1) in GDP % 33.8 51.2 45.5 53.7 55.4 54.7 56.4 61.1 47.7 50.1 55.1 9.9 63.0 Share of (2) in agricultural GDP %
25.1 41.9 37.8 38.3 37.7 32.5 38.1 30.1 22.9 39.3 30.3 -22.9 20.9
Source: Elaborated from NAPC database and the CBS, the ASA, 2010.

State of Food and Agriculture in Syria 2010
211
Table A2.10. Development of investment at current prices, 2000-2009 (SP million, %)
Item 2000 2002 2003 2004 2005 2006 2007 2008 2009 Average
2002-2004 Average
2007-2009 ACH %
2002-2009 Total investment 156,092 206,416 249,681 274,500 346,737 371,519 412,136 408,725 451,766 243,532 424,209 74.2 Public 99,331 125,191 160,130 141,330 167,155 172,212 178,317 158,399 195,275 142,217 177,330 24.7 Private 56,761 81,225 89,551 133,170 179,582 199,307 233,819 250,326 256,491 101,315 246,879 143.7 Share of public % 63.6 60.6 64.1 51.5 48.2 46.4 43.3 38.8 43.2 58.8 42 -29.0 Share of private % 36.4 39.4 35.9 48.5 51.8 53.6 56.7 61.2 56.8 41.2 58 41.3 Share of agriculture % 15.7 16.2 13.3 14.2 13.3 11.3 9.2 7.8 8.7 14.6 9 -41.2 Return to total investment % 580 495 430 462 435 459 490 561 558 462 536 16.0 Return to agricult. investment % 916 761 798 722 660 824 1,031 1,400 1,435 760 1,289 69.5
Investment structure (SP million)Agriculture 24,431 33,390 33,203 38,950 46,246 42,163 37,801 31,886 39,473 35,181 36,387 3.4 Mining and manufacturing 45,918 58,548 75,717 74,553 89,487 84,050 95,227 90,843 105,743 69,606 97,271 39.7 TCS 29,379 40,621 37,744 46,866 57,825 51,565 61,229 50,398 64,273 41,744 58,633 40.5 Dwellings 17,621 18,307 24,695 40,030 63,177 76,701 89,889 112,992 100,837 27,677 101,239 265.8 Other sectors 38,743 55,550 78,322 74,101 90,002 117,040 127,990 122,606 141,440 69,324 130,679 88.5 Source: Elaborated from CBS, the ASA, various issues. Return to investment = GDP/investment; agricult.: agricultural.
Table A2.11. Development of investment at constant prices of 2000, 2000-2009 (SP million, %)
Item 2000 2002 2003 2004 2005 2006 2007 2008 2009 Average
2002-2004 Average
2007-2009 ACH %
2002-2009 Total investment 156,092 197,328 231,944 255,767 288,193 308,669 283,099 266,488 297,100 228,346 282,229 23.6 Public 99,331 121,491 146,049 135,318 146,688 143,791 136,400 112,739 143,820 134,286 130,986 -2.5 Private 56,761 75,837 85,895 120,449 141,505 164,878 146,699 153,749 153,280 94,060 151,243 60.8 Share of public % 63.6 61.6 63.0 52.9 50.9 46.6 48.2 42.3 48.4 59 46 -21.7 Share of private % 36.4 38.4 37.0 47.1 49.1 53.4 51.8 57.7 51.6 41 54 31.5 Share of agriculture % 15.7 16.4 13.0 14.6 14.1 11.2 9.3 8.2 9.1 15 9 -39.6 Return to total investment % 580 513 439 426 401 394 454 503 479 459 478 4.1 Return to agricult. investment % 916 809 842 662 654 844 963 1,055 985 771 1,001 29.8
Investment structure (SP million)Agriculture 24,431 32,278 30,174 37,218 40,571 34,634 26,260 21,879 26,911 33,223 25,017 -24.7 Mining and manufacturing 45,918 56,941 71,126 70,625 75,482 74,157 66,361 64,644 74,284 66,231 68,430 3.3 TCS 29,379 39,346 34,896 44,803 50,551 43,788 40,704 33,218 42,300 39,682 38,741 -2.4 Dwellings 17,621 14,045 23,546 32,781 44,530 58,989 60,573 61,990 56,018 23,457 59,527 153.8 Other sectors 38,743 54,718 72,202 70,340 77,059 97,101 89,201 84,757 97,587 65,753 90,515 37.7 Source: Elaborated from CBS, the ASA, various issues. Return to investment = GDP/investment * 100; agricult.: agricultural.

State of Food and Agriculture in Syria 2010
212
Table A2.12. Development of investment structure, 2000-2009 (%)
Item 2000 2002 2003 2004 2005 2006 2007 2008 2009 Average
2002-2004 Average
2007-2009 ACH %
2002-2009 At current prices 100.0 100.0 100.0 100.0 100.0 100.0 100.0 100.0 100.0 Agriculture 15.7 16.2 13.3 14.2 13.3 11.3 9.2 7.8 8.7 14.4 8.6 -40.6 Mining and manufacturing 29.4 28.4 30.3 27.2 25.8 22.6 23.1 22.2 23.4 28.6 22.9 -19.8 TCS 18.8 19.7 15.1 17.1 16.7 13.9 14.9 12.3 14.2 17.1 13.8 -19.4 Dwellings 11.3 8.9 9.9 14.6 18.2 20.6 21.8 27.6 22.3 11.4 23.9 110.0 Other sectors 24.8 26.9 31.4 27.0 26.0 31.5 31.1 30.0 31.3 28.5 30.8 8.2 At constant prices 100.0 100.0 100.0 100.0 100.0 100.0 100.0 100.0 100.0 Agriculture 15.7 16.4 13.0 14.6 14.1 11.2 9.3 8.2 9.1 14.5 8.9 -39.1 Mining and manufacturing 29.4 28.9 30.7 27.6 26.2 24.0 23.4 24.3 25.0 29.0 24.2 -16.4 TCS 18.8 19.9 15.0 17.5 17.5 14.2 14.4 12.5 14.2 17.4 13.7 -21.0 Dwellings 11.3 7.1 10.2 12.8 15.5 19.1 21.4 23.3 18.9 10.3 21.1 105.3 Other sectors 24.8 27.7 31.1 27.5 26.7 31.5 31.5 31.8 32.8 28.8 32.1 11.4 Source: Elaborated from CBS, the ASA, various issues.

State of Food and Agriculture in Syria 2010
213
Annex Three
Agricultural and Food Strategies and Policies
State of Food and Agriculture in Syria 2010
214
Annex 3. Agricultural and food strategies and policies
A3.1. United Nations Development Assistance Framework
The United Nations Development Assistance Framework (UNDAF), which is conducted by Un-gencies (FAO, UNDP, UNESCO, WFP, UNICEF, UNFPA, WHO, IFAD and UNIDO)77 either through individual programmes or through cooperate ones, focuses on the following outcomes, which are in line with the SAS and 10th FYP:
On Agricultural Development: Enhanced national capacity for improved public service delivery of sustainable development and management of agriculture, food security and nutrition that ensures equitable outcomes;
On Environment and Sustainable Development: Strengthened national & local capacity and private sector to implement and monitor sustainable use of natural resources (fisheries, forestry, land, and protected areas) and to respond to climate change;
On Trade and Private Sector Development: Strengthen national and local capacity to formulate, implement and monitor pro-poor investment, trade and private sector development strategy to develop and diversify the economy;
On Employment and Local Development: Increased employability and productive and decent employment opportunities, particularly for youth and women, through diversified local economic development in urban and rural areas.
Source: Elaborated from FAO (2009), Cambodia National Medium-Term Priority Framework (NMTPF) for 2011-2015, Draf report; and www.fao.org.
A3.2. New FAO Strategic objectives (SO) and Organizational Results (OR) SO A: Sustainable intensification of crop production
Organizational Result A1 - Policies and strategies on sustainable crop production intensification and diversification at national and regional levels;
Organizational Result A2 - Risks from outbreaks of transboundary plant pests and diseases are sustainably reduced at national, regional and global levels;
Organizational Result A3 - Risks from pesticides are sustainably reduced at national, regional and global levels;
Organizational Result A4 - Effective policies and enabled capacities for a better management of plant genetic resources for food and agriculture (PGRFA) including seed systems at the national and regional levels.
SO B: Increased sustainable livestock production
Organizational Result B1 – The livestock sector effectively and efficiently contributes to food security, poverty alleviation and economic development;
Organizational Result B2 - Reduced animal disease and associated human health risks; Organizational Result B3 - Better management of natural resources, including animal genetic
resources, in livestock production; Organizational Result B4 - Code of Conduct for a Responsible Livestock Sector.
SO C: Sustainable management and use of fisheries and aquaculture resources
Organizational Result C1 - Members and other stakeholders have improved formulation of policies and standards that facilitate the implementation of the Code of Conduct for Responsible Fisheries (CCRF) and other international instruments, as well as response to emerging issues;
Organizational Result C2 - Governance of fisheries and aquaculture has improved through the establishment or strengthening of national and regional institutions, including RFBs;
Organizational Result C3 - More effective management of marine and inland capture fisheries by FAO Members and other stakeholders has contributed to the improved state of fisheries resources, ecosystems and their sustainable use;
77 FAO: Food and Agriculture Organization of the United Nations. UNDP: United Nations Development Programme. WHO: World Health Organization. UNESCO: United Nations Educational, Scientific and Cultural Organization. UNFPA: United Nations Food Programme Assistance. UNICEF: United Nations Children’s Fund. IFAD: International Fund for Agricultural Development. UNIDO: United Nations Industrial Development Organization. WFP: World Food Programme.

State of Food and Agriculture in Syria 2010
215
Organizational Result C4 - Members and other stakeholders have benefited from increased production of fish and fish products from sustainable expansion and intensification of aquaculture;
Organizational Result C5 - Operation of fisheries, including the use of vessels and fishing gear, is made safer, more technically and socio-economically efficient, environmentally friendly and compliant with rules at all levels;
Organizational Result C6 - Members and other stakeholders have achieved more responsible post-harvest utilization and trade of fisheries and aquaculture products, including more predictable and harmonized market access requirements.
SO D: Improved quality and safety of foods at all stages of the food chain
Organizational Result D1 - New and revised internationally agreed standards and recommendations for food safety and quality that serve as the reference for international harmonization;
Organizational Result D2 - Institutional, policy and legal frameworks for food safety/quality management that support an integrated food chain approach;
Organizational Result D3 - National/ regional authorities are effectively designing and implementing programmes of food safety and quality management and control according to international norms;
Organizational Result D4 - Countries establish effective programmes to promote improved adherence of food producers/businesses to international recommendations on good practices in food safety and quality at all stages of the food chain, and conformity with market requirements.
SO E: Sustainable management of forests and trees
Organizational Result E1 - Policy and practice affecting forests and forestry are based on timely and reliable information;
Organizational Result E2 - Policy and practice affecting forests and forestry are reinforced by international cooperation and debate;
Organizational Result E3 - Institutions governing forests are strengthened and decision-making improved, including involvement of forest stakeholders in the development of forest policies and legislation, thereby enhancing an enabling environment for investment in forestry and forest industries. Forestry is better integrated into national development plans and processes, considering interfaces between forests and other land uses;
Organizational Result E4 - Sustainable management of forests and trees is more broadly adopted, leading to reductions in deforestation and forest degradation and increased contributions of forests and trees to improve livelihoods and to contribute to climate change mitigation and adaptation;
Organizational Result E5 - Social and economic values and livelihood benefits of forests and trees are enhanced, and markets for forest products and services contribute to making forestry a more economically viable land-use option;
Organizational Result E6 - Environmental values of forests, trees outside forests and forestry are better realized; strategies for conservation of forest biodiversity and genetic resources, climate change mitigation and adaptation, rehabilitation of degraded lands, and water and wildlife management are effectively implemented.
SO F: Sustainable management of land, water and genetic resources and improved responses to global environmental challenges affecting food and agriculture
Organizational Result F1 - Countries promoting and developing sustainable land management; Organizational Result F2 - Countries address water scarcity in agriculture and strengthen the
capacities to improve water productivity of agricultural systems at national and river-basin levels including trans-boundary water systems;
Organizational Result F3 - Policies and programmes are strengthened at national, regional and international levels to ensure the conservation and sustainable use of biological diversity for food and agriculture and the equitable sharing of benefits arising from the use of genetic resources;
Organizational Result F4 - An international framework is developed and countries’ capacities are reinforced for responsible governance of access to and secure tenure of land and its interface with other natural resources;

State of Food and Agriculture in Syria 2010
216
Organizational Result F5 - Countries have strengthened capacities to address emerging environmental challenges, such as climate change and bio-energy;
Organizational Result F6 - Improved access to and sharing of knowledge for natural resource management has been facilitated.
SO G: Enabling environment for markets to improve livelihoods
Organizational Result G1 - Appropriate analysis, policies and services enable producers to improve competitiveness, diversify into new enterprises, increase value addition and meet market requirements;
Organizational Result G2 - Rural employment creation and income diversification are integrated into agricultural and rural development policies, programmes and partnerships;
Organizational Result G3 - National and regional policies, regulations and institutions enhance the competitiveness and developmental impacts of agribusiness and agro-industries;
Organizational Result G4 - Countries have increased awareness of and capacity to analyze developments in international agricultural markets, trade policies and trade rules to identify trade opportunities and to formulate appropriate and effective trade policies and strategies.
SO H: Improved food security and better nutrition
Organizational Result H1 - Countries and other stakeholders have strengthened capacity to formulate and implement coherent policies and programmes that address the root causes of hunger, food insecurity and malnutrition;
Organizational Result H2 - Member countries and other stakeholders strengthen food security governance through the triple-track approach and the implementation of the Voluntary Guidelines to Support the Progressive Realization of the Right to Adequate Food in the Context of National Food Security;
Organizational Result H3 - Strengthened capacity of Member countries and other stakeholders to address specific nutrition concerns in food and agriculture;
Organizational Result H4 - Strengthened capacity of Member countries and other stakeholders to generate, manage, analyse and access data and statistics for improved food security and better nutrition;
Organizational Result H5 - Member countries and other stakeholders have better access to FAO analysis and information products and services on food security, agriculture and nutrition and strengthened own capacity to exchange knowledge.
SO I: Improved preparedness for, and effective response to, food and agricultural threats and emergencies
Organizational Result I1 - Countries vulnerability to crisis, threats and emergencies is reduced through better preparedness and integration of risk prevention and mitigation into policies, programmes and interventions;
Organizational Result I2 - Countries and partners respond more effectively to crises and emergencies with food and agriculture related interventions;
Organizational Result I3 - Countries and partners have improved transition and linkages between emergency, rehabilitation and development.
SO K: Gender equity in access to resources, goods, services and decision-making in the rural areas
Organizational Result K1 - Rural gender equality is incorporated into UN policies and joint programmes for food security, agriculture and rural development;
Organizational Result K2 - Governments develop enhanced capacities to incorporate gender and social equality issues in agriculture, food security and rural development programmes, projects and policies using sex-disaggregated statistics, other relevant information and resources;
Organizational Result K3 - Governments are formulating gender-sensitive, inclusive and participatory policies in agriculture and rural development;
Organizational Result K4 - FAO management and staff have demonstrated commitment and capacity to address gender dimensions in their work.
SO L: Increased and more effective public and private investment in agriculture and rural development

State of Food and Agriculture in Syria 2010
217
Organizational Result L01 - Greater inclusion of food and sustainable agriculture and rural development investment strategies and policies into national and regional development plans and frameworks;
Organizational Result L02 - Improved public and private sector organizations' capacity to plan, implement and enhance the sustainability of food and agriculture and rural development investment operations;
Organizational Result L03 - Quality assured public/private sector investment programmes, in line with national priorities and requirements, developed and financed.
FAO Core Functions (CF)
A. Providing long-term perspectives and leadership in monitoring and assessing trends in food security and agriculture, fisheries and forestry;
B. Stimulating the generation, dissemination and application of information and knowledge, including statistics;
C. Negotiating international instruments, setting norms, standards and voluntary guidelines, supporting the development of national legal instruments and promoting their implementation;
D. Articulating policy and strategy options and advice; E. Providing technical support to: F. promote technology transfer, G. catalyse change, and H. build capacity, particularly for rural institutions, I. Undertaking advocacy and communication, to mobilize political will and promote global recognition
of required actions in areas of FAO’s mandate; J. Bringing integrated interdisciplinary and innovative approaches to bear on the Organization’s
technical work and support services.
Source: Elaborated from FAO (2009). Cambodia National Medium-Term Priority Framework (NMTPF) for 2011-2015. Draf report, and www.fao.org.

State of Food and Agriculture in Syria 2010
218
A3.3. Arab Strategy until 2025
In Algiers Summit (March 2005), the Arab leaders issued Resolution no. 314 which designates the Arab Organization for Agricultural Development (AOAD) General Assembly (Ministers of Agriculture) to prepare a strategy for sustainable Arab Agricultural Development for the Upcoming Two Decades. The Riadh Summit (March 2007), issued Resolution no. 393 on the approval of this Strategy, which is considered as a part and parcel of the common Strategy for the Joint Arab Economic and Social Act (JAESA). In the context of these resolutions, the JAESA will enter into new era by which the desired agricultural integration and the attainment of food security among Arab States could be reached.
Source: Elaborated from AOAD database.
Table A3.1. MAAR investment by projects, 2006-2010 (000 US$)
Project FYP
Budget 06-10
FYP Budget 06-08
FYP Expenditure
2006-2008
Execution Rate %
2006-2008 MAAR Central Administration 1,412,667 512,446 479,805 94 Development of Extension Service 26,882 15,815 15,325 97 Establishment of a Training Centre in Al-Saboura 5,591 44 0 1 Building Establishment for 29 Vocational Schools and 6 Middle Institutes
32,258 15,422 14,502 94
Development of Agricultural Education Centres 43,011 8,647 8,481 98 Production of Fruit Seedlings 43,011 32,524 31,947 98 Fruit Trees Project 80,645 41,499 40,747 98 Second Fruit Trees Project in Al-Quneitra 3,226 746 745 100 Agricultural Development in Southern Area 10,753 8,906 8,751 98 Rural Development in Jabal Al-Hos 1,613 968 966 100 Agricultural Development in Coastal Area 36,559 19,954 17,701 89 Rural Development in North-Eastern Area 0 290 285 98 Rural Development in Idleb 36,559 8,841 5,380 61 Agricultural Development in Jabal Al-Hos 10,753 6,321 6,199 98 Development of Forestry 107,527 64,460 63,070 98 Green Belt around Dair-Ezzor 5,376 2,858 2,858 100 Expansion of Forestry 10,753 7,559 7,355 97 Protection of Forestry and Combating Fire 29,032 34,545 32,408 94 Integrated Development of Al-Badia 53,763 49,052 35,358 72 Renewing and Equipping Al-Badia Wells 26,882 10,516 10,200 97 Development of Al-Badia 26,882 12,279 12,051 98 Natural Protection Zone in Al-Talela 5,376 108 100 93 Grading and Improving Local Cattle 21,505 8,366 7,832 94

State of Food and Agriculture in Syria 2010
219
Table A3.1. Continued
Project FYP
Budget 06-10
FYP Budget 06-08
FYP Expenditure
2006-2008
Execution Rate %
2006-2008 MAAR Central Administration (continued) Development of Fishery 5,376 3,939 3,829 97 Arab Horses Establishment 3,226 1,845 1,733 94 Development and Spreading Out of Veterinary Care 37,634 25,038 24,477 98 Strengthening General Control 26,882 18,654 18,124 97 Development of Bio-Control 21,505 7,142 6,525 91 Development of Bees Breeding and Honey Production
6,452 3,433 3,234 94
Establishment of Agricultural Directorate Building in Tartous
366 1,208 1,192 99
Establishment of Agricultural Directorate Building in Al-Raqqa
1,935 774 711 92
Establishment of Agricultural Directorate Building in Dair-Ezzor
495 1,144 1,113 97
Establishment of MAAR Building 21,505 510 383 75 Establishment of Agricultural Directorate Building in Al-Quneitra
0 42 42 100
Establishment of Agricultural Directorate Building in Rural Damascus
4,194 2,183 2,113 97
Establishment of Agricultural District Building in Governorates
21,505 1,697 1,785 105
Artificial Rainfall 10,753 928 878 95 Agricultural Roads 1,075 396 339 86 Restoration and Substitution of Transportation vehicles
21,505 10,086 8,820 87
Mechanization of MAAR Actions 10,753 699 622 89 Using GIS for Natural and Agricultural Resources Mapping
6,452 918 889 97
Development of Agricultural Statistics 10,753 2,565 2,273 89 Office of Fruit Trees Project 0 3,537 3,530 100 8 March Establishment 3,226 2,460 2,420 98 Modern Irrigation Project 32,258 12,331 12,299 100 Studies for New Projects 151 0 0 0 Fund of Modern Irrigation 473,118 47,915 47,915 100 Establishment of Certified Laboratories for Agricultural Products, Diseases and Residuals
35,505 115 96 83
Strengthening Specialized Training Centers 7,376 2,975 2,415 81 Extension Units Support Project 30,258 6,744 6,504 96 High Sounding Bees 452 231 218 95 MAAR Establishments GCASR 172,043 51,118 47,385 93 MAAR Establishments (continued) GCG (General Commission for Al-Ghab Development) 43,011 16,011 15,682 98 REE 43,011 12,776 10,320 81 General Establishment for Fishery 645 624 584 94 General Establishment for Cattle 10,753 3,591 2,943 82 GESM 10,753 6,603 5,994 91 General Establishment for Fodder 6,452 4,499 3,365 75 General Establishment for Poultry 6,452 3,494 3,487 100 Total MAAR 1,705,785 611,161 569,564 93 Source: Elaborated from MAAR database.

State of Food and Agriculture in Syria 2010
220
Table A3.2. Intermediate goals of the MAAR investment, 2006-2010
Item Unit Total FYP 06-10
FYP 2006-2008
Planned FYP
Real planned
FYP Executed
Execution rate %
Fruit bearing seedlings million 30.0 18.0 19.7 23.8 132.2 Fruit trees project ha 52,950 Forestry seedlings million 60 36.0 41.8 54.9 152.5 Forestation 000 ha 50 Forestry roads km 5,000 Invested wells (cumulative) well 1,345 792.0 801.0 824.0 104.0 Land reclamation by Southern Area Project
000 ha 20
Identification and classification of lands
000 ha 30.0
Production of sperms liquid 000 shot 4,250 2,390.0 2,300.0 2,770.0 115.9 Production of nitrogen liquid 000 liter 2,050 1,230.0 1,330.0 1,449.7 117.9 Artificial insemination 000 shot 4,250 2,390.0 2,300.0 2,683.0 112.3 Production of modern bees boxes
000 box 50
Production of bees clusters cluster 8,500 Grazing seedlings million 66 43.0 45.0 45.0 105.6 Grazing cultivations 000 ha 140 Insect control 000 ha 1,800 Weed control 000 ha 2,850 Table A3.2. Continued
Item Unit Total FYP 06-10
FYP 2006-2008
Planned FYP
Real planned
FYP Executed
Execution rate %
Field mouse control 000 ha 3,800
Control value US$
million 60
Extension units (cumulative) unit 5,415 1,082.0 1,044.0 1,043.0 96.4
Analysis of fodder samples 000
samples 121 68.0 230.0 339.2
Grazing protection zones (cumulative)
000 ha 5,250
Land reclamation by Jabal Al-Hos Project
ha 18,500
Land reclamation by Middle-Coastal Area Project
ha 50,000
Clouds cultivation material Shot 65,000 Land reclamation by Idleb Rural Development Project
ha 21,000
Cultivation and development ha 28,500 Protection 000 ha 2,535 Improved seeds tonne 1,232,120 Grazing seeds tonne 500.0 494.0 98.8 Land reclamation 000 ha 89.7 83.8 93.4 Plant production research centers
station
189.0 174.0 92.1
Animal production research centers
station
47.0 47.0 100.0
Irrigation and land research centers
station 85.0 85.0 100.0
Number of plant production researches
research 2,649.0 2,589.0 97.7
Number of animal production researches
research 147.0 143.0 97.3
Number of natural resources researches
research
753.0 725.0 96.3
Extension fields field 374.0 353.0 94.4 Source: Elaborated from the 10th FYP and MAAR database.

State of Food and Agriculture in Syria 2010
221
Table A3.3. Agricultural joint-venture companies, 2005-2008
Item Year
Activities Fruit trees
Crops Dunum
Greenhouse Bee hives Number Area
Dunum Total Tree
Fruit bearing Tree
Number House
Area Dunum
Barakeh 2005 1,510 39,757 19,767 4,186 - - - 2007 1,510 40,000 14,767 3,972 - - - 2008 1,300 35,000 26,667 4,217
Nama’a 2005 489 36,650 16,650 14,507 143 57 61 2007 489 18,575 4,150 2,501 86 -43 50 2008 489 18,575 4,150 2,501 86 43 50
Kadak 2005 717 11,075 1,551 13,762 37 58 90 2007 717 9,500 1,500 9,551 37 58 65 2008 717 9,500 1,500 9,551 37 58 65
Al-Qalamoun 2005 730 18,500 700 5,420 - - 100 2007 730 18,500 2,500 5,400 - - 0 2008 730 18,500 2,500 5,400 - - -
Al-Sham 2005 163 12,322 2,430 - - - - 2007 163 12,322 2,430 - - - - 2008 163 12,322 2,430 - - - -
Source: Elaborated from Agricultural Engineering Organization, 2008.

State of Food and Agriculture in Syria 2010
222
Table A3.4. Agricultural and agro-industrial investments established by Law no. 10 of 1991, 2004-2008 (cost: 000 SP)
Project title Item 2004 2005 2006 2007 2008 Total
Sea lives breeding
Number 3 3 2 0 2 10 Total investment cost
217,020 1,817,377 859,408 0 203,943 3,097,748
Job opportunities
217 260 256 0 56 789
Feed industries
Number 6 27 21 16 7 77 Total investment cost
756,743 3,652,624 3,107,995 2,809,347 1,347,888 11,674,597
Job opportunities
287 1,735 953 599 527 4,101
Livestock production
Number 11 14 35 22 16 98 Total investment cost
832,052 13,045,515 6,213,314 3,472,131 8,872,369 32,435,381
Job opportunities
443 573 1,585 799 501 3,901
Livestock production and processing
Number 6 10 31 11 7 65 Total investment cost
1,125,921 1,134,633 8,662,315 1,536,173 932,978 105,300,020
Job opportunities
284 1,647 2,413 425 368 684
Crop production
Number 2 3 2 2 3 12 Total investment cost
1,028,508 347,047 156,336 132,329 1,960,777 3,624,997
Job opportunities
252 172 64 71 326 885
Infrastructure
Number 0 0 0 0 0 0 Total investment cost
0 0 0 0 0 0
Job opportunities
0 0 0 0 0 0
Processing agricultural production inputs
Number 1 3 4 2 2 12 Total investment cost
115,506 1,014,774 894,312 240,764 121 2,265,477
Job opportunities
50 195 252 52 135 135,546
Food industries
Number 6 6 36 3 1 52 Total investment cost
3,056,278 298,514 7,915,841 621,794 426,840 12,319,267
Job opportunities
1,226 688 2,156 226 119 4,415
Olive oil extraction
Number 0 0 46 9 2 57 Total investment cost
0 0 9,004,843 1,819,982 359,680 11,184,505
Job opportunities
0 0 2,465 322 62 2,849
Total
Number 35 66 177 65 40 383 Total investment cost
7,132,028 21,310,484 36,814,364 10,632,520 14,104,596 181,901,992
Job opportunities
2,759 5,270 10,144 2,496 2,094 22,763
Source: Elaborated from the MAAR, Report on Analysis of the Current Situation of the Agricultural Sector, 2004-2008.

State of Food and Agriculture in Syria 2010
223
Table A3.5. Diversification of agricultural and agro-industrial projects established by Law no. 10 of 1991 by governorates, 2005-2008
Item Feed industries Crop production Livestock Food industries Olive oil extraction
Processing agricultural production inputs
Total
Number Jobs Number Jobs Number Jobs Number Jobs Number Jobs Number Jobs Number Jobs
Rural Damascus 7 433 3 656 21 942 12 508 3 108 4 369 50 3,016
Dar’a 2 46 0 0 11 486 5 342 4 162 0 0 22 1,036
Al-Sweida 3 88 0 0 15 342 2 140 4 183 0 0 24 753
Al-Quneitra 0 0 0 0 0 0 0 0 1 149 0 0 1 149
Homs 7 762 0 0 7 402 4 637 2 87 2 98 22 1,986
Hama 5 173 1 44 26 1,345 3 184 11 388 2 52 48 2,186
Idleb 10 444 1 4 12 751 1 23 10 440 1 83 35 1,745
Aleppo 8 420 0 0 5 228 2 51 7 183 0 0 22 882
Lattakia 4 146 0 0 6 401 2 135 5 174 1 150 18 1,006
Tartous 3 90 0 0 5 311 4 263 3 119 0 0 15 783
Al-Raqqa 5 277 1 42 12 1,141 3 246 4 258 2 347 27 2,311
Dair-Ezzor 9 320 4 205 22 1,041 4 219 1 52 0 0 40 1,837
Al-Hassake 9 865 1 40 10 496 2 159 0 0 1 50 23 1,610
Total 72 4,064 11 991 152 7,886 44 2,907 55 2,303 13 1,149 347 19,300 Source: Elaborated from the MAAR, Report on Analysis of the Current Situation of the Agricultural Sector, 2004-2008.

State of Food and Agriculture in Syria 2010
224
A3.4. Preparation of the Annual Agricultural Production Plan (AAPP)
An agricultural production plan is prepared annually to set up quantitative production targets for crops and livestock at village level. It also indicates the crop rotations to be adopted by irrigated and rain-fed farming systems as well as the livestock structure by agro climatic zones. Therefore, it is considered as an important document of the Syrian planning system and is instrumental to achieve, on a yearly basis, the quantitative production targets of the FYP.The mechanism followed by the preparation of this plan has not changed in the period under study. It relies on iterative and participatory approaches to ensure that the views and knowledge of all concerned parties are taken into account. First, the MAAR issues the indicative figures of the area and production to be applied by governorates considering the specific objectives set for agriculture in the medium and long-term plans. These indications serve as reference to develop a plan for each governorate. They are discussed and reviewed at all administrative levels, down to the village, and eventually agreed upon by all concerned parties. Subsequently, all approved plans are submitted to the MAAR to be reviewed at the national level in cooperation with the General Peasant Union (GPU), the MI and the relevant MAAR departments. Finally, they are consolidated in a national plan and delivered to the Monitoring Committee chaired by the Minister of Agriculture, and then to the Prime Minister’s Office for endorsement (prior to 2002, the national plan was approved by the Supreme Agricultural Council). This process considers the irrigation capacity of each water basin, as estimated by the MI at the beginning of the agriculture season, as well as the water demand for each crop. As a consequence, the approved national plan serves as the reference for the issuance of agricultural licenses to individual and cooperative farmers. Licenses are permissions to plant specific crops on specific irrigated and rain-fed lands in compliance with the plan. If correctly implemented, they give access to Government credit, inputs and services. Therefore, farmers are legally bound to comply with these licenses and face, in theory, penalties if they deviate from dispositions without the approval of concerned Government agencies.
Subsequently, a comprehensive monitoring system ensures that the plan is adhered to and that farmers respect their obligation as stated in the licenses. It is initiated immediately after the issuance of agricultural licenses and is done periodically: daily, monthly, and seasonally. But, special treatment is undertaken when there are exceptional situations such as droughts and unforeseen epidemic diseases.
Finally, the AAPP, although indicative, determines to a large extent, the allocation of cultivable areas to specific crops, especially to the major strategic crops. Recently, however, it is set up according to the major groups of agricultural products instead of individual crops to expand farmers’ choice.
Source: Elaborated from NAPC, SOFAS 2007.
Table A3.6. Development of the official state prices, 1999-2008 (SP/kg)
Item Hard wheat
Soft wheat
Barley Maize Seed
cotton Sugar beet
Tobacco
1999 11.8 10.8 7.5 8 30.75 2.25 69.42 2000 11.8 10.8 7.5 8 30.75 2.25 59.95 2001 11.8 10.8 7.5 8 30.75 2.25 78.44 2002 11.8 10.8 12 8 30.75 2.25 80.98 2003 11.8 10.8 7.5 8 30.75 2.25 69.42 2004 11.8 10.8 7.5 8 30.75 2.25 80.98 2005 11.8 10.8 9 8 30.75 2.25 80.98 2006 11.8 10.8 9 8 30.75 2.25 93.5 2007 11.8 10.8 9 11 30.75 2.25 134.59 2008 17 16.5 15 17 41 3.75 110.55
Average 1 (1999-2001) 11.8 10.8 7.5 8 30.75 2.25 69.27 Average 2 (2003-2005) 11.8 10.8 8 8 30.75 2.25 77.13 Average 3 (2006-2008) 13.53 12.7 11 12 34.17 2.75 112.88 Average change 1 % (3/2)
14.7 17.6 37.5 50 11.1 22.2 46.4
Average change 2 % (3/1)
14.7 17.6 46.7 50 11.1 22.2 63
Source: Elaborated from MAAR, the AASA, various issues and CBS, the ASA, various issues.

State of Food and Agriculture in Syria 2010
225
Table A3.7. Development of some input prices, 1999-2009 (SP/kg) Item 1999 2000 2001 2002 2003 2004 2005 2006 2007 2008 2009
Hard wheat seeds 16 16 16 16 16 16 16 16 16 16 16 Soft wheat seeds 15 15 15 15 15 15 15 15 15 16 16 Seed cotton seeds 10 10 10 10 10 10 10 10 10.3 10.3 10.3 Seed cotton seeds without lint
11.9 11.9 11.9 11.9 11.9 11.9 12 12 12.3 12.3 12.3
Sugar beet seeds 280 265 260 250 320 320 425 425 460 555 555 Sugar beet seeds (single embryo)
5 3.7 3.7 3.7 4.2 4.2 5.2 5.2 5.2 5.2 5.2
Barley seeds 12.2 12.2 12.2 12 12 12 12 12.2 12.2 14.3 14 Chickpeas seeds 28 36 36 36 27 27.2 27.6 27.6 27.6 50 55 Lentils seeds 25 25 25 25 25 25 25 25 25 35 82 Sorghum seeds 15.5 15.5 15.5 15.5 15.5 15.5 Maize seeds 23 23 23 23 23.2 23.2 23.2 23.2 23.2 26 26 Local potato seeds 17 17 16 15.5 16 16 17 17 17.8 32 32 Imported potato seeds 12.5 12 12 12 12.5 12.5 12.5 13 20.5 22.4 22.3 Sunflower seeds 205 20 205 205 205 205 205 205 205 205 205 Source: Elaborated from NAPC database.
Table A3.7. Continued Item 1999 2000 2001 2002 2003 2004 2005 2006 2007 2008 2009
Soya beans seeds 25.5 25.5 25.5 25.5 25.5 25.5 25.5 25.5 25.5 25.5 25.5 Peanuts seeds 47.4 47.4 47.4 47.4 47.4 70 70 70 70 80 80 Broad beans seeds 22.5 22.5 22.5 22.5 23 23 23 23 23 51 50 Average fertilizer price 6.4 6.4 5.7 5.7 6.5 6.9 7.1 7.1 7.1 7.1 7.1 Imported nitrate fertilizer (33.5%)
6 6 5 5 5.6 6.5 6.5 6.5 6.5 6.5 6.5
Urea fertilizer (46%) 7.7 7.7 6.8 6.8 8.5 8.9 8.9 8.9 8.9 8.9 8.9 Supper phosphate fertilizer (46%)
8.3 8.3 8.2 8.2 8.2 8.2 8.2 8.2 8.2 8.2 8.2
Potash fertilizer (50%) 12.2 12.2 11.5 11.5 10.5 10.5 12.5 12.5 12.5 12.5 12.5 Cereals sack (empty) 35 37 37 37 50 50 50 50 50 50 50 Cotton sack (empty) 76 80 80 78.5 84 110 128 128 128 128 128

State of Food and Agriculture in Syria 2010
226
Table A3.8. Development of the reclaimed land by MAAR projects, 1999-2009 (ha)
Item Green Belt
Develop. Of
Fruit Trees
Develop. Of
Fruit Trees
in Quneitra
Development of Agriculture in
Co. and M. Areas
Development of Agriculture in
Southern Areas
Development of Agriculture
in Jabal Al-Hos Total
F C T F C T F C T F C T
1999 6,861 4,690 238 0 0 0 3,101 3,211 6,312 0 0 0 23,950 3,211 27,161 2000 5,909 4,548 212 0 0 0 2,776 2,721 5,497 0 0 0 22,141 2,721 24,862 2001 4,617 3,580 227 0 0 0 3,575 3,136 6,711 1,064 1,102 2,166 20,132 4,238 24,370 2002 3,205 0 305 338 265 603 1,241 464 1,705 388 3,733 4,121 10,495 4,462 14,957 2003 3,380 3,406 347 1,557 1,290 2,847 2,460 2,848 5,308 560 3,448 4,003 16,009 7,586 23,595 2004 5,186 0 293 5,469 2,376 7,845 2,522 2,709 5,231 684 3,379 4,063 19,715 8,464 28,179 2005 6,887 0 260 4,900 2,677 7,577 2,200 2,394 4,594 758 3,365 4,123 20,584 8,436 29,020 2006 5,225 2,954 170 4,487 2,347 6,834 1,701 1,975 3,677 1,671 1,802 3,473 19,528 6,124 25,652 2007 5,317 2,089 176 5,635 2,187 7,822 1,746 1,415 3,162 2,615 2,690 5,305 21,804 6,214 28,018 2008 4,377 3,544 0 3,540 1,702 5,242 1,784 1,796 3,580 617 2,629 3,246 17,432 6,127 23,559 2009 2,400 1,924 0 3,778 2,733 6,511 1,231 1,465 2,696 310 2,199 2,509 12,798 6,397 19,195
Average 1 (1999-2001)
5,796 4,273 226 0 0 0 3,151 3,023 6,173 355 367 722 22,074 3,390 25,464
Average 2 (2007-2009)
4,031 2,519 59 4,318 2,207 6,525 1,587 1,559 3,146 1,181 2,506 3,687 17,345 6,246 23,591
Average change % (2/1)
-30.4 -41.0 -74.0 -49.6 -48.4 -49.0 232.6 582.8 410.6 -21.4 84.2 -7.4
AAGR % (2/1)
-5.9 -8.4 -20.1 -10.8 -10.5 -10.6 22.2 37.7 31.2 -3.9 10.7 -1.3
Source: Elaborated from MAAR, the AASA, various issues. Develop: Development; Co: Coastal; M: Middle; F: Fruit trees; C: Crops; T: Total.

State of Food and Agriculture in Syria 2010
227
Table A3.9. Development of forestry activities, 1999-2009
Item Forestry
roads km
Industrial wood tonne
Fuel wood tonne
Charcoaltonne
Total Wood and Coal tonne
Forestry Seedlingsthousand
Artificial Forestation
ha
Forest Area
ha
1999 1,323 28,175 8,597 4,250 41,022 34,559 22,329 546,416 2000 1,265 33,749 8,551 3,355 45,655 37,768 22,798 556,867 2001 1,754 27,957 7,180 3,094 38,231 26,756 25,913 566,347 2002 1,453 32,001 7,579 2,878 42,458 22,998 19,053 575,281 2003 802 37,754 9,100 6,090 52,944 21,918 16,781 589,894 2004 519 51,441 12,668 6,869 70,978 20,976 11,850 593,354 2005 401 46,133 12,367 8,836 67,336 18,925 11,928 597,917 2006 550 48,451 13,702 3,525 65,678 20,720 10,471 600,972 2007 437 45,684 9,045 11,163 65,892 16,772 9,630 576,008 2008 393 40,422 14,955 1,074 56,451 13,563 9,633 578,801 2009 357 41,928 56,445 7,548 105,921 10,916 9,665 580,858
Average 1 (1999-2001)
1,447 29,960 8,109 3,566 41,636 33,028 23,680 556,543
Average 2 (2007-2009)
460 44,852 12,567 5,254 62,674 17,018 9,911 585,260
Average change % (2/1)
-68.2 49.7 55.0 47.3 50.5 -48.5 -58.1 5.2
AAGR % (2/1)
-17.4 7.0 7.6 6.7 7.1 -10.5 -13.5 0.8
Distribution by governorates in 2008 Al-Sweida 6 93 277 0 370 256 186 7,921
Dar'a 10 642 169 0 811 2,158 300 10,008
Al-Quneitra 0 0 18 0 18 205 34 3,322
Damascus 48 1,031 96 0 1,127 1,118 1,158 58,149
Homs 0 3,652 1,575 61 5,288 1,347 689 56,855
Hama 45 643 609 171 1,423 507 601 38,553
Al-Ghab 18 960 351 132 1,443 540 325 37,039
Idleb 46 1,841 1,113 262 3,216 1,235 1,181 79,758
Tartous 19 886 1,980 407 3,273 924 508 31,206
Lattakia 82 29,224 7,457 13 36,694 1,946 843 85,257
Aleppo 29 937 1,126 28 1,326 1,239 53,194
Al-Raqqa 0 78 33 0 677 947 16,311
Dair-Ezzor 5 253 7 0 418 185 8,600
Al-Hassake 85 181 145 0 908 1,437 92,628 Source: Elaborated from MAAR, the AASA, various issues.

State of Food and Agriculture in Syria 2010
228
Table A3.10. Development of the investment budget devoted to the MAAR over the 11th FYP , 2011-2015 (SP million)
Item Number of projects Total budget Ongoing projects 45 59,268.2 Extension, training and education projects 5 2,565.9 Rural development projects 14 15,319.0 Forestry projects 4 16,911.5 Al-Badia projects 1 1,060.0 Livestock projects 3 3,416.7 Control projects 4 2,943.6 Administrative services 5 2,432.0 Nutural resource management 7 2,585.4 Total central administration projects 38 47,234.0 Total MAAR commissions projects 3 10,067.8 GCASR 1 5,646 GCGMD 1 2,752.8 GCDFR 1 1,669.0 Production establishments projects 4 1,966.5 New projects 13 7,468.4 Total of the MAAR 58 66,736.6 Funds 2 208,263.4 Modern irrigation adoption fund 1 33,263.4 Agricultural production supporting fund 1 175,000.0 Total agricultural sector without the irrigation sector (MI) 275,000.0 Source: Elaborated from the MAAR.

State of Food and Agriculture in Syria 2010
229
Annex Four
Agricultural Production

State of Food and Agriculture in Syria 2010
230
Annex 4. Agricultural production
Table A4.1. Development of the cropped area by major groups of agricultural products, 1999-2009 (000 ha)
Item Field crops Vegetables Fruit trees Grand total
Total Irrigated Rain-fed Total Irrigated Rain-fed Total Irrigated Rain-fed Total Irrigated Rain-fed 1999 3,728 1,074 2,654 115 87 28 790 122 668 4,633 1,283 3,350 2000 3,771 1,127 2,645 117 85 31 800 122 678 4,688 1,334 3,354 2001 3,763 1,146 2,618 116 81 35 813 129 684 4,693 1,356 3,337 2002 3,726 1,176 2,551 146 115 31 817 136 681 4,690 1,427 3,263 2003 3,818 1,240 2,578 143 105 38 829 141 688 4,790 1,487 3,304 2004 3,862 1,310 2,552 170 129 42 847 145 702 4,879 1,583 3,296 2005 3,990 1,293 2,697 158 122 36 868 148 720 5,016 1,564 3,452 2006 3,815 1,254 2,562 158 119 40 899 155 744 4,873 1,528 3,345 2007 3,759 1,234 2,525 175 138 36 929 159 770 4,863 1,531 3,331 2008 3,647 1,206 2,441 170 135 35 950 172 778 4,767 1,513 3,255 2009 3,351 1,077 2,274 171 141 30 977 173 804 4,499 1,391 3,108
Average 1 (1999-2001) 3,754 1,116 2,639 116 84 31 801 124 677 4,671 1,324 3,347 Average 2 (2007-2009) 3,586 1,172 2,413 172 138 34 952 168 784 4,710 1,478 3,231 Average change % (2/1) -4.5 5.1 -8.6 48.3 63.6 7.4 18.9 35.1 15.9 0.8 11.6 -3.5 AAGR % (2/1) -0.8 0.8 -1.5 6.8 8.6 1.2 2.9 5.1 2.5 0.1 1.9 -0.6
Distribution by governorates in 2009 (ha) Al-Sweida 49,120 809 36,120 86,049
Dar'a 94,077 12,758 33,968 140,803 Al-Quneitra 14,613 1,085 6,462 22,160 Damascus 20,160 6,207 76,892 103,259
Homs 117,567 11,425 186,761 315,753 Hama 211,404 13,356 88,468 313,228
Al-Ghab 77,412 8,037 3,087 88,536 Idleb 185,670 27,013 146,817 359,500
Tartous 28,007 11,268 83,600 122,875 Lattakia 7,997 5,301 86,007 99,305 Aleppo 902,302 31,613 214,243 1,148,158
Al-Raqqa 358,610 20,041 12,122 390,773 Dair-Ezzor 189,696 13,207 2,224 205,127 Al-Hassake 1,093,773 9,483 1,044 1,104,300
Source: Elaborated from MAAR, the AASA, various issues.

State of Food and Agriculture in Syria 2010
231
Table A4.2. Development of the crop production by major groups of agricultural products, 1999-2009 (000 tonnes)
Item Field crops Vegetables Fruit trees Grand total
Total Irrigated Rain-fed Total Irrigated Rain-fed Total Irrigated Rain-fed Total Irrigated Rain-fed 1999 6,442 5,229 1,213 1,962 1,795 167 2,269 1,342 927 10,673 8,366 2,307 2000 6,858 5,618 1,240 1,965 1,790 176 2,866 1,446 1,420 11,689 8,854 2,836 2001 10,215 5,942 4,273 1,984 1,755 229 2,440 1,457 983 14,639 9,154 5,486 2002 9,376 6,617 2,758 2,666 2,398 267 2,803 1,385 1,419 14,844 10,400 4,444 2003 9,362 6,465 2,897 2,783 2,304 479 2,403 1,346 1,057 14,548 10,115 4,433 2004 8,678 6,762 1,916 3,086 2,623 463 2,931 1,484 1,447 14,695 10,869 3,826 2005 8,996 6,755 2,242 2,987 2,658 329 2,641 1,474 1,166 14,624 10,887 3,736 2006 9,744 6,947 2,797 2,919 2,677 242 3,421 1,703 1,718 16,084 11,327 4,757 2007 8,469 6,661 1,808 3,146 2,956 189 2,604 1,716 888 14,219 11,334 2,885 2008 5,461 5,021 440 2,876 2,717 159 3,067 1,829 1,237 11,404 9,567 1,836 2009 7,426 5,837 1,589 3,232 3,070 162 3,307 1,994 1,313 13,965 10,901 3,064
Average 1 (1999-2001) 7,838 5,596 2,242 1,970 1,780 191 2,525 1,415 1,110 12,334 8,791 3,543 Average 2 (2007-2009) 7,119 5,840 1,279 3,085 2,914 170 2,993 1,846 1,146 13,196 10,601 2,595 Average change % (2/1) -9.2 4.3 -43.0 56.6 63.7 -10.8 18.5 30.5 3.2 7.0 20.6 -26.8 AAGR % (2/1) -1.6 0.7 -8.9 7.8 8.6 -1.9 2.9 4.5 0.5 1.1 3.2 -5.1
Distribution by governorates in 2009 (tonnes) Al-Sweida 29,213 36,768 99,069 165,050
Dar'a 163,521 488,533 148,575 800,629 Al-Quneitra 27,180 74,432 21,369 122,981 Damascus 218,764 128,268 317,619 664,651
Homs 189,764 194,697 441,388 825,849 Hama 518,450 238,962 148,379 905,791
Al-Ghab 564,192 146,493 14,961 725,646 Idleb 537,085 418,886 326,208 1,282,179
Tartous 61,476 187,820 280,686 529,982 Lattakia 16,867 67,672 1,069,298 1,153,837 Aleppo 1,738,265 482,784 403,333 2,624,382
Al-Raqqa 879,755 463,630 21,073 1,364,458 Dair-Ezzor 848,294 174,034 10,425 1,032,753 Al-Hassake 1,633,947 128,777 4,359 1,767,083
Source: Elaborated from MAAR, the AASA, various issues.

State of Food and Agriculture in Syria 2010
232
Table A4.3. Development of the value of the agricultural production, 2000-2009 (SP million, %)
Item 2000 2001 2002 2003 2004 2005 2006 2007 2008 2009 Average 1 2000-2002
Average 2 2007-2009
AAGR % 2000-2009
At current prices Crop production 215,383 249,078 257,914 260,338 272,566 288,142 329,782 338,721 399,638 482,754 240,792 407,038 11.1 Cereals 39,209 70,744 62,511 66,356 59,457 65,774 73,653 56,922 44,882 89,732 57,488 63,845 2.1 Industrial crops 37,407 41,150 44,916 41,661 41,565 46,139 37,908 36,272 49,505 39,638 41,158 41,805 0.3 Fruits 65,692 64,435 73,606 69,241 83,706 75,849 114,267 97,323 142,708 166,888 67,911 135,640 14.8 Vegetables 18,713 22,291 23,567 28,046 29,265 31,053 36,649 69,764 73,020 75,698 21,524 72,827 27.6 Dry legumes 3,313 5,483 5,849 6,856 6,819 8,076 8,428 6,966 4,686 8,507 4,882 6,720 6.6 Pastoral 1,489 1,628 1,638 1,678 1,645 2,199 2,278 4,267 3,111 4,382 1,585 3,920 19.9 Others 49,560 43,347 45,827 46,500 50,109 59,052 56,599 67,207 81,726 97,909 46,245 82,281 12.2 Livestock production 121,716 125,171 130,706 136,480 146,862 164,219 176,756 224,084 250,526 295,636 125,864 256,749 15.3 Dairies 42,408 42,495 45,897 45,925 55,060 64,213 69,349 100,981 124,118 141,990 43,600 122,363 22.9 Meat 67,329 70,365 70,353 75,222 70,699 82,280 86,849 100,357 102,753 129,347 69,349 110,819 9.8 Eggs 6,365 6,687 8,302 8,623 13,339 9,312 11,343 13,368 15,000 14,875 7,118 14,414 15.2 Fish 1,264 1,275 1,365 1,584 1,595 1,698 1,717 2,038 1,918 1,855 1,301 1,937 8.3 Others 4,350 4,349 4,789 5,126 6,169 6,716 7,498 7,340 6,737 7,569 4,496 7,215 9.9 Grand total 337,099 374,249 388,619 396,818 419,428 452,361 506,538 562,805 650,164 778,390 366,656 663,786 12.6
At constant prices of 2000 Crop production 215,383 233,476 244,145 226,714 233,014 248,835 272,163 227,271 218,686 247,803 231,001 231,253 0.02 Cereals 39,209 71,493 63,594 67,932 58,863 62,224 68,880 52,324 29,331 51,157 58,099 44,271 -5.3 Industrial crops 37,407 36,504 37,414 32,711 30,567 37,304 28,762 30,641 33,050 27,499 37,108 30,397 -3.9 Fruits 65,692 49,453 68,380 53,654 67,824 59,717 85,570 54,531 67,729 73,884 61,175 65,381 1.3 Vegetables 18,713 20,340 22,173 24,460 23,864 25,229 26,908 28,342 30,188 28,980 20,409 29,170 7.4 Dry legumes 3,313 5,860 5,547 6,148 4,805 5,786 6,355 4,709 2,789 4,920 4,907 4,139 -3.3 Pastoral 1,489 1,551 1,457 1,503 1,439 1,493 1,594 1,867 1,361 1,704 1,499 1,644 1.9 Others 49,560 48,275 45,580 40,306 45,652 57,082 54,094 54,857 54,238 59,659 47,805 56,251 3.3 Livestock production 121,716 123,378 116,374 116,257 140,481 149,277 160,550 151,106 137,524 146,462 120,489 145,031 3.8 Dairies 42,408 42,941 45,882 49,439 57,229 62,031 67,016 63,542 57,560 57,172 43,744 59,425 6.3 Meat 67,329 68,319 56,182 52,027 65,901 71,939 75,827 70,752 65,378 73,734 63,943 69,955 1.8 Eggs 6,365 6,687 8,302 8,623 10,005 7,760 9,452 8,569 7,500 8,122 7,118 8,064 2.5 Fish 1,264 1,342 1,436 1,527 1,630 1,608 1,626 1,622 1,414 1,307 1,347 1,448 1.5 Others 4,350 4,089 4,572 4,641 5,716 5,939 6,629 6,621 5,672 6,127 4,337 6,140 7.2 Grand total 337,099 356,854 360,519 342,971 373,495 398,112 432,713 378,377 356,210 394,265 351,491 376,284 1.4 Source: Elaborated from CBS, the ASA, various issues.

State of Food and Agriculture in Syria 2010
233
Table A4.4. Development of the structure of the value of agricultural production by groups, 2000-2009 (%)
Item 2000 2001 2002 2003 2004 2005 2006 2007 2008 2009 Average 1 2000-2002
Average 2 2007-2009
ACH% 2000-2009
At current prices Crop production 100 100 100 100 100 100 100 100 100 100 100 100 Cereals 18.2 28.4 24.2 25.5 21.8 22.8 22.3 16.8 11.2 18.6 23.6 15.5 -34.2 Industrial crops 17.4 16.5 17.4 16.0 15.2 16.0 11.5 10.7 12.4 8.2 17.1 10.4 -39.0 Fruits 30.5 25.9 28.5 26.6 30.7 26.3 34.6 28.7 35.7 34.6 28.3 33.0 16.6 Vegetables 8.7 8.9 9.1 10.8 10.7 10.8 11.1 20.6 18.3 15.7 8.9 18.2 103.7 Dry legumes 1.5 2.2 2.3 2.6 2.5 2.8 2.6 2.1 1.2 1.8 2.0 1.7 -16.9 Pastoral 0.7 0.7 0.6 0.6 0.6 0.8 0.7 1.3 0.8 0.9 0.7 1.0 48.8 Others 23.0 17.4 17.8 17.9 18.4 20.5 17.2 19.8 20.5 20.3 19.4 20.2 4.1 Livestock production 100 100 100 100 100 100 100 100 100 100 100 100 Dairies 34.8 33.9 35.1 33.6 37.5 39.1 39.2 45.1 49.5 48.0 34.6 47.5 37.3 Meat 55.3 56.2 53.8 55.1 48.1 50.1 49.1 44.8 41.0 43.8 55.1 43.2 -21.7 Eggs 5.2 5.3 6.4 6.3 9.1 5.7 6.4 6.0 6.0 5.0 5.6 5.7 0.4 Fish 1.0 1.0 1.0 1.2 1.1 1.0 1.0 0.9 0.8 0.6 1.0 0.8 -25.8 Others 3.6 3.5 3.7 3.8 4.2 4.1 4.2 3.3 2.7 2.6 3.6 2.8 -20.4 Grand total
At constant prices of 2000 Crop production 100 100 100 100 100 100 100 100 100 100 100 100 Cereals 18.2 30.6 26.0 30.0 25.3 25.0 25.3 23.0 13.4 20.6 25.0 19.0 -23.8 Industrial crops 17.4 15.6 15.3 14.4 13.1 15.0 10.6 13.5 15.1 11.1 16.1 13.2 -17.9 Fruits 30.5 21.2 28.0 23.7 29.1 24.0 31.4 24.0 31.0 29.8 26.6 28.3 6.4 Vegetables 8.7 8.7 9.1 10.8 10.2 10.1 9.9 12.5 13.8 11.7 8.8 12.7 43.4 Dry legumes 1.5 2.5 2.3 2.7 2.1 2.3 2.3 2.1 1.3 2.0 2.1 1.8 -15.6 Pastoral 0.7 0.7 0.6 0.7 0.6 0.6 0.6 0.8 0.6 0.7 0.7 0.7 9.2 Others 23.0 20.7 18.7 17.8 19.6 22.9 19.9 24.1 24.8 24.1 20.8 24.3 17.1 Livestock production 100 100 100 100 100 100 100 100 100 100 100 100 Dairies 34.8 34.8 39.4 42.5 40.7 41.6 41.7 42.1 41.9 39.0 36.4 41.0 12.7 Meat 55.3 55.4 48.3 44.8 46.9 48.2 47.2 46.8 47.5 50.3 53.0 48.2 -9.0 Eggs 5.2 5.4 7.1 7.4 7.1 5.2 5.9 5.7 5.5 5.5 5.9 5.6 -6.3 Fish 1.0 1.1 1.2 1.3 1.2 1.1 1.0 1.1 1.0 0.9 1.1 1.0 -10.9 Others 3.6 3.3 3.9 4.0 4.1 4.0 4.1 4.4 4.1 4.2 3.6 4.2 17.3 Grand total Source: Elaborated from CBS, the ASA, various issues. ACH: Average change.

State of Food and Agriculture in Syria 2010
234
Table A4.5. Development of the structure of the value of agricultural production in relation to the total value, 2000-2009 (%)
Item 2000 2001 2002 2003 2004 2005 2006 2007 2008 2009 Average 1 2000-2002
Average 2 2007-2009
ACH% 2000-2009
At current prices Crop production 63.9 66.6 66.4 65.6 65.0 63.7 65.1 60.2 61.5 62.0 65.6 61.2 -6.7 Cereals 11.6 18.9 16.1 16.7 14.2 14.5 14.5 10.1 6.9 11.5 15.5 9.5 -38.8 Industrial crops 11.1 11.0 11.6 10.5 9.9 10.2 7.5 6.4 7.6 5.1 11.2 6.4 -43.1 Fruits 19.5 17.2 18.9 17.4 20.0 16.8 22.6 17.3 21.9 21.4 18.5 20.2 9.1 Vegetables 5.6 6.0 6.1 7.1 7.0 6.9 7.2 12.4 11.2 9.7 5.9 11.1 89.8 Dry legumes 1.0 1.5 1.5 1.7 1.6 1.8 1.7 1.2 0.7 1.1 1.3 1.0 -22.8 Pastoral 0.4 0.4 0.4 0.4 0.4 0.5 0.4 0.8 0.5 0.6 0.4 0.6 38.6 Others 14.7 11.6 11.8 11.7 11.9 13.1 11.2 11.9 12.6 12.6 12.7 12.4 -2.6 Livestock production 36.1 33.4 33.6 34.4 35.0 36.3 34.9 39.8 38.5 38.0 34.4 38.8 12.7 Dairies 12.6 11.4 11.8 11.6 13.1 14.2 13.7 17.9 19.1 18.2 11.9 18.4 54.6 Meat 20.0 18.8 18.1 19.0 16.9 18.2 17.1 17.8 15.8 16.6 19.0 16.8 -11.6 Eggs 1.9 1.8 2.1 2.2 3.2 2.1 2.2 2.4 2.3 1.9 1.9 2.2 13.5 Fish 0.4 0.3 0.4 0.4 0.4 0.4 0.3 0.4 0.3 0.2 0.4 0.3 -16.1 Others 1.3 1.2 1.2 1.3 1.5 1.5 1.5 1.3 1.0 1.0 1.2 1.1 -10.1 Grand total 100 100 100 100 100 100 100 100 100 100 100 100
At constant prices of 2000 Crop production 63.9 65.4 67.7 66.1 62.4 62.5 62.9 60.1 61.4 62.9 65.7 61.4 -6.5 Cereals 11.6 20.0 17.6 19.8 15.8 15.6 15.9 13.8 8.2 13.0 16.4 11.7 -28.9 Industrial crops 9.5 8.2 9.4 6.6 8.1 9.4 11 8.1 9.3 7 9.0 8.1 -10.0 Fruits 15.6 18.2 15 19.8 14.4 19.3 17 14.4 19 18.7 16.3 17.4 6.8 Vegetables 7.1 6.4 6.3 6.2 7.5 8.6 6 7.5 8.5 7.4 6.6 7.8 18.2 Dry legumes 1.8 1.3 1.5 1.5 1.2 0.8 1 1.2 0.8 1.2 1.5 1.1 -30.4 Pastoral 0.4 0.4 0.4 0.4 0.5 0.4 0 0.5 0.4 0.4 0.4 0.4 8.3 Others 11.8 12.2 14.3 12.5 14.5 15 14 14.5 15.2 15.1 12.8 14.9 17.0 Livestock production 36.1 36.6 34.5 34.5 41.7 44.3 47.6 44.8 40.8 43.4 35.7 43.0 20.4 Dairies 12.6 12.0 12.7 14.4 15.3 15.6 15.5 16.8 16.2 14.5 12.4 15.8 27.1 Meat 20.0 19.1 15.6 15.2 17.6 18.1 17.5 18.7 18.4 18.7 18.2 18.6 1.9 Eggs 1.9 1.9 2.3 2.5 2.7 1.9 2.2 2.3 2.1 2.1 2.0 2.1 6.0 Fish 0.4 0.4 0.4 0.4 0.4 0.4 0.4 0.4 0.4 0.3 0.4 0.4 0.7 Others 1.3 1.1 1.3 1.4 1.5 1.5 1.5 1.7 1.6 1.6 1.2 1.6 32.2 Grand total 100 100 100 100 100 100 100 100 100 100 100 100 Source: Elaborated from CBS, the ASA, various issues.

State of Food and Agriculture in Syria 2010
235
Table A4.6. Development of the average cropped area by crops, 1999-2009 (ha, %)
Item 1999 2000 2001 2002 2003 2004 2005 2006 2007 2008 2009 AAGR% 1999-2009
Total field crops 3,728,348 3,771,301 3,763,326 3,726,319 3,818,304 3,861,946 3,989,828 3,815,158 3,758,855 3,647,274 3,350,408 -0.8 Total cereals 3,071,093 3,054,695 3,054,155 2,974,213 3,116,679 3,182,395 3,286,262 3,143,430 3,084,683 2,992,045 2,772,138 -0.6 Food cereals 1,603,020 1,678,797 1,683,784 1,679,350 1,796,015 1,831,226 1,903,826 1,786,659 1,667,732 1,485,991 1,437,375 -1.3 Wheat 1,603,020 1,678,797 1,683,784 1,679,350 1,796,015 1,831,226 1,903,826 1,786,659 1,667,732 1,485,991 1,437,375 -1.3 Soft wheat 706,783 756,574 800,361 847,419 952,307 982,571 1,103,050 1,025,874 963,748 883,278 896,173 3.3 Durum wheat 896,237 922,223 883,423 831,931 843,708 848,655 800,776 760,785 703,984 602,713 541,202 -6.1 Feed cereals (dry) 1,468,073 1,375,898 1,370,371 1,294,863 1,320,664 1,351,169 1,382,436 1,356,771 1,416,951 1,506,054 1,334,763 0.2 Barley 1,414,227 1,316,893 1,302,761 1,234,010 1,253,584 1,290,574 1,327,195 1,307,371 1,362,773 1,433,215 1,290,220 0.2 Maize 49,831 55,316 63,794 57,267 61,946 56,516 50,955 45,232 50,360 70,858 41,848 -0.6 Sorghum 3,851 3,522 3,712 3,579 5,133 3,990 4,285 4,165 3,817 1,975 2,684 -4.4 Oats 164 167 104 7 1 89 1 3 1 6 11 -41.2 Legumes (dry) 237,766 268,734 291,824 285,844 294,667 266,368 285,089 267,388 283,819 265,795 214,956 -0.7 Food legumes (dry) 206,760 232,426 243,957 241,443 258,120 234,595 250,287 232,421 252,901 238,546 196,743 0.1 Lentils 147,641 122,774 139,091 121,156 138,847 137,419 142,803 150,082 149,142 135,740 100,721 -1.0 Chickpeas 50,644 101,434 87,134 102,161 99,537 75,820 86,318 62,525 85,590 75,779 73,797 -0.3 Dry broad beans 7,395 6,931 15,109 15,509 16,396 17,809 16,374 14,289 14,708 22,298 17,461 10.8 Dry haricot beans 1,027 1,196 1,200 1,136 2,170 1,288 1,346 1,147 675 546 637 -9.7 Dry peas 53 91 1,423 1,481 1,170 2,259 3,446 4,378 2,787 4,184 4,127 38.6 Feed legumes (dry) 31,006 36,308 47,867 44,401 36,547 31,773 34,802 34,967 30,918 27,250 18,213 -6.6 Bitter vetch 7,013 9,638 9,544 12,410 9,894 9,879 6,955 5,572 5,230 4,343 3,278 -11.2 Flowering sern 11,470 12,841 20,080 14,876 7,164 7,928 13,600 15,187 14,003 12,980 5,669 -5.0 Rambling vetch 12,523 13,829 18,243 17,115 19,489 13,966 14,247 14,208 11,685 9,927 9,266 -5.9 Grazing crops * 75,854 78,907 46,063 51,200 47,490 50,512 52,569 55,835 59,342 72,621 91,992 1.8 Grazing barley 56,983 59,374 23,917 36,583 37,677 38,301 32,539 39,251 41,892 56,851 67,325 2.9 Grazing flowering 10,018 11,211 14,531 6,883 3,253 5,364 7,890 4,205 4,675 4,696 2,581 -16.7 Grazing maize 2,502 2,494 3,252 2,534 1,734 2,441 8,254 7,934 7,966 7,328 17,469 25.8 Grazing alfalfa 3,888 3,849 3,417 4,225 3,764 3,103 2,623 2,744 3,062 2,809 2,486 -4.7 Grazing clover 208 468 256 282 452 409 615 489 568 325 429 6.0 Other grazing crops 2,255 1,511 690 693 611 894 648 1,212 1,179 612 1,702 -4.0 Source: Elaborated from MAAR, the AASA, various issues. *Green fodder.

State of Food and Agriculture in Syria 2010
236
Table A4.6. Continued
Item 1999 2000 2001 2002 2003 2004 2005 2006 2007 2008 2009 AAGR% 1999-2009
Industrial crops 342,562 367,668 370,770 413,748 358,537 362,300 364,609 347,907 330,490 316,154 271,322 -2.7 Sugar beet 29,953 27,474 26,600 29,597 28,213 27,590 25,999 32,562 28,192 29,525 15,463 -2.3 Seed cotton 243,835 270,290 257,063 199,773 205,360 234,181 237,768 215,640 192,790 176,449 163,712 -6.0 Soya beans 3,161 2,787 2,419 2,653 1,877 1,819 2,313 1,850 1,267 642 1,006 -16.1 Oily sunflower 417 257 1,491 1,115 947 514 514 333 369 188 113 -17.8 Indian millet 352 699 1,440 238 427 122 369 284 660 41 103 -17.2 Sunflower 7,288 3,327 6,300 5,628 7,273 7,247 9,122 8,302 11,556 6,707 6,881 6.8 Tobacco 16,163 16,726 16,339 15,811 15,482 16,085 16,272 15,896 14,227 13,817 12,674 -3.1 Peanuts 12,964 10,260 10,446 6,661 5,231 6,535 7,871 5,743 7,240 6,241 5,108 -9.4 Sesame 5,633 6,400 5,327 13,262 12,780 8,557 6,296 7,235 5,174 4,445 5,714 -2.0 Aniseeds 1,381 1,422 1,383 1,235 1,181 1,649 1,795 2,170 2,010 2,465 2,193 8.1 Cumin 21,136 25,912 40,418 133,843 77,523 55,151 53,558 54,677 60,950 61,430 52,837 12.3 Lupines 51 59 49 63 71 25 5 8 10 15 14 -20.9 Black cumin 228 2,056 1,495 3,869 2,173 2,825 2,727 3,207 6,046 14,190 4,919 37.2 Other industrial crops 1,073 1,298 514 1,314 931 371 1,299 598 521 659 584 -7.9 Vegetables 114,804 116,542 115,959 146,301 142,956 170,214 158,022 158,471 174,526 170,269 171,603 6.8 Green peas 2,235 2,553 2,967 3,902 3,418 4,006 2,713 2,377 3,495 3,141 1,970 1.8 Green broad beans 4,402 4,054 4,984 5,280 5,311 4,892 5,224 5,648 5,094 6,043 4,845 2.9 Green haricot beans 3,332 2,929 3,092 3,718 2,522 3,212 5,507 3,137 3,299 3,096 3,547 1.0 Green kidney beans 978 945 1,818 1,648 1,591 1,705 1,745 1,761 1,376 1,129 1,121 -0.5 Cucumber and snake cucumber 6,810 6,783 6,291 9,735 10,535 11,746 10,310 10,435 11,351 10,269 10,449 8.3 Eggplants 5,142 5,763 5,057 6,128 6,178 7,462 7,162 7,629 7,199 8,081 7,352 6.0 Pumpkins 2,122 2,851 3,375 2,923 2,920 4,198 3,614 4,011 4,243 5,635 2,528 6.8 Lettuce 2,355 2,092 1,732 2,217 2,385 3,165 2,350 2,522 2,752 2,690 2,453 4.2 Green onion 2,900 3,043 3,009 3,961 2,750 2,888 2,964 3,296 3,195 3,654 4,517 4.1 Leaf beat 1,092 1,029 876 1,124 1,077 972 632 851 908 938 793 -2.1 Cauliflower 2,559 1,479 1,505 1,678 1,589 1,467 2,240 1,619 1,708 1,570 1,780 -1.5 Cabbages 2,860 2,042 1,898 2,428 1,836 1,712 2,446 1,790 1,734 2,101 2,221 -1.9 Potatoes 24,779 22,783 21,243 24,102 24,789 27,304 29,347 27,766 31,083 36,172 34,855 6.8 Field tomatoes 13,596 17,656 15,820 16,602 14,332 14,655 12,615 14,507 15,235 15,695 13,919 -0.8 Dry onion 4,734 4,355 4,610 5,429 4,668 5,456 6,797 5,854 5,309 6,273 5,007 3.2 Green pepper 2,360 2,845 2,928 2,827 3,115 2,993 4,093 3,852 4,703 4,382 3,484 7.5 Okra 3,460 3,842 4,460 3,688 5,656 5,815 4,785 6,857 5,427 6,290 5,124 6.2

State of Food and Agriculture in Syria 2010
237
Table A4.6. Continued
Item 1999 2000 2001 2002 2003 2004 2005 2006 2007 2008 2009 AAGR%
99-09 Vegetables (continued) Squash 5,186 4,071 3,530 5,394 4,346 5,269 8,839 4,365 5,616 5,349 6,484 5.3 Dry garlic 2,239 2,263 2,706 2,803 4,320 3,806 4,917 4,509 4,086 4,207 3,650 8.8 Water melon 11,575 13,602 13,160 23,202 24,856 33,216 22,373 28,772 33,531 24,028 34,477 15.7 Musk melon 5,215 4,627 6,045 9,739 7,439 6,456 7,161 8,007 12,092 6,379 7,346 8.4 Other vegetables 4,873 4,935 4,853 7,773 7,323 17,819 10,188 8,906 11,091 13,147 13,682 17.2 Fruit trees 789,624 800,232 813,302 817,172 828,893 846,833 868,003 899,262 929,497 949,854 977,815 2.9 Olives 469,857 477,993 488,957 501,468 516,950 531,391 544,652 564,939 600,498 617,060 635,690 4.3 Grapes 69,874 69,288 68,816 54,312 52,037 51,277 53,977 55,743 54,751 54,714 55,861 -3.8 Apples 48,660 49,375 49,478 46,624 43,406 45,083 45,214 46,547 46,544 47,360 49,918 -0.4 Pistachios 59,137 58,839 58,472 57,589 57,261 56,911 56,896 56,728 56,607 56,152 56,117 -0.7 Citrus 27,001 27,418 28,214 28,181 29,279 31,209 31,870 33,794 35,960 37,521 38,383 5.2 Pomegranates 6,607 6,465 6,330 5,633 5,318 4,373 4,336 4,322 4,344 4,354 4,353 -6.4 Apricots 12,399 12,420 12,500 12,612 12,879 13,081 13,330 13,944 13,664 13,561 13,563 1.5 Cherries 21,011 21,483 22,512 22,562 23,819 24,262 24,772 25,436 26,045 26,533 27,074 3.4 Almonds 39,881 41,581 41,713 55,826 57,334 57,991 61,296 65,980 58,753 60,088 64,226 6.8 Green plums 1,540 1,521 1,566 1,561 1,554 1,531 1,527 1,646 1,706 1,716 1,648 1.5 Plums 2,628 2,660 2,782 2,570 2,413 2,700 2,963 3,133 3,307 3,483 3,627 4.3 Pears 5,720 5,834 5,825 4,974 4,228 4,086 3,998 4,072 4,081 4,115 4,053 -5.7 Quince 928 905 880 574 523 543 522 512 521 515 502 -9.0 Peaches 5,300 5,326 5,609 6,238 5,868 6,312 6,515 6,588 6,661 6,825 6,875 3.8 Nuts 4,656 4,765 5,337 3,632 3,278 3,389 3,279 3,264 3,246 3,233 3,314 -6.6 Figs 10,729 10,650 10,744 10,071 9,960 9,814 9,968 9,746 9,796 9,650 9,663 -1.6 Loquats 105 107 110 88 73 68 70 68 85 96 88 -3.0 Palms 1,000 1,009 1,037 435 350 353 355 355 358 349 369 -15.9 Other trees 2,591 2,593 2,421 2,222 2,363 2,459 2,463 2,445 2,572 2,529 2,492 0.0 Total cropped area 4,632,776 4,688,075 4,692,587 4,689,792 4,790,153 4,878,993 5,015,853 4,872,891 4,862,878 4,767,397 4,499,826 0.1

State of Food and Agriculture in Syria 2010
238
Table A4.7. Development of the irrigated cropped area by crops, 1999-2008 (ha, %)
Item 1999 2000 2001 2002 2003 2004 2005 2006 2007 2008 AAGR% 1999-2008
Total field crops 1,074,468 1,126,633 1,145,560 1,175,803 1,240,435 1,309,594 1,293,129 1,253,584 1,234,033 1,206,004 2.0 Total cereals 725,072 758,424 783,112 858,832 917,431 957,407 928,207 907,106 906,270 884,190 3.5 Food cereals 669,937 694,469 682,786 752,524 814,533 857,463 855,876 810,127 791,358 730,334 2.6 Wheat 669,937 694,469 682,786 752,524 814,533 857,463 855,876 810,127 791,358 730,334 2.6 Soft wheat 267,719 318,037 293,525 351,075 407,810 433,092 460,310 445,498 438,344 430,202 8.4 Durum wheat 402,218 376,432 389,261 401,449 406,723 424,371 395,566 364,629 353,014 300,132 -2.7 Feed cereals (dry) 55,135 63,955 100,326 106,308 102,898 99,944 72,331 96,979 114,912 153,856 10.8 Barley 5,266 8,542 36,418 48,771 40,957 43,214 20,592 51,206 63,428 82,752 31.5 Maize 49,825 55,310 63,763 57,225 61,797 56,497 50,899 45,214 50,355 70,811 -0.3 Sorghum 44 103 145 312 144 233 840 559 1,129 293 46.7 Oats 0 0 0 0 0 0 0 0 0 0 0 Legumes (dry) 7,878 7,616 16,743 16,603 17,896 17,728 17,962 16,494 18,615 26,094 13.7 Food legumes (dry) 6,483 7,271 12,911 14,947 17,177 17,501 17,467 16,083 18,315 25,813 17.7 Lentils 214 400 813 612 258 353 326 48 2,571 1,938 26.1 Chickpeas 218 488 475 1,051 1,054 734 482 786 1,647 3,202 36.7 Dry broad beans 4,984 5,144 9,979 11,996 13,491 14,149 13,286 11,191 11,807 18,301 15.5 Dry haricot beans 1,027 1,196 1,200 1,128 2,145 1,274 1,343 1,138 660 534 -7.4 Dry peas 40 43 444 160 229 991 2,030 2,920 1,631 1,839 64.7 Feed legumes (dry) 1,395 345 3,832 1,656 719 227 495 411 301 281 -29.2 Bitter vetch 0 0 0 0 0 0 0 0 0 16 Flowering sern 1,264 284 3,567 1,656 719 227 339 333 295 255 -29.6 Rambling vetch 131 61 265 0 0 0 156 78 6 10 -27.1 Grazing crops * 36,340 36,674 32,820 41,868 45,110 44,867 50,109 53,701 56,325 60,164 10.0 Grazing barley 24,317 24,150 20,423 32,416 37,027 34,632 32,078 38,772 41,462 46,825 13.0 Grazing flowering 4,912 5,603 7,278 3,407 2,409 4,826 6,997 3,381 3,177 2,740 -12.2 Grazing maize 760 1,093 756 908 956 1,115 7,148 7,262 7,154 7,024 52.4 Grazing alfalfa 3,888 3,849 3,417 4,225 3,764 3,103 2,623 2,744 3,062 2,809 -5.0 Grazing clover 208 468 256 282 452 409 615 489 568 317 8.1 Other grazing crops 2,255 1,511 690 630 503 782 648 1,053 902 449 -11.6 Source: Elaborated from MAAR, the AASA, various issues. *Green fodder.

State of Food and Agriculture in Syria 2010
239
Table A4.7. Continued
Item 1999 2000 2001 2002 2003 2004 2005 2006 2007 2008 AAGR% 1999-2008
Industrial crops 305,166 323,828 312,773 257,794 259,412 289,276 296,037 275,872 252,495 235,127 -4.1 Sugar beet 29,953 27,474 26,600 29,597 28,213 27,590 25,999 32,562 28,192 29,525 1.4 Seed cotton 243,835 270,290 257,063 199,773 205,360 234,181 237,768 215,640 192,790 176,449 -5.4 Soya beans 3,161 2,787 2,419 2,653 1,877 1,819 2,313 1,850 1,267 642 -14.8 Oily sunflower 417 257 1,491 1,111 947 514 494 316 369 188 -16.6 Indian millet 129 323 133 37 145 83 338 242 627 20 8.7 Sunflower 5,809 1,745 4,662 4,748 6,404 6,046 8,565 7,574 10,544 6,001 14.6 Tobacco 5,853 5,795 5,592 4,896 5,110 5,352 5,417 4,869 4,332 3,895 -5.4 Peanuts 12,964 10,260 10,446 6,661 5,231 6,460 7,871 5,743 7,240 6,241 -10.6 Sesame 1,803 3,150 2,005 3,264 3,563 4,271 4,120 4,250 3,550 3,775 10.7 Aniseeds 1,098 1,358 1,361 1,232 1,172 1,632 1,765 2,131 1,975 2,433 11.4 Cumin 144 378 942 3,710 1,367 1,287 884 574 843 785 8.5 Lupines 0 0 0 0 0 0 0 0 0 1 Black cumin 0 11 59 112 23 41 503 121 767 5,172 144.0 Other industrial crops 12 91 112 706 586 316 814 411 328 429 40.3 Vegetables 86,794 85,212 81,063 115,261 104,932 128,532 122,378 118,871 138,384 134,996 9.2 Green peas 2,006 2,212 2,656 3,612 3,113 3,584 2,459 1,595 2,556 2,450 -0.8 Green broad beans 2,906 2,351 3,481 4,009 4,165 3,256 3,857 4,254 3,797 4,460 7.4 Green haricot beans 3,328 2,920 3,083 3,674 2,484 3,171 5,468 3,129 3,280 3,023 0.2 Green kidney beans 249 199 795 411 449 562 836 921 676 794 14.0 Cucumber and snake cucumber 5,061 4,675 4,347 6,485 6,106 6,713 5,638 4,982 6,355 6,027 4.3 Eggplants 5,142 5,763 5,057 6,128 6,178 7,459 7,162 7,629 7,199 8,078 7.5 Pumpkins 216 318 172 325 201 144 149 386 222 988 17.7 Lettuce 1,964 1,677 1,433 1,878 2,053 2,339 2,162 2,209 2,530 2,398 7.1 Green onion 1,958 2,061 1,990 3,219 1,842 1,931 2,139 2,236 2,212 2,602 3.2 Leaf beat 825 770 674 841 727 641 476 672 722 766 -1.0 Cauliflower 2,544 1,462 1,489 1,664 1,576 1,461 2,236 1,614 1,694 1,544 -2.5 Cabbages 2,816 1,999 1,856 2,384 1,772 1,673 2,412 1,741 1,620 1,977 -4.4 Potatoes 24,251 22,299 20,891 23,692 24,440 27,008 29,011 27,449 30,797 35,890 6.9 Field tomatoes 9,751 13,338 9,966 12,380 10,925 11,979 10,484 11,931 13,402 13,284 3.2 Dry onion 4,083 3,710 4,028 5,037 4,176 4,928 5,904 4,464 4,648 5,282 4.0 Green pepper 2,360 2,845 2,928 2,827 3,115 2,992 4,028 3,852 4,614 4,375 9.6 Okra 1,198 1,598 1,090 1,206 2,102 1,854 1,712 2,112 1,808 2,624 11.0

State of Food and Agriculture in Syria 2010
240
Table A4.7. Continued
Item 1999 2000 2001 2002 2003 2004 2005 2006 2007 2008 AAGR% 1999-2008
Vegetables (continued) Squash 4,490 3,971 3,373 5,162 4,208 5,136 8,759 4,256 5,302 5,127 4.4 Dry garlic 1,638 1,697 2,187 2,238 3,808 3,280 4,356 3,900 3,596 3,726 15.2 Water melon 4,774 4,597 4,572 16,377 13,011 20,741 13,499 20,024 26,974 19,111 36.5 Musk melon 1,343 1,311 1,841 6,867 2,858 2,326 2,216 2,935 7,514 2,828 24.2 Other vegetables 3,891 3,439 3,154 4,846 5,623 15,354 7,415 6,580 6,867 7,641 15.0 Fruit trees 121,948 122,489 129,383 135,810 141,153 144,540 148,321 155,225 159,040 171,695 5.4 Olives 28,584 28,994 32,254 40,935 46,799 47,060 49,910 51,616 53,457 63,902 13.5 Grapes 10,705 10,341 10,498 9,623 8,468 8,930 8,597 9,932 9,956 9,925 -1.1 Apples 16,734 16,928 17,064 16,569 15,143 15,676 15,630 16,490 16,216 16,317 -0.7 Pistachios 2,608 2,739 5,308 5,643 6,178 6,051 6,109 5,887 5,908 5,934 10.7 Citrus 26,907 27,338 28,129 28,094 29,193 31,047 31,711 33,633 35,799 37,363 5.3 Pomegranates 5,755 5,611 5,465 4,968 4,811 3,972 3,962 3,952 3,951 3,978 -6.7 Apricots 9,258 9,133 9,077 9,453 10,132 10,481 10,725 11,334 11,058 11,073 4.0 Cherries 1,815 1,828 1,834 1,854 2,840 2,979 3,008 3,224 3,014 3,018 11.1 Almonds 762 670 669 1,448 1,717 1,670 1,717 2,027 2,248 2,300 25.6 Green plums 1,462 1,443 1,499 1,493 1,402 1,457 1,469 1,577 1,636 1,640 2.0 Plums 1,943 1,931 2,026 1,928 1,706 1,888 1,968 2,046 2,129 2,259 1.7 Pears 2,969 2,957 2,933 2,368 2,247 2,287 2,288 2,353 2,330 2,335 -4.6 Quince 689 672 651 398 380 363 365 354 354 347 -12.1 Peaches 4,363 4,333 4,580 5,242 5,195 5,679 5,847 5,898 6,002 6,193 6.4 Nuts 3,619 3,622 3,649 2,570 2,216 2,250 2,233 2,155 2,101 2,235 -9.8 Figs 872 814 806 999 481 434 439 406 395 394 -13.7 Loquats 68 68 65 65 56 56 57 61 75 85 1.9 Palms 786 793 822 427 343 347 348 348 352 349 -15.3 Other trees 2,049 2,274 2,054 1,733 1,845 1,913 1,938 1,932 2,059 2,049 -1.1 Total cropped area 1,283,210 1,334,334 1,356,006 1,426,874 1,486,520 1,582,666 1,563,828 1,527,680 1,531,457 1,512,695 2.8

State of Food and Agriculture in Syria 2010
241
Table A4.8. Development of the rain-fed (non-irrigated) cropped area by crops, 1999-2008 (ha, %)
Item 1999 2000 2001 2002 2003 2004 2005 2006 2007 2008 AAGR% 1999-2008
Total field crops 2,653,880 2,644,668 2,617,766 2,550,516 2,577,869 2,552,352 2,696,699 2,561,574 2,524,822 2,441,270 -1.0 Total cereals 2,346,021 2,296,271 2,271,043 2,115,380 2,199,248 2,224,904 2,358,055 2,236,325 2,178,413 2,107,854 -1.2 Food cereals 933,083 984,328 1,000,998 926,826 981,482 973,763 1,047,950 976,532 876,374 755,657 -2.2 Wheat 933,083 984,328 1,000,998 926,826 981,482 973,763 1,047,950 976,532 876,374 755,657 -2.2 Soft wheat 439,064 438,537 506,836 496,344 544,497 549,479 642,740 580,376 525,404 453,076 2.4 Durum wheat 494,019 545,791 494,162 430,482 436,985 424,284 405,210 396,156 350,970 302,581 -7.3 Feed cereals (dry) 1,412,938 1,311,943 1,270,045 1,188,554 1,217,766 1,251,141 1,310,105 1,259,793 1,302,039 1,352,197 -0.4 Barley 1,408,961 1,308,351 1,266,343 1,185,239 1,212,627 1,247,360 1,306,603 1,256,165 1,299,345 1,350,463 -0.4 Maize 6 6 31 42 149 19 56 18 5 46 9.9 Sorghum 3,807 3,419 3,567 3,267 4,989 3,756 3,445 3,607 2,688 1,682 -5.9 Oats 164 167 104 6 1 6 1 3 1 6 -53.0 Legumes (dry) 229,888 261,118 275,081 269,241 276,770 248,512 267,127 250,894 265,203 239,702 -0.3 Food legumes (dry) 200,277 225,155 231,046 226,496 240,942 217,094 232,820 216,338 234,586 212,733 0.2 Lentils 147,427 122,374 138,278 120,544 138,589 137,066 142,477 150,034 146,571 133,802 1.1 Chickpeas 50,426 100,946 86,659 101,110 98,483 75,086 85,836 61,739 83,943 72,577 -1.7 Dry broad beans 2,411 1,787 5,130 3,513 2,904 3,660 3,088 3,098 2,901 3,997 1.4 Dry haricot beans 0 0 0 8 25 14 3 9 15 12 Dry peas 13 48 979 1,321 941 1,268 1,416 1,458 1,156 2,345 36.7 Feed legumes (dry) 29,611 35,963 44,035 42,745 35,828 31,418 34,307 34,556 30,617 26,969 -3.4 Bitter vetch 7,013 9,638 9,544 12,410 9,894 9,879 6,955 5,572 5,230 4,327 -10.4 Flowering sern 10,206 12,557 16,513 13,220 6,445 7,701 13,261 14,854 13,708 12,725 1.0 Rambling vetch 12,392 13,768 17,978 17,115 19,489 13,838 14,091 14,130 11,679 9,917 -4.1 Grazing crops * 39,514 42,233 13,243 9,332 2,371 5,646 2,460 2,134 3,018 12,457 -28.6 Grazing barley 32,666 35,224 3,494 4,167 650 3,670 461 479 430 10,026 -31.3 Grazing flowering 5,106 5,608 7,253 3,476 844 538 893 824 1,498 1,956 -24.9 Grazing maize 1,742 1,401 2,496 1,626 769 1,326 1,106 672 813 304 -20.5 Grazing alfalfa 0 0 0 0 0 0 0 0 0 0 Grazing clover 0 0 0 0 0 0 0 0 0 8 Other grazing crops 0 0 0 63 108 112 0 159 277 163 Source: Elaborated from MAAR, the AASA, various issues. *Green fodder.

State of Food and Agriculture in Syria 2010
242
Table A4.8. Continued
Item 1999 2000 2001 2002 2003 2004 2005 2006 2007 2008 AAGR% 1999-2008
Industrial crops 37,396 43,839 57,997 155,954 99,126 72,950 68,551 72,035 77,995 81,027 10.7 Sugar beet 0 0 0 0 0 0 0 0 0 0 Seed cotton 0 0 0 0 0 0 0 0 0 0 Soya beans 0 0 0 0 0 0 0 0 0 0 Oily sunflower 0 0 0 4 0 0 0 17 0 0 Indian millet 223 376 1,307 201 282 39 31 42 33 20 -45.1 Sunflower 1,479 1,582 1,638 880 869 1,201 557 728 1,012 706 -12.2 Tobacco 10,310 10,931 10,747 10,915 10,372 10,734 10,855 11,027 9,895 9,922 -0.7 Peanuts 0 0 0 0 0 0 0 0 0 0 Sesame 3,830 3,250 3,322 9,998 9,217 4,286 2,176 2,985 1,624 670 -12.7 Aniseeds 283 64 22 3 9 17 30 39 35 32 -22.1 Cumin 20,992 25,533 39,476 130,133 76,156 53,864 52,674 54,103 60,107 60,645 15.2 Lupines 51 59 49 63 71 25 5 8 10 14 -27.4 Black cumin 228 2,045 1,436 3,757 2,150 2,784 2,223 3,086 5,279 9,018 36.2 Other industrial crops 1,061 1,207 402 609 354 340 506 186 193 230 -25.6 Vegetables 28,010 31,330 34,896 31,040 38,024 41,682 35,644 39,600 36,142 35,273 3.3 Green peas 229 341 311 290 304 422 254 782 939 691 22.3 Green broad beans 1,496 1,703 1,503 1,271 1,146 1,636 1,367 1,394 1,297 1,583 -1.9 Green haricot beans 4 9 9 44 38 41 39 8 19 73 35.3 Green kidney beans 729 746 1,023 1,237 1,142 1,144 909 840 701 335 -5.6 Cucumber and snake cucumber 1,746 2,108 1,944 3,250 4,429 5,033 4,672 5,453 4,996 4,242 20.4 Eggplants 0 0 0 0 0 0 0 0 0 3 Pumpkins 1,906 2,533 3,203 2,598 2,719 4,054 3,465 3,625 4,021 4,647 10.0 Lettuce 391 415 299 339 332 826 188 313 221 292 -5.7 Green onion 942 982 1,019 742 907 957 825 1,060 983 1,052 1.0 Leaf beat 267 259 202 283 350 332 156 179 186 172 -5.9 Cauliflower 15 17 16 14 13 6 4 5 14 26 -1.3 Cabbages 44 43 42 44 64 39 34 49 114 124 17.3 Potatoes 528 484 352 410 349 296 336 317 286 282 -8.3 Field tomatoes 3,845 4,318 5,854 4,221 3,407 2,676 2,131 2,576 1,833 2,411 -13.4 Dry onion 651 645 582 392 492 527 893 1,391 661 991 10.1 Green pepper 0 0 0 0 0 0 0 0 89 7 Okra 2,262 2,244 3,370 2,483 3,554 3,961 3,073 4,746 3,619 3,666 8.8

State of Food and Agriculture in Syria 2010
243
Table A4.8. Continued
Item 1999 2000 2001 2002 2003 2004 2005 2006 2007 2008 AAGR% 1999-2008
Vegetables (continued) Squash 696 100 157 232 139 133 80 109 314 222 -7.5 Dry garlic 601 566 519 565 512 526 561 609 490 481 -1.3 Water melon 6,801 9,005 8,588 6,825 11,845 12,475 8,844 8,748 6,557 4,917 -3.7 Musk melon 3,872 3,316 4,204 2,872 4,581 4,130 4,945 5,073 4,578 3,551 3.0 Other vegetables 985 1,496 1,699 2,928 1,702 2,468 2,868 2,323 4,225 5,506 23.6 Fruit trees 667,676 677,743 683,919 681,362 687,740 702,293 719,682 744,037 770,457 778,159 2.5 Olives 441,273 448,999 456,703 460,533 470,150 484,331 494,742 513,323 547,041 553,159 3.7 Grapes 59,169 58,947 58,318 44,689 43,569 42,347 45,380 45,811 44,795 44,789 -5.2 Apples 31,926 32,447 32,414 30,055 28,262 29,406 29,584 30,057 30,328 31,043 -1.1 Pistachios 56,529 56,100 53,163 51,946 51,083 50,860 50,787 50,841 50,699 50,218 -1.8 Citrus 94 80 85 87 86 163 160 161 161 159 13.2 Pomegranates 852 854 865 665 507 401 374 370 393 376 -15.0 Apricots 3,141 3,287 3,423 3,159 2,746 2,600 2,605 2,610 2,606 2,489 -4.8 Cherries 19,196 19,655 20,678 20,708 20,979 21,284 21,764 22,212 23,031 23,515 2.9 Almonds 39,119 40,911 41,044 54,378 55,627 56,322 59,579 63,953 56,505 57,788 8.0 Green plums 78 78 67 68 152 74 58 69 70 76 -0.7 Plums 685 729 755 642 707 812 996 1,087 1,178 1,224 10.0 Pears 2,751 2,877 2,892 2,606 1,981 1,799 1,710 1,719 1,752 1,780 -9.2 Quince 239 233 229 176 143 180 157 158 167 168 -6.8 Peaches 937 993 1,029 996 673 633 668 690 658 632 -7.7 Nuts 1,037 1,143 1,688 1,062 1,063 1,139 1,046 1,109 1,145 998 -3.4 Figs 9,857 9,836 9,938 9,072 9,480 9,380 9,529 9,340 9,400 9,255 -1.1 Loquats 37 39 45 23 17 12 13 7 10 11 -25.4 Palms 214 215 215 8 7 6 6 6 6 0 -54.9 Other trees 541 320 368 489 508 544 524 514 513 479 4.1 Total cropped area 3,349,566 3,353,741 3,336,581 3,262,918 3,303,633 3,296,327 3,452,025 3,345,211 3,331,421 3,254,702 -0.2

State of Food and Agriculture in Syria 2010
244
Table A4.9. Development of the average yield by crops, 1999-2009 (kg/ha, %)
Item 1999 2000 2001 2002 2003 2004 2005 2006 2007 2008 2009 AAGR% 1999-2009
Total field crops 1,728 1,818 2,714 2,516 2,452 2,247 2,255 2,554 2,253 1,497 2,217 -0.8 Total cereals 1,075 1,149 2,265 1,994 1,997 1,659 1,712 2,003 1,623 897 1,708 -1.0 Food cereals 1,679 1,850 2,818 2,844 2,735 2,478 2,452 2,760 2,423 1,440 2,575 0.2 Wheat 1,679 1,850 2,818 2,844 2,735 2,478 2,452 2,760 2,423 1,440 2,575 0.2 Soft wheat 1,533 1,821 2,894 2,898 2,580 2,353 2,359 2,633 2,308 1,349 2,366 -0.6 Durum wheat 1,795 1,873 2,749 2,788 2,911 2,622 2,581 2,932 2,580 1,573 2,923 1.6 Feed cereals (dry) 415 294 1,586 891 992 548 693 1,007 681 361 774 -3.8 Barley 301 161 1,501 745 861 408 578 920 576 182 655 -5.3 Maize 3,632 3,444 3,381 4,049 3,660 3,719 3,674 3,515 3,515 3,970 4,379 2.1 Sorghum 563 673 702 777 834 810 931 1,070 1,083 747 1,472 9.3 Oats 805 725 798 714 1,000 697 1,000 1,000 1,000 667 1,455 5.0 Legumes (dry) 420 640 1,044 1,010 1,092 893 1,003 1,147 760 436 1,031 1.0 Food legumes (dry) 425 656 1,104 1,062 1,135 908 1,042 1,186 755 444 1,046 0.5 Lentils 294 595 1,276 1,096 1,213 912 1,076 1,204 731 251 1,017 -1.3 Chickpeas 570 636 689 869 874 597 756 830 585 358 777 -1.6 Dry broad beans 1,874 1,849 1,870 2,018 1,954 2,009 2,074 2,142 1,690 1,707 2,162 -0.1 Dry haricot beans 1,564 1,612 1,511 1,599 1,525 2,838 1,928 2,042 1,932 1,701 2,059 3.3 Dry peas 1,547 1,231 1,211 1,204 1,894 1,328 1,533 2,300 2,076 1,363 1,659 4.2 Feed legumes (dry) 387 537 740 726 787 784 726 889 794 368 878 3.4 Bitter vetch 238 509 407 424 735 663 424 607 565 334 691 5.5 Flowering sern 523 561 920 973 703 776 729 957 1,015 248 961 1.7 Rambling vetch 346 535 717 730 843 874 871 927 633 539 893 4.4 Grazing crops * 9,197 10,535 14,222 12,855 14,314 16,282 15,902 16,314 17,978 10,710 10,589 2.5 Grazing barley 7,000 7,856 13,412 11,372 12,784 15,660 14,449 14,118 16,803 9,756 9,776 4.3 Grazing flowering 11,568 13,570 12,888 13,035 17,568 14,717 22,924 20,476 18,917 11,852 19,056 4.6 Grazing maize 12,697 27,082 11,518 17,887 13,775 20,899 11,518 19,390 19,435 10,055 8,755 -4.8 Grazing alfalfa 25,933 24,130 22,783 18,211 24,193 21,779 23,988 30,156 26,647 27,524 26,345 1.7 Grazing clover 20,779 16,511 14,898 16,287 20,219 15,648 17,915 14,139 16,886 15,148 16,252 -1.3 Other grazing crops 20,364 29,510 40,487 36,898 27,617 20,936 24,573 22,403 24,146 18,928 24,250 -4.8 Source: Elaborated from MAAR, the AASA, various issues. *Green fodder.
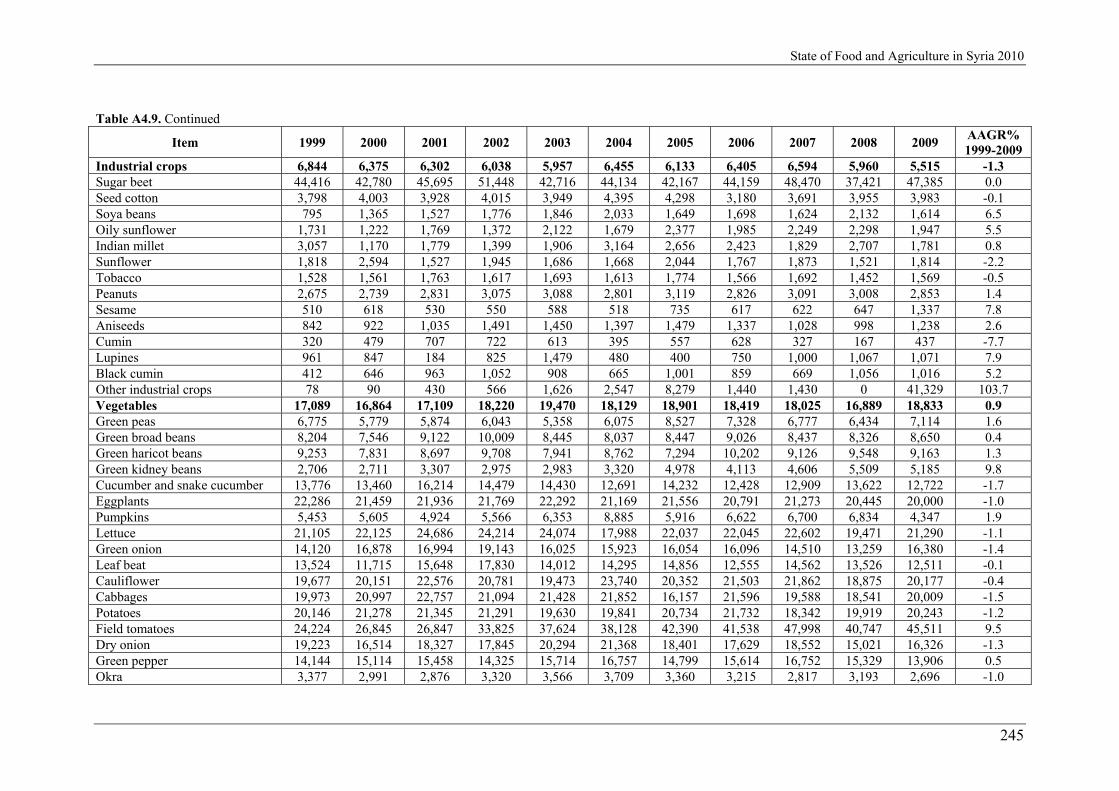
State of Food and Agriculture in Syria 2010
245
Table A4.9. Continued
Item 1999 2000 2001 2002 2003 2004 2005 2006 2007 2008 2009 AAGR% 1999-2009
Industrial crops 6,844 6,375 6,302 6,038 5,957 6,455 6,133 6,405 6,594 5,960 5,515 -1.3 Sugar beet 44,416 42,780 45,695 51,448 42,716 44,134 42,167 44,159 48,470 37,421 47,385 0.0 Seed cotton 3,798 4,003 3,928 4,015 3,949 4,395 4,298 3,180 3,691 3,955 3,983 -0.1 Soya beans 795 1,365 1,527 1,776 1,846 2,033 1,649 1,698 1,624 2,132 1,614 6.5 Oily sunflower 1,731 1,222 1,769 1,372 2,122 1,679 2,377 1,985 2,249 2,298 1,947 5.5 Indian millet 3,057 1,170 1,779 1,399 1,906 3,164 2,656 2,423 1,829 2,707 1,781 0.8 Sunflower 1,818 2,594 1,527 1,945 1,686 1,668 2,044 1,767 1,873 1,521 1,814 -2.2 Tobacco 1,528 1,561 1,763 1,617 1,693 1,613 1,774 1,566 1,692 1,452 1,569 -0.5 Peanuts 2,675 2,739 2,831 3,075 3,088 2,801 3,119 2,826 3,091 3,008 2,853 1.4 Sesame 510 618 530 550 588 518 735 617 622 647 1,337 7.8 Aniseeds 842 922 1,035 1,491 1,450 1,397 1,479 1,337 1,028 998 1,238 2.6 Cumin 320 479 707 722 613 395 557 628 327 167 437 -7.7 Lupines 961 847 184 825 1,479 480 400 750 1,000 1,067 1,071 7.9 Black cumin 412 646 963 1,052 908 665 1,001 859 669 1,056 1,016 5.2 Other industrial crops 78 90 430 566 1,626 2,547 8,279 1,440 1,430 0 41,329 103.7 Vegetables 17,089 16,864 17,109 18,220 19,470 18,129 18,901 18,419 18,025 16,889 18,833 0.9 Green peas 6,775 5,779 5,874 6,043 5,358 6,075 8,527 7,328 6,777 6,434 7,114 1.6 Green broad beans 8,204 7,546 9,122 10,009 8,445 8,037 8,447 9,026 8,437 8,326 8,650 0.4 Green haricot beans 9,253 7,831 8,697 9,708 7,941 8,762 7,294 10,202 9,126 9,548 9,163 1.3 Green kidney beans 2,706 2,711 3,307 2,975 2,983 3,320 4,978 4,113 4,606 5,509 5,185 9.8 Cucumber and snake cucumber 13,776 13,460 16,214 14,479 14,430 12,691 14,232 12,428 12,909 13,622 12,722 -1.7 Eggplants 22,286 21,459 21,936 21,769 22,292 21,169 21,556 20,791 21,273 20,445 20,000 -1.0 Pumpkins 5,453 5,605 4,924 5,566 6,353 8,885 5,916 6,622 6,700 6,834 4,347 1.9 Lettuce 21,105 22,125 24,686 24,214 24,074 17,988 22,037 22,045 22,602 19,471 21,290 -1.1 Green onion 14,120 16,878 16,994 19,143 16,025 15,923 16,054 16,096 14,510 13,259 16,380 -1.4 Leaf beat 13,524 11,715 15,648 17,830 14,012 14,295 14,856 12,555 14,562 13,526 12,511 -0.1 Cauliflower 19,677 20,151 22,576 20,781 19,473 23,740 20,352 21,503 21,862 18,875 20,177 -0.4 Cabbages 19,973 20,997 22,757 21,094 21,428 21,852 16,157 21,596 19,588 18,541 20,009 -1.5 Potatoes 20,146 21,278 21,345 21,291 19,630 19,841 20,734 21,732 18,342 19,919 20,243 -1.2 Field tomatoes 24,224 26,845 26,847 33,825 37,624 38,128 42,390 41,538 47,998 40,747 45,511 9.5 Dry onion 19,223 16,514 18,327 17,845 20,294 21,368 18,401 17,629 18,552 15,021 16,326 -1.3 Green pepper 14,144 15,114 15,458 14,325 15,714 16,757 14,799 15,614 16,752 15,329 13,906 0.5 Okra 3,377 2,991 2,876 3,320 3,566 3,709 3,360 3,215 2,817 3,193 2,696 -1.0

State of Food and Agriculture in Syria 2010
246
Table A4.9. Continued
Item 1999 2000 2001 2002 2003 2004 2005 2006 2007 2008 2009 AAGR%
99-09 Vegetables (continued) Squash 17,059 15,852 17,203 17,430 16,891 16,673 13,485 18,366 16,501 18,093 17,095 0.5 Dry garlic 8,065 8,657 10,559 9,533 9,614 9,704 9,475 8,886 7,237 7,708 7,733 -3.0 Water melon 22,335 14,816 17,321 20,692 27,124 24,448 26,295 19,549 18,094 15,262 21,745 0.2 Musk melon 8,573 10,411 12,170 10,277 15,613 15,788 13,303 12,224 13,129 9,555 14,499 3.0 Other vegetables 14,351 12,599 12,845 12,437 14,373 7,143 15,700 14,776 12,615 11,047 11,090 -2.2 Fruit trees 2,874 3,582 3,000 3,430 2,899 3,461 3,042 3,804 2,802 3,229 3,382 -0.1 Olives 852 1,812 1,016 1,876 1,068 1,933 1,124 2,108 825 1,340 1,394 -0.6 Grapes 5,538 5,909 5,653 6,295 5,906 4,734 5,676 6,041 4,987 5,135 6,409 -0.6 Apples 5,831 5,808 5,315 4,628 7,066 7,945 6,548 8,042 6,021 7,616 7,231 3.5 Pistachios 510 679 640 918 830 372 785 1,290 920 936 1,096 8.3 Citrus 26,652 29,178 29,540 26,478 22,287 27,047 24,406 26,840 26,887 27,890 28,466 -0.4 Pomegranates 11,880 10,698 11,824 9,934 11,599 11,928 12,493 11,828 13,973 12,927 13,797 2.8 Apricots 5,074 6,350 5,282 8,000 8,146 5,785 4,915 7,067 8,251 7,441 7,293 5.5 Cherries 2,575 2,620 2,256 1,760 2,300 1,457 2,157 2,476 2,881 1,820 2,101 -1.5 Almonds 1,447 1,498 1,186 2,490 2,446 2,121 3,737 1,623 1,295 1,375 1,510 0.2 Green plums 9,700 8,598 8,310 8,986 6,734 8,142 8,048 9,496 9,256 9,455 10,593 1.6 Plums 9,924 9,838 8,210 8,849 8,499 7,424 7,643 8,418 9,241 9,052 7,439 -1.4 Pears 4,651 5,248 4,737 4,049 4,821 5,020 4,944 5,440 6,045 5,973 6,297 3.8 Quince 8,749 9,110 7,950 8,244 8,260 7,123 9,222 8,863 9,511 8,351 9,155 0.8 Peaches 7,848 7,892 6,710 5,662 5,971 4,335 7,921 8,513 8,616 8,258 9,110 2.5 Nuts 3,448 3,149 2,350 3,515 3,630 3,312 3,804 3,905 3,403 3,945 4,064 4.1 Figs 3,898 4,138 3,725 4,309 4,125 3,739 5,004 5,272 4,194 4,172 5,559 2.9 Loquats 9,181 9,028 11,245 13,443 19,274 24,662 29,043 25,618 22,012 20,417 24,516 14.7 Palms 3,000 3,024 3,781 7,044 11,523 11,742 12,310 9,177 9,642 9,986 10,929 20.9 Other trees 6,079 5,522 5,551 5,700 10,933 5,415 8,754 10,178 8,233 7,763 9,750 7.0 Total 2,304 2,493 3,120 3,165 3,037 3,012 2,916 3,301 2,924 2,392 3,104 1.0
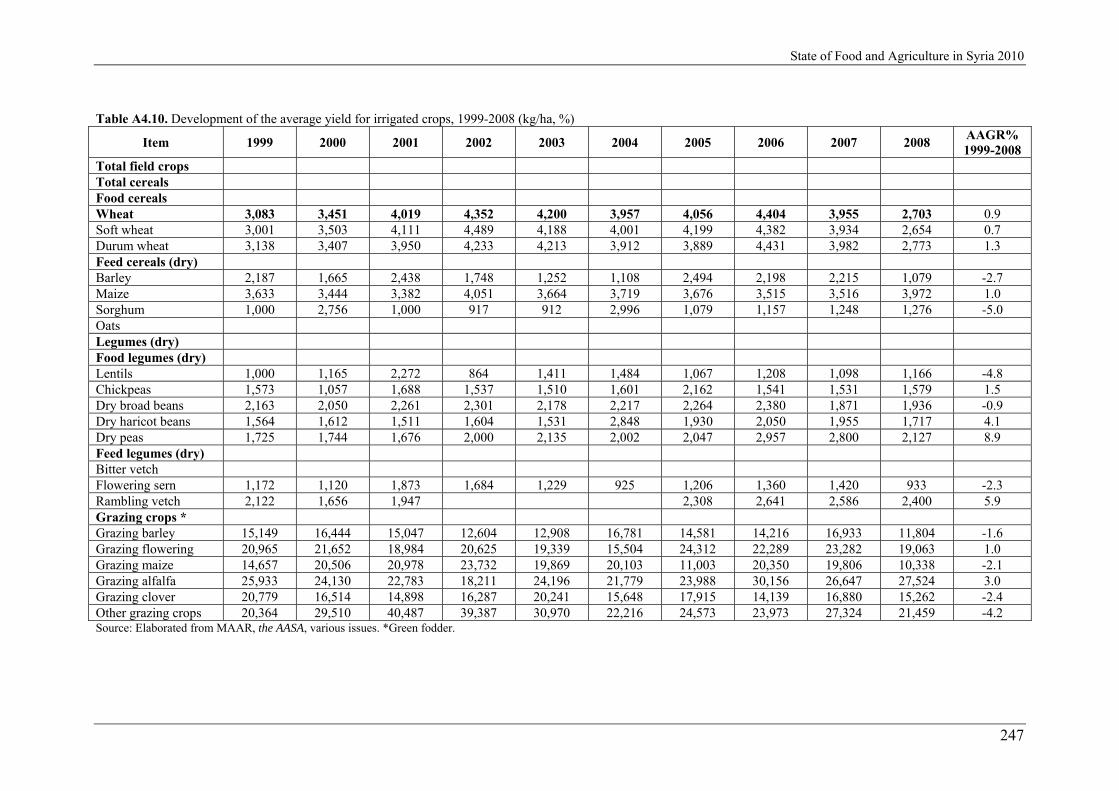
State of Food and Agriculture in Syria 2010
247
Table A4.10. Development of the average yield for irrigated crops, 1999-2008 (kg/ha, %)
Item 1999 2000 2001 2002 2003 2004 2005 2006 2007 2008 AAGR% 1999-2008
Total field crops Total cereals Food cereals Wheat 3,083 3,451 4,019 4,352 4,200 3,957 4,056 4,404 3,955 2,703 0.9 Soft wheat 3,001 3,503 4,111 4,489 4,188 4,001 4,199 4,382 3,934 2,654 0.7 Durum wheat 3,138 3,407 3,950 4,233 4,213 3,912 3,889 4,431 3,982 2,773 1.3 Feed cereals (dry) Barley 2,187 1,665 2,438 1,748 1,252 1,108 2,494 2,198 2,215 1,079 -2.7 Maize 3,633 3,444 3,382 4,051 3,664 3,719 3,676 3,515 3,516 3,972 1.0 Sorghum 1,000 2,756 1,000 917 912 2,996 1,079 1,157 1,248 1,276 -5.0 Oats Legumes (dry) Food legumes (dry) Lentils 1,000 1,165 2,272 864 1,411 1,484 1,067 1,208 1,098 1,166 -4.8 Chickpeas 1,573 1,057 1,688 1,537 1,510 1,601 2,162 1,541 1,531 1,579 1.5 Dry broad beans 2,163 2,050 2,261 2,301 2,178 2,217 2,264 2,380 1,871 1,936 -0.9 Dry haricot beans 1,564 1,612 1,511 1,604 1,531 2,848 1,930 2,050 1,955 1,717 4.1 Dry peas 1,725 1,744 1,676 2,000 2,135 2,002 2,047 2,957 2,800 2,127 8.9 Feed legumes (dry) Bitter vetch Flowering sern 1,172 1,120 1,873 1,684 1,229 925 1,206 1,360 1,420 933 -2.3 Rambling vetch 2,122 1,656 1,947 2,308 2,641 2,586 2,400 5.9 Grazing crops * Grazing barley 15,149 16,444 15,047 12,604 12,908 16,781 14,581 14,216 16,933 11,804 -1.6 Grazing flowering 20,965 21,652 18,984 20,625 19,339 15,504 24,312 22,289 23,282 19,063 1.0 Grazing maize 14,657 20,506 20,978 23,732 19,869 20,103 11,003 20,350 19,806 10,338 -2.1 Grazing alfalfa 25,933 24,130 22,783 18,211 24,196 21,779 23,988 30,156 26,647 27,524 3.0 Grazing clover 20,779 16,514 14,898 16,287 20,241 15,648 17,915 14,139 16,880 15,262 -2.4 Other grazing crops 20,364 29,510 40,487 39,387 30,970 22,216 24,573 23,973 27,324 21,459 -4.2 Source: Elaborated from MAAR, the AASA, various issues. *Green fodder.

State of Food and Agriculture in Syria 2010
248
Table A4.10. Continued
Item 1999 2000 2001 2002 2003 2004 2005 2006 2007 2008 AAGR% 1999-2008
Industrial crops Sugar beet 44,416 42,780 45,695 51,448 42,716 44,134 42,167 44,159 48,470 37,421 -0.4 Seed cotton 3,798 4,003 3,928 4,015 3,949 4,395 4,298 3,180 3,691 3,955 -1.6 Soya beans 795 1,365 1,527 1,776 1,846 2,033 1,649 1,698 1,624 2,132 8.1 Oily sunflower 1,731 1,222 1,769 1,374 2,122 1,679 2,405 2,022 2,249 2,298 6.8 Indian millet 1,713 1,523 3,203 3,514 2,538 4,024 2,799 2,657 1,862 4,412 6.8 Sunflower 1,961 3,966 1,555 2,119 1,690 1,747 2,099 1,837 1,967 1,585 -6.4 Tobacco 2,482 2,548 2,569 2,699 2,752 2,655 2,833 2,590 2,864 2,625 1.2 Peanuts 2,675 2,739 2,831 3,075 3,088 2,798 3,119 2,826 3,091 3,007 1.6 Sesame 727 951 790 624 830 669 913 776 790 706 -1.6 Aniseeds 936 946 1,046 1,493 1,455 1,404 1,490 1,349 1,032 1,002 2.9 Cumin 951 683 1,146 960 898 660 840 1,174 568 990 -0.3 Lupines Black cumin 818 1,237 1,357 913 1,195 1,380 1,793 1,875 1,914 12.6 Other industrial crops Vegetables Green peas 7,093 5,974 5,922 6,128 5,536 6,350 8,694 7,629 7,570 6,650 2.8 Green broad beans 9,567 8,719 10,471 11,148 9,073 9,115 9,281 9,580 9,294 9,376 -0.4 Green haricot beans 9,254 7,836 8,705 9,759 7,980 8,802 7,295 10,213 9,135 9,641 2.4 Green kidney beans 7,076 7,518 5,600 7,450 6,982 6,507 8,004 6,289 7,159 7,431 0.7 Cucumber and snake cucumber 17,143 17,730 21,575 19,192 18,354 17,132 20,728 19,552 19,058 19,761 0.7 Eggplants 22,286 21,459 21,936 21,769 22,292 21,172 21,556 20,791 21,273 20,449 -1.0 Pumpkins 15,366 21,528 17,941 16,992 22,471 22,465 14,396 16,078 9,577 6,869 -9.9 Lettuce 22,790 24,634 27,264 26,289 25,340 22,046 22,747 22,975 23,355 20,438 -2.2 Green onion 16,489 20,110 20,877 21,387 18,689 18,728 17,908 18,646 16,338 15,747 -2.5 Leaf beat 14,596 12,217 17,619 20,329 14,762 16,421 16,779 13,301 15,731 14,709 -0.3 Cauliflower 19,735 20,272 22,713 20,871 19,555 23,797 20,370 21,537 21,960 19,015 -0.1 Cabbages 20,052 21,120 22,930 21,210 21,665 22,012 16,181 21,731 20,217 18,815 -1.1 Potatoes 20,319 21,502 21,524 21,456 19,723 19,926 20,845 21,837 18,398 19,982 -1.0 Field tomatoes 31,056 33,714 38,407 43,532 47,397 45,240 49,841 49,400 53,740 47,058 7.8 Dry onion 21,003 17,965 19,918 18,597 21,100 22,253 19,913 20,625 19,570 16,346 -0.8 Green pepper 14,144 15,114 15,458 14,325 15,714 16,759 14,920 15,614 16,941 15,339 1.4 Okra 6,257 5,146 4,877 5,764 6,167 6,430 6,149 6,545 6,252 5,708 2.6

State of Food and Agriculture in Syria 2010
249
Table A4.10. Continued
Item 1999 2000 2001 2002 2003 2004 2005 2006 2007 2008 AAGR% 1999-2008
Vegetables (continued) Squash 18,312 16,173 17,867 18,028 17,136 17,056 13,549 18,573 17,008 18,789 0.8 Dry garlic 9,866 10,369 12,239 10,888 10,295 10,615 10,101 9,385 7,788 8,309 -4.7 Water melon 43,454 29,778 32,991 20,361 29,628 26,238 30,501 24,534 20,934 17,704 -9.9 Musk melon 17,774 21,233 18,027 11,339 20,186 22,195 25,171 20,621 16,991 17,307 -0.8 Other vegetables 17,562 17,605 19,098 18,864 17,981 8,009 20,925 19,412 19,846 18,291 1.2 Fruit trees Olives 1,422 2,255 1,950 2,271 2,274 2,289 2,486 2,699 2,062 2,153 4.2 Grapes 13,629 14,014 13,678 15,703 15,498 12,303 15,082 13,513 13,204 13,968 -0.3 Apples 9,293 9,115 8,970 6,858 10,804 12,363 11,060 12,317 10,498 11,402 4.6 Pistachios 1,243 1,350 1,112 1,752 1,515 706 1,254 2,214 1,752 1,734 9.0 Citrus 26,744 29,261 29,609 26,539 22,340 27,164 24,508 26,949 26,990 27,992 -0.9 Pomegranates 11,924 10,081 11,219 9,851 10,947 11,052 11,539 10,686 12,949 12,060 1.4 Apricots 6,313 7,928 6,744 10,029 9,572 6,853 5,665 8,131 9,584 8,590 4.6 Cherries 8,170 7,334 7,287 5,824 4,664 3,029 5,062 5,394 5,694 3,320 -8.8 Almonds 2,925 3,642 5,652 5,277 4,655 4,294 6,498 4,432 3,048 3,677 -1.8 Green plums 9,700 8,715 8,300 8,957 6,944 7,981 7,898 9,464 9,236 9,470 1.1 Plums 9,203 9,403 7,159 7,494 7,386 6,464 7,465 9,284 9,755 10,418 2.7 Pears 6,381 7,392 6,720 6,319 6,265 6,036 5,947 6,580 7,677 7,791 1.5 Quince 9,049 9,487 8,057 8,239 7,574 6,532 8,841 9,280 9,613 8,277 0.4 Peaches 8,832 8,930 7,496 6,210 6,264 4,505 8,424 9,073 9,130 8,714 1.3 Nuts 3,766 3,394 2,739 3,883 3,826 3,532 4,155 4,328 3,570 4,358 4.4 Figs 7,291 8,371 7,935 5,959 7,757 8,159 8,230 8,618 8,042 8,225 1.1 Loquats 10,618 10,441 13,116 12,877 17,633 19,232 24,000 20,869 18,455 16,780 10.4 Palms 3,346 3,378 4,320 7,059 11,651 11,830 12,374 9,316 9,727 9,946 21.3 Other trees 6,651 5,757 5,701 6,320 12,788 5,703 9,919 11,650 9,420 8,561 10.3

State of Food and Agriculture in Syria 2010
250
Table A4.11. Development of the average yield for rain-fed crops, 1999-2008 (kg/ha, %)
Item 1999 2000 2001 2002 2003 2004 2005 2006 2007 2008 AAGR% 1999-2008
Total field crops Total cereals Food cereals Wheat 671 720 1,998 1,619 1,520 1,176 1,143 1,397 1,040 219 -4.8 Soft wheat 637 602 2,188 1,773 1,375 1,055 1,041 1,291 952 110 -7.2 Durum wheat 701 815 1,804 1,441 1,700 1,332 1,305 1,552 1,171 382 -1.3 Feed cereals (dry) Barley 294 151 1,474 704 848 384 548 868 496 127 -4.9 Maize 667 500 710 1,167 1,919 1,895 1,857 1,667 1,000 2,198 21.0 Sorghum 558 610 690 764 832 674 895 1,056 1,013 655 8.0 Oats 805 724 798 833 1,000 667 1,000 1,000 1,000 667 2.8 Legumes (dry) Food legumes (dry) Lentils 293 593 1,270 1,097 1,213 910 1,076 1,204 725 238 0.1 Chickpeas 566 634 684 862 867 587 748 821 566 304 -2.1 Dry broad beans 1,278 1,268 1,109 1,053 914 1,207 1,253 1,284 956 658 -4.5 Dry haricot beans 1,000 960 1,929 1,000 1,000 933 1,083 Dry peas 1,000 771 1,000 1,107 1,835 802 794 985 1,054 764 0.2 Feed legumes (dry) Bitter vetch 238 509 407 424 735 663 424 607 565 330 5.4 Flowering sern 443 549 715 884 644 772 717 948 1,006 234 5.1 Rambling vetch 327 530 699 730 843 865 855 917 632 537 6.0 Grazing crops * Grazing barley 933 1,968 3,858 1,784 5,729 5,081 5,289 6,127 4,379 190 9.6 Grazing flowering 2,528 5,495 6,770 5,596 12,514 7,660 12,049 13,039 9,661 1,751 10.6 Grazing maize 11,842 32,213 8,653 14,622 6,368 21,569 14,848 9,022 16,165 3,514 -11.4 Grazing alfalfa Grazing clover Other grazing crops Source: Elaborated from MAAR, the AASA, various issues. *Green fodder.

State of Food and Agriculture in Syria 2010
251
Table A4.11. Continued
Item 1999 2000 2001 2002 2003 2004 2005 2006 2007 2008 AAGR% 1999-2008
Industrial crops Sugar beet Seed cotton Soya beans Oily sunflower 3,834 867 1,634 1,010 1,582 1,333 1,119 1,081 1,212 1,040 -12.1 Indian millet 1,260 1,082 1,448 1,007 1,654 1,269 1,209 1,041 896 977 -5.1 Sunflower 987 1,038 1,343 1,131 1,171 1,093 1,246 1,114 1,178 991 -0.5 Tobacco Peanuts 408 296 373 525 494 368 396 390 256 316 -2.2 Sesame 477 422 409 667 778 706 833 692 800 625 10.1 Aniseeds 315 476 697 715 608 388 553 622 323 156 -5.8 Cumin 961 855 184 825 1,479 480 400 750 1,000 1,000 6.6 Lupines 412 645 951 1,043 908 658 916 822 493 564 -1.3 Black cumin 3,834 867 1,634 1,010 1,582 1,333 1,119 1,081 1,212 1,040 -12.1 Other industrial crops Vegetables Green peas 3,991 4,516 5,463 4,976 3,549 3,739 6,913 6,715 4,622 5,667 4.0 Green broad beans 5,557 5,927 5,997 6,417 6,166 5,892 6,094 7,334 5,928 5,367 1.3 Green haricot beans 8,750 6,333 5,778 5,409 5,368 5,634 7,179 5,625 7,579 5,701 -1.9 Green kidney beans 1,213 1,429 1,526 1,488 1,411 1,752 2,195 1,727 2,144 955 3.0 Cucumber and snake cucumber 4,039 3,992 4,227 5,075 9,021 6,769 6,392 5,918 5,087 4,898 5.3 Eggplants Pumpkins 4,329 3,606 4,223 4,140 5,162 8,403 5,551 5,615 6,541 6,826 9.3 Lettuce 12,642 11,983 12,334 12,723 16,245 6,496 13,872 15,486 14,109 11,527 2.2 Green onion 9,196 10,095 9,412 9,406 10,630 10,263 11,245 10,718 10,398 7,106 -0.3 Leaf beat 10,210 10,224 9,074 10,403 12,453 10,148 8,987 9,754 10,027 8,256 -1.0 Cauliflower 9,867 9,765 9,813 10,143 9,538 10,000 10,000 10,400 10,000 10,538 1.0 Cabbages 14,932 15,140 15,095 14,795 14,859 15,000 14,412 16,776 10,649 14,169 -1.6 Potatoes 12,205 10,959 10,716 11,754 13,129 12,074 11,110 12,650 12,296 11,865 1.7 Field tomatoes 6,898 5,626 7,166 5,361 6,285 6,290 5,728 5,122 6,009 5,979 -2.8 Dry onion 8,058 8,164 7,316 8,186 13,451 13,133 8,402 8,004 11,399 7,954 3.1 Green pepper Okra 1,851 1,455 2,229 2,133 2,029 2,435 1,807 1,733 1,101 1,392 -5.3

State of Food and Agriculture in Syria 2010
252
Table A4.11. Continued
Item 1999 2000 2001 2002 2003 2004 2005 2006 2007 2008 AAGR% 1999-2008
Vegetables (continued) Squash 8,977 3,140 2,949 4,138 9,345 1,887 6,438 10,312 7,936 1,992 6.1 Dry garlic 3,155 3,523 3,482 4,165 4,549 4,027 4,613 5,693 3,194 3,052 3.3 Water melon 7,509 7,178 8,978 21,485 24,374 21,473 19,965 8,138 6,411 5,773 -3.0 Musk melon 5,381 6,132 9,605 7,736 12,760 12,180 7,984 7,364 6,791 3,381 -3.6 Other vegetables 1,620 1,095 1,243 1,796 2,434 1,748 1,670 1,665 858 994 -2.3 Fruit trees Olives 815 1,783 950 1,841 948 1,898 987 2,048 704 1,246 2.4 Grapes 4,075 4,488 4,208 4,269 4,042 3,138 3,894 4,421 3,160 3,177 -3.4 Apples 4,016 4,083 3,390 3,398 5,064 5,590 4,164 5,697 3,628 5,626 5.4 Pistachios 476 646 593 827 748 332 728 1,183 823 842 10.7 Citrus 297 888 6,529 7,011 4,118 4,454 4,000 3,888 4,174 3,770 8.9 Pomegranates 11,583 14,755 15,644 10,555 17,783 20,606 22,596 24,016 24,251 22,115 10.9 Apricots 1,423 1,967 1,405 1,929 2,889 1,481 1,824 2,443 2,592 2,326 9.0 Cherries 2,046 2,182 1,810 1,396 1,981 1,237 1,756 2,053 2,513 1,627 0.5 Almonds 1,418 1,463 1,114 2,416 2,378 2,057 3,657 1,534 1,225 1,283 0.2 Green plums 9,680 6,419 8,582 9,618 4,812 11,311 11,845 10,232 9,786 9,083 3.3 Plums 11,971 10,989 11,038 12,917 11,178 9,656 7,987 6,788 8,308 6,533 -8.6 Pears 2,784 3,044 2,725 1,987 3,183 3,728 3,603 3,879 3,873 3,588 5.8 Quince 7,883 8,026 7,646 8,256 10,084 8,317 10,108 7,930 9,303 8,486 1.8 Peaches 3,269 3,364 3,209 2,777 3,712 2,810 3,518 3,730 3,936 3,786 3.1 Nuts 2,338 2,373 1,511 2,624 3,219 2,876 3,053 3,085 3,097 3,022 8.1 Figs 3,597 3,788 3,383 4,128 3,941 3,535 4,855 5,127 4,032 4,000 4.1 Loquats 6,541 6,564 8,689 15,043 24,471 50,000 51,154 67,000 51,053 50,667 50.6 Palms 1,729 1,724 1,722 6,173 4,571 6,667 10,667 2,667 4,286 15.0 Other trees 3,921 3,839 4,693 3,505 4,407 3,904 4,462 4,623 3,465 4,358 0.0
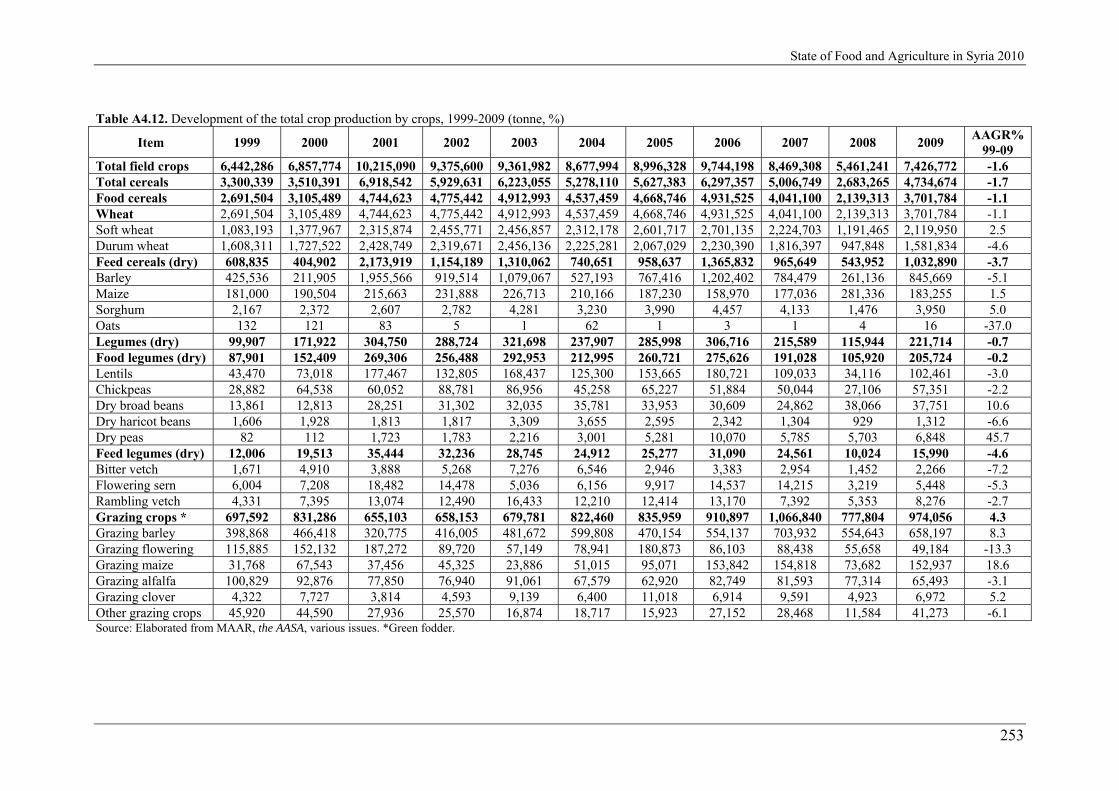
State of Food and Agriculture in Syria 2010
253
Table A4.12. Development of the total crop production by crops, 1999-2009 (tonne, %)
Item 1999 2000 2001 2002 2003 2004 2005 2006 2007 2008 2009 AAGR%
99-09 Total field crops 6,442,286 6,857,774 10,215,090 9,375,600 9,361,982 8,677,994 8,996,328 9,744,198 8,469,308 5,461,241 7,426,772 -1.6 Total cereals 3,300,339 3,510,391 6,918,542 5,929,631 6,223,055 5,278,110 5,627,383 6,297,357 5,006,749 2,683,265 4,734,674 -1.7 Food cereals 2,691,504 3,105,489 4,744,623 4,775,442 4,912,993 4,537,459 4,668,746 4,931,525 4,041,100 2,139,313 3,701,784 -1.1 Wheat 2,691,504 3,105,489 4,744,623 4,775,442 4,912,993 4,537,459 4,668,746 4,931,525 4,041,100 2,139,313 3,701,784 -1.1 Soft wheat 1,083,193 1,377,967 2,315,874 2,455,771 2,456,857 2,312,178 2,601,717 2,701,135 2,224,703 1,191,465 2,119,950 2.5 Durum wheat 1,608,311 1,727,522 2,428,749 2,319,671 2,456,136 2,225,281 2,067,029 2,230,390 1,816,397 947,848 1,581,834 -4.6 Feed cereals (dry) 608,835 404,902 2,173,919 1,154,189 1,310,062 740,651 958,637 1,365,832 965,649 543,952 1,032,890 -3.7 Barley 425,536 211,905 1,955,566 919,514 1,079,067 527,193 767,416 1,202,402 784,479 261,136 845,669 -5.1 Maize 181,000 190,504 215,663 231,888 226,713 210,166 187,230 158,970 177,036 281,336 183,255 1.5 Sorghum 2,167 2,372 2,607 2,782 4,281 3,230 3,990 4,457 4,133 1,476 3,950 5.0 Oats 132 121 83 5 1 62 1 3 1 4 16 -37.0 Legumes (dry) 99,907 171,922 304,750 288,724 321,698 237,907 285,998 306,716 215,589 115,944 221,714 -0.7 Food legumes (dry) 87,901 152,409 269,306 256,488 292,953 212,995 260,721 275,626 191,028 105,920 205,724 -0.2 Lentils 43,470 73,018 177,467 132,805 168,437 125,300 153,665 180,721 109,033 34,116 102,461 -3.0 Chickpeas 28,882 64,538 60,052 88,781 86,956 45,258 65,227 51,884 50,044 27,106 57,351 -2.2 Dry broad beans 13,861 12,813 28,251 31,302 32,035 35,781 33,953 30,609 24,862 38,066 37,751 10.6 Dry haricot beans 1,606 1,928 1,813 1,817 3,309 3,655 2,595 2,342 1,304 929 1,312 -6.6 Dry peas 82 112 1,723 1,783 2,216 3,001 5,281 10,070 5,785 5,703 6,848 45.7 Feed legumes (dry) 12,006 19,513 35,444 32,236 28,745 24,912 25,277 31,090 24,561 10,024 15,990 -4.6 Bitter vetch 1,671 4,910 3,888 5,268 7,276 6,546 2,946 3,383 2,954 1,452 2,266 -7.2 Flowering sern 6,004 7,208 18,482 14,478 5,036 6,156 9,917 14,537 14,215 3,219 5,448 -5.3 Rambling vetch 4,331 7,395 13,074 12,490 16,433 12,210 12,414 13,170 7,392 5,353 8,276 -2.7 Grazing crops * 697,592 831,286 655,103 658,153 679,781 822,460 835,959 910,897 1,066,840 777,804 974,056 4.3 Grazing barley 398,868 466,418 320,775 416,005 481,672 599,808 470,154 554,137 703,932 554,643 658,197 8.3 Grazing flowering 115,885 152,132 187,272 89,720 57,149 78,941 180,873 86,103 88,438 55,658 49,184 -13.3 Grazing maize 31,768 67,543 37,456 45,325 23,886 51,015 95,071 153,842 154,818 73,682 152,937 18.6 Grazing alfalfa 100,829 92,876 77,850 76,940 91,061 67,579 62,920 82,749 81,593 77,314 65,493 -3.1 Grazing clover 4,322 7,727 3,814 4,593 9,139 6,400 11,018 6,914 9,591 4,923 6,972 5.2 Other grazing crops 45,920 44,590 27,936 25,570 16,874 18,717 15,923 27,152 28,468 11,584 41,273 -6.1 Source: Elaborated from MAAR, the AASA, various issues. *Green fodder.

State of Food and Agriculture in Syria 2010
254
Table A4.12. Continued
Item 1999 2000 2001 2002 2003 2004 2005 2006 2007 2008 2009 AAGR%
99-09 Industrial crops 2,344,364 2,344,058 2,336,474 2,498,348 2,135,934 2,338,572 2,236,233 2,228,367 2,179,386 1,884,229 1,496,329 -3.8 Sugar beet 1,330,387 1,175,326 1,215,477 1,522,702 1,205,159 1,217,658 1,096,291 1,437,921 1,366,453 1,104,861 732,708 -2.5 Seed cotton 926,096 1,081,888 1,009,826 802,178 811,026 1,029,232 1,021,996 685,705 711,497 697,841 652,058 -6.2 Soya beans 2,513 3,804 3,693 4,712 3,465 3,698 3,814 3,141 2,058 1,369 1,623 -10.8 Oily sunflower 722 314 2,638 1,530 2,010 863 1,222 661 830 432 220 -14.0 Indian millet 1,076 818 2,562 333 814 386 980 688 1,207 111 184 -16.6 Sunflower 13,253 8,631 9,621 10,946 12,259 12,085 18,647 14,671 21,643 10,204 12,481 5.9 Tobacco 24,700 26,112 28,802 25,561 26,209 25,942 28,870 24,896 24,066 20,058 19,881 -3.6 Peanuts 34,684 28,106 29,574 20,485 16,154 18,304 24,552 16,232 22,381 18,770 14,574 -8.1 Sesame 2,872 3,958 2,822 7,288 7,513 4,433 4,625 4,461 3,219 2,877 7,643 6.1 Aniseeds 1,163 1,311 1,432 1,841 1,713 2,303 2,654 2,902 2,066 2,459 2,714 10.8 Cumin 6,755 12,412 28,579 96,650 47,534 21,776 29,849 34,329 19,914 10,245 23,107 1.8 Lupines 49 50 9 52 105 12 2 6 10 16 15 -14.9 Black cumin 94 1,328 1,439 4,070 1,973 1,880 2,731 2,754 4,042 14,986 4,997 42.6 Other industrial crops 84 117 221 744 1,514 945 10,755 861 745 0 24,124 97.3 Vegetables 1,961,914 1,965,338 1,983,996 2,665,602 2,783,318 3,085,728 2,986,726 2,918,873 3,145,859 2,875,632 3,231,755 7.8 Green peas 15,143 14,754 17,429 23,578 18,314 24,335 23,135 17,419 23,685 20,208 14,014 3.4 Green broad beans 36,115 30,592 45,465 52,847 44,853 39,318 44,125 50,977 42,976 50,313 41,909 3.2 Green haricot beans 30,831 22,938 26,890 36,093 20,027 28,143 40,170 32,003 30,107 29,560 32,498 2.2 Green kidney beans 2,646 2,562 6,013 4,903 4,746 5,661 8,686 7,243 6,338 6,220 5,813 8.6 Cucumber and snake 93,814 91,302 102,005 140,953 152,025 149,074 146,730 129,682 146,526 139,887 132,925 6.5 Eggplants 114,594 123,670 110,931 133,402 137,723 157,960 154,384 158,613 153,148 165,213 147,041 4.9 Pumpkins 11,571 15,980 16,620 16,269 18,551 37,299 21,380 26,560 28,429 38,506 10,988 9.9 Lettuce 49,702 46,285 42,757 53,683 57,417 56,931 51,786 55,598 62,202 52,376 52,225 3.1 Green onion 40,949 51,360 51,136 75,825 44,070 45,986 47,583 53,053 46,361 48,450 73,987 2.7 Leaf beat 14,768 12,055 13,708 20,041 15,091 13,895 9,389 10,684 13,215 12,687 9,921 -2.0 Cauliflower 50,354 29,804 33,977 34,871 30,943 34,827 45,588 34,813 37,329 29,633 35,915 -1.7 Cabbages 57,124 42,876 43,193 51,216 39,342 37,411 39,519 38,656 33,965 38,955 44,441 -3.3 Potatoes 499,203 484,778 453,435 513,153 486,605 541,743 608,480 603,411 570,128 720,492 705,586 5.6 Field tomatoes 329,351 473,973 424,714 561,562 539,228 558,762 534,744 602,588 731,251 639,531 633,483 8.5 Dry onion 91,000 71,917 84,489 96,880 94,731 116,585 125,072 103,203 98,492 94,228 81,748 1.7 Green pepper 33,379 42,999 45,261 40,496 48,949 50,155 60,572 60,147 78,786 67,173 48,444 8.1 Okra 11,684 11,490 12,827 12,246 20,171 21,568 16,079 22,046 15,290 20,081 13,812 5.3

State of Food and Agriculture in Syria 2010
255
Table A4.12. Continued
Item 1999 2000 2001 2002 2003 2004 2005 2006 2007 2008 2009 AAGR%
99-09 Vegetables (continued) Squash 88,469 64,535 60,728 94,020 73,409 87,851 119,194 80,169 92,671 96,782 110,851 5.8 Dry garlic 18,057 19,591 28,574 26,720 41,533 36,935 46,590 40,069 29,572 32,427 28,227 5.3 Water melon 258,523 201,530 227,939 480,087 674,193 812,079 588,305 562,461 606,716 366,722 749,695 16.5 Musk melon 44,706 48,172 73,567 100,084 116,146 101,930 95,263 97,880 158,756 60,950 106,510 11.9 Other vegetables 69,931 62,175 62,338 96,673 105,251 127,280 159,952 131,598 139,916 145,239 151,724 14.4 Fruit trees 2,269,097 2,866,363 2,440,173 2,803,264 2,403,030 2,930,884 2,640,715 3,420,610 2,604,080 3,066,849 3,306,742 2.9 Olives 400,509 866,052 496,952 940,941 552,277 1,027,166 612,223 1,190,781 495,310 827,033 885,942 3.8 Grapes 386,986 409,450 388,989 341,886 307,343 242,746 306,377 336,754 273,028 280,939 358,000 -4.3 Apples 283,713 286,773 262,963 215,762 306,715 358,165 296,057 374,328 280,247 360,697 360,978 3.1 Pistachios 30,133 39,923 37,436 52,853 47,547 21,183 44,642 73,183 52,066 52,556 61,484 7.5 Citrus 719,619 800,000 833,449 746,185 652,531 844,095 777,817 907,016 966,870 1,046,456 1,092,622 4.7 Pomegranates 78,492 69,164 74,843 55,958 61,682 52,162 54,170 51,119 60,697 56,284 60,055 -3.7 Apricots 62,914 78,873 66,023 100,902 104,915 75,674 65,513 98,538 112,738 100,902 98,913 7.0 Cherries 54,112 56,285 50,795 39,707 54,795 35,358 53,441 62,982 75,034 48,282 56,886 1.9 Almonds 57,697 62,288 49,487 139,028 140,249 123,026 229,035 107,117 76,093 82,616 97,003 7.1 Green plums 14,938 13,078 13,014 14,027 10,465 12,465 12,289 15,631 15,790 16,224 17,460 3.2 Plums 26,081 26,168 22,841 22,742 20,507 20,045 22,646 26,374 30,559 31,527 26,978 2.9 Pears 26,603 30,618 27,591 20,142 20,383 20,511 19,767 22,150 24,671 24,577 25,521 -2.1 Quince 8,119 8,245 6,996 4,732 4,320 3,868 4,814 4,538 4,955 4,301 4,591 -8.3 Peaches 41,595 42,034 37,635 35,320 35,037 27,363 51,607 56,084 57,393 56,361 62,628 6.4 Nuts 16,053 15,005 12,543 12,766 11,900 11,224 12,472 12,747 11,045 12,755 13,465 -2.6 Figs 41,818 44,071 40,019 43,400 41,089 36,696 49,881 51,384 41,086 40,262 53,723 1.2 Loquats 964 966 1,237 1,183 1,407 1,677 2,033 1,742 1,871 1,960 2,155 11.2 Palms 3,000 3,051 3,921 3,064 4,033 4,145 4,370 3,258 3,452 3,485 4,037 1.6 Other trees 15,751 14,319 13,440 12,666 25,835 13,315 21,561 24,884 21,175 19,633 24,301 6.9 Total 10,673,297 11,689,475 14,639,259 14,844,466 14,548,330 14,694,606 14,623,769 16,083,681 14,219,247 11,403,723 13,965,269 1.1

State of Food and Agriculture in Syria 2010
256
Table A4.13. Development of the crop production for irrigated crops, 1999-2008 (tonne, %)
Item 1999 2000 2001 2002 2003 2004 2005 2006 2007 2008 AAGR% 1999-2008
Total field crops 5,229,446 5,617,814 5,942,189 6,617,286 6,464,947 6,761,535 6,754,776 6,947,220 6,661,147 5,021,575 2.1 Total cereals 2,258,041 2,601,582 3,048,761 3,592,579 3,699,248 3,651,373 3,710,505 3,839,797 3,448,958 2,344,785 4.0 Food cereals 2,065,483 2,396,573 2,744,203 3,275,222 3,421,429 3,392,660 3,471,110 3,567,671 3,130,010 1,973,906 3.8 Wheat 2,065,483 2,396,573 2,744,203 3,275,222 3,421,429 3,392,660 3,471,110 3,567,671 3,130,010 1,973,906 3.8 Soft wheat 803,473 1,114,028 1,206,811 1,575,830 1,708,087 1,732,595 1,932,941 1,951,987 1,724,431 1,141,766 9.1 Durum wheat 1,262,010 1,282,545 1,537,392 1,699,392 1,713,342 1,660,065 1,538,169 1,615,684 1,405,579 832,140 -1.1 Feed cereals (dry) 192,558 205,009 304,558 317,357 277,819 258,713 239,395 272,126 318,948 370,879 6.5 Barley 11,518 14,223 88,772 85,232 51,261 47,885 51,363 112,539 140,508 89,271 24.5 Maize 180,996 190,501 215,641 231,839 226,427 210,130 187,126 158,940 177,031 281,234 1.0 Sorghum 44 285 145 286 131 698 906 647 1,409 374 38.7 Oats 0 0 0 0 0 0 0 0 0 0 Legumes (dry) 14,771 13,951 34,967 34,665 35,996 38,885 38,991 39,525 33,723 47,861 13.7 Food legumes (dry) 13,012 13,532 27,770 31,877 35,112 38,675 38,222 38,866 33,289 47,576 17.1 Lentils 214 466 1,847 529 364 524 348 58 2,823 2,259 15.3 Chickpeas 343 516 802 1,615 1,592 1,175 1,042 1,211 2,521 5,056 39.5 Dry broad beans 10,780 10,547 22,564 27,604 29,382 31,364 30,084 26,630 22,089 35,434 13.9 Dry haricot beans 1,606 1,928 1,813 1,809 3,285 3,628 2,592 2,333 1,290 916 -3.2 Dry peas 69 75 744 320 489 1,984 4,156 8,634 4,566 3,911 80.7 Feed legumes (dry) 1,759 419 7,197 2,788 884 210 769 659 434 285 -31.9 Bitter vetch 0 0 0 0 0 0 0 0 0 23 Flowering sern 1,481 318 6,681 2,788 884 210 409 453 419 238 -33.4 Rambling vetch 278 101 516 0 0 0 360 206 15 24 -22.8 Grazing crops * 633,573 686,035 570,921 606,730 659,301 769,746 806,339 889,247 1,033,533 769,372 7.3 Grazing barley 368,385 397,111 307,295 408,569 477,947 581,159 467,716 551,202 702,049 552,735 11.0 Grazing flowering 102,978 121,318 138,167 70,268 46,587 74,820 170,113 75,359 73,966 52,233 -11.1 Grazing maize 11,139 22,413 15,859 21,546 18,989 22,415 78,649 147,779 141,682 72,614 48.9 Grazing alfalfa 100,829 92,876 77,850 76,940 91,061 67,579 62,920 82,749 81,593 77,314 -2.3 Grazing clover 4,322 7,727 3,814 4,593 9,139 6,400 11,018 6,914 9,591 4,841 6.1 Other grazing crops 45,920 44,590 27,936 24,814 15,578 17,373 15,923 25,244 24,652 9,635 -12.9 Source: Elaborated from MAAR, the AASA, various issues. *Green fodder.

State of Food and Agriculture in Syria 2010
257
Table A4.13. Continued
Item 1999 2000 2001 2002 2003 2004 2005 2006 2007 2008 AAGR%
99-08 Industrial crops 2,323,014 2,316,160 2,287,406 2,382,598 2,068,982 2,300,678 2,189,937 2,177,869 2,144,288 1,858,885 -2.3 Sugar beet 1,330,387 1,175,326 1,215,477 1,522,702 1,205,159 1,217,658 1,096,291 1,437,921 1,366,453 1,104,861 1.0 Seed cotton 926,096 1,081,888 1,009,826 802,178 811,026 1,029,232 1,021,996 685,705 711,497 697,841 -7.0 Soya beans 2,513 3,804 3,693 4,712 3,465 3,698 3,814 3,141 2,058 1,369 -8.1 Oily sunflower 722 314 2,638 1,527 2,010 863 1,188 639 830 432 -12.3 Indian millet 221 492 426 130 368 334 946 643 1,167 90 10.8 Sunflower 11,390 6,920 7,249 10,060 10,822 10,561 17,974 13,913 20,736 9,514 11.6 Tobacco 14,525 14,764 14,364 13,215 14,064 14,212 15,347 12,611 12,408 10,225 -4.2 Peanuts 34,684 28,106 29,574 20,485 16,154 18,073 24,552 16,232 22,381 18,770 -9.1 Sesame 1,311 2,995 1,583 2,038 2,959 2,857 3,763 3,298 2,804 2,665 8.3 Aniseeds 1,028 1,284 1,423 1,839 1,706 2,291 2,629 2,875 2,038 2,439 14.5 Cumin 137 258 1,080 3,560 1,228 850 743 674 479 777 5.5 Lupines 0 0 0 0 0 0 0 0 0 2 Black cumin 0 9 73 152 21 49 694 217 1,437 9,900 169.0 Other industrial crops 47 86 134 714 1,420 853 9,004 782 646 672 51.1 Vegetables 1,795,277 1,789,629 1,754,666 2,398,270 2,304,147 2,623,062 2,658,036 2,676,883 2,956,428 2,717,085 9.4 Green peas 14,229 13,214 15,730 22,135 17,235 22,757 21,379 12,168 19,345 16,292 2.1 Green broad beans 27,801 20,498 36,451 44,691 37,787 29,679 35,795 40,754 35,288 41,817 6.8 Green haricot beans 30,796 22,881 26,838 35,855 19,823 27,912 39,890 31,958 29,963 29,145 2.5 Green kidney beans 1,762 1,496 4,452 3,062 3,135 3,657 6,691 5,792 4,836 5,900 16.5 Cucumber and snake cucumber 86,762 82,886 93,787 124,460 112,069 115,008 116,866 97,409 121,111 119,110 5.1 Eggplants 114,594 123,670 110,931 133,402 137,722 157,923 154,384 158,613 153,148 165,186 6.4 Pumpkins 3,319 6,846 3,093 5,514 4,519 3,235 2,145 6,206 2,129 6,785 2.7 Lettuce 44,759 41,312 39,069 49,370 52,023 51,565 49,178 50,751 59,084 49,010 4.9 Green onion 32,286 41,447 41,545 68,846 34,429 36,164 38,306 41,692 36,140 40,974 0.6 Leaf beat 12,042 9,407 11,875 17,097 10,732 10,526 7,987 8,938 11,350 11,267 -1.1 Cauliflower 50,206 29,638 33,820 34,729 30,819 34,767 45,548 34,761 37,189 29,359 -2.3 Cabbages 56,467 42,225 42,559 50,565 38,391 36,826 39,029 37,834 32,751 37,198 -5.3 Potatoes 492,759 479,474 449,663 508,334 482,023 538,169 604,747 599,401 566,615 717,146 5.8 Field tomatoes 302,828 449,679 382,765 538,932 517,815 541,930 522,538 589,394 720,237 625,118 11.3 Dry onion 85,754 66,651 80,231 93,671 88,113 109,664 117,569 92,069 90,955 86,346 3.0 Green pepper 33,379 42,999 45,261 40,496 48,948 50,144 60,099 60,147 78,163 67,113 11.0 Okra 7,496 8,224 5,316 6,951 12,961 11,922 10,527 13,822 11,305 14,977 13.8

State of Food and Agriculture in Syria 2010
258
Table A4.13. Continued
Item 1999 2000 2001 2002 2003 2004 2005 2006 2007 2008 AAGR% 1999-2008
Vegetables (continued) Squash 82,221 64,221 60,265 93,060 72,110 87,600 118,679 79,045 90,176 96,340 5.1 Dry garlic 16,161 17,597 26,767 24,367 39,204 34,817 44,002 36,602 28,007 30,959 9.6 Water melon 207,451 136,890 150,835 333,451 385,486 544,205 411,735 491,274 564,678 338,335 23.0 Musk melon 23,870 27,837 33,187 77,867 57,693 51,626 55,780 60,522 127,668 48,943 22.8 Other vegetables 68,335 60,537 60,226 91,415 101,110 122,966 155,162 127,731 136,290 139,766 16.4 Fruit trees 1,341,760 1,446,303 1,456,758 1,384,710 1,346,316 1,484,142 1,474,463 1,702,838 1,716,470 1,829,485 4.3 Olives 40,654 65,386 62,899 92,979 106,424 107,740 124,059 139,294 110,210 137,587 18.0 Grapes 145,901 144,917 143,598 151,108 131,235 109,869 129,664 134,207 131,465 138,628 -1.4 Apples 155,506 154,304 153,069 113,623 163,604 193,800 172,869 203,102 170,230 186,043 3.9 Pistachios 3,241 3,699 5,900 9,886 9,359 4,275 7,658 13,034 10,350 10,291 21.3 Citrus 719,591 799,929 832,894 745,575 652,176 843,369 777,177 906,390 966,198 1,045,857 4.4 Pomegranates 68,623 56,563 61,311 48,939 52,666 43,899 45,719 42,233 51,164 47,973 -5.4 Apricots 58,445 72,408 61,212 94,807 96,983 71,823 60,762 92,161 105,984 95,113 8.8 Cherries 14,828 13,407 13,365 10,798 13,246 9,023 15,226 17,389 17,161 10,021 1.4 Almonds 2,229 2,440 3,781 7,641 7,993 7,171 11,157 8,983 6,853 8,456 23.5 Green plums 14,181 12,576 12,439 13,373 9,736 11,628 11,602 14,925 15,105 15,531 3.1 Plums 17,881 18,157 14,504 14,449 12,602 12,204 14,691 18,995 20,770 23,529 4.6 Pears 18,945 21,859 19,710 14,963 14,078 13,805 13,606 15,482 17,887 18,190 -3.2 Quince 6,235 6,375 5,245 3,279 2,878 2,371 3,227 3,285 3,406 2,872 -11.7 Peaches 38,532 38,694 34,333 32,554 32,539 25,584 49,257 53,510 54,802 53,967 7.8 Nuts 13,629 12,293 9,993 9,979 8,478 7,948 9,279 9,326 7,498 9,739 -5.9 Figs 6,358 6,814 6,396 5,953 3,731 3,541 3,613 3,499 3,180 3,244 -12.7 Loquats 722 710 846 837 991 1,077 1,368 1,273 1,386 1,428 12.4 Palms 2,630 2,680 3,550 3,014 4,001 4,105 4,306 3,242 3,425 3,472 2.7 Other trees 13,629 13,092 11,713 10,953 23,596 10,910 19,223 22,508 19,396 17,544 9.1 Total 8,366,483 8,853,746 9,153,613 10,400,266 10,115,410 10,868,739 10,887,275 11,326,941 11,334,045 9,568,145 4.1

State of Food and Agriculture in Syria 2010
259
Table A4.14. Development of the crop production for rain-fed crops, 1999-2008 (tonne, %)
Item 1999 2000 2001 2002 2003 2004 2005 2006 2007 2008 AAGR% 1999-2008
Total field crops 1,212,840 1,239,960 4,272,901 2,758,314 2,897,035 1,916,459 2,241,552 2,796,899 1,808,162 440,492 -5.6 Total cereals 1,042,298 908,809 3,869,781 2,337,052 2,523,807 1,626,679 1,916,878 2,457,560 1,557,791 338,480 -5.6 Food cereals 626,021 708,916 2,000,420 1,500,220 1,491,564 1,144,799 1,197,636 1,363,854 911,090 165,407 -6.1 Wheat 626,021 708,916 2,000,420 1,500,220 1,491,564 1,144,799 1,197,636 1,363,854 911,090 165,407 -6.1 Soft wheat 279,720 263,939 1,109,063 879,941 748,770 579,583 668,776 749,148 500,272 49,699 -4.7 Durum wheat 346,301 444,977 891,357 620,279 742,794 565,216 528,860 614,706 410,818 115,708 -7.5 Feed cereals (dry) 416,277 199,893 1,869,361 836,832 1,032,243 481,880 719,242 1,093,706 646,701 173,073 -5.1 Barley 414,018 197,682 1,866,794 834,282 1,027,806 479,308 716,053 1,089,863 643,971 171,865 -5.1 Maize 4 3 22 49 286 36 104 30 5 102 36.4 Sorghum 2,123 2,087 2,462 2,496 4,150 2,532 3,084 3,810 2,724 1,102 2.7 Oats 132 121 83 5 1 4 1 3 1 4 -52.6 Legumes (dry) 85,136 157,971 269,783 254,059 285,702 198,778 247,007 267,190 181,866 68,083 0.2 Food legumes (dry) 74,889 138,877 241,536 224,611 257,841 174,320 222,499 236,759 157,739 58,344 -0.1 Lentils 43,256 72,552 175,620 132,276 168,073 124,776 153,317 180,663 106,210 31,857 1.8 Chickpeas 28,539 64,022 59,250 87,166 85,364 44,083 64,185 50,673 47,523 22,050 -4.6 Dry broad beans 3,081 2,266 5,687 3,698 2,653 4,417 3,869 3,979 2,773 2,632 -3.2 Dry haricot beans 0 0 0 8 24 27 3 9 14 13 Dry peas 13 37 979 1,463 1,727 1,017 1,125 1,436 1,219 1,792 34.0 Feed legumes (dry) 10,247 19,094 28,247 29,448 27,861 24,458 24,508 30,430 24,127 9,739 2.2 Bitter vetch 1,671 4,910 3,888 5,268 7,276 6,546 2,946 3,383 2,954 1,429 -5.8 Flowering sern 4,523 6,890 11,801 11,690 4,152 5,946 9,508 14,084 13,796 2,981 5.9 Rambling vetch 4,053 7,294 12,558 12,490 16,433 11,966 12,054 12,964 7,377 5,329 1.4 Grazing crops * 64,019 145,251 84,182 51,423 20,479 52,714 29,620 21,650 33,307 8,432 -26.4 Grazing barley 30,483 69,307 13,480 7,436 3,724 18,649 2,438 2,935 1,883 1,908 -43.2 Grazing flowering 12,907 30,814 49,105 19,452 10,562 4,121 10,760 10,744 14,472 3,425 -21.0 Grazing maize 20,629 45,130 21,597 23,779 4,897 28,600 16,422 6,063 13,136 1,068 -25.3 Grazing alfalfa 0 0 0 0 0 0 0 0 0 0 Grazing clover 0 0 0 0 0 0 0 0 0 82 Other grazing crops 0 0 0 756 1,296 1,344 0 1,908 3,816 1,949 Source: Elaborated from MAAR, the AASA, various issues. *Green fodder.

State of Food and Agriculture in Syria 2010
260
Table A4.14. Continued
Item 1999 2000 2001 2002 2003 2004 2005 2006 2007 2008 AAGR% 1999-2008
Industrial crops 21,350 27,898 49,068 115,750 66,952 37,894 46,297 50,499 35,098 25,344 2.4 Sugar beet 0 0 0 0 0 0 0 0 0 0 Seed cotton 0 0 0 0 0 0 0 0 0 0 Soya beans 0 0 0 0 0 0 0 0 0 0 Oily sunflower 0 0 0 3 0 0 34 22 0 0 Indian millet 855 326 2,136 203 446 52 35 45 40 21 -49.8 Sunflower 1,863 1,711 2,372 886 1,437 1,524 673 758 907 690 -16.9 Tobacco 10,175 11,348 14,438 12,346 12,145 11,730 13,523 12,285 11,658 9,833 -1.2 Peanuts 0 0 0 0 0 231 0 0 0 0 Sesame 1,561 963 1,239 5,250 4,554 1,576 862 1,163 415 212 -13.8 Aniseeds 135 27 9 2 7 12 25 27 28 20 -15.2 Cumin 6,618 12,154 27,499 93,090 46,306 20,926 29,106 33,655 19,435 9,468 6.2 Lupines 49 50 9 52 105 12 2 6 10 14 -22.6 Black cumin 94 1,319 1,366 3,918 1,952 1,831 2,037 2,537 2,605 5,086 29.8 Other industrial crops 37 31 87 30 96 394 1,750 0 99 153 10.2 Vegetables 166,637 175,709 229,330 267,332 479,171 462,666 328,690 241,990 189,431 158,547 0.6 Green peas 914 1,540 1,699 1,443 1,079 1,578 1,756 5,251 4,340 3,916 26.6 Green broad beans 8,314 10,094 9,014 8,156 7,066 9,639 8,330 10,223 7,688 8,496 -0.8 Green haricot beans 35 57 52 238 204 231 280 45 144 415 33.2 Green kidney beans 884 1,066 1,561 1,841 1,611 2,004 1,995 1,451 1,502 320 -1.4 Cucumber and snake cucumber 7,052 8,416 8,218 16,493 39,956 34,066 29,864 32,273 25,415 20,777 27.1 Eggplants 0 0 0 0 1 37 0 0 0 27 Pumpkins 8,252 9,134 13,527 10,755 14,032 34,064 19,235 20,354 26,300 31,721 20.5 Lettuce 4,943 4,973 3,688 4,313 5,394 5,366 2,608 4,847 3,118 3,366 -3.6 Green onion 8,663 9,913 9,591 6,979 9,641 9,822 9,277 11,361 10,221 7,476 0.6 Leaf beat 2,726 2,648 1,833 2,944 4,359 3,369 1,402 1,746 1,865 1,420 -6.9 Cauliflower 148 166 157 142 124 60 40 52 140 274 -0.2 Cabbages 657 651 634 651 951 585 490 822 1,214 1,757 14.3 Potatoes 6,444 5,304 3,772 4,819 4,582 3,574 3,733 4,010 3,513 3,346 -6.9 Field tomatoes 26,523 24,294 41,949 22,630 21,413 16,832 12,206 13,194 11,014 14,413 -16.1 Dry onion 5,246 5,266 4,258 3,209 6,618 6,921 7,503 11,134 7,537 7,882 12.4 Green pepper 0 0 0 0 1 11 473 0 623 60 Okra 4,188 3,266 7,511 5,295 7,210 9,646 5,552 8,224 3,985 5,104 3.0

State of Food and Agriculture in Syria 2010
261
Table A4.14. Continued
Item 1999 2000 2001 2002 2003 2004 2005 2006 2007 2008 AAGR% 1999-2008
Vegetables (continued) Squash 6,248 314 463 960 1,299 251 515 1,124 2,495 442 -10.4 Dry garlic 1,896 1,994 1,807 2,353 2,329 2,118 2,588 3,467 1,565 1,468 2.7 Water melon 51,072 64,640 77,104 146,636 288,707 267,874 176,570 71,187 42,038 28,387 -6.0 Musk melon 20,836 20,335 40,380 22,217 58,453 50,304 39,483 37,358 31,088 12,007 -0.3 Other vegetables 1,596 1,638 2,112 5,258 4,141 4,314 4,790 3,867 3,626 5,473 19.4 Fruit trees 927,338 1,420,060 983,415 1,418,555 1,056,714 1,446,461 1,166,252 1,717,772 887,610 1,237,364 2.9 Olives 359,855 800,666 434,053 847,962 445,853 919,426 488,164 1,051,487 385,100 689,446 5.9 Grapes 241,085 264,533 245,391 190,778 176,108 132,877 176,713 202,547 141,563 142,311 -8.3 Apples 128,207 132,469 109,894 102,139 143,111 164,365 123,188 171,226 110,017 174,654 4.2 Pistachios 26,892 36,224 31,536 42,967 38,188 16,908 36,984 60,149 41,716 42,265 8.8 Citrus 28 71 555 610 355 726 640 626 672 599 23.7 Pomegranates 9,869 12,601 13,532 7,019 9,016 8,263 8,451 8,886 9,533 8,311 -5.8 Apricots 4,469 6,465 4,811 6,095 7,932 3,851 4,751 6,377 6,754 5,789 3.7 Cherries 39,284 42,878 37,430 28,909 41,549 26,335 38,215 45,593 57,873 38,261 3.5 Almonds 55,468 59,848 45,706 131,387 132,256 115,855 217,878 98,134 69,240 74,160 8.4 Green plums 757 502 575 654 729 837 687 706 685 693 2.6 Plums 8,200 8,011 8,337 8,293 7,905 7,841 7,955 7,379 9,789 7,998 0.5 Pears 7,658 8,759 7,881 5,179 6,305 6,706 6,161 6,668 6,784 6,387 -4.0 Quince 1,884 1,870 1,751 1,453 1,442 1,497 1,587 1,253 1,549 1,429 -5.1 Peaches 3,063 3,340 3,302 2,766 2,498 1,779 2,350 2,574 2,591 2,394 -4.9 Nuts 2,424 2,712 2,550 2,787 3,422 3,276 3,193 3,421 3,547 3,016 5.4 Figs 35,460 37,257 33,623 37,447 37,358 33,155 46,268 47,885 37,906 37,018 2.9 Loquats 242 256 391 346 416 600 665 469 485 532 10.8 Palms 370 371 371 50 32 40 64 16 27 13 -45.0 Other trees 2,123 1,227 1,727 1,714 2,239 2,124 2,338 2,376 1,779 2,089 4.2 Total 2,306,815 2,835,729 5,485,646 4,444,200 4,432,920 3,825,586 3,736,494 4,756,661 2,885,203 1,836,403 -2.3

State of Food and Agriculture in Syria 2010
262
Table A4.15. Development of the number of fruit trees and their productivity by selected crops and governorates, 1999-2008 (number: 000 trees; yield: kg/tree)
Item Total number Olives Apples Citrus Grapes
T FB Number Yield Number Yield Number Yield Number Yield
T FB IR NI A T FB IR NI A T FB IR NI A T FB IR NI A 1999 198,235 132,303 63,379 38,148 16 10 10 16,192 10,120 35 23 28 10,746 7,868 92 1 91 52,706 45,785 22 6 8 2000 195,510 134,106 64,344 40,306 23 21 21 16,204 10,650 34 22 27 10,793 8,130 99 4 98 49,353 43,922 22 7 9 2001 197,166 136,109 66,061 43,807 20 11 11 16,187 10,416 33 19 25 10,904 8,411 99 27 99 48,589 41,770 25 7 9 2002 182,918 134,338 71,025 51,374 22 18 18 14,605 10,294 25 18 21 9,819 8,593 87 26 87 35,773 30,384 28 8 11 2003 182,097 132,444 73,948 52,689 22 9 10 13,459 9,766 41 25 31 9,966 8,921 73 13 73 33,375 27,734 30 8 11 2004 198,105 139,098 75,990 55,774 21 18 18 13,979 10,130 46 28 35 10,599 9,443 90 12 89 46,265 27,720 23 6 9 2005 203,032 142,722 78,968 58,101 20 9 11 14,014 10,344 40 20 29 10,817 9,488 82 10 82 46,445 27,202 28 8 11 2006 210,733 148,831 82,299 61,248 21 19 19 14,410 10,749 46 27 35 11,456 9,988 91 9 91 47,031 27,948 25 9 12 2007 216,428 153,017 87,514 64,159 16 7 8 14,306 9,933 38 20 28 12,105 10,557 92 10 92 46,619 28,660 21 6 10 2008 220,832 157,235 90,429 66,394 17 12 12 14,638 10,478 41 29 34 12,507 11,087 95 9 94 46,559 28,663 22 6 10
Distribution by governorates in 2008 Sweida 10,335 7,382 1,587 1,049 9 2 2 2,581 1,626 23 35 35 0 0 0 0 0 4,892 4,020 12 6 6 Dar'a 8,368 6,683 6,246 4,588 19 10 12 0 0 0 0 0 111 106 25 9 17 1,747 1,732 36 10 33 Quneitra 1,667 890 642 324 16 10 11 253 139 35 25 29 0 0 0 0 0 414 215 25 8 11 Damascus 21,908 16,101 3,465 2,385 14 4 12 3,939 3,179 30 12 24 2 2 15 0 15 3,254 2,836 20 5 16 Homs 63,354 31,880 11,740 5,454 13 9 10 3,371 1,720 69 43 58 217 195 28 0 28 25,522 9,632 8 3 4 Hama 20,668 15,335 8,942 4,923 14 6 7 852 605 35 25 27 50 45 13 4 12 4,353 4,161 17 7 8 Al-Ghab 903 678 446 320 33 17 19 6 5 31 19 22 56 52 20 11 19 142 140 10 5 6 Idleb 19,605 17,193 13,770 11,716 26 11 12 683 657 49 40 44 49 43 45 0 45 719 705 37 14 17 Tartous 14,967 13,424 9,644 8,665 19 15 15 1,095 995 32 19 23 2,612 2,344 74 0 74 448 428 41 28 28 Lattakia 23,652 20,022 10,303 8,735 28 25 25 1,647 1,360 40 35 37 9,367 8,277 104 0 104 308 267 31 27 29 Aleppo 32,073 25,940 21,444 17,164 19 7 8 145 139 28 10 27 1 1 28 0 28 4,515 4,353 47 8 10 Al-Raqqa 2,191 1,167 1,818 959 16 20 16 6 5 44 0 44 11 4 35 0 35 129 86 20 14 20 Dair-Ezzor 933 396 327 78 21 21 42 36 24 0 24 31 19 24 0 24 31 24 22 0 22 Hassake 209 144 55 34 11 11 18 12 10 0 10 0 0 0 0 0 86 64 9 10 9 Source: Elaborated from MAAR, the AASA, 2008. T: Total; FB: Fruit bearing; IR: Irrigated; NR: Non-irrigated; A: Average.

State of Food and Agriculture in Syria 2010
263
Table A4.16. Development of the number of livestock, 1999-2009 (000 heads) Item Total cattle Milked cows Total sheep Milked sheep Total goats Milked goats Total poultry Layers 1999 978 465 13,998 8,993 1,046 732 21,009 13,623 2000 984 459 13,505 8,622 1,050 736 21,629 14,176 2001 837 416 12,362 8,100 979 662 21,122 13,902 2002 867 452 13,497 9,070 932 631 28,634 17,637 2003 937 459 15,293 10,090 1,017 699 25,058 19,011 2004 1,024 528 17,565 11,694 1,131 745 28,861 20,867 2005 1,083 561 19,651 13,020 1,296 881 23,795 15,854 2006 1,121 597 21,380 14,240 1,420 966 30,946 18,513 2007 1,168 630 22,865 15,771 1,561 1,064 26,096 17,468 2008 1,109 607 19,237 13,482 1,579 1,091 23,143 15,547 2009 1,085 605 18,336 12,122 1,508 1,005 24,490 16,338
Average 1(1999-2001) 933 446 13,289 8,572 1,025 710 21,253 13,900 Average 2 (2003-2005) 1,015 516 17,503 11,601 1,148 775 25,905 18,577 Average 3 (2007-2009) 1,121 614 20,146 13,792 1,549 1,053 24,576 16,451 Average change 1 % (3/2) 10.4 19.0 15.1 18.9 35.0 35.9 -5.1 -11.4 Average change 2 % (3/1) 20.1 37.7 51.6 60.9 51.2 48.4 15.6 18.4 AAGR % (3/1) 3.1 5.5 7.2 8.2 7.1 6.8 2.5 2.8
Distribution by governorates in 2008 (cattle, sheep and goats: per head; poultry: 000 heads) Sweida 8,253 5,446 378,137 305,784 87,217 71,010 422 297 Dar'a 44,476 24,463 515,367 349,510 62,800 41,298 1,248 964 Quneitra 22,662 10,139 173,500 112,775 10,250 6,663 155 92 Damascus 214,881 130,442 1,683,625 1,136,205 342,395 233,004 5,623 3,869 Homs 113,753 78,847 2,542,058 2,339,929 102,734 97,923 4,685 3,104 Hama 61,032 41,614 2,685,742 1,784,576 132,654 90,228 1,579 1,117 Al-Ghab 50,625 28,405 162,822 102,556 42,316 28,557 221 158 Idleb 54,423 25,969 771,923 536,822 128,231 88,682 1,557 1,045 Tartous 37,204 20,785 58,042 44,099 14,080 9,534 455 345 Lattakia 39,963 17,512 110,601 69,782 10,428 7,487 509 314 Aleppo 86,992 63,965 3,317,950 2,376,637 181,811 140,670 2,474 1,754 Al-Raqqa 21,391 15,330 2,262,102 1,530,043 177,843 122,279 388 239 Dair-Ezzor 256,976 105,471 2,875,270 1,858,297 75,225 48,085 428 230 Hassake 96,571 38,121 1,699,564 934,761 210,660 105,755 3,399 2,019 Source: Elaborated from MAAR, the AASA, various issues.

State of Food and Agriculture in Syria 2010
264
Table A4.17. Development of livestock productivity, 1999-2009 (cattle, sheep and goats: kg milk/head; layers: egg/chicken)
Item Total Cows
Local Cows
Shami Cows
Improved Cows
Foreign Cows
Sheep Total Goats
Shami Goats
Mountainous Goats
Total Layers
Farm Layers
Local Layers
1999 2,460 746 2,015 2,407 3,730 50 90 208 85 182 213 99 2000 2,520 946 2,014 2,468 3,806 52 96 301 87 180 201 100 2001 2,484 766 1,989 2,626 3,848 60 93 228 89 192 211 105 2002 2,595 896 1,708 2,597 4,316 59 89 327 82 188 196 99 2003 2,632 754 2,230 2,675 4,249 59 102 413 92 181 191 96 2004 2,582 818 2,387 2,646 4,277 59 97 375 89 192 192 92 2005 2,682 845 1,588 2,710 4,052 59 92 291 86 196 204 88 2006 2,705 1,306 2,021 2,694 4,187 58 94 373 88 204 208 117 2007 2,710 1,247 2,265 2,646 4,073 55 91 385 84 196 196 104 2008 2,653 860 2,555 2,616 4,274 53 91 380 83 195 173 106 2009 2,645 1,572 2,353 2,550 4,539 58 97 411 88 199 182 107
Average 1(1999-2001) 2,488 819 2,006 2,500 3,795 54 93 246 87 185 208 101 Average 2 (2003-2005) 2,632 806 2,068 2,677 4,193 59 97 360 89 190 195 92 Average 3 (2007-2009) 2,669 1,226 2,391 2,604 4,295 56 93 392 85 197 184 106 Average change 1 % (3/2) 1.4 52.2 15.6 -2.7 2.4 -5.9 -4.3 8.9 -4.5 3.5 -5.8 14.9 Average change 2 % (3/1) 7.3 49.7 19.2 4.2 13.2 2.8 -0.2 59.3 -2.3 6.3 -11.7 4.6 AAGR % (3/1) 1.2 7.0 3.0 0.7 2.1 0.5 0.0 8.1 -0.4 1.0 -2.1 0.8
Distribution by governorates in 2008 Sweida 3,602 3,602 60 80 457 79 230 293 106 Dar'a 2,366 800 2,100 5,377 55 56 311 55 201 172 89 Quneitra 2,074 750 1,800 3,500 60 86 424 70 171 189 90 Damascus 3,195 2,000 3,000 4,011 60 118 425 85 231 205 93 Homs 2,311 2,300 5,379 58 80 80 80 236 150 88 Hama 2,712 778 2,000 2,599 3,725 60 85 422 85 189 68 89 Al-Ghab 2,791 775 2,650 4,239 62 86 86 92 23 100 Idleb 2,538 827 2,541 66 89 197 87 178 193 89 Tartous 3,081 947 3,075 4,280 67 105 432 101 171 155 136 Lattakia 3,126 620 3,082 4,410 62 100 389 80 219 254 95 Aleppo 3,007 722 2,748 4,862 60 108 200 108 140 144 97 Al-Raqqa 1,422 900 2,735 1,500 4,000 44 66 125 66 219 301 87 Dair-Ezzor 2,364 735 2,051 2,570 4,511 30 45 45 122 244 92 Hassake 1,879 986 4,547 2,118 5,365 47 96 108 95 127 281 118 Source: Elaborated from MAAR, the AASA, various issues.

State of Food and Agriculture in Syria 2010
265
Table A4.18. Development of livestock products, 1999-2009 (tonne)
Item Total Meat
Red Meat
Cattle Meat
Sheep Meat
Goat Meat
Poultry Meat
Fish Total Milk
Cow Milk
Sheep Milk
Goat Milk
Eggs (000 eggs)
1999 347,636 229,085 47,037 176,744 5,304 104,380 14,171 1,656,085 1,143,423 445,913 65,853 2,479,164 2000 355,820 235,849 47,079 184,137 4,633 106,602 13,369 1,673,204 1,156,393 445,558 70,322 2,545,897 2001 345,714 215,967 42,497 168,548 4,922 115,576 14,171 1,577,782 1,032,322 482,809 61,714 2,671,273 2002 312,955 173,169 47,292 120,900 4,977 124,620 15,166 1,765,392 1,173,527 535,873 55,992 3,320,780 2003 383,872 206,894 47,343 152,767 6,784 160,850 16,128 1,878,174 1,207,116 596,036 71,198 3,448,997 2004 405,367 216,336 48,426 161,308 6,602 171,821 17,210 2,128,658 1,364,359 690,054 72,340 4,002,052 2005 422,793 242,380 55,411 179,912 7,057 163,433 16,980 2,357,566 1,505,509 765,851 81,169 3,104,095 2006 447,632 255,475 60,570 187,467 7,437 174,990 17,167 2,534,682 1,615,683 824,067 91,138 3,780,882 2007 471,751 278,939 65,944 204,567 8,428 174,932 17,880 2,679,596 1,705,858 873,673 96,967 3,427,607 2008 453,159 257,191 64,247 184,500 8,444 180,378 15,590 2,425,043 1,609,365 712,921 99,240 3,027,885 2009 459,195 261,168 63,411 189,537 8,220 183,621 14,406 2,409,190 1,600,269 706,023 96,995 3,248,622
Average 1(1999-2001) 349,723 226,967 45,538 176,476 4,953 108,853 13,904 1,635,690 1,110,713 458,093 65,963 2,565,445 Average 2 (2003-2005) 404,011 221,870 50,393 164,662 6,814 165,368 16,773 2,121,466 1,358,995 683,980 74,902 3,518,381 Average 3 (2007-2009) 461,368 265,766 64,534 192,868 8,364 179,644 15,959 2,504,610 1,638,497 764,206 97,734 3,234,705 Average change 1 % (3/2) 14.2 19.8 28.1 17.1 22.7 8.6 -4.9 18.1 20.6 11.7 30.5 -8.1 Average change 2 % (3/1) 31.9 17.1 41.7 9.3 68.9 65.0 14.8 53.1 47.5 66.8 48.2 26.1 AAGR % (3/1) 4.7 2.7 6.0 1.5 9.1 8.7 2.3 7.4 6.7 8.9 6.8 3.9
Distribution by governorates in 2008 Sweida 5,433 3,346 758 2,251 337 2,087 0 43,668 19,619 18,402 5,647 68,194 Dar'a 38,803 8,262 2,656 5,235 371 30,386 155 79,427 57,889 19,221 2,317 193,641 Quneitra 3,895 2,481 1,072 1,376 33 1,383 31 28,371 21,028 6,767 576 15,754 Damascus 39,387 29,010 14,405 12,777 1,828 10,377 0 512,400 416,720 68,162 27,518 895,576 Homs 57,246 40,548 4,982 35,099 467 16,138 560 325,782 182,226 135,720 7,836 731,878 Hama 65,883 29,335 4,678 24,124 533 35,743 805 227,824 112,843 107,073 7,696 211,519 Al-Ghab 9,727 3,694 2,045 1,428 221 631 5,402 88,701 79,270 6,376 2,455 14,486 Idleb 42,932 14,624 3,437 10,564 623 28,004 304 109,345 65,902 35,576 7,867 185,601 Tartous 30,647 2,873 2,409 403 61 26,932 842 67,990 64,036 2,953 1,001 59,088 Lattakia 8,252 2,948 1,943 963 42 2,323 2,981 59,803 54,739 4,313 751 68,837 Aleppo 66,874 44,101 4,378 38,455 1,268 20,943 1,830 349,389 192,362 141,824 15,203 246,354 Al-Raqqa 24,365 21,699 450 20,359 890 533 2,133 96,852 21,795 66,868 8,091 52,232 Dair-Ezzor 30,983 29,131 12,240 16,533 358 1,597 255 307,201 249,289 55,748 2,164 28,000 Hassake 28,732 25,139 8,794 14,933 1,412 3,301 292 128,290 71,647 43,918 10,118 256,725 Source: Elaborated from MAAR, the AASA, various issues.

State of Food and Agriculture in Syria 2010
266
Table A4.19. Development of the cost of agricultural production, 1999-2009 (total cost: SP/ha, unit cost: SP/kg, price: SP/kg and yield: kg/ha) Item 1999 2000 2001 2002 2003 2004 2005 2006 2007 2008 2009 AAGR %
Sugar beet Total cost of agricultural operations 47,847 47,846 44,008 45,112 50,313 48,481 48,468 50,742 54,434 78,074 77,039 7.0 Total cost of production inputs 37,731 37,425 35,020 36,111 37,026 38,042 37,657 37,146 39,575 58,421 72,376 7.5 Other total cost 22,153 22,124 20,470 21,064 22,599 22,451 22,323 22,698 25,663 37,324 41,645 8.3 Total cost 107,731 107,395 99,498 102,287 109,938 108,974 108,448 110,586 119,672 173,819 191,060 7.5 Average yield 45,000 45,000 43,000 43,500 45,315 45,470 45,414 45,214 44,906 44,330 44,812 0.1 Unit cost 2.4 2.4 2.3 2.4 2.4 2.4 2.4 2.5 2.7 3.9 4.3 7.1 Official price 2.3 2.3 2.3 2.3 2.3 2.3 2.3 2.7 2.7 3.8 3.75 6.8 Competitiveness index 1.06 1.06 1.03 1.05 1.08 1.07 1.06 0.91 0.99 1.05 1.14 -0.6 Seed cotton Total cost of agricultural operations 45,298 46,373 44,476 46,131 47,171 44,886 47,992 51,399 55,475 72,586 76,591 7.0 Total cost of production inputs 32,421 32,684 32,526 35,062 35,442 35,690 35,811 36,486 36,867 69,364 68,321 10.2 Other total cost 20,035 20,365 19,869 20,991 21,350 20,881 21,641 22,636 25,010 39,550 40,153 9.6 Total cost 97,754 99,422 96,871 102,184 103,963 101,457 105,444 110,521 117,352 181,500 185,065 8.7 Average yield 3,400 3,600 3,700 3,900 3,890 3,939 4,058 4,117 3,967 3,902 3,903 1.6 Unit cost 28.8 27.6 26.2 26.2 26.7 25.8 26 26.8 29.6 33.2 47.42 4.9 Official price 30.8 30.8 30.8 30.8 30.8 30.8 30.8 30.8 30.8 41 42 3.5 Competitiveness index 0.93 0.9 0.85 0.85 0.87 0.84 0.84 0.87 0.96 0.81 1.13 1.2 Irrigated wheat Total cost of agricultural operations 14,606 14,611 12,959 13,038 14,439 13,734 13,814 14,346 14,895 16,976 23,317 4.6 Total cost of production inputs 17,812 17,860 16,550 16,318 17,453 16,855 16,792 16,852 16,852 19,870 24,905 2.8 Other total cost 8,532 8,547 7,798 7,754 8,402 8,069 8,081 8,226 8,946 10,379 13,421 4.7 Total cost 40,949 41,018 37,306 37,109 40,294 38,657 38,686 39,424 40,692 47,225 61,643 3.8 Average yield 3,453 3,453 3,400 3,550 3,703 3,823 4,001 4,119 4,194 4,113 3,816 2.7 Unit cost 11.9 11.9 11 10.5 10.9 10.1 9.7 9.6 9.7 11.5 16.16 1.2 Official price 11.3 11.3 11.3 11.3 11.3 11.3 11.3 11.3 11.3 16.8 19.75 5.9 Competitiveness index 1.05 1.05 0.97 0.93 0.96 0.9 0.86 0.85 0.86 0.69 0.82 -3.9 Irrigated soft wheat Total cost of agricultural operations 14,645 14,650 12,944 13,046 14,443 13,746 13,827 14,369 14,908 16,981 23,329 4.6 Total cost of production inputs 17,710 17,760 16,422 16,203 17,335 16,727 16,664 16,724 16,724 19,760 24,905 2.8 Other total cost 8,516 8,532 7,758 7,726 8,371 8,053 8,048 8,199 8,910 10,347 13,424 4.7 Total cost 40,871 40,942 37,124 36,975 40,149 38,526 38,539 39,292 40,542 47,088 61,658 3.9 Average yield 3,560 3,560 3,400 3,600 3,742 3,858 4,058 4,198 4,252 4,141 3,834 2.5 Source: Elaborated from MAAR, the AASA, various issues. AAGR: Estimated for the 1999-2009 period. Average yield: five years average.

State of Food and Agriculture in Syria 2010
267
Table A4.19. Continued Item 1999 2000 2001 2002 2003 2004 2005 2006 2007 2008 2009 AAGR %
Irrigated soft wheat (continued) Unit cost 11.5 11.5 10.9 10.3 10.7 10.0 9.5 9.4 9.5 11.4 16.1 1.5 Official price 10.8 10.8 10.8 10.8 10.8 10.8 10.8 10.8 10.8 16.5 19.5 6.3 Competitiveness index 1.1 1.1 1.0 1.0 1.0 0.9 0.9 0.9 0.9 0.7 0.8 -4.4 Irrigated hard wheat Total cost of agricultural operations 14,567 14,572 12,974 13,029 14,435 13,722 13,801 14,323 14,881 16,971 23,305 4.6 Total cost of production inputs 17,913 17,960 16,677 16,432 17,570 16,982 16,919 16,979 16,979 19,980 24,905 2.8 Other total cost 8,548 8,561 7,837 7,782 8,433 8,084 8,113 8,253 8,982 10,411 13,418 4.7 Total cost 41,028 41,093 37,488 37,243 40,438 38,788 38,833 39,555 40,842 47,362 61,628 3.8 Average yield 3,346 3,346 3,400 3,500 3,663 3,788 3,943 4,039 4,136 4,085 3,797 3.0 Unit cost 12.3 12.3 11 10.6 11 10.2 9.9 9.8 9.9 11.6 16.23 0.9 Official price 11.8 11.8 11.8 11.8 11.8 11.8 11.8 11.8 11.8 17 20 5.5 Competitiveness index 1.04 1.04 0.93 0.9 0.94 0.87 0.83 0.83 0.84 0.68 0.81 -4.1 Rain-fed hard wheat Total cost of agricultural operations 4,340 4,341 3,683 3,788 4,286 4,077 4,330 4,431 4,566 5,021 6,939 5.0 Total cost of production inputs 4,918 4,928 4,974 4,971 5,030 4,813 5,553 5,563 5,563 5,719 5,563 2.2 Other total cost 2,423 2,419 2,288 2,320 2,452 2,341 2,615 2,644 2,867 3,018 3,397 4.5 Total cost 11,681 11,688 10,945 11,079 11,768 11,231 12,498 12,638 12,996 13,758 15,899 3.7 Average yield 770 770 950 1,200 1,268 1,292 1,418 1,516 1,466 1,412 1,148 8.3 Unit cost 15.2 15.2 11.5 9.2 9.3 8.7 8.8 8.3 8.9 9.7 13.8 -4.2 Official price 11.8 11.8 11.8 11.8 11.8 11.8 11.8 11.8 11.8 17 20 5.5 Competitiveness index 1.29 1.29 0.98 0.78 0.79 0.74 0.75 0.71 0.75 0.57 0.69 -9.2 Rain-fed barley Total cost of agricultural operations 3,405 3,406 2,784 2,839 3,233 3,051 3,054 3,132 3,165 3,508 5,195 3.6 Total cost of production inputs 1,968 1,979 1,960 1,968 1,972 1,811 1,806 1,836 1,836 2,297 2,049 0.8 Other total cost 1,361 1,365 1,215 1,233 1,325 1,242 1,234 1,274 1,335 1,558 1,861 3.2 Total cost 6,734 6,750 5,959 6,040 6,530 6,104 6,094 6,242 6,336 7,363 9,105 2.7 Average yield 625 625 550 650 638 696 714 794 670 629 485 -0.1 Unit cost 10.8 10.8 10.8 9.3 10.2 8.8 8.5 7.9 9.5 11.7 18.8 3.6 Official price 7.5 7.5 7.5 12 7.5 7.5 7.5 9.5 9.5 15 16 10.3 Competitiveness index 1.44 1.44 1.44 0.77 1.36 1.17 1.14 0.83 1 0.78 1.17 -5.7 Rain-fed lentils Total cost of agricultural operations 9,118 9,118 6,884 7,090 8,163 7,972 8,683 9,788 10,366 12,180 15,807 7.3 Total cost of production inputs 4,358 4,366 4,403 4,384 4,418 4,545 4,539 4,645 4,641 5,635 10,361 7.8

State of Food and Agriculture in Syria 2010
268
Table A4.19. Continued Item 1999 2000 2001 2002 2003 2004 2005 2006 2007 2008 2009 AAGR %
Rain-fed lentils (continued) Other total cost 3,128 3,130 2,615 2,659 2,921 2,914 3,088 3,362 3,666 4,418 6,800 9.0 Total cost 16,604 16,614 13,902 14,133 15,502 15,431 16,310 17,795 18,673 22,233 32,968 7.8 Average yield 621 621 750 800 868 759 864 1,114 1,100 1,026 831 6.8 Unit cost 24.2 26.8 16.4 15.7 16 15.5 14.5 14.5 15.5 20.1 39.7 1.9 Official price 16 16 16 16 16 16 16 23 23 23 23 6.2 Competitiveness index 1.51 1.67 1.03 0.98 1 0.97 0.9 0.63 0.67 0.87 1.7 -4.1 Rain-fed chickpeas Total cost of agricultural operations 8,950 8,950 7,214 7,459 8,372 8,158 8,379 9,104 9,712 11,423 15,413 6.5 Total cost of production inputs 3,923 3,932 4,589 4,579 4,430 3,958 3,972 4,042 4,045 5,853 6,222 4.4 Other total cost 3,245 3,247 3,028 3,081 3,255 3,063 3,122 3,316 3,601 4,589 5,651 6.4 Total cost 16,118 16,129 14,831 15,119 16,057 15,179 15,473 16,462 17,358 21,865 27,286 5.9 Average yield 650 650 650 700 722 739 743 766 776 717 605 1.2 Unit cost 24.8 24.8 22.8 21.6 22.2 20.5 20.8 21.5 22.4 30.5 45.1 5.2 Official price 17.8 17.9 17.9 17.9 17.9 17.9 17.9 25 25 25 25 5.8 Competitiveness index 1.39 1.39 1.28 1.21 1.25 1.15 1.17 0.86 0.89 1.22 1.80 -1.2 Irrigated maize Total cost of agricultural operations 22,549 22,549 21,085 21,087 23,408 17,529 18,336 19,377 21,332 31,524 31,985 4.2 Total cost of production inputs 18,612 18,683 16,339 17,440 18,140 10,512 10,288 10,307 10,317 10,373 15,763 -6.2 Other total cost 10,686 10,707 9,686 10,004 10,755 7,169 7,297 7,546 8,370 10,790 12,642 0.4 Total cost 51,847 51,939 47,110 48,531 52,303 35,210 35,921 37,230 40,019 52,687 60,390 0.2 Average yield 4,600 4,600 3,700 3,600 3,687 3,635 3,652 3,698 3,725 3,619 3,813 -2.4 Unit cost 11.3 11.3 12.7 13.5 14.2 10 9.8 10.1 10.7 14.6 15.8 2.5 Official price 8 8 8 8 8 8 8 8 11 17 17 11.0 Competitiveness index 1.41 1.41 1.59 1.69 1.77 1.25 1.23 1.26 0.98 0.86 0.93 -7.8 Total potato Total cost of agricultural operations 51,185 51,185 44,650 44,826 48,526 46,917 42,517 44,621 42,982 70,638 70,533 3.8 Total cost of production inputs 86,066 85,153 80,801 82,602 81,850 85,599 91,494 97,702 126,778 196,683 132,763 10.4 Other total cost 36,893 36,623 33,836 34,386 35,040 35,757 36,415 38,699 51,163 80,296 59,576 10.1 Total cost 174,144 172,961 159,287 161,815 165,416 168,273 170,427 181,023 220,922 347,617 262,871 8.6 Average yield 21,000 21,000 21,000 20,667 21,817 21,369 21,229 21,710 22,312 22,309 22,280 1.0 Unit cost 8.3 8.3 7.6 7.9 7.7 8 8.1 8.4 10 15.5 12.4 7.7

State of Food and Agriculture in Syria 2010
269
Table A4.19. Continued Item 1999 2000 2001 2002 2003 2004 2005 2006 2007 2008 2009 AAGR %
Autumn potato Total cost of agricultural operations 48,494 48,494 42,398 43,479 46,223 44,123 39,717 40,912 38,733 64,703 63,945 3.1 Total cost of production inputs 70,630 69,100 66,900 69,698 69,830 69,803 69,947 72,329 96,280 110,657 119,270 7.9 Other total cost 31,817 31,366 29,297 30,353 31,047 30,548 29,541 30,524 40,313 51,066 53,682 7.8 Total cost 150,941 148,960 138,595 143,530 147,100 144,474 139,205 143,765 175,326 226,426 236,897 6.5 Average yield 17,000 17,000 17,000 18,000 17,807 16,934 16,785 16,012 16,014 15,444 14,995 -1.5 Unit cost 8.9 8.8 8.2 8 8.3 8.5 8.3 9 11 14.7 15.8 8.2 Spring potato Total cost of agricultural operations 51,153 51,153 44,871 45,308 50,100 48,969 44,567 46,303 44,034 70,393 71,279 4.0 Total cost of production inputs 91,144 90,539 85,551 86,746 85,742 91,354 100,125 108,103 139,562 232,699 133,508 11.2 Other total cost 38,335 38,173 35,247 35,693 36,559 37,899 39,383 42,087 55,538 91,889 59,957 10.9 Total cost 180,632 179,865 165,669 167,747 172,401 178,222 184,075 196,493 239,134 394,981 264,744 9.3 Average yield 23,000 23,000 23,000 23,000 25,821 25,456 25,315 25,678 25,647 24,655 24,670 1.4 Unit cost 7.9 7.8 7.2 7.3 6.7 7 7.3 7.7 9.3 16 10.7 7.9 Summer potato Total cost of agricultural operations 53,909 53,909 46,682 45,692 49,256 47,659 43,267 46,648 46,178 76,817 76,375 4.3 Total cost of production inputs 96,423 95,819 89,951 91,362 89,977 95,639 104,411 112,675 144,491 246,694 145,510 11.3 Other total cost 40,526 40,331 36,963 37,113 37,514 38,825 40,322 43,486 57,638 97,934 65,088 11.0 Total cost 190,858 190,059 173,596 174,167 176,747 182,123 188,000 202,809 248,307 421,445 286,973 9.5 Average yield 23,000 23,000 23,000 21,000 21,822 21,716 21,587 23,440 25,276 26,828 27,175 2.3 Unit cost 8.3 8.3 7.5 8.3 8.1 8.4 8.7 8.7 9.8 15.7 10.6 7.0 Total field tomato Total cost of agricultural operations 58,442 58,442 54,769 56,894 65,704 66,784 67,656 73,824 85,456 119,266 121,597 11.3 Total cost of production inputs 75,797 75,797 77,047 80,075 89,567 92,236 94,977 99,495 103,434 122,014 132,706 7.8 Other total cost 35,815 35,815 35,300 36,578 41,618 42,348 43,170 46,185 53,644 67,556 71,615 10.3 Total cost 170,054 170,054 167,116 173,547 196,889 201,368 205,803 219,504 242,534 308,836 325,918 9.6 Average yield 30,000 30,000 35,000 37,000 40,519 43,453 44,530 47,886 50,559 51,447 50,866 8.3 Unit cost 5.7 5.7 4.8 4.7 4.9 4.6 4.6 4.6 4.8 6 6.4 1.0

State of Food and Agriculture in Syria 2010
270
Table A4.20. Development of the cost for selected fruit trees crops, 2007-2009 (total cost: SP/ha, unit cost: SP/kg and yield: kg/ha) Item Total cost of agricultural operations Total cost of production inputs Other total cost Total cost Average yield Unit cost
Rain-fed olives 2007 18,684 13,416 12,339 44,439 2,650 16.8 2008 24,988 13,388 15,512 53,888 2,605 20.7 2009 27,730 28,336 21,319 77,385 1,767 43.8
Change % (2007-2009) 48.4 111.2 72.8 74.1 -33.3 160.7 Rain-fed juice grapes
2007 22,516 2,274 14,040 38,830 5,000 7.8 2008 34,221 2,288 17,994 54,503 5,000 10.9 2009 32,583 3,144 18,207 53,934 5,000 10.8
Change % (2007-2009) 44.7 38.3 29.7 38.9 0.0 38.3 Irrigated apples
2007 89,452 61,402 55,728 206,582 13,101 15.8 2008 111,143 105,952 75,931 293,026 13,864 21.1 2009 112,237 119,998 80,714 312,949 13,822 22.6
Change % (2007-2009) 25.5 95.4 44.8 51.5 5.5 43.3 Rain-fed apples
2007 50,170 33,255 29,035 112,460 7,037 16.0 2008 63,043 33,310 32,304 128,657 7,166 18.0 2009 64,492 45,474 14,600 124,566 7,448 16.7
Change % (2007-2009) 22.7 36.7 -44.7 9.4 5.7 4.0 Source: Elaborated from MAAR, the AASA, 2009.

State of Food and Agriculture in Syria 2010
271
Table A4.21. Development of farm prices, 2000-2009 (SP/kg)
Item 2000 2001 2002 2003 2004 2005 2006 2007 2008 2009 Average
2000-2002 Average
2007-2009 ACH %
2000-2009 AAGR % 2000-2009
Crop production Cereals 11.2 10.2 10.5 10.7 11.3 11.7 11.7 11.4 17.3 19.0 10.6 15.9 49.8 8.4 Dry legumes 19.3 18 20.3 21.3 28.7 28.2 27.5 32.3 39.2 38.4 19.2 36.6 90.7 13.8 Pastoral 1.8 2.5 2.5 2.5 2 2.6 2.5 4.0 4.0 4.5 2.3 4.2 81.1 12.6 Industrial crops 16 17.6 18 19.5 17.8 20.6 17 16.6 26.5 26.5 17.2 23.2 34.9 6.2 Vegetables 9.5 11.2 8.8 10.1 9.5 10.4 12.6 22.5 25.8 23.4 9.9 23.9 141.5 19.3 Fruits 22.9 26.4 26.3 28.8 28.6 28.7 33.4 37.7 46.8 50.5 25.2 45.0 78.5 12.3 Livestock production Meat 196.6 212.2 236.3 204.6 182.1 202.8 201.8 221.1 234.8 290.8 215 248.9 15.8 3.0 Dairies 25.3 26.9 26 24.5 25.9 27.2 27.4 37.7 48.5 58.9 26.1 48.4 85.4 13.1 Eggs 2.5 2.5 2.5 2.5 3.3 3 3 3.9 5 4.6 2.5 4.5 79.7 12.4 Fish 94.5 90 90 98.2 92.7 100 100 114 123 128.8 91.5 121.9 33.2 5.9 Source: Elaborated from CBS, the ASA, various issues and the MAAR, the AASA, 2009.
Table A4.22. Development of wholesale prices for selected commodities, 2008 and 2009 (SP/kg)
Commodity Price Commodity Price Commodity Price
2008 2009 2008 2009 2008 2009 Red lentils 76 68 Lemons 28 23 Cattle meat (un-boned) 218 270 Chickpeas 60 49 Oranges 25 25 Poultry meat (un-boned) 104 101 Cumin 147 136 Clementine 25 26 Fish 134 153 Sunflowers 46 58 Grapefruit 10 11 Eggs (30 eggs) 136 121 Potato 15 17 Golden apples 39 39 Olive oil 188 Garlic 39 27 Apricot 33 41 Sheep cheese 136 Greenhouse tomato 17 14 Cherries 72 84 Cattle cheese 122 Field tomato 13 12 Peaches 41 45 Sheep ghee 625 Dry onion 12 13 Plums 39 43 Water melon 6 6 Grapes 33 32 Musk melon 12 13 Local bananas 33 34 Eggplants 14 14 Olives 67 59 Cucumber 14 16 Sheep milk 35 35 Squash 18 15 Cattle milk 23 22 Green haricot beans 30 27 Sheep meat (un-boned) 263 368 Source: Elaborated from MAAR, the AASA, various issues.

State of Food and Agriculture in Syria 2010
272
Table A4.23. Development of retail market prices for selected products, 1999-2010 (SP/kg) Item Sweida Dar’a Quneitra Damascus Homs Hama Idleb Tartous Lattakia Aleppo Raqqa Dair-Ezzor Hassake Mean CV % Lentils 1999 34.1 30.4 36.2 35.0 30.0 23.8 28.8 32.1 28.0 34.9 36.2 31.7 30.3 31.7 11.5 2000 30.0 30.0 34.6 30.4 30.0 25.3 28.0 35.0 28.0 35.0 35.0 27.1 30.0 30.6 10.7 2001 30.0 30.0 35.0 30.0 28.2 22.0 20.4 28.2 27.2 34.2 35.4 30.8 30.0 29.3 15.2 2002 27.5 26.0 30.8 29.8 26.2 20.0 20.0 26.2 28.2 30.4 35.0 31.2 30.0 27.8 15.3 2003 23.6 25.8 31.2 30.8 31.7 20.0 25.0 31.4 28.0 27.0 35.0 39.6 28.8 29.1 17.5 2004 29.6 28.4 25.4 32.9 34.2 23.1 25.8 37.3 28.0 25.6 38.8 41.2 32.1 31.0 18.4 2005 35.5 36.5 37.1 37.4 38.9 36.6 33.9 41.7 38.0 35.0 45.5 44.3 50.0 39.3 12.1 2006 35.0 41.3 41.0 40.7 39.0 41.0 35.0 44.3 45.0 49.3 46.7 43.3 50.0 42.4 11.1 2007 43.0 45.0 45.0 44.5 47.0 43.0 43.0 43.0 44.0 45.0 44.0 44.0 45.0 44.3 2.6 2008 91.0 91.0 95.0 87.5 92.0 85.0 88.0 85.0 88.0 87.0 89.0 91.0 88.0 89.0 3.2 2009 75.5 76.0 77.5 72.0 70.5 73.5 65.5 71.5 75.5 68.5 71.5 76.5 72.0 72.5 4.8 2010 53.5 50.0 49.5 49.3 46.5 50.0 46.5 48.0 51.0 47.0 47.5 49.0 47.0 48.5 4.2 Chickpeas 1999 32.0 29.4 39.2 35.0 30.0 37.0 30.0 32.1 37.7 35.7 45.0 36.7 34.8 35.0 12.5 2000 44.0 30.0 37.2 36.2 39.8 42.6 30.0 38.4 44.0 38.3 45.0 40.0 35.0 38.5 12.7 2001 41.8 39.2 40.2 37.5 43.8 43.8 32.5 45.0 40.1 39.1 45.0 49.2 40.0 41.3 10.1 2002 37.6 36.2 37.8 41.7 39.8 45.0 35.4 43.3 43.8 39.5 45.0 45.0 37.9 40.6 8.7 2003 27.2 30.0 33.2 35.7 38.0 44.4 40.0 38.2 45.0 37.2 45.0 43.8 42.9 38.5 15.1 2004 26.5 32.0 29.2 33.6 38.0 42.0 33.8 37.8 40.4 37.0 44.6 44.2 43.8 37.1 15.8 2005 35.5 41.8 40.0 38.3 46.7 39.5 40.7 46.9 45.0 39.5 50.0 48.5 45.5 42.9 10.4 2006 50.0 55.7 60.0 67.4 60.0 54.7 53.3 56.7 63.3 55.0 55.0 58.3 51.7 57.0 8.4 2007 75.0 67.0 74.0 81.0 77.0 72.0 63.0 70.0 64.0 64.0 60.0 78.0 66.0 70.1 9.4 2008 84.0 82.0 82.0 35.0 83.0 82.0 84.0 83.0 82.0 82.0 84.0 82.0 84.0 83.0 1.3 2009 80.0 80.0 80.0 80.0 80.0 80.0 80.0 80.0 80.0 80.0 80.0 80.0 80.0 80.0 0.0 2010 63.0 58.0 60.0 61.5 58.0 58.0 61.0 66.0 66.0 62.0 71.0 62.0 64.0 62.0 6.1 Dry haricot beans 1999 68.4 58.6 64.6 72.1 63.8 65.0 70.4 65.0 71.2 55.0 70.0 70.0 70.8 66.5 7.8 2000 72.1 60.0 66.7 69.6 68.8 65.0 75.0 64.2 66.2 55.0 70.0 70.0 64.2 66.7 7.9 2001 61.7 56.7 62.8 70.0 61.2 53.4 71.7 55.0 65.0 55.0 70.0 60.0 65.0 62.1 9.8 2002 58.8 53.3 62.1 59.7 57.1 55.7 61.8 52.9 58.3 54.4 66.2 57.5 60.2 58.3 6.5 2003 52.5 54.7 62.1 50.9 53.8 58.8 69.2 49.8 60.0 45.3 70.0 56.8 60.0 57.2 12.6 2004 44.2 59.2 54.6 48.4 45.0 61.0 59.2 50.9 50.4 44.5 70.0 58.0 60.0 54.3 14.4 Source: Elaborated from NAPC database.

State of Food and Agriculture in Syria 2010
273
Table A4.23. Continued Item Sweida Dar’a Quneitra Damascus Homs Hama Idleb Tartous Lattakia Aleppo Raqqa Dair-Ezzor Hassake Mean CV % Dry haricot beans (continued) 2005 55.5 59.7 56.8 50.5 57.0 58.5 57.5 56.4 59.1 45.0 65.0 60.0 62.3 57.2 8.8 2006 60.0 60.7 58.3 53.3 60.0 61.3 53.3 57.7 73.4 45.0 60.0 60.0 60.0 58.7 10.8 2007 52.0 56.0 66.0 67.0 55.0 41.0 46.0 52.0 54.0 52.0 46.0 57.0 48.0 53.2 14 2008 38.0 48.0 50.0 51.5 35.0 39.0 41.0 48.0 39.0 36.0 36.0 38.0 32.0 40.9 15.5 2009 38.0 43.0 51.0 51.5 32.0 33.0 37.0 48.0 44.0 32.0 30.0 36.0 36.0 40.0 18.5 2010 54.0 52.0 53.0 51.0 48.0 49.0 49.0 54.0 57.0 51.0 55.0 55.0 51.0 52.0 5.2 Cumin 1999 137.8 108.2 130.0 122.7 100.5 100.5 91.6 108.6 116.4 98.2 99.1 101.5 107.8 109.5 12.5 2000 166.2 109.2 130.0 125.0 115.0 130.0 90.0 110.0 136.5 100.0 100.0 100.0 100.0 116.3 17.9 2001 196.2 100.0 204.2 124.6 140.0 179.2 159.2 100.0 143.3 130.0 191.8 200.0 114.6 152.5 25.1 2002 147.5 125.0 213.6 125.0 123.3 154.6 144.2 106.2 125.0 130.0 187.5 160.0 125.0 143.6 20.7 2003 120.8 175.0 191.8 153.8 120.0 143.2 131.8 125.0 125.0 130.0 175.0 124.6 125.0 141.6 17.2 2004 140.0 175.0 197.9 199.9 120.0 131.9 124.2 127.1 125.0 139.2 158.3 120.0 125.0 144.9 19.8 2005 195.5 175.0 217.5 200.0 137.3 130.0 120.9 130.2 125.0 155.5 150.0 120.9 147.8 154.3 21.2 2006 200.0 175.0 233.3 216.8 135.0 130.0 120.0 130.0 125.0 150.0 150.0 130.0 150.0 157.3 23.8 2007 250.0 300.0 270.0 300.0 250.0 270.0 250.0 280.0 260.0 240.0 220.0 230.0 250.0 259.2 9.4 2008 300.0 300.0 320.0 290.0 260.0 300.0 260.0 290.0 300.0 260.0 260.0 260.0 260.0 281.5 7.8 2009 280.0 280.0 280.0 280.0 280.0 280.0 280.0 280.0 260.0 280.0 280.0 280.0 280.0 280.0 2.0 2010 350.0 350.0 350.0 350.0 350.0 350.0 350.0 350.0 350.0 350.0 350.0 350.0 350.0 350.0 0.0 Tomato 1999 14.8 12.9 13.6 14.9 13.5 13.8 13.2 16.2 13.8 15.9 13.1 14.0 14.4 14.2 7.3 2000 12.2 12.4 11.6 14.5 12.6 12.8 11.8 13.8 13.4 17.4 14.3 12.2 14.0 13.3 11.7 2001 14.8 14.5 14.8 15.0 14.4 14.1 13.1 15.8 14.1 16.2 14.8 12.8 14.9 14.6 6.4 2002 13.8 12.6 13.0 14.0 12.8 13.4 13.5 16.1 13.1 13.5 12.9 13.3 14.8 13.6 7.0 2003 14.8 14.8 14.4 16.4 14.2 13.8 13.4 17.2 15.2 14.9 17.1 15.8 15.5 15.2 7.8 2004 15.2 16.6 14.9 15.9 15.3 14.1 15.8 16.0 14.6 17.0 17.6 16.2 17.5 15.9 6.8 2005 17.8 17.0 17.1 17.4 18.5 16.2 17.4 19.5 16.3 20.8 18.5 17.5 17.8 17.8 7.1 2006 22.8 19.0 19.3 24.0 19.8 19.3 20.0 24.0 20.3 24.3 22.0 21.3 19.8 21.2 9.3 2007 17.0 17.0 15.0 20.5 19.0 21.0 20.0 16.0 19.0 18.0 17.0 17.0 19.0 18.1 10.0 2008 24.0 27.0 23.0 27.5 25.0 24.0 23.0 22.0 24.0 25.0 24.0 27.0 26.0 24.7 6.9 2009 27.0 23.7 23.0 27.3 24.7 25.0 23.0 25.3 25.7 15.0 24.0 24.7 26.0 25.0 12.3 2010 55.7 52.3 54.3 52.8 51.0 53.3 51.0 55.0 56.0 49.7 54.7 55.0 52.3 53.0 3.8

State of Food and Agriculture in Syria 2010
274
Table A4.23. Continued Item Sweida Dar’a Quneitra Damascus Homs Hama Idleb Tartous Lattakia Aleppo Raqqa Dair-Ezzor Hassake Mean CV % Potato 1999 13.8 12.8 12.3 14.9 13.0 12.0 10.6 12.5 9.8 15.8 10.4 11.2 11.2 12.3 14.3 2000 14.5 14.8 14.3 16.6 16.0 14.2 11.4 15.8 14.4 17.4 13.8 12.3 12.2 14.4 12.2 2001 15.8 13.2 13.2 16.8 13.8 13.9 12.2 14.2 10.8 15.6 12.2 10.8 13.0 13.5 13.5 2002 14.8 14.6 14.8 16.5 14.6 14.3 13.2 15.2 12.2 14.4 13.8 14.0 13.3 14.3 7.4 2003 13.2 14.8 14.4 15.2 14.2 13.1 12.2 16.2 12.2 14.5 13.6 12.6 13.5 13.8 8.7 2004 17.8 18.1 17.6 18.4 19.2 17.0 16.8 18.2 15.2 16.2 16.3 15.1 17.1 17.2 7.2 2005 17.3 19.0 16.5 17.5 17.8 15.1 17.4 16.8 13.8 18.0 14.4 16.1 14.3 16.5 9.8 2006 21.0 20.0 15.0 20.0 15.0 15.0 16.8 15.0 16.0 15.0 14.8 15.0 14.3 16.4 14.3 2007 31.0 33.0 27.0 32.0 30.0 29.0 30.0 29.0 29.0 31.0 30.0 30.0 28.0 29.9 5.4 2008 27.0 28.0 24.0 26.0 24.0 21.0 23.0 23.0 21.0 23.0 22.0 25.0 22.0 23.8 9.3 2009 28.0 28.0 27.0 29.5 27.0 26.0 24.0 30.0 27.0 25.0 24.0 28.0 26.0 27.0 6.9 2010 54.0 54.0 52.0 53.5 50.0 50.0 49.0 52.0 53.0 50.0 51.0 51.0 50.0 52.0 3.3 Water melon 1999 8.8 7.7 9.0 7.2 8.2 8.8 6.8 11.8 9.5 10.0 12.2 7.5 7.5 9.0 18.2 2000 6.8 6.2 6.2 6.8 5.2 7.0 5.4 8.3 8.5 10.3 5.8 5.7 5.7 6.9 21.0 2001 9.4 8.2 10.8 6.8 8.0 9.0 7.2 6.6 8.0 8.8 8.3 9.4 9.4 8.5 15.3 2002 9.4 6.8 10.5 6.8 6.2 7.4 8.3 6.8 10.4 6.2 8.5 6.8 6.8 7.9 19.0 2003 8.6 8.8 12.8 12.3 6.4 5.5 8.8 8.2 9.8 6.4 6.8 6.8 6.8 8.3 27.7 2004 6.8 7.8 9.9 8.8 7.6 6.4 9.8 8.0 10.2 8.4 9.9 7.2 7.2 8.2 17.0 2005 10.0 12.0 10.0 10.0 7.4 7.0 9.8 9.0 9.3 9.8 9.3 9.0 9.0 9.3 13.9 2006 8.5 14.0 11.5 11.5 8.2 7.5 9.4 11.0 8.7 9.4 9.2 10.0 10.0 9.8 18.7 2007 7.0 16.0 13.0 13.0 9.0 8.0 9.0 13.0 8.0 9.0 9.0 11.0 11.0 10.2 26.5 2008 12.0 14.0 14.0 15.5 12.0 11.0 14.0 10.0 12.0 12.0 14.0 11.0 11.0 12.5 13.1 2009 12.0 13.0 20.0 10.5 10.0 9.0 13.0 11.0 12.0 9.0 9.0 11.0 11.0 11.0 26.2 2010 13.0 13.0 14.0 13.0 11.0 12.0 12.0 12.0 11.0 12.0 11.0 10.0 12.0 12.0 9.0 Green peas 1999 36.7 26.2 34.7 37.6 32.2 26.0 18.8 25.4 31.0 25.5 16.5 19.5 18.0 26.8 7.2 2000 21.5 25.8 29.1 30.5 14.4 19.0 15.8 29.4 26.0 20.0 16.0 14.0 21.0 21.7 5.9 2001 26.2 19.2 25.6 33.5 13.0 16.8 15.0 24.0 26.8 13.3 18.0 8.0 15.0 19.6 7.2 2002 21.5 23.8 27.2 33.4 17.5 21.8 23.5 35.4 37.0 25.0 15.5 36.6 26.5 7.4 2003 20.5 33.2 32.1 34.2 23.0 15.0 28.0 33.3 37.0 23.0 37.0 30.0 28.9 7.0 2004 17.8 33.4 37.6 34.3 27.0 18.5 20.0 21.0 32.8 25.0 19.8 24.5 25.0 25.9 6.7 2005 18.5 37.0 35.1 32.8 19.3 14.0 15.5 27.4 21.3 26.2 19.0 19.0 17.0 23.2 7.7

State of Food and Agriculture in Syria 2010
275
Table A4.23. Continued Item Sweida Dar’a Quneitra Damascus Homs Hama Idleb Tartous Lattakia Aleppo Raqqa Dair-Ezzor Hassake Mean CV % Green peas (continued) 2006 19.0 25.0 24.0 26.0 21.0 21.0 19.0 21.0 19.0 21.0 19.0 21.0 21.0 21.3 2.3 2007 10.0 25.0 39.0 33.5 27.0 15.0 26.0 15.0 18.0 16.0 12.0 36.0 21.0 11.3 2008 35.0 40.0 49.0 33.0 37.0 25.0 32.0 27.0 38.0 40.0 30.0 38.0 41.0 35.8 6.4 2009 36.0 34.0 50.0 42.5 31.0 35.0 39.0 37.0 46.0 59.0 21.0 32.0 35.0 39.0 24.4 2010 42.0 38.0 38.0 41.0 41.0 44.0 36.0 46.0 44.0 44.0 43.0 43.0 42.0 42.0 6.8 Green pepper 1999 27.8 21.2 25.5 24.4 12.5 27.8 28.4 21.2 30.2 27.4 12.2 28.3 31.0 24.5 25.1 2000 23.0 22.8 26.7 32.8 16.8 29.4 29.0 24.6 34.2 35.2 8.5 26.0 30.2 26.1 28.2 2001 22.2 18.2 19.8 23.0 15.8 21.8 22.8 21.0 27.0 26.1 16.5 18.4 20.8 21.0 15.9 2002 19.3 19.8 22.0 21.4 19.3 22.1 22.8 27.0 27.7 23.0 9.2 22.3 23.8 21.5 20.9 2003 21.0 19.5 22.4 28.8 14.6 21.6 26.8 28.0 25.2 23.0 20.4 28.3 23.3 18.3 2004 20.6 21.5 21.8 22.6 23.2 20.2 28.6 20.8 23.8 26.3 22.8 23.8 23.0 10.6 2005 24.8 33.4 28.2 29.5 35.6 27.3 29.4 26.5 27.8 33.3 24.1 37.1 29.6 29.7 13.5 2006 40.0 38.0 33.3 34.7 43.3 39.0 20.0 31.7 33.5 46.0 44.0 48.3 34.3 37.4 19.9 2007 47.0 46.0 41.0 37.0 37.0 36.0 35.0 42.0 38.0 39.0 41.0 47.0 39.0 40.4 10.2 2008 49.0 55.0 48.0 44.0 42.0 38.0 40.0 35.0 39.0 37.0 44.0 48.0 42.0 43.2 13.1 2009 45.0 43.0 38.0 39.0 39.0 35.5 38.5 38.5 45.5 37.5 40.5 37.0 42.5 40.0 7.8 2010 53.0 53.0 53.5 54.0 51.0 53.5 51.0 55.5 57.5 48.0 48.0 52.0 54.0 52.5 5.1 Squash 1999 24.6 20.4 21.2 22.4 21.5 19.2 19.3 24.3 21.5 18.0 15.0 20.4 20.8 20.7 12.2 2000 21.8 18.5 18.8 20.8 17.5 18.6 17.4 19.5 18.8 19.0 13.1 18.3 17.6 18.4 11.0 2001 20.4 17.5 18.2 16.8 16.5 19.8 17.8 16.8 18.5 15.6 11.6 16.2 18.3 17.2 12.7 2002 19.0 21.1 17.8 18.2 16.5 18.3 17.8 19.8 18.8 13.2 13.8 16.6 17.2 17.5 12.5 2003 17.8 18.8 21.3 22.8 18.0 21.2 18.2 22.8 19.3 19.2 20.8 19.2 19.3 19.9 8.6 2004 18.0 16.2 19.8 19.6 19.4 19.8 19.0 17.4 14.0 18.2 15.6 21.4 21.6 18.5 12.0 2005 23.0 23.1 25.2 24.5 23.4 22.6 20.3 23.6 18.0 26.8 21.0 24.4 21.2 22.9 10.1 2006 24.3 28.7 33.7 28.0 31.3 31.7 30.0 31.3 24.5 36.7 33.3 33.3 32.0 30.7 11.6 2007 25.0 30.0 28.0 28.0 28.0 27.0 25.0 24.0 24.0 26.0 25.0 26.0 25.0 26.2 7.0 2008 30.0 34.0 30.0 29.5 30.0 28.0 27.0 25.0 28.0 27.0 27.0 30.0 31.0 29.0 7.9 2009 32.0 33.0 28.0 31.5 31.0 32.0 26.0 33.0 31.0 26.0 28.0 32.0 31.0 30.0 8.3 2010 48.0 46.0 52.0 45.5 45.0 44.0 40.0 51.0 51.0 47.0 46.0 46.0 46.0 47.0 6.9

State of Food and Agriculture in Syria 2010
276
Table A4.23. Continued Item Sweida Dar’a Quneitra Damascus Homs Hama Idleb Tartous Lattakia Aleppo Raqqa Dair-Ezzor Hassake Mean CV % Eggplants 1999 23.4 17.0 20.8 24.5 15.0 13.0 18.2 20.1 25.0 18.1 16.8 20.4 23.0 19.6 18.9 2000 9.8 16.2 20.3 12.2 11.3 15.1 11.4 20.6 22.1 18.5 18.6 20.1 24.4 17.0 27.5 2001 18.0 14.2 17.4 15.4 12.2 14.3 14.4 20.8 16.8 11.4 16.6 14.4 19.5 15.8 17.2 2002 12.9 14.2 16.3 19.4 10.5 14.2 9.4 17.1 16.3 12.8 14.8 15.8 17.1 14.7 19.0 2003 13.6 17.1 13.8 23.8 14.0 13.9 14.0 26.1 21.8 22.2 17.0 20.0 22.0 18.4 24.1 2004 12.4 17.6 14.4 15.4 12.2 15.1 11.8 19.5 18.0 10.2 17.8 17.0 18.8 15.4 19.5 2005 16.8 21.3 16.0 18.6 22.1 15.8 17.8 24.2 15.1 25.5 19.4 25.0 19.3 19.8 18.1 2006 18.9 28.7 35.0 29.5 41.0 0.0 20.0 30.3 25.7 36.7 28.7 32.7 24.3 27.0 37.9 2007 21.0 25.0 25.0 27.0 26.0 24.0 24.0 28.0 24.0 23.0 24.0 25.0 24.0 24.6 7.1 2008 27.0 33.0 28.0 32.5 29.0 29.0 28.0 31.0 27.0 30.0 28.0 35.0 30.0 29.8 8.3 2009 27.3 26.3 24.7 31.0 28.3 25.7 24.3 32.7 29.3 23.3 28.0 31.0 27.3 27.3 10.3 2010 51.0 48.7 53.3 47.7 48.3 56.7 48.0 52.3 54.3 49.0 49.0 55.0 49.3 50.7 6.0 Cucumber 1999 22.5 20.2 19.2 22.3 19.2 18.8 18.5 22.5 21.0 24.8 18.0 18.5 20.3 20.4 10.0 2000 19.8 20.2 19.2 19.8 17.0 18.0 17.8 18.0 20.2 22.4 18.8 16.5 16.8 18.8 8.9 2001 21.0 19.8 17.5 17.2 17.0 17.8 17.3 17.8 18.8 20.3 17.6 15.0 18.6 18.1 8.7 2002 18.0 19.8 18.4 17.0 15.9 16.4 16.0 19.0 18.8 16.1 17.2 17.0 17.6 17.5 7.2 2003 19.5 20.3 18.2 19.4 19.4 17.8 18.8 21.8 19.6 18.1 16.8 19.0 18.8 19.0 6.5 2004 19.8 20.0 18.8 18.1 18.2 18.3 18.8 19.4 15.2 16.1 19.0 19.0 18.1 18.4 7.4 2005 24.4 25.2 24.5 23.1 25.1 21.0 23.8 23.4 20.8 21.8 21.2 24.0 22.2 23.1 6.8 2006 22.8 31.3 29.0 26.7 27.3 27.7 35.0 30.0 29.7 26.5 31.7 28.7 24.3 28.5 11.3 2007 34.0 33.0 28.0 31.5 29.0 32.0 33.0 23.0 33.0 30.0 30.0 24.0 27.0 29.8 11.8 2008 31.0 46.0 33.0 37.0 30.0 32.0 34.0 28.0 33.0 41.0 32.0 29.0 29.0 33.5 15.4 2009 33.0 31.5 29.5 29.5 29.0 28.0 26.0 31.0 32.5 28.0 26.5 26.5 28.5 29.5 7.7 2010 58.0 56.5 58.0 61.5 53.0 55.5 53.0 54.0 58.0 48.0 49.0 53.5 52.5 55.5 6.8 Green haricot beans 1999 35.3 32.8 29.6 28.7 28.7 25.0 25.0 35.0 43.2 37.2 25.3 27.0 34.5 31.3 17.7 2000 26.3 20.8 28.6 34.2 21.6 25.4 24.3 36.5 33.2 28.4 27.0 22.2 20.2 26.8 19.6 2001 34.1 22.6 31.8 39.0 24.8 23.0 21.8 30.0 27.3 24.0 21.4 16.5 19.0 25.8 24.8 2002 27.0 22.6 31.4 30.6 24.0 27.6 18.3 34.9 29.6 21.2 17.8 22.8 23.0 25.4 20.5 2003 25.7 26.4 44.5 45.8 29.1 21.6 23.0 47.5 32.8 28.5 21.8 25.1 21.1 30.2 31.6 2004 20.8 30.0 40.8 45.8 33.2 21.5 30.0 37.2 32.8 24.0 22.0 28.4 25.1 30.1 25.7 2005 18.4 39.2 42.5 50.5 39.2 29.1 33.2 45.0 19.3 34.1 19.0 35.2 30.3 33.5 30.4

State of Food and Agriculture in Syria 2010
277
Table A4.23. Continued Item Sweida Dar’a Quneitra Damascus Homs Hama Idleb Tartous Lattakia Aleppo Raqqa Dair-Ezzor Hassake Mean CV % Green haricot beans (continued) 2006 37.5 60.0 59.7 52.7 70.0 55.7 42.0 78.7 54.3 65.0 39.7 47.3 50.8 2007 52.0 56.0 56.0 66.0 55.0 41.0 46.0 52.0 54.0 52.0 46.0 57.0 49.0 52.5 11.9 2008 38.0 48.0 50.0 51.5 35.0 39.0 41.0 48.0 39.0 36.0 36.0 38.0 32.0 40.9 15.5 2009 30.0 34.0 22.0 31.0 25.0 32.0 25.0 29.0 28.0 27.0 27.0 29.0 25.0 28.0 11.8 2010 44.0 44.0 45.0 41.0 42.0 43.0 43.0 43.0 43.0 41.0 42.0 45.0 42.0 43.0 3.1 Dry onion 1999 11.2 12.2 10.8 13.9 11.8 11.2 13.5 14.8 9.8 15.4 11.0 12.0 11.2 12.2 13.8 2000 11.5 13.2 12.2 12.8 11.8 14.6 13.1 12.2 14.1 12.5 14.5 10.8 10.8 12.6 10.0 2001 19.3 16.8 16.2 16.8 15.6 16.8 17.4 15.8 18.4 21.4 17.1 15.3 18.0 17.3 9.7 2002 12.8 11.8 11.5 13.0 9.2 9.5 11.8 11.9 11.2 11.6 15.0 10.0 10.5 11.5 13.5 2003 13.4 19.3 15.5 15.9 15.1 12.2 12.6 17.5 14.3 13.1 15.4 12.8 13.8 14.7 14.1 2004 16.3 21.0 15.8 15.2 14.5 13.4 16.5 17.4 15.0 13.2 18.4 13.3 16.6 15.9 14.0 2005 10.0 12.3 10.9 10.6 9.2 8.0 11.8 11.5 8.5 11.8 12.8 11.0 7.5 10.5 16.2 2006 18.0 13.8 19.8 13.3 13.0 12.0 15.0 14.3 12.0 19.0 16.3 14.3 11.0 14.8 18.8 2007 20.0 24.0 20.0 21.5 21.0 21.0 21.0 23.0 23.0 20.0 20.0 21.0 20.0 21.2 6.4 2008 16.0 21.0 18.0 19.0 19.0 17.0 19.0 22.0 20.0 19.0 20.0 21.0 16.0 19.0 9.8 2009 20.0 18.5 18.0 18.5 18.0 17.5 18.0 20.5 23.0 17.5 18.0 22.0 19.0 19.0 9.3 2010 60.5 59.5 61.5 62.8 60.5 66.0 58.5 61.0 61.0 53.5 56.0 58.5 59.0 60.0 5.1 Dry garlic 1999 43.3 47.5 41.9 55.6 46.6 43.0 55.1 50.5 40.5 48.3 43.9 48.8 38.9 46.5 11.2 2000 19.1 23.8 17.3 23.3 19.3 22.0 19.2 25.8 21.8 22.2 21.3 19.2 16.2 20.8 13.1 2001 40.9 39.4 44.8 49.5 40.2 43.3 45.2 39.7 41.8 27.3 45.1 43.7 48.4 42.3 13.0 2002 67.6 67.0 70.4 64.9 56.6 60.5 62.9 67.1 61.6 52.1 62.5 64.7 63.5 63.2 7.7 2003 43.2 47.4 53.1 46.8 47.5 43.6 45.6 51.4 49.3 44.4 45.6 41.1 52.6 47.0 7.9 2004 46.2 55.4 54.2 56.2 42.2 51.1 50.3 45.1 39.7 39.2 43.6 51.2 49.4 48.0 12.0 2005 46.3 62.1 48.5 50.9 33.3 42.5 29.5 38.2 32.9 31.8 37.1 46.5 55.5 42.7 23.4 2006 52.0 60.0 71.7 71.0 68.5 52.3 30.0 59.0 0.0 56.0 38.3 49.3 79.7 52.9 39.7 2007 98.0 96.0 99.0 111.5 87.0 90.0 82.0 101.0 98.0 75.0 82.0 99.0 85.0 92.6 10.8 2008 62.0 68.0 68.0 76.0 62.0 60.0 51.0 59.0 67.0 54.0 70.0 82.0 64.0 64.8 13.0 2009 52.0 49.5 47.5 44.0 40.5 52.0 39.0 42.5 38.0 44.5 53.0 50.0 54.5 46.5 12.1 2010 76.5 76.0 76.0 79.0 70.0 69.5 73.5 77.0 83.0 68.0 71.5 79.5 78.0 75.0 5.9

State of Food and Agriculture in Syria 2010
278
Table A4.23. Continued Item Sweida Dar’a Quneitra Damascus Homs Hama Idleb Tartous Lattakia Aleppo Raqqa Dair-Ezzor Hassake Mean CV % Cabbage 1999 11.3 8.8 9.8 11.8 8.8 9.3 12.0 11.2 9.5 14.4 13.5 10.9 8.8 10.8 17.0 2000 13.0 8.6 10.8 10.0 8.4 8.8 10.6 10.8 10.2 11.9 11.8 9.9 8.9 10.3 13.7 2001 9.5 8.4 7.8 9.8 5.0 8.3 11.2 8.9 8.5 10.5 15.0 9.6 7.5 9.2 25.1 2002 10.4 9.8 10.4 11.8 7.8 11.3 14.8 12.0 11.4 12.0 14.6 12.3 11.3 11.5 16.0 2003 9.2 13.2 10.3 12.4 8.3 8.4 13.1 12.2 10.6 9.9 15.4 11.4 11.2 11.2 18.4 2004 10.3 11.9 9.3 11.3 7.9 7.9 14.5 11.6 9.2 12.9 12.3 10.2 9.0 10.6 18.7 2005 18.3 15.2 15.9 18.5 16.8 15.6 19.3 16.4 14.2 22.3 12.8 19.0 15.5 16.9 14.9 2006 14.0 13.8 11.0 16.0 9.3 14.0 14.3 16.3 11.0 14.0 13.3 10.0 10.0 12.8 18.1 2007 14.0 15.0 14.0 16.0 16.0 15.0 19.0 16.0 16.0 16.0 17.0 18.0 15.0 15.9 9.1 2008 20.0 20.0 18.0 21.0 17.0 17.0 21.0 17.0 16.0 19.0 20.0 23.0 18.0 19.0 10.7 2009 17.0 15.0 14.0 16.0 13.0 18.0 12.0 15.0 16.0 13.0 16.0 19.0 16.0 15.0 13.5 2010 61.0 56.0 62.0 62.5 59.0 66.0 59.0 66.0 60.0 52.0 56.0 56.0 53.0 59.0 7.5 Grapes 1999 28.8 23.4 23.3 32.6 26.7 26.0 30.0 22.0 23.2 28.8 20.8 29.0 26.0 26.2 13.5 2000 19.2 24.2 22.2 31.0 30.0 27.6 32.5 23.8 28.0 29.8 24.4 30.2 22.5 26.6 15.4 2001 24.8 25.2 25.6 23.3 25.6 34.2 31.8 23.2 30.6 29.5 26.0 29.2 27.4 27.4 12.4 2002 20.5 26.7 25.0 29.2 26.2 32.2 36.0 38.5 37.0 28.8 27.0 26.2 22.8 28.9 19.1 2003 19.5 21.2 24.0 26.0 30.3 23.0 27.6 29.2 29.3 26.4 26.2 23.0 28.4 25.7 13.0 2004 21.8 23.6 23.2 28.8 32.8 23.3 25.0 23.8 22.0 28.5 27.6 26.8 21.0 25.2 13.6 2005 22.0 25.0 29.0 26.8 36.0 20.5 28.8 27.8 23.8 34.0 25.6 30.0 23.5 27.1 16.6 2006 27.0 30.0 32.0 33.7 38.5 29.3 30.9 31.4 31.4 37.5 29.3 34.0 27.8 31.7 10.8 2007 32.0 35.0 35.0 40.5 41.0 38.0 33.0 35.0 39.0 41.0 33.0 38.0 32.0 36.3 9.4 2008 38.0 40.0 39.0 42.5 47.0 40.0 39.0 39.0 43.0 37.0 37.0 45.0 34.0 40.0 8.8 2009 56.3 34.0 31.7 43.3 40.0 42.0 37.7 45.7 42.7 36.7 36.7 42.0 34.7 40.5 15.7 2010 39.7 48.0 39.3 51.5 52.5 43.0 38.0 48.3 51.0 47.0 47.5 48.7 41.7 46.3 10.7 Oranges 1999 20.0 19.0 25.0 12.0 15.0 15.0 16.0 27.0 20.0 20.0 15.0 18.5 43.7 2000 18.3 23.2 18.3 22.5 15.0 15.8 15.5 20.1 16.1 25.6 19.1 23.4 19.0 19.4 17.6 2001 19.8 23.0 17.6 26.1 17.8 16.4 16.5 14.8 18.3 18.4 24.0 25.1 20.0 19.8 18.2 2002 17.4 23.8 22.8 26.4 20.6 18.8 14.6 15.4 17.8 22.4 22.5 19.3 22.1 20.3 17.0 2003 21.0 21.8 24.0 25.2 21.0 17.2 17.0 21.8 20.0 22.0 24.0 21.6 23.6 21.6 11.4 2004 22.2 26.8 27.0 26.0 22.3 22.5 19.6 23.5 22.4 28.0 23.8 20.2 28.5 24.1 12.1 2005 23.2 30.4 27.1 30.8 21.1 19.0 21.0 23.0 19.8 27.6 24.0 28.0 26.3 24.7 15.9

State of Food and Agriculture in Syria 2010
279
Table A4.23. Continued Item Sweida Dar’a Quneitra Damascus Homs Hama Idleb Tartous Lattakia Aleppo Raqqa Dair-Ezzor Hassake Mean CV % Oranges (continued) 2006 18.0 27.7 30.0 32.3 27.3 22.8 25.0 21.0 21.3 30.3 26.7 25.0 24.0 25.5 16.1 2007 33.0 35.0 30.0 35.0 32.0 31.0 31.0 29.0 25.0 28.0 34.0 35.0 32.0 31.5 9.6 2008 37.0 40.0 35.0 40.5 36.0 33.0 27.0 27.0 27.0 27.0 30.0 33.0 31.0 32.6 15.1 2009 34.8 35.0 32.3 33.6 30.4 28.5 25.8 28.8 28.4 28.2 31.4 28.5 32.8 30.9 9.3 2010 34.5 36.2 33.4 34.4 32.2 27.8 28.2 29.6 30.8 32.2 27.2 37.3 33.8 32.3 10.0 Lemons 1999 24.0 17.0 20.0 25.0 20.0 21.0 20.0 15.0 18.0 30.0 21.0 25.0 25.0 21.6 18.7 2000 25.0 26.8 22.4 23.8 22.4 23.4 19.6 18.5 18.0 35.0 28.5 28.1 25.7 24.4 19.0 2001 26.1 23.6 23.1 18.8 17.8 23.0 21.6 20.0 16.4 22.5 23.1 26.8 26.6 22.3 14.8 2002 18.8 22.2 20.5 21.2 16.8 19.2 22.6 19.3 16.1 16.4 25.7 21.5 21.1 20.1 13.6 2003 31.2 29.7 31.6 32.1 30.0 30.7 30.3 30.8 26.1 25.1 27.0 24.8 32.9 29.4 9.3 2004 32.5 38.5 33.8 31.8 28.7 29.3 31.1 25.8 23.8 31.3 28.2 26.7 32.8 30.3 12.7 2005 23.5 25.3 25.5 23.5 18.6 17.0 17.8 18.4 15.1 23.5 21.8 22.4 21.0 21.0 15.9 2006 18.0 25.3 20.0 23.3 15.0 14.0 20.0 15.0 16.8 18.3 20.8 22.8 18.8 19.1 18.0 2007 34.0 37.0 30.0 35.5 28.0 31.0 32.0 27.0 28.0 30.0 39.0 37.0 37.0 32.7 12.5 2008 51.0 54.0 48.0 51.5 47.0 44.0 45.0 42.0 45.0 50.0 53.0 56.0 52.0 49.1 8.7 2009 41.5 39.0 31.0 35.8 33.5 31.5 30.5 31.0 40.5 40.0 40.0 40.5 36.0 36.2 11.8 2010 54.0 42.0 38.5 40.5 36.5 34.0 36.0 36.5 43.5 40.5 41.0 44.0 39.0 40.5 12.5 Apples 1999 38.1 33.1 29.6 38.9 29.1 32.6 32.0 29.3 24.2 34.2 31.6 64.9 34.1 34.7 28.3 2000 38.2 33.2 34.8 40.0 28.6 32.0 33.3 30.5 30.2 34.2 36.2 30.8 36.2 33.7 9.9 2001 40.9 39.1 36.1 39.2 30.0 37.1 33.8 32.8 34.8 36.4 44.3 36.4 36.6 36.7 9.9 2002 42.5 41.0 38.4 40.5 30.6 34.7 36.8 37.2 30.5 33.5 39.7 35.7 45.2 37.4 11.8 2003 41.0 35.0 39.1 35.3 31.6 30.6 37.7 40.7 30.8 35.4 36.1 39.2 36.8 36.1 9.7 2004 34.3 37.9 37.2 38.6 30.2 29.2 34.4 32.0 25.0 35.8 41.9 34.4 37.5 34.5 13.1 2005 34.1 41.6 37.9 37.8 34.8 30.5 34.4 38.0 25.8 39.4 40.0 38.7 36.4 36.1 11.8 2006 44.3 42.0 45.3 46.7 41.7 39.0 35.0 39.7 35.3 42.3 43.0 42.7 48.0 41.9 9.3 2007 52.0 55.0 55.0 51.5 53.0 43.0 41.0 42.0 38.0 54.0 52.0 49.0 52.0 49.0 12.0 2008 63.0 65.0 58.0 69.0 58.0 60.0 56.0 53.0 57.0 62.0 69.0 62.0 59.0 60.8 7.9 2009 58.0 60.0 51.0 54.5 56.0 48.0 46.0 56.0 46.0 56.0 65.0 67.0 56.0 56.0 11.6 2010 60.0 65.0 54.0 58.5 58.0 52.0 54.0 58.0 58.0 57.0 60.0 64.0 60.0 58.0 6.4

State of Food and Agriculture in Syria 2010
280
Table A4.23. Continued Item Sweida Dar’a Quneitra Damascus Homs Hama Idleb Tartous Lattakia Aleppo Raqqa Dair-Ezzor Hassake Mean CV % Apricots 1999 25.5 23.0 29.3 30.0 29.5 27.7 26.5 31.3 30.0 25.5 26.7 33.0 36.0 28.8 12.1 2000 23.3 21.0 33.5 23.3 20.8 19.0 24.0 17.0 23.5 28.0 23.8 30.0 16.3 23.3 21.1 2001 36.0 37.0 28.3 35.0 29.3 31.7 40.0 24.8 34.0 23.3 30.0 34.7 36.3 32.3 15.3 2002 27.0 29.3 27.0 30.0 25.5 28.0 24.3 29.7 36.0 22.0 26.5 26.8 25.7 27.5 12.3 2003 27.5 30.5 29.0 35.2 24.5 29.0 25.0 31.0 26.5 24.0 35.0 29.0 36.5 29.4 14.0 2004 31.0 36.2 37.7 34.7 28.0 29.3 32.5 24.2 32.5 34.3 27.5 31.0 36.7 32.0 12.5 2005 24.5 32.0 29.2 27.7 29.7 24.3 23.0 31.3 22.5 39.5 28.3 35.2 29.7 29.0 16.9 2006 29.3 36.5 34.6 34.6 32.4 33.2 27.5 35.7 27.8 40.3 32.2 40.1 31.4 33.5 12.2 2007 34.0 41.0 40.0 41.5 35.0 42.0 32.0 40.0 33.0 41.0 36.0 45.0 33.0 38.0 11.2 2008 51.0 65.0 62.0 45.0 57.0 40.0 50.0 33.0 37.0 50.0 50.0 50.0 50.0 49.2 18.5 2009 48.5 62.5 41.0 65.8 56.0 62.0 42.0 54.0 51.0 52.5 45.0 60.0 58.0 54.6 14.6 2010 57.0 74.0 70.5 72.0 56.0 63.0 64.0 74.0 73.0 67.0 64.0 66.0 64.0 66.9 9.0 Cherries 1999 31.3 46.5 35.0 35.3 30.3 33.0 31.5 34.5 32.3 30.0 28.3 37.2 42.3 34.4 14.9 2000 41.5 54.7 39.0 49.5 41.0 50.0 39.5 37.3 44.0 34.0 31.3 46.0 60.0 43.7 18.8 2001 46.0 57.7 42.7 46.7 41.7 41.7 41.0 43.7 32.7 40.0 33.7 53.8 53.8 44.2 16.8 2002 40.0 57.0 60.5 51.3 36.5 48.2 58.3 49.7 59.3 36.7 44.0 41.0 49.0 48.6 17.5 2003 50.5 39.8 45.8 44.8 37.3 34.0 43.7 48.7 44.7 32.2 35.0 44.5 50.0 42.4 14.5 2004 40.5 42.5 65.0 66.0 50.7 50.3 60.0 35.7 44.5 55.2 45.2 46.0 65.0 51.3 19.8 2005 39.0 52.8 48.3 48.5 42.2 40.7 43.5 45.3 39.7 41.7 38.3 47.2 60.5 45.2 13.9 2006 53.5 65.4 62.2 57.5 54.6 50.9 39.8 46.2 40.9 44.9 44.7 51.6 61.3 51.8 16.0 2007 68.0 78.0 76.0 66.5 67.0 61.0 36.0 47.0 42.0 48.0 51.0 56.0 62.0 58.3 22.2 2008 78.0 133.0 105.0 108.5 87.0 88.0 100.0 59.0 78.0 100.0 92.0 100.0 73.0 92.4 20.2 2009 122.0 121.0 99.0 116.5 118.0 105.0 103.0 125.0 104.0 97.0 100.0 111.0 108.0 110.0 8.7 2010 120.0 103.0 112.0 113.5 100.0 99.0 96.0 110.0 116.0 95.0 95.0 100.0 100.0 105.0 8.2 Sheep meat dressed 1999 253 256 250 300 270 227 250 260 246 284 405 225 205 264 18.6 2000 248 233 220 300 278 221 250 255 250 275 207 212 194 242 12.8 2001 246 257 246 346 296 254 271 257 279 275 230 248 219 263 12.2 2002 250 281 258 339 306 277 277 263 295 316 228 250 250 276 11.3 2003 250 352 296 352 325 318 288 301 323 333 250 242 250 298 13.4 2004 320 356 297 404 381 346 371 360 387 373 253 250 250 334 16.5 2005 376 413 346 450 448 361 366 356 379 297 313 302 367 13.8

State of Food and Agriculture in Syria 2010
281
Table A4.23. Continued Item Sweida Dar’a Quneitra Damascus Homs Hama Idleb Tartous Lattakia Aleppo Raqqa Dair-Ezzor Hassake Mean CV % Sheep meat dressed (continued) 2006 383 449 335 477 508 400 450 365 448 327 338 317 400 16.3 2007 448 490 450 519 518 426 476 465 490 450 384 350 403 451 11.2 2008 484 508 394 598 581 521 535 496 521 475 417 384 408 486 14.2 2009 426 566 479 475 503 529 506 517 549 506 421 428 417 486 10.4 2010 487 528 508 501.5 536 542 522 527 560 497 506 486 467 512 5.1 Cattle meat dressed 1999 163 200 185 200 200 179 186 200 200 200 180 181 205 191 6.6 2000 160 200 177 200 196 175 160 198 200 200 180 180 193 186 8.1 2001 167 200 195 200 213 201 199 208 219 210 207 200 213 203 6.3 2002 182 202 207 224 225 205 200 220 223 228 200 200 250 213 8.2 2003 198 235 235 253 260 210 207 250 225 253 224 250 255 8.1 2004 200 238 243 252 260 219 225 276 229 253 225 250 261 8 2005 234 272 255 294 286 255 252 264 266 302 243 250 288 7.2 2006 253 280 280 306 323 285 258 258 292 340 250 279 267 282 9.7 2007 312 302 325 337 341 300 300 331 328 340 291 299 310 317 5.6 2008 317 313 333 370 377 306 286 359 353 350 261 319 363 331 10.5 2009 369 383 376 400.5 430 380 358 420 426 408 342 376 409 391 7.0 2010 408 425 393 440.5 446 401 392 450 445 414 399 413 402 419 5.1 Chicken meat slaughtered 1999 84.5 61.7 79.1 65.7 73.7 71.0 68.2 108.5 84.9 82.0 70.0 73.5 79.1 77.1 15.4 2000 71.6 47.8 68.8 66.4 63.4 63.2 62.5 91.8 63.8 67.2 69.2 64.0 68.4 66.8 14.2 2001 64.9 68.2 78.9 69.5 71.7 67.8 69.6 71.6 77.8 69.1 73.8 72.6 77.5 71.8 5.9 2002 53.8 66.7 62.2 60.4 62.4 60.4 62.5 55.8 70.9 63.6 62.4 65.1 66.2 62.5 7.1 2003 57.8 58.2 70.9 71.1 70.0 64.9 68.4 55.0 78.6 79.2 69.2 65.6 79.2 68.3 11.7 2004 65.2 59.8 75.4 72.1 75.9 72.2 78.4 75.1 79.6 73.0 75.0 66.8 75.8 72.6 7.7 2005 59.9 57.2 75.4 70.8 78.7 69.2 76.5 63.0 79.1 81.7 75.0 78.1 84.6 73.0 11.7 2006 58.0 57.7 85.7 69.7 81.4 68.4 70.0 61.7 79.0 78.4 78.4 73.4 71.7 71.8 12.3 2007 98.0 101.0 102.0 103.0 100.0 98.0 104.0 101.0 98.0 103.0 108.0 104.0 102.0 101.7 2.8 2008 110.0 129.0 123.0 122.5 124.0 120.0 116.0 116.0 108.0 122.0 122.0 130.0 127.0 120.7 5.5 2009 110.0 126.0 117.0 115.5 117.0 113.0 109.0 114.0 105.0 110.0 120.0 117.0 125.0 116.0 5.3 2010 125.0 135.0 121.0 125.5 127.0 120.0 121.0 119.0 114.0 122.0 127.0 124.0 128.0 124.0 4.2

State of Food and Agriculture in Syria 2010
282
Table A4.23. Continued Item Sweida Dar’a Quneitra Damascus Homs Hama Idleb Tartous Lattakia Aleppo Raqqa Dair-Ezzor Hassake Mean CV % Fresh milk 1999 13.2 15.2 12.3 15.4 14.8 14.5 14.6 14.8 13.8 19.2 14.5 14.8 18.1 15.0 12.2 2000 15.4 17.0 14.0 17.0 14.8 15.0 12.8 15.0 13.0 16.3 16.0 15.0 15.0 15.1 8.7 2001 15.0 14.2 13.0 17.0 14.3 14.0 13.8 15.0 12.2 15.8 15.1 15.0 15.0 14.6 8.3 2002 15.3 15.3 13.4 15.3 14.0 13.2 15.0 15.0 12.8 14.5 15.0 15.0 15.0 14.5 6.0 2003 15.9 15.2 11.4 17.0 14.2 13.9 15.0 15.0 13.0 12.6 15.0 15.0 16.0 14.6 10.5 2004 14.8 16.0 12.8 15.6 15.1 13.5 15.0 14.2 13.0 13.8 15.0 15.0 15.8 14.6 7.1 2005 16.1 17.3 14.8 18.6 18.1 15.4 17.5 15.4 16.3 18.0 15.0 17.5 17.1 16.7 7.6 2006 17.0 18.0 16.3 20.0 21.8 17.0 22.0 15.3 17.0 18.0 15.8 19.3 17.0 18.0 11.9 2007 23.0 21.0 20.0 23.5 23.0 22.0 22.0 21.0 21.0 21.0 23.0 21.0 23.0 21.9 5.1 2008 30.0 28.0 28.0 30.5 28.0 27.0 30.0 26.0 27.0 28.0 28.0 26.0 31.0 28.3 5.8 2009 26.0 25.0 25.0 29.5 26.0 26.0 25.0 28.0 27.0 24.0 27.0 25.0 28.0 27.0 5.8 2010 25.0 22.0 24.0 29.5 24.0 23.0 25.0 28.0 26.0 25.0 24.0 24.0 27.0 26.0 7.9 Eggs (30 eggs) 1999 85.9 60.5 78.6 74.1 68.4 71.1 78.6 75.5 84.5 86.4 64.5 68.9 72.4 74.6 10.9 2000 84.2 70.0 75.4 67.9 69.2 73.0 71.7 72.8 91.2 85.4 66.7 69.2 73.4 74.6 10.1 2001 79.2 76.2 79.7 75.0 71.5 78.7 75.0 79.4 84.5 90.0 70.9 75.4 75.8 77.8 6.6 2002 73.8 60.1 66.8 63.7 55.1 62.1 75.0 66.1 66.6 61.6 66.7 65.4 65.8 65.3 8.0 2003 80.9 73.9 80.6 73.2 67.0 73.7 76.7 75.8 76.2 71.5 77.5 64.6 77.1 74.5 6.4 2004 95.8 95.6 99.8 95.5 87.2 88.4 87.5 94.8 96.1 83.7 90.0 65.0 99.6 90.7 10.2 2005 93.6 90.4 88.7 85.2 92.2 89.9 94.6 89.7 83.5 86.9 90.0 88.5 88.5 89.4 3.5 2006 81.7 78.7 86.0 92.0 78.7 67.7 84.0 98.7 82.7 88.4 78.4 85.0 86.7 83.7 8.9 2007 127.0 126.0 133.0 130.5 126.0 122.0 125.0 125.0 126.0 126.0 112.0 131.0 127.0 125.9 4.0 2008 140.0 147.0 146.0 145.0 144.0 144.0 142.0 140.0 138.0 142.0 132.0 144.0 145.0 142.2 2.8 2009 139.0 139.5 134.0 132.8 134.0 125.0 126.5 142.5 138.5 129.5 124.0 130.0 132.0 133.0 4.4 2010 125.5 128.5 124.0 124.5 127.0 124.0 126.0 133.0 132.0 128.5 126.5 120.0 123.5 126.5 2.8

State of Food and Agriculture in Syria 2010
283
Table A4.24. Development of the retail price index by food groups, 2000-2009 (%)
Item 2000 2001 2002 2003 2004 2005 2006 2007 2008 2009 Average
2001-2003 Average
2007-2009 Average change %
2001-2009 AAGR % 2001-2009
General price index 100 103 104 109 114 123 135 141 166 171 105.3 159.2 51.2 10.9 Food stuff 100 105 103 107 113 122 138 152 190 191 105.0 177.5 69.1 14.0 Cereals 100 99 103 104 106 109 118 122 186 181 102.0 163.1 59.9 12.5 Dry legumes 100 98 96 94 94 106 126 139 147 143 96.0 143.1 49.0 10.5 Fruits and nuts 100 102 102 105 108 111 134 150 185 181 103.0 172.0 67.0 13.7 Source: Elaborated from CBS, the ASA, various issues. Base: 2000.
Table A4.25. Development of agricultural exports by products, 1998-2008
Item Quantity
tonne Value
US$ million RUV
US$/tonne RCAI
CR1 %
CR2 %
NP Major destination countries %
Cereals Soft and hard wheat
1998 0.1 Average (91-01) 49,184 10.9 221.9 Average (06-08) 769,721 127.5 165.6
2004 700,193 125.9 179.8 Egypt (35), Iraq (16.3), Algeria (15.6), Jordan (11.3), Lebanon (9.1), North Korea (3) 2005 750,332 84.8 113.0 Egypt (58.6), Jordan (10.6), Tunisia (10.1), Italy (8.5) 2006 1,196,341 147.6 123.4 5.2 Egypt (30.1), Jordan (19.9), Tunisia (4.0), Italy (43.9) 2007 994,673 197.7 198.8 4.1 94.8 99.9 12 Egypt (29.7), Jordan (26.9), Tunisia (24.6), Italy (9.1), Turkey (4.6) 2008 114,592 36.5 318.9 99.7 100.0 7 Egypt (16.4), Jordan (39.0), Yemen (43.6)
Dry legumes Lentils
1998 2.2 Average (91-01) 28,970 17.9 616.2 Average (06-08) 43,538 23.9 548.2
2004 71,459 26.7 373.3 Egypt (56.8), Saudi Arabia (18.7), Jordan (6.9), Turkey (4.3), Lebanon (3.1), Bangladesh (7.9)
2005 76,856 31.4 408.7 Egypt (29.2), Saudi Arabia (20.2), Jordan (9.7), Turkey (20.8), Lebanon (2.2), Morocco (3.3), Sudan (7.3)
2006 25,571 11.7 458.7 39.8 Egypt (17.8), Saudi Arabia (33.5), Jordan (12.3), Turkey (12.3), Lebanon (5.4), Morocco (5.4), Kuwait (3.8)
2007 78,415 43.2 550.3 107.7 88.7 89.5 38 Egypt (41.1), Saudi Arabia (16.5), Jordan (6.4), Turkey (6.4), Bangladesh (18.3)
2008 26,628 16.7 627.8 97.3 98.0 33 Egypt (51.1), Saudi Arabia (21.6), Jordan (3.0), Bangladesh (7.9), Kuwait (5.7), Sudan (3.2), UAE (3.0)
Source: Elaborated from NAPC database, Syrian Agricultural Trade, 2008-2009. RUV: Relative unit value; RCAI: Revealed comparative advantage indicator; CR1: Market share of the major five partners; CR2: Market share of the major ten partners; NP: Number of trading partners. UAE: United Arab Emirate.

State of Food and Agriculture in Syria 2010
284
Table A4.25. Continued
Item Quantity
tonne
Value US$
million
RUV US$/tonne
RCAI CR1%
CR2 %
NP Major destination countries %
Dry legumes (continued)
Chickpeas
1998 1.4
Average (91-01) 8,092.0 6.2 769.0
Average (06-08) 344.0 0.2 648.7
2004 29,459.0 12.1 411.8 Egypt (12.3), Saudi Arabia (6.0), Jordan (53.7), Lebanon (6.5), UAE (3.3)
2005 19,231.0 8.1 422.7 Egypt (7.4), Saudi Arabia (10.4), Jordan (35.0), Lebanon (16.3), UAE (5.5), Tunisia (12.4)
2006 685.0 0.3 495.7 1.0 Kuwait (19.7), Saudi Arabia (18.3), Jordan (30.0), Lebanon (21.4)
2007 185.0 0.1 721.2 0.3 70.7 66.9 30 Lebanon (20.1), Saudi Arabia (17.3), UK (16.0), Sweden (11.8), Cyprus (5.5), Denmark (4.3)
2008 162.0 0.2 1,212.2 86.8 85.7 26 Saudi Arabia (18.3), Kuwait (14.6), Germany (14.3), Iraq (10.3), Greece (9.5), Romania (6.8), UK (3.9)
Industrial crops
Cumin
Average (91-01) 19,733.0 43.5 2,203.5
Average (06-08) 31,056.0 31.9 1,028.7
2004 31,130.0 23.2 746.8 UAE (19.2), EU (12.8), USA (11.3), Brazil (11.2), Saudi Arabia (10.2), Egypt (5.1), Morocco (5.0), Algeria (4.0), Malaysia (3.8)
2005 EU (11.0), USA (10.5), Saudi Arabia (10.8), Egypt (10.6), Morocco (11.0), Algeria (3.8), UAE (9.8), Brazil (8.0)
2006 39,841.0 32.3 810.2 UAE (20.5), Egypt (10.5), Brazil (8.8), Saudi Arabia (7.9), Morocco (7.1), Singapore (5.3), USA (5.3), Vietnam (3.6), Algeria (3.5), Mexico (3.1)
2007 31,680.0 35.8 1,128.7 49.9 69.2 54 Saudi Arabia (11.9), UAE (11.7), Egypt (9.9), Morocco (9.3), Brazil (7.1), USA (6.1), Turkey (4.5), Algeria (3.1), Vietnam (3.1), Holland (2.5)
2008 12,186.0 18.9 1,551.7 65.4 78.1 44 Morocco (26.3), Egypt (17.1), Saudi Arabia (14.4), Algeria (3.9), Brazil (3.7), Spain (3.5), Turkey (3.5), Colombia (3.2)
Aniseeds
Average (91-01) 2,034.0 4.4 2,144.4
Average (06-08) 5,247.0 6.3 1,207.9 UK: United Kingdom; EU: European Union; USA: United States of America.

State of Food and Agriculture in Syria 2010
285
Table A4.25. Continued
Item Quantity
tonne
Value US$
million
RUV US$/tonne
RCAI CR1%
CR2 %
NP Major destination countries %
Industrial crops (continued)
Aniseeds (continued)
2004 3,166.0 3.5 1,110.9 USA (15.3), Saudi Arabia (9.4), Mexico (8.9), Lebanon (7.2), Ecuador (7.0), Venezuela (4.6), France (4.3), Egypt (4.1), Holland (4.1), Algeria (3.9), Turkey (2.8), Brazil (2.6), Kuwait (2.2), UAE (1.7)
2005 Turkey (38.3), USA (13.9), Brazil (7.7), Lebanon (4.0), Holland (3.7), Saudi Arabia (3.0), Venezuela (2.7), Mexico (2.5), Jordan (1.9), Ecuador (1.9), France (1.6)
2006 7,030.0 7.2 1,017.9 Egypt (15.4), Brazil (9.3), USA (8.4), Mexico (6.9), Saudi Arabia (6.6), Turkey (6.3), Ecuador (4.4), Algeria (4.3), Morocco (4.0), Holland (3.9), UAE (3.2), Jordan (2.9), France (2.3), Lebanon (2.2)
2007 USA (20.2), Egypt (13.7), Turkey (11.4), Brazil (9.9), Algeria (5.5), Holland (3.7), France (3.5), Jordan (3.1), Mexico (3.1)
2008 5,445.0 5.5 1,005.8 USA (23.8), Egypt (11.5), Ecuador (5.9), Jordan (5.6), Saudi Arabia (5.0), Brazil (4.9), Algeria (4.4), France (4.3), Turkey (4.1), Lebanon (3.6), Venezuela (3.3), Mexico (3.1)
Seed cotton
Average (91-01) 174,011.0 186.1 1,069.3
Average (06-08) 64,914.0 89.3 1,376.2
2004 113,876.0 156.2 1,372.0 Turkey (20.0), Pakistan (19.4), Italy (15.2), China (12.6), Indonesia (6.2), South Korea (3.6), Egypt (3.4)
2005 159,256.0 163.2 1,025.0 Turkey (36.6), Italy (11.1), China (8.0), Indonesia (7.2), Japan (7.1), Thailand (5.4), Pakistan (4.2), Egypt (4.4)
2006 137,293.0 169.6 1,235.2 China (25.2), Turkey (23.2), Egypt (16.7), Italy (12.8), Bangladesh (4.8), Indonesia (4)
2007 43,920.0 75.9 1,728.2 Spain (25.6), Turkey (17.3), Japan (14.8), Egypt (12.0), South Korea (6.9), Portugal (6.3), China (6.2)
2008 13,529.0 22.5 1,664.7 Tunisia (22.2), Egypt (15.3), China (14.2), Japan (11.2), Pakistan (7.8), Portugal (4.4), Italy (3.4)

State of Food and Agriculture in Syria 2010
286
Table A4.25. Continued
Item Quantity
tonne Value
US$ million RUV
US$/tonne RCAI
CR1 %
CR2 %
NP Major destination countries %
Vegetables Tomato
1998 0.6 Average (91-01) 167,060.0 80.8 483.6 Average (06-08) 154,943.0 43.9 283.5
2004 260,310.0 28.9 110.9 Saudi Arabia (67.6), Kuwait (7.0), EU (4.6), Lebanon (4.2), Ukraine (4.1), UAE (3.7) 2005 327,152.0 41.1 125.7 Saudi Arabia (58.0), Lebanon (12.5), Iraq (9.1), UAE (4.2), EU (4.6) 2006 256,411.0 51.1 199.3 16.7 Saudi Arabia (51.5), Iraq (12.9), Lebanon (11.8), EU (9.6), Kuwait (5.9), UAE (3.4) 2007 123,470.0 52.0 421.3 20.8 92.5 99.4 15 Saudi Arabia (68.4), Iraq (11.5), EU (5.4), UAE (3.6), Lebanon (3.6) 2008 84,949.0 28.7 337.5 93.5 99.8 16 Saudi Arabia (57.8), Lebanon (13.1), Iraq (9.8), UAE (7.8), Oman (4.9), Kuwait (4.4)
Cooled potato 1998 0.1
Average (91-01) 31,258.5 13.8 441.1 Average (06-08) 18,222.1 3.9 215.6
2004 16,798.2 3.0 178.9 Iraq (36.4), Kuwait (17.3), Saudi Arabia (12.4), UAE (8.1), Lebanon (7.8), Qatar (5.3), Oman (4.8), Jordan (3.7)
2005 23,188.5 5.4 234.2 Iraq (46.9), Lebanon (8.0), Kuwait (7.5), UAE (5.4), Jordan (5.3), Saudi Arabia (4.5), Oman (3.0), Qatar (2.9)
2006 34,816.2 5.9 170.3 2.5 UAE (19.0), Iraq (17.8), Saudi Arabia (17.1), Kuwait (14.6), Jordan (8.5), Oman (4.5), Lebanon (3.5)
2007 4,201.8 1.8 431.4 1.3 91.4 93.4 12 Saudi Arabia (30.2), Jordan (29.2), EU (11.7), Kuwait (9.3), Qatar (3.4) 2008 15,648.3 4.0 258.4 98.6 97.9 12 Jordan (47.7), UAE (21.1), Iraq (20.6)
Fruits Varied fruits
1998 0.4 Average (91-01) 59,539.0 49.4 829.9 Average (06-08) 46,712.0 22.9 489.5
2004 47,641.0 18.9 396.4 Jordan (25.2), Saudi Arabia (20.9), Egypt (20.2), Lebanon (5.4), Russia (3.8), UAE (3.8), Kuwait (3.1)
2005 109,402.0 29.1 266.0 Saudi Arabia (27.6), Egypt (19.6), Jordan (17.9), Lebanon (8.9), Kuwait (5.6), Iraq (4.0), UAE (2.5)
2006 56,577.0 30.3 535.7 6.4 Egypt (40.1), Jordan (21.1), Saudi Arabia (17.9), Libya (3.4), Kuwait (1.6), Lebanon (1.5)
2007 45,196.0 19.4 428.4 3.6 84.8 91.3 16 Egypt (57.7), Jordan (14.3), Libya (6.0), Iraq (4.0), Saudi Arabia (2.8), Yemen (2.3) 2008 38,364.0 18.9 493.6 95.1 96.1 19 Egypt (68.9), Jordan (16.5), Iraq (4.6), Libya (2.4), Sudan (2.3)
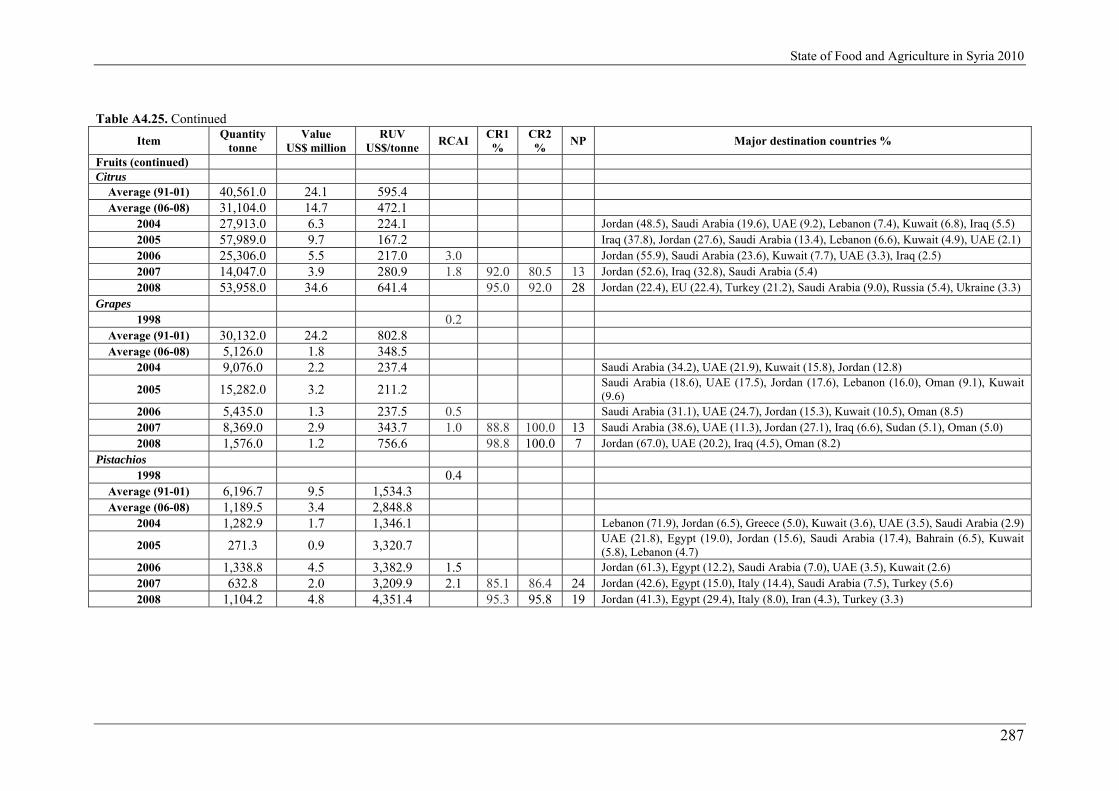
State of Food and Agriculture in Syria 2010
287
Table A4.25. Continued
Item Quantity
tonne Value
US$ million RUV
US$/tonne RCAI
CR1 %
CR2 %
NP Major destination countries %
Fruits (continued) Citrus
Average (91-01) 40,561.0 24.1 595.4 Average (06-08) 31,104.0 14.7 472.1
2004 27,913.0 6.3 224.1 Jordan (48.5), Saudi Arabia (19.6), UAE (9.2), Lebanon (7.4), Kuwait (6.8), Iraq (5.5) 2005 57,989.0 9.7 167.2 Iraq (37.8), Jordan (27.6), Saudi Arabia (13.4), Lebanon (6.6), Kuwait (4.9), UAE (2.1) 2006 25,306.0 5.5 217.0 3.0 Jordan (55.9), Saudi Arabia (23.6), Kuwait (7.7), UAE (3.3), Iraq (2.5) 2007 14,047.0 3.9 280.9 1.8 92.0 80.5 13 Jordan (52.6), Iraq (32.8), Saudi Arabia (5.4) 2008 53,958.0 34.6 641.4 95.0 92.0 28 Jordan (22.4), EU (22.4), Turkey (21.2), Saudi Arabia (9.0), Russia (5.4), Ukraine (3.3)
Grapes 1998 0.2
Average (91-01) 30,132.0 24.2 802.8 Average (06-08) 5,126.0 1.8 348.5
2004 9,076.0 2.2 237.4 Saudi Arabia (34.2), UAE (21.9), Kuwait (15.8), Jordan (12.8)
2005 15,282.0 3.2 211.2 Saudi Arabia (18.6), UAE (17.5), Jordan (17.6), Lebanon (16.0), Oman (9.1), Kuwait (9.6)
2006 5,435.0 1.3 237.5 0.5 Saudi Arabia (31.1), UAE (24.7), Jordan (15.3), Kuwait (10.5), Oman (8.5) 2007 8,369.0 2.9 343.7 1.0 88.8 100.0 13 Saudi Arabia (38.6), UAE (11.3), Jordan (27.1), Iraq (6.6), Sudan (5.1), Oman (5.0) 2008 1,576.0 1.2 756.6 98.8 100.0 7 Jordan (67.0), UAE (20.2), Iraq (4.5), Oman (8.2)
Pistachios 1998 0.4
Average (91-01) 6,196.7 9.5 1,534.3 Average (06-08) 1,189.5 3.4 2,848.8
2004 1,282.9 1.7 1,346.1 Lebanon (71.9), Jordan (6.5), Greece (5.0), Kuwait (3.6), UAE (3.5), Saudi Arabia (2.9)
2005 271.3 0.9 3,320.7 UAE (21.8), Egypt (19.0), Jordan (15.6), Saudi Arabia (17.4), Bahrain (6.5), Kuwait (5.8), Lebanon (4.7)
2006 1,338.8 4.5 3,382.9 1.5 Jordan (61.3), Egypt (12.2), Saudi Arabia (7.0), UAE (3.5), Kuwait (2.6) 2007 632.8 2.0 3,209.9 2.1 85.1 86.4 24 Jordan (42.6), Egypt (15.0), Italy (14.4), Saudi Arabia (7.5), Turkey (5.6) 2008 1,104.2 4.8 4,351.4 95.3 95.8 19 Jordan (41.3), Egypt (29.4), Italy (8.0), Iran (4.3), Turkey (3.3)

State of Food and Agriculture in Syria 2010
288
Table A4.25. Continued
Item Quantity
tonne Value
US$ million RUV
US$/tonne RCAI
CR1 %
CR2 %
NP Major destination countries %
Live sheep 1998 1.4
Average (91-01) 26,928.0 63.0 2,339.9 Average (06-08) 70,676.0 193.9 2,743.6
2004 93,850.0 225.3 2,400.2 Saudi Arabia (73.0), Lebanon (9.1), Kuwait (9.1), Qatar (7.6) 2005 68,118.0 179.8 2,639.7 Saudi Arabia (77.0), Lebanon (4.0), Kuwait (8.0), Qatar (10.0) 2006 85,153.0 222.8 2,616.8 124.9 Saudi Arabia (83.2), Lebanon (1.6), Kuwait (7.7), Qatar (6.8) 2007 85,599.0 214.3 2,503.5 146.8 99.7 100.0 10 Saudi Arabia (89.1), Lebanon (2.7), Kuwait (1.3), Qatar (6.1) 2008 41,275.0 144.6 3,503.5 99.7 100.0 7 Saudi Arabia (88.2), Qatar (8.4), Iraq (1.4)
Table A4.26. Development of agricultural imports by products, 1999-2008
Item Quantity
tonne Value
US$ million RUV
US$/tonne CR1 %
CR2 %
NP Major import destinations %
Cereals Barley Average (91-01) 505,942 47.8 94.6 Average (06-08) 637,246 129.6 203.4
2004 624,727 66.4 106.3 Iraq (45.0), Ukraine (44.6), Bulgaria (8.5) 2005 802,516 100.9 125.8 Ukraine (46.9), Russia (23.4), Turkey (20.0), France (3.4) 2006 462,946 57.7 124.7 Turkey (46.0), Ukraine (36.7), Russia (8.9) 2007 90,920 13.6 149.2 100 100 8 Ukraine (54.7), Russia (17.1), Turkey (16.9), Kazakhstan (7.9), Bulgaria (3.5) 2008 1,357,872 317.7 233.9 87.8 97.6 13 Ukraine (57.6), Russia (18.3), Bulgaria (6.6), Romania (3.3)
Maize Average (91-01) 826,029 93.8 113.6 Average (06-08) 1,263,311 201.7 159.6
2004 855,778 112.8 131.9 USA (84.7), Argentina (14.9) 2005 1,474,703 180.8 122.6 USA (66.2), Argentina (13.5), Ukraine (11.2), Turkey (4.1), Bulgaria (3.6) 2006 1,390,315 174.9 125.8 USA (74.7), Turkey (5.5), Bulgaria (3.3) 2007 1,388,225 219.9 158.4 100 100 8 USA (91.4), Argentina (6.8), Uruguay (1.5) 2008 1,011,392 210.3 207.9 93.3 99.5 18 USA (31.7), Argentina (42.0), Ukraine (11.0), Bulgaria (5.1), Hungary (3.6), Romania (3.4)
Source: Elaborated from NAPC database, Syrian Agricultural Trade, 2008-2009. RUV: Relative unit value; CR1: Market share of the major five partners; CR2: Market share of the major ten partners; NP: Number of trading partners.
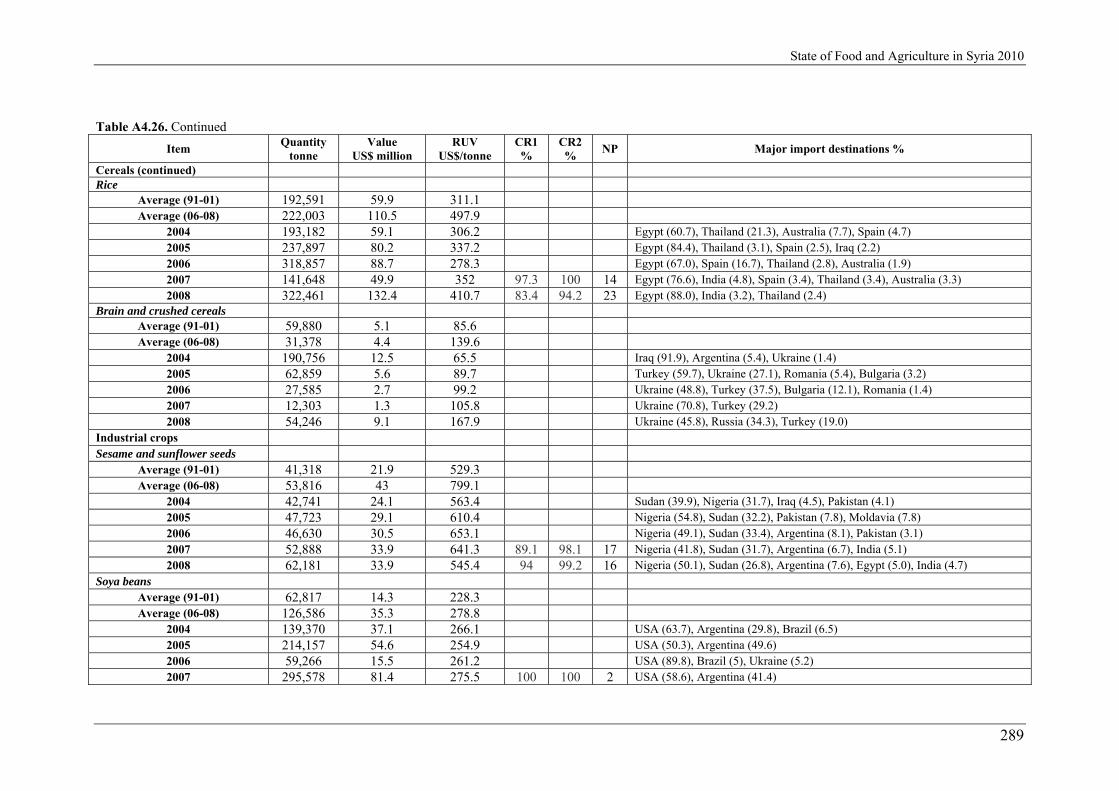
State of Food and Agriculture in Syria 2010
289
Table A4.26. Continued
Item Quantity
tonne Value
US$ million RUV
US$/tonne CR1 %
CR2 %
NP Major import destinations %
Cereals (continued) Rice
Average (91-01) 192,591 59.9 311.1 Average (06-08) 222,003 110.5 497.9
2004 193,182 59.1 306.2 Egypt (60.7), Thailand (21.3), Australia (7.7), Spain (4.7) 2005 237,897 80.2 337.2 Egypt (84.4), Thailand (3.1), Spain (2.5), Iraq (2.2) 2006 318,857 88.7 278.3 Egypt (67.0), Spain (16.7), Thailand (2.8), Australia (1.9) 2007 141,648 49.9 352 97.3 100 14 Egypt (76.6), India (4.8), Spain (3.4), Thailand (3.4), Australia (3.3) 2008 322,461 132.4 410.7 83.4 94.2 23 Egypt (88.0), India (3.2), Thailand (2.4)
Brain and crushed cereals Average (91-01) 59,880 5.1 85.6 Average (06-08) 31,378 4.4 139.6
2004 190,756 12.5 65.5 Iraq (91.9), Argentina (5.4), Ukraine (1.4) 2005 62,859 5.6 89.7 Turkey (59.7), Ukraine (27.1), Romania (5.4), Bulgaria (3.2) 2006 27,585 2.7 99.2 Ukraine (48.8), Turkey (37.5), Bulgaria (12.1), Romania (1.4) 2007 12,303 1.3 105.8 Ukraine (70.8), Turkey (29.2) 2008 54,246 9.1 167.9 Ukraine (45.8), Russia (34.3), Turkey (19.0)
Industrial crops Sesame and sunflower seeds
Average (91-01) 41,318 21.9 529.3 Average (06-08) 53,816 43 799.1
2004 42,741 24.1 563.4 Sudan (39.9), Nigeria (31.7), Iraq (4.5), Pakistan (4.1) 2005 47,723 29.1 610.4 Nigeria (54.8), Sudan (32.2), Pakistan (7.8), Moldavia (7.8) 2006 46,630 30.5 653.1 Nigeria (49.1), Sudan (33.4), Argentina (8.1), Pakistan (3.1) 2007 52,888 33.9 641.3 89.1 98.1 17 Nigeria (41.8), Sudan (31.7), Argentina (6.7), India (5.1) 2008 62,181 33.9 545.4 94 99.2 16 Nigeria (50.1), Sudan (26.8), Argentina (7.6), Egypt (5.0), India (4.7)
Soya beans Average (91-01) 62,817 14.3 228.3 Average (06-08) 126,586 35.3 278.8
2004 139,370 37.1 266.1 USA (63.7), Argentina (29.8), Brazil (6.5) 2005 214,157 54.6 254.9 USA (50.3), Argentina (49.6) 2006 59,266 15.5 261.2 USA (89.8), Brazil (5), Ukraine (5.2) 2007 295,578 81.4 275.5 100 100 2 USA (58.6), Argentina (41.4)

State of Food and Agriculture in Syria 2010
290
Table A4.26. Continued
Item Quantity
tonne Value
US$ million RUV
US$/tonne CR1 %
CR2 %
NP Major import destinations %
Industrial crops (continued) Soya beans (continued)
2008 24,913 9 359.3 100 100 2 USA (82.8), Argentina (17.2) Fruits Banana
Average (91-01) 64,953 22 338.3 Average (06-08) 237,899 43.2 181.7
2004 94,332 24.5 259.8 Ecuador (62.0), Lebanon (23.4), Yemen (6.9) 2005 565,125 24.6 43.6 Colombia (59.3), Ecuador (28.8), Lebanon (5.0) 2006 317,911 36 113.3 Ecuador (68.8), Lebanon (6.8), Egypt (5.4), Costarica (3.6), Colombia (3.1) 2007 179,513 49.1 273.4 94 97.5 18 Ecuador (82.2), Egypt (4.8), Yemen (4.7) 2008 216,273 44.6 206.1 98.9 99.5 17 Ecuador (60.2), Lebanon (22.9), Colombia (4.8),Yemen (3.5)

State of Food and Agriculture in Syria 2010
291
Annex Five
Agro-Industries

State of Food and Agriculture in Syria 2010
292
Annex 5. Agro-industries Table A5.1. Development of the agro-industrial mix, 2000-2008
Item Unit 2000 2001 2002 2003 2004 2005 2006 2007 2008
ACH %
2000-2008
Flour 000
tonnes 1,686 1,697 1,689 1,032 1,460 1,790 788 812 1,134 14.2
Bread 000
tonnes 1,896 2,336 2,457 65,887 60,620 51,700 64,773 92,206 118,742 60.9
Vegetal oil and ghee
tonne 88,786 106,506 114,458 141,161 157,760 170,626 197,983 230,982 349,953 21.9
Animal ghee and butter
tonne 975 1,169 1,091 10,013 10,855 11,073 10,650 9,891 7,899 -24.2
Olive oil tonne 165,354 95,384 194,599 3,341 4,171 4,025 4,189 4,389 4,075 11.3 Soap tonne 17,649 17,653 18,834 315 257 225 213 210 179 114.2 Cotton cake
000 tonnes
312 328 1,122 1,535 2,293 3,460 3,488 4,456 4,025 546.6
Variant canned foods
tonne 20,793 11,435 22,324 8,327 8,689 12,453 19,678 21,023 30,650 43.6
Pasteurized milk
tonne 13,487 16,775 15,916 13,412 13,144 11,832 13,056 13,245 12,652 -18.8
Variant biscuits
tonne 13,079 13,672 17,361 123 231 148 198 197 236 99
Chocolate tonne 5,581 6,081 7,089 57,295 57,180 53,023 68,183 64,030 47,346 132.3 Macaroni and noodles
tonne 8,191 7,956 8,210 278 263 211 315 263 172 112.5
Dried onion
tonne 1,443 1,047 1,129 3,949 2,398 2,676 2,726 3,103 3,224 -24.4
Mineral water
000 liters
26,927 57,692 57,781 27,556 29,725 30,050 30,994 31,950 31,840 93.6
Gaseous beverages
000 liters
117,122 122,466 132,244 98,374 135,725 146,405 145,585 138,182 137,010 109.5
Beer 000 liters
9,078 9,950 10,370 2,353 3,261 3,478 3,521 3,354 3,472 -3.3
Arak 000 liters
3,823 3,762 3,870 0 11,107 12,533 13,871 14,398 14,376 10.5
Wine 000 liters
326 303 296 0 0 0 0 0 133 -34.8
Other alcoholic beverages
000 liters
1,187 1,248 1,443 29,089 39,576 37,296 42,977 51,273 52,833 208.6
Fruit juice 000 liters
11,920 12,173 8,025 1,032 1,460 1,790 788 812 1,134 122.2
Processed tobacco
tonne 11,097 12,007 12,863 65,887 60,620 51,700 64,773 92,206 118,742 8.3
Sugar 000
tonnes 109 121 214 141,161 157,760 170,626 197,983 230,982 349,953 42.1
Molasses tonne 49,724 59,907 78,618 10,013 10,855 11,073 10,650 9,891 7,899 -4.6 Beet sediment
000 tonnes
224 274 346 3,341 4,171 4,025 4,189 4,389 4,075 -11
Alcohol tonne 2,091 2,192 2,592 315 257 225 213 210 179 31.7 Yeast tonne 26,529 23,979 20,620 1,535 2,293 3,460 3,488 4,456 4,025 33.3 Cotton yarns
tonne 78,019 82,975 90,600 8,327 8,689 12,453 19,678 21,023 30,650 67.2
Mixed woolen yarns
tonne 8,510 9,309 10,324 10,537 12,559 13,878 17,729 17,988 19,066 94.7
Synthetic yarns
tonne 0 0 0 123 231 148 198 197 236
Silk yarns tonne 0 0 0 57,295 57,180 53,023 68,183 64,030 47,346 Cotton textiles
tonne 21,559 25,067 27,777 278 263 211 315 263 172 97.7
Source: Elaborated from CBS, the ASA, various issues.

State of Food and Agriculture in Syria 2010
293
Table A5.1. Continued
Item Unit 2000 2001 2002 2003 2004 2005 2006 2007 2008
ACH %
2000-2008
Mixed woolen textiles
tonne 2,364 2,744 2,675 8,535 10,061 13,878 14,947 15,201 16,111 494.4
Synthetic textiles
tonne 20,364 21,463 24,036 24,750 31,186 35,744 38,155 48,537 55,921 116.5
Silk textiles tonne 10 25 30 30 40 55 32 32 27 37.9 Underwear clothes
000 dozen
6,556 6,277 7,586 8,190 10,438 12,012 15,810 18,098 22,976 178.6
Ready-made clothes
000 pieces
35,116 48,317 51,868 54,738 88,663 91,925 113,543 126,605 190,036 217.9
Variant tricot
000 pieces
14,725 14,441 15,282 16,072 21,884 27,567 32,873 45,309 56,009 201.9
Carpets 000 m2
1,705 1,982 2,211 2,458 5,200 5,960 7,765 10,927 11,714 415.5
Socks 000
dozen 4,410 6,312 7,130 8,003 9,045 9,234 12,704 18,659 20,084 188.2
Blankets 000
pieces 429 425 438 460 526 677 985 1,013 1,133 142.2
Bed sheets 000
pieces 1,599 1,808 1,785 1,817 1,905 2,258 3,476 6,413 7,198 229
Towels and kaflas
000 pieces
8,897 7,818 7,950 8,133 10,104 12,721 16,818 22,817 24,034 158.1
Leather shoes
000 pairs
20,679 21,687 22,453 23,412 35,297 37,497 44,076 53,967 55,185 136.4
Sport and rubber shoes
000 pairs
2,009 2,876 2,431 2,813 3,031 2,818 3,573 12,717 13,105 301.7
Tanned hides box
000 feet2
1,335 1,214 1,080 91 0 499 27 37 416 -86.8
Tanned hides
000 feet2
577 964 1,117 417 599 727 849 951 0 -32.3
Plywood m3 38,622 37,237 45,098 45,969 49,219 41,609 46,832 52,057 55,890 28 Panolatteh wood
m3 3,872 3,237 4,951 5,487 6,148 6,642 7,244 10,679 10,236 133.5
Compressed wood
m3 3,714 3,380 4,747 5,118 5,353 7,096 9,281 11,659 11,809 176.6
Hygienic paper
000 boxes
9,493 9,996 9,694 10,011 11,621 21,327 27,525 39,133 47,050 289.6
Paper and cardboard
tonne 2,485 2,045 514 54,000 60,000 72,000 84,000 114,000 120,000 6,205.8

State of Food and Agriculture in Syria 2010
294
Table A5.2. Development of the public agro-industrial mix, 2000-2008
Item Unit 2000 2001 2002 2003 2004 2005 2006 2007 2008
ACH %
2000-2008
Flour 000
tonnes 1,686 1,697 1,689 1,716 1,753 1,807 1,832 1,897 2,062 14.2
Bread 000
tonnes 680 710 730 808 821 848 857 920 1,060 33.8
Vegetal oil and ghee
tonne 45,087 44,121 49,568 43,756 33,320 47,723 46,749 33,337 34,658 -17.3
Animal ghee and butter
tonne 975 1,169 1,091 1,054 926 744 1,138 747 567 -24.2
Olive oil tonne 0 0 0 0 0 0 0 0 0 Soap tonne 4,292 4,191 4,313 1,222 1,289 2,207 1,648 1,647 1,318 -63.9
Cotton cake 000
tonnes 136 134 159 144 147 156 149 110 112 -13.5
Variant canned foods
tonne 9,328 3,871 10,295 8,017 8,441 6,692 4,186 3,498 3,509 -52.4
Pasteurized milk
tonne 11,714 15,278 14,509 14,759 13,402 9,123 11,032 6,878 6,800 -40.5
Variant biscuits
tonne 2,207 2,318 1,699 1,644 1,678 1,455 1,264 903 646 -54.8
Chocolate tonne 14 19 11 1 0 0 0 0 0 -100 Macaroni and noodles
tonne 1,433 922 1,095 1,219 1,203 1,178 1,203 1,261 1,551 16.4
Dried onion tonne 1,443 1,047 1,129 1,032 1,460 1,790 788 812 1,134 -24.5 Mineral water
000 liters
26,927 28,848 28,896 32,940 60,620 51,700 64,773 92,206 118,742 225.6
Gaseous beverages
000 liters
3,614 3,014 2,787 2,642 2,412 1,788 779 254 0 -89
Beer 000
liters 9,078 9,950 10,370 10,013 10,855 11,073 10,650 9,891 7,899 -3.3
Arak 000
liters 2,987 3,083 3,108 2,496 3,334 3,113 3,251 3,208 3,398 7.4
Wine 000
liters 326 303 296 315 257 225 213 210 179 -34.9
Other alcoholic beverages
000 liters
34 37 39 49 25 63 73 40 47 45.5
Fruit juice 000
liters 0 0 0 0 0 0 0 0 0
Processed tobacco
tonne 11,097 12,007 12,863 13,412 13,144 11,832 13,056 13,245 12,652 8.3
Sugar 000
tonnes 109 121 214 123 231 148 198 197 236 42.1
Molasses tonne 49,724 59,907 78,618 57,295 57,180 53,023 68,183 64,030 47,346 -4.6 Beet sediment
000 tonnes
224 274 346 278 263 211 315 263 172 -11.1
Alcohol tonne 1,741 1,818 2,227 3,577 2,014 2,281 2,376 2,733 2,869 37.9 Yeast tonne 26,529 23,979 20,620 27,556 29,725 30,050 30,994 31,950 31,840 33.3 Cotton yarns
tonne 78,019 82,975 90,600 98,374 107,610 114,951 110,159 102,048 99,471 23.9
Mixed woolen yarns
tonne 2,364 2,744 2,675 2,353 3,261 3,478 3,521 3,354 3,472 32.9
Synthetic yarns
tonne 0 0 0 0 0 31 41 15 8
Silk yarns tonne 0 0 0 0 0 0 0 0 133 Cotton tonne 11,747 12,445 15,025 15,806 21,401 18,118 19,460 17,050 15,544 32.7

State of Food and Agriculture in Syria 2010
295
textiles Mixed woolen textiles
tonne 335 679 625 351 763 484 739 567 517 11.2
Synthetic textiles
tonne 232 0 1,578 1,298 0 0 0 0 0 -100
Silk textiles tonne 0 0 0 0 0 0 0 0 0 Underwear clothes
000 dozen
720 783 891 510 475 560 402 453 436 -46.1
Ready-made clothes
000 pieces
1,103 1,045 1,160 1,045 743 629 657 743 374 -46.4
Variant tricot
000 pieces
0 0 0 0 0 0 0 0 0
Carpets 000 m2
396 400 436 400 357 397 355 331 307 -19.4
Socks 000
dozen 176 146 130 167 163 178 133 119 158 -9.3
Blankets 000
pieces 41 75 73 73 53 35 80 80 100 37.6
Bed sheets 000
pieces 0 0 0 0 0 0 0 0 0
Towels and kaflas
000 pieces
0 0 0 0 0 0 0 0 0
Leather shoes
000 pairs
805 841 611 518 674 662 489 379 510 -38.9
Sport and rubber shoes
000 pairs
75 56 111 138 177 147 135 141 97 54.1
Tanned hides box
000 feet2
1,335 1,214 1,080 91 0 499 27 37 416 -86.8
Tanned hides
000 feet2
577 964 1,117 417 599 727 849 951 0 -32.3
Plywood m3 1,202 2,779 1,697 1,354 787 0 0 0 0 -100 Panolatteh wood
m3 657 397 191 380 218 130 121 50 35 -83.5
Compressed wood
m3 314 245 518 511 301 300 441 119 84 -40.2
Hygienic paper
000 boxes
248 192 153 141 120 118 108 91 86 -51.9
Paper and cardboard
tonne 0 0 0 0 0 0 0 0 0
Source: Elaborated from CBS, the ASA, various issues.

State of Food and Agriculture in Syria 2010
296
Table A5.3. Development of the production index for public agro-industries, 2000-2009 (%) Item 2000 2001 2002 2003 2004 2005 2006 2007 2008 2009
General industrial index 100 103 109 102 92 91 91 88 85 87 Food stuff and beverages 100 103 114 106 119 112 119 120 133 127 Tobacco 100 108 118 123 119 108 121 125 118 146 Textile and yarn 100 109 116 120 138 138 141 128 123 129 Clothes 100 101 113 85 67 66 58 66 45 48 Tanning and preparation of hides 100 103 90 60 78 82 64 59 85 88 Wood and wooden products 100 124 92 108 91 80 103 91 104 43 Paper and paper products 100 89 64 51 51 54 43 35 34 18 Source: Elaborated from CBS, the ASA, various issues.
Table A5.4. Development of the market share of public agro-industries, 2000-2008 (%) Item 2000 2001 2002 2003 2004 2005 2006 2007 2008
Flour 100 100 100 100 100 100 100 100 100 Bread 35.9 30.4 29.7 31.1 25.4 25.1 24.7 25.9 28.3 Vegetal oil and ghee 50.8 41.4 43.3 39.1 32.6 40.1 37.3 28.2 25.8 Animal ghee and butter 100 100 100 100 100 100 100 100 100 Olive oil 0 0 0 0 0 0 0 0 0 Soap 24.3 23.7 22.9 7.4 6.6 8 4.7 4 3.3 Cotton cake 43.6 40.9 14.2 12.8 5.6 5.2 4.3 2.7 2.9 Variant canned foods 44.9 33.9 46.1 38.9 34.7 24.1 15.3 13.3 14.1 Pasteurized milk 86.9 91.1 91.2 90.9 89.9 86 74 61.9 59.3 Table A5.4. Continued
Item 2000 2001 2002 2003 2004 2005 2006 2007 2008 Variant biscuits 16.9 17 9.8 9.3 8.6 7.3 5.3 3.3 1.8 Chocolate 0.3 0.3 0.2 0 0 0 0 0 0 Macaroni and noodles 17.5 11.6 13.3 14.5 9.9 8.4 5.9 7.9 10 Dried onion 100 100 100 100 100 100 100 100 100 Mineral water 100 100 100 100 100 100 100 100 100 Gaseous beverages 3.1 2.5 2.1 1.9 1.5 1 0.4 0.1 0 Beer 100 100 100 100 100 100 100 100 100 Arak 78.1 82 80.3 74.7 79.9 77.3 77.6 73.1 83.4 Wine 100 100 100 100 100 100 100 100 100 Other alcoholic beverages 2.9 3 2.7 3.2 1.1 1.8 2.1 0.9 1.2 Fruit juice 0 0 0 0 0 0 0 0 0 Processed tobacco 100 100 100 100 100 100 100 100 100 Sugar 100 100 100 100 100 100 100 100 100 Molasses 100 100 100 100 100 100 100 100 100 Beet sediment 100 100 100 100 100 100 100 100 100 Alcohol 83.3 82.9 85.9 90.6 84 85.2 87.2 88.1 89 Yeast 100 100 100 100 100 100 100 100 100 Cotton yarns 100 100 100 100 79.3 78.5 75.7 73.9 72.6 Mixed woolen yarns 100 100 100 100 100 100 100 100 100 Synthetic yarns 0 0 0 0 0 0.2 0.3 0.1 0.1 Silk yarns 100 Cotton textiles 54.5 49.6 54.1 54.3 54.1 48.6 45.3 33.3 29.4 Mixed woolen textiles 14.2 3.9 7.3 5.8 3.3 6.1 3.5 4.2 3.2 Synthetic textiles 1.1 0 6.6 5.2 0 0 0 0 0 Silk textiles 0 0 0 0 0 0 0 0 0 Underwear clothes 11 12.5 11.7 6.2 4.6 4.7 2.5 2.5 1.9 Ready-made clothes 3.1 2.2 2.2 1.9 0.8 0.7 0.6 0.6 0.2 Variant tricot 0 0 0 0 0 0 0 0 0 Carpets 23.2 20.2 19.7 16.3 6.9 6.7 4.6 3 2.6 Socks 4 2.3 1.8 2.1 1.8 1.9 1 0.6 0.8 Blankets 9.6 17.6 16.7 15.9 10.1 5.2 8.1 7.9 8.8 Bed sheets 0 0 0 0 0 0 0 0 0 Towels and kaflas 0 0 0 0 0 0 0 0 0 Leather shoes 3.9 3.9 2.7 2.2 1.9 1.8 1.1 0.7 0.9

State of Food and Agriculture in Syria 2010
297
Table A5.4. Continued Item 2000 2001 2002 2003 2004 2005 2006 2007 2008
Sport and rubber shoes 3.7 1.9 4.6 4.9 5.8 5.2 3.8 1.1 0.7 Tanned hides box 100 100 100 100 100.0 100 100 100 100 Tanned hides 100 100 100 100 100 100 100 100 Plywood 3.1 7.5 3.8 2.9 1.6 0 0 0 0 Panolatteh wood 17 12.3 3.9 6.9 3.5 2 1.7 0.5 0.3 Compressed wood 8.5 7.2 10.9 10 5.6 4.2 4.8 1 0.7 Hygienic paper 2.6 1.9 1.6 1.4 1 0.6 0.4 0.2 0.2 Paper and cardboard 0 0 0 0 0 0 0 0 0 Source: Elaborated by the reporter.
Table A5.5. Development of the private agro-industrial mix, 2000-2008
Item Unit 2000 2001 2002 2003 2004 2005 2006 2007 2008
ACH %
2000-2008
Flour 000
tonnes 0 0 0 0 0 0 0 0 0
Bread 000
tonnes 1,216 1,626 1,727 1,789 2,411 2,525 2,610 2,627 2,690 73.5
Vegetal oil and ghee
tonne 43,699 62,385 64,890 68,161 69,031 71,302 78,508 84,714 99,711 53.8
Animal ghee and butter
tonne 0 0 0 0 0 0 0 0 0
Olive oil tonne 165,354 95,384 194,599 103,947 201,964 123,143 252,352 98,294 156,338 11.3 Soap tonne 13,357 13,462 14,521 15,270 18,324 25,540 33,599 39,311 38,409 169.3 Cotton cake
000 tonnes
176 194 963 985 2,463 2,860 3,342 3,910 3,763 727
Variant canned foods
tonne 11,465 7,564 12,029 12,570 15,898 21,124 23,108 22,729 21,320 116.2
Pasteurized milk
tonne 1,773 1,497 1,407 1,470 1,502 1,490 3,884 4,234 4,661 173.2
Variant biscuits
tonne 10,872 11,354 15,662 16,037 17,801 18,371 22,672 26,526 35,787 124.3
Chocolate tonne 5,567 6,062 7,078 7,985 8,023 8,631 12,704 14,864 15,995 132.9 Macaroni and noodles
tonne 6,758 7,035 7,115 7,205 11,000 12,858 19,122 14,730 13,885 128.3
Dried onion
tonne 0 0 0 0 0 0 0 0 0
Mineral water
000 liters
0 0 0 0 0 0 0 0 0
Gaseous beverages
000 liters
113,508 119,452 129,457 138,519 155,348 168,838 197,204 230,728 349,953 114.6
Beer 000 liters
0 0 0 0 0 0 0 0 0
Arak 000 liters
836 679 762 845 837 912 938 1,181 677 22.8
Wine 000 liters
0 0 0 0 0 0 0 0 0
Other alcoholic beverages
000 liters
1,153 1,211 1,404 1,486 2,268 3,397 3,415 4,416 3,978 213.4
Fruit juice 000 liters
11,920 12,173 8,025 8,327 8,689 12,453 19,678 21,023 30,650 122.2
Processed tobacco
tonne 0 0 0 0 0 0 0 0 0

State of Food and Agriculture in Syria 2010
298
Table A5.5. Continued
Item Unit 2000 2001 2002 2003 2004 2005 2006 2007 2008
ACH %
2000-2008
Sugar 000
tonnes 0 0 0 0 0 0 0 0 0
Molasses tonne 0 0 0 0 0 0 0 0 0 Beet sediment
000 tonnes
0 0 0 0 0 0 0 0 0
Alcohol tonne 350 374 365 372 384 395 350 370 355 -1.3 Yeast tonne 0 0 0 0 0 0 0 0 0 Cotton yarns
tonne 0 0 0 0 28,115 31,454 35,426 36,134 37,539
Mixed woolen yarns
tonne 0 0 0 0 0 0 0 0 0
Synthetic yarns
tonne 0 0 0 0 11,107 12,502 13,830 14,383 14,368
Silk yarns tonne 0 0 0 0 0 0 0 0 0 Cotton textiles
tonne 9,812 12,622 12,752 13,283 18,175 19,178 23,517 34,223 37,289 170.1
Mixed woolen textiles
tonne 6,146 6,565 7,649 8,184 9,298 10,400 14,208 14,634 15,594 118.2
Synthetic textiles
tonne 20,132 21,463 22,458 23,452 31,186 35,744 38,155 48,537 55,921 122.6
Silk textiles tonne 10 25 30 30 40 55 32 32 27 37.9 Underwear clothes
000 dozen
5,836 5,494 6,695 7,680 9,963 11,452 15,408 17,645 22,976 210.9
Ready-made clothes
000 pieces
34,013 47,272 50,708 53,693 87,920 91,296 112,886 125,862 189,600 224.5
Variant tricot
000 pieces
14,725 14,441 15,282 16,072 21,884 27,567 32,873 45,309 56,009 201.9
Carpets 000 m2
1,309 1,582 1,775 2,058 4,843 5,563 7,410 10,596 11,340 529.1
Socks 000
dozen 4,234 6,166 7,000 7,836 8,882 9,056 12,571 18,540 19,777 192.5
Blankets 000
pieces 388 350 365 387 473 642 905 933 975 154.8
Bed sheets 000
pieces 1,599 1,808 1,785 1,817 1,905 2,258 3,476 6,413 7,198 229
Towels and kaflas
000 pieces
8,897 7,818 7,950 8,133 10,104 12,721 16,818 22,817 24,034 158.1
Leather shoes
000 pairs
19,874 20,846 21,845 22,894 34,623 36,835 43,587 53,588 55,085 143.4
Sport and rubber shoes
000 pairs
1,934 2,820 2,320 2,675 2,854 2,671 3,438 12,576 13,104 311.6
Tanned hides box
000 feet2
0 0 0 0 0 0 0 0 0
Tanned hides
000 feet2
0 0 0 0 0 0 0 0 0
Plywood m3 37,420 34,458 43,401 44,615 48,432 41,609 46,832 52,057 55,890 34.3 Panolatteh wood
m3 3,215 2,840 4,760 5,107 5,930 6,512 7,123 10,629 10,201 158.5
Compressed wood
m3 3,400 3,135 4,229 4,607 5,052 6,796 8,840 11,540 11,725 198.3
Hygienic paper
000 boxes
9,245 9,804 9,541 9,870 11,501 21,209 27,417 39,042 46,964 296.7
Paper and cardboard
tonne 0 0 0 54,000 60,000 72,000 84,000 114,000 120,000
Source: Elaborated from CBS, the ASA, various issues.

State of Food and Agriculture in Syria 2010
299
Table A5.6. Development of the market share of private agro-industries, 2000-2008 (%)
Item 2000 2001 2002 2003 2004 2005 2006 2007 2008 Flour 0 0 0 0 0 0 0 0 0 Bread 64.1 69.6 70.3 68.9 74.6 74.9 75.3 74.1 71.7 Vegetal oil and ghee 49.2 58.6 56.7 60.9 67.4 59.9 62.7 71.8 74.2 Animal ghee and butter 0 0 0 0 0 0 0 0 0 Olive oil 100 100 100 100 100 100 100 100 100 Soap 75.7 76.3 77.1 92.6 93.4 92 95.3 96 96.7 Cotton cake 56.4 59.1 85.8 87.2 94.4 94.8 95.7 97.3 97.1 Variant canned foods 55.1 66.1 53.9 61.1 65.3 75.9 84.7 86.7 85.9 Pasteurized milk 13.1 8.9 8.8 9.1 10.1 14 26 38.1 40.7 Variant biscuits 83.1 83 90.2 90.7 91.4 92.7 94.7 96.7 98.2 Chocolate 99.7 99.7 99.8 100 100 100 100 100 100 Macaroni and noodles 82.5 88.4 86.7 85.5 90.1 91.6 94.1 92.1 90 Dried onion 0 0 0 0 0 0 0 0 0 Mineral water 0 0 0 0 0 0 0 0 0 Gaseous beverages 96.9 97.5 97.9 98.1 98.5 99 99.6 99.9 100 Beer 0 0 0 0 0 0 0 0 0 Arak 21.9 18 19.7 25.3 20.1 22.7 22.4 26.9 16.6 Wine 0 Other alcoholic beverages 97.1 97 97.3 96.8 98.9 98.2 97.9 99.1 98.8 Fruit juice 100 100 100 100 100 100 100 100 100 Processed tobacco 0 0 0 0 0 0 0 0 0 Sugar 0 0 0 0 0 0 0 0 0 Molasses 0 0 0 0 0 0 0 0 0 Beet sediment 0 0 0 0 0 0 0 0 0 Alcohol 16.7 17.1 14.1 9.4 16 14.8 12.8 11.9 11 Yeast 0 0 0 0 0 0 0 0 0 Cotton yarns 0 0 0 0 20.7 21.5 24.3 26.1 27.4 Mixed woolen yarns 0 72.2 70.5 72.3 77.7 74.0 74.9 80.1 81.4 Synthetic yarns 0 0 0 0 99.7 99.8 99.7 99.9 99.9 Silk yarns 0 Cotton textiles 45.5 50.4 45.9 45.7 45.9 51.4 54.7 66.7 70.6 Mixed woolen textiles 72.2 70.5 74.1 77.7 74.0 74.9 80.1 81.4 81.8 Synthetic textiles 98.9 100 93.4 94.8 100 100 100 100 100 Silk textiles 100 100 100 100 100 100 100 100 100 Underwear clothes 89 87.5 88.3 93.8 95.4 95.3 97.5 97.5 100 Ready-made clothes 96.9 97.8 97.8 98.1 99.2 99.3 99.4 99.4 99.8 Variant tricot 100 100 100 100 100 100 100 100 100 Carpets 76.8 79.8 80.3 83.7 93.1 93.3 95.4 97 96.8 Socks 96 97.7 98.2 97.9 98.2 98.1 99 99.4 98.5 Blankets 90.4 82.4 83.3 84.1 89.9 94.8 91.9 92.1 86.1 Bed sheets 100 100 100 100 100 100 100 100 100 Towels and kaflas 100 100 100 100 100 100 100 100 100 Leather shoes 96.1 96.1 97.3 97.8 98.1 98.2 98.9 99.3 99.8 Sport and rubber shoes 96.3 98.1 95.4 95.1 94.2 94.8 96.2 98.9 100 Tanned hides box 0 0 0 0 0 0 0 0 Tanned hides 0 0 0 0 0 0 0 0 0.0 Plywood 96.9 92.5 96.2 97.1 98.4 100 100 100 100 Panolatteh wood 83 87.7 96.1 93.1 96.5 98 98.3 99.5 99.7 Compressed wood 91.5 92.8 89.1 90 94.4 95.8 95.2 99 99.3 Hygienic paper 97.4 98.1 98.4 98.6 99 99.4 99.6 99.8 99.8 Paper and cardboard 0 0 0 100 100 100 100 100 100

State of Food and Agriculture in Syria 2010
300
Table A5.7. Contribution of agro-industries to the gross output at current prices, 2001-2009 (SP million; %)
Item 2001 2002 2003 2004 2005 2006 2007 2008 2009
ACH %
2001-2009
Total GO 1,645,700 1,737,054 1,855,898 2,174,192 2,654,585 2,969,597 3,465,787 4,158,909 4,284,726 127.3 Total industrial GO
585,349 608,748 640,372 707,990 1,056,318 1,254,959 1,419,593 1,735,181 1,561,795 157.1
Total GO of TI
352,921 368,257 381,357 408,632 575,584 701,709 783,831 910,432 774,383 123.9
Total GO of AI
179,131 190,304 201,360 210,463 253,141 259,997 263,024 261,156 280,029 40.9
Food stuff, beverages and tobacco
85,912 94,809 100,285 103,791 115,667 117,261 128,394 122,254 141,091 39.4
Textiles, clothing and leather
76,732 78,610 83,051 88,244 102,558 105,217 100,308 105,820 104,872 30.5
Wood and furniture
10,519 11,362 11,837 12,052 24,564 25,679 20,549 20,862 21,532 86.7
Paper, printing and publishing
5,968 5,523 6,187 6,376 10,352 11,840 13,773 12,220 12,534 117.9
% contribution of AI to Total GO 10.9 11 10.8 9.7 9.5 8.8 7.6 6.3 6.5 -38.1 Total industrial GO
30.6 31.3 31.4 29.7 24 20.7 18.5 15.1 17.9 -44.6
Total GO of TI
50.8 51.7 52.8 51.5 44 37.1 33.6 28.7 36.2 -36.9

State of Food and Agriculture in Syria 2010
301
Table A5.7. Continued
Item 2001 2002 2003 2004 2005 2006 2007 2008 2009
ACH %
2001-2009
% contribution of agro-industrial sub-sectors to total GO of AI Food stuff, beverages and tobacco
48 49.8 49.8 49.3 45.7 45.1 48.8 46.8 50.4 -0.7
Textiles, clothing and leather
42.8 41.3 41.2 41.9 40.5 40.5 38.1 40.5 37.5 -7.9
Wood and furniture
5.9 6 5.9 5.7 9.7 9.9 7.8 8 7.7 30.4
Paper, printing and publishing
3.3 2.9 3.1 3 4.1 4.6 5.2 4.7 4.5 59.5
Public industrial sector Total public industrial GO
406,654 424,081 447,085 511,057 763,895 949,754 1,078,829 1,363,664 1,179,133 183.4
Total GO of public TI
175,986 185,587 190,069 213,887 285,603 399,063 444,185 540,093 392,935 149.7
Total GO of public AI
58,564 66,827 72,058 78,823 77,822 76,533 74,144 71,389 84,570 16.5
Public food stuff, beverages and tobacco
43,714 50,690 54,084 56,755 54,327 53,351 52,180 49,768 66,431 13.4
Public textiles, clothing and leather
14,238 15,642 17,112 21,114 22,410 21,711 20,527 20,724 17,224 24.4
Public wood and furniture
350 268 220 224 244 340 362 404 460 46.5
Public paper, printing and publishing
262 227 642 730 841 1,131 1,075 493 455 78.9
% contribution of public AI to Total industrial GO
10 11 11.3 11.1 7.4 6.1 5.2 4.1 5.4 -54.1
Total public industrial GO
14.4 15.8 16.1 15.4 10.2 8.1 6.9 5.2 7.2 -58.2
Total 33.3 36 37.9 36.9 27.2 19.2 16.7 13.2 21.5 -52

State of Food and Agriculture in Syria 2010
302
public GO of TI % contribution of public agro-industrial sub-sectors to total GO of public AI Public food stuff, beverages and tobacco
74.6 75.9 75.1 72 69.8 69.7 70.4 69.7 78.6 -3.1
Public textiles, clothing and leather
24.3 23.4 23.7 26.8 28.8 28.4 27.7 29 20.4 8
Public wood and furniture
0.6 0.4 0.3 0.3 0.3 0.4 0.5 0.6 0.5 34.2
Public paper, printing and publishing
0.4 0.3 0.9 0.9 1.1 1.5 1.4 0.7 0.5 46
Private industrial sector Total private industrial GO
178,695 184,667 193,287 196,933 292,423 305,205 340,764 371,517 382,662 96.7
Total GO of private TI
176,935 182,670 191,288 194,745 289,981 302,646 339,646 370,339 381,448 98.1
Total GO of private AI
120,567 123,477 129,302 131,640 175,319 183,464 188,880 189,767 195,459 53.8
Private food stuff, beverages and tobacco
42,198 44,119 46,201 47,036 61,340 63,910 76,214 72,486 74,660 68.5
Private textiles, clothing and leather
62,494 62,968 65,939 67,130 80,148 83,506 79,781 85,096 87,648 31.9
Private wood and furniture
10,169 11,094 11,617 11,828 24,320 25,339 20,187 20,458 21,072 87.7
Private paper, printing and publishing
5,706 5,296 5,545 5,646 9,511 10,709 12,698 11,727 12,079 120.6
% contribution of private AI to Total industrial GO
20.6 20.3 20.2 18.6 16.6 14.6 13.3 10.9 12.5 -39.9
Total private industrial GO
67.5 66.9 66.9 66.8 60 60.1 55.4 51.1 51.1 -21.7

State of Food and Agriculture in Syria 2010
303
Table A5.7. Continued
Item 2001 2002 2003 2004 2005 2006 2007 2008 2009
ACH %
2001-2009
% contribution of private AI to (continued) Total GO of private TI 68.1 67.6 67.6 67.6 60.5 60.6 55.6 51.2 51.2 -22.3 % contribution of private agro-industrial sub-sectors to total GO of private AI Private food stuff, beverages and tobacco
35 35.7 35.7 35.7 35 34.8 40.4 38.2 38.2 9.7
Private textiles, clothing and leather
51.8 51 51 51 45.7 45.5 42.2 44.8 44.8 -14.3
Private wood and furniture 8.4 9 9 9 13.9 13.8 10.7 10.8 10.8 22.2 Private paper, printing and publishing
4.7 4.3 4.3 4.3 5.4 5.8 6.7 6.2 6.2 44.4
Source: Elaborated from CBS, the ASA, various issues. GO: Gross output; TI: Transformation industries; AI: Agro-industries.
Table A5.8. Contribution of agro-industries to the net domestic product at current prices, 2001-2009 (SP million; %)
Item 2001 2002 2003 2004 2005 2006 2007 2008 2009
ACH %
2001-2009
Total NDP 936,072 982,253 1,031,388 1,217,240 1,446,467 1,635,306 1,937,409 2,347,556 2,419,652 127.3 Total industrial NDP
282,987 283,682 281,415 348,234 490,058 551,503 608,860 771,846 632,596 137.4
Total NDP of TI
74,860 71,965 77,404 104,711 122,028 118,718 116,938 134,227 155,675 81.4
Total NDP of AI
44,557 42,178 50,221 50,316 74,587 70,221 73,377 80,891 94,016 81.3
Food stuff, beverages and tobacco
17,598 16,275 23,053 24,286 29,316 23,201 30,802 31,670 43,675 86.5
Textiles, clothing and leather
21,297 21,084 21,881 21,511 33,928 34,892 32,693 37,725 38,074 68.8
Wood and furniture
3,671 3,419 3,636 2,796 7,398 8,169 6,171 7,629 8,031 103.6
Paper, printing and publishing
1,991 1,400 1,651 1,723 3,945 3,959 3,711 3,867 4,236 134.3
% contribution of AI to
Total NDP 4.8 4.3 4.9 4.1 5.2 4.3 3.8 3.4 3.9 -19.4 Total industrial NDP
15.7 14.9 17.8 14.4 15.2 12.7 12.1 10.5 14.9 -23.1
Total NDP of TI
59.5 58.6 64.9 48.1 61.1 59.1 62.7 60.3 60.4 0.2
% contribution of agro-industrial sub-sectors to total NDP of AI Food stuff, beverages and tobacco
39.5 38.6 45.9 48.3 39.3 33 42 39.2 46.5 3
Textiles, clothing and leather
47.8 50 43.6 42.8 45.5 49.7 44.6 46.6 40.5 -6.8

State of Food and Agriculture in Syria 2010
304
Wood and furniture
8.2 8.1 7.2 5.6 9.9 11.6 8.4 9.4 8.5 11.3
Paper, printing and publishing
4.5 3.3 3.3 3.4 5.3 5.6 5.1 4.8 4.5 29.6
Public industrial sector Total public industrial NDP
233,474 240,595 233,372 301,911 400,067 456,145 518,181 557,300 511,669 124.4
Total NDP of public TI
26,384 30,052 30,546 58,335 33,475 24,844 26,738 20,247 35,338 -5.4
Total NDP of public AI
12,854 14,792 19,119 19,174 21,004 13,943 20,490 16,224 25,955 34
Table A5.8. Continued
Item 2001 2002 2003 2004 2005 2006 2007 2008 2009
ACH %
2001-2009
Total NDP of public AI (continued) Public food stuff, beverages and tobacco
9,596 10,149 14,907 13,731 13,504 7,492 14,272 11,402 22,194 38.1
Public textiles, clothing and leather
3,082 4,539 4,002 5,053 6,980 6,073 6,099 4,544 3,249 19.5
Public wood and furniture
110 48 14 59 70 110 86 101 155 100
Public paper, printing and publishing
66 56 196 331 450 268 33 177 357 78.3
% contribution of public AI to Total industrial NDP
4.5 5.2 6.8 5.5 4.3 2.5 3.4 2.1 4.1 -42
Total public industrial NDP
5.5 6.1 8.2 6.4 5.3 3.1 4 2.9 5.1 -39.7
Total public NDP of TI
48.7 49.2 62.6 32.9 62.7 56.1 76.6 80.1 73.4 43.4
% contribution of public agro-industrial sub-sectors to total NDP of public AI Public food stuff, beverages and tobacco
74.7 68.6 78 71.6 64.3 53.7 69.7 70.3 85.5 2
Public textiles, clothing and leather
24 30.7 20.9 26.4 33.2 43.6 29.8 28 12.5 -7
Public wood and furniture
0.9 0.3 0.1 0.3 0.3 0.8 0.4 0.6 0.6 36.6
Public paper, printing and publishing
0.5 0.4 1 1.7 2.1 1.9 0.2 1.1 1.4 46
Private industrial sector Total private industrial NDP
49,513 43,087 48,043 46,323 89,992 95,358 90,679 114,546 120,929 131.9
Total NDP of private TI
48,476 41,913 46,858 46,376 88,554 93,874 90,200 113,980 120,340 136.4
Total NDP of private AI
31,703 27,386 31,102 31,142 53,583 56,277 52,887 64,667 68,062 105.8
Private food stuff, beverages and tobacco
8,002 6,126 8,146 10,555 15,812 15,708 16,530 20,268 21,481 161.6
Private textiles, clothing and leather
18,215 16,545 17,879 16,458 26,949 28,819 26,594 33,181 34,826 79.7
Private wood and furniture
3,561 3,371 3,622 2,737 7,327 8,059 6,085 7,528 7,876 103.6
Private paper, printing and
1,925 1,344 1,455 1,392 3,495 3,691 3,678 3,690 3,879 138

State of Food and Agriculture in Syria 2010
305
publishing % contribution of private AI to Total industrial NDP
11.2 9.7 11.1 8.9 10.9 10.2 8.7 8.4 10.8 -12.5
Total private industrial NDP
64 63.6 64.7 67.2 59.5 59 58.3 56.5 56.3 -11
Total NDP of private TI
65.4 65.3 66.4 67.2 60.5 59.9 58.6 56.7 56.6 -12.8
% contribution of private agro-industrial sub-sectors to total NDP of private AIPrivate food stuff, beverages and tobacco
25.2 22.4 26.2 33.9 29.5 27.9 31.3 31.3 31.6 27.6
Private textiles, clothing and leather
57.5 60.4 57.5 52.8 50.3 51.2 50.3 51.3 51.2 -12.9
Private wood and furniture
11.2 12.3 11.6 8.8 13.7 14.3 11.5 11.6 11.6 -1.1
Private paper, printing and publishing
6.1 4.9 4.7 4.5 6.5 6.6 7 5.8 5.6 18
Source: Elaborated from CBS, the ASA, various issues. NDP: Net domestic product; TI: Transformation industries; AI: Agro-industries.

State of Food and Agriculture in Syria 2010
306
Table A5.9. Accumulated capital and employment in the public agro-industries, 2000-2009 (SP million, employee, %)
Item 2000 2001 2002 2003 2004 2005 2006 2007 2008 2009
ACH %
2000-2009
Investment (SP million)
Total investment of the public industrial sector (1)
372,823 374,319 512,841 473,111 512,841 473,111 725,933 638,027 698,473 578,966 52
Investment of the public agro-industries (2)
31,822 43,989 47,596 39,406 59,276 58,779 74,214 70,011 79,441 70,385 78.1
Food stuff, beverages and tobacco (3)
14,104 24,647 25,899 14,441 30,360 31,185 35,432 30,534 35,557 36,253 58.3
General Establishment of Food Industries
2,648 4,348 3,414 5,381 5,534 5,655 5,365 5,299 6,718 7,418 86.7
General Organization of Tobacco
2,409 3,045 4,044 1,518 3,963 4,304 8,017 1,786 4,437 4,306 10.9
General Establishment of Sugar
2,973 3,773 4,386 5,292 5,992 5,315 5,365 6,111 6,743 6,588 74.6
General Company of Mills
3,475 10,833 11,538 0 11,536 13,512 13,512 14,082 14,429 14,638 67
General Company of Bakeries
2,375 2,428 1,549 1,566 2,658 1,699 2,232 2,212 2,354 2,381 9.4
Reserve Bakeries Committee
224 220 968 684 677 700 941 1,044 876 922 101.1
General Establishment of Textile Industries (4)
17,718 19,342 21,697 24,965 28,916 27,594 38,782 39,477 43,884 34,132 100
Share of (2) in (1) %
8.5 11.8 9.3 8.3 11.6 12.4 10.2 11 11.4 12.2 16.4
Share of (3) in (2) %
44.3 56 54.4 36.6 51.2 53.1 47.7 43.6 44.8 51.5 -9.6
Share of (4) in (2) %
55.7 44 45.6 63.4 48.8 46.9 52.3 56.4 55.2 48.5 10.3
Return to investment in the public AI
0.292 0.311 0.485 0.323 0.357 0.188 0.293 0.206 0.369
Employment (employee)
Total employment in the public industrial sector (5)
174,484 175,633 183,379 181,158 183,843 188,453 190,274 188,867 188,564 184,347 5.3
Total 107,237 106,064 109,471 108,818 105,827 105,033 105,524 103,535 101,979 96,383 -6.5

State of Food and Agriculture in Syria 2010
307
employment in the public TI (6) Total employment in the public AI (7)
65,505 64,248 67,804 67,646 65,814 65,372 64,798 63,646 62,882 60,680 -5.2
Public food stuff, beverages and tobacco
32,833 32,842 33,058 33,203 32,996 32,974 32,881 32,637 32,546 32,161 -1.4
Public food stuff and beverages
23,559 23,710 23,594 23,733 23,526 23,218 23,125 22,881 22,790 22,405 -3.9
Public tobacco industries
9,274 9,132 9,464 9,470 9,470 9,756 9,756 9,756 9,756 9,756 5
Public textiles, clothing and leather
31,419 30,202 33,523 33,277 31,758 31,377 30,931 30,069 29,437 27,693 -8.4
Public textiles and yarn
27,094 25,669 29,027 28,958 27,794 27,591 27,336 26,681 26,191 24,792 -5
Public clothes 2,728 2,936 2,949 2,829 2,616 2,486 2,343 2,235 2,145 1,961 -26.4 Public tanning and hides
1,597 1,597 1,547 1,490 1,348 1,300 1,252 1,153 1,101 940 -32.6
Public wood and furniture
691 651 565 507 439 408 373 355 331 314 -47.6
Public wood and wooden products
317 298 252 219 179 167 150 137 120 103 58.5
Public furniture
374 353 313 288 260 241 223 218 211 211 -38.5
Public paper, printing and publishing
562 553 658 659 621 613 613 585 568 512 -6.1
Share of (7) in (5) %
37.5 36.6 37 37.3 35.8 34.7 34.1 33.7 33.3 32.9 -10
Share of (7) in (6) %
61.1 60.6 61.9 62.2 62.2 62.2 61.4 61.5 61.7 63 1.7
Source: Elaborated from CBS, the ASA, various issues.

State of Food and Agriculture in Syria 2010
308
Table A5.10. Contribution of private agro-industrial projects to total executed private projects, 2000-2009
Item Unit 2000 2001 2002 2003 2004 2005 2006 2007 2008 2009
ACH %
2000-2009
Total 2000-2009
Total Number of projects Project 590 600 714 695 906 994 936 685 805 757 18.0 7,682
Capital SP
million 4,324 4,864 3,828 4,459 6,621 7,567 16,169 9,548 9,348 18,651 188.4 85,379
Employment Employee 2,803 4,414 4,244 4,173 6,223 5,893 7,799 5,115 7,230 6,488 64.3 54,382 Food stuff Number of projects Project 122 145 206 210 328 380 333 246 301 266 71.5 2,537
Capital SP
million 1,126 1,441 1,261 1,621 2,567 2,838 3,423 2,792 3,125 7,533 251.4 27,727
Employment Employee 578 1,169 845 1,342 1,909 1,724 1,983 1,442 1,568 1,422 71.0 13,982 Textiles Number of projects Project 217 196 227 187 244 227 240 146 179 130 -28.8 1,993
Capital SP
million 631 631 315 856 1,216 1,261 4,324 811 1,741 1,629 165.0 13,415
Employment Employee 1,001 1,268 1,263 952 1,752 1,773 1,857 1,247 1,765 1,331 23.0 14,209 Total agro-industries Number of projects Project 339 341 433 397 572 607 573 392 480 396 13.9 4,530
Capital SP
million 1,757 2,072 1,576 2,477 3,783 4,099 7,747 3,603 4,866 9,162 226.1 41,142
Employment Employee 1,579 2,437 2,108 2,294 3,661 3,497 3,840 2,689 3,333 2,753 43.3 28,191 Contribution of private agro-industries to total private projects Number of projects % 57.5 56.8 60.6 57.1 63.1 61.1 61.2 57.2 59.6 52.3 -3.3 59
Capital % 40.6 42.6 41.2 55.6 57.1 54.2 47.9 37.7 52.1 49.1 11.6 48.2 Employment % 56.3 55.2 49.7 55 58.8 59.3 49.2 52.6 46.1 42.4 -12.4 51.8
Source: Elaborated from CBS, the ASA, various issues.

State of Food and Agriculture in Syria 2010
309
Table A5.11. Contribution of agro-industries to trade, 1999-2008 (US$ million, %)
Item Unit 2002 2003 2004 2005 2006 2007 2008 Average
1999-2001
Average2006-2008
ACH %
1999-2008
Total exports (1)
US$ million
6,556 5,762 7,137 8,486 10,100 11,581 15,231 4,486 12,304 174.3
Food stuff and beverages exports (2)
US$ million
132 192 217 289 718 1,036 2,297 109 1,350 1138.8
Textiles exports (3)
US$ million
263 272 216 240 889 1,119 1,554 224 1,187 430.1
Total agro-industrial exports (4)
US$ million
395 464 433 529 1,607 2,155 3,851 333 2,538 662.1
Share of (4) in (1)
% 6 8.1 6.1 6.2 15.9 18.6 25.3 7.4 19.9 168.5
Share of (2) in (4) % 33.4 41.4 50.1 54.6 44.7 48.1 59.6 32.7 50.8 55.2
Share of (3) in (4)
% 66.6 58.6 49.9 45.4 55.3 51.9 40.4 67.3 49.2 -26.9
Total imports (5)
US$ million
5,070 5,092 7,996 10,047 10,626 13,691 17,994 4,201 14,104 235.7
Table A5.11. Continued
Item Unit 2002 2003 2004 2005 2006 2007 2008 Average
1999-2001
Average2006-2008
ACH %
1999-2008
Food stuff and beverages imports
US$ million
537 519 649 589 782 1,043 1,237 485 1,021 110.4
Tobacco imports
US$ million
36 39 77 42 79 76 53 8 69 766.7
Food stuff, beverages and tobacco imports (6)
US$ million
573 558 726 631 861 1,119 1,290 493 1,090 121.1
Textiles imports (7)
US$ million
183 221 219 221 212 192 283 283 229 -19.1
AI imports (8)
US$ million
756 779 945 852 1,073 1,311 1,573 776 1,319 70
Share of (8) in (5)
% 14.9 15.3 11.8 8.5 10.1 9.6 8.7 18.5 9.5 -48.7
Share of (6) in (8)
% 75.8 71.6 76.8 74.1 80.2 85.4 82 63.5 82.5 29.9
Share of (7) in (8)
% 24.2 28.4 23.2 25.9 19.8 14.6 18 36.5 17.5 -52.1
Total trade (9)
US$ million
11,626 10,854 15,133 18,533 20,726 25,272 33,225 8,687 26,408 204

State of Food and Agriculture in Syria 2010
310
Total trade of food stuff, beverages and tobacco (10)
US$ million
705 750 943 920 1,579 2,155 3,587 602 2,440 305.4
Total trade of textiles (11)
US$ million
446 493 435 461 1,101 1,311 1,837 507 1,416 179.4
Total trade of AI (12)
US$ million
1,151 1,243 1,378 1,381 2,680 3,466 5,424 1,109 3,857 247.8
Share of (12) in (9)
% 9.9 11.5 9.1 7.5 12.9 13.7 16.3 12.8 14.3 12.2
Share of (10) in (12)
% 61.3 60.3 68.4 66.6 58.9 62.2 66.1 54.3 62.4 15
Share of (11) in (12)
% 38.7 39.7 31.6 33.4 41.1 37.8 33.9 45.7 37.6 -17.8
Source: Elaborated from CBS, the ASA, various issues and NAPC database.
Table A5.12. Agro-industrial exports by products, 1998-2008
Item Quantity
tonne
Value US$
million
RUV US$/tonne
RCAI CR1 %
CR2 %
NP Major destination countries %
Cattle cheese
1998 966.0 2.3 2,381.0 Average (91-01)
1 1,059.0 3.2 2,976.6
Average (06-08)
2 10,904.0 29.5 2,701.2
2004 6,814.0 11.5 1,686.7 Saudi Arabia (6.0), Lebanon (67.3), Kuwait (4.1), UAE (2.4)
2005 15,326.0 17.2 1,120.1 Saudi Arabia (6.2), Lebanon (56.0), Kuwait (6.4), Iraq (8.8), Jordan (8.2)
2006 12,396.0 26.1 2,104.4 1.3 Saudi Arabia (4.6), Lebanon (48.7), Kuwait (3.8), UAE (8.6), Jordan (19.4)
2007 10,732.0 28.4 2,642.8 1.5 Saudi Arabia (4.9), Lebanon (37.2), Kuwait (9.1), Iraq (6.1), Jordan (14.3), UAE (19.7)
2008 9,585.0 33.9 3,538.7 Saudi Arabia (10.9), Lebanon (40.8), Kuwait (12.9), Iraq (4.4), Jordan (19.2), UAE (7.3)
ACH % (2/1) 929.7 821.9 -9.3
Source: Elaborated from NAPC database.
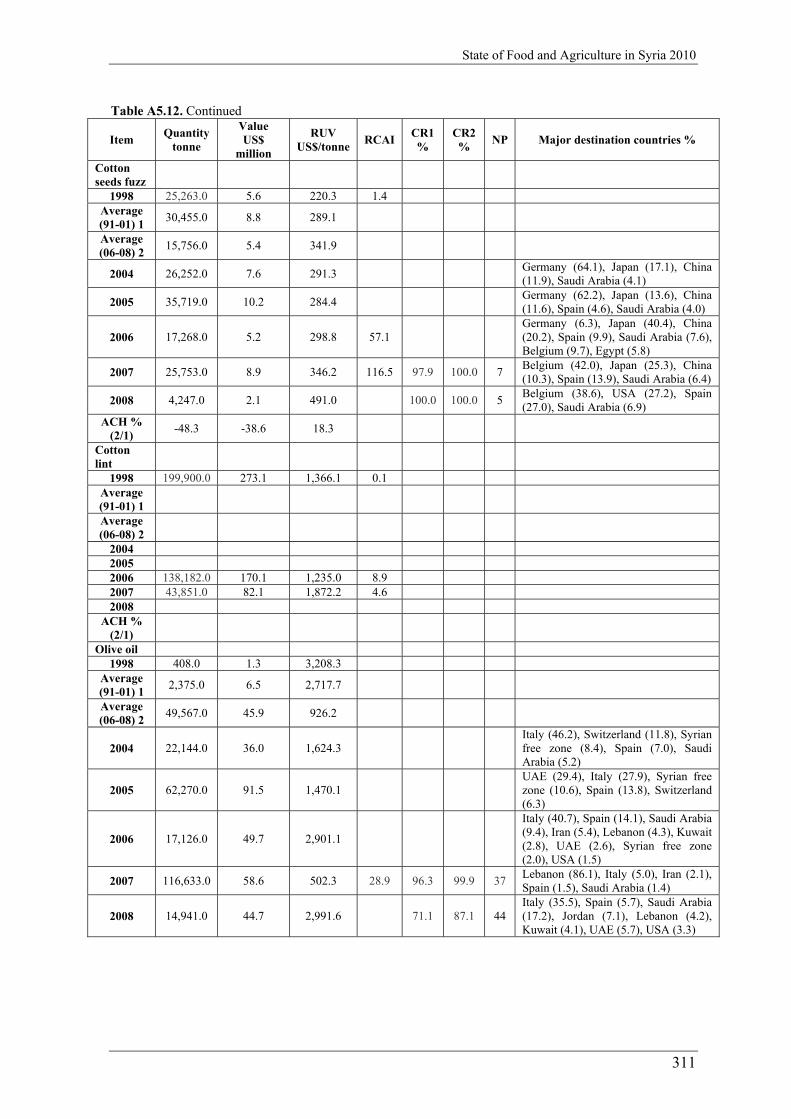
State of Food and Agriculture in Syria 2010
311
Table A5.12. Continued
Item Quantity
tonne
Value US$
million
RUV US$/tonne
RCAI CR1 %
CR2 %
NP Major destination countries %
Cotton seeds fuzz
1998 25,263.0 5.6 220.3 1.4 Average (91-01) 1
30,455.0 8.8 289.1
Average (06-08) 2
15,756.0 5.4 341.9
2004 26,252.0 7.6 291.3 Germany (64.1), Japan (17.1), China (11.9), Saudi Arabia (4.1)
2005 35,719.0 10.2 284.4 Germany (62.2), Japan (13.6), China (11.6), Spain (4.6), Saudi Arabia (4.0)
2006 17,268.0 5.2 298.8 57.1 Germany (6.3), Japan (40.4), China (20.2), Spain (9.9), Saudi Arabia (7.6), Belgium (9.7), Egypt (5.8)
2007 25,753.0 8.9 346.2 116.5 97.9 100.0 7 Belgium (42.0), Japan (25.3), China (10.3), Spain (13.9), Saudi Arabia (6.4)
2008 4,247.0 2.1 491.0 100.0 100.0 5 Belgium (38.6), USA (27.2), Spain (27.0), Saudi Arabia (6.9)
ACH % (2/1)
-48.3 -38.6 18.3
Cotton lint
1998 199,900.0 273.1 1,366.1 0.1 Average (91-01) 1
Average (06-08) 2
2004 2005 2006 138,182.0 170.1 1,235.0 8.9 2007 43,851.0 82.1 1,872.2 4.6 2008
ACH % (2/1)
Olive oil 1998 408.0 1.3 3,208.3
Average (91-01) 1
2,375.0 6.5 2,717.7
Average (06-08) 2
49,567.0 45.9 926.2
2004 22,144.0 36.0 1,624.3 Italy (46.2), Switzerland (11.8), Syrian free zone (8.4), Spain (7.0), Saudi Arabia (5.2)
2005 62,270.0 91.5 1,470.1 UAE (29.4), Italy (27.9), Syrian free zone (10.6), Spain (13.8), Switzerland (6.3)
2006 17,126.0 49.7 2,901.1
Italy (40.7), Spain (14.1), Saudi Arabia (9.4), Iran (5.4), Lebanon (4.3), Kuwait (2.8), UAE (2.6), Syrian free zone (2.0), USA (1.5)
2007 116,633.0 58.6 502.3 28.9 96.3 99.9 37 Lebanon (86.1), Italy (5.0), Iran (2.1), Spain (1.5), Saudi Arabia (1.4)
2008 14,941.0 44.7 2,991.6 71.1 87.1 44 Italy (35.5), Spain (5.7), Saudi Arabia (17.2), Jordan (7.1), Lebanon (4.2), Kuwait (4.1), UAE (5.7), USA (3.3)

State of Food and Agriculture in Syria 2010
312
Table A5.12. Continued
Item Quantity
tonne
Value US$
million
RUV US$/tonne
RCAI CR1 %
CR2 %
NP Major destination countries %
Leather Average (91-01)
1 805.0 1.8 2,213.8
Average (06-08)
2 13,173.0 21.6 1,639.9
2004 5,958.0 16.1 2,706.1 Italy (89.8), Turkey (3.5) 2005 6,635.0 16.3 2,449.6 Italy (96.1), Egypt (2.3)
2006 9,611.0 16.2 1,689.4 Italy (80.2), India (4.7), Egypt (2.5), Turkey (1.9), China (1.2)
2007 13,041.0 22.1 1,691.7 93.9 95.7 14 Italy (67.2), India (14.2), South Korea (7.7), UAE (3.4), Turkey (3.2)
2008 16,868.0 26.5 1,571.7 98.9 99.7 17 Italy (46.2), India (28.2), South Korea (7.1), Pakistan (6.5), UAE (2.0), Turkey (5.9)
ACH % (2/1) 1,536.4 1,100.0 -25.9
Apricot dried sheets
Average (91-01)
1 7,551.0 9.1 1,199.6
Average (06-08)
2 12,689.0 10.1 793.7
2004 7,051.0 5.1 729.3 Egypt (60.9), Saudi Arabia (15.9), Jordan (5.8), Kuwait (5.8), UAE (4.0)
2005 11,177.0 7.4 665.9 Egypt (56.9), Saudi Arabia (18.8), Jordan (6.9), Kuwait (6.4), UAE (3.5)
2006 13,870.0 10.2 736.2 Egypt (66.9), Saudi Arabia (10.7), Jordan (5.0), Kuwait (3.6), UAE (9.4)
2007 12,389.0 9.6 771.7 Egypt (64.1), Saudi Arabia (11.2), Jordan (7.1)
2008 11,806.0 10.3 870.5 Egypt (54.3), Saudi Arabia (14.8), Jordan (4.1), Kuwait (6.5), Sudan (3.0)
ACH % (2/1) 68.0 11.0 -33.8
Gaseous and mineral water
Average (91-01)
1 737.0 0.5 660.9
Average (06-08)
2 291,382.0 73.9 253.5
2004 265,519.0 52.5 197.7 Iraq (79.6), Jordan (17.4) 2005 302,047.0 58.2 192.7 Iraq (78.6), Jordan (18.0) 2006 269,570.0 58.2 216.0 Iraq (90.4), Jordan (4.6) 2007 321,225.0 96.7 301.0 99.7 100.0 27 Iraq (94.8), Jordan (4.0) 2008 283,351.0 66.7 235.3 99.6 100.0 36 Iraq (94.8), Jordan (4.5)

State of Food and Agriculture in Syria 2010
313
Table A5.13. Agro-industrial imports by products, 1999-2008
Item Quantity
tonne
Value US$
million
RUV US$/tonne
CR1 %
CR2 %
NP Major import destinations %
Sugar Average (91-01) 1 529,610.0 129.3 244.2
Average (06-08) 2 569,465.0 219.2 385.0
2004 740,996.0 193.3 260.8 EU (55.4), Brazil (36.3), France (7.6), Colombia (3.5)
2005 714,362.0 185.9 260.3 EU (42.4), Brazil (36.9), France (11.6), Belgium (6.4)
2006 535,620.0 199.3 372.0 EU (53.1), Brazil (17.8), UAE (6.1), Egypt (5.0), Belgium (4.7)
2007 806,237.0 320.9 398.1 89.0 97.2 18 Brazil (40.0), UAE (18.1), EU (10.3), India (10.3), Thailand (10.3), Egypt (3.4)
2008 366,537.0 137.5 375.2 97.8 100.0 9 Brazil (52.6), UAE (36.0), India (4.8), Thailand (10.3)
ACH % (2/1) 7.5 69.5 57.7
Powder milk
Average (91-01) 1 10,640.0 34.4 3,236.7
Average (06-08) 2 11,858.0 52.0 4,385.1
2004 14,645.0 39.5 2,695.0 Holland (21.9), Poland (21.2), Belgium (14.3), France (12.0), Australia (9.5), Maldives (7.2), New Zealand (4.9), Ukraine (3.0)
2005 25,459.0 45.0 1,769.1 France (53.1), Belgium (9.4), Holland (8.3), Maldives (7.2)
2006 12,529.0 42.7 3,405.4 France (30.2), Holland (21.8), Ukraine (11.2), Poland (8.8), New Zealand (7.1), India (5.7), Maldives (4.9)
2007 14,646.0 53.7 3,664.5 70.2 80.0 30 New Zealand (31.8), Holland (14.3), Ukraine (9.4), Belorussia (8.4), India (6.2), Denmark (3.0)
2008 8,400.0 59.7 7,103.1 74.8 94.2 18 Holland (26.5), France (17.2), Iran (14.7), Belgium (9.2), India (7.2), Ukraine (6.4), Mali (5.1)
ACH % (2/1) 11.4 51.2 35.5
Canned fish
Average (91-01) 1 8,186.0 33.7 4,117.3
Average (06-08) 2 16,078.0 32.3 2,007.6
2004 13,612.0 22.6 1,662.9 Morocco (67.4), Thailand (22.5) 2005 15,756.0 19.7 1,251.0 Morocco (50.2), Thailand (43.9) 2006 18,171.0 31.6 1,738.3 Morocco (54.7), Thailand (40.7) 2007 16,487.0 31.8 1,929.1 98.0 100.0 11 Morocco (46.4), Thailand (44.3) 2008 13,576.0 33.4 2,463.4 96.8 100.0 10 Morocco (52.7), Thailand (39.8) ACH
% (2/1) 96.4 -4.2 -51.2
Source: Elaborated from NAPC database.

State of Food and Agriculture in Syria 2010
314
Table A5.13. Continued
Item Quantity
tonne
Value US$
million
RUV US$/tonne
CR1 %
CR2 %
NP Major import destinations %
Butter and ghee
Average (91-01)
1 6,751.00 12.60 1,866.20
Average (06-08)
2 6,960.00 15.20 2,188.90
2004 9,195.00 19.40 2,109.90 Holland (40.5), Belgium (12.8), UAE (12.4), New Zealand (10.5), Denmark (6.2), France (5.5), Poland (3.2)
2005 9,504.00 20.40 2,149.70
Holland (35.1), Belgium (15.4), UAE (6.4), New Zealand (5.4), Denmark (7.1), France (8.2), Poland (2.7), Maldives (4.7), Germany (3.8)
2006 8,443.00 16.90 2,006.70 Holland (48.8), Belgium (8.8), UAE (2.4), New Zealand (12.0), Denmark (2.3), France (5.5), Finland (6.0), Ireland (3.5)
2007 9,419.00 19.40 2,063.40 69.40 87.70 19 Holland (29.3), Belgium (8.8), Estonia (10.6), New Zealand (12.0), Denmark (5.9), France (5.1)
2008 3,018.00 9.30 3,090.30 87.90 100.00 8 Holland (34.9), Belgium (5.6), China (17.1), New Zealand (7.8), India (12.4), France (7.1), Egypt (3.6)
ACH %
(2/1) 3.10 20.90 17.30

State of Food and Agriculture in Syria 2010
315
Table A5.14. Agro-industrial retail prices, 2006-2010 (SP/kg) Item Sweida Dar’a Quneitra Damascus Homs Hama Idleb Tartous Lattakia Aleppo Raqqa Dair-Ezzor Hassake Mean Canned beef 2006 350 350 350 350 350 350 350 350 350 350 350 350 350 350 2007 365 365 375 375 365 365 355 370 375 375 375 365 370 370 2008 350 350 350 350 350 350 350 350 350 350 350 350 350 350 2009 340 340 340 340 340 340 340 340 340 340 340 340 340 340 2010 340 340 340 340 340 340 340 340 340 340 340 340 340 340 Canned poultry 2006 191 191 191 191 191 191 191 191 191 191 191 191 191 191 2007 191 191 191 191 191 176 191 188 191 191 191 191 191 188 2008 188 188 197 188 188 188 188 188 191 188 188 188 188 188 2009 191 191 191 191 191 191 191 191 191 191 191 191 191 191 2010 194 200 200 200 200 200 200 200 200 200 200 200 200 200 Tuna 2006 270 270 270 270 270 270 270 216 216 270 270 270 270 265 2007 276 297 281 279 297 297 259 243 259 270 308 276 286 276 2008 335 346 346 362 346 330 346 346 324 335 346 335 346 341 2009 247 247 247 247 247 247 247 247 247 247 247 247 247 247 2010 243 243 243 243 243 243 243 243 243 243 243 243 243 243 Sardines 2006 200 200 200 200 200 200 200 200 200 200 200 200 200 200 2007 200 200 232 200 200 200 200 200 200 200 200 200 200 200 2008 240 240 240 240 240 224 240 240 240 224 224 224 240 232 2009 200 200 200 200 200 200 200 200 200 200 200 200 200 200 2010 232 232 232 232 232 232 232 232 232 232 232 232 232 232 Baby powder milk 2006 325 325 325 325 325 325 325 325 325 325 325 325 325 325 2007 363 403 378 365 363 373 350 363 380 373 358 378 360 370 2008 565 565 570 565 565 565 565 568 550 565 565 565 565 565 2009 445 445 445 445 445 445 445 445 445 445 445 445 445 445 2010 455 455 455 455 455 455 455 455 455 455 455 455 455 455 Powder milk 2006 252 256 256 256 256 256 250 256 256 250 252 251 251 253 2007 298 294 301 301 301 294 293 300 292 293 294 294 294 297 2008 436 436 438 436 436 436 436 436 436 436 436 436 436 436

State of Food and Agriculture in Syria 2010
316
2009 370 370 370 370 370 370 370 370 370 370 370 370 370 370 2010 368 368 368 368 368 368 368 368 368 368 368 368 368 368 Pasteurized milk 2006 33 33 33 33 33 33 33 33 33 33 33 33 33 33 2007 37 37 37 37 37 37 37 36 37 36 37 37 37 37 2008 45 45 45 45 45 45 45 45 45 45 45 45 45 45 2009 45 45 45 45 45 45 45 45 45 45 45 45 45 45 2010 45 45 45 45 45 45 45 45 45 45 45 45 45 45 Labneh 2006 75 70 70 78 72 62 68 72 65 68 55 55 55 67 2007 88 78 86 79 73 75 82 70 68 80 70 65 64 76 2008 127 105 119 103 86 89 90 95 90 88 89 81 88 97 Labneh (continued) 2009 115 101 123 101 86 88 80 85 85 84 87 91 85 94 2010 101 93 101 94 84 85 79 91 85 91 87 90 84 90 Cattle Akkawi cheese 2006 104 92 90 101 99 95 103 100 97 108 89 94 90 97 2007 121 102 125 111 104 108 115 123 120 120 109 97 93 111 2008 170 134 171 143 142 149 160 140 148 166 159 139 140 150 2009 146 125 152 136 123 120 130 154 160 146 151 134 134 139 2010 136 118 138 127 117 113 120 138 146 131 128 117 117 127 Sheep Akkawi cheese 2006 113 105 104 120 120 100 100 112 105 109 95 104 104 108 2007 123 130 138 113 117 99 103 142 117 118 108 121 123 119 2008 168 166 158 140 149 142 180 168 165 154 154 159 159 157 2009 177 147 165 157 148 130 144 179 165 154 170 168 176 160 2010 167 135 156 148 132 128 128 166 165 159 148 139 164 149 Shalall cheese 2006 123 125 125 130 138 120 120 120 127 122 108 125 123 124 2007 172 157 152 146 145 138 135 153 154 130 119 157 149 147 2008 213 222 210 218 213 218 196 191 205 205 221 207 210 211 2009 251 223 235 222 206 224 220 245 256 200 236 201 214 225 2010 233 211 231 215 202 226 217 239 245 205 237 199 208 220 Haloum cheese 2006 129 133 128 142 146 133 139 141 140 137 132 129 127 136 2007 172 174 149 187 170 150 163 166 164 184 141 153 160 166

State of Food and Agriculture in Syria 2010
317
2008 221 222 197 241 221 253 199 199 230 243 232 208 190 221 2009 288 281 245 241 215 288 279 312 259 306 237 220 223 260 2010 270 243 246 215 213 264 218 255 247 238 239 215 223 236 Kashkaval cheese 2006 220 220 220 220 225 225 220 225 225 219 220 220 220 221 2007 251 249 260 255 259 243 251 254 255 252 252 248 244 252 2008 334 332 334 334 338 334 334 334 334 342 334 334 334 335 2009 363 363 363 363 363 363 363 363 363 363 363 363 363 363 2010 375 375 375 375 375 375 375 375 375 375 375 375 375 375 Cottage cheese 2006 60 60 60 60 60 55 60 60 60 60 55 50 50 58 2007 53 48 62 59 53 67 56 62 50 50 48 55 2008 81 85 98 82 63 94 77 76 88 54 54 78 2009 101 90 91 99 102 90 75 123 122 84 80 75 75 93 2010 100 91 92 99 97 97 83 118 121 94 85 80 82 96 Processed cheese (8 pieces) 2006 35 35 35 35 35 35 35 35 35 35 35 35 35 35 2007 35 35 35 35 35 35 35 35 35 35 34 31 35 35 2008 37 37 37 37 37 37 37 37 37 37 37 37 37 37 2009 35 35 35 35 35 35 35 35 35 35 35 35 35 35 2010 35 35 35 35 35 35 35 35 35 35 35 35 35 35 Processed cheese (350 g) 2006 75 75 75 75 75 75 75 75 75 75 75 75 75 75 2007 73 75 75 73 75 73 75 69 75 71 75 75 75 74 2008 75 75 75 75 75 75 75 75 75 75 75 75 75 75 2009 66 66 66 66 66 66 66 66 66 66 66 66 66 66 2010 66 66 66 66 66 66 66 66 66 66 66 66 66 66 Olive oil 2006 240 240 240 240 240 240 220 230 235 236 240 245 240 238 2007 205 186 212 205 195 192 182 183 204 185 185 191 204 195 2008 220 212 228 241 215 206 200 200 215 212 210 227 225 218 2009 223 238 245 236 216 224 205 214 221 224 221 230 225 226 2010 214 224 224 223 198 216 199 217 208 222 210 226 232 217 Cotton seeds oil 2006 55 50 50 55 55 55 55 55 55 55 52 52 55 54 2007 72 68 69 65 63 60 65 67 58 64 58 54 58 63

State of Food and Agriculture in Syria 2010
318
2008 103 92 81 103 95 85 100 96 97 93 91 85 80 93 2009 75 73 70 74 72 72 72 74 74 72 70 70 70 72 2010 62 62 64 62 62 62 62 62 62 62 62 62 62 63 Imported corn oil 2006 101 100 100 106 105 102 105 100 102 100 100 100 100 102 2007 104 102 103 110 114 107 102 102 103 102 106 109 103 106 2008 163 161 164 164 161 162 164 162 161 163 163 162 162 162 Imported corn oil (continued) 2009 137 137 137 137 137 137 137 137 137 137 137 137 137 137 2010 137 137 137 137 137 137 137 137 137 137 137 137 137 137 Local corn oil 2006 85 85 85 89 85 81 85 82 92 78 85 85 85 85 2007 99 102 98 99 98 91 100 95 101 95 99 104 94 98 2008 140 146 140 143 145 147 138 143 148 139 144 144 144 143 2009 115 115 115 115 115 115 115 115 115 115 115 115 115 115 2010 125 125 125 125 125 125 125 125 125 125 125 125 125 125 Local sunflower oil 2006 75 75 75 76 76 75 76 76 74 73 75 75 75 75 2007 78 79 87 80 84 75 79 78 78 79 80 85 78 80 2008 125 132 133 128 129 127 125 128 128 125 128 128 125 128 2009 95 95 95 95 95 95 95 95 95 95 95 95 95 95 2010 95 95 95 95 95 95 95 95 95 95 95 95 95 95 Vegetal ghee 2006 99 99 99 98 98 99 98 99 99 98 97 99 99 99 2007 104 106 104 103 105 100 101 103 101 101 102 101 103 103 2008 143 139 137 131 132 130 132 136 137 130 133 138 131 134 2009 132 132 132 131 132 131 131 132 132 131 132 131 132 132 2010 134 134 135 134 134 134 134 134 134 134 134 134 134 134 Animal ghee 2006 456 465 459 485 479 448 474 475 479 479 464 474 478 471 2007 530 570 531 557 569 527 517 554 532 551 512 565 544 544 2008 759 805 783 804 788 760 771 767 785 783 771 814 793 785 2009 466 493 464 457 423 415 440 418 430 440 467 442 440 447 2010 513 533 469 494 449 417 486 461 466 503 506 465 446 479 Animal butter (225g) 2006 65 65 65 65 65 65 65 65 65 65 65 65 65 65

State of Food and Agriculture in Syria 2010
319
2007 62 62 64 64 62 65 62 65 64 63 63 61 62 63 2008 83 83 83 83 83 83 83 83 83 83 83 83 83 83 2009 72 72 72 72 72 72 72 72 72 72 72 72 72 72 2010 80 80 80 80 80 80 80 80 80 80 80 80 80 80 Supported normal bread 2006 9 9 9 9 9 9 9 9 9 9 9 9 9 9 2007 9 9 9 9 9 9 9 9 9 9 9 9 9 9 2008 9 9 9 9 9 9 9 9 9 9 9 9 9 9 2009 9 9 9 9 9 9 9 9 9 9 9 9 9 9 2010 9 9 9 9 9 9 9 9 9 9 9 9 9 9 High quality bread 2006 25 25 25 25 26 24 24 25 25 25 24 24 25 25 2007 26 26 26 26 25 25 25 25 25 26 25 26 26 26 2008 39 37 39 38 38 37 36 35 37 39 35 35 36 37 2009 36 36 36 36 38 37 38 36 34 38 36 37 36 37 2010 38 37 38 37 39 38 37 37 37 38 40 40 38 38 Bulgur 2006 27 27 28 28 27 27 27 28 28 27 26 26 26 27 2007 29 28 28 30 31 27 29 30 29 28 28 28 29 29 2008 46 46 45 47 47 46 46 46 47 45 46 45 47 46 2009 40 40 40 40 40 40 40 40 40 40 40 40 40 40 2010 45 45 45 45 45 45 45 45 45 45 45 45 45 45 Wheat flour 2006 26 26 26 26 25 25 26 26 23 25 25 25 23 25 2007 27 28 28 29 29 27 27 28 27 25 24 26 25 27 2008 42 40 41 38 42 39 39 40 41 37 36 40 36 39 2009 35 35 35 35 35 35 35 35 35 35 35 35 35 35 2010 36 36 36 36 36 36 36 36 36 36 36 36 36 36 Freekeh (crushed wheat processed) 2006 100 100 100 100 100 100 100 100 100 100 100 100 100 100 2007 96 99 104 103 100 96 92 95 100 94 94 94 95 98 2008 138 139 135 137 135 140 134 135 134 136 137 136 135 136 2009 120 100 111 116 106 117 104 100 103 111 108 104 101 108 2010 122 106 102 113 107 116 114 109 113 115 106 114 108 112 Macaroni 2006 49 49 49 49 49 49 49 49 49 49 49 49 49 49

State of Food and Agriculture in Syria 2010
320
2007 53 53 54 56 55 54 57 54 52 53 52 55 55 54 2008 57 57 57 57 57 57 57 57 57 57 57 57 57 57 Macaroni (continued) 2009 72 72 72 72 72 72 72 72 72 72 72 72 72 72 2010 71 71 71 71 71 71 71 71 71 71 71 71 71 71 Noodles 2006 40 40 40 40 40 40 40 40 40 40 40 40 40 40 2007 42 41 44 45 47 43 42 45 42 47 45 43 42 44 2008 64 62 63 64 61 61 62 64 63 63 65 63 63 63 2009 57 58 58 57 58 56 57 58 56 57 58 57 58 57 2010 53 55 53 56 54 54 55 55 54 55 56 56 55 55 Cake 2006 60 58 60 58 57 60 60 60 60 57 54 53 55 58 2007 61 66 65 64 64 65 65 65 61 59 60 69 64 63 2008 90 90 94 89 83 86 78 79 81 92 78 84 76 85 2009 93 82 90 93 86 80 89 84 80 84 82 90 80 86 2010 100 82 91 96 102 89 94 81 80 89 81 90 85 90 Semolina 2006 25 25 25 26 25 25 25 26 25 25 25 25 25 25 2007 30 26 30 29 29 25 25 29 25 25 25 29 25 27 2008 45 42 44 46 44 42 42 43 43 42 42 45 44 44 2009 45 44 45 45 45 44 44 45 46 44 44 45 45 45 2010 52 52 52 52 52 52 52 52 52 52 52 52 52 52 Wheat starch 2006 53 53 53 55 55 53 53 53 53 53 53 50 50 53 2007 54 55 55 55 54 52 53 53 53 52 55 53 55 54 2008 71 66 72 61 61 65 57 70 65 58 66 65 61 64 2009 53 50 55 54 52 52 47 51 48 45 49 50 51 51 2010 50 46 56 53 50 50 43 46 47 41 43 50 50 48 Canned haricot beans (370 g) 2006 40 40 40 40 40 40 40 40 40 40 40 40 40 40 2007 35 37 40 36 37 37 35 37 37 35 37 37 37 36 2008 38 38 38 38 38 38 38 38 38 38 38 38 38 38 2009 50 50 50 50 50 50 50 50 50 50 50 50 50 50 2010 58 53 56 53 53 54 49 57 59 52 56 57 52 54

State of Food and Agriculture in Syria 2010
321
Table A5.14. Continued Item Sweida Dar’a Quneitra Damascus Homs Hama Idleb Tartous Lattakia Aleppo Raqqa Dair-Ezzor Hassake Mean Canned chickpeas (370 g) 2006 40 40 40 40 40 40 40 40 40 40 40 40 40 40 2007 40 40 40 40 38 38 38 40 40 40 40 40 40 39 2008 45 44 44 44 45 44 44 44 44 44 44 44 44 44 2009 45 45 45 45 45 45 45 45 45 45 45 45 45 45 2010 49 50 51 50 48 48 49 51 52 49 52 51 50 50 Canned peas (450 g) 2006 60 60 75 75 75 60 60 61 60 60 60 60 60 65 2007 67 62 57 72 67 67 59 67 75 67 67 68 67 66 2008 75 75 75 75 75 76 75 75 75 75 75 75 75 75 2009 95 95 95 95 95 95 95 95 95 95 95 95 95 95 2010 90 93 97 95 97 99 96 104 101 85 85 99 104 96 Canned mushroom (380 g) 2006 50 50 54 50 63 50 50 50 50 50 50 50 50 51 2007 59 54 70 52 51 55 54 51 60 59 67 54 55 56 2008 68 68 68 68 68 68 68 68 68 68 68 68 68 68 2009 60 60 60 60 60 60 60 60 60 60 60 60 60 60 2010 68 70 75 74 76 75 70 77 75 68 69 71 72 72 Tomato paste (450 g) 2006 53 38 38 38 38 53 54 53 54 53 53 53 53 48 2007 52 56 47 47 46 53 47 49 47 42 47 42 45 48 2008 56 56 57 56 56 57 56 70 56 56 58 57 55 56 2009 65 65 65 65 65 65 65 65 65 65 65 65 65 65 2010 49 49 50 52 48 49 52 50 54 48 49 49 49 50 Pickled olives 2006 74 76 78 85 77 77 74 73 75 75 72 73 74 76 2007 90 88 87 90 88 82 85 85 89 88 76 88 77 86 2008 101 89 107 92 89 96 87 108 95 98 82 91 84 93 2009 117 99 108 97 97 96 120 111 117 105 99 95 105 104

State of Food and Agriculture in Syria 2010
322
Annex Six
Food Security

State of Food and Agriculture in Syria 2010
323
Annex six. Food security Table A6.1. Total availabilities by the major groups of agricultural products, 1999-2008 (000 tonnes)
Item Average 1 1999-2001
2002 2003 2004 2005 Average 2 2003-2005
2006 2007 2008 Average 3 2006-2008
ACH % 3/1
AAGR % 3/1
Food cereals
Production 3,514 4,775 4,913 4,537 4,669 4,706 4,932 4,041 2,139 3,704 5.4 1.1 Import 206 255 458 381 454 431 416 367 531 438 112.6 16.3 Export 49 626 668 700 753 707 92 1,002 382 492 904.1 58.6
Availability 3,671 4,404 4,703 4,218 4,370 4,430 5,256 3,406 2,289 3,650 -0.6 -0.1
Food legumes
Production 170 257 293 213 261 255 296 191 106 198 16.4 3.1 Import 5 10 7 15 10 11 11 19 41 24 397.9 37.9 Export 46 43 82 101 105 96 122 79 48 83 82.5 12.8
Availability 129 225 218 127 166 170 185 131 99 138 7.3 1.4
Vegetables
Production 1,970 2,666 2,783 3,086 2,987 2,952 2,919 3,146 2,876 2,980 51.3 8.6 Import 14 68 80 129 151 120 59 187 577 274 1857.1 81.3 Export 246 281 286 344 423 351 313 816 760 630 156.1 20.7
Availability 1,739 2,453 2,577 2,871 2,715 2,721 2,665 2,516 2,692 2,624 50.9 8.6
Fruits
Production 2,525 2,803 2,403 2,931 2,641 2,658 3,421 2,604 3,067 3,031 20.0 3.7 Import 3 9 15 19 21 18 25 27 689 247 8133.3 141.6 Export 140 123 101 90 177 123 334 279 207 273 95.0 14.3
Availability 2,388 2,689 2,317 2,860 2,485 2,554 3,111 2,352 3,549 3,004 25.8 4.7
Meat
Production 350 313 384 405 423 404 447 472 453 457 30.6 5.5 Import 5 13 19 19 16 18 19 24 25 23 360.0 35.7 Export 8 63 30 45 54 43 0 2 86 29 262.5 29.4
Availability 347 263 373 380 384 379 466 494 392 451 30.0 5.4
Eggs (million)
Production 2,565 3,321 3,449 4,002 3,104 3,518 3,781 3,428 3,028 3,412 33.0 5.9 Import 0 0 0 0 0 0 0 1 0 0 Export 25 10 107 48 20 58 30 0 0 10 -60.0 -16.7
Availability 2,541 3,311 3,342 3,954 3,084 3,460 3,751 3,429 3,028 3,403 33.9 6.0
Fresh milk
Production 1,636 1,765 1,878 2,129 2,357 2,121 2,535 2,680 2,425 2,547 55.7 9.3 Import 3 0 0 0 0 0 0 0 0 0 Export 4 14 0 0 0 0 6 0 0 2 -50.0 -12.9
Availability 1,635 1,751 1,878 2,129 2,357 2,121 2,529 2,680 2,425 2,545 55.6 9.3 Total milk Availability 1,751 1,878 2,129 2,357 2,122 2,540 2,665 2,558 2,588
Source: Elaborated from the MAAR, the AASA, various issues and NAPC database. Food cereals include only wheat and rice.

State of Food and Agriculture in Syria 2010
324
Table A6.2. Total availabilities by products, 1999-2008 (000 tonnes)
Item Average
1999-2001 2002 2003 2004 2005 2006 2007 2008
Average 2006-2008
Wheat
Production 3,514.0 4,775.0 4,913.0 4,537.0 4,668.7 4,932.0 4,041.0 2,139.3 3,704.1 Import 14.0 74.0 265.0 143.0 188.4 154.5 44.6 302.0 167.0 Export 49.0 626.0 668.0 700.0 752.7 92.0 1,002.0 381.6 491.9
Availability 3,478.0 4,223.0 4,510.0 3,980.0 4,104.4 4,994.5 3,083.6 2,059.8 3,379.3
Rice
Production 0.0 0.0 0.0 0.0 0.0 0.0 0.0 0.0 0.0 Import 193.0 180.7 193.2 237.9 265.1 261.1 322.5 229.2 270.9 Export 0.0 0.0 0.0 0.0 0.0 0.0 0.0 0.0 0.0
Availability 193.0 180.7 193.2 237.9 265.1 261.1 322.5 229.2 270.9
Food cereals
Production 3,514.0 4,775.0 4,913.0 4,537.0 4,668.7 4,932.0 4,041.0 2,139.3 3,704.1 Import 206.0 254.7 458.2 380.9 453.5 415.6 367.1 531.2 438.0 Export 49.0 626.0 668.0 700.0 752.8 92.0 1,002.0 381.6 491.9
Availability 3,671.0 4,403.7 4,703.2 4,217.9 4,369.5 5,255.6 3,406.1 2,288.9 3,650.2
Barley
Production 864.0 920.0 1,079.0 527.0 767.4 1,202.0 784.5 261.1 749.2 Import 506.0 368.0 601.0 625.0 802.5 415.0 91.0 1,201.0 569.0 Export 0.0 89.0 546.0 194.0 1.9 0.4 0.0 0.0 0.1
Availability 1,370.0 1,199.0 1,134.0 958.0 1,568.0 1,616.6 875.5 1,462.1 1,318.1
Maize
Production 196.0 232.0 226.7 210.0 187.2 159.0 177.0 281.3 205.8 Import 627.0 899.0 914.2 856.0 1,473.7 1,346.0 1,406.0 1,009.2 1,253.7 Export 0.0 0.0 0.0 0.0 0.0 0.2 2.0 19.5 7.2
Availability 822.0 1,131.0 1,140.9 1,066.0 1,661.0 1,504.8 1,581.0 1,271.0 1,452.3
Sorghum
Production 3.0 3.0 4.2 3.0 4.0 4.0 4.1 1.5 3.2 Import 0.0 0.0 0.0 0.0 0.0 19.0 0.0 0.1 6.4 Export 0.0 0.0 0.0 0.0 0.0 0.0 0.0 0.4 0.1
Availability 3.0 3.0 4.2 3.0 4.0 23.0 4.1 1.2 9.4
Oat
Production 0.0 0.0 0.0 0.1 0.0 0.0 0.0 0.0 0.0 Import 0.0 0.0 0.0 0.0 0.0 0.0 0.0 0.0 0.0 Export 0.0 0.0 0.0 0.0 0.0 0.0 0.0 0.0 0.0
Availability 0.0 0.0 0.0 0.1 0.0 0.0 0.0 0.0 0.0
Feed cereals
Production 1,063.0 1,155.0 1,309.9 740.1 958.6 1,365.0 965.6 543.9 958.2 Import 1,132.0 1,267.0 1,515.2 1,481.0 2,276.3 1,780.0 1,497.0 2,210.3 1,829.1 Export 0.0 89.0 546.0 194.0 1.9 0.6 2.0 19.9 7.5
Availability 2,195.0 2,333.0 2,279.1 2,027.1 3,233.0 3,144.4 2,460.6 2,734.3 2,779.8

State of Food and Agriculture in Syria 2010
325
Table A6.2. Continued
Item Average
1999-2001 2002 2003 2004 2005 2006 2007 2008
Average 2006-2008
Total cereals
Production 4,577.0 5,930.0 6,222.9 5,277.1 5,627.4 6,297.0 5,006.6 2,683.2 4,662.3 Import 1,339.0 1,521.7 1,973.4 1,861.9 2,729.8 2,195.6 1,864.1 2,741.5 2,267.1 Export 49.0 715.0 1,214.0 894.0 754.7 92.6 1,004.0 401.5 499.4
Availability 5,866.0 6,736.7 6,982.3 6,245.0 7,602.5 8,400.1 5,866.7 5,023.2 6,430.0
Lentils
Production 98.0 133.0 168.0 125.3 153.7 181.0 109.0 34.1 108.0 Import 0.0 2.0 0.9 0.3 0.3 3.0 0.0 3.1 2.0 Export 29.0 38.0 70.0 71.4 74.8 80.0 75.4 44.1 66.5
Availability 69.0 97.0 98.9 54.2 79.2 104.0 33.6 -6.8 43.6
Chickpeas
Production 51.0 89.0 87.0 45.0 65.2 52.0 50.0 27.1 43.0 Import 2.0 8.0 5.6 8.0 0.2 0.0 7.0 5.4 4.1 Export 8.0 0.5 8.3 29.0 18.2 2.0 1.0 0.3 1.1
Availability 45.0 96.5 84.3 24.0 47.3 50.0 56.0 32.2 46.1
Dry broad beans
Production 18.0 31.0 32.0 36.0 34.0 30.6 24.9 38.1 31.2 Import 1.0 0.0 0.0 1.0 9.3 0.8 1.5 0.8 1.0 Export 8.0 4.0 0.3 0.1 10.7 16.1 0.9 2.0 6.3
Availability 11.0 27.0 31.7 37.0 32.6 15.3 25.5 36.8 25.9
Dry haricot and kidney beans
Production 2.0 2.0 3.3 3.6 2.6 2.0 1.3 0.9 1.4 Import 1.0 0.0 0.0 0.0 0.0 6.5 10.7 31.3 16.2 Export 1.0 0.0 3.0 0.1 1.6 7.8 2.0 1.6 3.8
Availability 2.0 2.0 0.3 3.5 1.0 0.7 10.0 30.6 13.8
Dry peas
Production 1.0 2.0 2.2 3.0 5.3 30.6 5.8 5.7 14.0 Import 1.0 0.0 0.1 5.7 0.2 0.8 0.1 0.6 0.5 Export 0.0 0.0 0.0 0.7 0.0 16.1 0.0 0.4 5.5
Availability 1.0 2.0 2.3 8.0 5.5 15.3 5.9 5.9 9.0
Food legumes
Production 170.0 257.0 292.5 212.9 260.8 296.2 191.0 105.9 197.7 Import 5.0 10.0 6.6 15.0 10.1 11.1 19.3 41.2 23.9 Export 46.0 42.5 81.6 101.3 105.3 122.0 79.3 48.4 83.2
Availability 129.0 224.5 217.5 126.6 165.6 185.3 131.0 98.7 138.3
Bitter vetch
Production 4.0 5.3 7.3 6.5 2.9 3.4 3.0 1.5 2.6 Import 0.0 0.0 0.0 0.0 0.0 0.0 0.0 0.0 0.0 Export 0.0 0.0 0.0 0.0 0.0 0.0 0.0 0.0 0.0
Availability 4.0 5.3 7.3 6.5 2.9 3.4 3.0 1.5 2.6

State of Food and Agriculture in Syria 2010
326
Table A6.2. Continued
Item Average
1999-2001 2002 2003 2004 2005 2006 2007 2008
Average 2006-2008
Flowering sern
Production 11.0 14.5 5.0 6.2 9.9 14.5 14.2 3.2 10.6 Import 0.0 0.0 0.0 0.0 0.0 0.0 0.0 0.0 0.0 Export 0.0 0.0 0.0 0.0 0.0 0.0 0.0 0.0 0.0
Availability 11.0 14.5 5.0 6.2 9.9 14.5 14.2 3.2 10.6
Rambling vetch
Production 8.0 12.5 16.4 12.2 12.4 13.2 7.4 5.4 8.7 Import 0.0 0.0 0.0 0.0 0.0 0.0 0.0 0.0 0.0 Export 0.0 0.0 0.0 0.0 0.0 0.0 0.0 0.0 0.0
Availability 8.0 12.5 16.4 12.2 12.4 13.2 7.4 5.4 8.7
Feed legumes
Production 22.0 32.2 28.7 24.9 25.3 31.1 24.6 10.0 21.9 Import 0.0 0.0 0.0 0.0 0.0 0.0 0.0 0.0 0.0 Export 0.0 0.0 0.0 0.0 0.0 0.0 0.0 0.0 0.0
Availability 22.0 32.2 28.7 24.9 25.3 31.1 24.6 10.0 21.9
Total legumes
Production 192.0 289.2 321.3 237.8 286.0 327.3 215.6 115.9 219.6 Import 5.0 10.0 6.6 15.0 10.1 11.1 19.3 41.2 23.9 Export 46.0 42.5 81.6 101.3 105.3 122.0 79.3 48.4 83.2
Availability 151.0 256.7 246.2 151.5 190.9 216.4 155.6 108.7 160.2
Grazing barley
Production 395.0 416.0 481.7 599.8 470.2 554.1 703.9 554.6 604.2 Import 0.0 0.0 0.0 0.0 0.0 0.0 0.0 0.0 0.0 Export 0.0 0.0 0.0 0.0 0.0 0.0 0.0 0.0 0.0
Availability 395.0 416.0 481.7 599.8 470.2 554.1 703.9 554.6 604.2
Grazing flowering sern
Production 152.0 89.7 57.1 78.9 180.9 86.1 88.4 55.7 76.7 Import 0.0 0.0 0.0 0.0 0.0 0.0 0.0 0.0 0.0 Export 0.0 0.0 0.0 0.0 0.0 0.0 0.0 0.0 0.0
Availability 152.0 89.7 57.1 78.9 180.9 86.1 88.4 55.7 76.7
Grazing maize
Production 46.0 45.3 23.9 51.0 95.1 153.8 154.8 73.7 127.4 Import 0.0 0.0 0.0 0.0 0.0 0.0 0.0 0.0 0.0 Export 0.0 0.0 0.0 0.0 0.0 0.0 0.0 0.0 0.0
Availability 46.0 45.3 23.9 51.0 95.1 153.8 154.8 73.7 127.4
Grazing alfalfa
Production 91.0 76.9 91.1 67.6 62.9 82.7 81.6 77.3 80.5 Import 0.0 0.0 0.0 0.0 0.0 0.0 0.0 0.0 0.0 Export 0.0 0.0 0.0 0.0 0.0 0.0 0.0 0.0 0.0
Availability 91.0 76.9 91.1 67.6 62.9 82.7 81.6 77.3 80.5

State of Food and Agriculture in Syria 2010
327
Table A6.2. Continued
Item Average
1999-2001 2002 2003 2004 2005 2006 2007 2008
Average 2006-2008
Grazing clover
Production 5.0 4.6 9.1 6.4 11.0 6.9 9.6 4.9 7.1 Import 0.0 0.0 0.0 0.0 0.0 0.0 0.0 0.0 0.0 Export 0.0 0.0 0.0 0.0 0.0 0.0 0.0 0.0 0.0
Availability 5.0 4.6 9.1 6.4 11.0 6.9 9.6 4.9 7.1
Other grazing crops
Production 39.0 25.6 16.9 18.7 15.9 27.2 28.5 11.6 22.4 Import 0.0 0.0 0.0 0.0 0.0 0.0 0.0 0.0 0.0 Export 0.0 0.0 0.0 0.0 0.0 0.0 0.0 0.0 0.0
Availability 39.0 25.6 16.9 18.7 15.9 27.2 28.5 11.6 22.4
Green fodder
Production 728.0 658.2 679.8 822.5 836.0 910.9 1,066.8 777.8 918.5 Import 0.0 0.0 0.0 0.0 0.0 0.0 0.0 0.0 0.0 Export 0.0 0.0 0.0 0.0 0.0 0.0 0.0 0.0 0.0
Availability 728.0 658.2 679.8 822.5 836.0 910.9 1,066.8 777.8 918.5
Sugar beet
Production 1,240.0 1,523.0 1,205.0 1,217.7 1,096.3 1,438.0 1,366.5 1,366.5 1,390.3 Import 0.0 0.0 0.0 0.0 0.0 0.0 0.0 0.0 0.0 Export 0.0 0.0 0.0 0.0 1.2 0.6 0.0 0.0 0.2
Availability 1,240.0 1,523.0 1,205.0 1,217.7 1,095.1 1,437.4 1,366.5 1,366.5 1,390.1
Cotton fiber
Production 352.0 281.0 283.8 360.0 357.6 240.0 249.0 244.2 244.4 Import 0.0 0.0 0.0 0.0 0.0 0.0 0.0 0.1 0.0 Export 174.0 255.0 127.6 114.0 156.3 75.0 44.0 31.9 50.3
Availability 178.0 26.0 156.2 246.0 201.3 165.0 205.0 212.4 194.1
Peanut
Production 31.0 20.0 16.2 18.0 24.5 16.0 22.4 18.8 19.1 Import 0.0 0.0 0.0 0.0 1.9 7.0 9.0 17.1 11.0 Export 1.0 0.0 0.0 1.0 0.0 0.0 0.0 0.4 0.1
Availability 30.0 20.0 16.2 17.0 26.4 23.0 31.4 35.5 30.0
Tobacco
Production 27.0 26.0 26.2 25.9 28.9 24.8 24.1 20.1 23.0 Import 0.0 0.0 0.0 0.3 0.0 0.0 0.0 0.0 0.0 Export 1.0 1.0 0.8 1.8 1.2 1.4 0.8 0.9 1.0
Availability 25.0 25.0 25.4 24.4 27.7 23.4 23.3 19.2 22.0
Soya beans
Production 3.0 4.7 3.5 3.7 3.8 3.1 2.1 1.4 2.2 Import 63.0 101.1 156.5 139.4 214.2 251.5 291.8 500.5 347.9 Export 0.0 0.0 0.0 0.0 3.2 0.2 0.0 0.1 0.1
Availability 66.0 105.8 160.0 143.0 214.8 254.4 293.9 501.8 350.0

State of Food and Agriculture in Syria 2010
328
Table A6.2. Continued
Item Average
1999-2001 2002 2003 2004 2005 2006 2007 2008
Average 2006-2008
Oily sunflower
Production 1 1.5 2 0.9 1.2 0.7 0.8 0.4 0.6 Import 12 17.9 13.9 5.5 5.2 6 9.4 0 5.1 Export 0 0 3.5 3.5 2.3 1.5 0 0 0.5
Availability 13 19.4 12.4 2.8 4.1 5.2 10.2 0.4 5.3
Sunflower
Production 12 11 2 13 19.9 14.7 21.6 10.2 15.5 Import 12 18 13.8 5 4.6 28.5 25.3 18.3 24 Export 0 0 0 4 2.2 0.3 4.9 0 1.7
Availability 24 29 15.8 14 22.2 42.9 42 28.5 37.8
Sesame
Production 3 7 7.5 4 0.5 4 3.2 2.9 3.4 Import 29 36 28.8 42 41.1 44 52.7 43.5 46.7 Export 0 0 0 0 0.2 1 0.3 12.4 4.6
Availability 32 43 36.3 46 41.3 47 55.6 34 45.5
Aniseed
Production 1 2 2 2 2.6 3 2 2.5 2.5 Import 0 0 0 0 0 0 0 0 0 Export 1 0 4 3 6.6 0 25 7 10.7
Availability 0 2 -2 -1 -4 3 -23 -4.6 -8.2
Cumin
Production 16 97 48 22 29.8 34 19.9 10.2 21.4 Import 0 0 0 0 0 0 0.2 0 0.1 Export 15 0 32 31 38.8 0 144.8 23.7 56.2
Availability 97 16 -9 -8.9 34 -124.7 -13.4
Black cumin
Production 0 0.7 1.5 0.9 10.8 0.9 4 15 6.6 Import 0 0 0 0 0 0 0 0 0 Export 0 0 0 0 0 0 0 0 0
Availability 0 0.7 1.5 0.9 10.8 0.9 4 15 6.6
Industrial crops
Production 1,686.0 1,974.0 1,597.7 1,668.1 1,575.8 1,779.2 1,715.5 1,692.1 1,728.9 Import 116.0 173.0 213.0 192.1 266.9 337.0 388.4 579.5 435.0 Export 193.0 256.0 167.9 158.3 212.0 80.0 219.8 76.4 125.4
Availability 1,609.0 1,891.0 1,642.8 1,701.9 1,630.7 2,036.2 1,884.1 2,195.2 2,038.5
Total vegetables
Production 1,970.0 2,665.6 2,783.3 3,085.7 2,986.7 2,918.9 3,145.9 2,875.6 2,980.1 Import 14.0 67.7 79.9 129.2 151.2 58.8 186.7 576.6 274.0 Export 246.0 280.8 285.8 343.7 423.2 313.1 816.4 759.8 629.8
Availability 1,739.0 2,452.5 2,577.4 2,871.2 2,714.7 2,664.6 2,516.2 2,692.4 2,624.4

State of Food and Agriculture in Syria 2010
329
Table A6.2. Continued
Item Average
1999-2001 2002 2003 2004 2005 2006 2007 2008
Average 2006-2008
Green broad beans
Production 37 53 44.8 39.3 44.1 50.9 43 50.3 48.1 Import 0 0 0 0 0 0 0 0 0 Export 2 2 2 2.5 1.5 0.6 12 0 4.2
Availability 35 51 42.8 36.8 42.6 50.3 31 50.3 43.9
Green haricot and kidney beans
Production 22 41 24.7 33.8 48.9 39 36.4 36.2 37.2 Import 0 0 0 0 0 0 0 0.3 0.1 Export 3 3 2.2 1.8 2 3 1 0 1.3
Availability 19 38 22.5 32 46.8 36 35.4 36.4 35.9
Cabbage and cauliflower
Production 86 86 70.2 72.2 85.1 73 71.3 64.8 69.7 Import 0 0 0 0 0 0 0 0.4 0.1 Export 6 10 11.5 11.4 10.9 66 63 53.3 60.8
Availability 80 76 58.7 60.8 74.2 7 8.3 11.9 9.1
Garlic
Production 22 27 41.5 36.9 46.6 40 29.6 32.4 34 Import 0 8 2.2 4.8 2.2 1.8 7.3 128.3 45.8 Export 1 0.1 0.2 0.3 0.2 1.1 1.6 0 0.9
Availability 21 34.9 43.5 41.4 48.5 40.7 35.3 160.7 78.9
Green peas
Production 16 24 18.3 24 23.1 17.4 23.7 20.2 20.4 Import 0 0 0 0 0 0 0.4 0.1 0.2 Export 1 2 2.3 2 3.2 7.4 2.8 0.3 3.5
Availability 14 22 16 22 19.9 10 21.3 19.9 17.1
Dry onion
Production 82 97 94.7 117 125.1 103 98.5 94.2 98.6 Import 4 14 8 16 6 4 25 50.5 26.5 Export 3 3 1.3 7 21 30 11 8.7 16.6
Availability 83 108 101.4 126 110 77 112.5 136 108.5
Cucumber, snake cucumber, squash and pumpkin
Production 182 235 244 274.2 287.3 236 267.6 275.2 259.6 Import 0 6 2.2 10.7 11.7 16 14 24.2 18.1 Export 3 0 1.5 7.4 12.3 23 61 6.2 30.1
Availability 179 241 244.7 277.5 286.7 229 220.6 293.1 247.6
Water melon
Production 230 480 674.1 812 588.3 562 606.7 366.7 511.8 Import 1 4 3.9 7 3.8 5 3 4.2 4.1 Export 9 11 9.5 9 8.6 81 74 27.8 60.9
Availability 221 473 668.5 810 583.5 486 535.7 343.1 454.9

State of Food and Agriculture in Syria 2010
330
able A6.2. Continued
Item Average
1999-2001 2002 2003 2004 2005 2006 2007 2008
Average 2006-2008
Musk melon
Production 56 100 116.1 102 95.3 98 158.8 61 105.9 Import 0 0 0 0 0 0 0 0 0 Export 17 17 15.7 17 15.8 26 34 0.4 20.1
Availability 39 83 100.4 85 79.5 72 124.8 60.6 85.8
Potato
Production 411.0 513.0 486.6 452.0 608.5 603.0 570.1 720.5 631.2 Import 6.0 16.0 36.8 22.0 44.2 19.0 25.0 84.8 42.9 Export 31.0 17.0 16.9 17.0 23.9 53.0 35.0 43.4 43.8
Availability 385.0 512.0 506.5 457.0 628.8 569.0 560.1 762.0 630.4
Tomato
Production 712.0 900.0 945.8 965.4 957.3 1,036.0 1,232.5 1,163.3 1,143.9 Import 1.0 14.0 5.1 14.7 73.7 0.0 89.0 218.5 102.5 Export 167.0 210.0 217.9 260.3 321.7 0.0 503.0 188.4 230.5
Availability 546.0 704.0 733.0 719.8 709.3 1,036.0 818.5 1,193.3 1,015.9
Eggplant
Production 116.0 133.0 137.7 158.0 154.4 159.0 153.1 165.2 159.1 Import 2.0 5.7 21.7 54.0 9.7 13.0 23.0 49.3 28.4 Export 2.0 5.7 4.8 8.0 2.1 22.0 18.0 5.0 15.0
Availability 117.0 133.0 154.6 204.0 162.0 150.0 158.1 209.6 172.6
Lettuce
Production 46.0 53.7 57.4 56.9 51.8 55.6 62.2 52.4 56.7 Import 0.0 0.0 0.0 0.0 0.0 0.0 0.0 0.0 0.0 Export 0.0 0.0 0.0 0.0 0.0 0.0 0.0 15.9 5.3
Availability 46.0 53.7 57.4 56.9 51.8 55.6 62.2 36.5 51.4
Leaf beet
Production 14.0 20.0 15.1 13.9 9.4 10.7 13.2 12.7 12.2 Import 0.0 0.0 0.0 0.0 0.0 0.0 0.0 0.0 0.0 Export 0.0 0.0 0.0 0.0 0.0 0.0 0.0 0.0 0.0
Availability 14.0 20.0 15.1 13.9 9.4 10.7 13.2 12.7 12.2
Okra
Production 12.0 12.2 20.2 21.6 16.2 22.0 15.3 20.1 19.1 Import 0.0 0.0 0.0 0.0 0.0 0.0 0.0 0.0 0.0 Export 0.0 0.0 0.0 0.0 0.0 0.0 0.0 0.0 0.0
Availability 12.0 12.2 20.2 21.6 16.2 22.0 15.3 20.1 19.1
Green pepper
Production 41.0 40.5 48.9 50.2 60.6 60.1 78.8 67.2 68.7 Import 0.0 0.0 0.0 0.0 0.0 0.0 0.0 0.8 0.3 Export 0.0 0.0 0.0 0.0 0.0 0.0 0.0 0.5 0.2
Availability 41.0 40.5 48.9 50.2 60.6 60.1 78.8 67.5 68.8

State of Food and Agriculture in Syria 2010
331
Table A6.2. Continued
Item Average
1999-2001 2002 2003 2004 2005 2006 2007 2008
Average 2006-2008
Total fruits
Production 2,525.0 2,803.3 2,403.0 2,930.9 2,640.7 3,420.6 2,604.1 3,066.8 3,030.5 Import 3.0 9.0 14.9 19.1 21.2 24.9 26.9 689.4 247.1 Export 140.0 122.8 101.2 89.9 176.7 334.4 279.0 206.9 273.4
Availability 2,388.0 2,689.5 2,316.7 2,860.0 2,485.2 3,111.1 2,352.0 3,549.4 3,004.2
Olives
Production 588.0 941.0 552.2 1,027.0 612.2 1,191.0 495.3 827.0 837.8 Import 0.0 0.0 0.0 0.0 0.0 0.0 0.0 0.0 0.0 Export 0.0 0.0 0.6 0.5 5.0 15.0 16.0 6.6 12.5
Availability 588.0 941.0 551.6 1,026.5 607.2 1,176.0 479.3 820.4 825.2
Grapes
Production 395.0 342.0 307.3 243.0 306.3 337.0 273.0 280.9 297.0 Import 0.0 0.0 2.9 0.5 0.8 0.2 0.3 1.2 0.6 Export 30.0 25.0 13.0 9.0 13.0 66.0 25.0 3.2 31.4
Availability 365.0 317.0 297.2 234.5 294.1 271.2 248.3 278.9 266.1
Figs
Production 42.0 43.0 41.0 37.0 49.9 51.0 41.1 40.3 44.1 Import 0.0 0.0 0.0 0.0 0.0 0.0 0.0 0.0 0.0 Export 2.0 0.0 4.8 4.0 4.5 5.0 3.0 8.0 5.3
Availability 40.0 43.0 36.2 33.0 45.4 46.0 38.1 32.3 38.8
Apricot
Production 69.0 101.0 104.9 76.0 65.5 99.0 112.7 100.9 104.2 Import 0.0 0.0 0.0 0.0 0.0 0.0 0.0 0.0 0.0 Export 8.0 9.0 7.7 4.0 7.1 12.0 1.0 0.0 4.3
Availability 62.0 92.0 97.2 72.0 58.4 87.0 111.7 100.9 99.9
Apples
Production 278.0 216.0 306.7 358.0 296.0 374.0 280.2 360.7 338.3 Import 0.0 0.0 0.0 0.0 0.0 0.0 0.0 4.9 1.6 Export 19.0 16.0 13.9 28.0 68.5 131.0 125.0 67.5 107.8
Availability 259.0 200.0 292.8 330.0 227.5 243.0 155.2 298.1 232.1
Pears
Production 28.0 20.0 20.3 21.0 19.8 22.0 24.7 24.6 23.8 Import 0.0 0.0 0.0 0.0 0.0 0.0 0.0 0.0 0.0 Export 13.0 10.0 6.0 5.0 9.3 1.0 16.0 0.0 5.7
Availability 15.0 10.0 14.3 16.0 10.4 21.0 8.7 24.6 18.1
Plums and green plums
Production 39.0 37.0 30.9 33.0 34.9 42.0 46.0 47.8 45.3 Import 0.0 0.0 0.0 0.0 0.8 0.7 0.0 0.6 0.4 Export 7.0 9.0 5.3 4.0 3.3 10.0 3.0 0.7 4.6
Availability 32.0 28.0 25.6 29.0 32.4 32.7 43.0 47.7 41.1
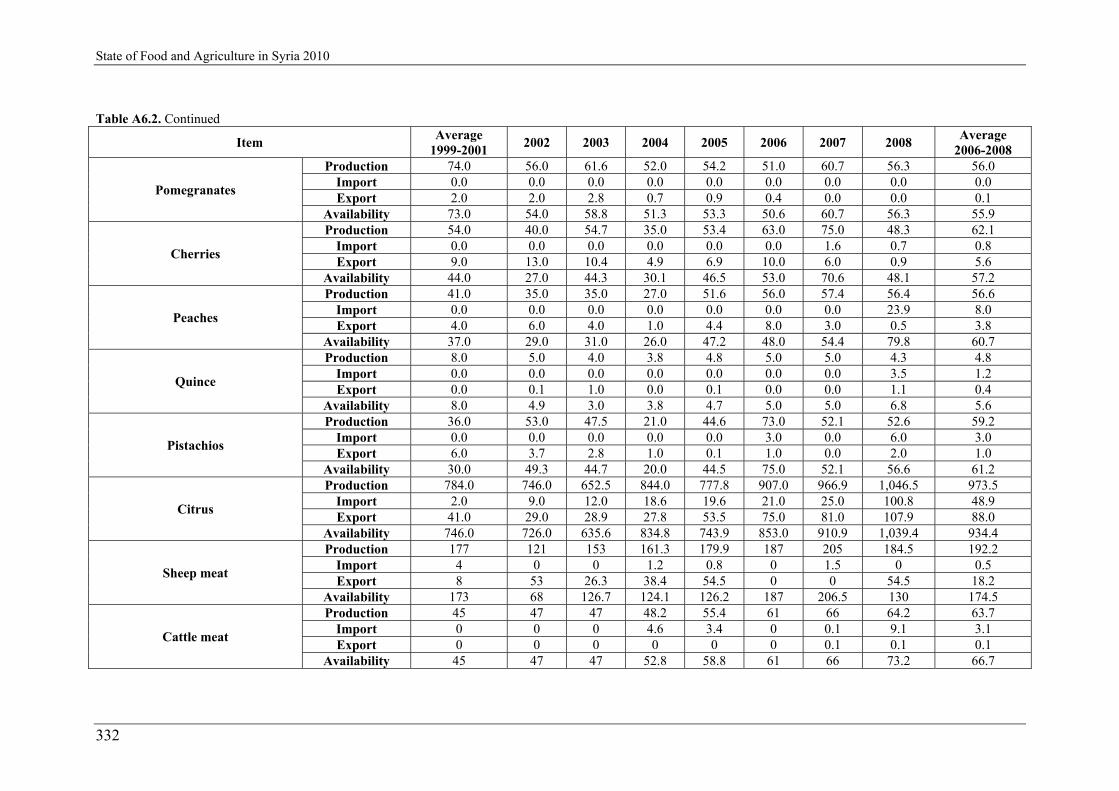
State of Food and Agriculture in Syria 2010
332
Table A6.2. Continued
Item Average
1999-2001 2002 2003 2004 2005 2006 2007 2008
Average 2006-2008
Pomegranates
Production 74.0 56.0 61.6 52.0 54.2 51.0 60.7 56.3 56.0 Import 0.0 0.0 0.0 0.0 0.0 0.0 0.0 0.0 0.0 Export 2.0 2.0 2.8 0.7 0.9 0.4 0.0 0.0 0.1
Availability 73.0 54.0 58.8 51.3 53.3 50.6 60.7 56.3 55.9
Cherries
Production 54.0 40.0 54.7 35.0 53.4 63.0 75.0 48.3 62.1 Import 0.0 0.0 0.0 0.0 0.0 0.0 1.6 0.7 0.8 Export 9.0 13.0 10.4 4.9 6.9 10.0 6.0 0.9 5.6
Availability 44.0 27.0 44.3 30.1 46.5 53.0 70.6 48.1 57.2
Peaches
Production 41.0 35.0 35.0 27.0 51.6 56.0 57.4 56.4 56.6 Import 0.0 0.0 0.0 0.0 0.0 0.0 0.0 23.9 8.0 Export 4.0 6.0 4.0 1.0 4.4 8.0 3.0 0.5 3.8
Availability 37.0 29.0 31.0 26.0 47.2 48.0 54.4 79.8 60.7
Quince
Production 8.0 5.0 4.0 3.8 4.8 5.0 5.0 4.3 4.8 Import 0.0 0.0 0.0 0.0 0.0 0.0 0.0 3.5 1.2 Export 0.0 0.1 1.0 0.0 0.1 0.0 0.0 1.1 0.4
Availability 8.0 4.9 3.0 3.8 4.7 5.0 5.0 6.8 5.6
Pistachios
Production 36.0 53.0 47.5 21.0 44.6 73.0 52.1 52.6 59.2 Import 0.0 0.0 0.0 0.0 0.0 3.0 0.0 6.0 3.0 Export 6.0 3.7 2.8 1.0 0.1 1.0 0.0 2.0 1.0
Availability 30.0 49.3 44.7 20.0 44.5 75.0 52.1 56.6 61.2
Citrus
Production 784.0 746.0 652.5 844.0 777.8 907.0 966.9 1,046.5 973.5 Import 2.0 9.0 12.0 18.6 19.6 21.0 25.0 100.8 48.9 Export 41.0 29.0 28.9 27.8 53.5 75.0 81.0 107.9 88.0
Availability 746.0 726.0 635.6 834.8 743.9 853.0 910.9 1,039.4 934.4
Sheep meat
Production 177 121 153 161.3 179.9 187 205 184.5 192.2 Import 4 0 0 1.2 0.8 0 1.5 0 0.5 Export 8 53 26.3 38.4 54.5 0 0 54.5 18.2
Availability 173 68 126.7 124.1 126.2 187 206.5 130 174.5
Cattle meat
Production 45 47 47 48.2 55.4 61 66 64.2 63.7 Import 0 0 0 4.6 3.4 0 0.1 9.1 3.1 Export 0 0 0 0 0 0 0.1 0.1 0.1
Availability 45 47 47 52.8 58.8 61 66 73.2 66.7

State of Food and Agriculture in Syria 2010
333
Table A6.2. Continued
Item Average
1999-2001 2002 2003 2004 2005 2006 2007 2008
Average 2006-2008
Goat meat
Production 5 5 6.7 6.6 7.1 7 8 8.4 7.8 Import 0 0.7 0 0 0 0 0 0 0 Export 0 5 3.9 6.4 0 0 0 5.7 1.9
Availability 5 0.7 2.8 0.2 7.1 7 8 2.8 5.9
Total red meat
Production 227 173 206.7 216.1 242.3 255 279 257.2 263.7 Import 4 0.7 6.6 5.8 4.2 0 2 9.1 3.7 Export 8 63 30.3 44.8 54.5 0 0 60.2 20.1
Availability 223 110.7 183 177.1 192 255 281 206 247.3
Fish
Production 14 15 16.1 17.2 17 17 17.9 15.6 16.8 Import 1 12 12.8 13.6 11.5 18 22 16.2 18.7 Export 0 0 0 0 0 0 0 0.1 0
Availability 15 27 28.9 30.8 28.5 35 39.9 31.7 35.5
Poultry meat
Production 109 125 160.8 171.8 163.4 175 174.9 180.4 176.8 Import 0 0 0 0 0 1 0 0 0.3 Export 0 0 0 0 0 0 1.6 25.7 9.1
Availability 109 125 160.8 171.8 163.4 176 173.4 154.6 168
White meat
Production 123.0 140.0 176.9 189.0 180.4 192.0 192.8 196.0 193.6 Import 1.0 12.0 12.8 13.6 11.5 19.0 22.0 16.2 19.1 Export 0.0 0.0 0.0 0.0 0.0 0.0 1.6 25.8 9.1
Availability 124.0 152.0 189.7 202.6 191.9 211.0 213.2 186.4 203.5
Total meat
Production 350.0 313.0 383.6 405.1 422.7 447.0 471.8 453.2 457.3 Import 5.0 12.7 19.4 19.4 15.7 19.0 24.0 25.3 22.8 Export 8.0 63.0 30.3 44.8 54.5 0.0 1.6 86.1 29.2
Availability 347.0 262.7 372.7 379.7 383.9 466.0 494.2 392.4 450.9
Eggs (million)
Production 2,565.0 3,321.0 3,449.0 4,002.0 3,104.0 3,781.0 3,428.0 3,028.0 3,412.3 Import 0.0 0.0 0.0 0.0 0.0 0.0 1.0 0.0 0.3 Export 25.0 10.0 107.0 48.0 20.4 30.0 0.0 0.0 10.0
Availability 2,541.0 3,311.0 3,342.0 3,954.0 3,083.6 3,751.0 3,429.0 3,028.0 3,402.7
Fresh milk
Production 1,636.0 1,765.4 1,878.2 2,128.7 2,357.0 2,535.0 2,680.0 2,425.0 2,546.7 Import 3.0 0.0 0.0 0.0 0.0 0.0 0.0 0.0 0.0 Export 4.0 14.0 0.0 0.0 0.3 6.0 0.0 0.0 2.0
Availability 1,635.0 1,751.4 1,878.2 2,128.7 2,356.7 2,529.0 2,680.0 2,425.0 2,544.7 Total milk Availability 1,635.0 1,751.4 1,878.2 2,129.0 2,357.3 2,539.8 2,665.4 2,558.4 2,587.9

State of Food and Agriculture in Syria 2010
334
Honey
Production 2 2 1.8 2 2.1 2.4 2.3 2.5 2.4 Import 0 0 0 0 0 0.1 0 0 0 Export 0 0 0 0 0 0 0 0 0
Availability 2 2 1.8 2 2.1 2.5 2.3 2.5 2.4
Sugar Production 148 214 123 231 148 201.3 197 236 211.4 Availability 638 805.3 736.6 895.6 743 737 1,063.2 596.8 799
Vegetal oils Production 255 309.1 215.9 304.3 242.2 377.6 216.3 290.6 294.8 Availability 259 332.4 233.6 352.4 285.5 361 271.3 383.7 338.7
Population (000 person)
16,521 17,438 17,952 18,512 19,121 19,789 20,504 21,227 20,507
Source: Elaborated from the MAAR, the AASA, various issues and NAPC database.
Table A6.3. Self-sufficiency ratios by food groups, 1999-2008 (%)
Item 1999 2000 2001 Average 1 1999-2001
2002 2003 2004 2005 Average
2003-2005 2006 2007 2008
Average 2 2006-2008
Index % 2/1
Food cereals 99.2 94.6 94.6 108.4 108.4 104.5 107.6 106.8 106.3 93.8 118.6 93.5 102.0 1.06 Food legumes 443.7 120.4 112.0 114.5 114.5 134.5 168.1 157.5 157.5 159.8 145.8 107.3 137.7 0.61 Vegetables 114.2 115.1 110.8 108.7 108.7 108.0 107.5 110.0 108.5 109.5 125.0 106.8 113.8 1.00 Fruits 107.5 104.4 105.7 104.2 104.2 103.7 102.5 106.3 104.2 109.9 110.7 86.4 102.4 0.97 Meat 98.0 103.8 100.7 119.1 119.1 102.9 106.7 110.1 106.6 95.9 95.5 115.5 102.3 1.01 Fresh milk 100.0 100.0 100.1 100.8 100.8 100.0 100.0 100.0 100.0 100.2 100.0 100.0 100.1 1.00 Eggs 100.5 101.8 100.6 100.3 100.3 103.2 101.2 100.7 101.7 100.8 100.0 100.0 100.3 0.99 Source: Elaborated by the reporter.
Table A6.4. Import dependency ratios by food groups, 1999-2008 (%)
Item 1999 2000 2001 Average 1 1999-2001
2002 2003 2004 2005 Average
2003-2005 2006 2007 2008
Average 2 2006-2008
Index % 2/1
Food cereals 4.8 5.4 6.1 5.4 5.1 8.5 7.7 8.9 8.4 7.8 8.3 19.9 12.0 2.2 Food legumes 0.8 2.0 3.8 2.2 3.7 2.2 6.6 3.7 4.2 3.6 9.2 28.0 13.6 6.2 Vegetables 0.0 0.3 1.9 0.7 2.5 2.8 4.0 4.8 3.9 2.0 5.6 16.7 8.1 11.0 Fruits 0.0 0.0 0.3 0.1 0.3 0.6 0.6 0.8 0.7 0.7 1.0 18.4 6.7 67.0 Meat 2.3 1.1 0.8 1.4 3.9 4.8 4.6 3.6 4.3 4.1 4.8 5.3 4.7 3.4 Source: Elaborated by the reporter.

State of Food and Agriculture in Syria 2010
335
Table A6.5. Distribution of domestic production by governorates, 2008 (tonne, %)
Item Wheat Food legumes Vegetables Fruits Meat Milk Eggs
tonne % tonne % tonne % tonne % tonne % tonne % 000 eggs % Sweida 750 0.04 160 0.15 34,349 1.19 89,730 2.93 5,433 1.20 43,668 1.80 68,194 2.25 Dar'a 43,097 2.01 9,050 8.54 461,842 16.06 120,796 3.94 38,803 8.56 79,427 3.28 193,641 6.40 Quneitra 11,521 0.54 1,931 1.82 82,250 2.86 15,373 0.50 3,895 0.86 28,371 1.17 15,754 0.52 Damascus 31,574 1.48 2,264 2.14 139,887 4.86 282,237 9.20 39,387 8.69 512,400 21.13 895,576 29.58 Homs 59,177 2.77 4,694 4.43 158,186 5.50 328,546 10.71 57,246 12.63 325,782 13.43 731,878 24.17 Hama 74,471 3.48 5,362 5.06 252,624 8.78 153,109 4.99 65,883 14.54 227,824 9.39 211,519 6.99 Al-Ghab 171,093 8.00 6,468 6.11 173,988 6.05 11,940 0.39 9,727 2.15 88,701 3.66 14,486 0.48 Idleb 79,496 3.72 17,961 16.96 469,031 16.31 266,496 8.69 42,932 9.47 109,345 4.51 185,601 6.13 Tartous 25,315 1.18 1,086 1.03 170,341 5.92 362,171 11.81 30,647 6.76 67,990 2.80 59,088 1.95 Lattakia 7,122 0.33 290 0.27 81,944 2.85 1,174,060 38.28 8,252 1.82 59,803 2.47 68,837 2.27 Aleppo 438,701 20.51 50,472 47.65 472,772 16.44 230,602 7.52 66,874 14.76 349,389 14.41 246,354 8.14 Raqqa 345,053 16.13 1,242 1.17 100,055 3.48 19,895 0.65 24,365 5.38 96,852 3.99 52,232 1.73 Dair-Ezzor 243,023 11.36 695 0.66 179,913 6.26 10,511 0.34 30,983 6.84 307,201 12.67 28,000 0.92 Hassake 608,920 28.46 4,245 4.01 98,450 3.42 1,383 0.05 28,732 6.34 128,290 5.29 256,725 8.48
Total 2,139,313 100.00 105,920 100.00 2,875,632 100.00 3,066,849 100.00 453,159 100.00 2,425,043 100.00 3,027,885 100.00 Source: Elaborated from MAAR, the AASA, various issues.

State of Food and Agriculture in Syria 2010
336
Table A6.6. Aggregate per capita availabilities by countries, 2003-2008 (kg/capita/year)
Item 2003 2004 2005 Average 1 2003-2005
2006 2007 2008 Average 2 2006-2008
ACH % 2/1
Food cereals Syria 230.3 190.8 212.2 211.1 243.5 249.9 161.8 218.4 3.5 Egypt 176.7 171.0 175.1 174.3 184.4 179.7 182.1 182.1 4.5 Jordan 145.0 135.3 153.5 144.6 141.6 139.9 140.7 140.7 -2.7 Kuwait 135.7 141.7 139.5 139.0 146.0 142.3 144.2 144.2 3.7 Lebanon 126.6 126.7 129.7 127.7 116.0 114.8 115.4 115.4 -9.6 Morocco 184.7 183.3 178.5 182.2 196.3 160.5 178.4 178.4 -2.1 Saudi Arabia 123.5 130.6 129.4 127.8 121.9 119.3 120.6 120.6 -5.6 Tunisia 196.3 191.7 200.5 196.2 204.4 200.3 202.4 202.4 3.2 USA 93.4 91.7 91.8 92.3 113.1 115.0 114.6 114.3 23.8 EU 108.6 108.5 110.2 109.1 124.3 129.4 115.8 123.2 12.9 World 119.8 119.7 119.0 119.5 137.8 120.3 124.0 127.4 6.6 Source: Elaborated from the FAOSTAT, USDA database, AOAD database, MAAR database and NAPC database. Estimation for other countries is provisional because FAO estimates have been not published yet. Vegetables Syria 113.0 121.9 112.0 115.6 106.0 96.6 99.8 100.8 -12.8 Egypt 215.8 220.7 220.3 218.9 225.4 221.1 223.3 223.3 2.0 Jordan 125.7 141.7 161.7 143.0 167.2 101.5 134.4 134.4 -6.0 Kuwait 162.3 178.3 162.8 167.8 126.5 123.3 124.9 124.9 -25.6 Lebanon 275.2 294.3 295.4 288.3 268.7 264.0 266.3 266.3 -7.6 Morocco 166.9 196.6 175.9 179.8 178.4 163.7 171.1 171.1 -4.8 Saudi Arabia 115.3 123.3 122.8 120.5 118.9 116.4 117.7 117.7 -2.3 Tunisia 224.7 233.0 213.4 223.7 257.9 276.6 267.2 267.2 19.4 USA 190.2 192.2 179.5 187.3 175.2 176.6 172.1 174.6 -6.8 EU 206.0 214.6 206.2 208.9 195.2 192.3 193.8 193.8 -7.2 World 159.7 163.4 163.5 162.2 162.6 163.0 162.8 162.8 0.4 Fruits Syria 103.2 123.6 104.0 110.3 125.8 91.8 133.8 117.1 6.2 Egypt 95.7 97.7 95.8 96.4 108.2 105.2 106.7 106.7 10.7 Jordan 56.3 58.8 57.4 57.5 102.9 102.3 102.6 102.6 78.4 Kuwait 40.7 42.7 42.2 41.9 40.5 39.5 40.0 40.0 -4.5 Lebanon 147.3 138.4 125.0 136.9 169.8 168.3 169.1 169.1 23.5

State of Food and Agriculture in Syria 2010
337
Morocco 66.1 68.2 65.4 66.6 75.5 134.5 105.0 105.0 57.7 Saudi Arabia 104.4 103.4 111.0 106.3 95.4 94.7 95.1 95.1 -10.5 Tunisia 84.4 91.1 91.9 89.1 86.2 81.6 83.9 83.9 -5.8 USA 114.0 115.3 111.0 113.4 110.1 107.2 102.7 106.7 -5.9 EU 102.2 104.9 108.6 105.2 103.8 96.6 100.2 100.2 -4.8 World 61.5 63.5 64.7 63.2 67.7 68.3 68.0 68.0 7.6 Meat Syria 19.7 19.5 19.1 19.4 22.4 22.9 17.6 20.9 7.7 Egypt 36.5 37.6 38.3 37.5 33.6 35.0 34.3 34.3 -8.5 Jordan 38.1 41.5 41.2 40.3 33.6 37.5 35.5 35.5 -11.9 Kuwait 73.7 86.6 103.1 87.8 79.1 77.1 78.1 78.1 -11.0 Lebanon 58.1 60.3 61.8 60.1 43.1 42.8 42.9 42.9 -28.6 Morocco 30.7 31.6 33.6 32.0 33.7 30.2 32.0 32.0 0.0 Saudi Arabia 58.0 57.9 63.9 59.9 57.2 58.8 58.0 58.0 -3.2

State of Food and Agriculture in Syria 2010
338
Table A6.6. Continued
Item 2003 2004 2005 Average 1 2003-2005
2006 2007 2008 Average 2 2006-2008
Change % 2/1
Meat (continued) Tunisia 35.8 38.2 38.7 37.6 33.5 32.0 32.7 32.7 -13.0 USA 146.7 151.6 150.7 149.7 146.7 144.5 145.6 145.6 -2.7 EU 107.9 106.8 106.7 107.1 105.7 102.5 104.1 104.1 -2.8 World 55.1 55.5 56.2 55.6 54.3 54.4 59.0 55.9 0.5 Milk and its products Syria 96.7 106.3 113.9 105.6 118.6 120.1 111.4 116.7 10.5 Egypt 90.6 75.1 75.8 80.5 60.0 64.4 62.2 62.2 -22.7 Jordan 103.3 93.5 67.8 88.2 103.4 113.0 108.2 108.2 22.7 Kuwait 126.3 104.6 118.4 116.4 142.2 138.7 140.5 140.5 20.7 Lebanon 134.8 133.9 129.2 132.6 146.9 145.6 146.2 146.2 10.3 Morocco 58.4 58.1 60.9 59.1 49.7 47.5 48.6 48.6 -17.8 Saudi Arabia 104.3 112.5 95.1 104.0 108.6 107.0 107.8 107.8 3.7 Tunisia 113.0 104.5 108.0 108.5 98.7 95.7 97.2 97.2 -10.4 USA 284.1 280.9 281.7 282.2 273.0 271.7 270.2 271.6 -3.8 EU 288.8 283.5 285.7 286.0 279.4 278.7 280.0 279.4 -2.3 World 95.4 96.1 97.7 96.4 84.8 85.7 103.7 91.4 -5.2 Eggs Syria 8.8 10.1 7.7 8.9 9.0 7.9 6.8 7.9 -11.2 Egypt 2.8 2.7 2.7 2.7 2.5 3.0 2.7 2.7 0.0 Jordan 5.1 5.4 4.4 5.0 4.8 4.0 4.4 4.4 -12.0 Kuwait 9.9 12.2 12.8 11.6 12.6 12.3 12.5 12.5 7.8 Lebanon 7.9 7.2 7.9 7.7 8.5 8.4 8.4 8.4 9.1 Morocco 6.5 5.1 5.2 5.6 4.5 5.3 4.9 4.9 -12.5 Saudi Arabia 4.4 4.4 5.0 4.6 4.5 4.8 4.7 4.7 2.2 Tunisia 6.8 7.2 7.2 7.1 6.4 6.8 6.6 6.6 -7.0 USA 14.6 14.7 14.6 14.6 14.9 14.4 14.3 14.5 -0.7 EU 12.4 12.5 12.0 12.3 12.1 11.8 12.0 11.9 -3.3 World 8.2 8.3 8.3 8.3 8.4 8.4 8.5 8.4 1.2
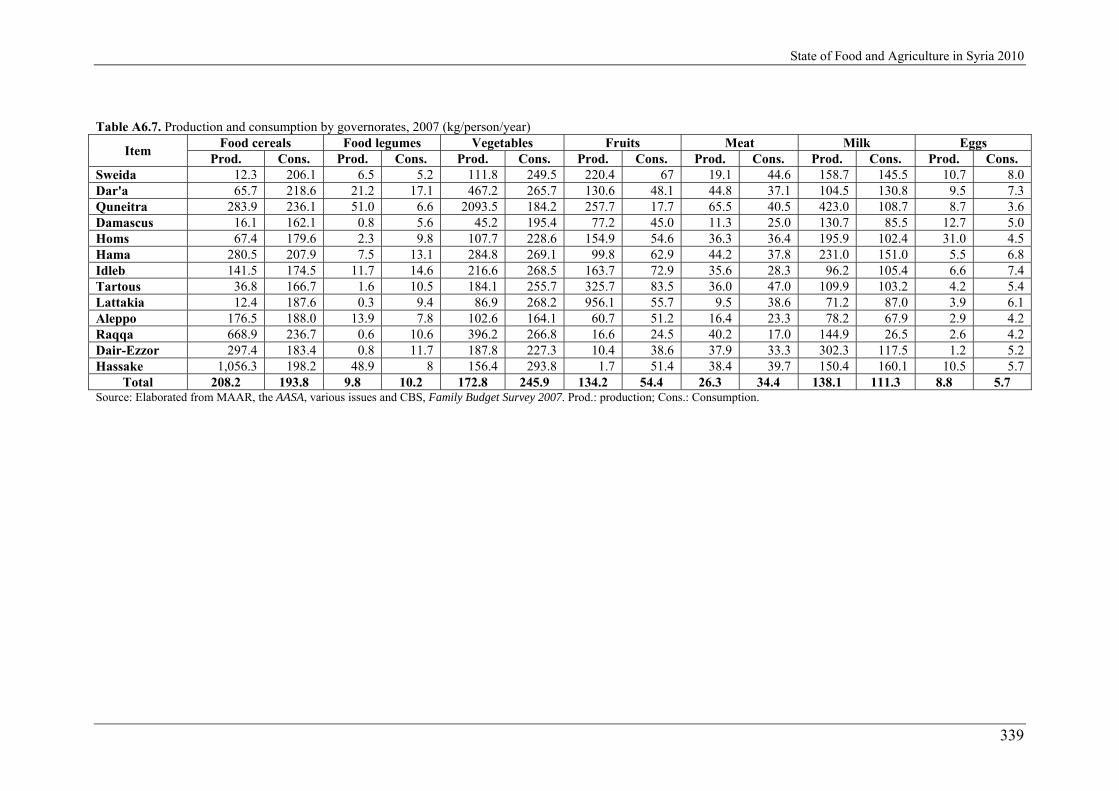
State of Food and Agriculture in Syria 2010
339
Table A6.7. Production and consumption by governorates, 2007 (kg/person/year)
Item Food cereals Food legumes Vegetables Fruits Meat Milk Eggs
Prod. Cons. Prod. Cons. Prod. Cons. Prod. Cons. Prod. Cons. Prod. Cons. Prod. Cons. Sweida 12.3 206.1 6.5 5.2 111.8 249.5 220.4 67 19.1 44.6 158.7 145.5 10.7 8.0 Dar'a 65.7 218.6 21.2 17.1 467.2 265.7 130.6 48.1 44.8 37.1 104.5 130.8 9.5 7.3 Quneitra 283.9 236.1 51.0 6.6 2093.5 184.2 257.7 17.7 65.5 40.5 423.0 108.7 8.7 3.6 Damascus 16.1 162.1 0.8 5.6 45.2 195.4 77.2 45.0 11.3 25.0 130.7 85.5 12.7 5.0 Homs 67.4 179.6 2.3 9.8 107.7 228.6 154.9 54.6 36.3 36.4 195.9 102.4 31.0 4.5 Hama 280.5 207.9 7.5 13.1 284.8 269.1 99.8 62.9 44.2 37.8 231.0 151.0 5.5 6.8 Idleb 141.5 174.5 11.7 14.6 216.6 268.5 163.7 72.9 35.6 28.3 96.2 105.4 6.6 7.4 Tartous 36.8 166.7 1.6 10.5 184.1 255.7 325.7 83.5 36.0 47.0 109.9 103.2 4.2 5.4 Lattakia 12.4 187.6 0.3 9.4 86.9 268.2 956.1 55.7 9.5 38.6 71.2 87.0 3.9 6.1 Aleppo 176.5 188.0 13.9 7.8 102.6 164.1 60.7 51.2 16.4 23.3 78.2 67.9 2.9 4.2 Raqqa 668.9 236.7 0.6 10.6 396.2 266.8 16.6 24.5 40.2 17.0 144.9 26.5 2.6 4.2 Dair-Ezzor 297.4 183.4 0.8 11.7 187.8 227.3 10.4 38.6 37.9 33.3 302.3 117.5 1.2 5.2 Hassake 1,056.3 198.2 48.9 8 156.4 293.8 1.7 51.4 38.4 39.7 150.4 160.1 10.5 5.7
Total 208.2 193.8 9.8 10.2 172.8 245.9 134.2 54.4 26.3 34.4 138.1 111.3 8.8 5.7 Source: Elaborated from MAAR, the AASA, various issues and CBS, Family Budget Survey 2007. Prod.: production; Cons.: Consumption.

State of Food and Agriculture in Syria 2010
340
Table A6.8. Composition of the household total monthly expenditure by governorates, 2004, 2007 and 2009 (SP/household/month, %)
Item
2004 2007 2009
Total expenditure
Food expenditure
Food %
Total expenditur
e
Food
expenditure
Food %
Total expenditur
e
Food expenditur
e
Food %
Total Sweida 16,738 6,976 41.7 29,806 9,713 32.6 28,370 10,910 38.5 Dar’a 23,248 10,166 43.7 32,838 15,738 47.9 32,217 15,219 47.2 Quneitra 19,031 8,240 43.3 32,058 14,050 43.8 31,765 15,417 48.5 Damascus City 28,598 9,817 34.3 28,191 10,239 36.3 40,196 13,886 34.5 Damascus Rural 19,288 8,596 44.6 24,668 10,255 41.6 32,498 12,725 39.2 Homs 20,095 8,233 41.0 26,214 11,400 43.5 29,548 13,937 47.2 Hama 21,083 8,624 40.9 28,325 12,841 45.3 27,890 13,554 48.6 Idleb 19,990 7,720 38.6 20,739 9,817 47.3 24,890 12,346 49.6 Tartous 23,161 8,377 36.2 34,977 11,794 33.7 34,771 14,059 40.4 Lattakia 20,051 7,619 38.0 29,042 10,535 36.3 34,296 13,548 39.5 Aleppo 17,774 7,813 44.0 23,530 9,963 42.3 29,994 15,523 51.8 Raqqa 19,711 7,598 38.5 18,636 10,191 54.7 26,522 15,025 56.7 Dair-Ezzor 22,941 9,786 42.7 24,239 11,740 48.4 24,297 13,678 56.3 Hassake 23,135 9,948 43.0 23,490 11,806 50.3 28,200 15,528 55.1 Average 21,048 8,553 40.6 25,913 10,929 42.2 30,826 14,072 45.6 Standard deviation 2,981 1,016 3 4,687 1,768 7 4,284 1,348 7 CV % 14.2 11.9 7.8 18.1 16.2 15.5 13.9 9.6 15.7 Min 16,738 6,976 34.3 18,636 9,713 32.6 24,297 10,910 34.5 Max 28,598 10,166 44.6 34,977 15,738 54.7 40,196 15,528 56.7 Urban Sweida 19,147 7,361 38.4 35,093 10,020 28.6 31,072 10,805 34.8 Dar’a 23,217 9,934 42.8 28,154 12,293 43.7 32,670 15,032 46.0 Quneitra 0 0 0 0 0 0 0 0 0 Damascus City 28,598 9,817 34.3 27,258 10,035 36.8 40,196 13,886 34.5 Damascus Rural 20,101 8,597 42.8 24,828 10,150 40.9 33,467 12,681 37.9 Homs 21,288 8,413 39.5 21,477 9,028 42.0 28,765 12,930 45.0 Hama 21,253 8,464 39.8 30,987 12,280 39.6 31,257 14,387 46.0 Idleb 22,945 8,269 36.0 29,451 12,311 41.8 29,759 13,204 44.4 Tartous 24,670 8,518 34.5 38,644 12,829 33.2 41,503 15,342 37.0 Lattakia 18,859 7,132 37.8 25,326 9,266 36.6 38,451 13,180 34.3
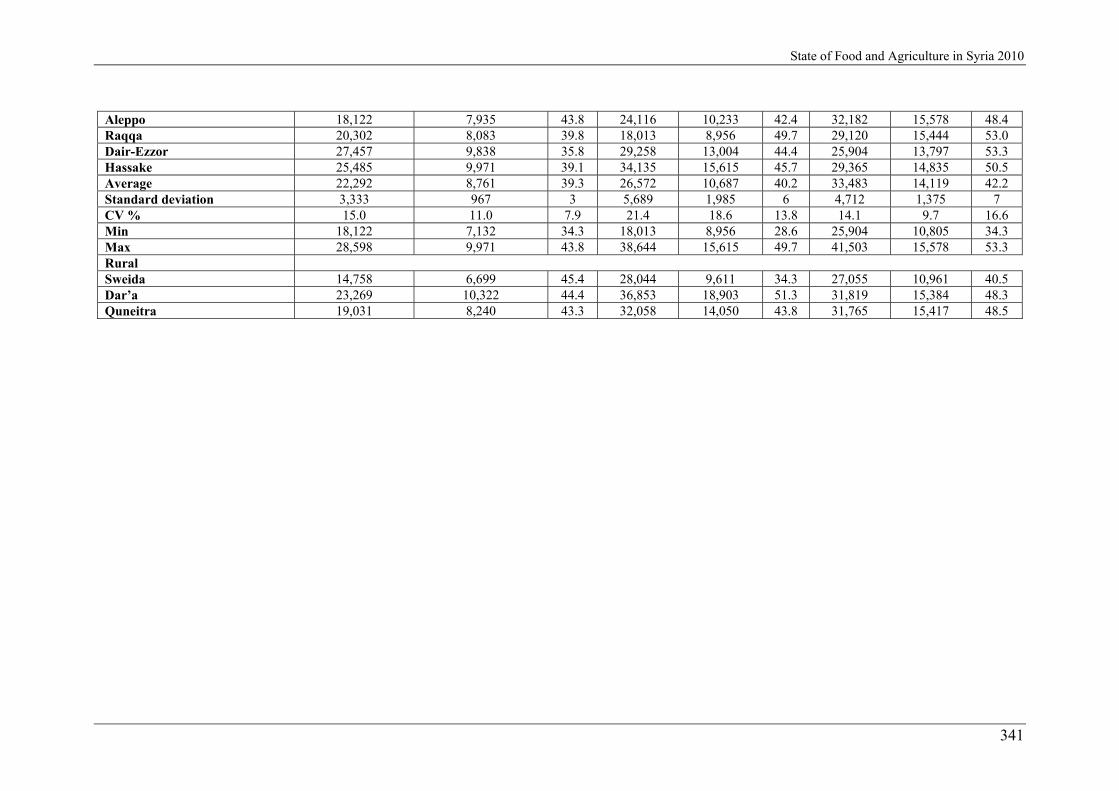
State of Food and Agriculture in Syria 2010
341
Aleppo 18,122 7,935 43.8 24,116 10,233 42.4 32,182 15,578 48.4 Raqqa 20,302 8,083 39.8 18,013 8,956 49.7 29,120 15,444 53.0 Dair-Ezzor 27,457 9,838 35.8 29,258 13,004 44.4 25,904 13,797 53.3 Hassake 25,485 9,971 39.1 34,135 15,615 45.7 29,365 14,835 50.5 Average 22,292 8,761 39.3 26,572 10,687 40.2 33,483 14,119 42.2 Standard deviation 3,333 967 3 5,689 1,985 6 4,712 1,375 7 CV % 15.0 11.0 7.9 21.4 18.6 13.8 14.1 9.7 16.6 Min 18,122 7,132 34.3 18,013 8,956 28.6 25,904 10,805 34.3 Max 28,598 9,971 43.8 38,644 15,615 49.7 41,503 15,578 53.3 Rural Sweida 14,758 6,699 45.4 28,044 9,611 34.3 27,055 10,961 40.5 Dar’a 23,269 10,322 44.4 36,853 18,903 51.3 31,819 15,384 48.3 Quneitra 19,031 8,240 43.3 32,058 14,050 43.8 31,765 15,417 48.5

State of Food and Agriculture in Syria 2010
342
Table A6.8. Continued
Item 2003-2004 2006-2007 2008-2009
Total expenditure
Food expenditure
Food %
Total expenditure
Food expenditure
Food %
Total expenditure
Food expenditure
Food %
Rural (continued)Damascus City 0 0 0 0 0 0 0 0 0 Damascus Rural 18,450 8,595 46.6 24,275 10,513 43.3 30,659 12,807 41.8 Homs 17,287 8,161 47.2 31,609 15,029 47.5 30,565 15,245 49.9 Hama 21,632 8,810 40.7 26,418 13,180 49.9 25,612 12,991 50.7 Idleb 18,825 7,420 39.4 18,289 8,920 48.8 22,692 11,958 52.7 Tartous 22,482 8,374 37.2 32,541 11,422 35.1 31,885 13,508 42.4 Lattakia 19,720 7,846 39.8 30,769 11,095 36.1 29,124 14,007 48.1 Aleppo 12,183 6,352 52.1 17,324 9,290 53.6 25,491 15,409 60.4 Raqqa 19,421 7,600 39.1 18,723 10,945 58.5 24,980 14,776 59.2 Dair-Ezzor 18,237 9,323 51.1 20,248 10,732 53.0 22,827 13,570 59.4 Hassake 21,937 9,960 45.4 18,156 9,898 54.5 27,521 15,933 57.9 Average 18,503 8,196 44.3 24,267 11,381 46.9 27,336 14,011 51.3 Standard deviation 3,094 1,158 5 6,712 2,814 8 3,362 1,529 7 CV % 16.7 14.1 10.5 27.7 24.7 16.8 12.3 10.9 13.4 Min 12,183 6,352 37.2 17,324 8,920 34.3 22,692 10,961 40.5 Max 23,269 10,322 52.1 36,853 18,903 58.5 31,885 15,933 60.4 Source: Elaborated from CBS, Family Budget Survey, 2004, 2007 and 2009. CV: Coefficient of variation.

State of Food and Agriculture in Syria 2010
343
Table A6.9. Composition of the household total monthly expenditure by expenditure strata in urban and rural areas, 2004, 2007 and 2009 (SP/household/month, %) Item 1 2 3 4 5 6 7 8 9 10 Mean Stdv CV % Min Max
2004 Average Expenditure 1,490 4,470 7,451 10,431 13,411 16,391 19,371 22,351 25,331 28,311 14,901 9,023 60.6 1,490 28,311 % of total 1.0 3.0 5.0 7.0 9.0 11.0 13.0 15.0 17.0 19.0 Urban Expenditure 1,675 4,520 7,515 10,430 13,416 16,390 19,379 22,353 25,361 28,276 15,965 8,979 56.2 1,675 28,276 % of total 1.1 3.0 5.0 7.0 9.0 11.0 13.0 15.0 17.0 18.9 Rural Expenditure 1,374 4,437 7,393 10,422 13,419 16,382 19,364 22,322 25,273 28,246 13,252 9,030 68.1 1,374 28,246 % of total 0.9 3.0 5.0 7.0 9.0 11.0 13.0 15.0 17.0 19.0 Table A6.9. Continued
Item 1 2 3 4 5 6 7 8 9 10 Mean Stdv CV % Min Max 2007 Average Expenditure 9,005 13,209 15,657 17,938 20,395 23,073 26,479 30,887 37,942 64,525 25,913 16,039 61.9 9,005 64,525 % of total 3.5 5.1 6.0 6.9 7.9 8.9 10.2 11.9 14.6 24.9 Urban Expenditure 9,326 13,255 15,665 17,971 20,376 23,038 26,462 30,863 38,007 60,985 25,595 15,065 58.9 9,326 60,985 % of total 3.6 5.2 6.1 7.0 8.0 9.0 10.3 12.1 14.8 23.8 Rural Expenditure 8,811 13,154 15,650 17,906 20,406 23,126 26,507 30,915 37,667 69,332 24,267 17,351 71.5 8,811 69,332 % of total 3.3 5.0 5.9 6.8 7.7 8.8 10.1 11.7 14.3 26.3 2009 Average Expenditure 11,208 15,725 18,651 21,406 24,203 27,232 30,919 35,981 44,257 78,680 30,826 19,447 63.1 11,208 78,680 % of total 3.6 5.1 6.1 6.9 7.9 8.8 10.0 11.7 14.4 25.5 Urban Expenditure 12,467 17,140 20,243 23,087 25,950 29,207 33,266 38,836 47,777 86,864 33,483 21,473 64.1 12,467 86,864 % of total 3.7 5.1 6 6.9 7.8 8.7 9.9 11.6 14.3 25.9 Rural Expenditure 10,057 14,344 16,925 19,409 21,993 24,799 28,047 32,276 39,255 66,256 27,336 16,177 59.2 10,057 66,256 % of total 3.7 5.2 6.2 7.1 8 9.1 10.3 11.8 14.4 24.2 Source: Elaborated from CBS, Family Budget Survey, 2004, 2007 and 2009.

State of Food and Agriculture in Syria 2010
344
Table A6.10. Structure of the household by expenditure strata, 2004, 2007 and 2009 (%)
Item 1
< 3,001
2 3,001-6,000
3 6,001-9,000
4 9,001-12,000
5 12,001-16,000
6 16,001-20,000
7 20,001-25,000
8 25,001-30,000
9 30,001-40,000
10 ≥
40,000-50,000
Total
2004 0.3 3.0 9.7 14.4 19.6 15.4 12.5 8.1 8.3 8.7 100.0 2007 0.1 0.9 3.1 6.6 15.7 16.9 17.7 12.2 14 12.8 100.0 2009
Strata ≤7,000- 10,000
10,001-16,000
16,001-19,000
19,001-22,000
22,001-25,000
25,001-30,000
30,001-35,000
35,001-40,000
40,001-50,000
> 50,000
Share 2.6 13.2 10.4 11.1 10.5 15.3 10.7 7.2 8.8 10.2 100.0 Source: Elaborated from CBS, Family Budget Survey, 2004, 2007 and 2009.

State of Food and Agriculture in Syria 2010
345
Table A6.11. Per capita daily requirements of nutrients
Item Unit Calories
Lower Upper Full rest kcal 1,800 1,900 Relative rest kcal 2,200 2,400 Easy work kcal 2,400 3,000 Hard work kcal 3,300 3,800 Very hard work kcal 4,100 6,500 Average kcal 2,125 2,700
Nutrients Carbohydrate g 360 Fat g 41.4 75 Protein g 41.4 75 Mineral salt g 25 30 Water g 1,975 2,500
Vitamins A microg 756.5 1,500 C mg 47.9 75 B1 mg 0.9 1.5 B2 mg 0.9 2 B6 mg 1.1 3 B12 micro g 1.9 2
Minerals S Sulfure (g) 1.2 P Phosphor (g) 1.2 Cl Chloride (g) 6 Mg Magnesium (g) 0.32 Na Sodium (g) 3.2 4 K Potassium (g) 3.6 Ca Calcium (mg) 840 999 Mn Manganese (mg) 3 Fe Iron (mg) 11.5 18 Cu Copper (mg) 2.5 Zn Zink (mg) 20 I Iodine (microg) 40 200
Source: Mehmalji Rateb, Food Chemistry, Damascus University, 1981-1982 and Strategy of the Syrian Ministry of Health, 2009.

State of Food and Agriculture in Syria 2010
346
Table A6.12. Per capita daily requirements of nutrients by age groups
Sex and age Energy
kcal Protein
g Vitamin A
micro g Vitamin E
mg Vitamin C
m g Vitamin K
mg Fe mg
Zn mg
Iodine (I) micro g
Selenium micro g
Breast fed 0-0.5 650 13 375 3 5 30 6 5 40 10 0.5-1 850 14 375 4 10 35 10 5 50 15
Children 1-3 1,300 16 400 6 15 40 10 10 70 20 4-6 1,800 24 500 7 20 45 10 10 90 20
7-10 2,000 28 700 7 30 45 10 10 120 30 Male
11-14 2,500 45 1,000 10 45 50 12 15 150 40 15-18 3,000 59 1,000 10 65 60 12 15 150 50 19-24 2,900 58 1,000 10 70 60 10 15 150 70 25-50 2,900 63 1,000 10 80 60 10 15 150 70 +50 2,300 63 1,000 10 80 60 10 15 150 70
Female 11-14 2,300 46 800 8 45 50 15 12 150 45 15-18 2,200 44 800 8 55 60 15 12 150 50 19-24 2,200 46 800 8 60 60 15 12 150 55 25-50 2,200 50 800 8 65 60 15 12 150 55 +50 1,900 50 800 8 65 60 10 12 175 55
Pregnant +30 60 800 10 65 70 30 15 175 65 Breast feeding (lactating)
First six month +500 65 1,300 12 65 95 15 19 200 75 Second six month +500 62 1,200 11 65 95 15 16 200 75

State of Food and Agriculture in Syria 2010
347
Table A6.12. Continued
Sex and age
International recommendation for nutrition requirements Sufficient intakes
Thiaminmg
Riboflavin micro g
Niacinmg
B6 mg
Alcoholmicro g
B12 micro
g
Phosphormg
Magnesium mg
Vitamin D
micro g
Pentatonic acid mg
Biotin micro
g
Colinmg
Calciummg
Florid mg
Breast fed 0-0.5 0.2 0.3 2 0.1 65 0.4 100 30 5 1.7 5 125 210 0.01 0.5-1 0.3 0.4 4 0.3 80 0.5 275 75 5 1.8 6 270 270 0.5
Children 1-3 0.5 0.5 6 0.6 50 0.9 460 80 5 2.0 8 200 500 0.7 4-8 0.6 0.6 8 0.6 200 1.2 500 130 5 3.0 12 250 800 1.1
Male 9-13 0.9 0.9 12 1.0 300 1.8 1,250 240 5 4 20 375 1,300 2.0
14-18 1.2 1.3 16 1.3 400 2.4 1,250 410 5 5 25 550 1,300 3.2 19-30 1.2 1.3 16 1.3 400 2.4 700 400 5 5 30 550 1,000 3.8 31-50 1.2 1.3 16 1.7 400 2.4 700 420 5 5 30 550 1,000 3.8 51-70 1.2 1.3 16 1.7 400 2.4 700 420 10 5 30 500 1,200 3.8 +70 1.2 1.3 16 1.7 400 2.4 700 420 15 5 30 500 1,200 3.8
Female 9-13 0.9 0.9 12 1.0 300 1.8 1,250 240 5 4 20 375 1,300 2.0
14-18 1.0 1.0 14 1.2 400 2.4 1,250 360 5 5 25 400 1,300 3.2 19-30 1.1 1.1 14 1.3 400 2.4 700 310 5 5 30 425 1,000 3.8 31-50 1.1 1.1 14 1.3 400 2.4 700 320 5 5 30 425 1,000 3.8 51-70 1.1 1.1 14 1.5 400 2.4 700 320 10 5 30 425 1,200 3.8 +70 1.1 1.1 14 1.5 400 2.4 700 320 15 5 30 425 1,200 3.8
Pregnant 1.4 1.4 18 1.9 600 2.6 * +40 * 6 30 450 * * Lactating 1.5 1.6 17 2.0 800 2.8 * * * 7 35 550 * *
Source: Elaborated from the Nutrition Strategy of the Syrian Ministry of Health, 2009. * The same intake as the females in the same age.

State of Food and Agriculture in Syria 2010
348
Table A6.13. Food composition per 1000 g by food groups and countries
Item Energy Protein Fat
Carbo- hydrate
Vitamin A
Vitamin C
Vitamin B1
Vitamin B2
Vitamin B6
Vitamin B12
Calcium Sodium Iron Iodine
kcal g g g microg RE mg mg mg mg microg mg mg mg microg Cereals Syria 2,907.4 85.5 14.5 660.0 228.0 0.0 3.1 1.2 0.8 0.0 225.0 52.4 43.0 45.0 Egypt 3,162.9 87.4 22.6 660.0 228.0 0.0 3.1 1.2 0.5 0.0 225.0 52.4 43.0 45.0 Jordan 3,108.7 89.0 16.0 660.0 228.0 0.0 3.1 1.2 0.6 0.0 225.0 52.4 43.0 45.0 Kuwait 3,205.6 79.4 10.3 660.0 228.0 0.0 3.1 1.2 0.9 0.0 225.0 52.4 43.0 45.0 Lebanon 2,986.4 78.6 9.6 660.0 228.0 0.0 3.1 1.2 0.6 0.0 225.0 52.4 43.0 45.0 Morocco 2,753.5 81.9 12.3 660.0 228.0 0.0 3.1 1.2 0.3 0.0 225.0 52.4 43.0 45.0 Saudi Arabia 3,348.5 89.7 21.6 660.0 250.0 0.0 3.1 1.2 0.7 0.0 225.0 52.4 43.0 45.0 Tunisia 2,903.8 87.0 10.5 660.0 228.0 0.0 3.1 1.2 0.5 0.0 225.0 52.4 43.0 45.0 USA 2,679.3 80.5 11.0 660.0 228.0 0.0 3.1 1.2 0.5 0.0 225.0 52.4 43.0 45.0 EU 2,655.6 81.4 10.3 660.0 228.0 0.0 3.1 1.2 0.5 0.0 225.0 52.4 43.0 45.0 World 3,195.0 79.9 14.5 660.0 228.0 0.0 3.1 1.2 0.8 0.0 225.0 52.4 43.0 45.0 Food legumes Syria 3,521.2 231.9 21.5 495.7 0.0 5.4 4.3 2.7 1.7 0.0 825.0 150.0 50.0 7.0 Egypt 3,548.6 263.6 20.3 495.7 0.0 5.4 4.3 2.7 1.7 0.0 825.0 150.0 50.0 7.0 Jordan 3,500.0 220.0 25.0 495.7 0.0 5.4 4.3 2.7 1.7 0.0 825.0 150.0 50.0 7.0 Kuwait 3,454.5 228.1 26.1 495.7 0.0 5.4 4.3 2.7 1.7 0.0 825.0 150.0 50.0 7.0 Lebanon 3,522.4 229.7 23.0 495.7 0.0 5.4 4.3 2.7 1.7 0.0 825.0 150.0 50.0 7.0 Morocco 3,467.5 240.9 18.3 495.7 0.0 5.4 4.3 2.7 1.7 0.0 825.0 150.0 50.0 7.0 Saudi Arabia 3,435.3 225.4 21.5 495.7 0.0 5.4 4.3 2.7 1.7 0.0 825.0 150.0 50.0 7.0 Tunisia 3,462.8 224.6 23.4 495.7 0.0 5.4 4.3 2.7 1.7 0.0 825.0 150.0 50.0 7.0 USA 3,421.9 228.1 11.4 495.7 0.0 5.4 4.3 2.7 1.7 0.0 825.0 150.0 50.0 7.0 EU 3,406.7 219.0 12.2 495.7 0.0 5.4 4.3 2.7 1.7 0.0 825.0 150.0 50.0 7.0 World 3,421.9 211.0 22.8 495.7 0.0 5.4 4.3 2.7 1.7 0.0 825.0 150.0 50.0 7.0 Fruits Syria 536.0 6.0 2.1 85.4 76.0 130.0 0.5 0.4 0.7 0.0 100.0 70.0 1.7 8.6 Egypt 607.1 7.9 2.9 85.4 76.0 130.0 0.5 0.4 0.7 0.0 100.0 70.0 1.7 8.6 Jordan 497.7 5.7 2.6 85.4 76.0 130.0 0.5 0.4 0.7 0.0 100.0 70.0 1.7 8.6 Kuwait 430.8 5.3 2.6 85.4 76.0 130.0 0.5 0.4 0.7 0.0 100.0 70.0 1.7 8.6 Lebanon 432.5 6.0 2.3 85.4 76.0 130.0 0.5 0.4 0.7 0.0 100.0 70.0 1.7 8.6 Morocco 465.2 5.4 3.6 85.4 76.0 130.0 0.5 0.4 0.7 0.0 100.0 70.0 1.7 8.6 Saudi Arabia 768.8 8.3 2.8 85.4 150.0 130.0 0.5 0.4 0.7 0.0 100.0 70.0 1.7 8.6

State of Food and Agriculture in Syria 2010
349
Table A6.13. Continued
Item Energy Protein Fat
Carbo- hydrate
Vitamin A
Vitamin C
Vitamin B1
Vitamin B2
Vitamin B6
Vitamin B12
Calcium Sodium Iron Iodine
kcal g g g microg RE mg mg mg mg microg mg mg mg microg Fruits (continued) Tunisia 520.6 6.1 3.0 85.4 76.0 130.0 0.5 0.4 0.7 0.0 100.0 70.0 1.7 8.6 USA 373.1 4.4 2.0 85.4 76.0 130.0 0.5 0.4 0.7 0.0 100.0 70.0 1.7 8.6 EU 451.3 5.3 2.7 85.4 76.0 130.0 0.5 0.4 0.7 0.0 100.0 70.0 1.7 8.6 World 474.1 5.3 3.0 85.4 76.0 130.0 0.5 0.4 0.7 0.0 100.0 70.0 1.7 8.6 Vegetables Syria 248.6 9.8 1.7 79.8 249.0 135.0 0.5 0.3 1.0 0.0 135.0 680.0 4.5 30.4 Egypt 286.9 10.1 1.6 79.8 249.0 135.0 0.5 0.3 1.0 0.0 135.0 680.0 4.5 30.4 Jordan 254.2 10.1 1.7 79.8 249.0 135.0 0.5 0.3 1.0 0.0 135.0 680.0 4.5 30.4 Kuwait 267.9 11.0 2.0 79.8 249.0 135.0 0.5 0.3 1.0 0.0 135.0 680.0 4.5 30.4 Lebanon 352.9 11.2 1.8 79.8 249.0 135.0 0.5 0.3 1.0 0.0 135.0 680.0 4.5 30.4 Morocco 395.0 11.4 1.5 79.8 249.0 135.0 0.5 0.3 1.0 0.0 135.0 680.0 4.5 30.4 Saudi Arabia 233.7 9.9 1.7 79.8 300.0 135.0 0.5 0.3 1.0 0.0 135.0 680.0 4.5 30.4 Tunisia 279.9 11.4 2.2 79.8 249.0 135.0 0.5 0.3 1.0 0.0 135.0 680.0 4.5 30.4 USA 349.8 12.4 1.5 79.8 249.0 135.0 0.5 0.3 1.0 0.0 135.0 680.0 4.5 30.4 EU 419.7 13.8 1.4 79.8 249.0 135.0 0.5 0.3 1.0 0.0 135.0 680.0 4.5 30.4 World 442.0 12.9 1.9 79.8 249.0 135.0 0.5 0.3 1.0 0.0 135.0 680.0 4.5 30.4 Meat Syria 1,954.2 135.7 153.4 1.7 1,168.0 9.2 1.8 1.7 2.9 20.9 115.0 690.0 12.5 117.4 Egypt 1,405.0 128.3 94.7 1.7 1,168.0 9.2 1.8 1.7 2.9 20.9 115.0 690.0 12.5 117.4 Jordan 1,734.7 132.7 129.5 1.7 1,168.0 9.2 1.8 1.7 2.9 20.9 115.0 690.0 12.5 117.4 Kuwait 1,615.7 122.7 121.2 1.7 1,168.0 9.2 1.8 1.7 2.9 20.9 115.0 690.0 12.5 117.4 Lebanon 1,803.1 133.3 137.7 1.7 1,168.0 9.2 1.8 1.7 2.9 20.9 115.0 690.0 12.5 117.4 Morocco 1,300.8 126.2 81.5 1.7 1,168.0 9.2 1.8 1.7 2.9 20.9 115.0 690.0 12.5 117.4 Saudi Arabia 1,527.4 128.4 108.3 1.7 1,200.0 9.2 1.8 1.7 2.9 20.9 115.0 690.0 12.5 117.4 Tunisia 1,322.8 124.9 88.2 1.7 1,168.0 9.2 1.8 1.7 2.9 20.9 115.0 690.0 12.5 117.4 USA 1,208.2 116.0 78.8 1.7 1,168.0 9.2 1.8 1.7 2.9 20.9 115.0 690.0 12.5 117.4 EU 1,522.4 117.8 113.0 1.7 1,168.0 9.2 1.8 1.7 2.9 20.9 115.0 690.0 12.5 117.4 World 1,554.8 118.9 114.7 1.7 1,168.0 9.2 1.8 1.7 2.9 20.9 115.0 690.0 12.5 117.4 Eggs Syria 1,436.1 107.7 101.7 12.3 1,696.0 0.0 1.3 3.2 1.1 9.8 430.0 1,100.0 12.6 371.8 Egypt 1,390.5 104.3 104.3 12.3 1,696.0 0.0 1.3 3.2 1.1 9.8 430.0 1,100.0 12.6 371.8

State of Food and Agriculture in Syria 2010
350
Table A6.13. Continued
Item Energy Protein Fat
Carbo- hydrate
Vitamin A
Vitamin C
Vitamin B1
Vitamin B2
Vitamin B6
Vitamin B12
Calcium Sodium Iron Iodine
kcal g g g microg RE mg mg mg mg microg mg mg mg microg Eggs (continued) Jordan 1,430.4 108.5 103.6 12.3 1,696.0 0.0 1.3 3.2 1.1 9.8 430.0 1,100.0 12.6 371.8 Kuwait 1,393.1 105.9 97.5 12.3 1,696.0 0.0 1.3 3.2 1.1 9.8 430.0 1,100.0 12.6 371.8 Lebanon 1,403.8 105.3 101.8 12.3 1,696.0 0.0 1.3 3.2 1.1 9.8 430.0 1,100.0 12.6 371.8 Morocco 1,216.7 101.4 81.1 12.3 1,696.0 0.0 1.3 3.2 1.1 9.8 430.0 1,100.0 12.6 371.8 Saudi Arabia 1,414.4 104.9 100.4 12.3 1,800.0 0.0 1.3 3.2 1.1 9.8 430.0 1,100.0 12.6 371.8 Tunisia 1,216.7 103.4 85.2 12.3 1,696.0 0.0 1.3 3.2 1.1 9.8 430.0 1,100.0 12.6 371.8 USA 1,384.5 105.7 98.2 12.3 1,696.0 0.0 1.3 3.2 1.1 9.8 430.0 1,100.0 12.6 371.8 EU 1,407.9 114.7 99.1 12.3 1,696.0 0.0 1.3 3.2 1.1 9.8 430.0 1,100.0 12.6 371.8 World 1,376.2 107.7 95.7 12.3 1,696.0 0.0 1.3 3.2 1.1 9.8 430.0 1,100.0 12.6 371.8 Milk Syria 632.8 36.5 39.0 29.6 250.0 4.1 0.2 1.0 0.2 2.2 960.0 550.0 0.5 157.9 Egypt 450.7 30.0 27.4 29.6 250.0 4.1 0.2 1.0 0.2 2.2 960.0 550.0 0.5 157.9 Jordan 567.8 34.6 30.7 29.6 250.0 4.1 0.2 1.0 0.2 2.2 960.0 550.0 0.5 157.9 Kuwait 485.5 34.4 18.5 29.6 250.0 4.1 0.2 1.0 0.2 2.2 960.0 550.0 0.5 157.9 Lebanon 475.0 33.3 24.2 29.6 250.0 4.1 0.2 1.0 0.2 2.2 960.0 550.0 0.5 157.9 Morocco 474.5 32.9 17.0 29.6 250.0 4.1 0.2 1.0 0.2 2.2 960.0 550.0 0.5 157.9 Saudi Arabia 560.1 37.2 23.1 29.6 350.0 4.1 0.2 1.0 0.2 2.2 960.0 550.0 0.5 157.9 Tunisia 570.5 32.7 27.5 29.6 250.0 4.1 0.2 1.0 0.2 2.2 960.0 550.0 0.5 157.9 USA 559.1 33.0 30.8 29.6 250.0 4.1 0.2 1.0 0.2 2.2 960.0 550.0 0.5 157.9 EU 491.9 30.8 28.4 29.6 250.0 4.1 0.2 1.0 0.2 2.2 960.0 550.0 0.5 157.9 World 555.4 33.1 30.3 29.6 250.0 4.1 0.2 1.0 0.2 2.2 960.0 550.0 0.5 157.9 Animal fats Syria 8,428.2 6.6 942.4 0.0 5,500.0 3.0 0.1 0.1 0.4 1.3 160.0 70.0 2.2 0.0 Egypt 7,554.7 8.5 848.8 0.0 5,500.0 3.0 0.1 0.1 0.4 1.3 160.0 70.0 2.2 0.0 Jordan 7,039.3 0.0 782.1 0.0 5,500.0 3.0 0.1 0.1 0.4 1.3 160.0 70.0 2.2 0.0 Kuwait 7,004.1 9.9 789.2 0.0 5,500.0 3.0 0.1 0.1 0.4 1.3 160.0 70.0 2.2 0.0 Lebanon 7,300.0 7.3 824.9 0.0 5,500.0 3.0 0.1 0.1 0.4 1.3 160.0 70.0 2.2 0.0 Morocco 7,300.0 0.0 821.3 0.0 5,500.0 3.0 0.1 0.1 0.4 1.3 160.0 70.0 2.2 0.0 Saudi Arabia 7,884.0 0.0 890.6 0.0 6,300.0 3.0 0.1 0.1 0.4 1.3 160.0 70.0 2.2 0.0 Tunisia 8,142.3 0.0 898.5 0.0 5,500.0 3.0 0.1 0.1 0.4 1.3 160.0 70.0 2.2 0.0 USA 6,264.2 4.9 705.3 0.0 5,500.0 3.0 0.1 0.1 0.4 1.3 160.0 70.0 2.2 0.0

State of Food and Agriculture in Syria 2010
351
Table A6.13. Continued
Item Energy Protein Fat
Carbo- hydrate
Vitamin A
Vitamin C
Vitamin B1
Vitamin B2
Vitamin B6
Vitamin B12
Calcium Sodium Iron Iodine
kcal g g g microg
RE mg mg mg mg microg mg mg mg microg
Animal fats Continued) EU 6,124.2 9.8 681.0 0.0 5,500.0 3.0 0.1 0.1 0.4 1.3 160.0 70.0 2.2 0.0 World 6,205.0 9.1 693.5 0.0 5,500.0 3.0 0.1 0.1 0.4 1.3 160.0 70.0 2.2 0.0 Vegetal oils and fats Syria 8,812.6 0.0 996.4 0.0 750.0 0.0 0.0 0.0 0.0 0.0 35.0 1,080.0 0.0 0.0 Egypt 8,917.1 0.0 1,007.2 0.0 750.0 0.0 0.0 0.0 0.0 0.0 35.0 1,080.0 0.0 0.0 Jordan 8,848.5 0.0 999.1 0.0 750.0 0.0 0.0 0.0 0.0 0.0 35.0 1,080.0 0.0 0.0 Kuwait 8,843.1 0.0 1,000.0 0.0 750.0 0.0 0.0 0.0 0.0 0.0 35.0 1,080.0 0.0 0.0 Lebanon 8,829.8 0.0 1,001.1 0.0 750.0 0.0 0.0 0.0 0.0 0.0 35.0 1,080.0 0.0 0.0 Morocco 8,818.1 0.0 998.1 0.0 750.0 0.0 0.0 0.0 0.0 0.0 35.0 1,080.0 0.0 0.0 Saudi Arabia 8,869.5 0.0 1,003.8 0.0 1,200.0 0.0 0.0 0.0 0.0 0.0 35.0 1,080.0 0.0 0.0 Tunisia 8,813.9 0.0 997.5 0.0 750.0 0.0 0.0 0.0 0.0 0.0 35.0 1,080.0 0.0 0.0 USA 8,490.6 3.1 958.7 0.0 750.0 0.0 0.0 0.0 0.0 0.0 35.0 1,080.0 0.0 0.0 EU 8,884.9 2.4 1,003.8 0.0 750.0 0.0 0.0 0.0 0.0 0.0 35.0 1,080.0 0.0 0.0 World 8,690.5 0.0 982.0 0.0 750.0 0.0 0.0 0.0 0.0 0.0 35.0 1,080.0 0.0 0.0 Sugar and sweetenersSyria 3,493.0 0.0 0.0 928.8 0.0 0.0 0.0 0.0 0.0 0.0 0.0 3.0 0.0 0.0 Egypt 3,617.0 0.0 0.0 928.8 0.0 0.0 0.0 0.0 0.0 0.0 0.0 3.0 0.0 0.0 Jordan 3,589.6 0.0 0.0 928.8 0.0 0.0 0.0 0.0 0.0 0.0 0.0 3.0 0.0 0.0 Kuwait 3,570.5 0.0 0.0 928.8 0.0 0.0 0.0 0.0 0.0 0.0 0.0 3.0 0.0 0.0 Lebanon 3,554.3 0.0 0.0 928.8 0.0 0.0 0.0 0.0 0.0 0.0 0.0 3.0 0.0 0.0 Morocco 3,543.7 0.0 0.0 928.8 0.0 0.0 0.0 0.0 0.0 0.0 0.0 3.0 0.0 0.0 Saudi Arabia 3,611.4 0.0 0.0 928.8 0.0 0.0 0.0 0.0 0.0 0.0 0.0 3.0 0.0 0.0 Tunisia 3,521.7 0.0 0.0 928.8 0.0 0.0 0.0 0.0 0.0 0.0 0.0 3.0 0.0 0.0 USA 3,405.4 0.0 0.0 928.8 0.0 0.0 0.0 0.0 0.0 0.0 0.0 3.0 0.0 0.0 EU 3,542.1 0.0 0.0 928.8 0.0 0.0 0.0 0.0 0.0 0.0 0.0 3.0 0.0 0.0 World 3,516.5 0.0 0.0 928.8 0.0 0.0 0.0 0.0 0.0 0.0 0.0 3.0 0.0 0.0 Alcoholic beverages Syria 912.5 0.0 0.0 0.0 0.0 0.0 0.0 0.0 0.0 0.0 0.0 0.0 0.0 0.0 Egypt 405.6 0.0 0.0 0.0 0.0 0.0 0.0 0.0 0.0 0.0 0.0 0.0 0.0 0.0 Jordan 576.3 0.0 0.0 0.0 0.0 0.0 0.0 0.0 0.0 0.0 0.0 0.0 0.0 0.0

State of Food and Agriculture in Syria 2010
352
Table A6.13. Continued
Item Energy Protein Fat
Carbo- hydrate
Vitamin A
Vitamin C
Vitamin B1
Vitamin B2
Vitamin B6
Vitamin B12
Calcium Sodium Iron Iodine
kcal g g g microg
RE mg mg mg mg microg mg mg mg microg
Alcoholic beverages (continued)
Kuwait 0.0 0.0 0.0 0.0 0.0 0.0 0.0 0.0 0.0 0.0 0.0 0.0 0.0 0.0 Lebanon 892.2 4.1 0.0 0.0 0.0 0.0 0.0 0.0 0.0 0.0 0.0 0.0 0.0 0.0 Morocco 497.7 0.0 0.0 0.0 0.0 0.0 0.0 0.0 0.0 0.0 0.0 0.0 0.0 0.0 Saudi Arabia 486.7 0.0 0.0 0.0 0.0 0.0 0.0 0.0 0.0 0.0 0.0 0.0 0.0 0.0 Tunisia 550.0 5.0 0.0 0.0 0.0 0.0 0.0 0.0 0.0 0.0 0.0 0.0 0.0 0.0 USA 576.3 2.6 0.0 0.0 0.0 0.0 0.0 0.0 0.0 0.0 0.0 0.0 0.0 0.0 EU 660.3 3.1 0.0 0.0 0.0 0.0 0.0 0.0 0.0 0.0 0.0 0.0 0.0 0.0 World 765.5 3.3 0.0 0.0 0.0 0.0 0.0 0.0 0.0 0.0 0.0 0.0 0.0 0.0 Others Syria 2,149.7 100.8 179.1 124.0 40.0 5.3 0.1 1.2 1.7 0.0 370.0 1,000.0 16.0 17.3 Egypt 552.0 27.0 18.0 124.0 40.0 5.3 0.1 1.2 1.7 0.0 370.0 1,000.0 16.0 17.3 Jordan 2,241.2 96.1 185.7 124.0 40.0 5.3 0.1 1.2 1.7 0.0 370.0 1,000.0 16.0 17.3 Kuwait 2,148.0 87.2 159.9 124.0 40.0 5.3 0.1 1.2 1.7 0.0 370.0 1,000.0 16.0 17.3 Lebanon 1,653.9 70.3 131.2 124.0 40.0 5.3 0.1 1.2 1.7 0.0 370.0 1,000.0 16.0 17.3 Morocco 2,010.1 84.6 137.5 124.0 40.0 5.3 0.1 1.2 1.7 0.0 370.0 1,000.0 16.0 17.3 Saudi Arabia 1,868.8 96.4 119.7 124.0 100.0 5.3 0.1 1.2 1.7 0.0 370.0 1,000.0 16.0 17.3 Tunisia 2,033.6 99.1 146.0 124.0 40.0 5.3 0.1 1.2 1.7 0.0 370.0 1,000.0 16.0 17.3 USA 2,420.1 119.0 184.5 124.0 40.0 5.3 0.1 1.2 1.7 0.0 370.0 1,000.0 16.0 17.3 EU 1,133.7 118.9 49.8 124.0 40.0 5.3 0.1 1.2 1.7 0.0 370.0 1,000.0 16.0 17.3 World 1,317.1 48.0 48.0 124.0 40.0 5.3 0.1 1.2 1.7 0.0 370.0 1,000.0 16.0 17.3 Source: Elaborated from FAO and USDA statistics. kcal: kilocalorie; g: gram; mg: milligram; microg: microgram; RE: retinol equivalent.

State of Food and Agriculture in Syria 2010
353
Table A6.14. Food composition per 1000 g by commodities
Item Energy Protein Fat
Carbo- hydrate
Vitamin A
Vitamin C
Vitamin B1
Vitamin B2
Vitamin B6
Vitamin B12
Calcium Sodium Iron Iodine
kcal g g g I.E mg mg mg mg microg mg mg mg microg Grains Bread 2,490.0 82.0 12.0 480.0 0.0 0.0 2.6 2.1 1.8 0.0 360.0 5,200.0 24.0 172.9 Wheat 3,340.0 120.0 23.0 610.0 0.0 0.0 6.0 0.5 0.5 0.0 440.0 78.0 30.0 15.4 Flour 3,640.0 109.0 11.0 710.0 0.0 0.0 4.0 3.2 4.0 0.0 380.0 20.0 46.7 15.4 Bulgur 3,450.0 123.0 20.0 700.0 0.0 0.0 0.0 0.0 0.0 0.0 700.0 260.0 40.0 15.4 Free rice 3,570.0 75.0 18.0 790.0 0.0 0.0 0.5 0.7 1.5 0.0 240.0 51.1 10.0 146.5 Freekeh 78 3,550.0 102.0 22.5 716.0 0.0 0.0 0.0 0.0 0.0 0.0 700.0 260.0 40.0 15.4 Macaroni 3,670.0 110.0 11.0 725.0 0.0 0.0 1.3 0.7 0.0 0.0 220.0 120.0 10.0 34.8 Noodles 3,670.0 110.0 11.0 725.0 0.0 0.0 1.3 0.7 0.0 0.0 220.0 120.0 10.0 34.8 Grain cake 3,860.0 92.0 55.0 729.0 0.0 0.0 0.2 0.0 0.9 0.0 500.0 2,500.0 16.0 172.9 Maize 3,560.0 95.0 43.0 630.0 5,000.0 0.0 2.5 2.4 0.0 0.0 190.0 100.0 70.0 0.0 Coupon rice 3,570.0 75.0 18.0 790.0 0.0 0.0 0.5 0.7 1.5 0.0 240.0 51.1 10.0 146.5 Semolina 3,470.0 96.0 5.0 720.0 0.0 0.0 1.5 0.4 0.8 0.0 700.0 10.0 10.0 15.4 Starch 3,620.0 5.0 3.0 840.0 0.0 0.0 4.0 3.2 4.0 0.0 380.0 50.0 47.0 15.4 Legumes Lentils 3,460.0 242.0 18.0 520.0 1,750.0 0.0 5.0 3.2 0.0 0.0 1,000.0 30.0 90.0 7.0 Crushed lentils 3,642.1 254.7 18.9 547.4 1,750.0 0.0 5.0 3.2 0.0 0.0 1,000.0 30.0 90.0 7.0 Dry broad beans 3,430.0 234.0 20.0 440.0 0.0 15.0 0.0 2.5 0.0 0.0 1,100.0 250.0 100.0 7.0 Chickpeas 3,580.0 201.0 45.0 226.7 4,000.0 20.0 2.0 3.0 0.0 0.0 800.0 500.0 100.0 7.0 Dry haricot beans 3,410.0 221.0 17.0 520.0 0.0 20.0 6.0 2.4 2.8 0.0 1,500.0 10.0 100.0 7.0 Meat Sheep meat 2,630.0 135.0 228.0 3.0 500.0 20.0 2.0 2.7 2.0 20.9 110.0 840.0 30.0 26.0 Goat meat 1,230.0 140.0 70.0 10.0 0.0 0.0 2.5 2.5 0.9 20.9 110.0 700.0 100.0 26.0 Cattle meat 2,645.9 169.0 210.0 0.0 0.0 0.0 1.0 1.2 2.9 23.3 90.0 0.0 30.0 26.0 Camel meat 1,740.0 127.0 132.0 0.0 0.0 0.0 2.5 2.5 0.9 20.9 110.0 700.0 30.0 26.0 Canned red meat 2,330.0 250.0 140.0 0.0 0.0 0.0 0.2 1.9 0.9 23.3 71.1 17,000.0 40.0 147.4 Poultry meat 1,220.0 123.0 77.0 0.0 280.0 10.9 0.4 0.9 2.4 2.2 75.6 480.0 30.0 29.0 Turkey meat 1,260.0 161.0 63.0 0.7 813.3 1.6 0.4 1.6 3.3 12.9 120.0 660.0 40.0 29.0 Source: Elaborated from FAO statistics, Mahmalji Rateb (1981-1982) and Aljabery Lamia (1984). kcal: kilocalorie; g: gram; mg: milligram; microg: microgram; I.E = International Equivalent = 0.03 RE: retinol equivalent.
78 Crushed wheat.
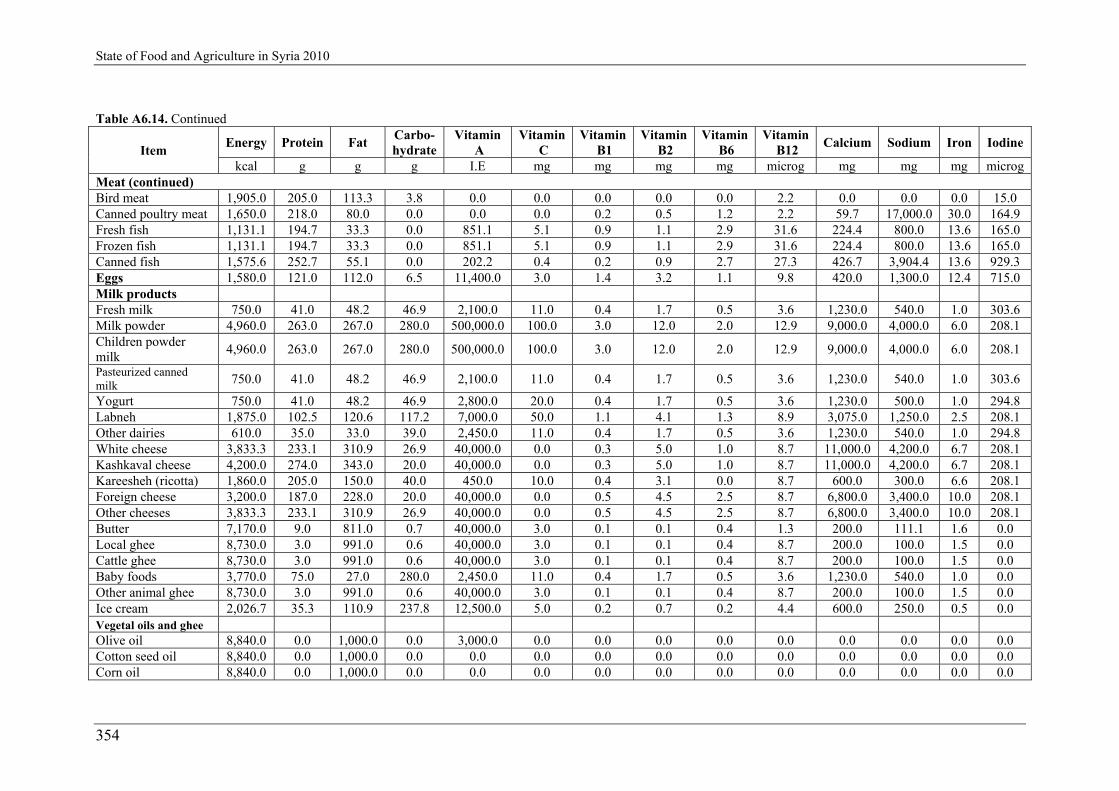
State of Food and Agriculture in Syria 2010
354
Table A6.14. Continued
Item Energy Protein Fat
Carbo- hydrate
Vitamin A
Vitamin C
Vitamin B1
Vitamin B2
Vitamin B6
Vitamin B12
Calcium Sodium Iron Iodine
kcal g g g I.E mg mg mg mg microg mg mg mg microg Meat (continued)Bird meat 1,905.0 205.0 113.3 3.8 0.0 0.0 0.0 0.0 0.0 2.2 0.0 0.0 0.0 15.0 Canned poultry meat 1,650.0 218.0 80.0 0.0 0.0 0.0 0.2 0.5 1.2 2.2 59.7 17,000.0 30.0 164.9 Fresh fish 1,131.1 194.7 33.3 0.0 851.1 5.1 0.9 1.1 2.9 31.6 224.4 800.0 13.6 165.0 Frozen fish 1,131.1 194.7 33.3 0.0 851.1 5.1 0.9 1.1 2.9 31.6 224.4 800.0 13.6 165.0 Canned fish 1,575.6 252.7 55.1 0.0 202.2 0.4 0.2 0.9 2.7 27.3 426.7 3,904.4 13.6 929.3 Eggs 1,580.0 121.0 112.0 6.5 11,400.0 3.0 1.4 3.2 1.1 9.8 420.0 1,300.0 12.4 715.0 Milk products Fresh milk 750.0 41.0 48.2 46.9 2,100.0 11.0 0.4 1.7 0.5 3.6 1,230.0 540.0 1.0 303.6 Milk powder 4,960.0 263.0 267.0 280.0 500,000.0 100.0 3.0 12.0 2.0 12.9 9,000.0 4,000.0 6.0 208.1 Children powder milk
4,960.0 263.0 267.0 280.0 500,000.0 100.0 3.0 12.0 2.0 12.9 9,000.0 4,000.0 6.0 208.1
Pasteurized canned milk 750.0 41.0 48.2 46.9 2,100.0 11.0 0.4 1.7 0.5 3.6 1,230.0 540.0 1.0 303.6
Yogurt 750.0 41.0 48.2 46.9 2,800.0 20.0 0.4 1.7 0.5 3.6 1,230.0 500.0 1.0 294.8 Labneh 1,875.0 102.5 120.6 117.2 7,000.0 50.0 1.1 4.1 1.3 8.9 3,075.0 1,250.0 2.5 208.1 Other dairies 610.0 35.0 33.0 39.0 2,450.0 11.0 0.4 1.7 0.5 3.6 1,230.0 540.0 1.0 294.8 White cheese 3,833.3 233.1 310.9 26.9 40,000.0 0.0 0.3 5.0 1.0 8.7 11,000.0 4,200.0 6.7 208.1 Kashkaval cheese 4,200.0 274.0 343.0 20.0 40,000.0 0.0 0.3 5.0 1.0 8.7 11,000.0 4,200.0 6.7 208.1 Kareesheh (ricotta) 1,860.0 205.0 150.0 40.0 450.0 10.0 0.4 3.1 0.0 8.7 600.0 300.0 6.6 208.1 Foreign cheese 3,200.0 187.0 228.0 20.0 40,000.0 0.0 0.5 4.5 2.5 8.7 6,800.0 3,400.0 10.0 208.1 Other cheeses 3,833.3 233.1 310.9 26.9 40,000.0 0.0 0.5 4.5 2.5 8.7 6,800.0 3,400.0 10.0 208.1 Butter 7,170.0 9.0 811.0 0.7 40,000.0 3.0 0.1 0.1 0.4 1.3 200.0 111.1 1.6 0.0 Local ghee 8,730.0 3.0 991.0 0.6 40,000.0 3.0 0.1 0.1 0.4 8.7 200.0 100.0 1.5 0.0 Cattle ghee 8,730.0 3.0 991.0 0.6 40,000.0 3.0 0.1 0.1 0.4 8.7 200.0 100.0 1.5 0.0 Baby foods 3,770.0 75.0 27.0 280.0 2,450.0 11.0 0.4 1.7 0.5 3.6 1,230.0 540.0 1.0 0.0 Other animal ghee 8,730.0 3.0 991.0 0.6 40,000.0 3.0 0.1 0.1 0.4 8.7 200.0 100.0 1.5 0.0 Ice cream 2,026.7 35.3 110.9 237.8 12,500.0 5.0 0.2 0.7 0.2 4.4 600.0 250.0 0.5 0.0 Vegetal oils and ghee Olive oil 8,840.0 0.0 1,000.0 0.0 3,000.0 0.0 0.0 0.0 0.0 0.0 0.0 0.0 0.0 0.0 Cotton seed oil 8,840.0 0.0 1,000.0 0.0 0.0 0.0 0.0 0.0 0.0 0.0 0.0 0.0 0.0 0.0 Corn oil 8,840.0 0.0 1,000.0 0.0 0.0 0.0 0.0 0.0 0.0 0.0 0.0 0.0 0.0 0.0

State of Food and Agriculture in Syria 2010
355
Table A6.14. Continued
Item Energy Protein Fat
Carbo- hydrate
Vitamin A
Vitamin C
Vitamin B1
Vitamin B2
Vitamin B6
Vitamin B12
Calcium Sodium Iron Iodine
kcal g g g I.E mg mg mg mg microg mg mg mg microg Vegetal oils and ghee (continued) Other vegetal oils 8,840.0 0.0 1,000.0 0.0 0.0 0.0 0.0 0.0 0.0 0.0 0.0 0.0 0.0 0.0 Vegetal ghee 7,900.0 5.1 850.0 5.1 0.0 0.0 0.0 0.0 0.0 0.0 0.0 4,500.0 0.0 0.0 Vegetables Tomatoes 170.0 8.0 2.0 42.7 11,000.0 230.0 0.6 0.4 0.7 0.0 120.0 82.2 6.0 20.7 Potatoes 670.0 16.0 1.0 181.3 400.0 230.0 1.0 0.4 2.7 0.0 170.0 60.0 7.6 7.0 Green haricot beans 500.0 30.0 4.0 70.0 10,000.0 120.0 0.7 1.0 2.0 0.0 400.0 12.0 10.0 20.7 Green okra 310.0 16.0 3.0 42.7 11,000.0 230.0 0.6 0.4 0.7 0.0 120.0 82.2 6.0 20.7 Green kidney beans 310.0 21.0 2.0 170.0 5,500.0 230.0 3.0 1.8 1.8 0.0 250.0 9.0 20.0 20.7 Squash 190.0 9.0 1.0 8.9 80,514.1 70.0 0.7 0.5 3.0 0.0 100.0 50.0 3.0 20.7 Eggplants 210.0 9.0 1.0 42.7 11,000.0 230.0 0.6 0.4 0.7 0.0 120.0 82.2 6.0 20.7 Green broad beans 882.0 63.0 10.0 144.0 0.0 188.0 0.0 2.0 0.0 0.0 344.0 5.0 31.0 0.0 Cabbage 220.0 14.0 5.0 30.0 1,000.0 200.0 0.6 2.0 0.0 0.0 500.0 730.0 5.0 20.7 Cauliflowers 310.0 25.0 3.4 45.5 900.0 600.0 1.5 1.3 2.0 0.0 400.0 200.0 10.0 20.7 Green peas 310.0 21.0 2.0 45.5 700.0 250.0 3.0 1.8 1.8 0.0 250.0 9.0 20.0 20.7 Dry onion 310.0 11.0 2.0 78.2 500.0 120.0 0.4 0.2 0.6 0.0 320.0 26.7 5.0 20.7 Green pepper 240.0 12.0 2.0 53.0 6,300.0 1,200.0 0.7 0.4 0.0 0.0 110.0 10.0 4.0 20.7 Cucumber 130.0 5.0 1.0 8.9 2,000.0 70.0 0.7 0.5 3.0 0.0 100.0 50.0 3.0 20.7 Carrots 380.0 9.0 2.0 90.9 120,000.0 83.3 0.9 0.4 2.0 0.0 400.0 480.0 4.4 20.7 Spinach 160.0 21.0 3.0 39.0 80,000.0 200.0 0.8 2.0 8.0 0.0 900.0 850.0 30.0 103.8 Jew's mallow 320.0 10.0 3.0 65.0 0.0 60.0 0.6 0.5 0.0 0.0 320.0 1,100.0 10.0 103.8 Beet 350.0 12.0 1.0 70.0 500.0 80.0 0.5 1.1 1.0 0.0 300.0 110.0 30.0 20.7 Turnip 380.0 27.0 2.0 63.0 0.0 280.0 0.6 0.6 1.0 0.0 740.0 385.0 10.0 20.7 Dry garlic 1,300.0 55.0 4.0 769.2 500.0 120.0 0.4 0.2 0.6 0.0 320.0 26.7 5.0 20.7 Green onion 240.0 17.0 1.0 78.2 500.0 120.0 0.3 0.2 1.1 0.0 182.2 26.7 2.0 20.7 Radish 325.0 19.0 1.0 55.0 300.0 240.0 1.0 1.1 1.8 0.0 1,000.0 80.0 20.0 20.7 Lettuce 120.0 11.0 2.0 20.0 5,400.0 80.0 0.6 1.0 2.0 0.0 300.0 120.0 5.0 103.8 Green mint 270.0 23.0 3.5 34.0 0.0 0.0 0.2 2.3 0.0 0.0 70.0 180.0 0.0 103.8 Parsley 144.4 6.7 1.3 32.7 180,000.0 62.9 0.4 0.4 0.9 0.0 357.8 780.0 3.6 103.8 Green coriander 270.0 23.0 3.5 34.0 0.0 0.0 0.0 0.0 0.0 0.0 70.0 180.0 0.0 103.8 Endive (chicory) 195.0 16.5 1.0 33.0 30,000.0 150.0 0.1 0.1 0.0 0.0 1,000.0 200.0 250.0 103.8 Pumpkin 190.0 9.0 1.0 69.0 80,514.1 50.1 0.5 0.1 0.4 0.0 69.4 358.0 2.1 103.8

State of Food and Agriculture in Syria 2010
356
Table A6.14. Continued
Item Energy Protein Fat
Carbo- hydrate
Vitamin A
Vitamin C
Vitamin B1
Vitamin B2
Vitamin B6
Vitamin B12
Calcium Sodium Iron Iodine
kcal g g g I.E mg mg mg mg microg mg mg mg microg Vegetables (continued)Leaf beet 320.0 10.0 3.0 65.0 0.0 60.0 0.6 0.5 0.0 0.0 320.0 1,100.0 10.0 103.8 Dried vegetables 1,525.5 75.6 16.0 239.9 4,375.0 0.0 1.9 1.9 0.2 0.0 1,316.0 6,170.1 58.1 529.3 Canned vegetables 360.0 14.0 3.0 59.8 16,625.0 102.5 0.7 0.5 0.6 0.0 202.5 2,420.0 10.5 529.3 Tomato paste 840.0 38.0 9.0 192.0 88,000.0 1,035.0 2.7 1.8 3.0 0.0 540.0 657.8 27.0 529.3 Water melon 170.0 3.0 2.0 69.0 5,900.0 60.0 0.5 0.5 0.0 0.0 120.0 358.0 6.0 20.7 Musk melon 170.0 4.0 1.0 69.0 5,900.0 60.0 0.5 0.5 0.0 0.0 120.0 358.0 6.0 20.7 Pickles 360.0 14.0 3.0 59.8 16,625.0 102.5 0.7 0.5 0.6 0.0 202.5 2,420.0 10.5 529.3 Fruits Orange 340.0 7.0 1.0 86.4 1,900.0 391.6 0.7 0.2 1.2 0.0 293.3 1,331.1 0.7 7.9 Mandarin 400.0 8.0 1.0 54.0 5,200.0 250.0 0.7 0.3 1.2 0.0 1,200.0 4,600.0 0.6 7.9 Clementine 400.0 8.0 1.0 54.0 5,200.0 250.0 0.7 0.3 1.2 0.0 1,200.0 4,600.0 0.6 7.9 Lemon 400.0 8.0 1.0 86.4 1,900.0 0.0 0.7 0.3 1.2 0.0 1,200.0 1,331.1 0.6 7.9 Grapefruit 160.0 3.0 1.0 40.0 600.0 170.0 0.2 0.2 0.4 0.0 150.0 20.0 0.4 7.9 Pomegranates 160.0 3.0 1.0 40.0 600.0 0.0 0.2 0.2 0.4 0.0 150.0 358.0 0.4 7.9 Grapes 530.0 5.0 4.0 129.8 800.0 60.2 0.7 0.4 0.9 0.0 170.0 20.0 2.0 7.9 Figs 730.0 8.0 3.0 161.0 750.0 20.0 0.4 0.3 1.0 0.0 425.5 21.9 6.1 7.9 Apricots 450.0 13.0 4.0 92.5 27,900.0 80.0 0.3 0.5 0.0 0.0 150.0 6.0 20.0 7.9 Plums 520.0 7.0 6.0 123.0 3,500.0 50.0 1.5 0.4 0.0 0.0 200.0 0.0 30.0 7.9 Peaches 330.0 5.0 1.0 81.0 8,800.0 85.0 0.2 0.5 0.3 0.0 80.0 5.0 6.0 7.9 Pears 540.0 4.0 4.0 145.0 200.0 45.0 0.3 0.5 1.5 0.0 150.0 30.0 20.0 7.9 Cherries 650.0 11.0 9.0 135.0 10,000.0 80.0 0.5 0.6 0.2 0.0 130.0 20.0 15.0 7.9 Bananas 600.0 7.0 3.0 185.0 4,300.0 59.6 0.9 0.7 5.0 0.0 90.0 7.5 2.0 7.9 Apples 480.0 1.0 3.0 141.3 1,050.0 52.9 0.2 0.2 1.6 0.0 80.0 20.0 1.8 7.9 Japanese quince 350.0 2.0 1.0 81.0 8,800.0 85.0 0.2 0.5 0.3 0.0 80.0 5.0 6.0 7.9 Dates 2,800.0 16.0 4.0 660.0 2,000.0 0.0 0.6 0.5 1.3 0.0 500.0 9.0 20.0 7.9 Canned fruits 360.0 5.0 2.0 40.0 3,000.0 0.0 0.3 0.8 0.0 0.0 870.0 24,000.0 0.0 7.9 Dried fruits 2,670.0 28.0 6.0 646.5 550.0 25.0 1.4 0.8 2.0 0.0 1,400.0 325.0 40.0 7.9 Pistachios 2,890.0 103.0 242.0 146.0 3,600.0 0.0 0.0 1.5 0.0 0.0 877.8 151.1 20.0 95.9 Peanut 5,024.4 224.2 436.7 146.0 3,600.0 2.9 3.0 1.5 2.9 0.0 877.8 151.1 20.0 95.9 Almonds 2,360.0 80.0 209.0 196.0 0.0 0.0 2.5 6.7 0.0 0.0 877.8 151.1 40.7 95.9 Walnuts 2,890.0 64.0 278.0 156.0 300.0 30.0 2.6 1.4 10.0 0.0 830.0 20.0 21.0 95.9

State of Food and Agriculture in Syria 2010
357
Table A6.14. Continued
Item Energy Protein Fat
Carbo- hydrate
Vitamin A
Vitamin C
Vitamin B1
Vitamin B2
Vitamin B6
Vitamin B12
Calcium Sodium Iron Iodine
kcal g g g I.E mg mg mg mg microg mg mg mg microg Fruits (continued)Marmalade and jams 2,800.0 5.0 0.0 700.0 100.0 60.0 0.2 0.2 0.0 0.0 120.0 130.0 3.0 7.9 Treacle 2,800.0 10.0 0.0 700.0 0.0 0.0 0.0 0.0 0.0 0.0 2,000.0 430.0 0.0 7.9 Olives 1,750.0 13.0 175.0 40.0 3,000.0 0.0 0.3 0.8 0.0 0.0 870.0 24,000.0 0.0 7.9 Juice 600.0 5.0 1.0 132.2 1,000.0 291.8 0.4 0.2 0.7 0.0 124.0 24.0 1.3 7.9 Condensed juice 1,200.0 10.0 2.0 264.4 2,000.0 583.6 0.8 0.4 1.5 0.0 248.0 48.0 2.7 7.9 Dried juice 2,400.0 20.0 4.0 528.8 4,000.0 1,167.1 1.6 0.8 3.0 0.0 496.0 96.0 5.3 7.9 Sweets and sweeteners Free sugar 3,870.0 0.0 0.0 996.0 0.0 0.0 0.0 0.0 0.0 0.0 0.0 3.0 0.0 0.0 Coupon sugar 3,870.0 0.0 0.0 996.0 0.0 0.0 0.0 0.0 0.0 0.0 0.0 3.0 0.0 0.0 Honey 2,980.0 4.0 0.0 700.0 0.0 0.0 1.2 0.4 0.0 0.0 2,000.0 430.0 0.0 0.0 Halawa79 4,669.7 76.6 257.3 441.1 534.3 0.0 2.3 1.6 1.9 0.0 425.1 225.5 40.0 0.0 Chocolate 5,400.0 64.0 37.0 585.0 45.0 0.0 0.2 2.8 0.0 0.0 800.0 560.0 9.0 0.0 Candies (confectionaries) 2,840.0 0.0 0.0 770.0 0.0 0.0 0.0 0.2 0.0 0.0 71.1 933.3 1.6 0.0 Raha (starch and sugar) 3,745.0 2.5 1.5 923.4 0.0 0.0 2.0 1.6 2.0 0.0 190.0 26.5 23.5 0.0 Mlabas (sugar and almonds)
4,880.0 100.0 261.0 808.4 0.0 10.0 2.0 1.1 5.0 0.0 1,435.6 100.6 25.3 0.0
Mabromeh (pistachios and others)
5,400.0 100.0 402.0 808.4 0.0 0.0 0.0 0.2 0.0 0.0 71.1 933.3 1.6 0.0
Buklawa 5,400.0 100.0 402.0 808.4 0.0 0.0 0.0 0.2 0.0 0.0 71.1 933.3 1.6 0.0 Kataief 3,690.0 74.0 17.0 770.0 0.0 0.0 0.0 0.2 0.0 0.0 71.1 933.3 1.6 0.0 Awameh 3,690.0 74.0 17.0 770.0 0.0 0.0 0.0 0.2 0.0 0.0 71.1 933.3 1.6 0.0 Knafeh with cheese 3,690.0 74.0 17.0 770.0 0.0 0.0 0.0 0.2 0.0 0.0 71.1 933.3 1.6 0.0 Shaibiat 3,690.0 74.0 17.0 770.0 0.0 0.0 0.0 0.2 0.0 0.0 71.1 933.3 1.6 0.0 Kraibeh 3,690.0 74.0 17.0 770.0 0.0 0.0 0.0 0.2 0.0 0.0 71.1 933.3 1.6 0.0 Barazek 3,690.0 74.0 17.0 770.0 0.0 0.0 0.0 0.2 0.0 0.0 71.1 933.3 1.6 0.0 Akras with dates 3,690.0 74.0 17.0 770.0 0.0 0.0 0.0 0.2 0.0 0.0 71.1 933.3 1.6 0.0 Maamoul with nuts 3,690.0 74.0 17.0 770.0 0.0 0.0 0.0 0.2 0.0 0.0 71.1 933.3 1.6 0.0 Other Arabic sweets 3,690.0 74.0 17.0 770.0 0.0 0.0 0.0 0.2 0.0 0.0 71.1 933.3 1.6 0.0 Kato (round cake) 3,690.0 74.0 17.0 770.0 0.0 0.0 0.0 0.2 0.0 0.0 71.1 933.3 1.6 0.0
79 Or halva: sweet made of tahini (sesame paste) and sugar.

State of Food and Agriculture in Syria 2010
358
Table A6.14. Continued
Item Energy Protein Fat
Carbo- hydrate
Vitamin A
Vitamin C
Vitamin B1
Vitamin B2
Vitamin B6
Vitamin B12
Calcium Sodium Iron Iodine
kcal g g g I.E mg mg mg mg microg mg mg mg microg Sweets and sweeteners (continued) Bitifour 3,690.0 74.0 17.0 770.0 0.0 0.0 0.0 0.2 0.0 0.0 71.1 933.3 1.6 0.0 Foreign sweets 3,690.0 74.0 17.0 770.0 0.0 0.0 0.0 0.2 0.0 0.0 71.1 933.3 1.6 0.0 Others Sesame 4,465.0 104.0 320.0 120.0 50.0 0.0 1.2 0.4 0.1 0.0 64.0 680.0 75.0 0.0 Tahini 4,465.0 104.0 320.0 120.0 50.0 0.0 1.2 0.4 0.1 0.0 64.0 680.0 75.0 0.0 Zaatar 0.0 0.0 0.0 0.0 0.0 0.0 0.0 0.0 0.0 0.0 0.0 0.0 0.0 0.0 Tea 560.0 8.0 0.0 100.0 0.2 1.5 2.5 0.1 0.0 0.0 20.0 20.0 0.4 0.0 Coffee 560.0 80.0 0.0 18.0 0.2 0.0 0.0 0.0 0.0 0.0 20.0 20.0 0.4 0.0 Mate 400.0 100.0 0.0 18.0 0.2 0.0 0.0 0.0 0.0 0.0 20.0 20.0 0.4 0.0 Cocoa 4,000.0 90.0 188.0 310.0 0.0 0.0 0.9 4.5 0.0 0.0 1,100.0 570.0 25.0 0.0 Salt 0.0 0.0 0.0 0.0 0.0 0.0 0.0 0.0 0.0 0.0 290 373,504.3 0.0 1,000.0 Drinks Gaseous beverages 500.0 5.0 0.0 120.0 0.0 0.0 0.0 0.0 0.0 0.0 0.0 20.0 0.0 0.0 Mineral water 0.0 0.0 0.0 0.0 0.0 0.0 0.0 0.0 0.0 0.0 36.0 2.5 0.0 0.0 Wine 680.0 0.0 0.0 160.0 0.0 0.0 0.1 0.1 0.2 0.0 100.0 50.0 20.0 0.0 Arak 2,500.0 0.0 0.0 0.0 0.0 0.0 0.0 0.0 0.0 0.0 0.0 0.0 0.0 0.0 Local drinks 2,500.0 0.0 0.0 0.0 0.0 0.0 0.0 0.0 0.0 0.0 0.0 0.0 0.0 0.0 Foreign drinks 1,845.0 1.0 0.0 55.0 0.0 0.0 0.0 0.0 0.0 0.0 55.0 10.0 0.0 0.0 Drink water 0.0 0.0 0.0 0.0 0.0 0.0 0.0 0.0 0.0 0.0 0.0 0.0 0.0 0.0
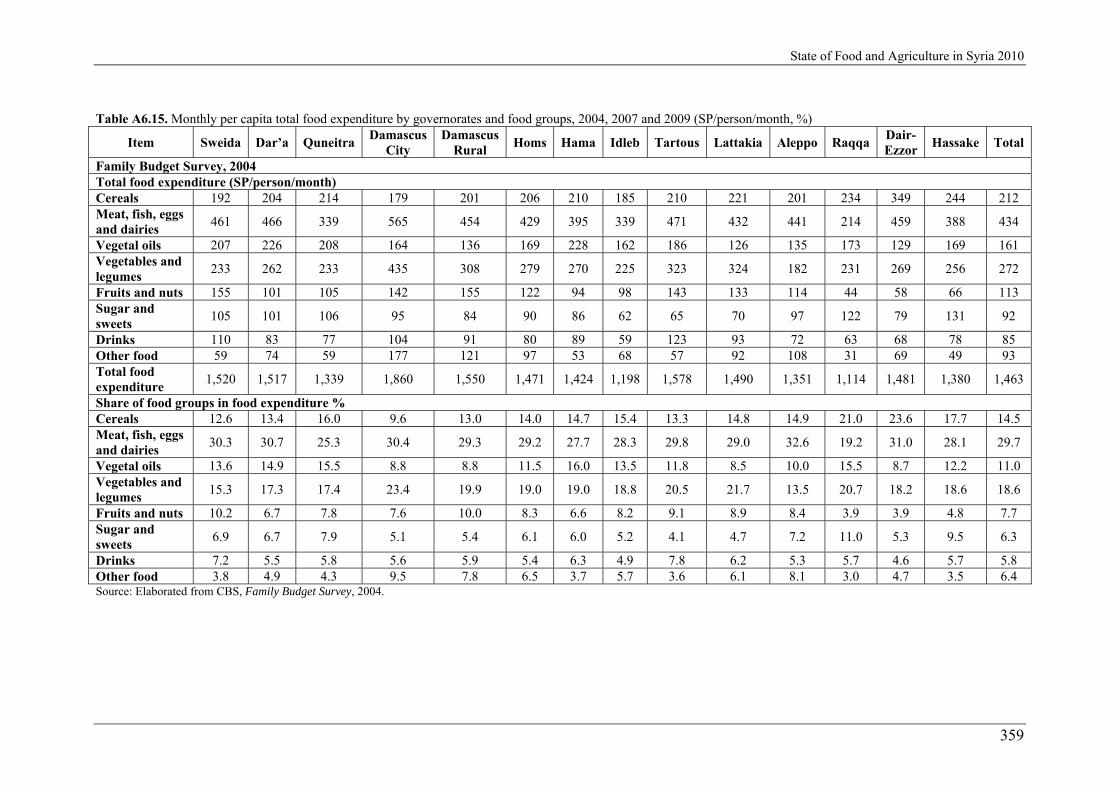
State of Food and Agriculture in Syria 2010
359
Table A6.15. Monthly per capita total food expenditure by governorates and food groups, 2004, 2007 and 2009 (SP/person/month, %)
Item Sweida Dar’a Quneitra Damascus
City Damascus
Rural Homs Hama Idleb Tartous Lattakia Aleppo Raqqa
Dair- Ezzor
Hassake Total
Family Budget Survey, 2004 Total food expenditure (SP/person/month) Cereals 192 204 214 179 201 206 210 185 210 221 201 234 349 244 212 Meat, fish, eggs and dairies
461 466 339 565 454 429 395 339 471 432 441 214 459 388 434
Vegetal oils 207 226 208 164 136 169 228 162 186 126 135 173 129 169 161 Vegetables and legumes
233 262 233 435 308 279 270 225 323 324 182 231 269 256 272
Fruits and nuts 155 101 105 142 155 122 94 98 143 133 114 44 58 66 113 Sugar and sweets
105 101 106 95 84 90 86 62 65 70 97 122 79 131 92
Drinks 110 83 77 104 91 80 89 59 123 93 72 63 68 78 85 Other food 59 74 59 177 121 97 53 68 57 92 108 31 69 49 93 Total food expenditure
1,520 1,517 1,339 1,860 1,550 1,471 1,424 1,198 1,578 1,490 1,351 1,114 1,481 1,380 1,463
Share of food groups in food expenditure % Cereals 12.6 13.4 16.0 9.6 13.0 14.0 14.7 15.4 13.3 14.8 14.9 21.0 23.6 17.7 14.5 Meat, fish, eggs and dairies
30.3 30.7 25.3 30.4 29.3 29.2 27.7 28.3 29.8 29.0 32.6 19.2 31.0 28.1 29.7
Vegetal oils 13.6 14.9 15.5 8.8 8.8 11.5 16.0 13.5 11.8 8.5 10.0 15.5 8.7 12.2 11.0 Vegetables and legumes
15.3 17.3 17.4 23.4 19.9 19.0 19.0 18.8 20.5 21.7 13.5 20.7 18.2 18.6 18.6
Fruits and nuts 10.2 6.7 7.8 7.6 10.0 8.3 6.6 8.2 9.1 8.9 8.4 3.9 3.9 4.8 7.7 Sugar and sweets
6.9 6.7 7.9 5.1 5.4 6.1 6.0 5.2 4.1 4.7 7.2 11.0 5.3 9.5 6.3
Drinks 7.2 5.5 5.8 5.6 5.9 5.4 6.3 4.9 7.8 6.2 5.3 5.7 4.6 5.7 5.8 Other food 3.8 4.9 4.3 9.5 7.8 6.5 3.7 5.7 3.6 6.1 8.1 3.0 4.7 3.5 6.4 Source: Elaborated from CBS, Family Budget Survey, 2004.

State of Food and Agriculture in Syria 2010
360
Table A6.15. Continued
Item Sweida Dar’a Quneitra Damascus
City Damascus
Rural Homs Hama Idleb Tartous Lattakia Aleppo Raqqa
Dair- Ezzor
Hassake Total
Family Budget Survey, 2007 Total food expenditure (SP/person/month)Cereals 239 268 290 184 214 231 248 215 228 245 212 255 245 226 235 Meat, fish, eggs and dairies
730 637 511 658 554 653 734 596 831 596 475 206 628 751 614
Vegetal oils 180 318 351 142 169 167 250 292 197 147 139 218 147 187 203 Vegetables and legumes
388 428 308 374 358 378 406 321 493 419 231 345 339 420 376
Fruits and nuts 267 138 64 165 141 158 190 228 292 172 143 50 105 172 166 Sugar and sweets
175 195 280 191 81 121 127 120 145 103 167 261 99 121 150
Drinks 147 110 97 115 117 107 148 83 160 112 101 89 83 104 112 Other food 128 139 93 207 168 121 187 249 217 238 227 142 109 284 185 Total food expenditure
2,254 2,232 1,993 2,037 1,802 1,937 2,290 2,105 2,562 2,031 1,695 1,567 1,753 2,265 2,040
Share of food groups in food expenditure % Cereals 10.6 12.0 14.6 9.0 11.9 11.9 10.8 10.2 8.9 12.1 12.5 16.3 14.0 10.0 11.5 Meat, fish, eggs and dairies
32.4 28.5 25.6 32.3 30.7 33.7 32.1 28.3 32.4 29.3 28.0 13.1 35.8 33.2 30.1
Vegetal oils 8.0 14.2 17.6 7.0 9.4 8.6 10.9 13.9 7.7 7.2 8.2 13.9 8.4 8.3 10.0 Vegetables and legumes
17.2 19.2 15.5 18.4 19.9 19.5 17.7 15.2 19.2 20.6 13.6 22.0 19.3 18.5 18.4
Fruits and nuts 11.8 6.2 3.2 8.1 7.8 8.2 8.3 10.8 11.4 8.5 8.4 3.2 6.0 7.6 8.1 Sugar and sweets
7.8 8.7 14.0 9.4 4.5 6.2 5.5 5.7 5.7 5.1 9.9 16.7 5.6 5.3 7.4
Drinks 6.5 4.9 4.9 5.6 6.5 5.5 6.5 3.9 6.2 5.5 6.0 5.7 4.7 4.6 5.5 Other food 5.7 6.2 4.6 10.2 9.3 6.3 8.2 11.9 8.4 11.7 13.4 9.1 6.1 12.5 9.0 Source: Elaborated from CBS, Family Budget Survey, 2007.

State of Food and Agriculture in Syria 2010
361
Table A6.15. Continued
Item Sweida Dar’a Quneitra Damascus
City Damascus
Rural Homs Hama Idleb Tartous Lattakia Aleppo Raqqa
Dair- Ezzor
Hassake Total
Family Budget Survey, 2009 Total food expenditure (SP/person/month) Cereals 315 308 401 310 319 340 319 314 372 399 357 368 337 381 341 Meat, fish, eggs and dairies
731 653 604 847 723 737 725 626 874 828 783 451 599 637 724
Vegetal oils 289 286 426 280 228 290 254 206 302 259 297 325 227 237 268 Vegetables and legumes
388 367 439 408 408 435 404 380 568 499 413 501 412 414 422
Fruits and nuts 293 130 131 229 206 193 176 164 284 264 196 86 94 92 183 Sugar and sweets
132 162 220 159 139 139 141 123 126 147 233 236 111 233 172
Drinks 159 95 115 142 112 136 131 94 199 181 136 120 102 102 128 Other food 197 214 254 465 338 279 225 182 337 424 316 230 128 200 288 Total food expenditure
2,504 2,214 2,588 2,840 2,473 2,549 2,376 2,090 3,060 3,002 2,731 2,317 2,011 2,296 2,526
Share of food groups in food expenditure % Cereals 12.6 13.9 15.5 10.9 12.9 13.3 13.4 15.0 12.2 13.3 13.1 15.9 16.8 16.6 13.5 Meat, fish, eggs and dairies
29.2 29.5 23.3 29.8 29.2 28.9 30.5 30.0 28.6 27.6 28.7 19.5 29.8 27.7 28.7
Vegetal oils 11.5 12.9 16.5 9.9 9.2 11.4 10.7 9.9 9.9 8.6 10.9 14.0 11.3 10.3 10.6 Vegetables and legumes
15.5 16.6 17.0 14.4 16.5 17.1 17.0 18.2 18.6 16.6 15.1 21.6 20.5 18.0 16.7
Fruits and nuts 11.7 5.9 5.1 8.1 8.3 7.6 7.4 7.8 9.3 8.8 7.2 3.7 4.7 4.0 7.2 Sugar and sweets
5.3 7.3 8.5 5.6 5.6 5.5 5.9 5.9 4.1 4.9 8.5 10.2 5.5 10.1 6.8
Drinks 6.3 4.3 4.4 5.0 4.5 5.3 5.5 4.5 6.5 6.0 5.0 5.2 5.1 4.4 5.1 Other food 7.9 9.6 9.7 16.4 13.7 10.9 9.5 8.8 10.9 14.2 11.6 9.9 6.4 8.7 11.4 Source: Elaborated from CBS, Family Budget Survey, 2009.

State of Food and Agriculture in Syria 2010
362
Table A6.16. Calorie intakes by countries, 1999-2008 (kcal/person/day)
Item 1999 2000 2001 Average
1999-2001 2003 2004 2005
Average 2003-2005
2006 2007 2008 Average
2006-2008 Syria 3,063 3,072 3,034 3,056 3,006 2,981 3,042 3,010 3,291 3,159 2,899 3,116 Egypt 3,378 3,375 3,408 3,387 3,375 3,241 3,334 3,317 3,466 3,396 3,431 3,431 Jordan 2,610 2,671 2,747 2,676 2,742 2,814 2,912 2,823 2,882 2,836 2,859 2,859 Kuwait 3,058 3,112 3,083 3,084 3,039 3,072 3,108 3,073 3,162 3,111 3,137 3,137 Lebanon 3,062 3,034 3,077 3,058 3,139 3,160 3,182 3,160 3,079 3,063 3,071 3,071 Morocco 3,070 3,050 3,103 3,074 3,181 3,234 3,168 3,194 3,331 3,369 3,350 3,350 Saudi Arabia 2,978 3,017 3,017 3,004 3,034 3,070 3,073 3,059 3,079 2,985 3,032 3,032 Tunisia 3,386 3,295 3,267 3,316 3,272 3,288 3,265 3,275 3,363 3,465 3,414 3,414 USA 3,683 3,789 3,764 3,745 3,795 3,829 3,855 3,826 3,985 3,981 3,983 3,983 EU 3,422 3,432 3,454 3,436 3,458 3,464 3,471 3,464 3,478 3,485 3,482 3,482 World 2,724 2,732 2,734 2,730 2,758 2,764 2,781 2,768 2,883 2,731 2,807 2,807 Source: NAPC elaboration based on FAO, USDA, AOAD and MAAR Statistics. Estimates of the countries excluding Syria for the 2006-2008 period are provisional because FAO and USDA estimates have been not published yet.
Table A6.17. Calorie intakes by Syrian governorates, 2004, 2007 and 2009 (kcal/person/day)
Item 2004 2007 2009 Change % (2004-2009)
Urban Rural Average Urban Rural Average Urban Rural Average Urban Rural Average Sweida 3,356 3,346 3,351 3,658 3,315 3,532 2,763 3,401 3,107 -17.7 1.6 -6.3 Dar'a 3,463 3,395 3,427 3,729 4,411 3,914 3,011 3,180 3,096 -13.1 -6.3 -9.7 Quneitra 0 3,246 3,246 0 4,249 4,249 0 3,973 3,973 0 22.4 22.4 Damascus City 2,778 0 2,778 2,346 0 2,346 2,586 0 2,586 -6.9 0 -6.9 Damascus Rural 2,661 2,826 2,745 2,370 2,632 2,502 2,586 2,908 2,750 -2.8 2.9 0.2 Homs 3,036 3,097 3,067 2,311 4,077 2,916 2,712 3,534 3,124 -10.7 14.1 5.5 Hama 3,248 3,665 3,470 3,399 3,786 3,548 3,080 3,390 3,236 -5.2 -7.5 -6.7 Idleb 2,663 2,759 2,711 3,292 2,803 3,156 3,008 2,798 2,905 13.0 1.4 5.2 Tartous 2,743 3,033 2,927 2,751 3,069 2,889 3,254 3,197 3,226 18.6 5.4 10.2 Lattakia 2,658 3,046 2,871 2,638 2,993 2,775 2,848 3,456 3,153 7.1 13.4 9.8 Aleppo 2,911 3,089 2,972 2,788 3,005 2,864 3,164 4,109 3,637 8.7 33.0 22.4 Raqqa 3,279 3,977 3,676 3,754 4,472 4,023 3,944 4,812 4,378 20.3 21.0 19.1 Dair-Ezzor 3,447 3,467 3,457 2,745 2,946 2,833 3,256 3,402 3,330 -5.5 -1.9 -5.2 Hassake 3,376 3,892 3,721 3,658 3,030 3,385 3,190 4,354 3,772 -5.5 11.9 1.4 Average 2,939 3,276 3,099 3,086 3,571 3,255 3,040 3,589 3,314 3.4 9.6 6.9 Source: NAPC elaboration based on CBS, Family Budget Survey, 2004, 2007 and 2009. Zero denotes that there is no rural or urban population.

State of Food and Agriculture in Syria 2010
363
Table A6.18. Protein intakes by countries, 1999-2008 (g/person/day)
Item 1999 2000 2001 Average
1999-2001 2003 2004 2005
Average 2003-2005
2006 2007 2008 Average
2006-2008 Syria 74 74 74 74 79 79 80 79 86 86 74 82 Egypt 94 95 95 95 95 92 95 94 93 93 93 93 Jordan 69 71 71 70 72 71 74 72 72 72 72 72 Kuwait 89 89 88 89 83 86 92 87 106 104 105 105 Lebanon 82 83 84 83 86 86 86 86 83 83 83 83 Morocco 83 81 84 83 87 89 87 88 90 89 90 90 Saudi Arabia 83 81 81 82 82 85 86 84 83 82 83 83 Tunisia 91 90 91 91 89 89 91 90 85 90 87 87 USA 115 115 113 114 115 117 116 116 125 124 125 125 EU 104 105 106 105 106 105 105 105 116 115 115 115 World 75 75 75 75 76 76 76 76 80 76 78 78 Source: NAPC elaboration based on FAO, USDA, AOAD and MAAR Statistics. Estimates of the countries excluding Syria for the 2006-2008 period are provisional because FAO and USDA estimates have been not published yet.
Table A6.19. Protein intakes by Syrian governorates, 2004, 2007 and 2009 (g/person/day)
Item 2004 2007 2009 Change % (2004-2009)
Urban Rural Average Urban Rural Average Urban Rural Average Urban Rural Average Sweida 86 82 83 103 100 102 86 96 93 0.0 17.1 12.0 Dar'a 92 87 89 101 126 104 83 84 83 -9.8 -3.4 -6.7 Quneitra 0 77 77 0 99 99 0 98 98 0 27.3 27.3 Damascus City 83 0 83 71 0 71 74 0 74 -10.8 0 -10.8 Damascus Rural 76 79 77 35 75 73 74 83 79 -2.6 5.1 2.6 Homs 81 83 81 76 100 84 78 98 88 -3.7 18.1 8.6 Hama 89 86 85 103 104 104 93 94 94 4.5 9.3 10.6 Idleb 73 74 74 94 79 90 86 80 83 17.8 8.1 12.2 Tartous 83 89 87 88 93 90 98 100 99 18.1 12.4 13.8 Lattakia 79 93 87 82 103 90 86 107 97 8.9 15.1 11.5 Aleppo 79 85 82 78 70 75 89 101 95 12.7 18.8 15.9 Raqqa 81 79 79 81 81 82 95 109 102 17.3 38.0 29.1 Dair-Ezzor 93 101 100 83 84 84 91 88 90 -2.2 -12.9 -10.0 Hassake 91 92 92 103 88 100 90 110 100 -1.1 19.6 8.7 Average 83 82 83 89 95 91 87 96 91 4.8 17.1 9.6 Source: NAPC elaboration based on CBS, Family Budget Survey, 2004, 2007 and 2009. Zero denotes that there is no rural or urban population.

State of Food and Agriculture in Syria 2010
364
Table A6.20. Fat intakes by countries, 1999-2008 (g/person/day)
Item 1999 2000 2001 Average
1999-2001 2003 2004 2005
Average 2003-2005
2006 2007 2008 Average
2006-2008 Syria 108 109 104 107 100 100 104 101 105 93 94 98 Egypt 58 58 57 58 60 57 56 58 78 72 75 75 Jordan 71 78 85 78 79 92 90 87 92 94 93 93 Kuwait 109 114 117 113 108 110 116 111 109 107 108 108 Lebanon 107 110 112 110 109 113 117 113 111 110 110 110 Morocco 62 60 60 61 61 59 57 59 74 79 77 77 Saudi Arabia 81 88 88 86 89 83 85 85 96 94 95 95 Tunisia 103 100 96 100 93 98 90 93 101 101 101 101 USA 146 154 157 152 160 163 169 164 162 161 161 161 EU 141 141 141 141 141 140 141 141 126 125 126 126 World 74 75 75 75 77 77 79 78 73 72 72 72 Source: NAPC elaboration based on FAO, USDA, AOAD and MAAR Statistics. Estimates of the countries excluding Syria for the 2006-2008 period are provisional because FAO and USDA estimates have been not published yet.
Table A6.21. Fat intakes by Syrian governorates, 2004, 2007 and 2009 (g/person/day)
Item 2004 2007 2009 Change % (2004-2009)
Urban Rural Average Urban Rural Average Urban Rural Average Urban Rural Average Sweida 135 113 117 128 97 117 87 121 106 -35.6 7.5 -9.4 Dar'a 130 119 123 127 134 131 107 113 110 -17.7 -5.4 -10.6 Quneitra 0 115 115 0 147 147 0 137 137 19.3 19.3 Damascus City 98 0 98 73 0 73 97 0 97 -1.0 -1.4 Damascus Rural 83 87 85 78 82 80 85 90 88 2.4 3.9 3.3 Homs 107 106 101 59 166 96 94 123 109 -12.1 16.1 7.6 Hama 133 131 129 126 136 131 108 107 108 -18.8 -18.4 -16.6 Idleb 103 90 94 130 87 117 101 84 93 -1.9 -6.5 -1.4 Tartous 95 99 97 96 98 97 120 98 109 26.3 -0.7 12.4 Lattakia 81 85 84 79 87 83 102 102 102 25.9 20.2 21.7 Aleppo 104 75 95 82 76 80 106 140 123 1.9 87.2 29.6 Raqqa 100 111 104 102 122 110 126 140 133 26.0 26.0 27.6 Dair-Ezzor 118 87 101 93 77 88 103 100 101 -12.7 14.7 0.4 Hassake 117 113 114 143 81 126 101 128 114 -13.7 13.2 0.2 Average 102 99 101 105 113 108 103 115 109 1.0 15.9 7.8 Source: NAPC elaboration based on CBS, Family Budget Survey, 2004, 2007 and 2009. Zero denotes that there is no rural or urban population.

State of Food and Agriculture in Syria 2010
365
Table A6.22. Carbohydrate intakes by countries, 1999-2008 (g/person/day)
Item 1999 2000 2001 Average
1999-2001 2003 2004 2005
Average 2003-2005
2006 2007 2008 Average
2006-2008 Syria 483 481 485 483 484 481 485 483 538 532 473 514 Egypt 628 627 635 630 619 594 618 610 604 600 602 602 Jordan 427 427 430 428 442 433 463 446 450 433 442 442 Kuwait 415 417 403 412 424 427 410 420 423 418 420 420 Lebanon 451 429 436 439 452 448 443 447 435 433 434 434 Morocco 601 599 610 604 623 643 629 632 627 623 625 625 Saudi Arabia 429 428 432 429 435 450 444 443 428 413 421 421 Tunisia 551 536 537 542 552 543 554 550 564 586 575 575 USA 498 497 508 501 482 481 479 481 522 525 523 523 EU 420 421 427 423 429 432 433 431 466 472 469 469 World 405 405 405 405 408 406 406 407 441 409 425 425 Source: NAPC elaboration based on FAO, USDA, AOAD and MAAR Statistics. Estimates of the countries excluding Syria for the 2006-2008 period are provisional because FAO and USDA estimates have been not published yet.
Table A6.23. Carbohydrate intakes by Syrian governorates, 2004, 2007 and 2009 (g/person/day)
Item 2004 2007 2009 Change % (2004-2009)
Urban Rural Average Urban Rural Average Urban Rural Average Urban Rural Average Sweida 449 502 483 517 504 512 412 485 449 -8.2 -3.4 -7.0 Dar'a 476 489 486 534 657 561 430 459 445 -9.7 -6.1 -8.4 Quneitra 0 471 471 0 625 625 0 592 592 25.7 25.7 Damascus City 391 0 391 340 0 340 366 0 366 -6.4 -6.4 Damascus Rural 400 427 414 343 393 368 386 443 415 -3.5 3.7 0.2 Homs 434 451 429 357 543 423 395 518 457 -9.0 14.9 6.5 Hama 422 530 489 456 527 481 445 514 479 5.5 -3.0 -2.0 Idleb 359 410 401 432 414 429 435 443 448 21.2 8.0 11.7 Tartous 383 439 421 379 446 404 449 479 464 17.2 9.1 10.2 Lattakia 400 471 436 398 443 415 404 528 466 1.0 12.1 6.9 Aleppo 410 506 438 425 502 451 482 615 548 17.6 21.5 25.1 Raqqa 508 659 602 621 762 672 614 796 705 20.9 20.8 17.1 Dair-Ezzor 497 556 541 389 468 418 485 531 508 -2.4 -4.5 -6.1 Hassake 480 612 568 419 475 449 472 685 580 -1.7 11.9 2.1 Average 417 502 457 438 536 472 446 546 496 7.0 8.8 8.5 Source: NAPC elaboration based on CBS, Family Budget Survey, 2004, 2007 and 2009. Zero denotes that there is no rural or urban population.

State of Food and Agriculture in Syria 2010
366
Table A6.24. Vitamin C intakes by countries, 1999-2008 (mg/person/day)
Item 1999 2000 2001 Average
1999-2001 2003 2004 2005
Average 2003-2005
2006 2007 2008 Average
2006-2008 Syria 74 75 75 75 85 89 86 87 86 71 87 81 Egypt 114 118 112 115 117 119 118 118 124 123 123 123 Jordan 58 61 54 57 69 76 82 76 101 83 92 92 Kuwait 114 116 115 115 78 84 79 80 66 65 66 66 Lebanon 172 152 147 157 158 162 157 159 168 166 167 167 Morocco 72 70 68 70 87 98 90 92 95 102 98 98 Saudi Arabia 77 75 79 77 83 85 88 85 84 78 81 81 Tunisia 109 110 102 107 116 121 114 117 119 124 122 122 USA 130 130 119 126 118 119 113 117 114 113 113 113 EU 119 120 117 118 118 122 121 121 122 118 120 120 World 78 80 81 80 84 86 86 85 88 88 88 88 Source: NAPC elaboration based on FAO, USDA, AOAD and MAAR Statistics. Estimates of the countries excluding Syria for the 2006-2008 period are provisional because FAO and USDA estimates have been not published yet; mg: milligram.
Table A6.25. Vitamin C intakes by Syrian governorates, 2004, 2007 and 2009 (mg/person/day)
Item 2004 2007 2009 Change % (2004-2009)
Urban Rural Average Urban Rural Average Urban Rural Average Urban Rural Average Sweida 167 153 154 163 154 160 120 134 127 -28.1 -12.3 -17.3 Dar'a 160 160 160 146 202 156 128 132 130 -20.0 -17.4 -18.7 Quneitra 0 153 153 0 110 110 0 133 133 -13.2 -13.2 Damascus City 163 0 163 125 0 125 120 0 120 -26.4 -26.5 Damascus Rural 154 161 158 112 119 116 113 119 116 -26.6 -26.4 -26.8 Homs 182 172 177 125 165 139 139 151 145 -23.6 -12.2 -18.1 Hama 159 184 170 143 180 156 158 150 154 -0.6 -18.3 -9.3 Idleb 139 156 152 161 119 147 150 141 146 7.9 -9.8 -4.3 Tartous 139 147 144 140 168 150 151 154 153 8.6 5.0 6.1 Lattakia 160 178 171 139 167 149 129 160 145 -19.4 -9.9 -15.4 Aleppo 129 120 124 115 111 114 136 164 150 5.4 36.9 21.2 Raqqa 164 129 141 137 139 138 183 188 185 11.6 45.7 31.6 Dair-Ezzor 169 120 141 123 113 120 140 129 135 -17.2 7.8 -4.4 Hassake 153 139 144 173 134 161 127 140 133 -17.0 0.7 -7.4 Average 153 152 152 140 146 142 138 146 142 -9.8 -4.0 -6.6 Source: NAPC elaboration based on CBS, Family Budget Survey, 2004, 2007 and 2009. Zero denotes that there is no rural or urban population.

State of Food and Agriculture in Syria 2010
367
Table A6.26. Vitamin A intakes by countries, 1999-2008 (microg/person/day)
Item 1999 2000 2001 Average
1999-2001 2003 2004 2005
Average 2003-2005
2006 2007 2008 Average
2006-2008 Syria 457 456 442 452 487 504 489 493 466 442 406 438 Egypt 538 550 530 539 551 538 546 545 532 532 532 532 Jordan 421 429 423 424 446 468 466 460 468 450 459 459 Kuwait 723 743 765 744 652 696 759 702 798 779 789 789 Lebanon 672 651 661 661 686 702 709 699 668 661 665 665 Morocco 465 455 460 460 502 517 505 508 516 504 510 510 Saudi Arabia 624 611 618 618 634 645 652 643 645 635 640 640 Tunisia 567 569 560 565 576 587 577 580 561 572 566 566 USA 1,250 1,250 1,080 1,193 1,080 1,080 1,097 1,086 1,051 1,040 1,045 1,045 EU 1,044 1,040 1,044 1,043 1,048 1,039 1,037 1,042 916 901 908 908 World 540 546 548 544 559 564 567 563 527 517 522 522 Source: NAPC elaboration based on FAO, USDA, AOAD and MAAR Statistics. Estimates of the countries excluding Syria for the 2006-2008 period are provisional because FAO and USDA estimates have been not published yet; microg: micro gram.
Table A6.27. Vitamin B1 intakes by countries, 1999-2008 (mg/person/day)
Item 1999 2000 2001 Average
1999-2001 2003 2004 2005
Average 2003-2005
2006 2007 2008 Average
2006-2008 Syria 2.0 2.0 2.0 2.0 2.1 2.1 2.1 2.1 2.3 2.3 2.0 2.2 Egypt 2.9 2.9 2.9 2.9 2.9 2.8 2.9 2.8 2.8 2.8 2.8 2.8 Jordan 1.9 1.8 1.8 1.8 1.9 1.8 2.0 1.9 1.9 1.9 1.9 1.9 Kuwait 2.1 2.1 2.1 2.1 2.0 2.1 2.2 2.1 2.4 2.4 2.4 2.4 Lebanon 2.2 2.1 2.1 2.1 2.2 2.2 2.2 2.2 2.2 2.2 2.2 2.2 Morocco 2.7 2.6 2.7 2.7 2.8 2.9 2.8 2.8 2.9 2.9 2.9 2.9 Saudi Arabia 2.1 2.1 2.1 2.1 2.1 2.1 2.1 2.1 2.0 2.0 2.0 2.0 Tunisia 2.6 2.5 2.5 2.5 2.5 2.5 2.6 2.5 2.5 2.7 2.6 2.6 USA 3.0 3.0 3.1 3.0 2.9 2.9 2.4 2.7 2.5 2.5 2.5 2.5 EU 2.2 2.2 2.2 2.2 2.2 2.3 2.3 2.3 2.4 2.4 2.4 2.4 World 2.0 2.0 2.0 2.0 2.0 2.0 2.0 2.0 2.2 2.0 2.1 2.1 Source: NAPC elaboration based on FAO, USDA, AOAD and MAAR Statistics. Estimates of the countries excluding Syria for the 2006-2008 period are provisional because FAO and USDA estimates have been not published yet.

State of Food and Agriculture in Syria 2010
368
Table A6.28. Vitamin B1 intakes by Syrian governorates, 2004, 2007 and 2009 (mg/person/day)
Item 2004 2007 2009 Change % (2004-2009)
Urban Rural Average Urban Rural Average Urban Rural Average Urban Rural Average Sweida 2.0 2.1 2.1 2.4 2.1 2.3 1.8 2.1 2.0 -10.0 0.0 -4.8 Dar'a 2.1 2.1 2.1 2.2 2.7 2.2 1.9 2.0 1.9 -9.5 -4.8 -9.5 Quneitra 0.0 2.0 2.0 0.0 2.1 2.1 0.0 2.3 2.3 15.0 15.0 Damascus City 1.7 0.0 1.7 1.7 0.0 1.7 1.7 0.0 1.7 0.0 0.0 Damascus Rural 1.8 1.9 1.9 1.6 1.7 1.7 1.8 1.9 1.8 0.0 0.0 -5.3 Homs 1.9 2.0 1.9 1.6 2.1 1.8 1.8 2.2 2.0 -5.3 10.0 5.3 Hama 1.9 2.2 2.1 2.1 2.4 2.2 2.1 2.4 2.2 10.5 9.1 4.8 Idleb 1.7 1.9 1.8 2.1 2.2 2.1 1.9 1.9 1.9 11.8 0.0 5.6 Tartous 1.9 2.1 2.0 1.8 2.1 1.9 2.1 2.3 2.2 10.5 9.5 10.0 Lattakia 1.9 2.2 2.1 1.9 2.2 2.0 1.9 2.4 2.1 0.0 9.1 0.0 Aleppo 1.7 2.5 2.0 1.8 1.8 1.8 2.0 2.5 2.3 17.6 0.0 15.0 Raqqa 2.1 2.2 2.2 2.1 2.1 2.1 2.5 3.0 2.8 19.0 36.4 27.3 Dair-Ezzor 2.2 2.8 2.6 1.8 2.1 1.9 2.4 2.4 2.4 9.1 -14.3 -7.7 Hassake 2.2 2.4 2.3 2.1 2.2 2.1 2.0 2.7 2.4 -9.1 12.5 4.3 Average 1.9 2.2 2.0 1.9 2.0 2.0 2.0 2.3 2.2 5.3 4.5 10.0 Source: NAPC elaboration based on CBS, Family Budget Survey, 2004, 2007 and 2009. Zero denotes that there is no rural or urban population.
Table A6.29. Vitamin B2 intakes by countries, 1999-2008 (mg/person/day)
Item 1999 2000 2001 Average
1999-2001 2003 2004 2005
Average 2003-2005
2006 2007 2008 Average
2006-2008 Syria 1.3 1.3 1.3 1.3 1.3 1.4 1.4 1.4 1.5 1.5 1.3 1.4 Egypt 1.7 1.7 1.7 1.7 1.7 1.6 1.7 1.7 1.7 1.7 1.7 1.7 Jordan 1.1 1.2 1.2 1.2 1.2 1.2 1.2 1.2 1.3 1.3 1.3 1.3 Kuwait 1.7 1.6 1.6 1.7 1.4 1.5 1.6 1.5 1.9 1.9 1.9 1.9 Lebanon 1.6 1.5 1.6 1.6 1.6 1.6 1.6 1.6 1.8 1.8 1.8 1.8 Morocco 1.4 1.3 1.4 1.4 1.4 1.5 1.4 1.4 1.5 1.5 1.5 1.5 Saudi Arabia 1.3 1.3 1.3 1.3 1.3 1.4 1.4 1.4 1.4 1.4 1.4 1.4 Tunisia 1.5 1.5 1.5 1.5 1.6 1.6 1.6 1.6 1.5 1.5 1.5 1.5 USA 2.9 2.9 2.9 2.9 2.8 2.9 2.3 2.7 2.5 2.5 2.5 2.5 EU 2.0 2.0 2.0 2.0 2.0 2.0 2.0 2.0 2.3 2.3 2.3 2.3 World 1.4 1.4 1.4 1.4 1.4 1.4 1.4 1.4 1.5 1.4 1.4 1.4 Source: NAPC elaboration based on FAO, USDA, AOAD and MAAR Statistics. Estimates of the countries excluding Syria for the 2006-2008 period are provisional because FAO and USDA estimates have been not published yet.

State of Food and Agriculture in Syria 2010
369
Table A6.30. Vitamin B2 intakes by Syrian governorates, 2004, 2007 and 2009 (mg/person/day)
Item 2004 2007 2009 Change % (2004-2009)
Urban Rural Average Urban Rural Average Urban Rural Average Urban Rural Average Sweida 2.0 2.0 2.0 2.1 2.1 2.1 1.9 2.1 2.0 -5.0 4.4 2.5 Dar'a 2.2 2.1 2.1 2.2 2.6 2.3 1.9 2.0 1.9 -13.6 -7.1 -8.3 Quneitra 0.0 1.9 1.9 0.0 2.0 2.0 0.0 2.2 2.2 14.4 14.4 Damascus City 2.2 0.0 2.2 1.7 0.0 1.7 1.8 0.0 1.8 -18.2 -20.4 Damascus Rural 1.9 2.0 1.9 1.6 1.7 1.7 1.8 1.9 1.9 -5.3 -2.7 -1.8 Homs 1.9 1.9 1.8 1.6 2.0 1.8 1.8 2.2 2.0 -5.3 18.3 12.4 Hama 2.0 1.9 1.9 2.2 2.2 2.2 2.2 2.2 2.2 10.0 16.9 15.5 Idleb 1.7 1.8 1.8 1.9 1.6 1.8 1.9 1.8 1.9 11.8 0.7 4.8 Tartous 1.9 1.9 1.9 1.8 2.0 1.9 2.1 2.2 2.2 10.5 17.1 14.3 Lattakia 1.9 2.1 2.0 1.9 2.1 2.0 2.0 2.3 2.1 5.3 9.5 6.5 Aleppo 1.9 1.8 1.8 1.7 1.6 1.7 2.1 2.3 2.2 10.5 29.8 22.0 Raqqa 1.9 1.8 1.8 1.8 1.7 1.8 2.3 2.5 2.4 21.1 41.4 33.8 Dair-Ezzor 2.2 2.4 2.4 1.8 1.9 1.8 2.1 2.1 2.1 -4.5 -14.2 -13.4 Hassake 2.1 2.1 2.1 2.4 2.1 2.3 1.9 2.6 2.4 -9.5 24.8 13.5 Average 2.0 2.0 2.0 1.9 2.0 2.0 2.0 2.2 2.1 0.0 9.8 5.1 Source: NAPC elaboration based on CBS, Family Budget Survey, 2004, 2007 and 2009. Zero denotes that there is no rural or urban population.
Table A6.31. Vitamin B6 intakes by countries, 1999-2008 (mg/person/day)
Item 1999 2000 2001 Average
1999-2001 2003 2004 2005
Average 2003-2005
2006 2007 2008 Average
2006-2008 Syria 1.2 1.2 1.2 1.2 1.3 1.3 1.3 1.3 1.3 1.2 1.2 1.3 Egypt 1.7 1.8 1.7 1.8 1.8 1.8 1.8 1.8 1.7 1.7 1.7 1.7 Jordan 1.1 1.1 1.1 1.1 1.2 1.2 1.3 1.2 1.3 1.2 1.3 1.3 Kuwait 1.9 1.9 1.9 1.9 1.6 1.8 1.9 1.8 2.0 1.9 2.0 2.0 Lebanon 2.0 1.8 1.9 1.9 2.0 2.0 2.0 2.0 2.0 2.0 2.0 2.0 Morocco 1.1 1.0 1.0 1.0 1.2 1.3 1.2 1.2 1.3 1.3 1.3 1.3 Saudi Arabia 1.4 1.4 1.4 1.4 1.4 1.4 1.5 1.4 1.4 1.4 1.4 1.4 Tunisia 1.5 1.5 1.4 1.5 1.5 1.6 1.5 1.5 1.5 1.5 1.5 1.5 USA 2.5 2.5 8.2 4.4 2.4 2.4 2.3 2.4 2.4 2.3 2.4 2.4 EU 2.0 2.0 2.0 2.0 2.0 2.1 2.1 2.1 2.1 2.1 2.1 2.1 World 1.5 1.6 1.6 1.5 1.6 1.6 1.6 1.6 1.6 1.6 1.6 1.6 Source: NAPC elaboration based on FAO, USDA, AOAD and MAAR Statistics. Estimates of the countries excluding Syria for the 2006-2008 period are provisional because FAO and USDA estimates have been not published yet.
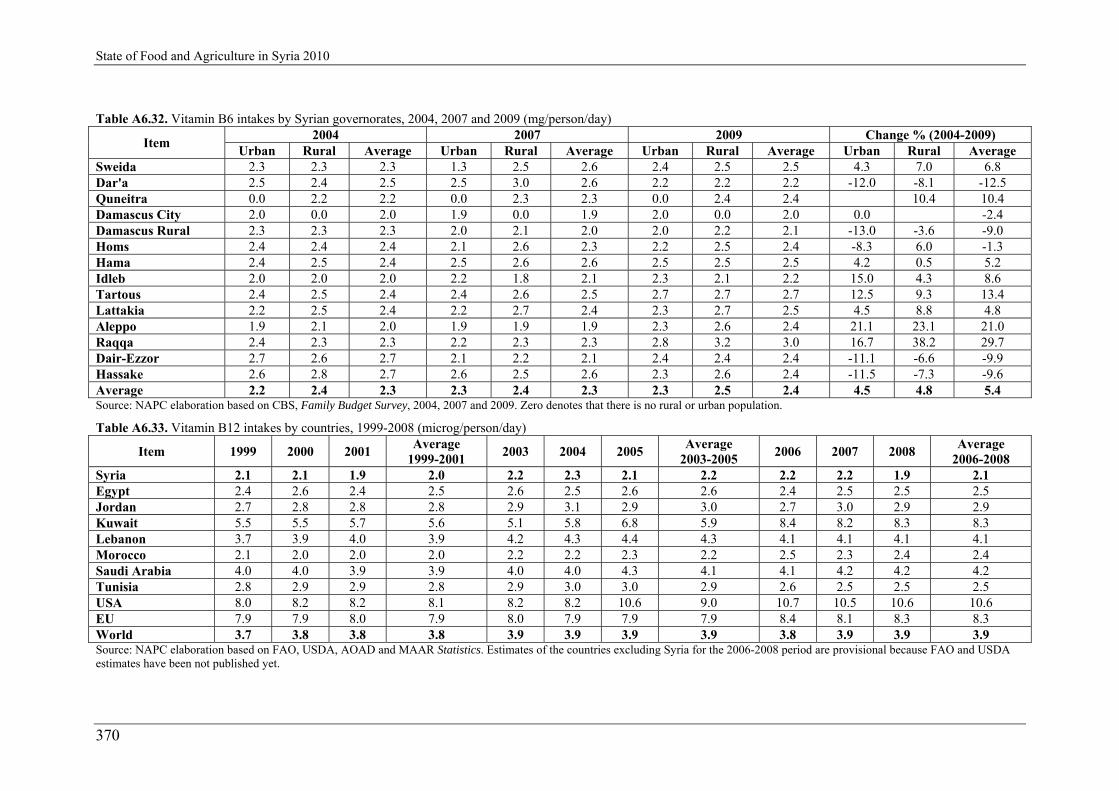
State of Food and Agriculture in Syria 2010
370
Table A6.32. Vitamin B6 intakes by Syrian governorates, 2004, 2007 and 2009 (mg/person/day)
Item 2004 2007 2009 Change % (2004-2009)
Urban Rural Average Urban Rural Average Urban Rural Average Urban Rural Average Sweida 2.3 2.3 2.3 1.3 2.5 2.6 2.4 2.5 2.5 4.3 7.0 6.8 Dar'a 2.5 2.4 2.5 2.5 3.0 2.6 2.2 2.2 2.2 -12.0 -8.1 -12.5 Quneitra 0.0 2.2 2.2 0.0 2.3 2.3 0.0 2.4 2.4 10.4 10.4 Damascus City 2.0 0.0 2.0 1.9 0.0 1.9 2.0 0.0 2.0 0.0 -2.4 Damascus Rural 2.3 2.3 2.3 2.0 2.1 2.0 2.0 2.2 2.1 -13.0 -3.6 -9.0 Homs 2.4 2.4 2.4 2.1 2.6 2.3 2.2 2.5 2.4 -8.3 6.0 -1.3 Hama 2.4 2.5 2.4 2.5 2.6 2.6 2.5 2.5 2.5 4.2 0.5 5.2 Idleb 2.0 2.0 2.0 2.2 1.8 2.1 2.3 2.1 2.2 15.0 4.3 8.6 Tartous 2.4 2.5 2.4 2.4 2.6 2.5 2.7 2.7 2.7 12.5 9.3 13.4 Lattakia 2.2 2.5 2.4 2.2 2.7 2.4 2.3 2.7 2.5 4.5 8.8 4.8 Aleppo 1.9 2.1 2.0 1.9 1.9 1.9 2.3 2.6 2.4 21.1 23.1 21.0 Raqqa 2.4 2.3 2.3 2.2 2.3 2.3 2.8 3.2 3.0 16.7 38.2 29.7 Dair-Ezzor 2.7 2.6 2.7 2.1 2.2 2.1 2.4 2.4 2.4 -11.1 -6.6 -9.9 Hassake 2.6 2.8 2.7 2.6 2.5 2.6 2.3 2.6 2.4 -11.5 -7.3 -9.6 Average 2.2 2.4 2.3 2.3 2.4 2.3 2.3 2.5 2.4 4.5 4.8 5.4 Source: NAPC elaboration based on CBS, Family Budget Survey, 2004, 2007 and 2009. Zero denotes that there is no rural or urban population.
Table A6.33. Vitamin B12 intakes by countries, 1999-2008 (microg/person/day)
Item 1999 2000 2001 Average
1999-2001 2003 2004 2005
Average 2003-2005
2006 2007 2008 Average
2006-2008 Syria 2.1 2.1 1.9 2.0 2.2 2.3 2.1 2.2 2.2 2.2 1.9 2.1 Egypt 2.4 2.6 2.4 2.5 2.6 2.5 2.6 2.6 2.4 2.5 2.5 2.5 Jordan 2.7 2.8 2.8 2.8 2.9 3.1 2.9 3.0 2.7 3.0 2.9 2.9 Kuwait 5.5 5.5 5.7 5.6 5.1 5.8 6.8 5.9 8.4 8.2 8.3 8.3 Lebanon 3.7 3.9 4.0 3.9 4.2 4.3 4.4 4.3 4.1 4.1 4.1 4.1 Morocco 2.1 2.0 2.0 2.0 2.2 2.2 2.3 2.2 2.5 2.3 2.4 2.4 Saudi Arabia 4.0 4.0 3.9 3.9 4.0 4.0 4.3 4.1 4.1 4.2 4.2 4.2 Tunisia 2.8 2.9 2.9 2.8 2.9 3.0 3.0 2.9 2.6 2.5 2.5 2.5 USA 8.0 8.2 8.2 8.1 8.2 8.2 10.6 9.0 10.7 10.5 10.6 10.6 EU 7.9 7.9 8.0 7.9 8.0 7.9 7.9 7.9 8.4 8.1 8.3 8.3 World 3.7 3.8 3.8 3.8 3.9 3.9 3.9 3.9 3.8 3.9 3.9 3.9 Source: NAPC elaboration based on FAO, USDA, AOAD and MAAR Statistics. Estimates of the countries excluding Syria for the 2006-2008 period are provisional because FAO and USDA estimates have been not published yet.

State of Food and Agriculture in Syria 2010
371
Table A6.34. Vitamin B12 intakes by Syrian governorates, 2004, 2007 and 2009 (microg/person/day)
Item 2004 2007 2009 Change % (2004-2009)
Urban Rural Average Urban Rural Average Urban Rural Average Urban Rural Average Sweida 2.1 1.5 1.7 3.0 2.6 2.8 2.5 2.5 2.6 19.0 66.7 52.9 Dar'a 2.1 1.8 1.9 2.4 2.3 2.4 2.1 2.0 2.0 0.0 11.1 5.3 Quneitra 0.0 1.6 1.6 0.0 2.7 2.7 0.0 2.3 2.3 43.8 43.8 Damascus City 1.7 0.0 1.7 1.7 0.0 1.7 1.9 0.0 1.9 11.8 11.8 Damascus Rural 1.7 1.6 1.6 1.7 1.8 1.8 1.7 1.9 1.8 0.0 18.8 12.5 Homs 1.8 1.6 1.7 2.0 2.4 2.1 1.9 2.2 2.1 5.6 37.5 23.5 Hama 2.3 1.2 1.6 2.8 2.1 2.6 2.5 1.9 2.2 8.7 58.3 37.5 Idleb 1.7 1.3 1.4 2.4 1.5 2.1 2.0 1.7 1.8 17.6 30.8 28.6 Tartous 2.1 1.7 1.8 2.7 2.1 2.5 2.6 2.3 2.5 23.8 35.3 38.9 Lattakia 1.6 1.6 1.7 2.1 2.9 2.4 2.4 2.3 2.3 50.0 43.8 35.3 Aleppo 1.8 1.2 1.6 1.8 1.0 1.6 2.1 1.5 1.8 16.7 25.0 12.5 Raqqa 1.1 0.6 0.7 1.0 0.9 1.0 1.3 1.2 1.2 18.2 100.0 71.4 Dair-Ezzor 2.0 2.0 2.1 2.5 1.6 2.3 1.8 1.5 1.7 -10.0 -25.0 -19.0 Hassake 1.8 1.2 1.4 3.2 1.9 2.8 2.0 1.8 1.9 11.1 50.0 35.7 Average 2.0 1.5 1.7 2.3 2.1 2.2 2.1 1.9 2.0 5.0 26.7 17.6 Source: NAPC elaboration based on CBS, Family Budget Survey, 2004, 2007 and 2009. Zero denotes that there is no rural or urban population.
Table A6.35. Iron intakes by countries, 1999-2008 (mg/person/day)
Item 1999 2000 2001 Average
1999-2001 2003 2004 2005
Average 2003-2005
2006 2007 2008 Average
2006-2008 Syria 25 25 25 25 26 26 25 26 29 29 24 27 Egypt 37 38 38 38 37 36 37 37 36 36 36 36 Jordan 23 22 22 22 22 22 24 23 22 22 22 22 Kuwait 23 23 23 23 24 24 24 24 27 26 26 26 Lebanon 24 23 24 24 24 25 25 25 24 24 24 24 Morocco 34 33 35 34 35 36 35 36 36 35 36 36 Saudi Arabia 24 24 24 24 24 25 25 24 23 23 23 23 Tunisia 31 31 31 31 31 30 31 31 31 32 32 32 USA 24 24 24 24 23 23 23 23 26 26 26 26 EU 23 23 24 23 23 24 24 24 25 26 26 26 World 24 24 24 24 25 24 24 24 26 24 25 25 Source: NAPC elaboration based on FAO, USDA, AOAD and MAAR Statistics. Estimates of the countries excluding Syria for the 2006-2008 period are provisional because FAO and USDA estimates have been not published yet.
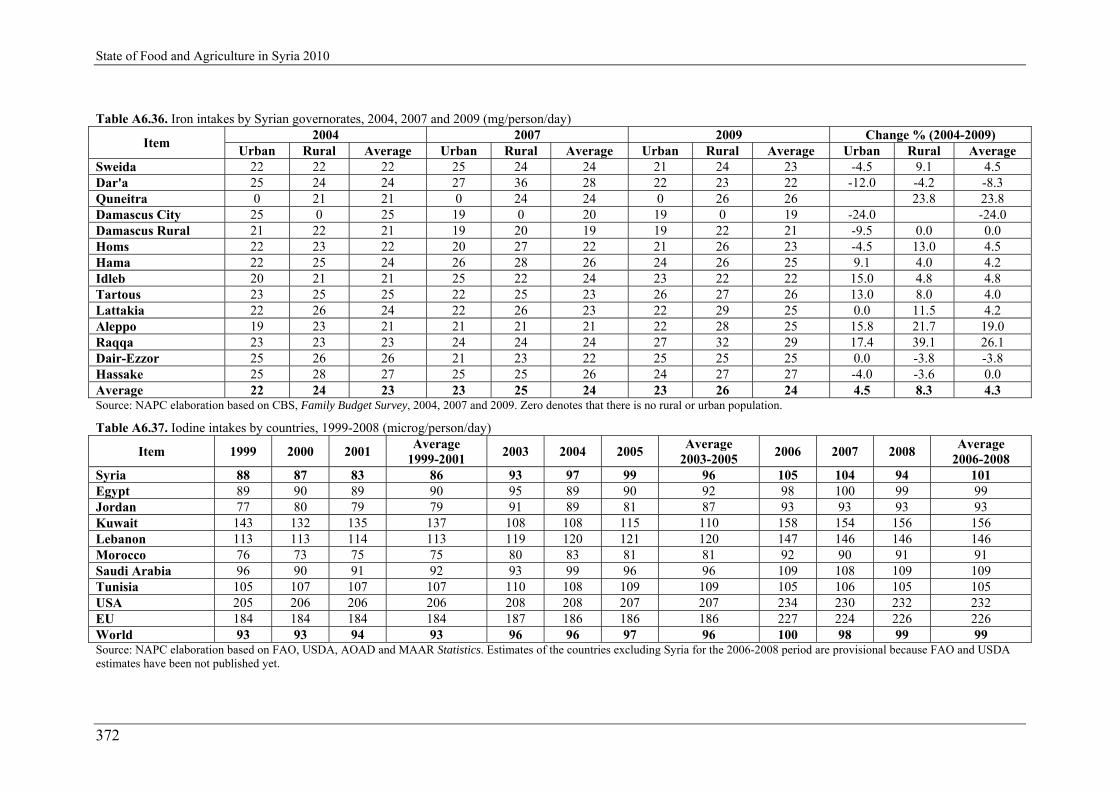
State of Food and Agriculture in Syria 2010
372
Table A6.36. Iron intakes by Syrian governorates, 2004, 2007 and 2009 (mg/person/day)
Item 2004 2007 2009 Change % (2004-2009)
Urban Rural Average Urban Rural Average Urban Rural Average Urban Rural Average Sweida 22 22 22 25 24 24 21 24 23 -4.5 9.1 4.5 Dar'a 25 24 24 27 36 28 22 23 22 -12.0 -4.2 -8.3 Quneitra 0 21 21 0 24 24 0 26 26 23.8 23.8 Damascus City 25 0 25 19 0 20 19 0 19 -24.0 -24.0 Damascus Rural 21 22 21 19 20 19 19 22 21 -9.5 0.0 0.0 Homs 22 23 22 20 27 22 21 26 23 -4.5 13.0 4.5 Hama 22 25 24 26 28 26 24 26 25 9.1 4.0 4.2 Idleb 20 21 21 25 22 24 23 22 22 15.0 4.8 4.8 Tartous 23 25 25 22 25 23 26 27 26 13.0 8.0 4.0 Lattakia 22 26 24 22 26 23 22 29 25 0.0 11.5 4.2 Aleppo 19 23 21 21 21 21 22 28 25 15.8 21.7 19.0 Raqqa 23 23 23 24 24 24 27 32 29 17.4 39.1 26.1 Dair-Ezzor 25 26 26 21 23 22 25 25 25 0.0 -3.8 -3.8 Hassake 25 28 27 25 25 26 24 27 27 -4.0 -3.6 0.0 Average 22 24 23 23 25 24 23 26 24 4.5 8.3 4.3 Source: NAPC elaboration based on CBS, Family Budget Survey, 2004, 2007 and 2009. Zero denotes that there is no rural or urban population.
Table A6.37. Iodine intakes by countries, 1999-2008 (microg/person/day)
Item 1999 2000 2001 Average
1999-2001 2003 2004 2005
Average 2003-2005
2006 2007 2008 Average
2006-2008 Syria 88 87 83 86 93 97 99 96 105 104 94 101 Egypt 89 90 89 90 95 89 90 92 98 100 99 99 Jordan 77 80 79 79 91 89 81 87 93 93 93 93 Kuwait 143 132 135 137 108 108 115 110 158 154 156 156 Lebanon 113 113 114 113 119 120 121 120 147 146 146 146 Morocco 76 73 75 75 80 83 81 81 92 90 91 91 Saudi Arabia 96 90 91 92 93 99 96 96 109 108 109 109 Tunisia 105 107 107 107 110 108 109 109 105 106 105 105 USA 205 206 206 206 208 208 207 207 234 230 232 232 EU 184 184 184 184 187 186 186 186 227 224 226 226 World 93 93 94 93 96 96 97 96 100 98 99 99 Source: NAPC elaboration based on FAO, USDA, AOAD and MAAR Statistics. Estimates of the countries excluding Syria for the 2006-2008 period are provisional because FAO and USDA estimates have been not published yet.

State of Food and Agriculture in Syria 2010
373
Table A6.38. Iodine intakes by Syrian governorates, 2004, 2007 and 2009 (microg/person/day)
Item 2004 2007 2009 Change % (2004-2009)
Urban Rural Average Urban Rural Average Urban Rural Average Urban Rural Average Sweida 188 184 186 219 223 221 187 210 209 -0.5 14.1 12.4 Dar'a 208 212 210 227 267 247 187 195 191 -10.1 -8.0 -9.0 Quneitra 0 191 191 0 216 216 0 216 216 13.1 13.1 Damascus City 150 0 150 143 0 143 155 0 155 3.3 3.3 Damascus Rural 171 181 176 152 168 160 157 181 169 -8.2 0.0 -4.0 Homs 172 175 173 158 196 158 161 207 184 -6.4 18.3 6.4 Hama 175 179 177 209 214 209 188 201 194 7.4 12.3 9.6 Idleb 152 167 159 174 147 174 174 173 174 14.5 3.6 9.4 Tartous 167 182 174 174 193 174 189 202 195 13.2 11.0 12.1 Lattakia 161 195 178 176 223 176 172 220 196 6.8 12.8 10.1 Aleppo 166 159 162 159 153 159 182 211 197 9.6 32.7 21.6 Raqqa 174 162 168 174 162 174 205 229 217 17.8 41.4 29.2 Dair-Ezzor 194 261 227 173 194 173 193 193 193 -0.5 -26.1 -15.0 Hassake 204 179 191 231 196 231 193 229 211 -5.4 27.9 10.5 Average 182 192 187 182 198 190 182 205 194 0.0 6.8 3.7 Source: NAPC elaboration based on CBS, Family Budget Survey, 2004, 2007 and 2009. Zero denotes that there is no rural or urban population.
Table A6.39. Calcium intakes by countries, 1999-2008 (mg/person/day)
Item 1999 2000 2001 Average
1999-2001 2003 2004 2005
Average 2003-2005
2006 2007 2008 Average
2006-2008 Syria 466 464 444 458 488 498 537 508 560 553 511 542 Egypt 482 493 492 489 520 483 485 496 527 539 533 533 Jordan 363 392 380 378 460 441 393 431 479 484 482 482 Kuwait 695 621 630 648 479 439 459 459 682 667 674 674 Lebanon 573 559 577 570 605 604 595 601 781 777 779 779 Morocco 354 345 354 351 380 395 384 386 451 449 450 450 Saudi Arabia 458 429 432 440 446 481 452 459 544 532 538 538 Tunisia 532 542 540 538 560 544 550 551 522 535 528 528 USA 980 980 970 977 950 970 940 953 1,105 1,092 1,098 1,098 EU 880 876 879 878 894 885 890 890 1,136 1,122 1,129 1,129 World 451 452 452 452 461 462 465 463 482 474 478 478 Source: NAPC elaboration based on FAO, USDA, AOAD and MAAR Statistics. Estimates of the countries excluding Syria for the 2006-2008 period are provisional because FAO and USDA estimates have been not published yet.

State of Food and Agriculture in Syria 2010
374
Table A6.40. Calcium intakes by Syrian governorates, 2004, 2007 and 2009 (mg/person/day)
Item 2004 2007 2009 Change % (2004-2009)
Urban Rural Average Urban Rural Average Urban Rural Average Urban Rural Average Sweida 894 838 857 948 968 962 842 883 869 -5.8 5.3 1.4 Dar'a 917 830 861 962 1,078 990 772 766 769 -15.8 -7.7 -10.7 Quneitra 0 796 796 0 829 829 0 899 899 13.0 13.0 Damascus City 992 0 992 809 0 809 824 0 824 -16.9 -16.9 Damascus Rural 854 882 869 741 728 735 786 827 807 -8.0 -6.2 -7.1 Homs 830 759 802 688 905 794 767 870 819 -7.6 14.6 2.1 Hama 1,053 747 806 1,106 999 1,072 1,027 838 932 -2.5 12.2 15.6 Idleb 890 773 816 1,069 741 965 940 810 875 5.6 4.8 7.3 Tartous 802 775 786 870 810 853 886 837 862 10.5 8.1 9.6 Lattakia 812 842 842 783 882 822 878 907 893 8.1 7.8 6.0 Aleppo 1,080 848 982 816 579 738 996 950 973 -7.8 12.1 -0.9 Raqqa 788 616 660 610 573 592 872 853 862 10.7 38.4 30.6 Dair-Ezzor 1,035 1,004 1,020 834 760 819 823 758 791 -20.5 -24.5 -22.5 Hassake 917 836 862 1,461 917 1,292 882 1,088 984 -3.8 30.1 14.2 Average 958 833 903 937 846 891 870 868 869 -9.2 4.3 -3.7 Source: NAPC elaboration based on CBS, Family Budget Survey, 2004, 2007 and 2009. Zero denotes that there is no rural or urban population.
Table A6.41. MICS and MDGs, 2006
Item MICS
Indicator Number
MDGs Indicator Number
Indicator Value Unit
Child mortality
Child mortality 1 13 Under-five mortality rate 22 thousand 2 14 Infant mortality rate 18 thousand
Nutrition
Nutrition 6 4 Underweight prevalence 9.7 % 7 Stunting prevalence 22.4 % 8 Wasting prevalence 8.6 %
Breast feeding
45 Timely initiation of breast feeding 32.4 % Continued breast feeding rate
16 12-15 months 63.9 % 20-23 months 16.3 %
17 Timely complementary feeding rate 6-9 months 36.5 %

State of Food and Agriculture in Syria 2010
375
Table A6.41. Continued
Item MICS
Indicator Number
MDGs Indicator Number
Indicator Value Unit
Nutrition (continued)
Breast feeding 18 Frequency of complementary feeding 20.8 % 19 Adequately fed infants 25.3 %
Vitamin A 42 Vitamin A supplementation (under five) 2.9 % 43 Vitamin A supplementation (postpartum mothers) 17.8 %
Low birth weight 9 Low birth weight infants 9.4 %
10 Infants weighed at birth 47.9 % Child health
Immunization
25 Tuberculosis immunization coverage 99.9 % 26 Polio immunization coverage 96.9 % 28 15 Measles immunization coverage 92.4 % 31 Fully immunized children 87.8 %
Tetanus toxoid 32 Neonatal tetanus protection 37.8 %
Care for illness
33 Use of oral dehydration therapy (ORT) 67.7 % 34 Home management of diarrhea 15.6 % 35 Received ORT or increased fluids, and continued feeding 34.2 % 23 Care seeking for suspected pneumonia 76.8 % 22 Antibiotic treatment of suspected pneumonia 71 %
Solid fuel use 24 29 Solid fuels 0.3 % Environment
Water and sanitation
11 30 Use of improved drinking water sources 87.3 % 13 Water treatment 4.5 % 12 31 Use of improved sanitation facilities 97.1 %
Maternal and new born health
44 Content of antenatal care Blood test taken 54.2 % Blood pressure measured 76.8 % Urine sampling 52.6 % Measuring weight 66.9 % 4 17 Skilled attendant at delivery 93 % 5 Institutional deliveries 70.4 %
Source: CBS, MICS, 2008.

State of Food and Agriculture in Syria 2010
376
Table A6.41. Continued
Item MICS
Indicator Number
MDGs Indicator Number
Indicator Value Unit
Child development
Child development
46 Support for learning 55 % 47 Father’s support for learning 56.2 % 48 Support for learning: children’s books 30.1 % 49 Support for learning: non-children’s books 62.6 % 50 Support for learning: materials for play 19.3 % 51 Non-adult care 16.6 %
Education
Education
53 Pre-school attendance 33.6 % 54 Net intake rate in primary education 92 % 55 6 Net primary school attendance rate 96.1 % 56 Net secondary school attendance rate 54.2 % 57 7 Children reaching grade five 99.4 % 58 Transition rate to secondary school 94 % 59 7b Primary completion rate 75.3 % 61 9 Gender parity index Primary school 1 Secondary school 1
Child protection Birth registration 62 Birth registration 95.2 %
Child labour 71 Child labour 4 % 72 Labourer students 61 % 73 Student labourers 3.1 %
Child discipline 74 Child discipline Any psychological/physical punishment 24.3 %
Early marriage 67 Marriage before age 15 3.4 % Marriage before age 18 17.7 %
68 Young women aged 15-19 currently married 9.7 % HIV/AIDS
Knowledge and attitudes 82 19b Comprehensive knowledge about HIV prevention among young people 7.9 % 89 Knowledge of mother-to-child transmission of HIV 19.7 % 86 Women refusing to care for family member with HIV 11.7 %

State of Food and Agriculture in Syria 2010
377
Annex Seven
Special Issue
National Programme for Food Security

State of Food and Agriculture in Syria 2010
378
Annex 7. National programme for food security
Figure A7.1. Structure and Impacts of the NPFS
Overall Impact
Sustainable Management of Natural Resources and
Environment
Enhance Agricultural Production and
Productivity
Policies, Institutions and Supporting
Improve Food Stability and Risk management
Enhance Food Access, Quality
Improve Water Resources Management
Improve Environment
Develop Forestry
Improve PlantProduction and Productivity
Improve Livestock Production and Productivity
Drought Management
Household Food Security and Livelihood
Development of the Tigris and Alkhabour basinCommunity-based Improved Water Management Practices in the North and Northeastern Arid Region of SyriaExpansion of Improved Packages of Water Harvesting in the Southern Region of Syria
Integrated Watershed Management and Enhanced Role of Natural Resources
Transfer to modern irrigation systems 2010 – 2015
Extending Euphrates water to Palmyra and phosphate mines, and then to the industrial city of Hisia
Establishing Water Reservoirs in the Western Side of Al Ghab Plain
Developing the Irrigation Network in Homs – Hama
Expansion of the Project of the Integrated Development of the Syrian Al Badia
Improving Productivity of Irrigated Reclaimed Lands in the Euphrates
Development of Environmental Tourism
Exploiting Herbs and Medical Plants in Afforested Areas
Development of Apiculture
Sustainable Agricultural Production through Promotion of Conservation Agriculture Introduction of High Value Cash Crops
Enhance the Production of Domestic Seeds of Vegetables and Reliable Fruit Seedlings
Expand the Plantation, Classification and Export of Medical and Aromatic Plants
Enhance the integration of crop and livestock production
Construct refrigerating units to store potato seeds produced by the national project for potato seed productionEstablish Integrated Organic Farm (Crop and Livestock Production) Licensed by Authorized Certificate Granting
Integrated Development of the Livestock sector Integrated and Participatory Management of Steppe Resources in Homs Province Production and Distribution of Improved-Sheep (Awassi) projectsIntroduce Turkey Breeding in Rural Households
Plant Flowering Sern Fodder under Olive TreesTraining/Capacity Building on Enhancing the Nutritional Value of Agricultural ResiduesIntensive Sheep Breeding , and Lambs Fattening nearby Olive Fields
Promote the Production of Domestic Chicken, and Set up Middle-Size Production
Calf Fattening and Benefit from Improved Agricultural Residues
Fattening Unites for Awassi Male Sheep (Lamb) under Intensive Production
Production of Biogas and Fermented Organic Fertilizers
Establish Silage Processing Units from Crop Residues to Feed Milk Producing Cattle
Integrated Project to Produce Fish and Ducks in Pools
Strategy for Sustainable Agricultural Development till 2030(SETTING POLICY ENVIRONMENT
Enhancing Marketing Extension through Farmers’ Field-Schools
Technical Support to Producers' Collective/Group Marketing
Establishing Market Information System (MIS) for Agricultural Products
Defining, Monitoring, Evaluating the Risks of Drought, and Promote an Early Warning System
Developing the Capability of the Local Communities to Combat Drought
Assessing and Mitigating the Impact of Climate Changes
Post-harvest and Marketing Insurance for Main Agricultural Products
Extending Mushroom Farming
Developing Traditional Home Agro-Processing Activities
Establishing Marketing Centers for Milk Collecting and Processing
Developing Back yard Farming
Support to Institutional and Technical Capacities for Food Safety
Alleviating children hunger and undernourishment in the northern, eastern and Al Badia regions
Field Surveys for Vulnerable and Food Insecure Groups
Scaling up the “Food for Education” Programme
Supporting Small Farmers in Northern and Eastern Governorate
Medical testing to investigate malnourishment cases in northern and eastern governoratesEstablish Consumer Cooperative Societies to Support Poor Households in Northeastern
Piloting “Direct Income Transfer” Support System in the Three Eastern GovernoratesScaling up the National programme for Women Empowerment and Combat
Achieving Sustainable Agricultural and Rural Development and Reducing Poverty
Achieve and Enhance Food Security in Syria Outcome
Objectives
Outputs/ Activities
Impacts
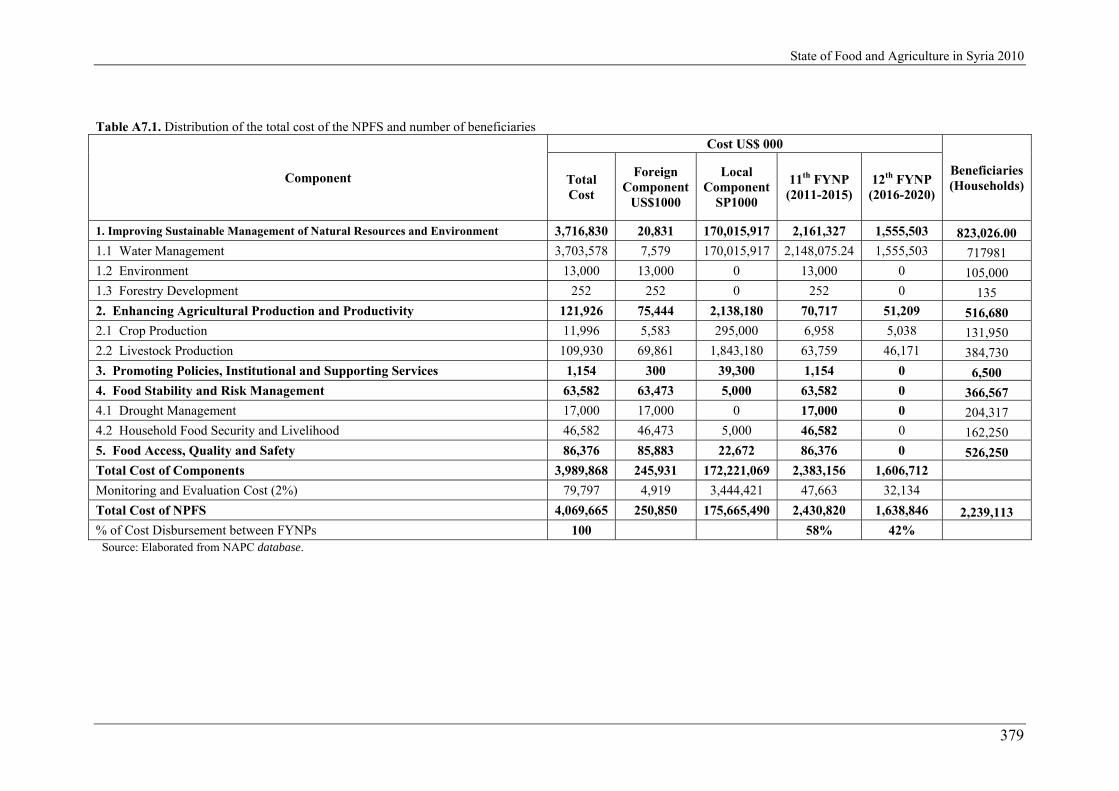
State of Food and Agriculture in Syria 2010
379
Table A7.1. Distribution of the total cost of the NPFS and number of beneficiaries
Component
Cost US$ 000
Beneficiaries (Households) Total
Cost
Foreign Component
US$1000
Local Component
SP1000
11th FYNP (2011-2015)
12th FYNP (2016-2020)
1. Improving Sustainable Management of Natural Resources and Environment 3,716,830 20,831 170,015,917 2,161,327 1,555,503 823,026.00 1.1 Water Management 3,703,578 7,579 170,015,917 2,148,075.24 1,555,503 717981 1.2 Environment 13,000 13,000 0 13,000 0 105,000 1.3 Forestry Development 252 252 0 252 0 135 2. Enhancing Agricultural Production and Productivity 121,926 75,444 2,138,180 70,717 51,209 516,680 2.1 Crop Production 11,996 5,583 295,000 6,958 5,038 131,950 2.2 Livestock Production 109,930 69,861 1,843,180 63,759 46,171 384,730 3. Promoting Policies, Institutional and Supporting Services 1,154 300 39,300 1,154 0 6,500 4. Food Stability and Risk Management 63,582 63,473 5,000 63,582 0 366,567 4.1 Drought Management 17,000 17,000 0 17,000 0 204,317 4.2 Household Food Security and Livelihood 46,582 46,473 5,000 46,582 0 162,250 5. Food Access, Quality and Safety 86,376 85,883 22,672 86,376 0 526,250 Total Cost of Components 3,989,868 245,931 172,221,069 2,383,156 1,606,712 Monitoring and Evaluation Cost (2%) 79,797 4,919 3,444,421 47,663 32,134 Total Cost of NPFS 4,069,665 250,850 175,665,490 2,430,820 1,638,846 2,239,113 % of Cost Disbursement between FYNPs 100 58% 42%
Source: Elaborated from NAPC database.

State of Food and Agriculture in Syria 2010
380
Table A7.2. Water Resources Management
Project Title
Cost Financing Sources (%) Implementation
Period (year)
Potential Source
of Funding
Foreign Component
US$1000
Local Component
1000 SP
Total Cost in
US$1000 Government Foreign Private
1.1.1. Development of the Tigris and Alkhabour Basin Areas
100,000,000 2,173,913 25% 75% 10
Kuwait Fund for Arabic Economic Development and other donors
1.1.2. Community-based Improved Water Management Practices in the North and Northeastern Arid Region
2,375 2,375 25% 75% 4 To be identified with the support of FAO
1.1.3. Expansion of Improved Packages of Water Harvesting in the Southern Region
1,403 1,403 25% 75% 3 To be identified with the support of FAO
1.1.4. Integrated Watershed Management and Enhanced Role of Natural Resources in Food Security in Coastal Area
3,039 3,039 23% 77% 3 To be identified with the support of FAO
1.1.5. Transfer to Modern Irrigation Systems 2010 – 2015
50,000,000 1,086,957 25% 75% 6 Local finance
1.1.6. Extending Euphrates Water to Palmyra, and Phosphate Mines, and then to the Industrial City of Hisia
20,000,000 434,783 25% 75% 6
Arab Fund For Economic And Social Development and other donors
1.1.7. Establishing Water Reservoirs in the Western Side of ALGhab Plain
515 515 25% 75% 1 To be identified with the support of FAO
1.1.8. Developing the Irrigation Network in Homs – Hama
247 15,917 593 25% 75% 1 To be identified with the support of FAO
All Water Projects
7,579 170,015,917 3,703,578
Source: Elaborated from NAPC database.

State of Food and Agriculture in Syria 2010
381
Table A7.3. Environment
Project Title
Cost Financing Sources (%) Implementation
Period (year)
Potential Source
of Funding
Foreign Component
U$$1000
Local Component
SP1000
Total Cost in
US$1000 Government Foreign Private
1.2.1. Expansion of the Project of the Integrated Development of the Syrian Al Badia
10,000 10,000 25% 65% 10% 5
To be identified with the support of FAO
1.2.2. Improving Productivity of Irrigated Reclaimed Lands in Euphrates Basin
3,000 3,000 25% 75% 5
To be identified with the support of FAO
Total Environment
Projects 13,000 0 13,000
Source: Elaborated from NAPC database.
Table A7.4. Forestry Development
Project Title
Costs Financing Sources (%) Implementation
Period (year)
Potential Source
of Funding
Foreign Component
US$1000
Local Component
SP1000
Total Cost in
US$1000 Government Foreign Private
1.3.1. Development of Environmental Tourism
140 140 25% 65% 10% 1
AOAD, Arabic and Regional Funding Agencies; IFAD and others
1.3.2. Exploiting Herbs and Medical Plants in Afforested Areas
100 100 25% 60% 15% 1
AOAD, Arabic and Regional Funding Agencies; IFAD and others
1.3.3. Development of Apiculture
12 12 10% 10% 80% 1
AOAD, Arabic and Regional Funding Agencies; IFAD and others
Total Forestry Projects
252 0 252
Source: Elaborated from NAPC database.

State of Food and Agriculture in Syria 2010
382
Table A7.5. Crop Production
Project Title
Cost Financing Sources (%) Implementation
Period (year)
Potential Source
of Funding
Foreign Component
US$1000
Local Component
SP1000
Total cost In
US$1000
Government Foreign Private sector
2.1.1. Sustainable Agricultural Production through Promotion of Conservation Agriculture
350 350 100% 2
Possible FAO TCP Project
2.1.2. Introduction of High Value Cash Crops
383 383 100% 2
Possible FAO TCP Project
2.1.3. Enhance Production of Domestic Seeds of Vegetables and Reliable Fruit Seedlings
295,000 6,413 70% 30% 20
To be identified with the support of FAO
2.1.4. Expand the Plantation, Classification and Export of Medical and Aromatic Plants
2,000 2,000 50% 50% 3
To be identified with the support of FAO
2.1.5. Enhance the Integration Crop and Livestock Production
150 150 20% 80% 2
To be identified with the support of FAO
2.1.6. Construct Refrigerating Units to Store Potato Seeds Produced by the National Project for Potato Seed Production
2,500 2,500 100% 2
To be identified with the support of FAO
2.1.7. Establish Integrated Organic Farm (Crop And Livestock Production) Licensed By Authorized Certificate Granting Organization
200 200 20% 70% 10% 5
To be identified with the support of FAO
Total Crop Production
Projects 5,583 295,000 11,996
Source: Elaborated from NAPC database.

State of Food and Agriculture in Syria 2010
383
Table A7.6. Livestock Production
Project Title
Cost Financing Sources (%) Implementation
Period (Year)
Potential Source
of Funding
Foreign Component
US$1000
Local Component
SP1000
Total cost in
US$1000
Government Foreign Private
2.2.1. Integrated Development of the Livestock Sector
65,000 65,000 25% 75% 8 IFAD
2.2.2. Integrated and Participatory Management of Steppe Resources in Homs Province
4,213 4,213 30% 70% 4 Local finance andInt. donors
2.2.3. Production and Distribution of Improved-Sheep (Awassi)
40,000 870 50% 50% 4 Local finance andInt. donors
2.2.4. Introduce Turkey Breeding in Rural Households
18,800 409 10% 90% 1 Local finance
2.2.5. Promote the Production of Domestic Chicken, and Set up middle-Size Production Units
86,480 1,880 10% 90% 2 Local finance
2.2.6. Integrated Project to Produce Fish and Ducks in Pools
715,500 15,554 10% 90% 1 r Local finance
2.2.7. Establish Silage Processing Units from crop residues to Feed Milking Cattle
310,000 6,739 70% 30% 1 Local finance,
2.2.8. Plant Flowering Sern Fodder under Olive Trees
24,000 522 100% 1 Local finance,
2.2.9. Training/Capacity Building on Enhancing the Nutritional Value of Agricultural Residues
2,550 55 30% 60% 10% 1
Local finance, and Int. donors
2.2.10. Intensive Sheep Breeding , and lambs' fattening Nearby Olive Fields
281,550 6,121 30% 70% 2 Local finance
2.2.11. Calf Fattening and benefit from Improved Agricultural Residues
289,300 6,289 30% 70% 2 Local finance
2.2.12. Fattening Units for Awassi male sheep (lamb) under Intensive System)
75,000 1,630 100% 2 Local finance
2.2.13. Production of biogas and fermented organic fertilizers (compost)
648 648 20% 80% 2 Local finance
Total Animal Production Projects
69,861 1,843,180 109,930
Source: Elaborated from NAPC database.

State of Food and Agriculture in Syria 2010
384
Table A7.7. Promoting Policies, Institutions and Supporting Services
Project Title
Costs Financing Sources (%) Implementation
Period (year)
Potential Source
of Finance
Foreign Currency
Component US$1000
Local Currency
Component SP1000
Total Cost
in US$1000
Government Foreign Private sector
3.1. Strategy for Sustainable Agricultural Development till 2030
300 2,000 343 15% 85% 1
To be identified through support from FAO
3.2. Enhancing Marketing Extension through Farmers’ Field-Schools.
9,000 195.7 50% 50% 2
To be identified through support from FAO
3.3. Technical Support to Producers Collective/ Group Marketing
15,300 332.7 50% 50% 2
To be identified through support from FAO
3.4. Establishing market Information System (MIS) for Agricultural Products
13,000 282.7 50% 50% 2
To be identified through support from FAO
Total Policies-
Institutions-Supporting
Services Projects
300 39,300 1,154.1
Source: Elaborated from NAPC database.

State of Food and Agriculture in Syria 2010
385
Table A7.8. Drought Management
Project Title
Costs Financing Sources (%) Implementation
Period (year)
Potential Source
of Funding
Foreign Component
US$1000
Local Component
SP1000
Total Cost in
US$1000 Government Foreign Private
4.1.1. Defining, Monitoring, Evaluating the Risks of Drought, and Promote an Early Warning System
7,000 7,000 25% 75% 5
To be Identified through support from FAO
4.1.2. Developing the Capability of the Local Communities to Combat Drought
3,000 3,000 25% 65% 10% 5
To be Identified through support from FAO
4.1.3. Assessing and Mitigating the Impact of Climate Changes
7,000 7,000 65% 25% 10% 5
Possibly WB, FAO and other Int. Partners
Total Drought Projects
17,000 0 17,000

State of Food and Agriculture in Syria 2010
386
Table A7.9. Household Food Security and Livelihood
Project Title
Costs Financing Sources (%) Implementation
Period (year)
Potential Source of Funding
Foreign Component
$1000
Local Component
SP1000
Total Cost
in US$1000
Government Foreign Private
4.2.1. Post-Harvest and Marketing Insurance for Main Agricultural Products
300 5,000 409 50% 50% 2
To be identified through support from FAO
4.2.2. Establishing Marketing Centers for Milk Collecting and Processing Project
6,292 6,292 10% 40% 50% 5
AOAD, Arabic and Regional Financing Agencies, IFAD and others
4.2.3. Developing back yard farming
34,691 34,691 10% 40% 50% 5
WHO,UNICIF, AOAD, Arabic, and Regional Financing Agencies, IFAD and others
4.2.4. Developing Traditional Home Agro-Processing Activities
4,690 4,690 10% 40% 50% 5
AOAD, Arabic, and Regional Financing Agencies IFAD and others
4.2.5. Extending Mushroom Farming
500 500 30% 20% 50% 1
FAO, AOAD, Arab, and Regional Financing Agencies, IFAD and others
Total Household
Food Security Projects
46,473 5,000 46,582
Source: Elaborated from NAPC database.
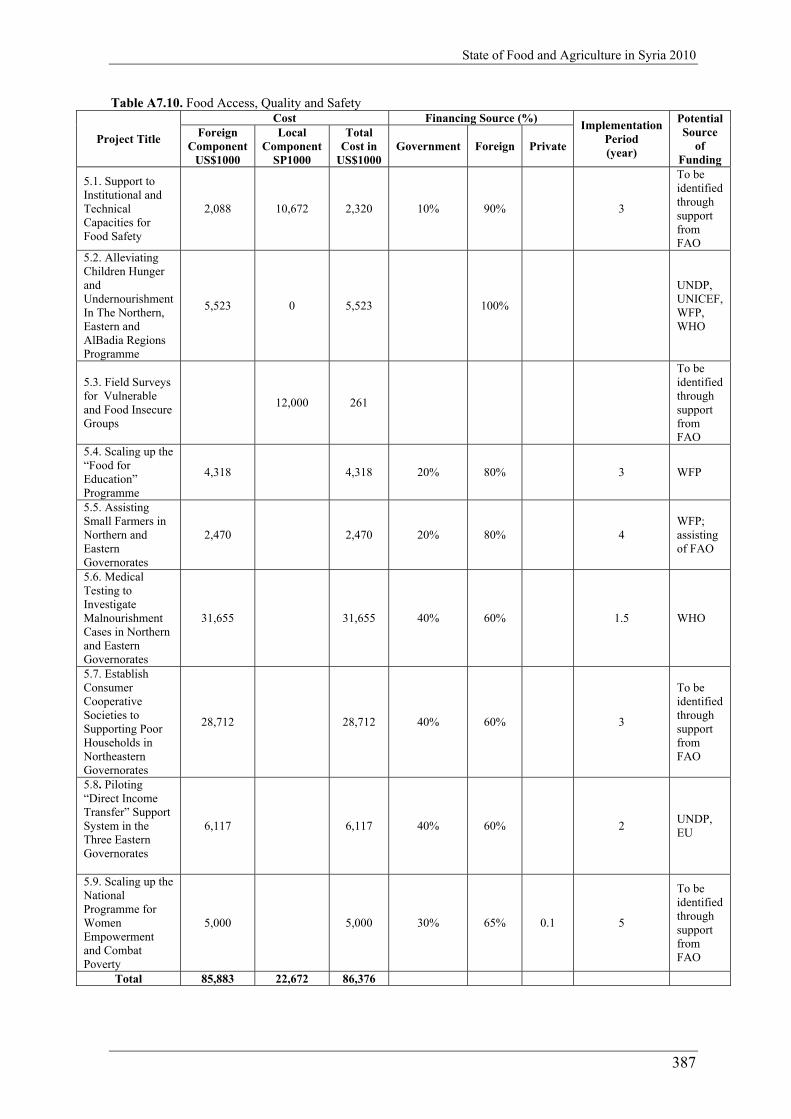
State of Food and Agriculture in Syria 2010
387
Table A7.10. Food Access, Quality and Safety
Project Title
Cost Financing Source (%) Implementation
Period (year)
Potential Source
of Funding
Foreign Component
US$1000
Local Component
SP1000
Total Cost in
US$1000 Government Foreign Private
5.1. Support to Institutional and Technical Capacities for Food Safety
2,088 10,672 2,320 10% 90% 3
To be identified through support from FAO
5.2. Alleviating Children Hunger and Undernourishment In The Northern, Eastern and AlBadia Regions Programme
5,523 0 5,523 100%
UNDP, UNICEF, WFP, WHO
5.3. Field Surveys for Vulnerable and Food Insecure Groups
12,000 261
To be identified through support from FAO
5.4. Scaling up the “Food for Education” Programme
4,318 4,318 20% 80% 3 WFP
5.5. Assisting Small Farmers in Northern and Eastern Governorates
2,470 2,470 20% 80% 4 WFP; assisting of FAO
5.6. Medical Testing to Investigate Malnourishment Cases in Northern and Eastern Governorates
31,655 31,655 40% 60% 1.5 WHO
5.7. Establish Consumer Cooperative Societies to Supporting Poor Households in Northeastern Governorates
28,712 28,712 40% 60% 3
To be identified through support from FAO
5.8. Piloting “Direct Income Transfer” Support System in the Three Eastern Governorates
6,117 6,117 40% 60% 2 UNDP, EU
5.9. Scaling up the National Programme for Women Empowerment and Combat Poverty
5,000 5,000 30% 65% 0.1 5
To be identified through support from FAO
Total 85,883 22,672 86,376

State of Food and Agriculture in Syria 2010
388
Annex Eight
Major Players in Agriculture and Agro-
Industries

State of Food and Agriculture in Syria 2010
389
Annex 8. Major players in agriculture and agro-industries
1. Local agencies
Ministry of Agriculture and Agrarian Reform (MAAR)
The MAAR is the public agency responsible for the development of the agricultural sector in Syria. It provides the policy directions and strategies and the planning for the sustainable agricultural growth and development. It implements the public role in the legitimate areas of public interventions to develop a competitive market-oriented agriculture and food processing. These areas comprise the use and protection of natural resources, public services, regulation and the growth of private investment in agriculture. Hence, the principal goals of agriculture are:
ensuring sustainable agricultural growth; maintaining food security for a fast growing population; enhancing and diversifying agricultural exports; providing adequate supply of raw materials for the domestic agro-industries; guaranteeing adequate levels of rural employment and curtailing migration to urban areas; achieving adequate targets of poverty alleviation and equitable levels of income distribution.
Consequently, the MAAR manages the activities related to crop production, livestock production, forestry, fishery and agricultural policies. Therefore, it provides services in the field of agricultural research, extension service, education, training, livestock production, animal health, plant protection (control), provision of production services, etc. To perform these tasks, it comprises many central directorates, departments, specialized bureaus for major products, 14 regional directorates and production establishments. These institutions are undergoing continuous changes in the framework of restructuring rural development institutions, which is generally viewed as an instrument of the adjustment to changes in the socioeconomic environment at the national, regional or international levels with a view to increasing their effectiveness and efficiency in achieving their mission, performing their roles and carrying out their functions.
In addition, the MAAR is in charge of the public investment related to agriculture so that its principal aims are achieved. It also encourages agricultural private investment through providing incentives, support and technical assistance. Moreover, it ensures the efficient implementation of the aforementioned investments and overcomes the investment gap in cooperation with foreign development partners. These foreign agencies provide development assistance.
Hence, the major institutions of the MAAR are:
General Commission of Agricultural Scientific Research (GCASR):
The GCASR was established by Law no. 42 dated 2001. It consists of 7 administrations (natural resources, crops, horticulture, cotton, plant control, livestock and economic research) to develop agricultural scientific research (ASR). The main tasks of this institution are creating high yielding varieties (wheat, barley, lentil, cotton, maize, sorghum, etc.), conducting research in the field of fruit trees (olives, citrus, apples) and improving animal breeds (cattle, sheep and goats). Its current research activities focus on the priorities of the Syrian agricultural strategy (SAS) such as drought and water management, resource protection, integrated control, improved quality, productivity increase and cost reduction.
General Commission for the Management and Development of Al-Badia (GCMDB):
It is responsible for the management and sustainable development of Al-Badia (Syrian Steppe) resources in cooperation with the local communities through its seven Al-Badia projects. Its major activities comprise: spreading out seeds and seedlings, protecting Al-Badia resources and utilizating Al-Badia wells to provide drink water for the population and livestock.
General Commission for the Development of Fishery Resources (GCDFR):
It focuses on the sustainable development of fishery resources through a good management and the assistance by providing the fishery inputs. In addition, it performs production activities and makes optimal use of water resources.
Extension, Training and Education Departments:

State of Food and Agriculture in Syria 2010
390
Their responsibility is directed towards extension, education and training programmes, knowledge transfer to farmers, the cooperation with the GCASR and the establishment of extension units. They also provide the required equipment and inputs for these activities.
National Agricultural Policy Center (NAPC):
The NAPC is a central directorate of the MAAR established in 2000 by the FAO project assistance GCP/SYR/006/ITA financed by the Italian Government. It is specialized in applied economic analysis of agricultural policies. Therefore, research and communication are the two pillars, which have emerged as a forum for agricultural policy debate.
Directorate of Planning and International Cooperation:
It gives great attention to the preparation and design of the agricultural production plan, investment plan, and unified plan of the agricultural sector and follows up these plans. It also issues the statistical information of the MAAR including the Annual Agricultural Statistical Abstract and other publications. In addition, it manages the relations with other countries.
Directorates of livestock Production and Animal Heath:
They are responsible for the provision of several services related to livestock production such as vaccination, artificial insemination, production of vaccines and sperms and their distribution to improve the productivity of the livestock.
Directorate of Plant Protection (control):
Its activities comprise the management of control activities, conduct of compulsory control and provision of some disinfection and control materials related to plant production.
Directorate of Forestry:
Its focus is on the sustainable development of forestry and the economic investment of forestry resources in cooperation with the local communities. It produces forestry seedlings, charcoal, fuel wood and industrial wood. In addition, it performs forestry roads and forestation activities.
Directorate of Agricultural Marketing:
It is concerned with the development of internal and external marketing activities through the establishment of a marketing information system and the conduct of studies on the movement of agricultural products in wholesale markets and post-harvest operations. It also focuses on the assessment of agricultural prices in both domestic and international markets.
Directorate of Economics and Investment:
It conducts economic studies, manages agricultural investments and studies the state of food and nutrition in the country. It also focuses on the assessment of the costs of agricultural products and their prices especially for the strategic crops. Food security issues and the improvement of the quality of agricultural products also fall under the directorate focus.
Directorate of Agricultural Affairs:
It focuses on crop production issues such as productivity, diseases, production, marketing and the activities of reclamation projects (crops and fruit trees). It is also concerned with technical issues related to crop production.
Directorate of Arab Horses Office:
Its focus is on the development, breeding and services of Arab horses. It also targets the selection of good races that are export oriented. In addition, it coordinates the activities in this field of business.
Directorate of Artificial Rainfall:
Its activities aim to make optimal use of rainfall resources so that the maximal precipitation rate is obtained and water resources are increased. It is also concerned with drought issues and drought management. In

State of Food and Agriculture in Syria 2010
391
addition, it follows up the movement of the precipitation on a daily basis to establish a database that helps assess adequate weather predictions.
Directorate of Agricultural Production Supporting Fund:
The Support Fund of Agricultural Production was established by the Decree no. 29 dated 5/5/2008 to improve food security, to enhance the economic efficiency of production, to strengthen the competitiveness of agricultural products and to achieve the decided agricultural policies. It supports the prices of agricultural products, agricultural production inputs and farmers in the case of disasters related to agricultural production bearing in mind that the current support schemes have gradually to be substituted complying with WTO rules.
Directorate of the Development of Rural Women:
This directorate has been established within the MAAR to:
Reduce poverty in the countryside by conducting surveys in the areas more exposed to poverty, which are chosen according to the poverty map of rural Syria, and study the impact of poverty on education, nutrition, health and the social status of rural women.
Strengthen the role of rural women in the development process through supporting them by the establishment of small, income-generating projects to increase the income of rural families. To do so, its activities focus on conducting training courses about the establishment and management of small projects and marketing skills, educating the female engineers operating in the directorate and founding a permanent center to sell and advertise the products of rural women.
Support the creation of job opportunities in the countryside through the establishment of 20 revolving funds in 20 villages, which are chosen according to the rural poverty map.
Agricultural Directorates in the Governorates:
Their number amounts to 14 directorates, one for each governorate. They have the same task as the MAAR, but on province level.
State Agricultural Companies:
These firms have been established to create jobs, to provide commodities at reasonable prices for consumers, to promote the private sector to enter thebusiness and to provide extension service for private firms to improve their efficiency. Their production, however, is very limited as compared to the private firms (about 1% of the total). They are administered by the MAAR. The current establishments are: the GESM, GEF, General Establishment for State Farming, General Establishment for Cattle, and General Establishment for Poltry. Currently, the Syrian government is intending to transform the service oriented companies into research units such as the GESM, and to gradually shut down the production oriented firms such as the General Establishment for Farming (liquidated, 10% retained for research purposes and the rest was distributed among farmers) and the General Establishment for Mechanization (liquidated); the current situation of the other establishments is under monitoring.
Joint-Ventures Agricultural Companies:
These companies are regulated under Decree No. 10 of 1986, where the contribution of the Government represented by the MAAR amounts to 25% of the company's capital paid in the form of land. By this decree, 7 companies were established. Two of them were out of business.
Ministry of Irrigation
The Ministry of Irrigation, which was established by Law No. 16 in 1982 to replace the different institutions controlling water resources, is currently in charge of following up, managing and planning both the use of water resources and coordination among water use associations. At the same time, this ministry is responsible for establishing the infrastructure of the irrigation public nets, licensing the wells and building dams.
General Peasant Union
It cooperates strongly with the MAAR and its tasks are in line with those of the MAAR, but it focuses on the cooperative sector. It encourages farmers to work together within cooperatives to benefit from credits, to provide inputs and to market their products. Cooperatives can be in the following forms: production

State of Food and Agriculture in Syria 2010
392
cooperatives, cooperatives of animal breeding, fattening cooperatives, cooperatives of poultry, cooperatives of silk worms, marketing cooperatives for vegetable, fruit and animal products, fishery cooperatives, cooperatives for breeding of Arab horses, cooperatives for breeding of camels, bees breeding cooperatives and multiple goals cooperatives.
Agricultural Chambers
It is a private agency responsible for the promotion of agro-industrial investment. Agricultural chambers are, to some extent, an alternative to co-operatives, as they represent individual farmers who are not associated to cooperatives; there is the possibility for a farmer to be member of both kinds of organizations, but this is really an exception. The first agricultural chamber was founded in Damascus in 1882; it was called Chamber of Commerce and Agriculture. In 1930, it was split into two separate chambers, of commerce and of agriculture. Now, there are 14 agricultural chambers, one per each governorate plus one for urban Damascus. The Syrian Federation of Agricultural Chambers was founded in 1990. In order to differentiate their task from those of other organizations acting in the same domain, agricultural chambers are seeking to concentrate their action in economic and marketing fields. Among projects at the level of each chamber are olive mills, storehouses, refrigerating units, etc. Each year, there is a prize for the best project. In the case of olive mills, the chamber gives loans to farmers without interest, provided they bring their olives to its mill. Other services of the agricultural chambers are: (i) organizing the participation of farmers in international exhibitions (especially in France, Germany and Italy), (ii) organizing each year in Syria an agricultural exhibition in different locations of the country, (iii) sponsoring scientific seminars with international consultantsand scientific research programmes, and (iv) offering scholarships in Syrian universities.
Agricultural Cooperative Bank (ACB)
It is affiliated to the Ministry of Finance and provides short, medium and long term loans and production inputs for the agricultural sector.
Ministry of Industry (MOI)
The MOI was first founded by the Act No 212 for the year 1958. It is a public agency aiming at planning, developing and administering industry so as to achieve a substantial increase in the national income and to foster the national economy. It promotes both publicly and privetly owned projects. As a consequence, its main responsibilities are:
proposing industrial development project drafts based on studies conducted on this purpose; drafting development policies for the various industrial sectors in line with domestic demand and
export potentials; involving private and compound sectors to take part in achieving the goals of the government; marketing and exporting MOI affiliated organizations and companies products to help develop the
national industry and national economy, and representing the country in national negotiations with this aim;
coordinating the collaboration between the public and private sectors and other industrial sectors; Following up with the part related to MOI in the economic plan of the country; participating in domestic and foreign fairs and exhibitions; setting standards for national products and conformity inspection; supervising Chambers of Industry; promoting handicrafts.
To perform the above-mentioned objectives, the MOI consists of head quarters, departments, directorates in provinces, affiliated organizations and companies, support institutions and centers, companies directly linked with MOI, institutes and extra-ministry affiliates. Its most important institutions are:
Marketing Department:
Marketing department is one of the main and central directorates at the MOI. It deals with marketing studies and research, foreign currency, commercial affairs and trade exchange, international affairs, exhibitions and conferences, register and correspondence.
Financial Department:
This department is concerned with expenses, balances, salaries, compensations and fuel accounting.

State of Food and Agriculture in Syria 2010
393
Production Department:
It is one of the central administration directorates in the MOI. It supervises production activities in the affiliated organizations and companies and conducts the studies necessary to reach the optimal usage of machines, equipment, and materials. It also does research to find local alternatives for imported materials, spare parts and equipment in cooperation with the relevant entities.
Vocational Training and Qualification Department:
It was established by Decision No. 7519 dated 05.12.1989.
Directorate of the Industrial Private Sector:
It is the Government body responsible for organizing the industrial private sector affairs with the state to reduce problems and costs, avoid discrepancies, enhance the overall performance of the administrative structure, and lead to stronger and more coherent industrial fiber with enhanced competitiveness.
Planning and Statistics and Economic Affairs:
It deals with planning, statistics and economic affairs.
Industrial Research and Testing Center:
It was set up by the legislative Decree no.71 in 25/3/1965. The various divisions and units of the center cooperate to carry out the following aims: 1. Publishing both researches and studies required for industrial purposes, 2. Popularizing rules of quality assurance in industrial plants, 3. Conducting quality and production control, 4. Providing studies and technical economical advice to the existed and prospective industries, 5. Conducting tests and analyses required by industry and trade, 6. Providing reliable services in the field of research, measure, standards and analyses, 7. Issuing certifications tests and inspecting the conformity of the products to the prescript specifications, 7. Training and qualifying technical personnel from inside and outside the center on the center various activities, 8. Organizing and holding specialized scientific meetings, seminars and courses, 9. Offering informational, documental and office services, 10. Cooperating with foreign, national, official and private organizations in order to achieve the purposes mentioned before.
Productivity and Management Development Center:
This institution focuses on upgrading professional abilities of administrative as well as technical staffs by providing training on best practices and up-to-date techniques and methodologies with the aim of enhancing productivity and quality at MOI affiliated companies and organizations, supplying administrators and technicians for the smooth running of projects, and doing studies and research requested by other institutions in their efforts to solve problems, such as production cost lowering.
Standardization and Metrology Organization or General Commission for Arab standards and Measures:
It was established by the legislative Decree no. 248 dated 1969. Its functions and purposes are: setting and confirming the standards of all the commodities and products, issuing the specifications related to the standardization, terms, definitions, expressions methods of taking samples and ways of testing, modifying and modernizing the certified metrology according to the technical and scientific latest developments, popularizing standards with the most suitable ways, generalizing the knowledge with standardization and coordinating the works related to the Syrian Arab republic, setting rules of granting conformity certification and assurance quality, organizing the mechanism of its issuing and seeking membership in the international, regional and Arab organizations of metrology and standardization.
General Organization (Establishment) of Food Industries (GOFI):
It was established by Decree no. 1849 of 1975. Its objectives are establishing and developing food industries and full supervising on branch companies. Its main products are vegetable oils, soap, tomato paste, apricots jam, peas, pasteurized milk, biscuits, beer, arak, macaroni, dry union, peanuts, gaseous drinks and mineral water.

State of Food and Agriculture in Syria 2010
394
General Organization of Sugar Industries (GOSI):
It was established by Decree no. 1446 of 1975. Its Objectives are establishing and developing sugar industry and its derivatives, supervising the affiliated public companies and setting up projects related to this industry included in the economic plan of the government. The affiliated companies are Homs Sugar Company, Al-Ghab Sugar Company, Tal Salhab Sugar Company, Maskana Sugar Company, Al-Raqqa Sugar Company, Dair-Ezzor Sugar Company, Shahba Yeast Factory (Aleppo), Damascus Yeast Factory, National Yeast Factory (Harasta).
General Organization of Textile Industries (GOTI):
It was established by Decrees no. 2174 and 2175 of 1975. Its objectives are establishing and developing textile industries and full supervising on branch companies. Its main products are cotton yarns, synthetic and mixed woolen yarns, grey, printed, bleached and dyed cotton fabrics, woolen, mixed and synthetic fabrics, readymade garments, underwear, woolen carpets, socks, pure silk, medical cotton, medical bandage, satin thread and oven belts.
General Organization for Cotton Ginning and Weaving (GOCGW):
Established by Decree no 106 of 1965, this organization had the name “General Commission for Cotton Ginning and Marketing”; later came Decree no 2100 of 1975 to rename it as “The General Organization for Cotton Ginning and Weaving”.
General Organization of Tobacco (GOT):
It is considered one of the organizations of economic character related to MET and was established in 1935, and then under Decree no. 2640 of 1975 , it has taken responsibility of tobacco and tobacco monopoly with all its rights and duties.
General Organization for Engineering Industries (GOEI):
It is the organization responsible for the engineering public sector companies. It encompasses 13 firms, to which belong both the Matches, Wood and Pencils Company and Arab Company for Wood.
General Organization for Chemical Industries (GOCI):
It was established by Decree no. 2387 of 1975 including the leather industries.
Syrian Federation of Industrial Chambers
It is a private organization in charge of promotion of private industrial investment of all kinds. It was established in 1935 to develop and expand the industrial sector mainly through providing services and expertise, coordinating with the government, conducting studies and research targeting the industrial sector and executing exhibitions for industrial products.
Syrian European Business Center (SEBC)
It is a private institution founded in 1996. It is a structure, founded by the EU, with the objective of improving the Syrian business environment. Its activities are business consultation, organization of export promotion, realization of feasibility studies, management of company to company business and assistance of Syrian companies’ participation in exhibitions abroad. It is now the leading organization supporting the Syrian economy by serving as an implementation agency for projects aimed at developing the private sector and the evolution of Syria into market economy. In other words, it is the catalyst institution for private sector development and growth in Syria. Leading by example and serving as a role model, it adopts innovative styles, bottom up approach and demand driven techniques to achieve its set objectives; these are:
increase the Syrian private sector competitiveness in local and international markets; assist Syrian private sector enterprises to access international markets; enhance the business community through increasing the number of enterprises with high growth
potential and evolving capability in addition to providing them with the required support; promote the positive development of the Syrian organizational and financial framework to uphold
development of private sector enterprises; facilitate the establishment of an efficient network of business support institutions.

State of Food and Agriculture in Syria 2010
395
Industrial Bank (IB)
It is affiliated to the Ministry of Finance and provides short, medium and long term loans for the industrial sector.
Ministry of Economy and Trade (MET)
It is responsible for the management of local and external trade as well as for the quality and health control including food products. It establishes the national specifications and measures in cooperation with the General Arab Commission for Standards and Measures.
Ministry of Health
It is responsible for the health control of food products and water in addition to its main tasks.
General Commission of Employment and Project Development
Its activities are dedicated to the creation of employment opportunities and the provision of technical assistance for income generating projects (small to medium).
General Commission of Investment
It is a public institution that was founded by Decree No. 9 dated 1/27/2009 to implement the national investment policy and to develop and strengthen the climate for investment of the country. It is a recent agency that has solely emerged in harmony with the considerable development of private sector investments. Public investments play a very miniscule role. The major tasks of the Commission are:
setting up the foundations and standards related to investment in order to facilitate the investment procedures;
establishing the investment map in coordination of the relevant institutions considering the strategic importance of the projects in order to advertise them both internally and externally;
providing advice and data for investors; Sharing in the preparation of investment agreements and protocols; conducting all advertising activities to attract and promote investment; studying and examining license applications represented by investors willing to set up an industrial
projects and assessing the feasibility of the suggested projects according to the criteria of Investment Law No.10 dated 1991, article /4/ which are: being in harmony with the objectives of the overall development plan of the country, utilizing indigenous resources as much as possible, contributing to the GDP growth and rationalizing import, deploying modern machinery and technology to meet the needs of the national economy and examining the value of fixed assets which are to be put in the project; for example, equipment, tools and machinery should not be under US$0.22 million;
complementing the procedures of the industrial license, which consist of an investor file, the legalization of the feasibility studies presented by the investor and the legalization of the list of required equipment, machinery and supplies;
following up the execution of the project through sending correspondence to the relevant directorates of industry in order to issue the required permits for importing service vehicles, adding some machines, changing the country of origin for some machines and canceling some machines; all of this is according to the instructions of the Supreme Investment Council;
approving part or the whole of the industrial record after making sure of its compliance with inclusion decision and the contents of the feasibility study;
studying and verifying the amended feasibility studies presented by some investors prior to or during execution of their projects and the expansion studies of running projects which have a complete industrial record and submitting them to the Supreme Investment Council after the approval of Minister of Industry;
archiving the documents and the files related to investors; processing the data related to the industrial projects licensed subject to Investment Law No. 10 for
quick reference; offering help and administrative support to investors to enable them to finish setting up their projects
as well as eliminating the obstacles in their way by contacting other competent bodies.

State of Food and Agriculture in Syria 2010
396
Overall Commission for Scientific Research
The Government founded this institution by Decision no. 68 dated 08/17/2005 to coordinate research activities and to enhance scientific research in general.
Overall Commission for Export promotion
The state established this institution to enhance Syrian exports and foreign trade competitiveness.
2. International and regional organizations
Food and Agriculture Organization of the United Nations (FAO):
Since its founding in 1945, it has focused special attention on developing rural areas. It leads international efforts to defeat hunger, serving both developed and developing countries. FAO acts as a neutral forum where all nations meet as equals to negotiate agreements and debate policy. FAO is also a source of knowledge and information. It helps developing countries and countries in transition modernize and improve agriculture, forestry and fisheries practices and ensure good nutrition for all.
FAO-Syria assists in developing the food and agricultural sector in a way that meets Syria long-term plans in human and economic development. FAO assistance is provided upon official Government requests in the fields that fall within FAO mandate (agricultural policies and production, irrigation, food security, food legislation, natural resources conservation and environment).
United Nations Development Programme (UNDP):
The UNDP is advocating for change and connecting countries to knowledge, experience and resources to help people build a better life. At the global level, UNDP’s focus is on helping countries build and share solutions to the challenges of: Democratic Governance, Poverty Reduction, Crisis Prevention and Recovery, Energy and Environment, Information and Communication Technology and HIV/AIDS. The UNDP in Syria is designed to address two functions:
To meet the increasing demand for policy advice and capacity building in support of the government’s economic and social transformation, and
To position the UNDP in its rightful place among the donor community as the proponent of human centered, participatory and sustainable socio-economic development. In this context, the program has a strong advocacy component.
European Union (EU):
The EU is an economic and political union of 27 member states, located primarily in Europe. Committed to regional integration, the EU was established by the Treaty of Maastricht on 1 November 1993 upon the foundations of the European Economic Community. It maintains common policies on trade, agriculture, fisheries and regional development. It develops its relations with Syria at an increasing rate. Examples of its intervention in Syria can be presented as follows: the modernization of institutions, management of olive-oil industries, support of the establishment of a commission for small and medium-sized projects and development of vocational training. These investments are related to both agriculture and industry. Therefore, the EU cooperates with both the MAAR and the MOI to perform the aforementioned investments.
International Fund for Agricultural Development (IFAD):
In Syria, it has granted funds for agricultural and rural development projects such as the Southern Area, Jaba AlHos, Coastal and Middle Area, Idleb, Syrian Steppe and Northern-Eastern Area. In addition, it focuses on water resource management, agricultural management, processing, treatment and marketing of milk, extension service, improvement of the gross margin of dairy products and property right. These activities are conducted in association with governmental bodies.
United Nations Industrial Development Organization (UNIDO):
The Organization's primary objective is the promotion and acceleration of industrial development in developing countries and countries with economies in transition and the enhancement of international industrial cooperation. UNIDO believes that competitive and environmentally sustainable industry has a

State of Food and Agriculture in Syria 2010
397
crucial role to play in pushing economic growth, reducing poverty and achieving the Millennium Development Goals. It helps Syria modernize its industries in partnership with the MOI.
Italian Trade Commission (ICE):
It is a government agency working under the mandate of the Italian Ministry of Foreign Trade. It promotes the internationalization of Italian companies, particularly SMES (small and medium-sized enterprises). In Syria its head office is in Damascus.
JICA-Japan:
It plays an important role in upgrading Syrian agriculture and the industrial sector.
Arab Fund for Economic-Socio Development (AFESD):
This institution supports the development projects in all Arab countries by providing the foreign currency to purchase equipment, to develop infrastructure and to conduct other activities. It has granted funds for several activities in Syria such as reclamation and development projects in the southern area, Jaba AlHos, coastal area, middle area and Idleb.
Arab Center for Studying Agricultural Dry Areas (ACSAD):
It focuses on the development and preservation of the dry areas in the Arab world. It accomplished several activities in Syria such as assessment of livestock resources, evaluation of fodder resources, improvement and distribution of livestock breeds and capacity building.
Arab Organization for Agricultural Development (AOAD):
The AOAD was established in 1970, upon the desire of the Arab countries. Realizing the vital role of agriculture within the region's economy, the Arab countries recognized the need for coordination between their different policies in agriculture, natural and human resources as well as economic development, in order to achieve the ultimate goal of fully integrated Arab economies. It started operating in 1972. Due to the abundance of Sudan's natural resources, in particular in agriculture, Khartoum was selected to host the organization's headquarter.
Arabic Industrial Development and Mining Organization (AIDMO):
In a summit in Kuwait 1966 the Arab League Council decided to establish an organization to improve and develop the Industry in general. The decision was approved by the Arab Economic Council in 1968. The headquarters was decided to be established in Cairo. In 1975, the Arab Ministries of Industries decided to free the organization from Arab League influence and was claimed as an independent organization.

State of Food and Agriculture in Syria 2010
398
Table A8.1. Contact information Agent Website E-mail Phone Fax Mobile Location
Ministry of Agriculture and Agrarian Reform
www.syrianagriculture.org [email protected] 00963 11 2213613 00963 11 2244078
Damascus - Baramkeh
National Agricultural Policy Center
www.napcsyr.org NAPC-
[email protected] 00963 11 5455371
00963 11 5455369
Damascus – 5th Bridge – Airport Highway
Usama Saadi Samir Jrad
www.napcsyr.org [email protected]@gmail.com
00963 11 4725880 00963 11 5455369
00963 11 5455369
00 963 0992042532
Damascus – 5th Bridge – Airport Highway
Directorate of Statistics and Planning
www.syrianagriculture.org [email protected] 00963 11 2213613 00963 11 2244078
Damascus - Baramkeh
Ministry of Economy and Trade
www.Syrecon.org [email protected] 00963 11 2213514 00963 11 2324684
Damascus
Ministry of Industry www.syrianindustry.org 00963 11 372 0959
00963 11 223 10 96
Damascus, SYRIA
General Organization for Sugar Industries
www.gofs.org [email protected] Homs
General Organization for Chemical Industries
www.chemical-syria.net [email protected] 00963 11 2122917 00963 11 2128289
Baramkeh – Damascus
General Organization for Food Industries
www.syriafoods.net [email protected] 00963 11 2457011 00963 11 2457022
Damascus, Fardoos
General organization for Textile Industries
www.syr-textile.com [email protected] 0096311 2215262 0096311 2216201
Damascus,Al Fardouss Street
General Organization for Engineering Industries
www.Handasieh.org [email protected] 0096311 2122650 0096311 2123375
Abu Baker Al-Sideek St.Baramkeh, Damascus, SYRIA
The General Organization for Cotton Ginning and Weaving
www.cmo.gov.sy [email protected] 00963-21-2238486 00963-21-2212697
Aleppo – Bab Al-Faraj
General Organization for Tobacco Industries
www.gotsyria.com [email protected]
Central Bureau of Statistics www.cbssyr.org mailto:[email protected]
mailto:[email protected]
Takieddin Group www.ibl-group.com [email protected] 00963 11 3340968 00963 11 3315632
Damascus-Hamra Street- Nahhas building
State of Food and Agriculture in Syria 2010
399
Annex Nine
Methodological Guide

State of Food and Agriculture in Syria 2010
400
Annex 9. Methodological guide
This annex introduces a proposed general methodology to analyze indicators related to the agricultural and food sector in Syria relying on various analysis tools. This methodology can be adopted to assess the development of the selected measures and its underlying factors in the short, medium and long terms. To do so, some analysis tools are used such as descriptive analysis, changes between periods, growth rates, index numbers and others. Hence, describing a statistical event can be performed by using several measures such as the mean, minimum, maximum, coefficient of variation (both mean and trend based) and distribution based indicators.
The sample mean can be calculated by using the following formula:
Ῡ = ∑yi/n
Where Ῡ, yi and n denote the sample mean, orginal observation and number of observations, respectively.
Coefficient of variation (CV), which traces the variations around the mean, can be estimated from the following formulas:
CV = standard deviation/mean * 100 or
CV = standard deviation of (yi-ỹi)/ỹi * 100, where yi and ỹi indicate current and trend values, respectively.
1)( 2
ns xxi
Where s, xi and x denote standard deviation, actual observation and mean, respectively. CV is better suited than standard deviation to compare events.
A more complete way to analyze income distribution than using CV is accomplished by constructing the Lorenz Curve, which traces the relationship between the cumulative income and cumulative population, and estimating the Gini coefficient80 (Figure A9.1). According to Figure A9.1, the Gini coefficient results from dividing area G by area OMN and varies from 0 (perfect equality) to 1 (perfect inequality).
Figure A9.1. Inequality of income
Cumulative income (%) M1
2
O NCumulative population (%)
1 45 degree line (perfect equality)2 Lorenz curveG Shaded area
G
Source: Elaborated by the rapporteur.
Several probability desity functions can also be used to dermine the distribution of a statistical event as illustrated in Box A9.1.
80 For more details, see Sadoulet and de Janvry (1995).

State of Food and Agriculture in Syria 2010
401
Box A9.1. Probability distribution The Central Limit Theorem states that for sufficiently large observations (n), the sample mean µ has an approximately normal distribution regardless of the form of the population distribution.
A large body of statistics is based on the assumption that the data follow the normal distribution (Gaussian distribution). A continuous random variable (r.v.) X has a normal distribution with parameters µ (mean) and σ2 (variance), denoted by X ~ N (µ, σ2), if its probability density function (p.d.f.) is given by
f(x) = exp[−(x − μ)2 / (2σ2)] / [(2π)1/2σ] for - ∞ < x < ∞, where - ∞ < µ < ∞ and σ > 0, where σ denotes the standard deviation.
A normal r.v. Z with a zero mean and unit variance (Z ~ N (0, 1)) is called a standard normal r.v., and its distribution is called the standard normal distribution. Any normal r.v. can be transformed to a standard normal r.v. by subtracting its mean and then dividing by its standard deviation. This is called standardizing. If X ~ N (µ, σ2) then
Z = (X-µ)/σ ~ N (0, 1).
A distribution commonly used to model r.v. is the lognormal distribution, where x is transformed into ln x. Then, the p.d.f. will be expressed in the form:
f(x) = exp{−[ln(x) − μ]2 / (2σ2) }/ [x (2π)1/2 σ] for x > 0.

State of Food and Agriculture in Syria 2010
402
Source: Tamhane and Dunlop (2000).
The dynamic of a statical event can be assessed as follows:
Change% = (yi-yo)/yo * 100, where yi and y0 denote current and base values, respectively; yi and yo represent either single year or three years average estimates.
AGR = (Power (yi/y0, 1/N)-1)*100, where N and AGR denote number of years (n) – 1 and annual growth rate, respectively.
In addition, several statistical measures can be estimated using the following formulas:
Self-sufficiency ratio = aggregate domestic production/aggregate food availability *100
Import dependency ratio = aggregate imports/(aggregate domestic production + aggregate imports)
Land productivity = gross output/land; it can be estimated at current and constant prices, but, the later is considered better.
Land profitability = GDP/land; see land productivity.
Labour productivity or profitability can be estimated using the same formulas mentioned above, but, by using labour instead of land.
Revealed Comparative Advantage Index (RCAI) is considered as one of the most important indicators that evaluates product competitiveness in foreign markets. The RCAI equation is: RCA= (value of Syrian exports of a given product / value of world exports of the same product) / (value of total Syrian agricultural exports/value of total word exports).
Relative Unit Value (RUV) evaluates the unit value of a given product for a specific country relative to the average world value. Unit value is used as proxy for prices since the latter are not always easily available for individual products or even for some industries. The reference value or average RUV is 1, i.e. the unit value for Syria equals the unit value in the world market. If the RUV is below (above) 1, then Syria exports its products at a lower (higher) “price” than the world average “price”. In some occasions, higher unit values may reflect, other things being equal, high products quality rather than low price competitiveness.

State of Food and Agriculture in Syria 2010
403
Comparative advantage:
Comparative advantage analysis is the framework by which the financial and economic profitability of any activity is determined via assessing the returns of this activity in the absence of market distortions. In other words, comparative advantage analysis focuses on the calculation of the real costs (economic costs), relying on the international prices, or the opportunity cost to determine the probability of the activity to be profitable when the policies causing the divergence between domestic and world prices are not present.
Comparative advantage of a production system is assessed through the Policy Analysis Matrix (PAM) by which the impact of governmental interventions (current policies) and market distortions is evaluated considering the social prices (Table A9.1). The PAM is the tool used to analyze market failures and policy interventions by studying the impact of these policies considering all the agents of the commodity chain from the farm gate until the wholesale market or where the foreign and local products are unified.
Table A9.1. The Policy Analysis Matrix Item Revenues Costs of tradable inputs Costs of domestic factors Profit
Private prices A B C D Social prices E F G H Divergence I J K L Source: Elaborated from NAPC database.
According to Table A9.1, the PAM consists of three rows and 4 columns. The first row of the matrix presents the aggregate budget of the system at market prices. The second row illustrates this budget at social prices by considering the distortions, either by adding them to or subtracting them from the first row. The social budget is assessed by using the world prices as reference for outputs, and eliminating the taxes from the value of tradable inputs and adding the subsidy to the value of the latter. The third row includes the divergences between social and private prices. The columns discriminate between tradable goods (final and intermediate) and domestic resources. By definition domestic resources are items that are not traded internationally such as labour, land and capital. The measures (revenues, costs, profit) of the PAM are calculated at both private and social prices. The revenues represent the sales. The profit is calculated by subtracting the costs (tradable goods and domestic resources) from the revenues.
To assess the performance of the agents and to compare between their efficiencies, several indicators derived from the PAM are used as illustrated in Table A9.2. Some of these indicators can also be used for analyzing statistical events. The second indicator of Table A9.2 was adopted to derive the competitiveness index or indicator to evaluate the performance of agriculture. But, in reality, assessing competitiveness is more complex, thus requiring the estimation of several indices. Some of them are presented below.

State of Food and Agriculture in Syria 2010
404
Table A9.2. Indicators of the PAM Indicators Formula Meaning
1. Financial Profitability (FP) [D = A - B - C] Absolute value of the profit generated by the system at private price
2. Financial Cost-Benefit Ratio (FCB) [(C+B) /A] Indicator of the competitiveness of the system. If FCB<1, the system is competitive, if FCB>1 the system is not competitive, FP is negative
3. Social Profitability (SP) [H = E - F - G] Absolute value of the profit generated by the system at social price.
4. Domestic Resource Cost (DRC) [G / (E - F)] Indicator of the comparative advantage of the system. If DRC<1, the system has comparative advantage, meaning that less value of domestic factors (labor, capital…) is used than the added value generated (VA= E-F), if DRC>1 the system has no comparative advantage, SP is negative.
5. Social Cost-Benefit Ratio (SCB) [ (F + G) / E ]
Another indicator for measuring the comparative advantage of the system. It takes into account the full cost of production (F + G) instead of the Domestic factors only. It is a more appropriate ratio to rank the relative position of different systems when they have different cost structures (i.e. tradable and non-tradable), because the DRC is biased in favor of the system that has a high share of tradable.
6. Transfers [L = I - J - K] Absolute value of the transfer between the economy and the system
7. Nominal Protection Coefficient (NPC) [A / E] Indicates the level of protection for the main output, if NPC> 1, the system benefits from a protection, if NPC<1 the system is taxed.
8. Effective Protection Coefficient (EPC) [(A - B) / (E - F)] Indicates the total level of protection taking into account the effect of the policy on the private value of the tradable output and tradable input.
9. Profitability Coefficient (PC) [D / H] Measures the impact of the policy on the profitability of the system. If PC>1, the system benefits from a net transfer from the economy, if PC<1, the economy benefits from a net transfer from the system.
10. Producers Subsidy Ratio (PSR) [L / E] Indicator of the impact of the policy/market distortion on the increase (+) or reduction (-) of the total revenue of the system at social price. i.e. magnitude of the divergence from the reference situation at social price to the current situation at market price
11. Equiv. Producer Subsidy (EPS) [L / A] Indicator of the impact of the policy/market distortion on the increase (+) or reduction (-) of the total revenue of the system at market price. Equivalent to the Producer Equivalent Subsidy (PSE) as defined by OECD for trade negotiations. If + it is producer subsidy, if – its consumer subsidy.
Source: Elaborated from NAPC database.
State of Food and Agriculture in Syria 2010
405
Ease of doing business index:
The ease of doing business index is a relative measure of how well the business climate facilitates efficiency in ten stages of a business's life, i.e. starting a business, dealing with licences, employing workers, registering property, getting credit, protecting investors, paying investors, paying taxes, trading across borders, enforcing contract and closing a business. One of the main merits of the ease of doing business index is that it covers, in depth, the most regulation directly affecting business operation. It is a good attempt to determine what regulation constitutes binding constraints, which reform packages are most effective and how these issues are shaped by the country context, but it says little about the effect of other policies and institutional arrangements, such as the effect of macroeconomic policies, quality of infrastructure, proximity to markets, security of poverty, gender biases in business regulations and transparency of government procurement.
Global competitiveness index:
Global competitiveness index (GCI) provides an overview of critical drivers of productivity and competitiveness, categorized into nine pillars: institutions, infrastructure, macroeconomy, health and primary education, higher education and training, market efficiency, technological readiness, business sophistication and innovation. One of the major advantages of the GCI is its holistic nature, stemming from understanding national competitiveness as a set of factors, policies and institutions that determine the level of productivity in a country. The GCI also recognizes the importance of the macroeconomic environment, human development, market efficiency, technology and innovation in developing and sustaining global competitiveness. The main limitations of the index, however, are: first, that it focuses on macroeconomic features and offers no industry or sector-specific appraisal of the operating environments. Second, the discussion on market efficiency fails to capture the critical value chain components that enhance or hinder competitiveness in any given industry. Third, the issue of geographic location of firm and proximity to market also remains unaddressed.
The growth competitiveness index:
The growth competitiveness index is a characterization of a set of institutions and economic policies that support high rates of economic growth over the medium term (over the coming 5 years). The index is based upon a country’s performance in three areas : level of technology, quality of public institutions and macroeconomic conditions related to growth. It attempts to incorporate many factors that drive productivity into a broader measure of competitiveness.
Current competitiveness index:
The Current competitiveness index (CCI) evaluates the underlying conditions that define the current level of productivity. It uses macroeconomic indicators to estimate the set of institution, market structures and economic policies supportive of high current levels of prosperity, thus giving an indication of the effectiveness with which an economy utilizes its current stock of resources. The additional value of this index is that it goes beyond examination of aggregate variables to capture the microeconomic conditions that support a high level of sustainable productivity.
The Business competitiveness index:
The Business competitiveness index (BCI) highlights, in detail, the microeconomic underpinnings of competitiveness, emphasizing a range of company-specific factors conducive to improving efficiency and productivity. The BCI is based upon two sub-indices that focus on these two foundations. Factors that drive company strategy include production processes, staff training, marketing, capacity of innovation, branding and value chain, whereas those that affect business environment include factor conditions, demand conditions, nature of related and support industries, firm strategy and domestic rivalry. The BCI has clear advantage of focusing on the local business environment, the environment of primary relevance to firms. Nevertheless, the main limitation of the BCI is that it is ultimately an aggregated national index.

State of Food and Agriculture in Syria 2010
406
References and data sources
Aljabery, Lamia. 1984. Good Appetite. Beirut, Lebanon.
AOAD. 2007. State of Food Security in the Arab World. Khartoum, Sudan.
AOAD. 2007. Country Paper on Polices and Legislation related to Food Control in Syria:
Coordination and Development on the Local and Arab Levels. Damascus, Syria.
AOAD. 2009. Impact of Soaring Food Prices on the Livelihood of Arab People. Khartoum,
Sudan.
Beyer Hans and Walter Emil. 1977. Firm Analysis. Verlag Die Wirtschaft, Berlin,
Deutschland.
Bickel Gary, Nord Mark, Price Cristofer, Hamilton William and Cook John. 2000. Guide
to Measuring Household Food Security. USDA.
Coates Jennifer, Swindale Anne and Bilinsky Paula. 2007. Household Food Insecurity
Access Scale (HFIAS) for Measurement of Food Access: Indicator Guide. Version 3, Food
and Nutrition Technical Assistance Project (FANTA).
CBS. The Annual Statistica Abstract. Various issues.
CBS. 2004. Family Budget Survey 2003-2004. Damascus, Syria.
CBS. 2007. Family Budget Survey 2006-2007. Damascus, Syria.
CBS and UNICEF. 2008. Multiple Indicator Cluster Survey 2006. Damascus, Syria.
CBS. 2009. Family Budget Survey 2008-2009. Damascus, Syria.
Devereux Stephen, Baulch Bob, Hussein Karim, Shoham Jeremy, Sida Helen and Wilcock
David. 2004. Improving the Analysis of Food Insecurity. FIVIMS.
Ecker, Olivier and Qaim Martin. 2008. Income and Price Elasticities of Food Demand and
Nutrient Consumption in Malawi. Göttingen, Germany.
FAO. 1998. Implications of Economic Policy for Food Security: A Training Manual, by
Thomson Anne and Metz Manfred. Rome, Italy.
FAO. 2002. FIVIMS Indicators. Rome, Italy.

State of Food and Agriculture in Syria 2010
407
FAO. 2005. The State of Food and Agriculture. Rome, Italy.
Food and Agriculture Organization of the United Nations (FAO), 2007. Agro-industrial
Supply Chain Management: Concepts and Applications. Rome, Italy.
FAO. 2008. Expansion in Bio-fuel and Soaring Food Prices: Implications for Agricultural
and Food Policies in the Near East and North Africa, by Elamin, Nasredin. NENARNAP,
Cairo, Egypt.
FAO. 2008. The Crisis of Soaring Food Prices: Background, Recent Developments and
Possible Policy Actions, by Saade, Maurice. NENARNAP, Cairo, Egypt.
FAO. Detailed Food Composition Tables. Rome, Italy.
FAO. 2009. Food Outlook. Rome, Italy.
FAO, United Nations Industrial Development Organization (UNIDO) and International
Fund for Agricultural Development (IFAD), 2009. Agro-industries for Development.
Rome, Italy.
FAO (2009). Cambodia National Medium-Term Priority Framework (NMTPF) for 2011-
2015. Draf.
FAO. 2010a. Food Security Data and Definitions: Food Consumption, Dietary Energy,
Protein and Fat. URL:http://www.fao.org/economic/ess/ess-fs/fs-data/ess-fadata/en/, last
time retrieved: 18.07.2011.
FAO. 2010b. Food Security Data and Definitions: Food Needs, Minimum Dietary Energy
Requirement. URL:http://www.fao.org/economic/ess/ess-fs/fs-data/ess-fadata/en/, last time
retrieved: 18.07.2011.
FAO. 2010c. The State of Food Insecurity in the World: Addressing Food Insecurity in
Protracted Crises. Rome.
Göttingen University. 2009. Food Security Training for NAPC Staff. Göttingen, Germany.
Mahmelji, Rateb. 1981-1982. Food Chemistry. Damascus University, Syria.
MAAR. 2009. Rapid Rural Appraisal of the Surveyed Villages. Damascus, Syria.
MAAR. The Annual Agricultural Statistical Abstract. Various issues, Damascus, Syria.
MOH and UNICEF. 2009. Strategy of Nutrition of the Ministry of Health. Draft,
Damascus, Syria.

State of Food and Agriculture in Syria 2010
408
NAPC. 2008. The State of Food and Agriculture. Damascus, Syria.
NAPC. 2008. Income Distribution and Poverty: Impact of Selected Policies in Syria.
Damascus, Syria.
NAPC. 2010. National Programme for Food Security in the Syrian Arab Republic.
Summary note, Damascus, Syria.
Rama, Daniele, 2000. Agricultural Marketing and Processing. NAPC, Damascus, Syria.
NAPC. Syrian Agricultural Trade. Various issues, Damascus, Syria.
Sadoulet Elisabeth and de Janvry Alain. 1995. Quantitative Development Policy Analysis.
The Johns Hopkins University Press, Baltimore and London.
Salem, Hamdi. 2000. Food Security. NAPC, Damascus, Syria.
Siam, Jamal. 2008. Food Chain and Related Policies. NAPC, Damascus, Syria.
State Planning Commission. Tenth Five Year Plan (2006-2010) and 11th Five Year Plan
(2011-2015). Damascus, Syria.
Tamhane Ajit C. and Dunlop Dorothy D. 2000. Statistics and Data Analysis. From
elementary to intermediate, Prentice Hall, Upper Saddle River, NJ 07458.
UNDP. 2004. Macroeconomic Policies for Poverty Reduction: The Case of Syria, by
Abdel Fadil Mahmoud et al. Damascus, Syria.
United Nations. 2009. Syrian Drought Response Plan. FAO, Rome, Italy.
WHO, FAO and United Nation University. 2007. Protein and Amino Acid Requirements in
Human Nutrition. Geneva, Switzerland.
Important Web Locations:
www.faostat.
www.fao.org.
www.usda.gov.
www.google.com.
www.napcsyr.org.
http:www2.renesas.com/fag/en/images/r_seiki.gif
http:www.ibm.com/developerworks/rational/library/content/RationalEdge/apr04/4291