© Shared Interest Tea sector -...
10
I 1 The bulk of world tea consumption is made up of black tea and green tea. Both come from the same shrub (Camellia sinensi) , but the leaves are processed differently. Black tea (Assam, Ceylon, Darjeeling, Earl Grey, Keemun, Lapsang Souchong, Sikkim, Yunnan etc.) repre- sents 65% of global output, 67% of con- sumption and 80% of international trade. Here the leaves undergo a complete oxidation, giving the product a longer shelf life than green tea in particular, and also making it easy to transport and store, hence its importance historically. Black tea is also more tannic and con- tains more caffeine (theine) than green tea. These black teas are also called red teas by the Chinese. In contrast, green tea (Gunpowder, Dragon Well, Jasmine, Sencha Dancha, Hojicha, Genmaicha, Gyokuro, Spider Leg, Mattcha and Tencha) is produced by processing the leaves in a way di- rected precisely towards neutralising the enzyme responsible for oxidation. It is drunk more in China and Japan, and in North Africa, where it forms the basis of mint tea. But it is also the subject of a fashion in western countries always on the look-out for new products and new flavours. An outstanding marketing campaign has also allowed the health benefits of green tea to be promoted. A number of fringe products supplement these two main methods of treating the leaves, among them yellow, white, semi- oxidised and post-fermented teas, not forgetting the top of the range flavoured teas, increasingly sought by connoisseurs in Europe. Although tea is grown in no less than 36 tropical and semi-tropical countries, includ- ing 21 ACP countries, six nations alone account for 80% of world production. The two main global producers of tea, China and India, are also its two leading consumers. In addition, only half of world production finds its way onto the global market; the rest all goes to meet domestic demand. 1. Background and key issues 2. Latest developments The global market in 2010–2011 Tea supply from ACP producers New consumption parameters The impact of climate change 3. Implications for the ACP The marketing challenge Competitiveness Maximum Residue Limits (MRLs) Tea sector 1. Background and key issues http://agritrade.cta.int/ September 2011 © Shared Interest
-
Upload
dinhnguyet -
Category
Documents
-
view
216 -
download
0
Transcript of © Shared Interest Tea sector -...

I 1
The bulk of world tea consumption is made up of black tea and green tea Both come from the same shrub (Camellia sinensi) but the leaves are processed differently Black tea (Assam Ceylon Darjeeling Earl Grey Keemun Lapsang Souchong Sikkim Yunnan etc) repre-sents 65 of global output 67 of con-sumption and 80 of international trade Here the leaves undergo a complete oxidation giving the product a longer shelf life than green tea in particular and also making it easy to transport and store hence its importance historically Black tea is also more tannic and con-tains more caffeine (theine) than green tea These black teas are also called red teas by the Chinese
In contrast green tea (Gunpowder Dragon Well Jasmine Sencha Dancha Hojicha Genmaicha Gyokuro Spider Leg Mattcha and Tencha) is produced by processing the leaves in a way di-rected precisely towards neutralising the enzyme responsible for oxidation It
is drunk more in China and Japan and in North Africa where it forms the basis of mint tea But it is also the subject of a fashion in western countries always on the look-out for new products and new flavours An outstanding marketing campaign has also allowed the health benefits of green tea to be promoted
A number of fringe products supplement these two main methods of treating the leaves among them yellow white semi-oxidised and post-fermented teas not forgetting the top of the range flavoured teas increasingly sought by connoisseurs in Europe
Although tea is grown in no less than 36 tropical and semi-tropical countries includ-ing 21 ACP countries six nations alone account for 80 of world production The two main global producers of tea China and India are also its two leading consumers In addition only half of world production finds its way onto the global market the rest all goes to meet domestic demand
1 Background and key issues
2 Latest developments
The global market in 2010ndash2011
Tea supply from ACP producers
New consumption parameters
The impact of climate change
3 Implications for the ACP
The marketing challenge
Competitiveness
Maximum Residue Limits (MRLs)
Tea sector1 Background and key issues
httpagritradectaint
September 2011
copy Shared Interest
Executive brief 2011 I 2httpagritradectaint
Tea sector
World tea production reached 39 million tonnes in 2010 compared with 3885 million tonnes in 2009 However it had already breached the 39 million tonne barrier with 3947 million tonnes in 2007 According to figures produced by the East African Tea Trade Association (EATTA) global imports of tea destined for consumption ndash rather than re-export ndash reached 1465 million tonnes in 2009 including 225000 tonnes for the EU
As the EU is not a tea producer imports are duty-free nor are there any specific quality standards apart from those relat-ing to food safety ndash including Maximum Residue Limits (MRLs) ndash and labelling The market is completely liberalised There is a 0 most favoured nation (MFN) tariff and with few exceptions no duty is payable on finished teas
With an output of 14 million tonnes in 2010 or 31 of global production China is the worldrsquos leading tea producer con-firming the ranking it snatched from India in 2005 its tea plantations occupy 186 million hectares or approximately half the worldrsquos total surface area under tea When all types of tea are combined China ranks second among global exporters but it is the leading exporter of green tea its sales rose by 2 in 2010 after previously passing the 300000 tonne threshold in 2009 Its main customers are Morocco the EU Japan and the US
India lies second among the worldrsquos tea producers with 966403 tonnes in 2010 or 28 of global output Only 193200 tonnes were exported placing India fourth in the list of exporters with 14 of the global market India imports tea for re-export its total imports declined by 25 in 201011 to 19260 tonnes but its imports from Kenya increased from 2270 tonnes in 200910 to 4510 tonnes in 201011
Kenya is number three producer in the world but comes first among ACP coun-tries with half of all ACP production
Kenya enjoyed a record harvest in 2010 with 398500 tonnes (compared with 314100 tonnes in 2009 and 345600 in 2008) It is the worldrsquos leading exporter of black tea shipping a record 441000 tonnes in 2010 (343000 tonnes in 2009 and 383000 tonnes in 2008) a figure which includes tea produced across the whole of east Africa and Madagascar and sold at the weekly Mombasa auction
2010 was also an exceptional year for fourth-placed Sri Lanka with a harvest of 329300 tonnes and a 73 increase in exports to 84100 tonnes
Eighty-five per cent of the world tea output is sold by a handful of multinationals which own plantations and buy up the crops of small growers Their processing plants are in situated in Europe and other western countries and they undertake their own blending and packaging two operations high in added value which represent up to 80 of the retail price
The main European players are Unilever (whose brands include Lipton the world leader Elephant Tchaeacute PG Tips Brooke Bond etc) Associated British Foods (Twin-ings) James Finlay Van Rees (a subsidi-ary of Acomo Amsterdam Commodities NV) along with other international groups such as Indiarsquos Tata (principally the Tetley brand) McLeod Russel India and Sarah Lee (Pickwick)
While the supermarkets concentrate for the most part on the big brands smaller retailers often specialise in unusual high-quality blends supplied by independent importers The trend among consum-ers towards more flavoursome products should increase their customer base
Most tea is sold at weekly auctions prin-cipally those held in Calcutta (India) Mom-basa (Kenya) Colombo (Sri Lanka) and Jakarta (Indonesia) Besides Mombasa the other ACP auction centre is Limbe in Malawi which handles much smaller volumes The Dubai Tea Trading Centre
(DTTC) which sells and processes teas from 13 different countries six of them ACP countries was created in 2005 and is a growing rival to the East African auctions
After 40 years of decline in real terms with supply rising more quickly than demand tea prices virtually doubled between 2002 and 2009 rising from 19443 US centskg in September 2002 to 37441 centskg in September 2009 while still remaining below the record of 42875 centskg set in Mombasa in January 1984 Consumers in develop-ing countries have felt the rise more keenly (+12 in 2009) than those in developed countries (+5) where tea faces stiff competition from the many other varieties of drink
This price explosion was the result of four years when the growth in global demand outstripped production of political events in Kenya and of the drought which affected East Africa India and Sri Lanka Output then fell by 064 between 2007 and 2009 while consumption showed a rise of only 021
European imports grew at an annual rate of 52 between 2004 and 2008 to 348000 tonnes an increase due less to the five main importers of black tea ndash UK Germany France Netherlands and Poland ndash than to rising demand in Eastern Europe In Poland and the Czech Republic ranked fifth and tenth among European importers demand rose by 67 and 17 respectively in 2008 In Bulgaria imports grew by as much as 48 and in Romania by 28 although both these markets remain modest in size Around 56 of European imports come directly from developing coun-tries the rest originating in re-exports between European countries
In conclusion the UN Food and Agri-culture Organization (FAO) states that the unprecedented rise seen gener-ally in food commodity prices in 2008
Executive brief 2011 I 3httpagritradectaint
Tea sector
had only a limited impact on tea On the supply side very few producers abandoned tea in favour of the food staples which would have proved more profitable on the demand side almost no substitution effect was observed
meant that the average global price of 31674 US centskg was 089 higher than the 2009 figure of 31396 centskg In mid 2010 an attack of Helopeltis in the state of Assam caused Indian production to fall by 13 over the year to 966000 tonnes In contrast Kenya like Sri Lanka registered a record crop increasing by 131 to 329400 tonnes Vietnam re-mained stable with 112000 tonnes over the first 10 months of the year
2 Latest developments
The global market in 2010ndash2011
2010 was marked by a strong volatility in prices which nevertheless continued their upward trend sustained demand
Table 1 Tea prices 2006ndash2011 (Mombasa auctions US centskg)
2006 2007 2008 2009 2010 2011
January 22500 24970 22970 26159 33867 36810
February 27890 21250 26467 27000 33235 34975
March 25974 20327 24629 26286 33261 33065
April 23045 19205 26091 27741 31359
May 23826 19004 26514 28800 28614
June 25014 20205 28452 28714 26236
July 26381 21191 28748 33765 25918
August 24722 21039 32190 32838 31509
September 22981 23125 32159 37441 33718
October 22427 22430 28239 34477 33986
November 21323 20964 24100 36105 33168
December 23957 20605 22848 37422 35213
Average price over the year 24170 21193 24271 31396 31674
Source IMF
Global prices continued to rise in early 2011 The impact of the Helopeltis out-break continued to make itself felt with Indian exports declining by 92 to 27700 tonnes in the first two months of the year Sri Lankan production also
showed a fall in January 2011 declining by 23 to 20700 tonnes
A fall in output among ACP countries notably Kenya meant that the average price achieved at the Mombasa auc-tion in January 2011 was 16 higher
than the 2010 average and 87 higher than that recorded in January 2010 In February 2011 however Egyptian buyers suspended their activities for around three weeks in the wake of po-litical unrest in that country causing a 14 fall in Kenyan exports and putting pressure on prices
Executive brief 2011 I 4httpagritradectaint
Tea sector
The continuing weakness of the US dollar ndash the quotation currency used at the Mombasa auction since 1992 ndash in relation to the currencies of the main tea-importing countries notably the EU has helped to consolidate their demand
Among producers the increase in re-ceipts derived from tea has been par-tially absorbed by a sustained rise in production costs in particular those of labour and of energy with the rise in the price of crude oil in late 2010early 2011 which in turn affected input as well as transport costs
Tea supply from ACP producers
The Tea Board of Kenya (TBK) reports that favourable weather conditions allowed the country to harvest a record 398500 tonnes in 2010 compared with 314100 tonnes in 2009 (an increase of 27) and 345600 tonnes in 2008
Country 2008 2009 2010
Kenya 230 271 276
Uganda 179 184 177
Rwanda 224 260 261
Burundi 214 244 148
Zambia 070 - -
Tanzania 149 148 152
DRC 142 153 182
Madagascar 173 168 195
Malawi 119 116 125
Average 218 251 254
Source Africa Tea Brokers
Table 2 Tea sales ndash average price received by ACP countries (Mombasa auctions $USkg)
2001 2002 2003 2004 2005 2006 2007 2008 2009 2010
294600 287000 292900 324300 328200 310400 369300 345600 314100 398500
Source Tea Board of Kenya
Table 3 Tea production in Kenya (tonnes)
Kenyarsquos exports which include tea produced in other East African coun-tries rose sharply to 441000 tonnes (compared with 342000 tonnes in 2009 and 338000 tonnes in 2008)
with receipts increasing by 40 to 97 billion shillings (US$12 billion) Tea represents 35 of Kenyarsquos agricul-tural export income Of the 273800 tonnes of tea sold at the Mombasa
auction during the first 10 months of 2010 203700 came from Kenya and 38700 from Uganda while Lipton was the main buyer (52500 tonnes)
Executive brief 2011 I 5httpagritradectaint
Tea sector
The TBK reports that during the first third of 2011 the drought linked to La Nintildea is likely to have seen a 23 fall in output to 85000 tonnes with exports of 95000 tonnes Some factories have been operating at 50 of capacity and the number of picking days has fallen from six a week to four The volumes sold at Mombasa have fallen by 7 to 87900 tonnes this was mainly the result of a decline in Egyptian purchases (21 of Kenyan exports in 2010) fol-lowing the revolution in that country which was Kenyarsquos leading customer in 2010 Domestic consumption in Kenya is rising year on year and increased to 18700 tonnes in 2010 compared with only 13800 tonnes in 2004
Demand for new plants is increasing and tea-growing is spreading into new areas
The current challenge for the TBK is to ensure that these areas are favourable for cultivation Remember that 60 of tea in Kenya is produced by the Kenya Tea Development Agency (KTDA) which manages over 500000 small growers as well as 65 factories employing more than 4 million Kenyans
Malawi
Malawi ranked twelfth in the world is the second largest tea producing country in Africa and an ACP member Tea is grown mainly in the south of the country in the Shire Highlands close to Thyolo and Mulanje In early 2010 the crop was badly affected by the drought and by an attack of armyworm which destroyed 35000 hectares causing a 40 fall in output and a 25 drop in receipts in January and February
Burundi
Tea is Burundirsquos second most impor-tant hard-currency earner after coffee Tea-growing employs around 300000 small farmers who thanks to good weather and the increased use of fer-tiliser produced 8016 tonnes in 2010 compared with 7500 tonnes in 2009 The Burundi Tea Office (Office du theacute burundais ndash OTB) is forecasting 9000 tonnes this year largely due to better use of inputs In 2010 export receipts rose to US$179 million for sales of 7188 tonnes 80 of which went via the Mombasa auction This compares with receipts of US$154 million and sales of 6292 tonnes in 2009
The OTB is planning to extend its own plantations and to distribute new plants in order to promote quality over quantity
Rwanda
Production is also rising in Rwanda to 22500 tonnes in 200910 (JulyJune) compared with 20500 tonnes the previ-ous season Receipts grew by 17 to US$56 million compared with US$489 million However the border conflicts between its two main customers Pa-kistan and Afghanistan sent prices falling from US$28kg at the beginning of the 200910 campaign to US$ 21kg at its end
The Rwanda Tea Authority (OCIR-Theacute) is supplied by 15 cooperatives with three others expected to have joined by the end of the 200910 season 69 of the tea produced by OCIR-Theacute is auctioned in Mombasa via brokers such as Ve-nus and Combrok and the rest is sold directly to importers and local buyers The domestic market represents only 1 of the total volume
Zimbabwe
Tea-growing in Zimbabwe has suffered greatly in recent years due to lack of finance operating at only 60 of capac-ity The political situation and levels of
Table 4 Tea imports in 2009 and proportion coming from Kenya (rsquo000 tonnes)
Importing country Total quantity imported Quantity from Kenya
Russian Federation 175 135
United Kingdom 120 64
United States 111 3
Pakistan 86 54
Egypt 78 75
United Arab Emirates 54 127
Iran 51 19
Afghanistan 47 33
Japan 40 21
Poland 29 46
Taiwan 26 0021
Kazakhstan 26 91
Germany 24 075
Sudan 23 22
South Africa 20 086
Chile 18 027
Malaysia 16 059
Source East Africa Tea Trade Association
Executive brief 2011 I 6httpagritradectaint
Tea sector
Malawi the Democratic Republic of Congo Zimbabwe Zambia Mozambique and Ethiopia but also from Madagascar is sold principally through the weekly Mombasa auction For example 80 of Burundirsquos tea is sold at Mombasa Yet Kenyan tea still dominates 75 of the tea sold at Mombasa this year remains Kenyan in origin
Kenya also runs a coffee auction in Nairobi The two bodies are managed separately but a plan to create an agricultural produce exchange has been under consideration for some time with a view to acquiring greater weight in the markets
Raw tea leaves Kenya for processing in the regions where it is consumed or in Dubai or India prior to re-export EATTA estimates that tea sold at US$3kg at the Mombasa auction appears in European supermarkets at five or six times this price
Emerging markets
Increasing purchasing power in emerging nations is stimulating their consumption of tea Kenyarsquos tea exports to China jumped by 65 between 2009 and 2010 reaching 1500 tonnes in the same period exports to India rose by 46 to a level of 5400 tonnes The KTB also reported a sharp rise in sales to the United Arab Emir-ates which increased by 73 to 22000 tonnes The hub provided by the Dubai Tea Trading Centre saw a record year in 2010 trading 10600 tonnes of tea a 41 increase on 2009 This is partly due to good harvests in the countries such as Kenya and Sri Lanka which produce black tea But it is also linked to a continuing
rainfall have sent yields tumbling Tea is a lsquocontrolledrsquo product in Zimbabwe with management both of its quality and of the development of the tea industry and sells at a lower price than that achieved by its competitors US$18kg to US$2kg in May 2011 compared with an average of US$3kg on the international market Tanganda Tea one of the most important local producers is also a well-known brand in the Central African market and ex-ports throughout the world
New consumption parameters
Population growth and relatively weak consumption within tea-producing countries are not the only factors lead-ing to a favourable outlook for tea A fresh breeze is blowing in among tradi-tional consumer nations such as those of the EU where the market should by rights be saturated It is linked to promoting the lsquohealthrsquo benefits of tea its lsquonaturalrsquo image its role in the battle against obesity and its exotic appeal
Nevertheless success is not guar-anteed as European consumers are concerned about a number of issues the use of pesticides on tea plantations the more general environmental impact of the plantations food safety and the wellbeing of growers The supply chain must remain vigilant and attempt to solve all these problems to ensure that they do not start to inhibit the increasing popularity of the product
Health and fashion
In European markets health issues play an increasing role in determining con-sumer choice of food products Excellent marketing has allowed green tea largely from Asia to benefit from this trend the FAO forecasts that annual consumption of green tea will rise by 55 compared with a rate of 18 for black tea
In response the Tea Board of Kenya has launched a marketing campaign lsquoTBK Tea Runrsquo linking two of Kenyarsquos flagship products tea and athletics The Tea Re-search Foundation is also working on a new variety of tea purple in colour with medicinal properties superior to those of black and green teas In addition the seeds of this new variety can be used to manufacture food-grade oil and in pharmaceuticals This purple variety will be submitted for registration with the Kenya Plant Health Inspectorate Services (KEPHIS)
In Europe consumption of fashionable teas is increasing ndash for example iced teas flavoured teas white green and other teas hot and cold In response producer countries are trying to diversify their product range and develop brands which will increase their market visibility and support marketing campaigns and the fight against fraudulent imitations
New markets and developing com-mercial trends
The supply chain
East African tea particularly from Uganda Rwanda Burundi Tanzania
Executive brief 2011 I 7httpagritradectaint
Tea sector
rise in demand from the countries of the Near East and the Community of Independent States (CIS) geographically close to Dubai which now represent 27 of global exports Dubai is pursuing an aggressive strategy offering up to 60 daysrsquo free storage and is developing its activities in packaging and labelling locally processed tea
Russia
Russia the worldrsquos leading importer of tea is consuming more speciality teas and more expensive teas Russia imports 99 of the tea it consumes and this year Ramaz Chanturiya CEO of Rusteacoffee expects it to return to a level of consumption last recorded before the economic crisis ie 170000 tonnes compared with 166500 tonnes in 2010 Imports amounted to 176000 tonnes in 2010 by comparison with 180000 in 2009 However Russiarsquos main suppliers are not ACP countries but Sri Lanka (29 of the Russian market) India (25) and China and Vietnam (11 each)
This year Russia plans to increase its imports of raw tea with a view to pro-cessing it as teabags and re-exporting it to the Ukraine Kazakhstan and Eastern
Europe Import duty which currently stands at 0 for raw tea and 15ndash20 for processed tea will be revised down-wards if Russia joins the World Trade Organisation (WTO) probably at the end of this year Russia would certainly like to increase domestic output particularly since the 2014 Winter Olympics will be held in Sochi right in the middle of the Krasnodar production zone But for the time being the industry is concentrating on increasing its imports particularly from Kenya and maintaining its purchases from other countries Note also that India once Russiarsquos main supplier of tea has had to cut its exports to meet increasing domestic demand
The tea-producing countries themselves
Can the tea-producing countries them-selves be considered developing mar-kets They currently drink only one-tenth of the quantity consumed by the tradi-tional tea-importing countries leaving considerable potential for growth The development of these markets would also bring pressure to bear on the value chain and increase the amount of added value retained by the tea-producing ACP countries Kenya consumes approxi-
mately 6 of its output ie 18700 of the 314000 tonnes produced last year but almost 60 of Kenyans say that tea is their favourite drink Bangladesh at one time the worldrsquos fifth largest tea exporter is witnessing a considerable increase in domestic demand forcing it to import 4000 tonnes in 200910 principally from India and Sri Lanka There must be potential here for the tea-producing ACP nations
Environment and sustainability
The production of tea from sustainable sources was more than 50 times greater in 2009 than it was in 2004 with 281105 tonnes compared with 5000 tonnes Marketed principally under the Fairtrade label this tea represented 77 of global tea exports in 2009 It generally achieves a higher price than the standard product with fair-trade and organic certification increasingly found side by side In the US in particular sales of tea certified as fair-trade leapt by 38 in 2010 57 of the tea comes from Asia and 43 from Africa including 10 from South Africa and 7 from Egypt Certified teas from Rwanda are expected to show a 46 increase in 2010 by comparison with 2009
Table 5 Tea sold at the Mombasa auctions by country of origin (in tonnes)
Country 2008 2009 2010
Kenya 25220309510 22622857690 28503013260
Uganda 4687372730 4961243900 5698113900
Rwanda 1434199640 1486370812 1789958200
Burundi 549399650 516330800 646119800
Zambia 1120000 1972000 1319630010
Tanzania 1358257880 1152243850 1319630010
DRC 89010350 50272050 57160750
Madagascar 27702400 26193200 22574800
Malawi 236111350 138282800 242399620
Mozambique 19261900 151286100 285103100
Total 33622745410 31107053202 38564073440
Source Africa Tea Brokers
Executive brief 2011 I 8httpagritradectaint
Tea sector
On the European market Unilever Sa-rah Lee and Twinings which together represent 40 of the supply of black tea to western markets are involved in the Dutch Sustainable Trade Initiative set up in 2007 Its objective is to review production models (the contamination of soils and surface water and the health of employees particularly pickers) and limit the residues contained in the fin-ished product The programme aims to certify 22 of global output bound for export by 2013
In 2007 Unilever also embarked upon large-scale sustainable supply opera-tions in Tanzania and Kenya with the objective of sourcing all the tea for its Lipton teabags from plantations with Rainforest Alliance certification by 2015 and all the tea for the group by 2020 Lipton is the biggest private buyer of tea in Kenya and in 2006 in conjunc-tion with the TBK it set up a number of publicndashprivate partnership projects designed to educate small growers in methods of sustainable cultivation By the end of 2009 38000 small growers in Kenya supplying tea to Unilever held Rainforest Alliance certification
Terroir and Protected Designation of Origin (PDO)
For the EU the main issue facing ACP countries is that of protecting them-selves from counterfeiting ndash hence the intensive efforts made by the WTO and the EU to implement suitable preventive measures At the WTO negotiations are ongoing over the extension of the register to include products other than wines and spirits but the EU has de-cided (ECR 5102006) that third world and therefore non-European products can be registered under a geographi-cal designation of origin in its member states The award of this Geographical Indication (GI) has a significant impact on the market In India for example the Darjeeling Tea Association presented its case for the protection of its GI before
the EU in November 2007 and protec-tion was granted in 2009 (EC DOOR Denomination Information Darjeel-ing14102009) ndash a decision which al-lows the name Darjeeling to be protected throughout EU member states South Africa is also considering taking similar steps to protect Rooibos (or Redbush) tea (an infusion produced using a native South African plant Aspalathus linaris)
The impact of climate change
According to EATTArsquos Brian Ngwiri the current impact of global warming on the tea industry is limited Last year however the Tea Research Founda-tion (TRF) launched two new varieties of tea TRFK 3713 and TRFK 43090 which display an increased resistance to drought but which also produce a 50 higher yield and are adapted to mechanised harvesting At present demand remains lower than expected but the TRF would attribute this to the fact that tea bushes are perennials and therefore seldom need replanting making growers reluctant to grub up old stock and to the limited amount of new land available for cultivation when tea faces competition with other more profitable crops
3 Implications for the ACP
The marketing challenge
The issue posing the greatest number of difficulties for the tea-producing ACP nations is not European regulation or hygiene standards but marketing EATTArsquos Brian Ngwiri argues that it is vital to develop appropriate branding and packaging which make up much of the end price of tea
The quality of packaging required by European consumers particularly in the UK is very high And the tea-producing ACP countries have been unable to de-velop to the standard required EATTA confirms that its members lack both the specialised equipment and the kind of packaging paper they need to compete with the major brands
In addition East African governments do not have any policies designed to encourage the creation of domestic processing and packaging industries because until now tea has been exported in bulk Furthermore the multination-als have well-established brands and deal in the sort of volumes that force European supermarkets to grant them preferential terms
In June 2010 the TBK and its partners set out to develop a stamp of origin to consolidate the identity of Kenyan tea on the international market Almost 94 of its output is exported in bulk for use in blends only 6 of its tea reaches the market in the form of lsquo100 Kenyanrsquo
Moreover 75 of the tea exported by Kenya and thus hailing from all the East African tea-producing countries is sold to just five importing countries ndash Egypt Pakistan the UK Sudan and Afghanistan ndash leaving the producers very vulnerable With the objective of diversifying its customer base the TBK has identified some emerging markets with strong potential such as China and the countries of Eastern Europe the Near East and North America and has launched a marketing campaign based around a lsquoMark of Originrsquo Kenya is also planning to tackle the proliferation of unbranded teas sold on the domestic market often with little respect for food hygiene However this is a very costly operation
Kenya also has its eye on regional mar-kets but commercial barriers make them difficult to penetrate In November 2010 therefore Kenya signed an agreement
Executive brief 2011 I 9httpagritradectaint
Tea sector
with South Africa aiming towards the reciprocal opening of their respective markets Kenyan tea entering South Africa is currently subject to a tax of 4 randkg
Competitiveness
Another obstacle is that production costs are rising in line with those of inputs particularly petroleum products and labour the latter representing 45ndash60 of the total production costs of Kenyan tea In the view of Sicily Kariuki CEO of the TBK the answer lies in a greater recourse to mechani-sation But this meets resistance from the three million people who work in the supply chain 80000 of whom went on strike last October Not they argued to oppose the introduction of mechanisation but to organise it more effectively In what proportion should tea be picked by machine or by manual labour
Maximum Residue Limits (MRLs)
The tea-producing ACP countries are also confronted by the complexity of international and particularly European regulations governing the use of pes-ticides The regulations are constantly evolving and the issue is all the more complicated in that tea is consumed as an infusion while the regulations often concern the form in which a product is sold ie the leaves
Enquiries and experiments on the use of pesticides and MRLs around the world have been conducted under the auspices of the FAO in India Sri Lanka Kenya Indonesia China and Malawi they have allowed data to be compiled for national use and interna-tional submission (for example to the Codex Alimentarius) Meetings with the legislative bodies and with the chemi-cal companies have been held at an international level since 2009
Within the EU Regulation (CE) No396 2005 concerning pesticide residues has been in force since 1 September 2008 before that date each member country applied its own MRLs regarding pesticides Previous European legisla-tion had established limits for pesticide residues which differed according to product type fruit and vegetables cereals foodstuffs of animal origin and foodstuffs of vegetable origin including fruit and vegetables
This 2008 regulation rescinded all pri-or directives by proposing maximum limits which have been harmonised and simplified to cover all foodstuffs including tea
One of the main problems produced by the new 2008 regulation concerning MRLs related to the deadline imposed for its implementation one which many actors judged too short Technical reasons played a part ndash for example chemical residues remain present in the soil for some time ndash but so too did farming methods Producers have to
adopt new habits but these are often small growers in isolated areas with little in the way of financial or technical resources
The EU is mindful of these concerns and Regulation No9152010 plans lsquomultiannual and coordinatedrsquo moni-toring programmes for 2011 2012 and 2013 Given that pesticide use evolves considerably over a 3-year period the regulation emphasises that pesticides are be checked in samples of particular foodstuffs over a series of 3-year cycles
The president of the French Tea As-sociation expects that in reality it will be in China and Japan not the ACP countries where small growers will face the most difficulty in implement-ing the new European directive This is expected to be one of several reasons why Chinese exports will not grow as quickly as before (and lies behind the average 20 a year price surge seen in recent years) but China should continue to fare reasonably well because of the enormous increase in domestic demand
Meanwhile the ACP countries are adapt-ing relatively well to the new regulation a country such as Kenya the worldrsquos leading exporter of black tea is used to adapting to different European measures and is also pretty much at the forefront of lsquoenvironmentally friendly agriculturersquo
Some countries will encounter difficul-ties in adapting to the new regulation the COLEACPPIP programme will provide them with a useful resource in this regard
Executive brief 2011 I 10httpagritradectaint
Tea sector
Main sources
1 FAO lsquoReport of the nineteenth session of the intergovernmental group on tearsquo New Delhi 12ndash14 May 2010 httpwwwfaoorgdocrepmeeting019k8336Epdf
Tea producers
2 1st African tea convention amp exhibition Mombasa Kenya 20 ndash 22 July 2011 httptea-conventioneattacompresentationsphp
3 Kenya Tea Board Kenya tea industry performance highlights for May 2010 httpwwwteaboardorkeopencmsexportsitestbknewsreleasesperformance_report_May2010pdf
4 Tea Board of India website httpwwwteaboardgovin
5 Interview with Olivier Scala president of the Comiteacute franccedilais du theacute and president of George Cannon (France) ndash not available on Internet
Tea traders
6 Albawabacom lsquoDubai Tea Trading Centre transacts record volumes in 2010rsquo 6 March 2011 httpwww1albawabacomdubai-tea-trading-centre-transacts-record-volumes-2010
Maximum Residue Levels (MRLs)
7 CBI Centre for the Promotion of Imports from Developing Countries lsquoEU legislation Maximum Residue Levels of pesticides in foodrsquo including download point for EU legislation February 2011 httpwwwcbieumarketinfocbidocseu_legislation_maximum_residue_levels_mrls_of_pesticides_in_food
8 Euro-lexeuropaeu EU Commission regulation No 9152010 on a coordinated multian-nual programme to ensure compliance with maximum levels of and to assess the consumer exposure to pesticide residues 12 October 2010 httpeur-lexeuropaeuLexUriServLexUriServdouri=CELEX32010R0915ENNOT
9 FAO Report on the working group on maximum residue levels CCP TE 105 New Delhi 12-14 May 2010 httpwwwfaoorgdocrepmeeting018K7503Epdf
Sustainable trade initiatives
10 Duurzamehandelcom Dutch sustainable trade initiative website httpwwwduurzamehandelcomentea
Multinationals
11 Unilevercom lsquoSustainable tearsquo web page httpwwwunilevercomsustainabilityenvironmentagriculturetea
About this update This brief was published in September 2011 Other publications in this series and additional resources on ACPndashEU agriculture and fisheries trade issues can be found online at httpagritradectaint
Technical Centre for Agricultural and Rural Cooperation (ACPmdashEU)
PO Box 380
6700 AJ Wageningen
The Netherlands
Tel +31 (0) 317 467 100
E-mail ctactaint - wwwctaint
The Technical Centre for Agricultural and Rural Cooperation (CTA) is a joint ACPmdashEU institution active in agricultural and rural development in African Caribbean and Pacific (ACP) countries Its mission is to advance food and nutritional security increase prosperity and encourage sound natural resource management
It does this by providing access to information and knowledge facilitating policy dialogue and strengthening the capacity of agricultural and rural development institutions and communities in ACP countries
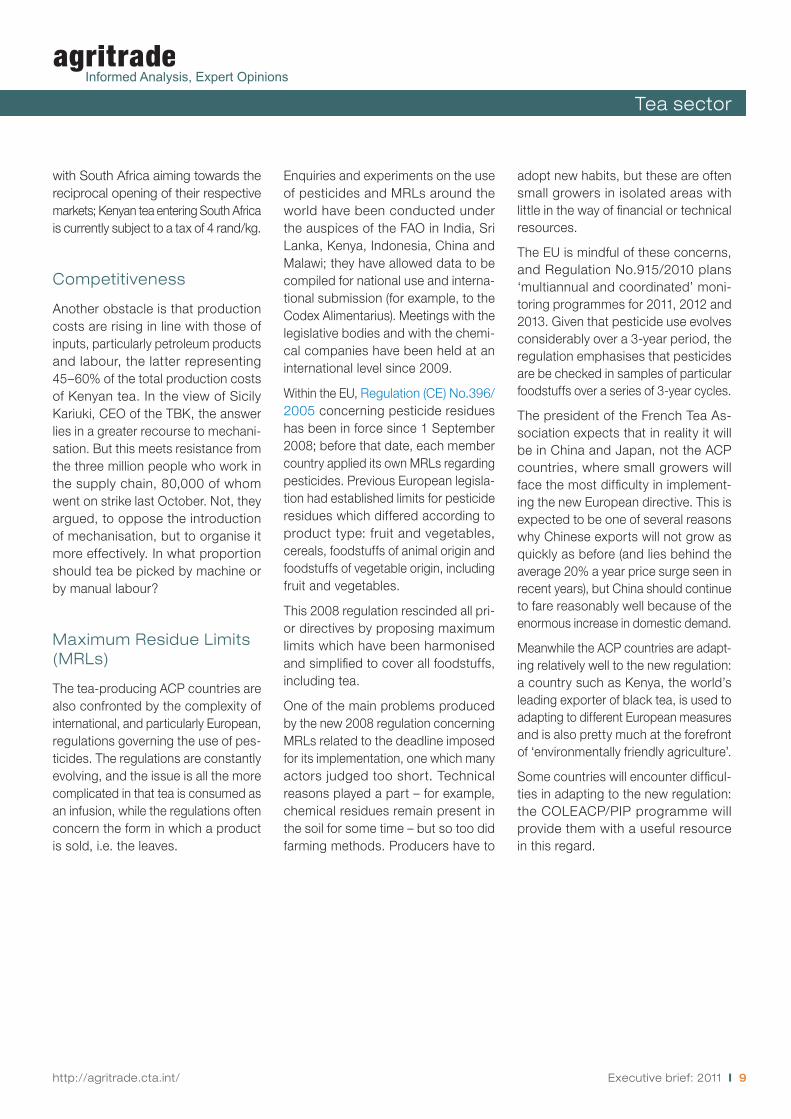