˘ ˇ ˆ - Bocpic.bankofchina.com/bocappd/report/200905/P02009051459535371902… · representing a...
372
-
Upload
nguyenkien -
Category
Documents
-
view
212 -
download
0
Transcript of ˘ ˇ ˆ - Bocpic.bankofchina.com/bocappd/report/200905/P02009051459535371902… · representing a...

������ ������ ����
�� ����� ����
��� �������������������� ����
� ����� ����� ������� ������������ �� ��� ������ � !��"#��� �$ %���� &��� ������� ���#�����'()�* + ,�-�) .-/-��0

1059
7-2
(BO
C -
H S
hare
) \ 2
3/03
/200
7 \ M
03 \
P.2
Bank of China
Bank of China was formally established inFebruary 1912 pursuant to the approval of Mr.Sun Yatsen. In the following 37 years until thefounding of the People’s Republic of China in1949, the Bank served as the central bank,international exchange bank and specializedforeign trade bank of the country. As the pillar ofthe country’s financial industry during a periodof turmoil in history, Bank of China wascommitted to serving the public and developingthe nation’s financial industry and achievedsignificant developments in many areas of itsbusiness operations through prudentmanagement and progressive reforms. After thefounding of the People’s Republic of China,Bank of China became the state-designatedspecialized foreign exchange and foreign tradebank. Having maintained and promoted itsstrong entrepreneurial spirit, the Bankcontributed substantially to the development ofthe country’s foreign trade and the nationaleconomy.
In 1994 and following the entrenchment of thereform of the financial sector, Bank of China wasconverted from a specialized foreign exchangeand foreign trade bank into a wholly state-owned commercial bank providingcomprehensive and high quality bankingservices.
In 1994 and 1995, Bank of China became a noteissuing bank in Hong Kong and Macau,respectively.
On 26 August 2004, Bank of China Limited wasformally incorporated in Beijing as a state-controlled joint stock commercial bank,representing a new chapter in its history andsignaling a huge step forward in becoming amodern joint stock commercial bank with soundcorporate governance practices. On 1 June2006, Bank of China was listed on the HongKong Stock Exchange (stock code: 3988) andshortly after, on the Shanghai Stock Exchange(stock code: 601988) on 5 July 2006. The listingsin Hong Kong and Shanghai have further
enhanced its strengths and influence in theinternational and domestic markets, bringingadditional splendor to its century-old brand.
Bank of China is one of the major domesticfinancial service providers. Its business scopecovers commercial banking, investment bankingand insurance. Members of the Group includeBOCHK, BOCI, BOCG Insurance and otherfinancial institutions. The core business of theBank is commercial banking which includescorporate banking, personal banking andfinancial markets. In terms of tier one capital, itranked 17th among the world’s top 1,000 banksby “The Banker” magazine in 2006.
With a history of almost a hundred years in thefinancial industry of China, Bank of China iswell-known for its continuous businessinnovations and the development of many“firsts” in the domestic banking industry, whilepaying regard to the needs for prudence in itsoperations. It is widely recognized andcommended by its peers and customers ininternational settlement, foreign exchange,trade finance, etc. Bank of China is also the mostinternationalized bank in China. BOC LondonBranch, the first overseas branch of Chinesebanks, was established in 1929. After that, theBank successively opened branches in globalfinancial centers, and has built up itsinstitutional network in 27 countries andregions. It was the first among Chinese banks torecruit international experts and to introducemodern business management concepts into itsoperations with a view to becoming a premierinternational bank.
As the sole banking partner of the Beijing 2008Olympic Games, Bank of China will offerefficient and high quality financial services todomestic and foreign customers. It will promoteand spread the Olympic spirits and contribute tothe success of this magnificent sports event,thereby improving its corporate image and itsvalue to the community.

Financial Highlights Delivering Growthand Excellence

✄
Finan
cial Hig
hlig
hts
Bank of China Annual Report 2006 Financial Highlights
Note: This report is prepared in accordance with International Financial Reporting Standards
Unit: RMB million
Note 2006 2005 2004 2003
(note 1)
Results of operationsNet interest income 121,371 101,008 88,435 76,597Non-interest income 27,007 24,098 27,378 17,599Operating income 2 148,378 125,106 115,813 94,196Loan impairment losses (12,342) (11,486 ) (23,812) (18,100 )Operating expenses (68,731) (59,984 ) (54,879) (46,080 )Operating profit 67,305 53,636 37,122 30,016Profit before income tax 67,937 53,811 37,263 29,947Profit after tax 48,264 31,558 27,065 26,785Profit attributable to the equity holders of the Bank 42,830 25,921 22,301 23,615Total dividend 10,154 14,112 14,200 N/A
Balance sheet itemsTotal assets 5,327,653 4,740,048 4,265,221 3,973,280
Loans and advances to customers, net 2,337,726 2,152,112 2,072,919 1,921,861Investment securities 3 1,892,482 1,683,313 1,321,646 1,104,105
Total liabilities 4,914,697 4,484,529 4,037,314 3,751,434Due to customers 4,091,118 3,699,464 3,338,448 3,033,364Capital and reserves attributable to the equity holders of the Bank 382,917 226,419 200,755 196,820
Number of ordinary shares in issueAverage (shares, million) 4 236,055 186,425 186,390 186,390Year-end (shares, million) 253,839 209,427 186,390 186,390
Per shareEarnings per share for profit attributable to the equity holders
of the Bank (basic and diluted) 0.18 0.14 0.12 0.13Dividend per share (before tax, RMB) 5 0.04 0.07 0.08 N/ANet assets per share (RMB) 6 1.51 1.08 1.08 1.06
Key financial ratiosReturn on average total assets (%) 7 0.96 0.70 0.66 0.74Return on average equity (%) 8 14.06 12.14 11.22 12.00Net interest spread (%) 9 2.28 2.21 2.14 2.08Net interest margin (%) 10 2.45 2.33 2.24 2.16Loan to deposit ratio (%) 11 59.45 60.42 64.33 71.24Non-interest income to operating income (%) 12 18.20 19.26 23.64 18.68Cost to income (%) 46.32 47.95 47.39 48.92Cost to income (excluding business and other taxes, %) 41.97 43.41 43.08 44.70
Capital adequacy ratiosCore capital adequacy ratio (%) 11.44 8.08 8.48 N/ACapital adequacy ratio (%) 13.59 10.42 10.04 N/A
Asset qualityIdentified impaired loans 103,232 109,530 118,383 358,218Identified impaired loans to gross loans (%) 4.24 4.90 5.51 16.58Allowance for loan impairment losses 94,293 83,153 74,769 239,039Allowance for loan impairment losses to identified impaired loans (%) 91.34 75.92 63.16 66.73Allowance for loan impairment losses to gross loans (%) 3.88 3.72 3.48 11.06Credit cost (%) 13 0.53 0.52 1.11 N/A
Human resourcesNumber of employees of the Group (person) 14 232,632 229,742 238,672 241,401
Credit ratingsMoody’s A2 A2 A2 A2Standard & Poor’s BBB+ BBB+ BBB– BB+Fitch Ratings A– A– BBB+ BBB+
Exchange rateUSD/RMB year-end middle rate 7.8087 8.0702 8.2765 8.2767EUR/RMB year-end middle rate 10.2665 9.5797 11.2627 10.3383HKD/RMB year-end middle rate 1.0047 1.0403 1.0637 1.0657
Share price (year-end closing price)Bank of China (601988, RMB per ordinary share) 5.43 N/A N/A N/ABank of China (3988, HKD per ordinary share) 4.27 N/A N/A N/ABOC Hong Kong (Holdings) Limited (2388, HKD per ordinary share) 21.15 14.95 14.85 14.60
On 26 August 2004, the Bank converted its form of ownership into a state-controlled joint stock commercial bank and
Bank of China Limited was formed and registered in Beijing. On 1 June 2006 and 5 July 2006, the Bank’s shares were
successfully listed on the Hong Kong Stock Exchange and the Shanghai Stock Exchange, respectively, being the first
bank in China dual-listed in the international and domestic capital markets.
Note 1. The results of operations and related financial ratios for the year 2003 were adjusted to exclude the net gain on the disposal of BOCHK Holdings’ shares of RMB7.4 billion.
Note 2. Operating income comprises net interest income and non-interest income. Non-interest income includes net fee and commission income, net trading (losses)/gains, net (losses)/gains on investment securities and otheroperating income.
Note 3. Investment securities include available-for-sale securities, held-to-maturity securities, loans and receivables and trading assets and other financial instruments at fair value through profit or loss.
Note 4. Average number of ordinary shares in issue represents the weighted average number of ordinary shares in issue during the period.
Note 5. Dividend per share = total dividend ÷ number of ordinary shares in issue at the year-end
Note 6. Net assets per share = capital and reserves attributable to the equity holders of the Bank at the year-end ÷ number of ordinary shares in issue at the year-end
Note 7. Return on average total assets = profit after tax ÷ average total assets. Average total assets = (total assets at the beginning of the year + total assets at the year-end) ÷ 2
Note 8. Return on average equity = profit attributable to the equity holders of the Bank ÷ average owner’s equity (excluding minority interest). Average owner’s equity (excluding minority interest) = (owner’s equity, excluding minorityinterest, at the beginning of the year + owner’s equity, excluding minority interest, at the year-end) ÷ 2. As the total owner’s equity (excluding minority interest) was less than zero at January 1, 2003, the ratio for the year2003 is computed using total equity (excluding minority interest) as at 31 December 2003.
Note 9. Net interest spread = average yield of interest-earning assets–average cost of interest-bearing liabilities. Average yield of interest-earning assets = interest income ÷ average balance of interest-earning assets. Averagecost of interest-bearing liabilities = interest expense ÷ average balance of interest-bearing liabilities. Average balances are daily average balances derived from the Bank’s management accounts (unaudited).
Note 10. Net interest margin = net interest income ÷ average balance of interest-earning assets. Average balance is daily average balance derived from the Bank’s management accounts (unaudited).
Note 11. Loan to deposit ratio = balance of loans and advances to customers at year-end ÷ balance of due to customers at year-end
Note 12. Non-interest income to operating income=non-interest income ÷ operating income. In 2006, excluding the losses from revaluation of foreign currency positions of RMB9.82 billion (2005: RMB4.746 billion), the non-interestincome accounted for 23.28% (2005: 22.21%) of the total operating income.
Note 13. Credit cost = impairment losses on loans and advances ÷ average balance of loans and advances to customers. Average balance of loans and advances to customers = (balance of loans and advances to customers at thebeginning of the year + balance of loans and advances to customers at the end of the year) ÷ 2
Note 14. Number of employees of the Group includes temporary and contract staff.
160,000
140,000
120,000
100,000
80,000
60,000
40,000
20,000
0
2003 2004 2005 2006 2003 2004 2005 2006 2003 2004 2005 2006
54,000
48,000
42,000
36,000
30,000
24,000
18,000
12,000
0
6,000
400,000
350,000
300,000
250,000
200,000
150,000
100,000
50,000
0
Identified impaired loans
Unit: RMB million
Operating income
Unit: RMB million
Profit after tax
Unit: RMB million
Financial Highlights
Table of Contents 1
Contents2 Corporate Information
4 Message from the Chairman
6 Message from the President
10 Management Discussion and Analysis
10 — Brief Review and Forecast on the Economic and Financial Environment
12 — Financial Review
38 — Business Review
60 — Risk Management
87 — Capital Management and Fund Transfer Pricing
91 — Organizational Information, Human Resources Management and Development
96 — Cooperation with Strategic Investors
99 — Corporate Honors and Responsibilities
102 Changes in Share Capital and Shareholdings
of Substantial Shareholders
110 Directors, Supervisors and Senior Management
128 Corporate Governance
140 Report of the Board of Directors
147 Report of the Board of Supervisors
149 Significant Events
155 Independent Auditor’s Report
157 Financial Statements
337 Unaudited Supplementary Financial Information
344 Supplementary Information — Financial Statements Prepared in
Accordance with PRC GAAP
349 Documents Available for Inspection
350 Reference for Shareholders
353 Organizational Chart
354 List of Domestic and Overseas Operations
364 Definitions

Corporate Information
Bank of China Annual Report 20062
Registered Corporate Name in Chinese
中國銀行股份有限公司
Registered Corporate Name in English
BANK OF CHINA LIMITED
Legal Representative
XIAO Gang
Board of Directors
Honorary Chairperson
CHEN Muhua
Honorary Vice Chairperson
CHUANG Shih Ping
Chairman
XIAO Gang
Vice Chairman
LI Lihui
Executive Director
HUA QingshanLI Zaohang
Non-Executive Director
ZHANG JinghuaYU ErniuZHU YanZHANG XinzeHONG ZhihuaHUANG HaiboSir Frederick Anderson GOODWINSEAH Lim Huat Peter
Independent Non-Executive Director
Anthony Francis NEOHWilliam Peter COOKEPatrick de SAINT-AIGNANAlberto TOGNI
Board of Supervisors
Chairman of Board of Supervisors
LIU Ziqiang
Supervisor
WANG XueqiangLIU WanmingLI Chunyu (Employee Supervisor)LIU Dun (Employee Supervisor)
Senior Management
President
LI Lihui
Executive Vice President
HUA QingshanLI ZaohangZHOU ZaiqunZHANG YanlingZHU MinWANG Yongli
Secretary of the Party Discipline Committee
ZHANG Lin
Authorized Representatives
LI LihuiYEUNG Jason Chi Wai
Secretary to the Board of Directors
YEUNG Jason Chi Wai
Qualified Accountant
LEUNG Frances Kim Lan
Registered Address of Head Office
No. 1 Fuxingmen Nei DaJie, Beijing, China
Corporate Information 3
Office Address
No. 1 Fuxingmen Nei DaJie, Beijing, China
Post code: 100818Telephone: (86)010-66596688Fax: (86)010-66594568Website: http://www.boc.cnE-mail: [email protected]
Place of Business in Hong Kong
Bank of China Tower,1 Garden Road,Central,Hong Kong
Selected Newspapers and Websitesfor Information Disclosure
According to the regulations byCSRC, the selected newspapersfor PRC GAAP announcement in ChineseMainland: China Securities, Shanghai Securities,Securities Times, China Daily. The IFRS announcementwill be published in one Chinese and one EnglishHong Kong Newspaper at the same time.
Website designated by CSRC to publish theAnnual Report: http://www.sse.com.cn
Website designated by the Stock Exchangeof Hong Kong Limited to publish theAnnual Report: http://www.hkex.com.hk
Places where the Annual Report can beobtained: major business locations
Hong Kong Legal Adviser
Freshfields Bruckhaus Deringer
China Legal Adviser
King & Wood PRC Lawyers
Compliance Advisers
Goldman Sachs (Asia) L.L.C.UBS AG acting through its business group,
UBS Investment Bank
Listing Affairs Representatives
Luo Nan
Address: No. 1 Fuxingmen Nei DaJie,Beijing, China
Post code: 100818Telephone: (86)010-66594626Fax: (86)010-66594568E-mail: [email protected]
Auditors
Domestic auditor:
PricewaterhouseCoopers Zhong Tian Certified PublicAccountants Limited CompanyAddress:11th Floor, PwC Center,No. 202 Hubin Road,Shanghai, ChinaPost code: 200021
International auditor:
PricewaterhouseCoopersAddress:22/F, Prince’s Building,Central, Hong Kong
Sponsors for A Share
China Galaxy Securities Co. Ltd.CITIC Securities Co. Ltd.Guotai Junan Securities Co. Ltd.
Other Relevant Information
Date of first registration
31 October 1983
Modified registration date
26 August 2004
Authority of first registration
State Administration of Industry and Commerce of PRC
Corporate business licence serial number
1000001000134
Financial institution licence serial number
B10311000H0001
Tax registration certificate number
JSZZ 110102100001342

Bank of China Annual Report 20064
Message from the Chairman
I am pleased to report to our shareholders and members of the community
the significant achievements we made in 2006. In 2006, Bank of China
recorded an after-tax profit attributable to equity holders of RMB42.83 billion,
an increase of 65.23% from the previous year, and an earnings per share (EPS)
of RMB0.18. This result is well above our projected net profit attributable to
equity holders of at least RMB33 billion and EPS of RMB0.14 at the time of our
public listing. Operating income and operating profit before impairment losses
on loans and advances rose, respectively, to RMB148.378 billion and
RMB79.647 billion, an increase of 18.6% and 22.3% from their respective
figures last year. Return on average total assets (ROA) and return on average
equity (ROE) have reached 0.96% and 14.06%, respectively. While ensuring a
steady increase in profitability, the Bank reduced both the overall balance and
ratio of our impaired loans. As of the end of 2006, our impaired loan balance
stood at RMB103.232 billion, a decrease of RMB6.298 billion from last year’s
end balance, and our impaired loan ratio decreased to 4.24% from 4.90%.
At the Annual Shareholders’ Meeting on 14 June 2007, the Board of Directors
will propose a cash dividend of RMB0.04 per share for the second half of
2006. The total amount of the cash dividend accounts for approximately
43.48% of distributable profit during the period, and is at the high end of the
dividend payout ratio of 35%–45% that we announced when we went public.
2006 marked the first year of China’s 11th Five-Year Plan, and China’s
economy continued to maintain steady and rapid growth, albeit some
imbalances in the economic development have been noticed. The
transformation process has started for the development mode of the Chinese
economy to go towards quality, efficiency, cleanliness, safety, and the
realization of growth in a fully harmonious and sustainable manner. China’s
financial market has been steady and buoyant, with ample liquidity in the
money market and continued success in its banking reform.
Against these various opportunities and challenges, we continue to enhance
our position as the premier bank in China and pursue our objective of
becoming a leading international bank. In 2006, Bank of China became the
first bank in China to be dual-listed in both the international and domestic
capital markets, further increasing our capital strength and capital adequacy
ratio. We have embraced the regulations of the banking industry and the
capital markets and have delivered to our investors our first semi-annual and
quarterly reports after IPO, with disclosure in a true, accurate, complete and
Message from the Chairman 5
timely manner and in compliance with
international regulatory standards. Cooperation
with our strategic investors is bearing fruit. We
have made substantial progress in business
areas such as credit card, syndicated lending,
and in the money and capital market operations,
as well as in infrastructure areas such as risk
management, internal control, financial
management, human resources management,
treasury, training, business organization
structure, and information technology.
At the end of 2006, we acquired Singapore
Aircraft Leasing Enterprise, a step forward in
implementing our strategic plan of broadening
our financial services platform. Internally, we
have actively promoted strategic development
of various business lines, advancing and further
developing our risk management and internal
control processes. We continued to deepen our
reform effort of human resources management,
established market-oriented remuneration
system in domestic operations, and improved
our incentive and accountability mechanisms.
We strived to accelerate our IT blueprint
implementation, achieving initial milestone in
the development of the core banking system.
We also had a bank-wide discussion on our core
values to cultivate a common set of principles
and code of conduct to meet the challenges
arising from the public listing.
In the past year, we have continued to improve
our corporate governance at all levels, which
include the Board of Directors, Board of
Supervisors, Senior Management, and
Shareholders’ Meeting. We appointed Mr.
Patrick de Saint-Aignan and Mr. Alberto Togni as
independent non-executive directors of the
Bank, and Sir Frederick Anderson Goodwin and
Mr. Seah Lim Huat Peter as non-executive
directors. Following these appointments, the
number of overseas directors increased to six –
including four independent non-executive
directors – substantially enhancing the
operating standards of the Board of Directors
towards the international standards.
Looking at the upcoming year, as China’s market
economy continues to develop, we are aware
that we will be facing increasing competitive
pressures from local and global foreign banks,
as well as strict regulatory supervision from
both financial regulators and capital market
regulators. Accordingly, we are improving our
corporate governance as a mean to maximize
shareholder value, as well as focusing on
internal reform, aiming at proactively adjusting
our strategies, adapting to the new business
environment, and enhancing our capabilities in
innovation and competitiveness.
We will continue to focus on all business risks to
ensure healthy and balanced development, and
manage foreign currency exposure to mitigate
the business impact of RMB appreciation. We
will also expedite the re-engineering of our
business process and the IT blueprint
implementation towards a robust customer-
centric platform enabling centralized business
operation and multi-dimensional management
of major business lines. Last but not at all least,
we will diligently foster a corporate culture that
nurtures honesty, efficiency, responsibility,
innovation, and harmony, so as to promote the
overall harmonious development of the Bank.
I would like to express my gratitude to our
domestic and overseas clients, our
shareholders, our peers and our friends who
have supported the Bank during the year, and I
hope to count on your continuing confidence
and support. My thanks also extend to the
Board of Directors, the Board of Supervisors
and Senior Management, and to all the staff for
their effort and dedication in a year that was
filled with many challenges.
Xiao GangChairman22 March 2007
Bank of China Annual Report 20066
Message from the President
The year 2006 was a landmark in the development history of Bank of
China. Having been listed successfully in both the domestic and
overseas markets, as well as achieving initial success in our joint-stock
reform, the Bank has entered into a new epoch in its development.
The Management has diligently implemented the development strategies
adopted by the Board of Directors. Taking a proactive and balanced
approach, the Management has adopted principle of scientific development
to maximize the Bank’s value and has met major business targets and goals
set by the Board. As of the end of 2006, the Bank’s total assets stood at
RMB5,327.653 billion, total liabilities were RMB4,914.697 billion, and total
shareholders’ equity (including minority interests) was RMB412.956 billion,
up 12.40%, 9.59% and 61.61% respectively over the end of 2005. The Bank
generated after-tax profit of RMB48.264 billion (a year-on-year rise of 52.94%)
in which the after-tax profit attributable to equity holders amounted to
RMB42.83 billion, up 65.23% from the previous year. Earnings per share was
RMB0.18, a rise of 28.57% over 2005. ROA was 0.96% and ROE was 14.06%,
up 26 and 192 basis points over 2005, respectively.
The significant increase in profits in 2006 was mainly attributable to the rapid
growth of net interest income and non-interest income, strict control of credit
cost, effective management of market risks, further improvement of
operating efficiency, decrease in the cost/income ratio, and a reduction of the
effective tax rate.
Due to the fast growth of interest-earning assets and the significant role of
active liability management to reduce funding costs, the Bank’s net interest
spread and net interest margin continued to widen, reaching 2.28% and
2.45% respectively, up 7 and 12 basis points over the previous year. The
Bank’s deposits in local and foreign currencies, loans, securities investments,
and net interest income increased by 10.59%, 8.80%, 12.43% and 20.16%
respectively.
Excluding the impact of the estimated losses on the net exposure of foreign
currencies, the Bank’s non-interest income accounted for 23.28% of its
operating income, up 1.07 percentage points, with net fee and commission
income growing by 54.89%. Additionally, the Bank’s multi-faceted operation

Message from the President 7
platform was further expanded, with pre-tax
profit from investment banking and insurance
business rising by 188.62%, contributing 2.76%
to the total profit, as opposed to 1.21% in the
previous year.
In 2006, the Bank’s asset quality continued to
improve. Credit cost was controlled at 0.53%,
with the ratio of impaired loans at 4.24%, down
0.66 percentage point from the end of the
previous year. Special-mention loans decreased
from 12.71% to 8.15% while the coverage ratio
of impaired loans provision to impaired loans
increased 15.42 percentage points to 91.34%. By
way of exchange settlement, the Bank reduced
net foreign currency exposure by USD10.1
billion, effectively lowering the exchange rate
risk.
Operating costs also continued to be controlled
effectively, with cost-income ratio decreased
from 43.41% to 41.97%. Our effective tax rate in
2006 also declined from 41.35% in 2005 to
28.96%.
The Bank has promoted business cooperation
with strategic investors and helped create
powerful synergies. Cooperation between the
Bank and RBS Group has made remarkable
achievements in credit cards, syndicated loans,
aircraft lease and financing, supply chain
financing, private banking, risk management,
personnel training and public relations. We have
also achieved progress in cooperation with AFH,
UBS, ADB, and NCSSF in the fields of small
enterprise finance, investment banking,
corporate governance and internal control.
In 2007, reform of the financial system will
accelerate and China’s banking sector will enter
a new stage as the market becomes fully open
to foreign banks and competition increases. In
the face of such new opportunities and
challenges, we will continue our efforts in
developing Bank of China into a leading
international bank, and continue to refine our
operating mechanisms and growth patterns. We
will expedite our business process re-
engineering and effectively implement the IT
Blueprint. We will improve risk management
and internal control. We will continue to enlarge
our service platform with innovative products
and services. We will increasingly focus on our
strategic development, leadership
enhancement, team building, and corporate
culture practices. We will foster the business
value one needs to be a market leader, to ensure
a healthy, rapid and sustainable business
growth.
On behalf of the Management, I would like to
take this opportunity to express our sincere
gratitude to the Board of Directors and the
Board of Supervisors for the guidance and
support; to the community at large for the trust
and support; and to all our colleagues at home
and abroad for the invaluable contributions. I
firmly believe that with our concerted efforts,
relentless drive, and continued pursuit of
excellence, Bank of China can look forward to a
bright future.
Li LihuiPresident22 March 2007


Bank of China Annual Report 200610
Management Discussion and Analysis— Brief Review and Forecast on the
Economic and Financial Environment
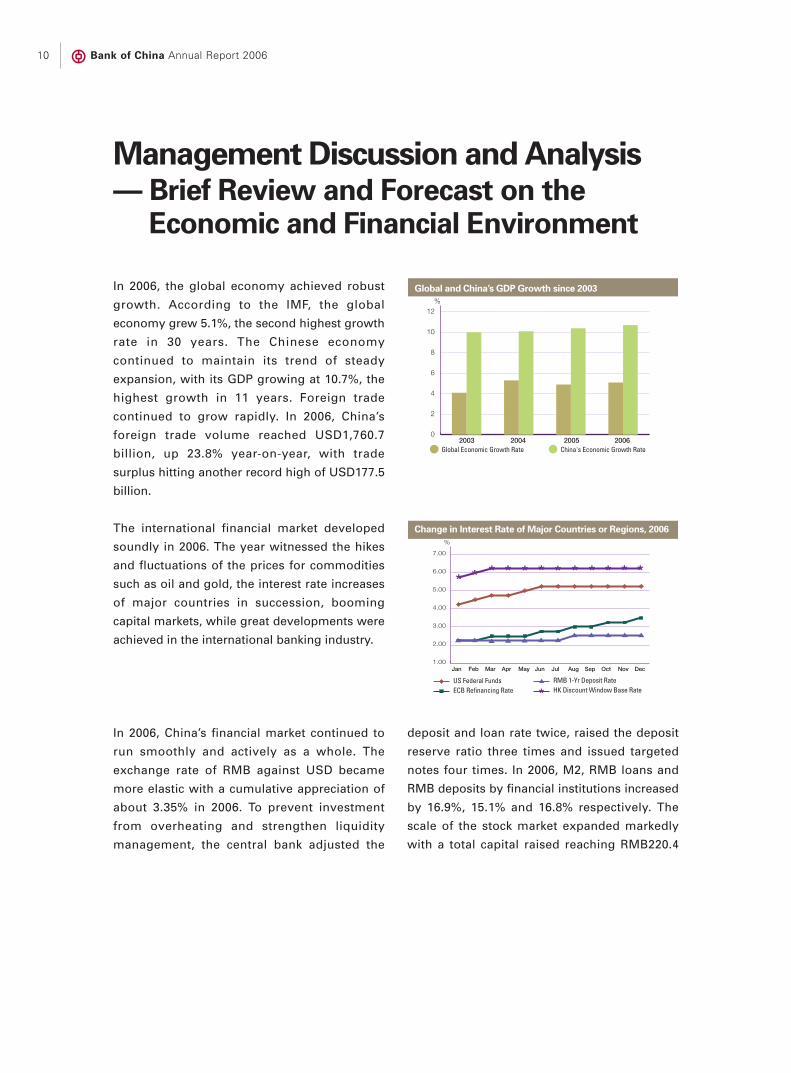
In 2006, the global economy achieved robust
growth. According to the IMF, the global
economy grew 5.1%, the second highest growth
rate in 30 years. The Chinese economy
continued to maintain its trend of steady
expansion, with its GDP growing at 10.7%, the
highest growth in 11 years. Foreign trade
continued to grow rapidly. In 2006, China’s
foreign trade volume reached USD1,760.7
billion, up 23.8% year-on-year, with trade
surplus hitting another record high of USD177.5
billion.
The international financial market developed
soundly in 2006. The year witnessed the hikes
and fluctuations of the prices for commodities
such as oil and gold, the interest rate increases
of major countries in succession, booming
capital markets, while great developments were
achieved in the international banking industry.
In 2006, China’s financial market continued to
run smoothly and actively as a whole. The
exchange rate of RMB against USD became
more elastic with a cumulative appreciation of
about 3.35% in 2006. To prevent investment
from overheating and strengthen liquidity
management, the central bank adjusted the
Change in Interest Rate of Major Countries or Regions, 2006
US Federal FundsECB Refinancing Rate
RMB 1-Yr Deposit RateHK Discount Window Base Rate
Jan Feb Mar Apr May Jun Jul Aug Sep Oct Nov Dec1.00
2.00
3.00
4.00
5.00
6.00
7.00
%
Global and China’s GDP Growth since 2003
0
2
4
6
8
10
12
2003 2004 2005 2006Global Economic Growth Rate China's Economic Growth Rate
%
deposit and loan rate twice, raised the deposit
reserve ratio three times and issued targeted
notes four times. In 2006, M2, RMB loans and
RMB deposits by financial institutions increased
by 16.9%, 15.1% and 16.8% respectively. The
scale of the stock market expanded markedly
with a total capital raised reaching RMB220.4
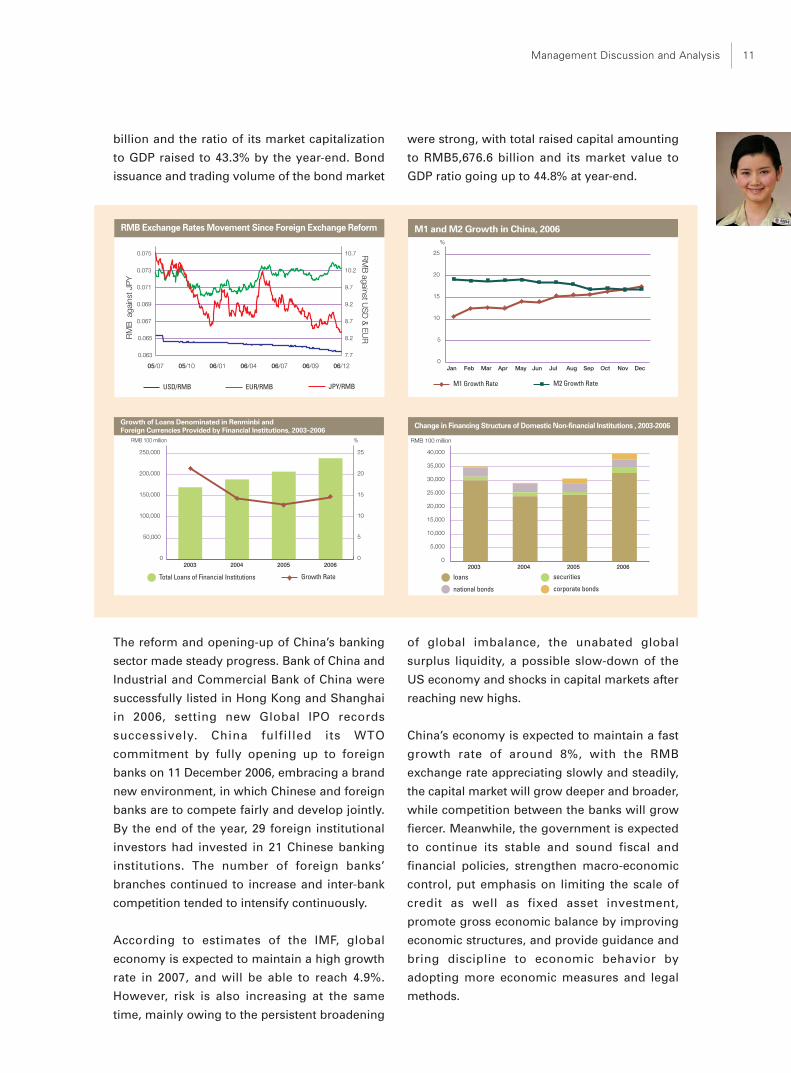
Management Discussion and Analysis 11
billion and the ratio of its market capitalization
to GDP raised to 43.3% by the year-end. Bond
issuance and trading volume of the bond market
The reform and opening-up of China’s banking
sector made steady progress. Bank of China and
Industrial and Commercial Bank of China were
successfully listed in Hong Kong and Shanghai
in 2006, setting new Global IPO records
successively. China fulfilled its WTO
commitment by fully opening up to foreign
banks on 11 December 2006, embracing a brand
new environment, in which Chinese and foreign
banks are to compete fairly and develop jointly.
By the end of the year, 29 foreign institutional
investors had invested in 21 Chinese banking
institutions. The number of foreign banks’
branches continued to increase and inter-bank
competition tended to intensify continuously.
According to estimates of the IMF, global
economy is expected to maintain a high growth
rate in 2007, and will be able to reach 4.9%.
However, risk is also increasing at the same
time, mainly owing to the persistent broadening
of global imbalance, the unabated global
surplus liquidity, a possible slow-down of the
US economy and shocks in capital markets after
reaching new highs.
China’s economy is expected to maintain a fast
growth rate of around 8%, with the RMB
exchange rate appreciating slowly and steadily,
the capital market will grow deeper and broader,
while competition between the banks will grow
fiercer. Meanwhile, the government is expected
to continue its stable and sound fiscal and
financial policies, strengthen macro-economic
control, put emphasis on limiting the scale of
credit as well as fixed asset investment,
promote gross economic balance by improving
economic structures, and provide guidance and
bring discipline to economic behavior by
adopting more economic measures and legal
methods.
were strong, with total raised capital amounting
to RMB5,676.6 billion and its market value to
GDP ratio going up to 44.8% at year-end.
RMB Exchange Rates Movement Since Foreign Exchange Reform
0.063
0.065
0.067
0.069
0.071
0.073
0.075
10.2
9.7
9.2
8.7
8.2
7.7
10.7
RM
Bag
ains
tJP
Y
RM
BagainstU
SD
&EU
R
USD/RMB EUR/RMB JPY/RMB
05/07 06/1206/0705/10 06/01 06/04 06/09
M1 and M2 Growth in China, 2006
M1 Growth Rate M2 Growth Rate
Jan Feb Mar Apr May Jun Jul Aug Sep Oct Nov Dec0
5
10
15
20
25
%
2003 2004 2005 20060
50,000
100,000
150,000
200,000
250,000
Growth of Loans Denominated in Renminbi andForeign Currencies Provided by Financial Institutions, 2003–2006
Total Loans of Financial Institutions Growth Rate
0
5
10
15
20
25
RMB 100 million %
Change in Financing Structure of Domestic Non-financial Institutions , 2003-2006
2003 2004 2005 20060
5,000
10,000
15,000
20,000
25.000
30,000
35,000
40,000
loans
national bonds
securities
corporate bonds
RMB 100 million

Management Discussion and Analysis— Financial Review
Bank of China Annual Report 200612
Summary of Financial Position and Results of Operations of theGroup for 2006
Profit after tax
2003 2004 2005 20060
10,000
20,000
30,000
40,000
50,000
Profit after tax Profit attributable to the equity holders of the Bank
RMB million
For 2006, the Group earned a profit after tax of RMB48.264 billion, anincrease of RMB16.706 billion (52.94%) compared to the prior year. Profitattributable to the equity holders of the Bank amounted to RMB42.83billion, an increase of RMB16.909 billion (65.23%). These results exceededthe objectives in the budget approved by the Bank’s shareholders and theprofit forecast developed in connection with the Bank’s IPO of its ordinaryshares. The substantial improvement in profit after tax for the year wasattributable to robust growth in operating income, improved operatingefficiency, effective management of credit costs, and a decrease in theeffective tax rate.
Earnings per share
0.10
0.12
0.14
0.16
0.18
0.20
2003 2004 2005 2006
RMB
For 2006, basic and diluted earnings per share was RMB0.18, an increase ofRMB0.04 compared to the prior year. The capital raised in connection withthe Bank’s IPO in 2006, and the related listing of its ordinary shares on boththe Hong Kong and Shanghai markets, further increased the Bank’s capitalbase and ordinary shares in issue. Benefiting from the Group’s strongprofits, both the basic and diluted earnings per share increased comparedto the prior year.
ROA & ROE
2003 2004 2005 20060
12
15
18
9
6
ROA %
0
0.2
0.4
0.6
0.8
1.0
ROE %
ROA ROE
For 2006, return on average total assets was 0.96%, the highest level in thepast four years, and return on average shareholders’ equity was 14.06%.These amounts reflected robust increases of 0.26 percentage point and1.92 percentage points, respectively, compared to the prior year.
Revenue growth RMB million
2003 2004 2005 20060
50,000
100,000
150,000
200,000
Operating income
The Group achieved operating income of RMB148.378 billion, an increaseof RMB23.272 billion (18.60%) compared to the prior year. This increasewas primarily due to the continued increase in the average balances ofloans and investment securities, as well as an increase in average yields. Atthe same time, the Group intensified its focus on developing fee-basedbusinesses, and there was a continued improvement in net fee andcommission income. Please refer to the “Net interest income” and “Non-interest income” sections for more detailed information.

Management Discussion and Analysis 13
Non-interest income to operating income ratio
2003 2004 2005 20060
6
18
30
%
24
12
Excluding the effect of loss from revaluation of foreign currency position
The Group recognized non-interest income of RMB27.007 billion in 2006,an increase of RMB2.909 billion (12.07%) compared to the prior year. Theratio of non-interest income to operating income was 18.20%, a decrease of1.06 percentage points compared to the prior year. Excluding the effect oflosses from the revaluation of foreign currency positions, this ratio was23.28%, an increase of 1.07 percentage points.
Cost to income ratio
2003 2004 2005 200635
45
50
55
Cost to income Cost to income (excluding business and other taxes)
40
%
The ratio of operating expenses to operating income was 46.32%, adecrease of 1.63 percentage points compared to the prior year. Excludingbusiness and other taxes, the ratio was 41.97%, a decrease of 1.44percentage points compared to the prior year. This decrease was mainlydue to the effective control of operating costs, as well as robust growth inoperating income. Please refer to the “Operating expenses and others”section for more detailed information.
Credit cost RMB million
2004 2005 20060
4,000
8,000
12,000
16,000
20,000
24,000
Impairment losses on loans and advances
0
0.2
0.4
0.6
0.8
1.0
1.2
%
Credit costs
For 2006, credit cost was 0.53% of average loans and advances, an increaseof 0.01 percentage point compared to the prior year. While the Group hasincreased the size of its loan portfolio in recent years, credit cost has beenmaintained at a relatively low level. Improvement in asset quality, resultingfrom continuous improvements in the Group’s credit risk managementprocesses, and diligent efforts directed at disposing of non-performingassets contributed significantly to the Group’s ability to control credit costs.Please refer to the “Impairment losses on loans and advances” and “Riskmanagement” sections for more detailed information.
Identified impaired loans
2003 2004 2005 20060
80,000
160,000
240,000
320,000
400,000
Identified impaired loans Identified impaired loans to gross loans
0
4
8
12
16
20
RMB million %
At the end of 2006, identified impaired loans totalled RMB103.232 billion, adecrease of RMB6.298 billion compared to the prior year-end. The ratio ofidentified impaired loans to total loans and advances was 4.24%, adecrease of 0.66 percentage points compared to the prior year-end. TheGroup achieved its “dual decrease” objective of reducing both identifiedimpaired loans and the ratio of identified impaired loans to total loans andadvances. Please refer to the “Risk management” section for more detailedinformation.
Allowance for loan impairment losses
2003 2004 2005 20060
120,000
180,000
240,000
300,000
360,000
Identified impaired loans Allowance for loanimpairment losses
40
50
60
70
80
100
60,000
90
Allowance for loan impairmentlosses to identified impaired loans
RMB million %
At the end of 2006, allowance for loan impairment losses was RMB94.293billion, an increase of RMB11.14 billion compared to the end of 2005. Theratio of the allowance for loan impairment losses to identified impairedloans was 91.34%, an increase of 15.42 percentage points compared to theprior year-end. Please refer to the “Risk management” section for moredetailed information.
Capital adequacy ratio
2004 2005 20060
8
12
16
Capital adequacy ratio Core capital adequacy ratio
4
%
At the end of 2006, the Group’s capital adequacy ratio was 13.59% and itscore capital adequacy ratio was 11.44%, representing increases of 3.17percentage points and 3.36 percentage points, respectively, compared tothose at the prior year-end. These ratios were the highest levels in recentyears. This increase is primarily due to the significant core capital raisedthrough the IPO and the decrease in the Group’s net foreign currencyexposure, which reduces the related market risk capital requirement.Please refer to the “Capital management” section for more detailedinformation.

Bank of China Annual Report 200614
Income Statement Analysis
Major items in the income statement are as follows:Unit: RMB million
Group 2006 2005 2004 2003
Net interest income 121,371 101,008 88,435 76,597
Non-interest income 27,007 24,098 27,378 24,999
Including: net fee andcommission income 14,323 9,247 8,557 7,353
Operating expenses and others (68,731) (59,984) (54,879) (46,080)
Impairment losses on loansand advances (12,342) (11,486) (23,812) (18,100)
Profit before income tax 67,937 53,811 37,263 37,347
Income tax expense (19,673) (22,253) (10,198) (3,162)
Profit for the year 48,264 31,558 27,065 34,185
Attributable to:Equity holders of the Bank 42,830 25,921 22,301 31,015
Minority interest 5,434 5,637 4,764 3,170
Note: Net gains of RMB7.4 billion on the disposal of BOCHK Holdings’ shares were included in non-interest income in the year
2003.
Net Interest Income
In 2006, the Group’s net interest income was
RMB121.371 billion, an increase of RMB20.363
billion (20.16%) compared to the prior year.
Net interest income is affected by the average
balances and average interest rates of interest-
earning assets and interest-bearing liabilities.
Domestically, interest rates related to interest-
earning assets and interest-bearing liabilities are
largely influenced by the benchmark interest
rates and interest rate policy established by the
PBOC. Significantly, the PBOC establishes floor
benchmark interest rates for loans and ceiling
benchmark interest rates for deposits
denominated in RMB offered by domestic
banks. Within the context of the framework
established by the PBOC, the average interest
rates of interest-earning assets and interest-
bearing liabilities of the domestic operations are
also influenced by other factors such as Chinese
macro-economic changes, domestic
competition and currency market liquidity.
Overseas rates are largely a function of foreign
currency interest rate, local economic
environment, financial market conditions and
related monetary policies.
Management Discussion and Analysis 15
The average balances1 and average interest rates of interest-earning assets and interest-bearingliabilities related to the Group and its domestic RMB and foreign currency activities are shown in thefollowing tables:
Unit: RMB million, except percentages
2006 2005Average Average
Average interest Average interestItems balance rate (%) balance rate (%)
Group
Interest-earning assets
Loans and advances to customers 2,353,694 5.48% 2,194,078 5.03%
Investment securities 1,895,643 3.54% 1,485,640 3.02%
Due from banks and other financial institutions2 710,323 2.70% 655,359 1.94%
Total 4,959,660 4.34% 4,335,077 3.87%
Interest-bearing liabilities
Deposits from customers 4,070,308 1.96% 3,560,014 1.57%
Due to banks and other financial institutions3 373,811 2.51% 355,856 1.83%
Other borrowed funds 109,910 4.21% 115,843 3.90%
Total 4,554,029 2.06% 4,031,713 1.66%
Net interest spread 2.28% 2.21%
Domestic RMB activities
Interest-earning assets
Loans and advances to customers 1,604,617 5.43% 1,443,809 5.42%
Investment securities 906,823 2.35% 657,018 2.41%
Due from banks and other financial institutions2 350,694 1.81% 313,591 1.66%
Total 2,862,134 4.01% 2,414,418 4.11%
Interest-bearing liabilities
Deposits from customers 2,792,952 1.57% 2,332,869 1.52%
Due to banks and other financial institutions3 176,661 2.14% 152,810 2.47%
Other borrowed funds 60,001 4.62% 53,959 4.71%
Total 3,029,614 1.67% 2,539,638 1.65%
Net interest spread 2.34% 2.46%
Domestic foreign currency activities Unit: USD million, except percentages
Interest-earning assets
Loans and advances to customers 40,692 5.20% 41,984 4.00%
Investment securities 77,096 4.74% 60,384 3.52%
Due from banks and other financial institutions2 27,691 2.87% 26,348 1.74%
Total 145,479 4.51% 128,716 3.31%
Interest-bearing liabilities
Deposits from customers 59,288 1.98% 58,903 1.16%
Due to banks and other financial institutions3 19,465 2.50% 20,467 1.03%
Other borrowed funds 6,391 3.65% 7,361 3.27%
Total 85,144 2.22% 86,731 1.31%
Net interest spread 2.29% 2.00%
Notes:
1 Average balances of interest-earning assets and interest-bearing liabilities are the average daily balances derived from
the Group’s management accounts which have not been audited.
2 Due from banks and other financial institutions includes balances with central banks and placements with banks and
other financial institutions.
3 Due to banks and other financial institutions includes due to central banks and placements from banks and other financial
institutions.

Bank of China Annual Report 200616
The impact of volume and interest rate1 changes on consolidated net interest income, that ofdomestic RMB activities and that of domestic foreign currency activities are summarized in thefollowing table:
Unit: RMB million
Analysis of net interestincome variances
Items 2006 2005 Change Volume Interest rate
Group
Interest-earning assets
Loans and advances to customers 128,934 110,313 18,621 8,029 10,592
Investment securities 67,195 44,938 22,257 12,382 9,875
Due from banks and otherfinancial institutions2 19,205 12,697 6,508 1,066 5,442
Total 215,334 167,948 47,386 21,477 25,909
Interest-bearing liabilities
Due to customers 79,939 55,914 24,025 8,012 16,013
Due to banks and otherfinancial institutions3 9,393 6,512 2,881 329 2,552
Other borrowed funds 4,631 4,514 117 (231 ) 348
Total 93,963 66,940 27,023 8,110 18,913
Net interest income 121,371 101,008 20,363 13,367 6,996
Domestic RMB activities
Interest-earning assets
Loans and advances to customers 87,128 78,271 8,857 8,716 141
Investment securities 21,274 15,852 5,422 6,020 (598 )
Due from banks and otherfinancial institutions2 6,346 5,197 1,149 616 533
Total 114,748 99,320 15,428 15,352 76
Interest-bearing liabilities
Due to customers 43,967 35,495 8,472 6,993 1,479
Due to banks and otherfinancial institutions3 3,773 3,782 (9 ) 589 (598 )
Other borrowed funds 2,774 2,543 231 285 (54 )
Total 50,514 41,820 8,694 7,867 (827 )
Net interest income 64,234 57,500 6,734 7,485 (751 )
Domestic foreign currency activities Unit: USD million
Interest-earning assets
Loans and advances to customers 2,116 1,678 438 (52 ) 490
Investment securities 3,658 2,123 1,535 588 947
Due from banks and otherfinancial institutions2 794 459 335 23 312
Total 6,568 4,260 2,308 559 1,749
Interest-bearing liabilities
Due to customers 1,173 682 491 4 487
Due to banks and otherfinancial institutions3 486 211 275 (10 ) 285
Other borrowed funds 233 241 (8 ) (32 ) 24
Total 1,892 1,134 758 (38 ) 796
Net interest income 4,676 3,126 1,550 597 953
Notes:1 Impact of volume changes on interest income and expenses is calculated based on the changes in average balances of
interest-earning assets and interest-bearing liabilities during the reporting period. Impact of interest rate changes oninterest income and expenses is computed based on the changes in the average interest rates of interest-earning assetsand interest-bearing liabilities during the reporting period. Changes caused by changes in both volume and rate havebeen allocated to rate.
2 Due from banks and other financial institutions includes balances with central banks and placements with banks andother financial institutions.
3 Due to banks and other financial institutions includes amounts due to central banks and placements from banks and otherfinancial institutions.

Management Discussion and Analysis 17
Interest income
The Group’s interest income was RMB215.334
billion, an increase of RMB47.386 billion
(28.21%) compared to the prior year. This
increase was primarily attributable to growth in
the average balance as well as the average yield
of interest-earning assets. In this regard, the
average balance of interest-earning assets
increased by 14.41% and reached RMB4,959.66
billion. The yield on interest-earning assets
increased 47 basis points during 2006 to 4.34%.
Loans and advances to customers
The Group’s interest income earned on loans
and advances to customers was RMB128.934
billion, an increase of RMB18.621 billion
(16.88%) compared to the prior year. This
increase reflects the judicious increase in loan
balances during the year. After cautiously taking
risk and reward into consideration, the Group’s
average balance of loans and advances to
customers reached RMB2,353.694 billion,
representing an increase of 7.27% compared to
the prior year. Continued increases in foreign
currency yields (in particular the USD) and the
PBOC’s increases in the RMB loan benchmark
rate in April and August of 2006 pushed the
average yield on the Group’s loans and
advances to customers to 5.48%, an increase of
45 basis points.
Investment securities
The Group’s interest income earned on
investment securities was RMB67.195 billion, an
increase of RMB22.257 billion (49.53%)
compared to the prior year. The growth was
largely attributable to an intense focus on
optimizing the mix of the Group’s investment
portfolio by investing surplus liquidity, including
the IPO proceeds, which had not been utilized in
its loan businesses in securities with higher
yields relative to other alternatives. This
deployment of surplus liquidity resulted in an
increase of 27.6% in the average balance of
investment securities during the year to
RMB1,895.643 billion. The Group has also
continued to proactively manage the
composition of its investment securities
portfolio, taking into consideration continuing
increases in the yields on securities
denominated in foreign currencies, in particular
the USD. The average yield of investment
securities increased 52 basis points to 3.54%
during the year.
The average yield of investment securities
denominated in RMB was 2.35%, a decline of 6
basis points compared to the prior year. The
decline was primarily attributable to surplus
liquidity in the RMB financial markets, pushing
down the yields on RMB securities. As
illustrated in the chart below, the yield of one
year PBOC bills decreased steadily from 2004,
although the decline stabilized and began to rise
from the third quarter of 2005. Such impact was
fully reflected in the Bank’s earnings in 2006.
The Yield of PBOC Bills (One Year)
Sep 2004 Mar 20051.1030
1.6030
2.1030
2.6030
3.6030
3.1030
Sep 2005 Mar 2006 Sep 2006
%
Bank of China Annual Report 200618
Due from banks and other financialinstitutions
The Group’s interest income derived from
amounts due from banks and other financial
institutions rose RMB6.508 billion (51.26%) to
RMB19.205 billion. The increase was primarily
due to the increase in mandatory reserve funds
placed with the PBOC, which was in turn
attributable to the growth in customer deposits
and a series of increases by the PBOC in deposit
reserve requirements during the year from 7.5%
to 9.0%. Continued increases in the interest
rates of major currencies, including the USD,
were also the contributing factors. The average
yield on the Group’s due from banks and other
institutions increased by 76 basis points during
2006 to 2.70%.
Despite the increase in average yield, the Group
continued its efforts to minimize the relative
balance of this lower yielding asset class. At the
end of 2006, the ratio of the average balance of
amounts due from banks and other financial
institutions to that of total interest-earning
assets declined from 15% to 14%, or
approximately 1 percentage point compared to
the prior year.
Interest expense
The Group’s interest expense was RMB93.963
billion, an increase of RMB27.023 billion
(40.37%) compared to the prior year. This
increase was principally attributable to a 12.96%
growth in the average balance of interest-
bearing liabilities to RMB4,554.029 billion, as
well as a 40 basis points increase in the average
cost to 2.06%.
Due to customers
In 2006, the Group’s interest expense for
customer deposits was RMB79.939 billion,
representing an increase of RMB24.025 billion
(42.97%) compared to the prior year. The
increase was primarily due to the Group’s
concerted efforts to expand its customer deposit
base, with the average balance of customer
deposits increasing to RMB4,070.308 billion, an
increase of 14.33% during the year and a rise of
39 basis points in the average cost on customer
deposits to 1.96%. This increase in average cost
was mainly attributable to: the continued rise in
interest rates of major foreign currencies, in
particular the USD; the effect of the PBOC’s five
upward adjustments of the benchmark interest
rate for smaller balance foreign currency
deposits during 2005, which was fully reflected
during 2006; the PBOC’s increase of the
benchmark interest rate for RMB deposits in
August 2006; and a rise in the proportion of
fixed deposits to total deposits in overseas
operations.
Due to banks and other financialinstitutions
The Group’s interest expense for amounts due
to banks and other financial institutions was
RMB9.393 billion, an increase of RMB2.881
billion (44.24%) compared to the prior year. The
increase was primarily due to interest rate
increases related to major foreign currencies,
particularly the USD, which resulted in a rise of
68 basis points on the average cost to 2.51%.
The average interest rate of amounts due to
banks and other financial institutions
denominated in RMB was 2.14%, a decrease of
33 basis points. During the year, the Group
intensified its efforts at proactive liability
management to minimize the balance of
relatively high costing class of interest-bearing
liabilities.
Other borrowed funds
Other borrowed funds include special purpose
borrowings and bonds issued. Special purpose
borrowings are long-term borrowings in
multiple currencies from foreign governments
and/or banks in the form of export credit loans,
foreign government loans and other subsidized
Management Discussion and Analysis 19
loans. These special purpose loans are normally
used to finance projects with special
commercial purposes in PRC. The Group’s
interest expense for other borrowed funds was
RMB4.631 billion, an increase of RMB0.117
billion (2.59%) compared to the prior year. The
increase was mainly due to the rise in interest
rates of major foreign currencies, in particular
the USD. The average interest rate of other
borrowed funds rose 31 basis points during the
year to 4.21%.
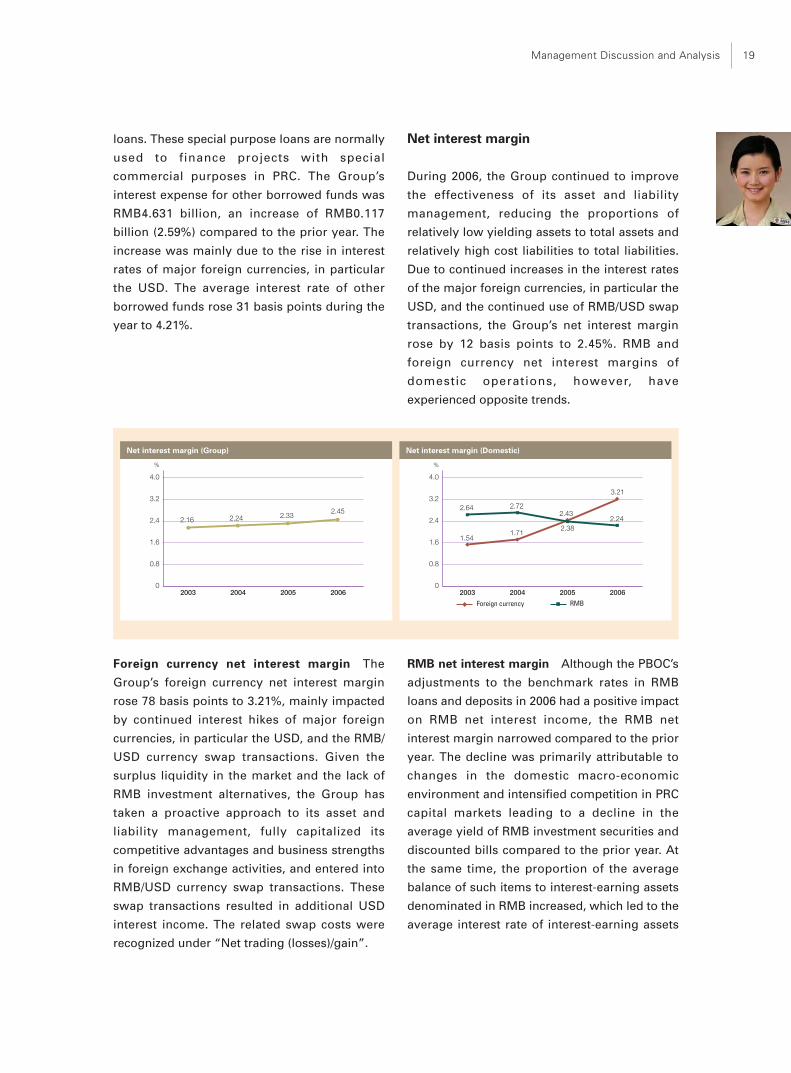
Net interest margin
During 2006, the Group continued to improve
the effectiveness of its asset and liability
management, reducing the proportions of
relatively low yielding assets to total assets and
relatively high cost liabilities to total liabilities.
Due to continued increases in the interest rates
of the major foreign currencies, in particular the
USD, and the continued use of RMB/USD swap
transactions, the Group’s net interest margin
rose by 12 basis points to 2.45%. RMB and
foreign currency net interest margins of
domestic operations, however, have
experienced opposite trends.
Net interest margin (Group)
%
0
0.8
1.6
2.4
3.2
4.0
2003 2004 2005 2006
2.16 2.24 2.332.45
Net interest margin (Domestic)
%
0
0.8
1.6
2.4
3.2
4.0
2003 2004 2005 2006
Foreign currency RMB
2.64 2.72
2.382.24
1.541.71
2.43
3.21
Foreign currency net interest margin The
Group’s foreign currency net interest margin
rose 78 basis points to 3.21%, mainly impacted
by continued interest hikes of major foreign
currencies, in particular the USD, and the RMB/
USD currency swap transactions. Given the
surplus liquidity in the market and the lack of
RMB investment alternatives, the Group has
taken a proactive approach to its asset and
liability management, fully capitalized its
competitive advantages and business strengths
in foreign exchange activities, and entered into
RMB/USD currency swap transactions. These
swap transactions resulted in additional USD
interest income. The related swap costs were
recognized under “Net trading (losses)/gain”.
RMB net interest margin Although the PBOC’s
adjustments to the benchmark rates in RMB
loans and deposits in 2006 had a positive impact
on RMB net interest income, the RMB net
interest margin narrowed compared to the prior
year. The decline was primarily attributable to
changes in the domestic macro-economic
environment and intensified competition in PRC
capital markets leading to a decline in the
average yield of RMB investment securities and
discounted bills compared to the prior year. At
the same time, the proportion of the average
balance of such items to interest-earning assets
denominated in RMB increased, which led to the
average interest rate of interest-earning assets

Bank of China Annual Report 200620
Non-interest IncomeUnit: RMB million
Group 2006 2005 2004 2003
Net fee and commission income 14,323 9,247 8,557 7,353
Net trading (losses)/gains (1,544) 4,283 8,882 4,303
Net gains/(losses) on investment securities 1,132 (582) 337 1,094
Other operating income 13,096 11,150 9,602 12,249
Total 27,007 24,098 27,378 24,999
Note: Net gains of RMB7.4 billion on the disposal of BOCHK Holdings’ shares were included in Other operating income in year
2003.
The Group reported non-interest income of
RMB27.007 billion, an increase of RMB2.909
billion (12.07%) compared to the prior year.
Non-interest income accounted for 18.20% of
total operating income, down 1.06 percentage
points. Excluding the losses from revaluation of
foreign currency positions, this ratio was
23.28%, an increase of 1.07 percentage points.
Net fee and commission income
Through its global network, the Group provides
its customers with a variety of fee-based
products, including agency services, settlement
and clearing, credit commitment, bank cards,
custodian and other services. The Group
improved its product mix, not only to generate
consistent revenue growth, but also to deepen
and strengthen its client relationships by
providing more diversified financial services to
address a more diverse set of customer needs.
denominated in RMB declining from last year’s
4.11% to this year’s 4.01%. As aforesaid, the
Bank entered into RMB/USD swap transactions
to increase income, but these swap transactions
resulted in a decline in RMB interest income.

Management Discussion and Analysis 21
Unit: RMB million
Group 2006 2005 2004 2003
Agency commissions 4,621 2,735 2,690 2,137
Settlement and clearing fees 3,848 2,941 2,626 2,237
Credit commitment fees 3,064 2,693 2,367 2,075
Bank card fees 2,937 2,340 1,840 1,340
Custodian and other service fees 2,669 1,989 1,865 1,779
Fee and commission income 17,139 12,698 11,388 9,568
Fee and commission expense (2,816) (3,451) (2,831) (2,215)
Net fee and commission income 14,323 9,247 8,557 7,353
The Group earned net fee and commission
income of RMB14.323 billion in 2006, an
increase of RMB5.076 billion (54.89%) compared
to the prior year. The principal elements are set
out in the table below:
Net fee and commission income from domestic
operations accounted for a significant portion of
consolidated net fee and commission income at
RMB8.629 million, an increase of RMB3.422
billion (65.72%) compared to the prior year. The
principal components of net fee and
commission income from domestic operations
are shown in the following table:
Unit: RMB million
Domestic 2006 2005 2004 2003
Agency commissions 1,406 823 647 425
Settlement and clearing fees 2,402 1,745 1,681 1,395
Credit commitment fees 2,164 1,784 1,407 1,191
Bank card fees 2,080 1,540 1,095 776
Custodian and other service fees 1,541 1,112 654 532
Fee and commission income 9,593 7,004 5,484 4,319
Fee and commission expense (964) (1,797) (1,432) (1,128)
Net fee and commission income 8,629 5,207 4,052 3,191
During 2006, the Group launched a three-year
plan to further develop and enhance its fee
based services, in order to leverage its
competitive advantage and reinforce its leading
position in the domestic market. The key
elements of this plan include: enhancement of
the management and organization structure and
deployment of adequate resources to more
effectively support the delivery of fee-based
products and services, principally through
objective-based performance evaluation and
remuneration; a reinvigorated focus on new
product development, with particular emphasis
on the areas of international settlement and
trade finance, wealth management products,
services for Qualified Domestic Institutional
Bank of China Annual Report 200622
Investors, and bank cards; improvement of
communications among various business and
functional departments, including product
management departments and the front line
departments, domestic and overseas
operations, commercial banking, investment
banking and insurance operations, to promote
efficient service and cross-selling; and further
strengthening of service pricing management
and improving pricing strategy including
revision and broadening of fee-charging
channels.
Agency commissions
The Group recorded agency commissions of
RMB4.621 billion in 2006, an increase of
RMB1.886 billion (68.96%) compared to the prior
year. The rapid growth of the domestic Chinese
economy, including robust increase in
disposable household income levels, and the
rapidly growing securities markets, both
domestically and in Hong Kong SAR,
contributed to the increase in the demand for
agency services related to mutual funds
distribution, placement of insurance products
and securities brokerage, which significantly
contributed to the increase in agency
commissions during 2006.
Settlement and clearing fees
The Group recorded settlement and clearing
fees of RMB3.848 billion, an increase of
RMB0.907 billion (30.84%) compared to the prior
year. The increase was primarily attributable to
strong demand for trade related clearing and
settlement services. Furthermore, the Bank
successfully launched the first phase of its new
core payments system, which provides an
efficient platform for customers to initiate
remittance transactions, contributing to a robust
increase in transaction volume and fee income
domestically.
Credit commitment fees
Credit commitment fees primarily consist of
fees from guarantee services, fees in connection
with on-lending loans and syndicated loans.
Total credit commitment fees were RMB3.064
billion in 2006, an increase of RMB0.371 billion
(13.78%) compared to the prior year. The
increase was primarily attributable to continued
growth of the domestic and international trade,
which led to the increase of fees from letters of
guarantee and syndicated loans business.
Bank card fees
Bank card fees primarily consist of annual fees,
cash advance fees, transaction fees and
merchant services fees. In 2006, bank card fees
for the Group were RMB2.937 billion, an
increase of RMB0.597 billion (25.51%) compared
to the prior year. During 2006, the Group
launched a number of new bank card programs
domestically, including the BoC City Card, the
Great Wall Commercial Card and a series of Co-
Brand Cards, which permit installment
payments. The steady increase in bank card fees
reflected increases in both the number and
usage volume of bank cards. In addition to these
increases, the levy of a fee on all domestic debit
cards resulted in an increase of RMB0.214
billion domestically during 2006.
Custodian and other service fees
Custodian and other service fees primarily
consist of fees from custody, corporate finance
advisory and other fee-based services. These
fees totalled RMB2.669 billion, an increase of
RMB0.680 billion (34.19%) compared to the prior
year. This increase was primarily attributable to
charges on smaller balance personal accounts,
which contributed RMB0.224 billion to the
increase and the exploring and developing new
fee sources such as corporate finance advisory
services.

Management Discussion and Analysis 23
Fee and commission expense
In 2006, total fee and commission expense was
RMB2.816 billion, a decrease of RMB0.635
billion (18.40%) compared to the prior year. The
decrease related to a number of factors
including a decrease of RMB0.3 billion due to a
reduction in transaction fees charged by the
China Foreign Exchange Trading Centre for
certain foreign exchange transactions and the
expenses of RMB0.13 billion in connection with
the issue of subordinated bonds and asset
disposal fees of RMB0.16 billion to China Orient
in 2005 which did not recur in 2006.
Net trading (losses)/gainsUnit: RMB million
Group 2006 2005 2004 2003
Net (losses)/gains from foreign exchange andforeign exchange products (2,290) 2,226 5,294 9,488
Net gains/(losses) from interest rate instruments 492 1,753 2,294 (5,333)
Net gains/(losses) from trading equity securities 324 130 (178) 3
Net (losses)/gains fromprecious metal transactions (68) 150 1,271 (40)
Others (2) 24 201 185
Total (1,544) 4,283 8,882 4,303
The Group incurred a net trading loss of
RMB1.544 billion in 2006. This loss arose
principally from foreign exchange and foreign
exchange products as a result of the continued
appreciation of RMB.
Net (losses)/gains from foreign exchangeand foreign exchange products
The Group recognized net losses of RMB2.290
billion from foreign exchange and foreign
exchange products during 2006. This loss
reflected the net result of gains from foreign
exchange transactions and losses from the
revaluation of foreign currency positions.
Gains from foreign exchange transactions
The volume of the Group’s foreign exchange
transactions grew steadily during the year,
resulting in a gain of RMB7.530 billion.
Domestically, the spread income derived from
RMB/foreign exchange operations amounted to
RMB5.938 billion, an increase of RMB1.077
billion (22.16%) compared to the prior year. The
increase was primarily attributable to the
increase of the spread earned on RMB/foreign
currency operations compared to 2005.

Bank of China Annual Report 200624
Losses from the revaluation of foreign currency positions
The Group reported a net loss of RMB9.820 billion which was attributable to the revaluation of its net
foreign currency position in 2006. The composition of the Group’s foreign currency position as at 31
December 2006 and the related revaluation gains and losses for the year are set out in the following
table:
Net gains/(losses) arising fromNet foreign currency position➀ the net foreign currency position➀
as at 31 December 2006 in 2006Unit: USD million Unit: RMB million
On Off On OffBalance Balance Balance Balance
Sheet Sheet Total Sheet Sheet Total
1. Net foreign currency positionrelating to Huijin option
(1) Foreign exchange option with Huijin — (18,000 ) — 1,949
(2) Foreign currency capital injected — (2,758 )economically hedged by theHuijin option 18,000 — (4,707 ) —
2. Net foreign currency position relatingto swap agreements
(1) Spot transactions under foreigncurrency swap agreements 41,528 — (6,730 ) —
(2) Forward transactions under foreign — (4,508 )currency swap agreements — (41,528 ) — 2,222
3. Foreign currency denominated net investmentsin foreign operations➁ 14,571 — 14,571 — — —
4. Other net foreign currency position 11,588 4,109 15,697 (2,773 ) 219 (2,554 )
Sub-total 85,687 (55,419 ) 30,268 (14,210 ) 4,390 (9,820 )
Less: Foreign currency denominated net investments in foreign operations➁ (14,571 )
Net foreign currency position 15,697
Notes:
➀ Long and short positions of foreign currency are represented by positive and negative figures, respectively.
Gain and loss of revaluation and retranslation are represented by positive and negative figures, respectively.
➁ Retranslation losses related to the foreign currency denominated net investments in foreign operations are recognized as
“Currency translation differences”, a separate component of equity, which does not affect the consolidated profit and loss
of the Group.
Management Discussion and Analysis 25
The following explains the key components
presented in the above table:
1. Net foreign currency position relating to
Huijin option
On 5 January 2005, the Bank entered into an
option agreement with Huijin (“Huijin option”),
to economically hedge a portion of its net
foreign currency position arising from the
foreign currency capital injection by Huijin.
According to the terms of the agreement, the
Bank acquired options to sell to Huijin USD,
totaling USD18 billion, in tranches of no more
than USD1.5 billion each at the beginning of
each calendar month from 1 January to 31
December 2007 at a fixed exchange rate of
USD1 to RMB8.2769. The related option
premium of RMB4.469 billion is payable by the
Bank to Huijin in 12 equal monthly installments
beginning from 1 January 2007. The gain from
the change in the fair value of the Huijin option
for 2006 amounted to RMB1.949 billion, which
partially offset the RMB4.707 billion foreign
exchange revaluation loss of the related on-
balance sheet foreign currency position.
2. Net foreign currency position relating to
swap agreements
In light of the surplus liquidity in the RMB
capital markets, the lack of investment
alternatives and the favorable interest yields of
foreign currency denominated financial assets,
the Bank entered into a series of USD/RMB
swap transactions to increase its income. Under
these agreements, the Bank bought USD in spot
transactions and invested the funds in financial
assets denominated in foreign currency to
benefit from the favorable interest rate
differentials, and bought back RMB in the future
at agreed exchange rates to effectively contain
the Group’s foreign currency risks. The swap
transactions had no impact on the Group’s net
foreign currency position. At the end of 2006,
the outstanding notional amount of these
transactions amounted to USD41.5 billion.
In 2006, the foreign exchange revaluation loss
related to the USD positions through these spot
transactions was RMB6.730 billion, partially
offset by the revaluation gain of RMB2.222
billion on the forward sales of USD. This net
loss of RMB4.508 billion was reported as a
component of “Net trading (losses)/gains”,
contributing to the significant decrease in 2006.
The beneficial effect of the favorable interest
rate differential on USD financial assets,
however, was reported as a component of
“Interest income”. Please refer to the “Cost/
benefits discussion” below for more detailed
information.
3. Other net foreign currency position
At the end of 2006, other net foreign currency
position of the Group amounted to USD15.7
billion which included a USD11.6 billion on-
balance sheet position and a USD4.1 billion off-
balance sheet position. The on-balance sheet
position comprised primarily the unhedged
portion of foreign currency capital contributions,
foreign currency profits, foreign currency
position retained for daily operation purposes,
and other long or short positions resulting from
cross foreign currency transactions.
During 2006, the foreign currency proceeds
from the IPO and the foreign currency profits
increased the Group’s foreign currency position.
However, the Bank sold approximately USD26.3
billion following approval from the relevant
authorities. As a result, the Group reduced its
net foreign currency position from USD25.8
billion as at 31 December 2005 to USD15.7
billion as at 31 December 2006. Please see Note
III.5 to the Financial Statements for detailed
information on the movements of the Group’s
foreign currency position. In 2006, the net loss
arising from this other net foreign currency
position recognized was RMB2.554 billion,
which was lower than that in 2005.

Bank of China Annual Report 200626
In 2007, the Group has continued to implement
measures to further reduce its net foreign
currency exposure and it is anticipated that such
exposure will continue to decrease.
Cost/benefits discussion
The Bank recorded a foreign currency
revaluation loss of RMB9.820 billion from its
foreign currency position during 2006. However,
it has benefited from the favorable interest
differentials between foreign currencies and
RMB financial assets as discussed above. By
way of example, in 2006, the average yield of
our domestic foreign currency denominated
investment securities was 4.74%, which was
higher than the average yield of 2.35% for RMB
denominated investment securities, leading to a
difference in yield of 2.39%. Management
believes that the benefits from favorable interest
differentials were greater than the foreign
currency revaluation loss as discussed above.
Net gains/(losses) from interest rateinstruments
Net gains/(losses) from interest rate instruments
primarily comprised of realized and unrealized
gains/losses related to the trading of debt
securities and interest rate derivatives. In 2006,
the Group reported a net gain of RMB0.492
billion from trading in interest rate instruments,
a decrease of RMB1.261 billion (71.93%)
compared to the prior year.
Net gains/losses on investment securitiesUnit: RMB million
Group 2006 2005 2004 2003
De-recognition of available-for-sale securities 1,178 (606) 529 1,217
(Provision)/write back for impairment losses (46) 24 (192) (123)
Total 1,132 (582) 337 1,094
The Group reported a net gain of RMB1.132
billion on investment securities in 2006, an
increase of RMB1.714 billion. This was mainly
attributable to the gain of RMB1.3 billion on
disposal of certain equity investments originally
acquired through domestic debt-for-equity swap
arrangements with borrowers.
Management Discussion and Analysis 27
Other operating incomeUnit: RMB million
Group 2006 2005 2004 2003
Insurance premiums 7,708 5,237 4,057 3,225
Gains on disposal of shares insubsidiaries and associates 789 320 760 7,530
Gains on disposal of property andequipment and other assets 717 870 420 157
Changes in fair value ofinvestment properties 595 1,697 1,280 (412)
Dividend income 186 194 264 122
Others 3,101 2,832 2,821 1,627
Total 13,096 11,150 9,602 12,249
Note: Net gains of RMB7.4 billion on the disposal of BOCHK Holdings’ shares were included in Gains on disposal of shares in
subsidiaries and associates in year 2003.
The Group’s other operating income was
RMB13.096 billion, an increase of RMB1.946
billion (17.45%) compared to the prior year. The
increase was mainly attributable to the rapid
development in the insurance business. In 2006,
insurance premiums amounted to RMB7.708
billion, representing an increase of RMB2.471
billion (47.18%) compared to the prior year.
Impairment Losses on Loansand Advances
In 2006, the Group’s identified impaired loans
and ratio of identified impaired loans to gross
loans both decreased, reflecting the improved
credit quality of loans and advances. The Group
continued to adopt a prudent loan provisioning
policy. Impairment losses on loans and
advances amounted to RMB12.342 billion in
2006, representing an increase of RMB0.856
billion compared to the prior year. In 2006, the
credit cost was 0.53% of average loans and
advances, the similar level as the prior year. For
further information on loan quality and the
allowance for impairment losses, please refer to
the “Risk Management — Credit Risk” section.

Bank of China Annual Report 200628
Operating Expenses and OthersUnit: RMB million
Group 2006 2005 2004 2003
Staff costs 30,896 27,106 20,545 16,824
General operating and administrative expenses 14,603 13,251 11,777 9,105
Depreciation and amortization 6,026 6,314 6,664 6,614
Business and other taxes 6,462 5,680 4,981 3,972
Special levy to the Ministry of Finance — — 2,805 3,060
Insurance benefits and claims 7,484 4,153 3,256 2,362
Operating lease rentals 1,775 1,550 1,759 1,725
Impairment/(write back) losses on other assets (171) 433 699 233
Losses on disposal of property and equipment 148 205 346 408
Provision for litigation losses 897 712 1,257 545
Others 611 580 790 1,232
Total 68,731 59,984 54,879 46,080
In 2006, the Group incurred operating expenses
amounting to RMB68.731 billion, an increase of
RMB8.747 billion (14.58%) compared to the prior
year.
Staff costs amounted to RMB30.896 billion, an
increase of RMB3.790 billion (13.98%) compared
to the prior year. The increase in staff costs was
mainly attributable to an increase in domestic
salary levels through the implementation of the
new domestic Salary System in 2006, which
assigned salary levels based on a consistent
assessment of roles, responsibilities and market
compensation levels. In addition, related
government mandated contributions to various
employee welfare programs, labor union, and
training initiatives which were levied at the rate
of 14%, 2% and 1.5%, respectively of the staff
salary costs also increased. Increases in
retirement costs related to contributions to the
Group’s defined contribution plan for domestic
employees also contributed to the rise in staff
costs. The impacts of these increases were
partially offset by the substantial decrease in
early retirement benefit expenses incurred in
2006. Such expenses incurred for 2005
amounted to RMB3.064 billion as a result of
certain human resources restructuring
measures implemented in 2005. For additional
details related to staff costs, see Note V.8 to the
Financial Statements.
General operating and administrative expenses
mainly comprised postal fees, marketing fees,
utility fees, printing expenses, maintenance
fees, offices, regulatory expenses and other
professional fees. In 2006, the general operating
and administrative expenses were RMB14.603
billion, an increase of RMB1.352 billion (10.20%)
compared to the prior year, consistent with the
growth in the Group’s business activities. These
expenses also included regulatory fees of
RMB0.992 billion paid to the CBRC, which
increased RMB0.066 billion compared to the
prior year.
Insurance benefits and claims amounted to
RMB7.484 billion, an increase of RMB3.331
billion (80.21%) compared to the prior year. As
the life insurance business grew rapidly in 2006,
the provision for life insurance claims increased
accordingly.

Management Discussion and Analysis 29
During 2006, the Group intensified its focus oncost control and budget management and thegrowth in operating income outpaced that ofoperating expenses. In 2006, the cost (excludingbusiness and other taxes) to income ratio was41.97%, a decrease of 1.44 percentage pointscompared to the prior year, indicating animprovement in operating efficiency.
Income Tax Expense
In 2006, the Group’s income tax expense wasRMB19.673 billion, representing a decrease ofRMB2.580 billion (11.59%) compared to the prioryear. The effective tax rate was 28.96%, adecrease of 12.39 percentage points comparedto the prior year. The decrease in the effectivetax rate was mainly due to the fact that pursuantto Cai Shui [2007] No. 40 “Notice to Bank ofChina Limited on the Deductible Criterionrelating to Salary Expenses” issued by theMinistry of Finance and the State Administrationof Taxation, the Group has obtained approval
for the deduction of RMB15.669 billion of itsdomestic salary expenses when determining theGroup’s 2006 taxable income, resulting in adecrease in income tax expense of RMB4.6billion for 2006.
The reconciliation of the statutory income taxrate to the effective income tax rate is set forthin the Note V.10 to the Financial Statements.
Balance Sheet Analysis
At the end of 2006, the Group’s total assets wereRMB5,327.653 billion, an increase ofRMB587.605 billion (12.40%) compared to theprior year-end, and total liabilities wereRMB4,914.697 billion, an increase ofRMB430.168 billion (9.59%) compared to theprior year-end.
An analysis of significant balance sheet items isset out in the following table:
Unit: RMB million
As at 31 December
Group 2006 2005 2004 2003
Assets
Loans and advances to customers, net 2,337,726 2,152,112 2,072,919 1,921,861
Investment securities1 1,892,482 1,683,313 1,321,646 1,104,105
Placements with banks and otherfinancial institutions, and balanceswith central banks 778,769 649,040 624,540 696,074
Other assets 318,676 255,583 246,116 251,240
Total assets 5,327,653 4,740,048 4,265,221 3,973,280
Liabilities
Due to customers 4,091,118 3,699,464 3,338,448 3,033,364
Due to and placements from banks andother financial institutions, and due tocentral banks2 368,059 376,898 319,613 329,239
Bonds issued and other borrowings 123,571 112,343 95,802 81,052
Other liabilities 331,949 295,824 283,451 307,779
Total liabilities 4,914,697 4,484,529 4,037,314 3,751,434
Notes:
1 Including trading assets and other financial instruments at fair value through profit or loss, available-for-sale securities,held-to-maturity securities and securities classified as loans and receivables.
2 Including amounts due to central banks, due to banks and other financial institutions, certificates of deposit andplacements from banks and other financial institutions.
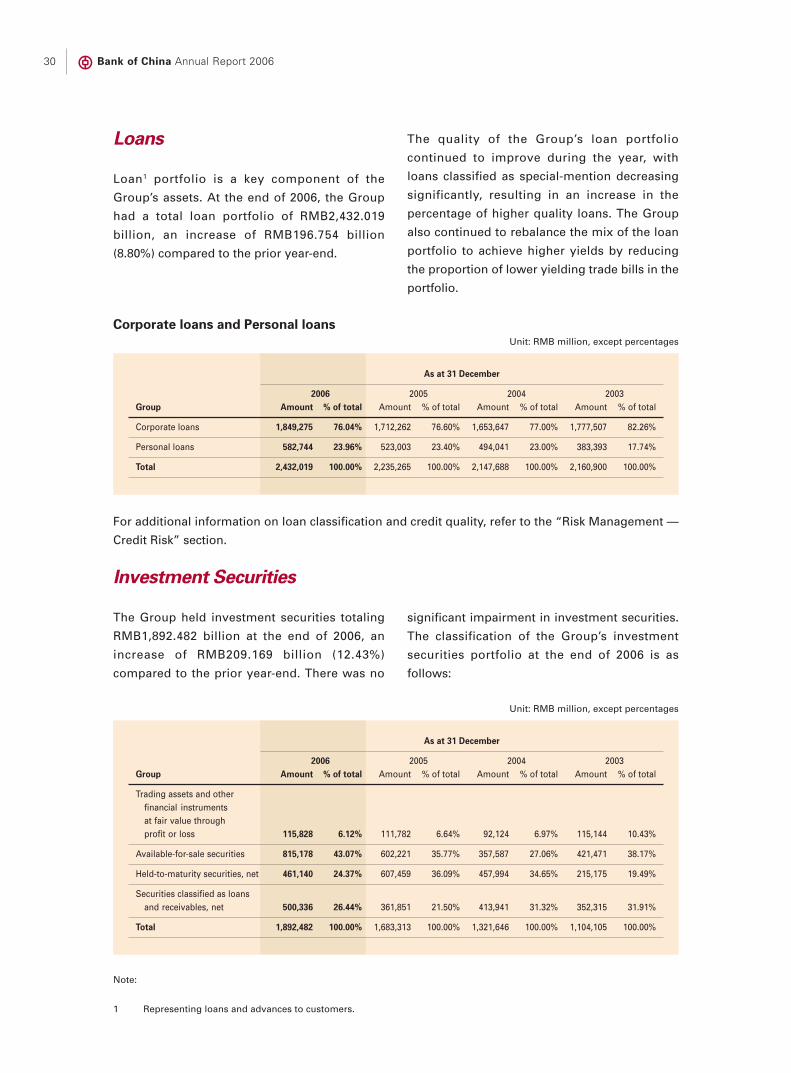
Bank of China Annual Report 200630
Loans
Loan1 portfolio is a key component of the
Group’s assets. At the end of 2006, the Group
had a total loan portfolio of RMB2,432.019
billion, an increase of RMB196.754 billion
(8.80%) compared to the prior year-end.
The quality of the Group’s loan portfolio
continued to improve during the year, with
loans classified as special-mention decreasing
significantly, resulting in an increase in the
percentage of higher quality loans. The Group
also continued to rebalance the mix of the loan
portfolio to achieve higher yields by reducing
the proportion of lower yielding trade bills in the
portfolio.
Corporate loans and Personal loansUnit: RMB million, except percentages
As at 31 December
2006 2005 2004 2003Group Amount % of total Amount % of total Amount % of total Amount % of total
Corporate loans 1,849,275 76.04% 1,712,262 76.60% 1,653,647 77.00% 1,777,507 82.26%
Personal loans 582,744 23.96% 523,003 23.40% 494,041 23.00% 383,393 17.74%
Total 2,432,019 100.00% 2,235,265 100.00% 2,147,688 100.00% 2,160,900 100.00%
For additional information on loan classification and credit quality, refer to the “Risk Management —
Credit Risk” section.
Note:
1 Representing loans and advances to customers.
Investment Securities
The Group held investment securities totaling
RMB1,892.482 billion at the end of 2006, an
increase of RMB209.169 billion (12.43%)
compared to the prior year-end. There was no
significant impairment in investment securities.
The classification of the Group’s investment
securities portfolio at the end of 2006 is as
follows:
Unit: RMB million, except percentages
As at 31 December
2006 2005 2004 2003Group Amount % of total Amount % of total Amount % of total Amount % of total
Trading assets and otherfinancial instrumentsat fair value throughprofit or loss 115,828 6.12% 111,782 6.64% 92,124 6.97% 115,144 10.43%
Available-for-sale securities 815,178 43.07% 602,221 35.77% 357,587 27.06% 421,471 38.17%
Held-to-maturity securities, net 461,140 24.37% 607,459 36.09% 457,994 34.65% 215,175 19.49%
Securities classified as loansand receivables, net 500,336 26.44% 361,851 21.50% 413,941 31.32% 352,315 31.91%
Total 1,892,482 100.00% 1,683,313 100.00% 1,321,646 100.00% 1,104,105 100.00%
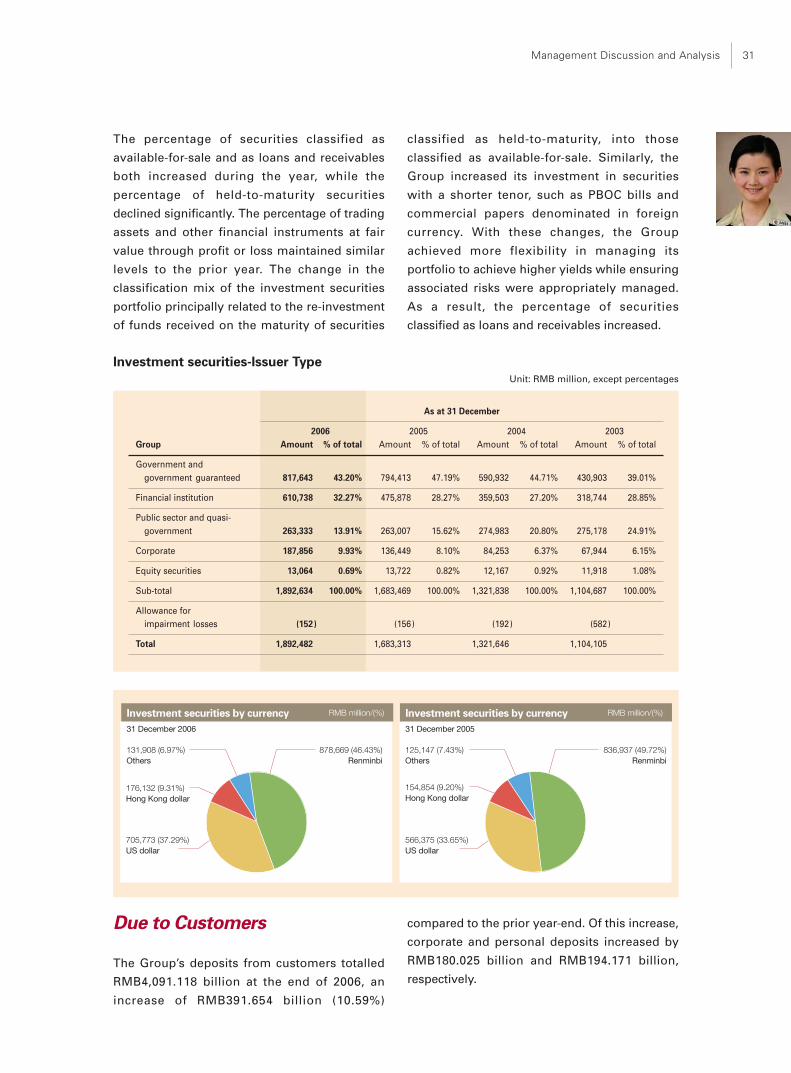
Management Discussion and Analysis 31
The percentage of securities classified as
available-for-sale and as loans and receivables
both increased during the year, while the
percentage of held-to-maturity securities
declined significantly. The percentage of trading
assets and other financial instruments at fair
value through profit or loss maintained similar
levels to the prior year. The change in the
classification mix of the investment securities
portfolio principally related to the re-investment
of funds received on the maturity of securities
classified as held-to-maturity, into those
classified as available-for-sale. Similarly, the
Group increased its investment in securities
with a shorter tenor, such as PBOC bills and
commercial papers denominated in foreign
currency. With these changes, the Group
achieved more flexibility in managing its
portfolio to achieve higher yields while ensuring
associated risks were appropriately managed.
As a result, the percentage of securities
classified as loans and receivables increased.
Investment securities-Issuer TypeUnit: RMB million, except percentages
As at 31 December
2006 2005 2004 2003Group Amount % of total Amount % of total Amount % of total Amount % of total
Government andgovernment guaranteed 817,643 43.20% 794,413 47.19% 590,932 44.71% 430,903 39.01%
Financial institution 610,738 32.27% 475,878 28.27% 359,503 27.20% 318,744 28.85%
Public sector and quasi-government 263,333 13.91% 263,007 15.62% 274,983 20.80% 275,178 24.91%
Corporate 187,856 9.93% 136,449 8.10% 84,253 6.37% 67,944 6.15%
Equity securities 13,064 0.69% 13,722 0.82% 12,167 0.92% 11,918 1.08%
Sub-total 1,892,634 100.00% 1,683,469 100.00% 1,321,838 100.00% 1,104,687 100.00%
Allowance forimpairment losses (152) (156) (192) (582)
Total 1,892,482 1,683,313 1,321,646 1,104,105
705,773 (37.29%)US dollar
176,132 (9.31%)Hong Kong dollar
878,669 (46.43%)Renminbi
Investment securities by currency RMB million/(%)
131,908 (6.97%)Others
31 December 2006
154,854 (9.20%)Hong Kong dollar
836,937 (49.72%)Renminbi
Investment securities by currency RMB million/(%)
125,147 (7.43%)Others
566,375 (33.65%)US dollar
31 December 2005
Due to Customers
The Group’s deposits from customers totalled
RMB4,091.118 billion at the end of 2006, an
increase of RMB391.654 billion (10.59%)
compared to the prior year-end. Of this increase,
corporate and personal deposits increased by
RMB180.025 billion and RMB194.171 billion,
respectively.

Bank of China Annual Report 200632
Customer Deposits by Customer Type
The following table sets forth the principal components of the Group’s deposits from customers by
customer type:
Unit: RMB million, except percentages
As at 31 December
2006 2005 2004 2003Group Amount % of total Amount % of total Amount % of total Amount % of total
Corporate deposits
Demand deposits 979,653 23.95% 836,763 22.62% 776,648 23.26% 679,524 22.40%
Time deposits 549,118 13.42% 511,983 13.84% 406,019 12.16% 332,606 10.96%
Sub-total 1,528,771 37.37% 1,348,746 36.46% 1,182,667 35.42% 1,012,130 33.36%
Personal deposits
Demand deposits 770,583 18.83% 667,957 18.06% 697,028 20.88% 607,904 20.04%
Time deposits 1,645,914 40.23% 1,554,369 42.02% 1,351,692 40.49% 1,324,511 43.66%
Sub-total 2,416,497 59.06% 2,222,326 60.07% 2,048,720 61.37% 1,932,415 63.71%
Security and margin deposits 145,850 3.57% 128,392 3.47% 107,061 3.21% 88,819 2.93%
Total 4,091,118 100.00% 3,699,464 100.00% 3,338,448 100.00% 3,033,364 100.00%
During 2006, the Group continued to proactively
manage its liability mix, while maintaining
stable growth of deposits. In this regard, the
proportion of generally low-interest bearing
demand deposits, both corporate and personal,
increased by 2.04 percentage points and 1.83
percentage points during the year.
The following table sets forth the principal
components of the Group’s domestic deposits
from customers by customer type:
Unit: RMB million, except percentages
As at 31 December
2006 2005 2004 2003Domestic Amount % of total Amount % of total Amount % of total Amount % of total
Corporate deposits
Demand deposits 871,331 26.65% 734,140 25.08% 657,481 25.80% 574,030 25.09%
Time deposits 420,017 12.85% 393,394 13.44% 283,435 11.12% 240,824 10.52%
Sub-total 1,291,348 39.50% 1,127,534 38.52% 940,916 36.92% 814,854 35.61%
Personal deposits
Demand deposits 544,974 16.67% 470,508 16.07% 416,516 16.34% 351,875 15.38%
Time deposits 1,295,672 39.62% 1,208,176 41.27% 1,091,760 42.84% 1,040,315 45.46%
Sub-total 1,840,646 56.29% 1,678,684 57.34% 1,508,276 59.18% 1,392,190 60.84%
Security and margin deposits 137,815 4.21% 121,344 4.14% 99,417 3.90% 81,310 3.55%
Total 3,269,809 100.00% 2,927,562 100.00% 2,548,609 100.00% 2,288,354 100.00%
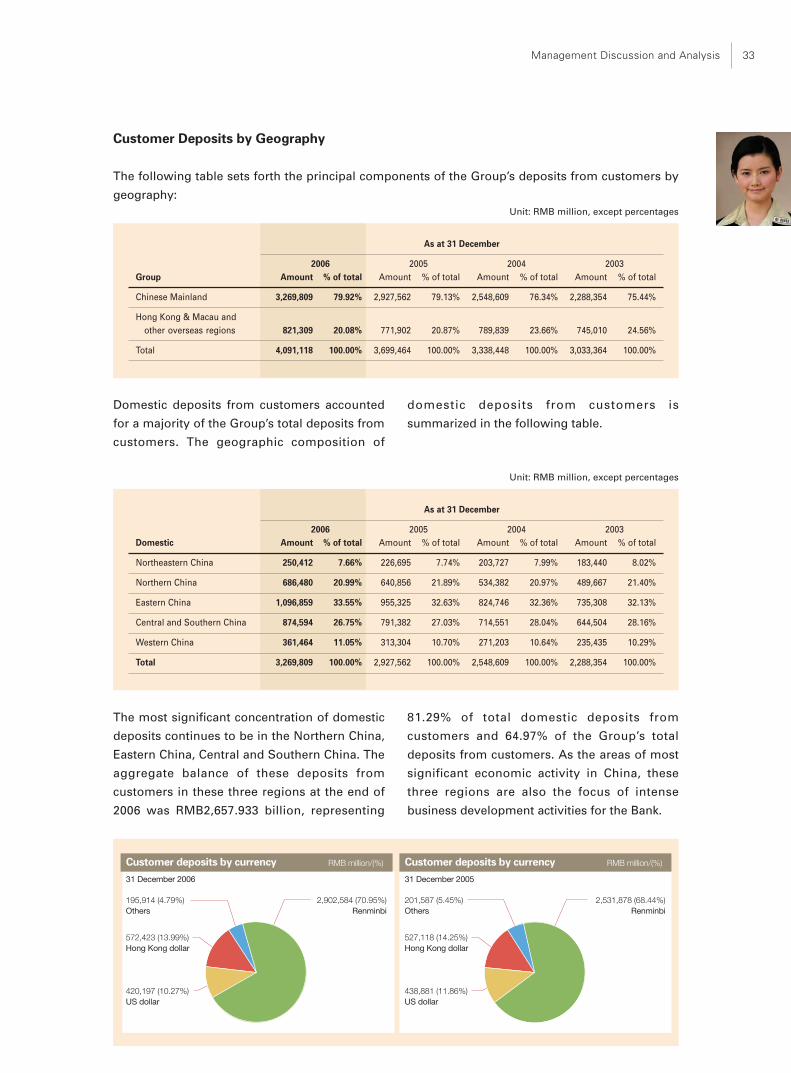
Management Discussion and Analysis 33
Customer Deposits by Geography
The following table sets forth the principal components of the Group’s deposits from customers by
geography:Unit: RMB million, except percentages
As at 31 December
2006 2005 2004 2003Group Amount % of total Amount % of total Amount % of total Amount % of total
Chinese Mainland 3,269,809 79.92% 2,927,562 79.13% 2,548,609 76.34% 2,288,354 75.44%
Hong Kong & Macau andother overseas regions 821,309 20.08% 771,902 20.87% 789,839 23.66% 745,010 24.56%
Total 4,091,118 100.00% 3,699,464 100.00% 3,338,448 100.00% 3,033,364 100.00%
Domestic deposits from customers accounted
for a majority of the Group’s total deposits from
customers. The geographic composition of
domestic deposits from customers is
summarized in the following table.
Unit: RMB million, except percentages
As at 31 December
2006 2005 2004 2003Domestic Amount % of total Amount % of total Amount % of total Amount % of total
Northeastern China 250,412 7.66% 226,695 7.74% 203,727 7.99% 183,440 8.02%
Northern China 686,480 20.99% 640,856 21.89% 534,382 20.97% 489,667 21.40%
Eastern China 1,096,859 33.55% 955,325 32.63% 824,746 32.36% 735,308 32.13%
Central and Southern China 874,594 26.75% 791,382 27.03% 714,551 28.04% 644,504 28.16%
Western China 361,464 11.05% 313,304 10.70% 271,203 10.64% 235,435 10.29%
Total 3,269,809 100.00% 2,927,562 100.00% 2,548,609 100.00% 2,288,354 100.00%
The most significant concentration of domestic
deposits continues to be in the Northern China,
Eastern China, Central and Southern China. The
aggregate balance of these deposits from
customers in these three regions at the end of
2006 was RMB2,657.933 billion, representing
81.29% of total domestic deposits from
customers and 64.97% of the Group’s total
deposits from customers. As the areas of most
significant economic activity in China, these
three regions are also the focus of intense
business development activities for the Bank.
Customer deposits by currency RMB million/(%)
527,118 (14.25%)Hong Kong dollar
2,531,878 (68.44%)Renminbi
201,587 (5.45%)Others
438,881 (11.86%)US dollar
31 December 2005
572,423 (13.99%)Hong Kong dollar
2,902,584 (70.95%)Renminbi
195,914 (4.79%)Others
420,197 (10.27%)US dollar
Customer deposits by currency RMB million/(%)
31 December 2006

Bank of China Annual Report 200634
Deposits from customers denominated in RMB
remained the Group’s most significant funding
source. At the end of 2006, the Group’s deposits
from customers denominated in RMB totalled
RMB2,902.584 billion, representing 70.95% of
the Group’s total deposits from customers, an
increase of 2.51 percentage points compared to
the prior year. During 2006, deposits from
customers denominated in RMB increased
RMB370.706 billion, representing 94.65% of the
increase in the Group’s total deposits from
customers. Deposits from customers
denominated in USD and HKD, accounted for
10.27% and 13.99%, respectively, of the Group’s
total deposits from customers at the end of
2006.
Equity
The Bank substantially increased its capital base
in recent years through, among other things, the
capital contribution from Huijin at the end of
2003, the sale of equity to strategic investors
during 2005, and the IPO in 2006. At the end of
2006, the Group’s total equity was RMB412.956
billion, representing an increase of RMB157.437
billion (61.61%) compared to the prior year-end.
This increase was comprised of the following
significant elements:
(1) On 13 March 2006, the Bank issued
approximately 8.514 billion ordinary
shares of par value of RMB1.00 each to the
National Council for Social Security Fund
at a premium. The share premium (net of
share issuance costs) of RMB1.481 billion
was recognized in the capital reserve;
(2) On 1 June 2006 and 9 June 2006, the Bank
issued approximately 29.404 billion H-
shares of par value of RMB1.00 each
through a global offering to Hong Kong
and overseas investors at a premium. The
share premium (net of share issuance
costs) of RMB58.128 billion was
recognized in the capital reserve;
(3) On 29 June 2006, the Bank issued
approximately 6.494 billion A-shares of par
value of RMB1.00 each through an initial
public offering to domestic investors at a
premium. The share premium (net of share
issuance costs) of RMB12.958 billion was
recognized in the capital reserve;
(4) In 2006, the Group’s profit after income tax
amounted to RMB48.264 billion and profit
attributable to equity holders of the Bank
was RMB42.83 billion.
Please refer to the Consolidated Statement of
Changes in Equity in the Financial Statements
for additional details.

Management Discussion and Analysis 35
Off-balance Sheet Items
Off-balance sheet items include derivative
financial instruments, contingent liabilities and
commitments.
Derivative Financial Instruments
The Group entered into various foreign
currency, interest rate, equity and precious
metals derivative transactions principally for
trading, asset and liability management and on
behalf of customers.
Please refer to Note V.16 to the Financial
Statements for the contractual/notional amounts
and fair values of derivative instruments held by
the Group at the end of 2006.
Contingent Liabilities andCommitments
Contingent liabilities and commitments include
legal proceedings, assets pledged, capital
commitments, operating leases, certificate
treasury bond redemption commitments and
credit commitments. Credit commitments were
the single largest component, totaling
RMB1,087.822 billion at the end of 2006.
Please refer to Note V.38 to the Financial
Statements for more details related to
contingent liabilities and commitments.
Segment Reporting byGeography
The Group conducts its business activities in the
Chinese mainland, Hong Kong and Macau and
other overseas locations. The geographical
analysis of profit attributable to our business
activities, along with information on the related
assets and liabilities, in these three geographic
areas are set forth in the following table:
Unit: RMB million
Chinese mainland Hong Kong & Macau Other overseas regions Eliminations Group
2006 2005 2006 2005 2006 2005 2006 2005 2006 2005
Total assets 4,220,395 3,736,930 1,084,078 969,872 214,766 186,995 (191,586 ) (153,749 ) 5,327,653 4,740,048
Total liabilities 3,921,219 3,586,428 980,389 872,995 204,675 178,855 (191,586 ) (153,749 ) 4,914,697 4,484,529
Net interest income 101,449 83,083 18,105 16,234 1,813 1,691 4 — 121,371 101,008
Non-interest income 7,061 8,313 19,564 14,356 931 1,429 (549 ) — 27,007 24,098
Including: net fee and
commission income 8,629 5,207 5,369 3,226 829 814 (504 ) — 14,323 9,247
Operating expenses and others (50,357 ) (46,375 ) (16,951 ) (11,831 ) (1,483 ) (1,778 ) 60 — (68,731 ) (59,984 )
Impairment (losses)/write
back on loans and advances (15,546 ) (15,345 ) 2,983 3,276 221 583 — — (12,342 ) (11,486 )
Profit before income tax 42,607 29,695 24,388 22,191 1,482 1,925 (540 ) — 67,937 53,811
Income tax expense (16,138 ) (18,911 ) (3,435 ) (3,022 ) (290 ) (320 ) 190 — (19,673 ) (22,253 )
Profit for the year 26,469 10,784 20,953 19,169 1,192 1,605 (350 ) — 48,264 31,558
Bank of China Annual Report 200636
The Chinese mainland continues to be the
Group’s most important geographic business
segment. At the end of 2006, the total assets of
this segment (before inter-company
eliminations) were RMB4,220.395 billion, an
increase of RMB483.465 billion (12.94%)
compared to the prior year-end, accounting for
76.47% of the Group’s total assets (before inter-
company eliminations), an increase of 0.11
percentage point compared to the prior year-
end. In 2006, this segment had a profit after
income tax (before inter-company eliminations)
of RMB26.469 billion, an increase of RMB15.685
billion (145.45%) compared to the prior year,
accounting for 54.45% of the Group’s profit after
income tax (before inter-company eliminations).
This segment has become increasingly
important to the Group as a source of revenue
and profit growth. The Group has an extensive
domestic branch network, providing traditional
retail and corporate banking services. The
Group also provides both RMB and foreign
currency banking services. With respect to the
latter, the Group continues to maintain a distinct
advantage over its competitors by virtue of its
unique position in the foreign currency
business.
The Hong Kong and Macau segment is also an
important one for the Group. At the end of 2006,
total assets of this segment (before inter-
company eliminations) were RMB1,084.078
billion, an increase of RMB114.206 billion
(11.78%) compared to the prior year-end,
accounting for 19.64% of the Group’s total
assets (before inter-company eliminations), a
decrease of 0.18 percentage point compared to
the prior year-end. In 2006, this segment had a
profit after income tax (before inter-company
eliminations) of RMB20.953 billion, an increase
of RMB1.784 billion (9.31%) compared to the
prior year, accounting for 43.10% of the Group’s
profit after income tax (before inter-company
eliminations). Apart from traditional commercial
banking activities, the Group also has
subsidiaries operating insurance, investment
banking and investment businesses in this
geographic area. These include BOCI, BOCG
Insurance and BOCG Investment. The continued
development of these businesses is essential to
the successful implementation of the Group’s
plan to develop a universal banking platform.
The Group has also established a substantial
overseas network, with operations in Europe,
North America, South America, Africa, and
other Asia-Pacific regions. At the end of 2006,
the total assets of these regions (before inter-
company eliminations) were RMB214.766
billion, an increase of RMB27.771 billion
(14.85%) compared to the prior year-end,
accounting for 3.89% of the Group’s total assets
(before inter-company eliminations). These
overseas operations had a profit after income
tax (before inter-company eliminations) of
RMB1.192 billion, accounting for 2.45% of the
Group’s profit after income tax (before inter-
company eliminations).
Please refer to the “Business Review” for
additional information on business segments.
Critical Accounting Estimatesand Assumptions
The application of the Group’s accounting
policies in the preparation of its consolidated
financial statements requires a number of
critical accounting estimates and assumptions.
These estimates and assumptions were made
based on past experience and reasonable
expectations of future events. Further, the basis
for making these estimates and judgments is
subject to a process of re-evaluation.
Management believes that the accounting
estimates and assumptions made properly
reflected the economic conditions in which the
Group was operating and the relevant
conditions specific to individual estimates and
judgments. The areas involving significant
Management Discussion and Analysis 37
estimates and assumptions include the
allowance for loan impairment losses and bad
debt write-offs, classification of investment
securities, measurement of the fair value of
financial assets and financial liabilities,
measurement of the fair value of investment
properties, measurement of retirement benefit
obligations, and the recognition of income tax
expense.
Please refer to Note II and IV to the Financial
Statements for more detailed information
related to the Group’s accounting policies and
accounting estimates.
Other Financial Information
The reconciliation of net assets and net profit of
the Group prepared in accordance with PRC
GAAP to that prepared in accordance with IFRS
is set forth in “Supplementary Information —
Financial Statements Prepared in Accordance
with PRC GAAP”.
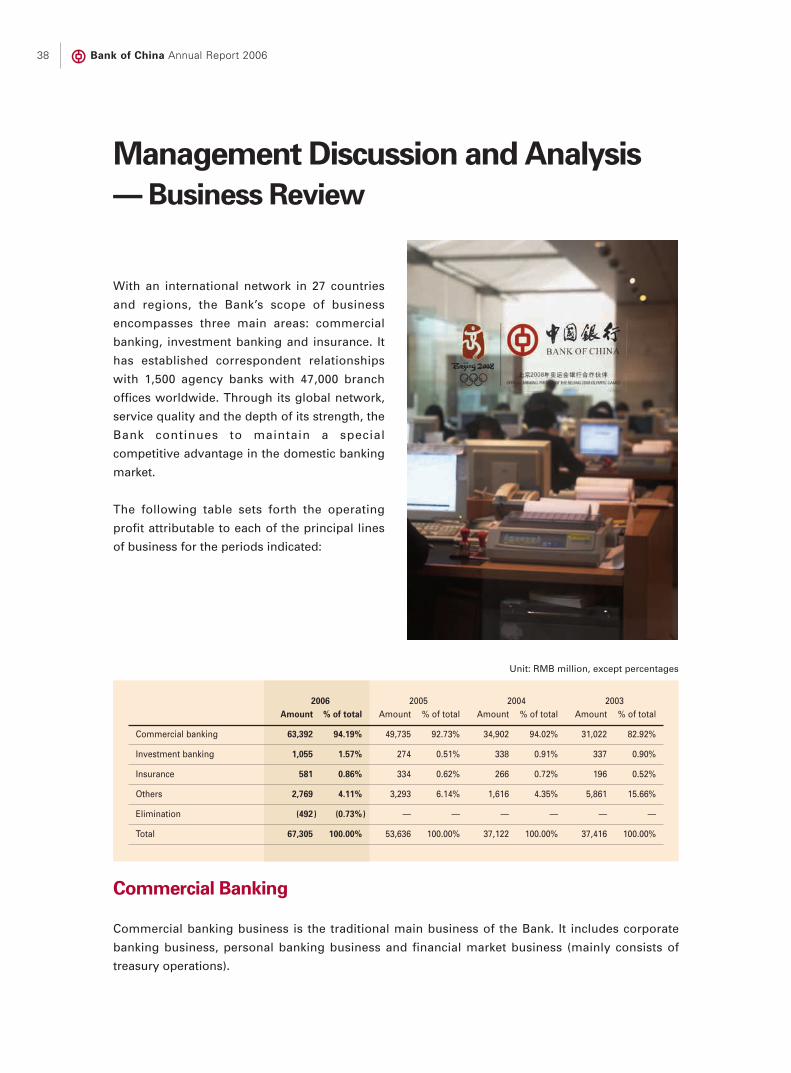
Management Discussion and Analysis— Business Review
Bank of China Annual Report 200638
With an international network in 27 countries
and regions, the Bank’s scope of business
encompasses three main areas: commercial
banking, investment banking and insurance. It
has established correspondent relationships
with 1,500 agency banks with 47,000 branch
offices worldwide. Through its global network,
service quality and the depth of its strength, the
Bank continues to maintain a special
competitive advantage in the domestic banking
market.
The following table sets forth the operating
profit attributable to each of the principal lines
of business for the periods indicated:
Unit: RMB million, except percentages
2006 2005 2004 2003Amount % of total Amount % of total Amount % of total Amount % of total
Commercial banking 63,392 94.19% 49,735 92.73% 34,902 94.02% 31,022 82.92%
Investment banking 1,055 1.57% 274 0.51% 338 0.91% 337 0.90%
Insurance 581 0.86% 334 0.62% 266 0.72% 196 0.52%
Others 2,769 4.11% 3,293 6.14% 1,616 4.35% 5,861 15.66%
Elimination (492) (0.73%) — — — — — —
Total 67,305 100.00% 53,636 100.00% 37,122 100.00% 37,416 100.00%
Commercial Banking
Commercial banking business is the traditional main business of the Bank. It includes corporate
banking business, personal banking business and financial market business (mainly consists of
treasury operations).
Management Discussion and Analysis 39
The following table sets forth the operating profit of the main commercial banking business lines for
the periods indicated:
Unit: RMB million, except percentages
2006 2005 2004 2003Amount % of total Amount % of total Amount % of total Amount % of total
Corporate banking business 32,278 50.92% 27,033 54.36% 17,215 49.32% 17,103 55.13%
Personal banking business 17,396 27.44% 14,117 28.38% 6,990 20.03% 4,050 13.06%
Treasury operations 13,718 21.64% 8,585 17.26% 10,697 30.65% 9,869 31.81%
Total 63,392 100.00% 49,735 100.00% 34,902 100.00% 31,022 100.00%
Corporate Banking Business
Business scope and strategic positioning
The Bank provides its corporate customers
(including state-owned enterprises, private
enterprises, foreign-investment enterprises,
financial institutions and government agencies)
with various financial products including loans,
bill discounting, trade finance, deposit-taking,
settlement, clearing, cash management services
as well as integrated financial solutions tailor-
made to meet customers’ needs. It is the Bank’s
strategy to target large and high quality
corporate customers and to cultivate a long-
term cooperative relationship with them. By the
end of 2006, the Bank has maintained credit
business relationships with more than 41,000
corporate customers and has more than 1,500
financial institution group customers.
Meanwhile, the Bank selectively explores
business opportunities with small and medium-
sized enterprises (“SME”) and has launched
new financial services for SME customers in 11
cities located in the “Yangtse River Delta” area.
Opportunities and challenges
In 2006, the effect of the macro-economic
control policy of the State gradually became
apparent as expansion in the production
capacity of some industries began to be
restrained. Competition between banks on
products, services and price became more
intensive. The Bank actively adjusted its
customer structure in accordance with the
macro-economic control policy of the State. The
Bank expanded its key customers group and
implemented differential relationship
management and service policies. Significant
achievements have been made in the marketing
and advancing of loans. Based on a global credit
line, the Bank improved its ability to serve its
customers at a global level by enhancing its
coordination with branches and subsidiaries
overseas. The Bank successfully operated a
number of projects together with BOCI, BOCG
Investment, BOCG Insurance, etc, realising
group synergies by tapping into their respective
resources. It enhanced the Bank’s abilities to
provide integrated services to its core
customers based on its universal banking
platform. The Bank advocated product
innovation and continuous improvement of its
product mix, so as to meet customers’
sophisticated demands for financial products
and to sharpen its competitive edge. The Bank
set up training plans for employees engaged in
the corporate banking business and established
working teams of professional customer
managers and product managers. Credit
monitoring of loans has been strengthened and
customer management system has been put
into application. The quality of the underlying
assets of corporate loans has continued to
improve.
Bank of China Annual Report 200640
Business operation
In 2006, the pre-tax profit (before inter-company eliminations) of the corporate banking business was
RMB32.3 billion, representing an increase of 19.4% from the previous year. The pre-tax ROA reached
1.87%.
Unit: RMB million
2006 2005 2004 2003
Net interest income 55,809 51,304 44,287 34,628
Non-interest income 10,915 9,564 7,188 5,973
Operating expenses and others (22,904) (21,127) (18,071) (14,142)
Impairment losses (11,542) (12,708) (16,189) (9,356)
Operating profit 32,278 27,033 17,215 17,103
Profit before income tax 32,278 27,033 17,215 17,103
Segment assets 1,795,152 1,655,351 1,608,781 1,578,313
Deposit business
With the rapid growth of the Chinese economy,
the Bank proactively adjusted its deposit
currency structure and has taken in more
corporate deposits denominated in Renminbi. At
the end of 2006, the balance of domestic
Renminbi-denominated corporate deposits was
RMB1,160.8 billion, representing an increase of
RMB165.4 billion or 16.6% compared to the prior
year-end. The Bank’s foreign currency deposits
kept growing as a result of its continuous efforts
to maintain its competitive advantage in the
foreign currency business. At the end of 2006, the
balance of domestic foreign currency corporate
deposits was USD16.72 billion, representing an
increase of USD344 million or 2.10% as
compared to the prior year-end, in which the
Bank continued to maintain its leading position in
the market. At the end of 2006, the balance of
foreign currency corporate deposits of overseas
operations totalled RMB237.4 billion,
representing an increase of RMB16.2 billion or
7.3% compared to the prior year-end.
Loan business
The Bank strengthened its marketing efforts to
key customers by optimizing the loan review
process and approval procedures and
implementing a flexible pricing authorization
system. The structure of the Bank’s loan by
customers, industries and loan tenure as well as
the asset quality have all continued to improve.
At the end of 2006, the outstanding balance of
domestic Renminbi-denominated corporate
loans was RMB1,245.1 billion, representing an
increase of RMB149 billion or 13.59% compared
to the prior year-end. This represented a market
share of 6.3% among the financial institutions in
China. The foreign exchange loan business is
principally affected by increases in foreign
exchange rates and on-lending loan repayment.
At the end of 2006, the outstanding balance of
domestic corporate loans denominated in
foreign currencies was USD38.374 billion,
representing a decrease of USD1.784 billion
compared to the prior year-end. The Bank
maintained the leading position in foreign
currency-denominated corporate loans with a
market share of 29.12% among PRC financial
institutions. At the end of 2006, the outstanding
balance of foreign currency-denominated
corporate loans of overseas operations was
RMB304.5 billion, representing an increase of
RMB12.4 billion or 4.2% compared to the prior
year-end.

Management Discussion and Analysis 41
Financial institutional banking business
The Bank’s financial institutional banking
business includes local and foreign currency
deposit taking, local and foreign currency
clearing, custody, fund distribution, asset
management services, insurance agency
business, securities and futures clearing, bond
distribution, clearing agency and foreign
currency note services for financial institutions
and correspondent banking services. The Bank
focused on expanding the scope of its
cooperation with other financial institutions
through customer referral, resource sharing and
joint development of new products.
The Bank also optimized the structure of its
deposit taking business by actively reducing the
amount of Renminbi-denominated negotiated
deposits which have a higher cost. By the end of
2006, the domestic branches of the Bank
received from financial institutions RMB
demand and time deposits of 134.1 billion,
representing a decrease of RMB7.3 billion
compared to the previous year. The balance of
foreign currency-denominated deposits from
financial institutions (including demand and
time deposits) was USD10 billion, representing
an increase of USD1.4 billion from the previous
year-end.
The Bank also conducts US Dollar, Euro and
Japanese Yen clearing services through its New
York, Frankfurt and Tokyo branches. These
branches, together with the Singapore branch,
are all tier one clearing banks in the local
markets. The Bank is committed to enhancing
the quality of its clearing services by improving
coordination between its domestic and overseas
operations. As a result, the clearing services for
US Dollar, Euro and Japanese Yen reached
historic record high. The New York branch
ranked 11th in terms of USD clearing volume
through CHIPS, Clearing House Interbank
Payment System, and the Tokyo branch was
ranked 10th in the Japanese Yen clearing
system.
International settlement and trade finance
International settlement and trade finance
business is one of the Bank’s traditional
strengths. It comprises trade settlement, non-
trade settlement, trade finance, guarantee,
factoring, etc. The Bank benefited from the
growth of the domestic economy and
international trade, and enjoyed rapid
development of its international settlement
services. The 2006 annual income of the
domestic branches and outlets from
international trade-related services was
RMB6.883 billion.
By the end of 2006, transaction volume for the
international settlement business (including
international trade settlement and non-trade
settlement) of the domestic branches and
outlets was USD588.045 billion, representing an
annual growth of 12.04%. For international trade
settlement business, the transaction volume
was USD492.848 billion, representing an annual
increase of 19.22%. According to data from the

Bank of China Annual Report 200642
International settlement services of the GroupUnit: USD million
2006 2005
Domestic branches and outlets Trade settlement 492,847.57 413,383.26
Non-trade settlement 95,197.77 111,474.64
Sub-total 588,045.34 524,857.90
Overseas operations Trade settlement andNon-trade settlement 343,358.05 283,233.31
Group Total 931,403.39 808,091.21
In 2006, despite the negative impact of
increasing foreign currency interest rates, the
Bank achieved steady growth in foreign-
currency denominated trade finance. For the
year 2006, the foreign currency-denominated
trade finance conducted by the domestic
branches of the Bank and outlets in the PRC was
USD27.089 billion, representing a 2.90%
increase compared to 2005. By taking advantage
of the rapidly growing domestic trade business,
the Bank saw a dramatic growth in its Renminbi-
denominated trade finance business, with the
total amount reaching RMB44.552 billion,
representing an increase of 166.65% compared
to 2005.
In relation to guarantee services, the Bank has
consolidated its leading position in this area by
actively pursuing business opportunities both
domestically and internationally. In 2006, the
transaction volume for foreign currency-
denominated guarantee business of the
domestic branches and outlets of the Bank in
the PRC reached USD12.700 billion with an
annual growth of 80.59%, and the transaction
volume for Renminbi-denominated guarantee
businesses in the PRC amounted to RMB73.234
billion with an annual growth of 90.97%.
The transaction volume for international
factoring from domestic branches and outlets of
the Bank in the PRC increased by 19.75% from
the previous year to USD5.645 billion in 2006.
The transaction volume for domestic factoring
State Administration of Foreign Exchange (or
SAFE), at the end of 2006, the Bank maintained
its leading position in international trade-related
services with a market share of 31.13%.
Management Discussion and Analysis 43
business reached RMB34.314 billion,
representing an increase of 163.62% from the
previous year. The Bank was elected a member
of the Executive Committee of the Factors Chain
International (“FCI”) which is the first time a
Chinese factor representative has been elected to
the FCI board. This further enhances the Bank’s
reputation in the international factoring
community.
The international settlement and trade finance
business of the Bank’s overseas operations
continued to maintain rapid growth. In 2006, the
transaction volume for overseas operations’
international settlement business was
USD343.358 billion, representing an increase of
21.23% from the previous year. The transaction
volume for trade finance business was
USD43.219 billion, representing a year-on-year
increase of 26.57%.
Other fee-based businesses for corporatecustomers
The Bank provides an extensive range of fee-
based products and services for corporate
customers. Apart from international settlement
services, the Bank also provides domestic
settlement, financial institutions services,
lending-related services and online banking
services.
Domestic settlement activities primarily include
bank drafts, promissory notes, checks, foreign
currency exchange, remittance and banker’s
acceptance. In 2006, the domestic branches and
outlets generated a total domestic settlement
income of RMB0.85 billion, representing an
increase of 31.0% from the previous year.
Lending-related services include on-lending
arrangements, syndicated loan arrangement,
entrusted loans, lending agent for policy banks
and corporate finance advisory work. In 2006,
the Bank participated in a number of syndicated
loans either as lead arranger or participant. In
2006, the fee income of the domestic branches
and outlets in the PRC generated from their
lending-related services was RMB0.426 billion,
increasing by 43.92% over the previous year.
Based on its corporate internet banking
platform, the Bank provides its corporate
customers with a wide range of cash
management services, including account
services, Renminbi payment and collection
services, settlement and clearing services,
centralized receivable management and liquidity
management, etc. The Bank also provides group
companies with foreign exchange fund
sweeping and management services. In 2006,
the total transaction volume for corporate
internet banking exceeded RMB10 trillion, and
the scope of the service was extended to nine
overseas branches. This further improved the
Bank’s ability to provide worldwide financial
support to Chinese enterprises with a global
business coverage.
Business innovation
In 2006, the Bank formulated the “Guidelines on
Corporate Banking Product Innovation and
Management” , which developed an
information-sharing platform for the Bank’s
products. The Bank also compiled the
“Handbook of Corporate Banking Products”,
which helped to standardize its corporate
banking products. The key innovative products
developed by the Bank include revolving loans,
inventory-linked acceptance for dealer
financing, purchase of account receivables,
asset-backed loans, equity trust and foreign
currency-denominated entrusted loans. The
corporate finance advisory business became a
new focus of growth and domestic and outlets
branches in the PRC have begun providing such
services to corporate customers. The Bank
cooperated with strategic investors in a number
of structured financing projects, thereby

Bank of China Annual Report 200644
improving its ability to serve the needs of
corporate clients with high-end financial
services and products. In 2006, the Bank started
to provide third party cash custody service to
securities companies, which consolidated the
Bank’s status as a major bank services provider
in the securities settlement market.
The Bank established and strengthened its trade
financing brand in the market by promoting the
“Da” (Chinese character which means “Access”)
series products, including “Export Quanyida”,
“Import Huilida”, “Import Baofuda”, “Rongfuda”
etc. The Bank was proactive in developing
supply chain finance products. It was the first
bank in the PRC to offer domestic supply chain
finance solutions to customers. It was also the
first bank in the world to introduce the “Back-
Flow International Factoring” product that
solves the technical problem caused by agents
in international factoring. The product has been
widely acclaimed within the factoring
community.
The Bank has successfully acquired SALE in
2006, which further expanded its corporate
banking business platform.
Outlook
The financial industry is striding into a new
competitive era in which the participants will
become more diversified with competition
coming from all directions. In 2007, the Bank
will continue to improve its service to
customers. Some major measures include:
improving the service model for key customers;
optimizing business procedures in the corporate
banking business; strengthening coordination
and cross-selling among the head office and the
branches in both domestic and overseas
markets and across different business lines;
encouraging product innovation and improving
the service model for small business. These
efforts will help the Bank lay down a solid
foundation for a sustainable growth in the
future.
Personal Banking Business
Annual international and domestic awards
received in the personal banking business:
• Hexun.com:
2006 Best Personal Residential Mortgage
Loan Service ( “Ideal Home”);
2006 Best Marketing Practice ( “The Great
Wall ChinaRen Card”);
2006 Maximum Investment Value, RMB
Wealth Management Products
• VISA:
2006 Best Olympic Partner;
2006 Best Acquiring Bank;
• MasterCard:
2006 Best Contribution of the Year (PRC);
2006 Best Acquiring Bank of the Year;
2006 Best International Card of the Year
(Great Wall International MasterCard in
GBP);
2006 Best Branch Sales of the Year (Bank
of China Jiangsu Branch);
• China Union Pay:
2006 Advance Award for Best Execution of
CUP Business Regulations;
2006 Excellent Achievements in CUP
Standard Credit Card Issuance;
2006 Extraordinary Contribution Award for
CUP Cards Acquiring;

Management Discussion and Analysis 45
Business scope and strategic positioning
The Bank provides a broad range of personal
banking products and services, including
savings deposit, personal loans, payment and
settlement, bank cards and wealth management
services.
Personal banking business is one of the Bank
strategic priorities. It strives to accelerate the
development of its personal banking business in
order to improve the business and income
structure and to increase revenues while
reducing risk. The Bank provides customers
with standardized quality products and services
as well as customized products and services to
affluent clients.
At the end of 2006, the Bank had approximately
0.14 billion retail customers, 0.183 billion
Renminbi-denominated deposit accounts and 35
million foreign currency-denominated deposit
accounts.
Opportunities and challenges
In 2006, a series of macro-economic adjustment
measures implemented by the central
government had a great impact on the personal
residential loans market. Deposits of residents
were partially diverted away due to the buoyant
and fast-growing capital market. The deposits
were subject to greater fluctuation. The
continuous appreciation of the Renminbi
reduced the desire of residents to keep foreign
currencies and settlement of foreign exchange
transactions by individuals increased. Interest
rate hikes by the PBOC contributed to the
increase in Renminbi-denominated deposits.
However, consumer loan borrowers were forced
to pay higher interest as a consequence and
therefore the amount of early loan repayments
also increased.
The Bank proactively makes adjustment in
response to changes in the market environment.
The Bank built up specialized marketing teams
for personal loans and implemented a “Direct
Sale Model” system. The Bank also continued to
improve its centralized personal loan approval
mechanism by upgrading the system and
optimizing the approval process in order to
improve efficiency in reviewing and approving
facilities. With these innovations, the Bank
greatly improved the competitiveness of its
personal lending business. The Bank also re-
adjusted the renovation of its operating
network, so as to implement the separation of
various functions, speed up the business
process, relocate services and establish a new
KPI system, which aims at increasing cross-
selling and customer wallet share. The Bank
Bank of China Annual Report 200646
strengthened product and service innovation,
provided a series of customized services to
affluent customers, and developed and
consolidated the mid-level customer base to
effectively maintain sustainable growth for all
related business.
Business operation
In 2006, the pre-tax profit (before inter-company
eliminations) of the personal banking business
was RMB17.4 billion, representing an increase of
23.2% over the prior year with a pre-tax ROA of
2.7%.
Unit: RMB million
2006 2005 2004 2003
Net interest income 36,414 32,302 30,148 26,469
Non-interest income 8,897 6,176 5,088 4,507
Operating expenses and others (27,121) (25,508) (20,592) (17,874)
Impaired loans (losses)/write-back (794) 1,147 (7,654) (9,052)
Operating profit 17,396 14,117 6,990 4,050
Profit before income tax 17,396 14,117 6,990 4,050
Segment assets 687,553 599,263 556,066 453,665
Savings deposits
At the end of 2006, the balance of domestic
savings deposits denominated in Renminbi was
1,602.755 billion, representing an increase of
RMB186.429 billion compared to the prior year-
end. The Bank’s market share among all financial
institutions was 9.92%. The balance of domestic
foreign exchange deposits was USD30.465 billion,
representing a decrease of USD2.044 billion from
the previous year-end. The balance of overseas
foreign currency deposits was RMB575.851 billion,
representing an increase of RMB32.209 billion
compared to the previous year-end.
Personal loans
At the end of 2006, the balance of domestic
Renminbi-denominated personal loans was
RMB443.6 billion, representing an increase of
RMB63.6 billion from the previous year, amongst
which the outstanding balance of residential
loans was RMB337.8 billion, representing an
increase of RMB51 billion from the previous year.
The balance of overseas personal loans was
RMB139.1 billion, representing a decrease of
RMB3.9 billion from the previous year.
Personal fee-based business
Wealth management
In 2006, the Bank strived to develop its personal
wealth management business by eliciting
synergies between its domestic and overseas
branches, which further enhanced customer
awareness of the “BOC Wealth Management”
brand.
The Bank continued to build specialized service
facilities in 2006. It established 97 new wealth
management centers, all built according to a
uniform standard within the year, bringing the
total number of wealth management centers to
297. The Bank continued to improve its services
provided to its wealth management customers
and the ability to expand such wealth
management customer base. It increased the
number of wealth management customers to
over 700,000, representing an increase of
200,000 from the previous year.
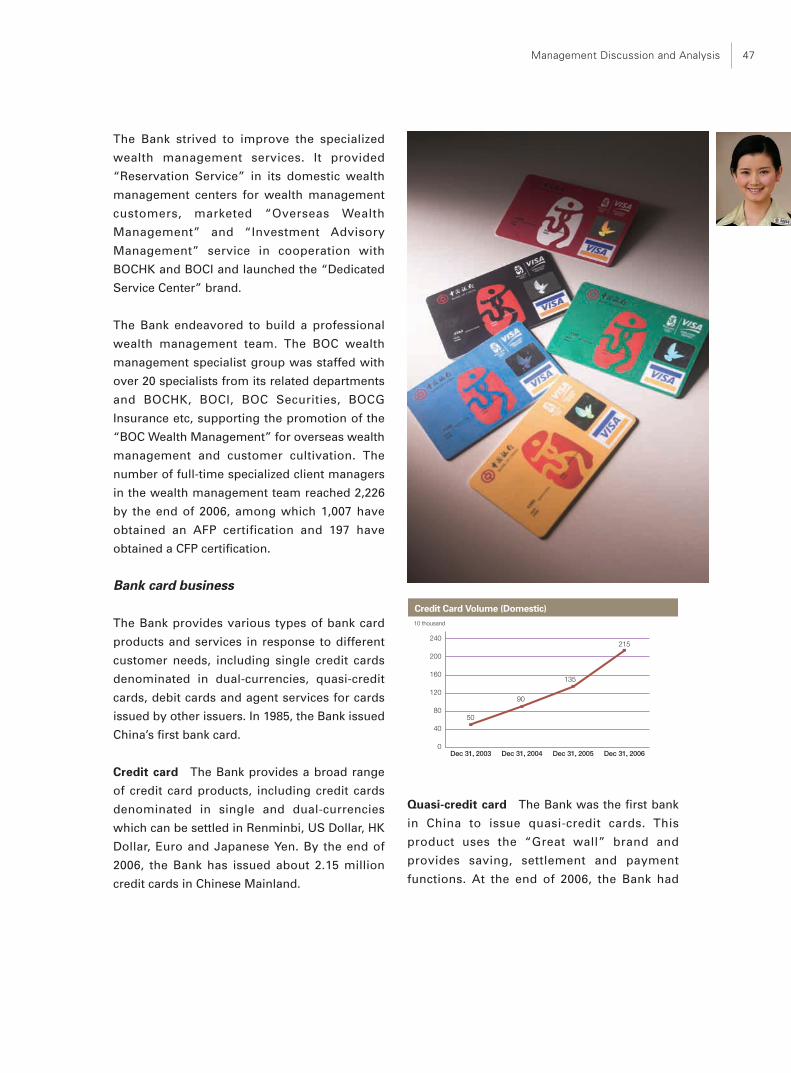
Management Discussion and Analysis 47
The Bank strived to improve the specialized
wealth management services. It provided
“Reservation Service” in its domestic wealth
management centers for wealth management
customers, marketed “Overseas Wealth
Management” and “Investment Advisory
Management” service in cooperation with
BOCHK and BOCI and launched the “Dedicated
Service Center” brand.
The Bank endeavored to build a professional
wealth management team. The BOC wealth
management specialist group was staffed with
over 20 specialists from its related departments
and BOCHK, BOCI, BOC Securities, BOCG
Insurance etc, supporting the promotion of the
“BOC Wealth Management” for overseas wealth
management and customer cultivation. The
number of full-time specialized client managers
in the wealth management team reached 2,226
by the end of 2006, among which 1,007 have
obtained an AFP certification and 197 have
obtained a CFP certification.
Bank card business
The Bank provides various types of bank card
products and services in response to different
customer needs, including single credit cards
denominated in dual-currencies, quasi-credit
cards, debit cards and agent services for cards
issued by other issuers. In 1985, the Bank issued
China’s first bank card.
Credit card The Bank provides a broad range
of credit card products, including credit cards
denominated in single and dual-currencies
which can be settled in Renminbi, US Dollar, HK
Dollar, Euro and Japanese Yen. By the end of
2006, the Bank has issued about 2.15 million
credit cards in Chinese Mainland.
Credit Card Volume (Domestic)
Dec 31, 2003 Dec 31, 2004 Dec 31, 2005 Dec 31, 20060
40
80
120
160
200
240
10 thousand
50
90
135
215
Quasi-credit card The Bank was the first bank
in China to issue quasi-credit cards. This
product uses the “Great wall” brand and
provides saving, settlement and payment
functions. At the end of 2006, the Bank had

Bank of China Annual Report 200648
Business innovation
The Bank focused on the credit requirements of
its customers in the areas of consumer payment
and investment. It launched some competitive
direct customer service products, including
“Easy Mortgage” for first-hand residential
mortgage loan, “Safe Mortgage” for second-
hand residential mortgage loan, fixed interest
rate mortgage, “Fast Auto Loan” under the
umbrella of the “Ideal Home” brand, etc.
Personal revolving loans were launched in some
developed regions. This product has grown
rapidly and brought in new revenue.
The Bank pays great attention to bank card
innovation. In 2006, it promoted various credit
card and co-brand products, such as the BOC
City Card, the Great Wall Commercial Card, the
BOC Jiaotong University Affinity Card, the BOC
Peking University Co-Brand Card, the BOC
Golden Eagle Co-Brand Card, the BOC
(Shanghai) SOGO JCB Co-Brand Card and the
BOC PKU Affinity Card. In addition, the Bank
promoted a lot of quasi-credit card products,
including the Great Wall Ruziniu Co-Brand Card,
the Great Wall PICC Co-Brand Card, the Great
Wall Jianye Co-Brand Card, the Great Wall
Jiashi Co-Brand Card, the Great Wall Zhonghai
Co-Brand Card, the Great Wall Zhongsheng Co-
Brand Card etc. The Bank emphasized the
importance of building relationships with
customers of great development potential. It has
strategically launched “Great Wall ChinaRen
Alumni Card”, “Great Wall Blooming Season
Card” etc.
The Bank emphatically developed new
personalized investment and wealth
management products. It has made available
investment products which are linked to
overseas stock markets, Renminbi-denominated
derivatives, Renminbi-denominated products —
issued 7.21 million quasi-credit cards in China.
The Bank is the largest quasi-credit card issuer
in China in terms of issued card volume and has
a market share of over 37%.
Debit card The Bank provides debit card
products which link directly to client bank
accounts. Cardholders may engage in trading in
foreign exchange, bullion, fund, treasury bonds
and other securities, and may also access the
Bank’s telephone banking and internet banking
services through their debit cards. By the end of
2006, the Bank had issued 98.6 million debit
cards in Chinese Mainland.
BOC RMB Card Sale Volume (Domestic)
2003 2004 2005 20060
400
800
1,200
1,600
RMB100 million
409
684
976
1,478
Merchant Acquiring Services The Bank
provides settlement services to merchants by
processing credit card, quasi-credit card and
debit card transactions. The Bank has one of the
largest merchant acquiring networks in China.
By the end of 2006, the Bank had 190,000
merchants, realizing foreign card acquiring
transactions of RMB22.3 billion.
Foreign Card Transaction Volume Acquired by BOC (Domestic)
2003 2004 2005 20060
40
80
120
160
200
240
RMB100 million
103
156
191
223
Management Discussion and Analysis 49
“Market Game” and a QDII product “BOC USD
Enhanced Cash Management”, and jointly
launched derivative products denominated in
foreign currencies linked to stock markets in
cooperation with its strategic investors.
As the banking partner of the 2008 Beijing
Olympic Games, the Bank launched the Olympic
Growth Deposit Passbook and Olympic
Courtesy Deposit Certificate, aligned with the
Olympic brand.
The Bank actively developed its overseas retail
market in 2006. Five of its overseas branches
including Singapore and Seoul, piloted the
Renminbi-denominated cash exchange and
deposit business. The Bank increased the choice
of foreign currencies for Renminbi-denominated
remittance, and issued debit cards at its
branches in Paris and London. BOCHK marketed
options, off-shore deposits and acted as the
agent for precious metal trading services
through its domestic branches and outlets. The
London branch launched banking services for
Chinese students studying in the UK in
cooperation with RBS Group. The New York
branch cooperated with Citizens Bank, a
subsidiary of RBS Group in the US, on the
provision of international remittance services to
the PRC. It also launched “Family Remittance”
with BTS in the US. It also started the selling of
Korean Won to the Chinese citizens in the PRC.
Outlook
In 2007, the Bank will focus its personal banking
business on a client-oriented tenet and strive to
improve business operations, perfect its service
model, optimize business processes, develop
and cultivate affluent customers, strengthen
cross-selling and internal coordination, promote
product innovation, strengthen marketing and
increase the core competitiveness of the
services delivered by the outlets. The Bank will
accelerate innovation in personal banking for
quick development and expansion of its private
banking business and wealth management
through extending its cooperation with overseas
strategic investors on products, services, human
resources etc. The human resources strategic
plan for the personal banking business will be
drawn up to accelerate the forming of
specialized teams and to lay down a solid
foundation in support of sustainable
development.
Financial Market Business
Business scope and strategic positioning
The financial market business of the Bank
includes foreign exchange and precious metal
transactions, bond transactions, short-term
financing notes and bills, local and foreign-
currency bond investments, financial derivatives
and commodity futures, local and foreign
currency wealth management and asset
management, distribution and custody of funds
etc. The Bank conducts its treasury operations
primarily through five trading centers located in
Beijing, Shanghai, Hong Kong, London and New
York. These trading centers manage positions
and quotations in relays, which enables the
Bank to conduct its treasury operations on a 24-
hour basis.

Bank of China Annual Report 200650
The Bank’s development strategies for its
financial market business are: giving equal
emphasis on local and foreign currency-
denominated business, carrying out treasury
transactions on self-owned accounts and
agency accounts and providing excellent
marketing and customer service, so as to
strengthen its leading position in the domestic
financial market; maintaining sustainable
product innovation and risk management,
cultivating professional human resources;
achieving a continual critical competitiveness;
realizing the integration of global trading and
investment; achieving the excellence of
advanced international banks in terms of both
business volume and profitability; and gradually
building up a good brand image for the financial
market business.
Opportunities and challenges
In 2006, due to the uncertain expectation on the
FED’s interest policy, there were relatively large
fluctuations in the interest rate market. The yield
of the US 10-year treasury bond experienced a
large decrease after its earlier large increase.
Major currencies maintained movements within
their normal range but with declining volatility,
and the market environment was not favorable
for foreign currency-denominated treasury
operations.
Meanwhile, due to tight monetary policies, the
overall price of the domestic bond market
witnessed a downturn. The overall yield of the
Renminbi-denominated bond market was in an
upward trend. The yield on Renminbi-
denominated bonds increased significantly
compared to that of the beginning of the year.
The yield curve flattened quite obviously.
Treasury operations denominated in Renminbi
also faced an unfavorable market environment.
However, the stock market in 2006 stayed
strong, and sales of fund products were on an
ascending trend. The funds distributed by the
Bank on a commission basis were primarily
equity funds with the highest commissions, and
the market environment of the fund business
was much better compared to that of 2005. The
commission income of the Bank set a historic
record.
By deepening research and analysis of the
market and strictly following investment
guidelines, the Bank managed to capture profit
opportunities despite unfavorable market
conditions, and achieved sound returns.
Business operations
In 2006, the overall pre-tax profit (before inter-
company eliminations) of the treasury
operations increased to RMB13.7 billion for the
Group, representing an increase of 59.8%
compared to last year. The average pre-tax ROA
was 0.5%.
Unit: RMB million
2006 2005 2004 2003
Net interest income 29,860 18,053 13,585 15,324
Non-interest income (7,324) (2,363) 5,680 2,350
Operating expenses and others (8,818) (7,105) (8,568) (7,805)
Operating profit 13,718 8,585 10,697 9,869
Profit before income tax 13,718 8,585 10,697 9,869
Segment assets 2,725,362 2,397,839 2,019,737 1,860,575
Management Discussion and Analysis 51
Local and foreign currency investments
Local and foreign currency denominated
investments of the Bank mainly include
investments denominated both in local currency
and foreign currencies.
Foreign currency-denominated investments The
foreign currency-denominated investments of the
Bank primarily include investments in government
bonds, institution bonds, corporate bonds, bank
bonds, emerging market bonds, mortgage-backed
securities (MBS), asset-backed securities (ABS),
collateralized debt obligation (CDO) and lending at
money market. The Bank normally invests in
foreign currency-denominated bonds with high
credit ratings, among which 74.9% are above Aaa
grade. The Bank also conducts forward, option,
swap and other derivative transactions to hedge
the risk or to achieve the objectives of
investments. In 2006, the Bank invested proceeds
from the IPO in assets that have both high liquidity
and high return, such as MBS, corporate bonds
with high ratings and long-term investment
portfolios which are flexible and conducive to the
enhancement of overall investment returns. In
addition, the Bank disposed of some bonds with
low returns. It decreased the proportion of held-to-
maturity investments, and thus enhanced liquidity
and improved the valuation of the account. The
duration of foreign currency-denominated bond
investments decreased sharply in the second half
of 2006 to 2.039 at the end of the year.
Local currency-denominated investments The
local currency-denominated investments of the
Bank primarily include investments in Chinese
treasury bonds, financial bonds issued by
Chinese policy banks, bills issued by PBOC and
bonds issued by Chinese commercial banks. In
2006, the yield curve of the domestic bond
market presented distinctly flattening trend. At
the end of 2006, the total volume of the local
currency-denominated investment portfolio
exceeded RMB400 billion. Modified duration
decreased to 2.16 and interest rate risk was
effectively reduced. Following a comprehensive
consideration of risk and return, the Bank held
more bills of PBOC and policy related financial
bonds, attaining greater stability and increasing
income.
Proprietary transactions
Proprietary transactions of the Bank include
foreign currency-denominated proprietary
transactions and local currency-denominated
proprietary transactions.
Foreign currency-denominated proprietary
transactions The Bank efficiently performed
the role of market-maker in inter-bank foreign
exchange markets with the largest transaction
volumes, and actively provided liquidity for the
market. During 2006, the number of transactions
in the inter-bank foreign exchange market
reached 17,210, representing a significant
increase of 70 times compared to the prior year.
The Bank actively participated in domestic and
overseas bullion transactions. While keeping its
profit margin, it continued to maintain the
leading position in the domestic market and
expanded its influence in the international
market.
Confronted with an unfavorable market
environment, the Bank actively explored the
volatility of various currencies and made a
flexible use of different trading platforms and
instruments so as to maintain the leading
position in the market. The Bank also actively
participated in bullion and other precious metal
transactions in the international market. With
the trade volume of bullion reaching 600 tons,
the Bank further expanded its influence in the
international market. As to the quotation of

Bank of China Annual Report 200652
derivatives, the Bank kept its traditional
advantages in the quotation of interest rate
swap denominated in US dollar.
Development Trends of the Financial Market Business
Trading Volume 2006 2005
Trading Volume of settlement & purchaseof CNY (USD billion) 347 308
Bullion Trading Volume of Shanghai Gold Exchange (Ton) 240 160
Trading Volume of FX Option (USD billion) 44 35.2
Renminbi-denominated proprietary
transactions Local currency-denominated
proprietary transaction of the Bank increased
greatly as a result of its accurate research and
judgment made on the market, active market
participation and timely operation. In 2006, the
volume of proprietary bond trading transactions
reached RMB730.2 billion, representing a year-
on-year increase of 38%. The number of bond
trading transactions was 8,965, representing a
year-on-year increase of 26%, securing the
Bank’s place as the first in the market.
Renminbi-denominated interest rate swaps are
one of the new businesses developed by PBOC
in 2006. In 2006, the market share of the Bank in
the Renminbi-denominated swap market was
ranked second in the market. In 2006, the Bank
maintained its leading position in domestic
bullion transactions. In 2006, its market share in
the Shanghai Gold Exchange, the only gold
exchange in Chinese Mainland, increased from
33.86% in 2005 to 36.79% in 2006 with the
volume of transactions being the largest at
Shanghai Gold Exchange.
Treasury operations on behalf of customersand bond market operations
Treasury operations on behalf of customers
includes corporate and private business.
Corporate business on behalf of customers
mainly includes foreign exchange fund
management (mainly to preserve values of the
debt), “Four-Season Forwarding”, “Credit
Garden” and structured wealth management
products denominated in Renminbi. The
development model and product design of
treasury operations on behalf of customers has
entered into a new phase in 2006. All businesses
reported sound growth. The volume of debt
value-preservation transactions made on behalf
of customers reached USD3 bill ion,
representing the largest market share in the
market. In addition to active marketing, the Bank
strengthened innovation and strived to create
new profit-growing areas in agency businesses.
The “Credit Garden” developed rapidly, with
transactions volumes reaching USD30 million.
Foreign exchange wealth management in private
business on behalf of customers mainly includes
“Huijubao”, “Liangdebao”, “Qiquanbao”,
“Personal Foreign Exchange Option”, “Spring -
Summer - Autumn - Winter”, etc. It is a traditional
business of the Bank and developed steadily in
2006. Amongst the products, the wealth
management product “Game” had an interest-
bearing fund of RMB5.4 billion.
The Bank provided itself and corporate
customers with financing services by issuing
Management Discussion and Analysis 53
local and foreign currency-denominated bonds
and arranging syndicated loans in international
and domestic markets. In 2006, the Bank played
an active role in issuing and underwriting bills
in the domestic inter-bank bond market. In 2006,
the Bank issued 22 short-term bonds with a
transaction volume of RMB16.6 billion, and
participated in the underwriting of 197 short-
term bonds with a total underwriting volume of
RMB51.04 billion.
Distribution and custody of fund
In 2006, on the basis of maintaining custodian
customers, the Bank further expanded the scale
of its custodian assets. It has made a
breakthrough in the custody of annuity plans,
financial institutions’ asset securitization funds,
which further strengthened and improved its
market position and the image of its assets
custody business. At the end of 2006, total net
custodian assets of the Bank exceeded RMB300
billion, reaching RMB342.8 billion and doubling
the amount at the end of 2005.
Business innovation
The development of new products and
quotation ability is a major competitive
advantage of the Bank. Resulting from the
continuation of active international and
domestic market activities, the performance of
the Bank’s settlement and purchase of foreign
exchange, and local and foreign currency-
denominated wealth management were
excellent. In 2006, by fully utilizing its traditional
advantages in foreign exchange, the Bank
applied its experience in the foreign exchange
business to its Renminbi-denominated business.
The Bank designed standard business models
for entrusted wealth management and created
the product line concepts of “BOC Value-added
Wealth Management”. It developed a series of
new products, including asset-backed wealth
management plan, trust management, bill
management, and mini-bonds. While facing
fierce market competition, the Bank successfully
designed and launched a foreign exchange
wealth management product “Credit Garden”
and a Renminbi-denominated wealth
management product “Game”, and took the
lead in launching a structured wealth
management product connected with stock
called “Red chip leverage”, and wealth
management product linked to crude oil called
“Tong Tong Jin” in the domestic market, which
provided relatively high investment returns for
investors. During 2006, Hexun.com, a domestic
professional finance website, awarded the Bank
the “Best RMB Wealth Management Investment
Product (RMB)” in recognition of its strength in
Renminbi-denominated wealth management
products. The personal wealth management
product “Huijubao” has been awarded the
“Best Domestic Wealth Management Brand” by
Hexun.com for two consecutive years. In the
year, the Bank was selected as one of the 16
quotation banks of SHIBOR, and successfully

Bank of China Annual Report 200654
conducted its first one-year placement
transaction.
Outlook
In 2007, the macro-economic environment and
regulatory policies are expected to provide
ample room for development, while posing new
challenges to the Bank’s financial market
business. The Bank expects to face more intense
market competition in the financial market
business in light of the advantages in
technology, experience and marketing
measures foreign banks will bring into the
market. The Bank will further expand its
financial market business, take business
opportunities in the Renminbi-denominated
derivative market, strengthen local and foreign
currency-denominated asset portfolio
management, take full advantage of its
cooperation with strategic investors, follow the
development trends of international banks and
its comparative competitive advantages, so as
to maintain the Bank’s leading position in
competition with other banks.
Operations of BOCHK
The Group conducts commercial banking
business in Hong Kong through its subsidiary
BOCHK. As a licensed bank in Hong Kong and
with 65.87% of its shares owned by the Group,
BOCHK is the Bank’s most significant overseas
business entity in terms of assets and profit
contributions. As at 31 December 2006, BOCHK
Group’s total assets reached RMB926.082
billion. At the end of 2006, BOCHK Group
contributed a net profit of RMB9.448 billion to
the Bank. BOCHK Holdings, which was the
controlling shareholder of BOCHK, was listed on
the Hong Kong Stock Exchange main board in
July 2002.
BOCHK is one of the three note-issuing banks in
Hong Kong. Through its extensive service
network, BOCHK offers comprehensive financial
products and services to its retail and corporate
customers. As of the end of 2006, BOCHK had
an aggregate of 302 branches, of which 287
branches are located in Hong Kong, 14 in
Chinese Mainland and 1 overseas, together with
445 ATMs in Hong Kong. In the first half of 2006,
BOCHK Holdings further extended its business
lines and diversified its income resources by
acquiring 51% stake in BOCG Life.
In 2006, BOCHK mapped out its strategic focus
for the next five years: strengthening its position
as one of the leading banks in Hong Kong;
enhancing its capabilities in product
manufacturing and distributing; building a

Management Discussion and Analysis 55
stronger presence in Chinese Mainland;
exploring opportunities for regional expansion;
and promoting corporate value and core
advantage.
Business Performance
In 2006, benefiting from the vibrant economic
growth and the active financial markets in Hong
Kong, BOCHK delivered the highest operating
profit before loan impairment allowances and
profit attributable to shareholders since its
restructuring in 2001, before taking into account
the impact of foreign exchange retranslation.
Net interest income and net interest margins
increased substantially. Both the net interest
income and the net interest yield experienced
strong growth, with outstanding performance in
both the investment and insurance businesses.
Proportion of BOCHK Group’s profit after tax to
that of the Group
Profit after tax
RMB million
2004 2005 20060
2,000
4,000
6,000
8,000
10,000
12,000
14,000
16,000
0
10
20
30
40
50
60
70
80
%
Profit after tax Proportion to the Group’s profit after tax
In 2006, BOCHK actively developed its deposit
taking business while controlling funding costs.
To meet the various demands of its customers,
BOCHK carried out specific product promotion,
resulting in an increase in taking of low-interest
and interest-free deposits as well as a more
optimized deposit structure. With an emphasis
on risk management and efficiency
enhancement, BOCHK set up operational
models for SME development. It streamlined
business flows and improved customer service
efficiency, and launched a series of competitive
and diversified products in the year which
doubled the loan balance for SMEs. BOCHK
remained the leader in the syndication loan
markets of Chinese Mainland, Hong Kong and
Macau, with a market share of 9.3%.
BOCHK was appointed by the PBOC in 2003 as
the clearing bank for Renminbi-denominated
businesses in Hong Kong and was reappointed
in January 2007. BOCHK has remained the
leader in Renminbi-denominated businesses in
Hong Kong since the Renminbi-related services
were initially launched in February 2004. BOCHK
has continued to achieve satisfactory results in
this area. In 2006, Renminbi-denominated
deposits in Hong Kong has increased by 1.8 %,
and Renminbi-denominated credit card issuance
has increased by 22.7%. A personal Renminbi-
denominated cheque service was launched in
March 2006 to provide more convenience to
customers.
Business Cooperation andComplementary Operationsbetween BOC and BOCHK
As one of the leading banks in Hong Kong,
BOCHK will continue to consolidate its strength
in the market in Hong Kong and leverage its
strong base and platform to grow its businesses
both in Chinese Mainland and other regions.
BOC and BOCHK together will seek to increase
their combined market share in the banking
market in Chinese Mainland. The Bank believes
the business strategies of BOCHK are
complimentary and consistent with those of the
Bank.
BOCHK’s extensive network and branches in
Hong Kong provide efficient services for
customers from Chinese Mainland. The Bank’s
network of over 11,000 branches throughout
Chinese Mainland offers convenient services for

Bank of China Annual Report 200656
the Hong Kong customers of BOCHK. The
cooperation and complement between BOCHK
and the Bank in the areas of corporate banking,
personal banking and financial market business
have enhanced their combined market position
in Chinese Mainland.
BOCHK has a network of 14 branches and sub-
branches operating in Chinese Mainland, mainly
spread along the Yangtse River Delta and Pearl
River Delta regions, as well as several major
cities along the coastline. Leveraging the
competitive advantage, these domestic branches
are able to offer cross-border banking services to
customers both from Hong Kong and Chinese
Mainland.
BOCHK announced in early 2007 the adoption of
a dualistic approach to its China business
model. Nanyang, a wholly-owned subsidiary of
BOCHK, is applying to the regulatory authorities
of Chinese Mainland for registration as a locally-
incorporated bank and will move on full steam
to develop full-scale banking services in Chinese
Mainland with emphasis on retail banking
services. BOCHK will continue to operate its
branches in Chinese Mainland as foreign bank
focusing on corporate banking and foreign
exchange business. Chiyu Banking Corporation
Limited, another subsidiary of BOCHK, will also
maintain its status as a foreign subsidiary and
continue its existing operations in China.
Outlook
In 2007, in terms of strategic business
development, BOCHK will continue to increase
its market share in traditional segments such as
corporate banking and retail banking. It will also
further strengthen and expand its business
platform, enhance product innovation and
manufacturing capabilities and take advantage
of the synergies created through collaboration
with the Bank which generate sustainable long-
term returns on equity and maximize value for
shareholders.
(For further details of BOCHK’s business results
and related information, please refer to its
annual report for the same period.)
Investment Banking Business
BOC International Holdings Limited (BOCI),
which specializes in investment banking, is a
wholly owned subsidiary of the Bank. BOCI was
founded in Hong Kong on 10 July 1998. It is a
PRC-based world-class investment bank with a
global presence in major financial centers,
including New York, London, Hong Kong and
Singapore. It has a well-established sales and
distribution network in major cities along the
coastal regions and inland regions of China,
covering Beijing, Shanghai, Guangzhou and
Chongqing. With a team of financial experts, a
broad institutional and retail sales network and
global infrastructure, BOCI is well-positioned to
offer its clients a wide range of investment
banking products and services, including
corporate financing, mergers and acquisitions,
financial advisory, sales and trading of equity
and fixed income products, derivative and
structured products, asset management and
private equity investments.
BOCI adopted its strategy of taking root in
China, making the world its stage and offering
the best cross-border services in 2006. It
emphasized strongly on corporate governance
and focused on its sustainable traditional
businesses while promoting business
innovation. It is committed to shaping a global
investment banking culture of “Customer-
Oriented, Integrity, Teamwork, Initiative, and
Innovation” in an effort to achieve continuous
enhancements in its core competences.

Management Discussion and Analysis 57
The profit after tax of BOCI was HKD1.13 billion
in 2006, representing a year-on-year growth of
280%.
Underwriting and financial advisory BOCI
arranged 7 initial public offerings (IPO) in 2006
including the H share IPO of the Bank, which
came out among the top in the league table and
gained a market share of 12.2% in terms of deal
value.
Domestic businesses BOCI leveraged its
expertise in China to provide extensive
investment banking services to its Chinese
clients. In particular, BOCI completed a number
of private placements as well as merger and
acquisition projects for financial institutions and
leading corporations in China in 2006.
Securities brokerage BOCI achieved
substantial growth in its securities brokerage
businesses, both for the primary and secondary
markets in 2006. In particular, its market share in
the Hong Kong retail stock brokerage market
increased 20% compared to last year.
Asset management BOCI, operating via its
subsidiary BOCI-Prudential, provides
comprehensive asset management services and
a wide range of investment products including
the Hong Kong Mandatory Provident Fund
(MPF), pension fund schemes, retail unit trusts,
and other institutional mandates. As of
December 2006, BOCI-Prudential managed over
HKD28.73 billion of assets (including MPF),
representing a year-on-year growth of 12.7%
and maintained a market share of
approximately 8% in terms of the assets under
management.
Equity research BOCI has a team of
investment research analysts covering the
global capital markets. Their research
capabilities as well as the depth and quality of
their product offerings are well recognized and
highly praised by clients worldwide.
Direct investment In 2006, BOCI became the
equity participant of Bohai Industrial Investment
Fund Management Co., Ltd., undertaking the
management and operation of Bohai Industrial
Investment Fund, with a total size of RMB20
billion. The establishment of BIIF was a
breakthrough in the financial system reform in
China, as well as a cornerstone of BOCI’s private
equity business. This also marked BOCI’s
leading position in China’s RMB industrial
investment fund sector.
Outlook
In 2007, BOCI will continue to leverage on the
global operating platform of the Bank to
strengthen its leading position in China as well
as to grow further in the global capital markets.
It is committed to creating value for its clients
by providing high quality, comprehensive,
professional, standardized and personalized
financial products and services.
Insurance Business
The insurance business is conducted through
the Bank’s wholly-owned subsidiary, BOCG
Insurance. The business scope of BOCG
Insurance includes: property insurance, liability
insurance, credit/bond insurance, short term
health insurance, accident insurance and
reinsurance of the above-mentioned classes of
insurance. BOCG Insurance develops its
business through 6 branches, 3 wholly-owned
subsidiaries (Bank of China Insurance Company
Limited, Eastern Pearl Insurance Advisers
Limited and Ford Ease Investment Limited) and
3 associated companies (BOC Group Life
Assurance Company Limited, Luen Fung Hang
Insurance Company Limited and DongFeng
Peugeot Citroen Auto Finance Company
Limited).

Bank of China Annual Report 200658
Business Operation
Since its establishment in Hong Kong more than
a decade ago, BOCG Insurance has been
making a stable progress. It is now in
possession of an extensive business network
and offers diversified insurance products. At the
end of 2006, the assets of BOCG Insurance
totalled HKD4.845 billion. In 2006, the actual
gross premium income of BOCG Insurance
totaled HKD1.21 billion with profit before tax
amounting to HKD0.76 billion, representing a
growth of 91.66% over the previous year.
Analysis of gross premium incomeUnit: HKD million
2006 2005 2004
Grosspremiumincome 1,213 1,266 1,398
In 2006, in the area of product innovation, BOCG
Insurance actively responded to the HKSAR
Government’s “User Pays” principle in health-
related service reform and introduced a series of
brand new medical insurance products to
address market competition and client demand.
At the same time, it also actively cooperated
with banks in the development of joint products
such as a safety insurance scheme for students.
In 2006, BOCG Insurance sold 51% of its shares
in BOCG Life to BOCHK Holdings. By leveraging
the extensive network of BOCHK in Hong Kong,
the Group can provide more effective customer
support to its “BOC wealth management”
services.
Business in Chinese Mainland
In line with the business strategy of BOCG
Insurance and to achieve one of its goals of
expanding its business in Chinese Mainland,
BOCG Insurance has set up a wholly-owned
subsidiary company, Bank of China Insurance
Company Limited, in China. At present the latter
has already established 4 branches. In 2006,
Bank of China Insurance Company Limited
adopted an operating philosophy aiming to be a
first class insurance company in China by
building up a strong insurance brand name with
advanced skills and quality service. The
aggregated actual gross premium income for
the year was RMB125.81 million, representing a
growth of 95.86% and an increase of RMB61.57
million over the past year.
In 2007, it is expected that there will be a
continuous increase in the number of
competitors in the insurance market in Chinese
Mainland and the challenges will become more
intense. Bank of China Insurance Company
Limited will take positive steps to make good
use of every opportunity that arises. It will
endeavour to enhance its risk management
ability, business support capabilities and
efficiency to establish a highly effective service
system so as to cope with the demand from
business development and competition, and to
maintain a leading role in the insurance market
in China.

Management Discussion and Analysis 59
Outlook
In light of a highly competitive insurance
market, BOCG Insurance will strive to explore
new development channels while at the same
time reinforce its traditional business. It aims to
elevate the quality of its service and
professional skills, and further extend its
business operations to the overseas market. It
will also make use of the Bank of China
Insurance Company Limited to gain access to
major cities in Chinese Mainland covering the
Bank’s existing network.
BOCG Investment
The Bank is engaged in direct investment and
investment management business, through its
wholly-owned subsidiary, BOCG Investment,
which was incorporated in Hong Kong in 1984.
As the only professional investment
management company within the Group, BOCG
Investment primarily aims to implementing the
overall development strategy of the Group. Its
major business includes corporate equity
investments, distressed asset investments, fixed
assets investments, management and lease and
property management services.
Business Operation
At the end of 2006, BOCG Investment had total
assets of HKD44.189 billion with an after tax
profit of HKD1.947 billion, representing an
increase of 88.70% compared to the prior year.
In 2006, BOCG Investment vigorously expanded
its business and succeeded in establishing
alliances in different areas with major
investment banks, professional funds, asset
management companies, the government
authorities in Chinese Mainland and other
strategic partners. Meanwhile, BOCG
Investment did not hesitate to make every effort
to achieve innovations and explore different
business models to support its business
development.
During 2006, BOCG Investment took part in
organizing the first contractual-type Renminbi-
denominated industrial fund in China, namely
“Bohai Industrial Investment Fund”. It has not
only opened up opportunities for the Group to
establish close strategic relationship with
growing enterprises of high potential, but also
consolidated and strengthened the core
competitiveness of the Group.
In 2006, BOCG Investment successfully
completed the acquisition of SALE through its
wholly-owned subsidiary, Sky Splendor, which
was incorporated in the Cayman Islands. The
acquisition provides a platform for the Bank to
enter into the aircraft leasing industry. With this
platform, the Bank not only provides operating
leases for aircraft, asset management and
structured financing services to airline
companies, but also achieves synergies by
securing more business in lending, intermediate
services, investment banking and insurance in
the aviation industry. Consequently, the Bank’s
presence could be further elevated by
differentiating itself from its competitors with its
international, global and diversified business
characteristics.
Outlook
In 2007, BOCG Investment will strive to become
a growth company which has an appropriate
asset size, a reasonable investment portfolio,
high liquidity, strong profit making ability and
stable investment returns. As a result, BOCG
Investment will be one of the key sources for
profit and contribute to the overseas diversified
business developments of the Group.
Management Discussion and Analysis— Risk Management
Bank of China Annual Report 200660
Overview
In 2006, the Bank achieved steady progress in
the development of its risk management
system, and further improved its risk
management ability and infrastructure with a
view to promoting independence, centralization
and professionalism in its risk management.
We seek to maintain a “moderate” risk appetite
and a balance between risk and return in a
“rational, stable and prudent” manner. Our
primary risk management objectives are to
maximize value for our shareholders while
maintaining risk within acceptable parameters
and satisfying the requirements of the
regulatory authorities, our depositors and other
stakeholders for the Bank’s prudent and stable
development.
The guiding principles in developing our risk
management framework include:
• Compliance with legal and regulatory
requirements: rigorously following the
laws and regulations, stipulations and
guidelines of regulatory authorities.
Compliance and stable operations are
precondit ions of the effect ive
implementation of risk management.
• Achieving an appropriate equilibrium
between risk and return: through active
control to achieve balance between profit
and loss, each category of business should
make profits which at least match the risk
it bears.
• Relative independence: being relatively
independent of business development, risk
management objectively identifies,
measures and controls risks existing in
business development, with independent
risk management institutions and
personnel.
• Strict accountability: clarifying duties,
rights and responsibilities through
rigorous internal control mechanisms.
• Alignment: ensuring the objective of risk
management is consistent with that of
business development and preserving a
unified risk management and control
strategy.
• Sufficient disclosure: providing risk
information to the supervisory authorities
or disclosing the information to the public
in accordance with regulatory
requirements.
Through further improvement of our risk
management system, we seek to achieve the
following objectives: (1) extending our risk
management framework to all of our business
departments, branches and subsidiaries; (2)
ensuring that risks inherent in our various lines
of business are effectively managed; (3)
establishing an all-encompassing risk
management culture; (4) developing
comprehensive and integrated risk
management procedures, policies and
processes; and (5) utilizing appropriate risk
management tools to identify, monitor and
quantify our risks.
Management Discussion and Analysis 61
Risk Management Framework
The Bank’s risk management framework is
mainly composed of the Board of Directors and
the Risk Policy Committee under the Board; the
Internal Control Committee, the Anti-Money
Laundering Committee, the Asset-Liability
Management Committee and the Asset Disposal
Committee which report to the senior
management; and the Risk Management
Department, the Credit Administration
Department, the Asset-Liability Management
Department and the Legal and Compliance
Department. The Bank manages the risks in
branches through a vertical management
model, the risks in business departments
through the risk window management model,
and monitors and controls the risk management
in subsidiaries through appointing members of
their boards of directors or risk management
committees.
Credit Risk
Overview
Credit risk is the risk that a customer or
counterparty may be unable or unwilling to
meet a repayment obligation that it has entered
into with us. The credit risks are mainly from
loans, trade finance and treasury operations.
In 2006, as part of our ongoing efforts to
improve the centralized credit approval system,
the pilot running of the centralized credit
approval system operated smoothly. Most of the
chief credit officers of tier one branches have
been put in place and the first batch of the
authorized credit application approvers has
been appointed and authorized by the head
office. To further enhance the efficiency and
acceleration of credit approval of our important
and high quality customers, we have initiated a
hierarchy management, with assigned and
designated officials to serve our important and
high quality customers, and we have drafted
and implemented “Lending Guidelines”. To
support our business development, we have
developed “The Guideline of SMEs Credit
Policy” and “The Rules of SMEs Credit
Management”, and have initiated the pilot run
of these measures in several branches.
In 2006, the Bank further enhanced the credit
management of group customers. We amended
and issued “The Rules of Credit Management of
BOC Group Customers”. By strengthening the
identification process of the groups and their
members, updating these information in IT
system on a timely basis, specifying
classification criteria for group customers, we
enhanced the ability to identify group
customers. We also enhanced the analysis of
high-risk group customers which demonstrate
the characteristics of large-scale loans, frequent
capital transactions, family management,
defective corporate governance, and lack of
transparency and analyzed how to improve
monitoring the risks of such customers.
In 2006, the Bank further improved the credit
rating of corporate customers through our ten-
category customer credit rating system, which
forms overall assessments on the credit status
of customers based on analysis of various
criteria including the customer’s solvency,
profitability, operating and management
indicators, credit record, market outlook,
development potential and quality of financial
information etc. Any assignment of a “A” or “B”
credit rating under our ten-category customer
rating system is required to be reviewed and
approved either by our tier one branches or our
head office. At the end of 2006, the outstanding
loans extended to borrowers with a credit rating
of “A” accounted for approximately 45.2% of
the total loans outstanding of the rated
corporate customers of our domestic
operations, an increase of 3.3 percentage points
compared with the prior year-end. The Bank has
developed a new quantitative approach to its
corporate borrower rating model, which focuses
on the probability of default by a borrower, and
have completed the back testing of the model to
improve its performance.

Bank of China Annual Report 200662
For better understanding and assessment of the
credit risks the Bank is taking, set forth below
are the details of distribution, quality and
allowance for impairment losses, respectively,
of the loan portfolio.
Loan Distribution
Loan concentration by geographical region
As at 31 December 2006, our domestic
operations accounted for 81.76% of the total
loan portfolio of the Group, and overseas
operations accounted for 18.24%. Domestic
loans were mainly concentrated in Eastern
China, and Central and Southern China,
respectively, accounting for 41.21% and 24.41%
of the total domestic loan portfolio. In 2006,
loans in Eastern China and Central and
Southern China achieved a relatively high
growth rate, increasing by RMB99.675 billion
and RMB40.416 billion respectively, compared
to last year.
GroupUnit: RMB million, except percentages
As at 31 December
2006 2005 2004 2003Amount % of total Amount % of total Amount % of total Amount % of total
Domestic institutions 1,988,334 81.76% 1,800,142 80.53% 1,735,528 80.81% 1,750,071 80.99%
Overseas institutions 443,685 18.24% 435,123 19.47% 412,160 19.19% 410,829 19.01%
Total 2,432,019 100.00% 2,235,265 100.00% 2,147,688 100.00% 2,160,900 100.00%
Note: In 2006, the Bank transferred impaired loans of RMB2.066 billion from overseas institutions. The transferred impaired
loans, together with the allowance for loan impairment losses of RMB1.849 billion are adjusted in the Management
Discussion and Analysis section for the comparison purposes. Such adjustments are included in the following disclosed
information.
DomesticUnit: RMB million, except percentages
As at 31 December
2006 2005 2004 2003Amount % of total Amount % of total Amount % of total Amount % of total
Northern China 348,596 17.53% 322,451 17.91% 314,843 18.14% 355,279 20.30%
Northeastern China 136,119 6.85% 131,649 7.32% 128,600 7.41% 139,263 7.96%
Eastern China 819,434 41.21% 719,759 39.98% 679,773 39.17% 621,900 35.54%
Central & Southern China 485,285 24.41% 444,869 24.71% 433,860 25.00% 453,863 25.93%
Western China 198,900 10.00% 181,414 10.08% 178,452 10.28% 179,766 10.27%
Total 1,988,334 100.00% 1,800,142 100.00% 1,735,528 100.00% 1,750,071 100.00%
Note: To improve the recovery and disposal of the NPLs, we centralized credit management of the NPLs of RMB12.643 billion to
our head office from 7 of our domestic branches, namely Heilongjiang, Jilin, Liaoning, Hubei, Shaanxi, Shanxi, and
Xinjiang in 2006. For the convenience of comparison, such NPLs and related allowance are adjusted in the “Management
Discussion and Analysis” section. Such adjustment is included in the following disclosed information.
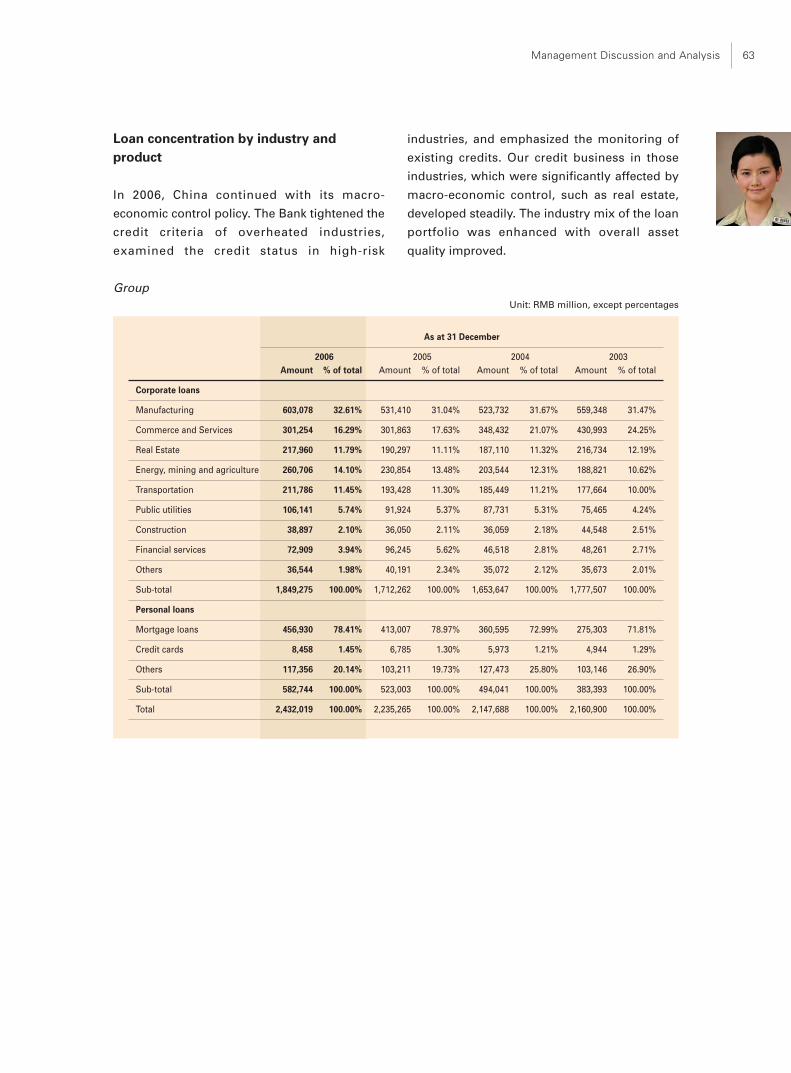
Management Discussion and Analysis 63
GroupUnit: RMB million, except percentages
As at 31 December
2006 2005 2004 2003Amount % of total Amount % of total Amount % of total Amount % of total
Corporate loans
Manufacturing 603,078 32.61% 531,410 31.04% 523,732 31.67% 559,348 31.47%
Commerce and Services 301,254 16.29% 301,863 17.63% 348,432 21.07% 430,993 24.25%
Real Estate 217,960 11.79% 190,297 11.11% 187,110 11.32% 216,734 12.19%
Energy, mining and agriculture 260,706 14.10% 230,854 13.48% 203,544 12.31% 188,821 10.62%
Transportation 211,786 11.45% 193,428 11.30% 185,449 11.21% 177,664 10.00%
Public utilities 106,141 5.74% 91,924 5.37% 87,731 5.31% 75,465 4.24%
Construction 38,897 2.10% 36,050 2.11% 36,059 2.18% 44,548 2.51%
Financial services 72,909 3.94% 96,245 5.62% 46,518 2.81% 48,261 2.71%
Others 36,544 1.98% 40,191 2.34% 35,072 2.12% 35,673 2.01%
Sub-total 1,849,275 100.00% 1,712,262 100.00% 1,653,647 100.00% 1,777,507 100.00%
Personal loans
Mortgage loans 456,930 78.41% 413,007 78.97% 360,595 72.99% 275,303 71.81%
Credit cards 8,458 1.45% 6,785 1.30% 5,973 1.21% 4,944 1.29%
Others 117,356 20.14% 103,211 19.73% 127,473 25.80% 103,146 26.90%
Sub-total 582,744 100.00% 523,003 100.00% 494,041 100.00% 383,393 100.00%
Total 2,432,019 100.00% 2,235,265 100.00% 2,147,688 100.00% 2,160,900 100.00%
Loan concentration by industry andproduct
In 2006, China continued with its macro-
economic control policy. The Bank tightened the
credit criteria of overheated industries,
examined the credit status in high-risk
industries, and emphasized the monitoring of
existing credits. Our credit business in those
industries, which were significantly affected by
macro-economic control, such as real estate,
developed steadily. The industry mix of the loan
portfolio was enhanced with overall asset
quality improved.
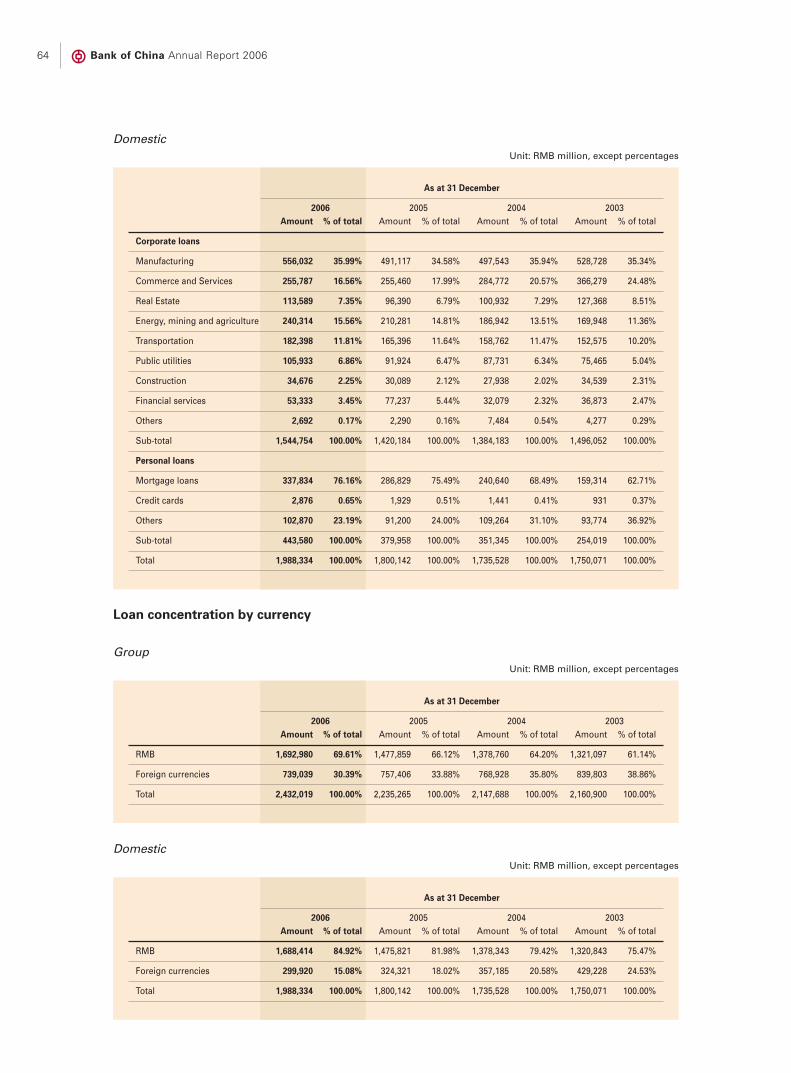
Bank of China Annual Report 200664
DomesticUnit: RMB million, except percentages
As at 31 December
2006 2005 2004 2003Amount % of total Amount % of total Amount % of total Amount % of total
Corporate loans
Manufacturing 556,032 35.99% 491,117 34.58% 497,543 35.94% 528,728 35.34%
Commerce and Services 255,787 16.56% 255,460 17.99% 284,772 20.57% 366,279 24.48%
Real Estate 113,589 7.35% 96,390 6.79% 100,932 7.29% 127,368 8.51%
Energy, mining and agriculture 240,314 15.56% 210,281 14.81% 186,942 13.51% 169,948 11.36%
Transportation 182,398 11.81% 165,396 11.64% 158,762 11.47% 152,575 10.20%
Public utilities 105,933 6.86% 91,924 6.47% 87,731 6.34% 75,465 5.04%
Construction 34,676 2.25% 30,089 2.12% 27,938 2.02% 34,539 2.31%
Financial services 53,333 3.45% 77,237 5.44% 32,079 2.32% 36,873 2.47%
Others 2,692 0.17% 2,290 0.16% 7,484 0.54% 4,277 0.29%
Sub-total 1,544,754 100.00% 1,420,184 100.00% 1,384,183 100.00% 1,496,052 100.00%
Personal loans
Mortgage loans 337,834 76.16% 286,829 75.49% 240,640 68.49% 159,314 62.71%
Credit cards 2,876 0.65% 1,929 0.51% 1,441 0.41% 931 0.37%
Others 102,870 23.19% 91,200 24.00% 109,264 31.10% 93,774 36.92%
Sub-total 443,580 100.00% 379,958 100.00% 351,345 100.00% 254,019 100.00%
Total 1,988,334 100.00% 1,800,142 100.00% 1,735,528 100.00% 1,750,071 100.00%
Loan concentration by currency
GroupUnit: RMB million, except percentages
As at 31 December
2006 2005 2004 2003Amount % of total Amount % of total Amount % of total Amount % of total
RMB 1,692,980 69.61% 1,477,859 66.12% 1,378,760 64.20% 1,321,097 61.14%
Foreign currencies 739,039 30.39% 757,406 33.88% 768,928 35.80% 839,803 38.86%
Total 2,432,019 100.00% 2,235,265 100.00% 2,147,688 100.00% 2,160,900 100.00%
DomesticUnit: RMB million, except percentages
As at 31 December
2006 2005 2004 2003Amount % of total Amount % of total Amount % of total Amount % of total
RMB 1,688,414 84.92% 1,475,821 81.98% 1,378,343 79.42% 1,320,843 75.47%
Foreign currencies 299,920 15.08% 324,321 18.02% 357,185 20.58% 429,228 24.53%
Total 1,988,334 100.00% 1,800,142 100.00% 1,735,528 100.00% 1,750,071 100.00%
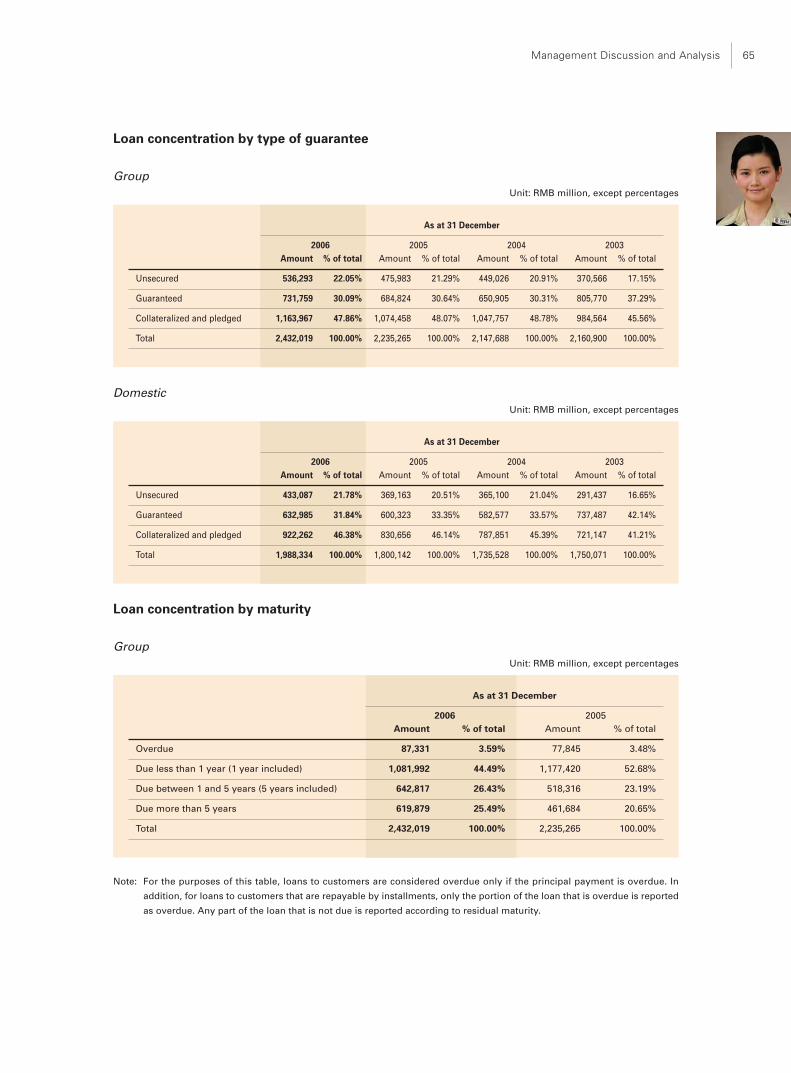
Management Discussion and Analysis 65
Loan concentration by type of guarantee
GroupUnit: RMB million, except percentages
As at 31 December
2006 2005 2004 2003Amount % of total Amount % of total Amount % of total Amount % of total
Unsecured 536,293 22.05% 475,983 21.29% 449,026 20.91% 370,566 17.15%
Guaranteed 731,759 30.09% 684,824 30.64% 650,905 30.31% 805,770 37.29%
Collateralized and pledged 1,163,967 47.86% 1,074,458 48.07% 1,047,757 48.78% 984,564 45.56%
Total 2,432,019 100.00% 2,235,265 100.00% 2,147,688 100.00% 2,160,900 100.00%
DomesticUnit: RMB million, except percentages
As at 31 December
2006 2005 2004 2003Amount % of total Amount % of total Amount % of total Amount % of total
Unsecured 433,087 21.78% 369,163 20.51% 365,100 21.04% 291,437 16.65%
Guaranteed 632,985 31.84% 600,323 33.35% 582,577 33.57% 737,487 42.14%
Collateralized and pledged 922,262 46.38% 830,656 46.14% 787,851 45.39% 721,147 41.21%
Total 1,988,334 100.00% 1,800,142 100.00% 1,735,528 100.00% 1,750,071 100.00%
Loan concentration by maturity
GroupUnit: RMB million, except percentages
As at 31 December
2006 2005Amount % of total Amount % of total
Overdue 87,331 3.59% 77,845 3.48%
Due less than 1 year (1 year included) 1,081,992 44.49% 1,177,420 52.68%
Due between 1 and 5 years (5 years included) 642,817 26.43% 518,316 23.19%
Due more than 5 years 619,879 25.49% 461,684 20.65%
Total 2,432,019 100.00% 2,235,265 100.00%
Note: For the purposes of this table, loans to customers are considered overdue only if the principal payment is overdue. In
addition, for loans to customers that are repayable by installments, only the portion of the loan that is overdue is reported
as overdue. Any part of the loan that is not due is reported according to residual maturity.
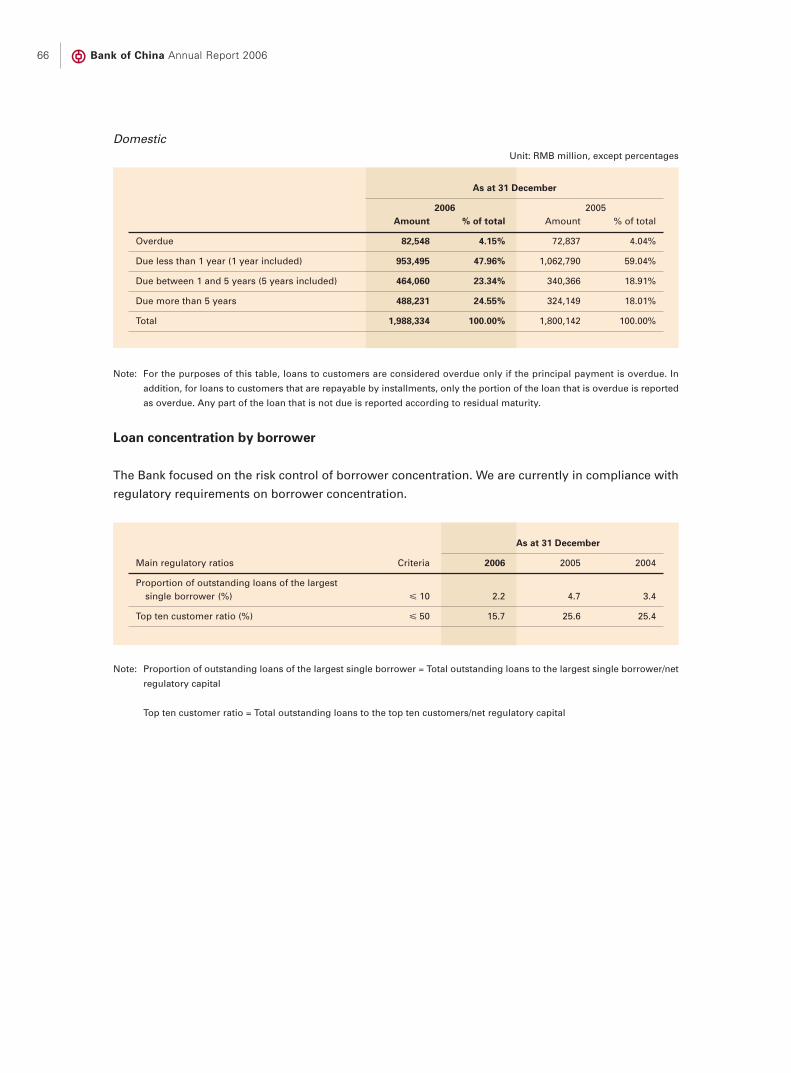
Bank of China Annual Report 200666
DomesticUnit: RMB million, except percentages
As at 31 December
2006 2005Amount % of total Amount % of total
Overdue 82,548 4.15% 72,837 4.04%
Due less than 1 year (1 year included) 953,495 47.96% 1,062,790 59.04%
Due between 1 and 5 years (5 years included) 464,060 23.34% 340,366 18.91%
Due more than 5 years 488,231 24.55% 324,149 18.01%
Total 1,988,334 100.00% 1,800,142 100.00%
Note: For the purposes of this table, loans to customers are considered overdue only if the principal payment is overdue. In
addition, for loans to customers that are repayable by installments, only the portion of the loan that is overdue is reported
as overdue. Any part of the loan that is not due is reported according to residual maturity.
Loan concentration by borrower
The Bank focused on the risk control of borrower concentration. We are currently in compliance with
regulatory requirements on borrower concentration.
As at 31 December
Main regulatory ratios Criteria 2006 2005 2004
Proportion of outstanding loans of the largestsingle borrower (%) � 10 2.2 4.7 3.4
Top ten customer ratio (%) � 50 15.7 25.6 25.4
Note: Proportion of outstanding loans of the largest single borrower = Total outstanding loans to the largest single borrower/net
regulatory capital
Top ten customer ratio = Total outstanding loans to the top ten customers/net regulatory capital

Management Discussion and Analysis 67
The following table sets forth our largest ten single borrowers as of the date indicated:Unit: RMB million, except percentages
As at 31 December 2006Outstanding % of total
Industry Principal amount loans
Customer A Commerce and services 10,366 0.43%
Customer B Energy, mining and agriculture 9,604 0.39%
Customer C Transportation 8,306 0.34%
Customer D Commerce and services 7,909 0.33%
Customer E Energy, mining and agriculture 7,850 0.32%
Customer F Transportation 6,814 0.28%
Customer G Transportation 6,548 0.27%
Customer H Commerce and services 6,127 0.25%
Customer I Energy, mining and agriculture 5,315 0.22%
Customer J Transportation 5,080 0.21%
Total 73,919 3.04%
Loan Quality
Five-category loan classification
The Bank generally measures and manages the
quality of our credit assets based on the Guiding
Principles on the Classification of Loan Risk
Management issued by the CBRC, which
requires Chinese commercial banks to classify
their loans into the following five asset quality
categories: “pass”, “special-mention”,
“substandard”, “doubtful” and “loss”, among
which loans classified in the “substandard”,
“doubtful” and “loss” categories are regarded
as non-performing loans. For our overseas
operations, where local regulations and
requirements are more prudent than the
Guiding Principles on the Classification of Loan
Risk Management, we classify our credit assets
according to local regulations and requirements.
In 2006, the Bank amended the “Management
Rules of Loan Classification” and continued
centralizing the responsibility for reviewing and
approving corporate loan classification to our
head office and domestic tier one branches.
When the loans are classified, we take into
account various factors that will affect the
quality of the loans and focus on the criterion of
“the probability of asset recovery and the extent
of loss”. To obtain a loan’s final risk
classification, we must perform a standard
process of initially classifying, checking,
reviewing by our internal rating specialists, and
approving by our authorized loan classification
approvers. The loan classification of a corporate
customer may be revised when there are
significant changes to the customer or its loan
risk status.
At the end of 2006, the Group reported NPLs of
RMB98.22 billion, and NPL ratio of 4.04%,
representing a decrease of RMB5.006 billion and
0.58 percentage point compared with the prior
year-end respectively. Domestic NPLs and NPL
ratio was RMB95.822 billion, and 4.82%,
respectively representing a decrease of
RMB2.387 billion and 0.64 percentage point
compared with the prior year-end.
In 2006, we developed “Management Rules of
Domestic Special-Mention Loans” to enhance
the risk categorizing management and
monitoring of special-mention loans, and
achieved encouraging progress. As to the low-
risk special-mention loans, we adopt practical
measures to eliminate the risk. As to the high-
risk special-mention loans, we improve the

Bank of China Annual Report 200668
GroupUnit: RMB million, except percentages
As at 31 December
2006 2005 2004 2003Amount % of total Amount % of total Amount % of total Amount % of total
Pass 2,135,654 87.81% 1,847,991 82.67% 1,612,936 75.10% 1,494,275 69.15%
Special-mention 198,145 8.15% 284,048 12.71% 424,606 19.77% 314,968 14.58%
Substandard 39,390 1.62% 45,573 2.04% 61,515 2.87% 63,314 2.93%
Doubtful 44,100 1.81% 44,550 1.99% 32,931 1.53% 116,032 5.37%
Loss 14,730 0.61% 13,103 0.59% 15,700 0.73% 172,311 7.97%
Total 2,432,019 100.00% 2,235,265 100.00% 2,147,688 100.00% 2,160,900 100.00%
NPLs 98,220 4.04% 103,226 4.62% 110,146 5.13% 351,657 16.27%
DomesticUnit: RMB million, except percentages
As at 31 December
2006 2005 2004 2003Amount % of total Amount % of total Amount % of total Amount % of total
Pass 1,703,908 85.69% 1,430,429 79.46% 1,228,414 70.78% 1,145,990 65.48%
Special-mention 188,604 9.49% 271,504 15.08% 408,571 23.54% 284,400 16.25%
Substandard 38,517 1.94% 44,056 2.45% 57,882 3.33% 56,386 3.22%
Doubtful 43,119 2.17% 42,852 2.38% 29,787 1.72% 110,159 6.30%
Loss 14,186 0.71% 11,301 0.63% 10,874 0.63% 153,136 8.75%
Total 1,988,334 100.00% 1,800,142 100.00% 1,735,528 100.00% 1,750,071 100.00%
NPLs 95,822 4.82% 98,209 5.46% 98,543 5.68% 319,681 18.27%
In 2006, we recovered and disposed of non-performing loans through undertaking various recovery
actions, including demand for payment, legal proceedings, arbitration and restructuring etc.
credit terms, reduce credit limits and undertake
early recovery actions. As to those high-risk
special-mention loans which meet the criteria of
NPLs, we downgraded them to NPLs on a timely
basis. At the end of 2006, the amount of
outstanding special-mention loans was
RMB198.145 billion, a decrease of RMB85.903
billion compared to those as of the end of last
year, and this accounted for 8.15% of the total
loan portfolio and a decrease of 4.56 percentage
points from the end of last year.

Management Discussion and Analysis 69
Overdue loans
GroupUnit: RMB million, except percentages
As at 31 December
2006 2005 2004 2003Amount % of total Amount % of total Amount % of total Amount % of total
Not overdue 2,313,465 95.13% 2,108,794 94.34% 2,025,487 94.31% 1,854,365 85.81%
Overdue
1–90 days 44,336 1.82% 50,450 2.26% 65,540 3.05% 24,086 1.12%
91–180 days 8,957 0.37% 14,012 0.63% 15,842 0.74% 10,448 0.48%
More than 180 days 65,261 2.68% 62,009 2.77% 40,819 1.90% 272,001 12.59%
Total overdue loans 118,554 4.87% 126,471 5.66% 122,201 5.69% 306,535 14.19%
Total loans 2,432,019 100.00% 2,235,265 100.00% 2,147,688 100.00% 2,160,900 100.00%
Overdue by more than 90 days 74,218 3.05% 76,021 3.40% 56,661 2.64% 282,449 13.07%
Note: For the purposes of this table, loans to customers are considered overdue if either the principal or interest payment is
overdue. For loans to customers that are repayable by installments, if any portion of the loan is overdue, the whole
amount of that loan is classified as overdue.
DomesticUnit: RMB million, except percentages
As at 31 December
2006 2005 2004 2003Amount % of total Amount % of total Amount % of total Amount % of total
Not overdue 1,876,397 94.37% 1,682,110 93.44% 1,626,070 93.69% 1,468,309 83.90%
Overdue
1–90 days 39,307 1.98% 47,587 2.64% 61,930 3.57% 19,167 1.10%
91–180 days 8,625 0.43% 13,643 0.76% 15,261 0.88% 9,164 0.52%
More than 180 days 64,005 3.22% 56,802 3.16% 32,267 1.86% 253,431 14.48%
Total overdue loans 111,937 5.63% 118,032 6.56% 109,458 6.31% 281,762 16.10%
Total loans 1,988,334 100.00% 1,800,142 100.00% 1,735,528 100.00% 1,750,071 100.00%
Overdue by more than 90 days 72,630 3.65% 70,445 3.92% 47,528 2.74% 262,595 15.00%
Note: For the purposes of this table, loans to customers are considered overdue if either the principal or interest payment is
overdue. For loans to customers that are repayable by installments, if any portion of the loan is overdue, the whole
amount of that loan is classified as overdue.

Bank of China Annual Report 200670
Identified impaired loans
Under IAS 39, if there is objective evidence of a
measurable decrease in estimated future cash
flows from the loans and advances, those loans
are assessed for impairment. When these loans
are identified as impaired, we make allowance
for impairment losses.
Movement of identified impaired loans
At the end of 2006, the Group reported
identified impaired loans totalled RMB103.232
billion, a decrease of RMB6.298 billion
compared with last year-end. The Group's
impaired loan ratio was 4.24%, representing a
reduction of 0.66 percentage point year-on-year.
Domestic operations reported identified
impaired loans which totalled RMB98.649
billion, a decrease of RMB3.71 compared to last
year-end. The domestic impaired loan ratio was
4.96%, representing a reduction of 0.73
percentage point year-on-year. Overseas
operations reported identified impaired loans
totalled RMB4.583 billion, a decrease of
RMB2.588 billion compared to last year-end.
The overseas impaired loan ratio was 1.03%,
representing a reduction of 0.61 percentage
point year-on-year.
Movement of identified impaired loans
GroupUnit: RMB million
2006 2005 2004 2003
Balance at the beginning of the year 109,530 118,383 358,218 436,163
Increase during the year 41,928 41,190 76,583 45,762
Reduction during the year (48,226) (50,043) (316,418) (123,707)
Balance at the end of the year 103,232 109,530 118,383 358,218
Domestic
Unit: RMB million
2006 2005 2004 2003
Balance at the beginning of the year 102,359 104,553 324,252 364,279
Increase during the year 40,924 39,721 74,077 37,632
Reduction during the year (44,634) (41,915) (293,776) (77,659)
Balance at the end of the year 98,649 102,359 104,553 324,252

Management Discussion and Analysis 71
Identified impaired loans by geographical region
GroupUnit: RMB million, except percentages
As at 31 December
2006 2005 2004 2003Impaired Impaired Impaired Impaired
Amount % of total loan ratio Amount % of total loan ratio Amount % of total loan ratio Amount % of total loan ratio
Domestic operations 98,649 95.56% 4.96% 102,359 93.46% 5.69% 104,553 88.32% 6.02% 324,252 90.52% 18.53%
Overseas operations 4,583 4.44% 1.03% 7,171 6.54% 1.64% 13,830 11.68% 3.36% 33,966 9.48% 8.27%
Total 103,232 100.00% 4.24% 109,530 100.00% 4.90% 118,383 100.00% 5.51% 358,218 100.00% 16.58%
Notes: Loans and advances to customers are considered impaired, and we recognize losses on the loans and advances, if
there is objective evidence of a measurable decrease in estimated future cash flows from the loans and advances.
Impaired loan ratio = amount of identified impaired loans/total balance of that category of loan.
DomesticUnit: RMB million, except percentages
As at 31 December
2006 2005 2004 2003Impaired Impaired Impaired Impaired
Amount % of total loan ratio Amount % of total loan ratio Amount % of total loan ratio Amount % of total loan ratio
Northern China 18,718 18.97% 5.37% 17,699 17.29% 5.49% 22,600 21.62% 7.18% 67,140 20.71% 18.90%
Northeastern China 12,673 12.85% 9.31% 12,582 12.29% 9.56% 13,396 12.81% 10.42% 36,645 11.30% 26.31%
Eastern China 24,269 24.60% 2.96% 27,811 27.17% 3.86% 28,595 27.34% 4.21% 91,087 28.09% 14.64%
Central andSouthern China 28,008 28.39% 5.77% 30,611 29.91% 6.88% 26,611 25.46% 6.13% 98,759 30.46% 21.76%
Western China 14,981 15.19% 7.53% 13,656 13.34% 7.53% 13,351 12.77% 7.48% 30,621 9.44% 17.03%
Total 98,649 100.00% 4.96% 102,359 100.00% 5.69% 104,553 100.00% 6.02% 324,252 100.00% 18.53%
Domestic identified impaired loans by industry and product
Domestic identified corporate impaired loans by industryUnit: RMB million, except percentages
As at 31 December
2006 2005 2004 2003Impaired Impaired Impaired Impaired
Amount % of total loan ratio Amount % of total loan ratio Amount % of total loan ratio Amount % of total loan ratio
Manufacturing 34,123 38.33% 6.14% 33,188 35.73% 6.76% 32,444 33.54% 6.52% 127,175 40.27% 24.05%
Commerce and Services 22,579 25.36% 8.83% 25,443 27.39% 9.96% 26,344 27.22% 9.25% 122,784 38.88% 33.52%
Real Estate 10,710 12.03% 9.43% 12,763 13.74% 13.24% 13,453 13.90% 13.33% 22,060 6.98% 17.32%
Energy, mining andagriculture 6,153 6.91% 2.56% 6,665 7.18% 3.17% 6,588 6.81% 3.52% 19,619 6.21% 11.54%
Transportation 8,258 9.28% 4.53% 7,759 8.35% 4.69% 9,729 10.05% 6.13% 7,349 2.33% 4.82%
Public utilities 4,523 5.08% 4.27% 4,627 4.98% 5.03% 5,564 5.75% 6.34% 6,019 1.91% 7.98%
Construction 2,322 2.61% 6.70% 2,226 2.40% 7.40% 2,569 2.65% 9.20% 5,190 1.64% 15.03%
Financial services 187 0.21% 0.35% 215 0.23% 0.28% 72 0.07% 0.22% 3,618 1.10% 9.81%
Others 171 0.19% 6.35% — — — 6 0.01% 0.08% 2,015 0.68% 47.11%
Total corporateimpaired loans 89,026 100.00% 5.76% 92,886 100.00% 6.54% 96,769 100.00% 6.99% 315,829 100.00% 21.11%

Bank of China Annual Report 200672
Domestic identified personal impaired loans by productUnit: RMB million, except percentages
As at 31 December
2006 2005 2004 2003Impaired Impaired Impaired Impaired
Amount % of total loan ratio Amount % of total loan ratio Amount % of total loan ratio Amount % of total loan ratio
Mortgage loans 4,100 42.61% 1.21% 3,837 40.50% 1.34% 3,608 46.35% 1.50% 3,003 35.65% 1.88%
Credit cards 219 2.28% 7.63% 228 2.41% 11.82% 218 2.80% 15.13% 262 3.11% 28.14%
Others 5,304 55.11% 5.16% 5,408 57.09% 5.93% 3,958 50.85% 3.62% 5,158 61.24% 5.50%
Total personal impairedloans 9,623 100.00% 2.17% 9,473 100.00% 2.49% 7,784 100.00% 2.22% 8,423 100.00% 3.32%
Identified impaired loans by customer type
GroupUnit: RMB million, except percentages
As at 31 December
2006 2005 2004 2003Impaired Impaired Impaired Impaired
Amount % of total loan ratio Amount % of total loan ratio Amount % of total loan ratio Amount % of total loan ratio
Corporate loans andadvances 92,237 89.35% 4.99% 98,888 90.28% 5.78% 108,230 91.42% 6.54% 345,778 96.53% 19.45%
Personal loans andadvances 10,995 10.65% 1.89% 10,642 9.72% 2.03% 10,153 8.58% 2.06% 12,440 3.47% 3.24%
Total 103,232 100.00% 4.24% 109,530 100.00% 4.90% 118,383 100.00% 5.51% 358,218 100.00% 16.58%
DomesticUnit: RMB million, except percentages
As at 31 December
2006 2005 2004 2003Impaired Impaired Impaired Impaired
Amount % of total loan ratio Amount % of total loan ratio Amount % of total loan ratio Amount % of total loan ratio
Corporate loans andadvances 89,026 90.25% 5.76% 92,886 90.74% 6.54% 96,769 92.56% 6.99% 315,829 97.40% 21.11%
Personal loans andadvances 9,623 9.75% 2.17% 9,473 9.26% 2.49% 7,784 7.44% 2.22% 8,423 2.60% 3.32%
Total 98,649 100.00% 4.96% 102,359 100.00% 5.69% 104,553 100.00% 6.02% 324,252 100.00% 18.53%
Identified impaired loans by currency
GroupUnit: RMB million, except percentages
As at 31 December
2006 2005 2004 2003Impaired Impaired Impaired Impaired
Amount % of total loan ratio Amount % of total loan ratio Amount % of total loan ratio Amount % of total loan ratio
RMB 86,816 84.10% 5.13% 87,980 80.33% 5.96% 84,469 71.36% 6.13% 204,846 57.18% 15.51%
Foreign currency 16,416 15.90% 2.22% 21,550 19.67% 2.84% 33,914 28.64% 4.41% 153,372 42.82% 18.26%
Total 103,232 100.00% 4.24% 109,530 100.00% 4.90% 118,383 100.00% 5.51% 358,218 100.00% 16.58%
Management Discussion and Analysis 73
DomesticUnit: RMB million, except percentages
As at 31 December
2006 2005 2004 2003Impaired Impaired Impaired Impaired
Amount % of total loan ratio Amount % of total loan ratio Amount % of total loan ratio Amount % of total loan ratio
RMB 86,816 88.01% 5.14% 87,980 85.96% 5.96% 84,469 80.79% 6.13% 204,846 63.17% 15.51%
Foreign currency 11,833 11.99% 3.95% 14,379 14.04% 4.43% 20,084 19.21% 5.62% 119,406 36.83% 27.82%
Total 98,649 100.00% 4.96% 102,359 100.00% 5.69% 104,553 100.00% 6.02% 324,252 100.00% 18.53%
Identified impaired loans by impairment loss assessment methodology
GroupUnit: RMB million, except percentages
As at 31 December
2006 2005 2004 2003Amount % of total Amount % of total Amount % of total Amount % of total
Individually assessed 81,730 79.17% 83,242 76.00% 89,768 75.83% 260,241 72.65%
Collectively assessed 21,502 20.83% 26,288 24.00% 28,615 24.17% 97,977 27.35%
Total 103,232 100.00% 109,530 100.00% 118,383 100.00% 358,218 100.00%
DomesticUnit: RMB million, except percentages
As at 31 December
2006 2005 2004 2003Amount % of total Amount % of total Amount % of total Amount % of total
Individually assessed 78,409 79.48% 78,309 76.50% 81,747 78.19% 241,200 74.39%
Collectively assessed 20,240 20.52% 24,050 23.50% 22,806 21.81% 83,052 25.61%
Total 98,649 100.00% 102,359 100.00% 104,553 100.00% 324,252 100.00%
Allowance for Impairment Losses onLoans
The Bank makes adequate allowance for
impairment losses on loans promptly in
accordance with prudent and established
principles. Allowance for impairment losses on
loans consists of two components: individually
assessed allowance and collectively assessed
allowance. For a further discussion of the
accounting policy of allowance for impairment
losses on loans, please refer to Note II.12 to the
Financial Statements.
Movements of allowance for impairmentlosses on loans
At the end of 2006, the Group’s allowance for
impairment losses was RMB94.293 billion,
representing an increase of RMB11.14 billion
from last year-end, with the coverage ratio of
allowance for impairment losses to identified
impaired loans increasing by 15.42 percentage
points to 91.34% from last year-end. The
impairment losses for the year were RMB12.342
billion, representing an increase of RMB0.856
billion from last year. The credit cost ratio was

Bank of China Annual Report 200674
GroupUnit: RMB million, except percentages
2006 2005 2004 2003
Balance at beginning of year 83,153 74,769 239,039 318,443
Impairment losses for the year 12,342 11,486 23,812 18,100
Loans and advances written off or transferred (3,711) (4,852) (189,945) (63,905)
Amounts recovered on loans and advanceswritten off in previous years 3,589 2,954 2,507 731
Unwinding of discount on allowance (628) (529) (644) (1,354)
Exchange differences (452) (675) — —
Transfer to capital reserve — — — (32,976)
Balance at the end of the year 94,293 83,153 74,769 239,039
DomesticUnit: RMB million, except percentages
2006 2005 2004 2003
Balance at beginning of year 78,193 67,158 223,758 276,212
Impairment losses for the year 15,545 15,346 26,926 19,333
Loans and advances written off or transferred (2,829) (3,527) (183,405) (37,573)
Amounts recovered on loans and advanceswritten off in previous years 83 120 523 116
Unwinding of discount on allowance (539) (396) (644) (1,354)
Exchange differences (293) (508) — —
Transfer to capital reserve — — — (32,976)
Balance at the end of the year 90,160 78,193 67,158 223,758
0.53%, representing an increase of 0.01
percentage point from last year. Domestic
allowance for impairment losses reached
RMB90.16 billion, representing an increase of
RMB11.967 billion from last year-end, with the
coverage ratio of allowance for impairment
losses to identified impaired loan increasing by
15 percentage points to 91.39% from last year-
end. The domestic impairment losses on loans
in 2006 were RMB15.545 billion, representing an
increase of RMB0.199 billion from last year, with
the domestic credit cost ratio of 0.82%,
representing a decrease of 0.05 percentage
point from last year.

Management Discussion and Analysis 75
Allowance for impairment losses by region
GroupUnit: RMB million, except percentages
As at 31 December
2006 2005 2004 2003Impaired Impaired Impaired Impaired
loan loan loan loancoverage coverage coverage coverage
Amount % of total ratio Amount % of total ratio Amount % of total ratio Amount % of total ratio
Domestic operations 90,160 95.62% 91.39% 78,193 94.04% 76.39% 67,158 89.82% 64.23% 223,758 93.61% 69.01%
Overseas operations 4,133 4.38% 90.18% 4,960 5.96% 69.16% 7,611 10.18% 55.03% 15,281 6.39% 44.99%
Total 94,293 100.00% 91.34% 83,153 100.00% 75.92% 74,769 100.00% 63.16% 239,039 100.00% 66.73%
Allowance for impairment losses on domestic identified impaired loans by geographical region
Unit: RMB million, except percentages
As at 31 December
2006 2005 2004 2003Impaired Impaired Impaired Impaired
loan loan loan loancoverage coverage coverage coverage
Amount % of total ratio Amount % of total ratio Amount % of total ratio Amount % of total ratio
Northern China 13,337 20.88% 71.26% 10,624 19.64% 60.03% 9,697 22.87% 42.91% 40,399 19.71% 60.17%
Northeastern China 7,903 12.37% 62.36% 7,020 12.98% 55.79% 5,903 13.92% 44.07% 23,789 11.60% 64.92%
Eastern China 13,530 21.18% 55.75% 12,482 23.07% 44.88% 10,803 25.48% 37.78% 57,269 27.94% 62.87%
Central and Southern China 19,495 30.52% 69.61% 16,929 31.29% 55.30% 10,675 25.18% 40.11% 64,730 31.57% 65.54%
Western China 9,614 15.05% 64.17% 7,044 13.02% 51.58% 5,322 12.55% 39.86% 18,816 9.18% 61.44%
Total 63,879 100.00% 64.75% 54,099 100.00% 52.85% 42,400 100.00% 40.55% 205,003 100.00% 63.22%
Allowance for impairment losses on domestic identified corporate impaired loans by industry
Unit: RMB million, except percentages
As at 31 December
2006 2005 2004 2003Impaired Impaired Impaired Impaired
loan loan loan loancoverage coverage coverage coverage
Amount % of total ratio Amount % of total ratio Amount % of total ratio Amount % of total ratio
Manufacturing 22,018 38.67% 64.53% 17,341 35.71% 52.25% 14,130 36.39% 43.55% 79,614 39.81% 62.60%
Commerce and Services 14,759 25.93% 65.37% 13,630 28.07% 53.57% 10,791 27.79% 40.96% 82,282 41.15% 67.01%
Real Estate 5,937 10.43% 55.43% 5,647 11.63% 44.24% 3,310 8.52% 24.60% 12,474 6.24% 56.54%
Energy, mining andagriculture 4,092 7.19% 66.50% 3,473 7.15% 52.11% 2,726 7.02% 41.38% 10,480 5.24% 53.42%
Transportation 6,100 10.72% 73.87% 5,500 11.32% 70.89% 5,572 14.35% 57.27% 3,444 1.72% 46.86%
Public utilities 2,419 4.25% 53.48% 1,877 3.87% 40.57% 1,635 4.21% 29.39% 3,860 1.93% 64.13%
Construction 1,430 2.51% 61.58% 1,003 2.06% 45.06% 647 1.67% 25.18% 3,545 1.77% 68.30%
Financial services 100 0.18% 53.48% 93 0.19% 43.26% 15 0.04% 20.83% 2,741 1.37% 75.76%
Others 70 0.12% 40.94% — — — 3 0.01% 50.00% 1,539 0.77% 76.38%
Total 56,925 100.00% 63.94% 48,564 100.00% 52.28% 38,829 100.00% 40.13% 199,979 100.00% 63.32%
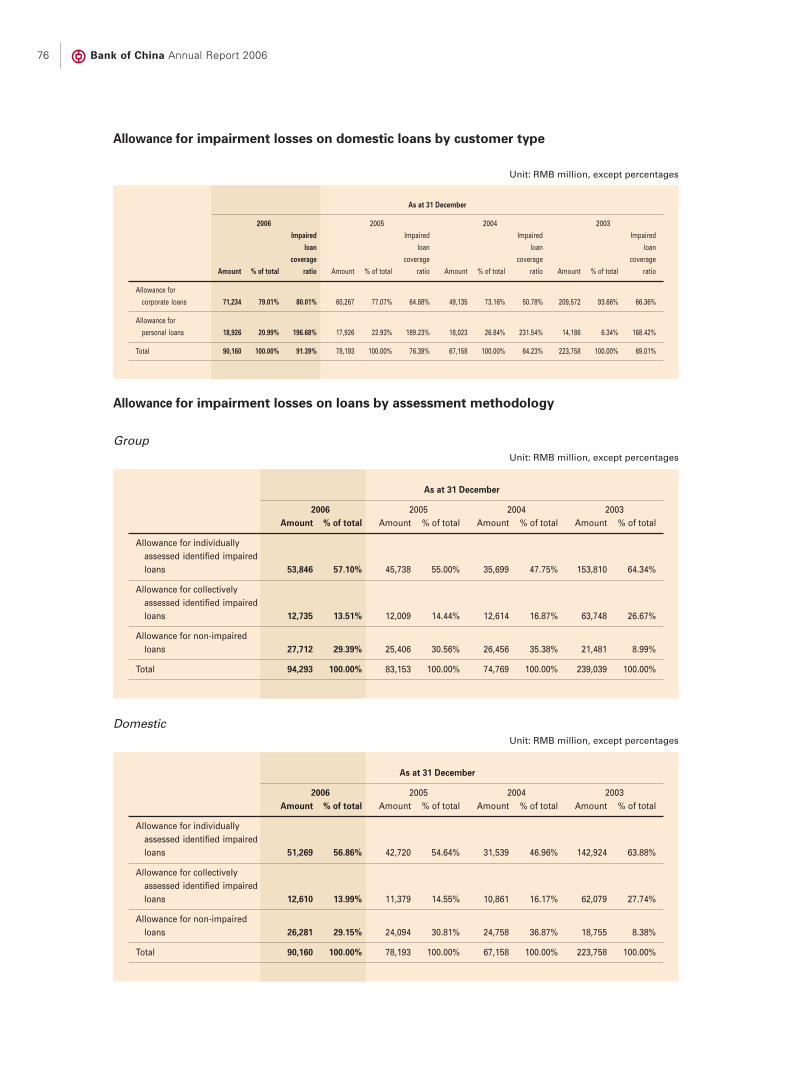
Bank of China Annual Report 200676
Allowance for impairment losses on domestic loans by customer type
Unit: RMB million, except percentages
As at 31 December
2006 2005 2004 2003Impaired Impaired Impaired Impaired
loan loan loan loancoverage coverage coverage coverage
Amount % of total ratio Amount % of total ratio Amount % of total ratio Amount % of total ratio
Allowance forcorporate loans 71,234 79.01% 80.01% 60,267 77.07% 64.88% 49,135 73.16% 50.78% 209,572 93.66% 66.36%
Allowance forpersonal loans 18,926 20.99% 196.68% 17,926 22.93% 189.23% 18,023 26.84% 231.54% 14,186 6.34% 168.42%
Total 90,160 100.00% 91.39% 78,193 100.00% 76.39% 67,158 100.00% 64.23% 223,758 100.00% 69.01%
Allowance for impairment losses on loans by assessment methodology
GroupUnit: RMB million, except percentages
As at 31 December
2006 2005 2004 2003Amount % of total Amount % of total Amount % of total Amount % of total
Allowance for individuallyassessed identified impairedloans 53,846 57.10% 45,738 55.00% 35,699 47.75% 153,810 64.34%
Allowance for collectivelyassessed identified impairedloans 12,735 13.51% 12,009 14.44% 12,614 16.87% 63,748 26.67%
Allowance for non-impairedloans 27,712 29.39% 25,406 30.56% 26,456 35.38% 21,481 8.99%
Total 94,293 100.00% 83,153 100.00% 74,769 100.00% 239,039 100.00%
DomesticUnit: RMB million, except percentages
As at 31 December
2006 2005 2004 2003Amount % of total Amount % of total Amount % of total Amount % of total
Allowance for individuallyassessed identified impairedloans 51,269 56.86% 42,720 54.64% 31,539 46.96% 142,924 63.88%
Allowance for collectivelyassessed identified impairedloans 12,610 13.99% 11,379 14.55% 10,861 16.17% 62,079 27.74%
Allowance for non-impairedloans 26,281 29.15% 24,094 30.81% 24,758 36.87% 18,755 8.38%
Total 90,160 100.00% 78,193 100.00% 67,158 100.00% 223,758 100.00%

Management Discussion and Analysis 77
Market Risk
Overview
Market risk is the risk of loss in on and off-
balance sheet positions arising from
movements in market prices (interest rates,
exchange rates, equity prices and commodity
prices). Market risk exists in both trading and
non-trading businesses of the Bank. The
principal types of market risk for the Bank are
interest rate risk and exchange rate risk. We
expect to be subject to increasing levels of
market risk as the PRC Government continues to
deregulate restrictions governing interest and
exchange rates.
We are exposed to market risk primarily through
the assets and liabilities on our balance sheet,
as well as our off-balance-sheet businesses. In
accordance with regulatory requirements, we
categorize our assets and liabilities as under
either trading book or banking book. Our trading
book primarily consists of positions in the
freely-tradable financial instruments and
commodities for trading purposes or in order to
mitigate risks of other financial instruments in
the trading book. Our banking book consists of
positions in financial instruments not included
in the trading book (and includes financial
instruments in the investment book purchased
with the Bank’s surplus liquility for investment
purposes).
In 2006, we integrated our market risk
management function and set up an
independent market risk management team
within the Risk Management Department to
specifically undertake the market risk
management function of the Group.
In 2006, we formulated the Market Risk
Management Policy for the Bank of China and
specified the organizational structure,
procedures, risk measurement, limit setting and
reporting of market risk management. With
reference to the relevant regulatory
requirements as well as the market risk
management practices of international
commercial banks, we set up our market risk
limit structure and improved our market risk
indicator system considering our current
business practice, our IT systems and our
customer management model. Additionally, we
set up our market risk limits for 2006. We have
also established daily and monthly market risk
reporting mechanism to integrate market risk
information with the aim of conducting effective
monitoring and analysis of market risk limit
utilization and providing relevant information to
the senior management.
Market Risk Management of theTrading Book
The Bank manages the market risk of the trading
book primarily through setting up the overall
VAR (see below for definition) and stop-loss
limits on the trading book and allocating and
establishing position limits and stop-loss limits
for each trading desk and trader. Traders can
only trade financial instruments which meet
certain pre-determined criteria (e.g. the liquidity
of the financial instruments). The Bank monitors
the VAR, position and stop-loss limits of the
traders on a daily basis.
Value-at-risk (VAR) is the possible loss in normal
market conditions, given a specified time
horizon and specified confidence level. The
Bank is using a one day time horizon and 95%

Bank of China Annual Report 200678
confidence level to calculate the VAR for the
domestic trading book. Based on such
calculation, within the one day time horizon, the
probability of loss on the trading book
exceeding the VAR is limited to 5% or below.
The chart below shows the VAR of the Bank’s
domestic foreign currency-denominated trading
book (excluding the investment book or banking
book) at the end of 2006 and 2005:
Unit: USD million
As at 31 December
2006 2005Period Period
end Average High Low end Average High Low
Interest rate risk 1.79 2.71 16.25 0.54 4.77 3.27 11.94 0.20
Foreign exchange risk 0.81 2.99 14.12 0.39 12.84 2.70 18.69 0.34
Volatility risk 0.13 0.79 6.19 0.07 0.36 0.80 2.54 0.04
Total market risk 2.07 5.64 19.15 0.86 15.06 5.10 18.86 0.69
We also use information technology systems,
such as Kondor+, Bloomberg PTS, DerivaTech,
Summit, and RiskMetrics, to measure, analyze,
monitor and manage the market risks of our
treasury operations. Our Kondor+ system
currently covers our major overseas branches
and most of our treasury products. In addition,
we use the Bloomberg PTS system to monitor
the positions and mark-to-market of fixed
income products and derivatives, the
DerivaTech and Summit systems to price, value
and monitor our risk exposure in derivative
products, and the RiskMetrics system to
generate VAR reports and stress testing reports.
These systems help us monitoring the market
risk exposure in our treasury operations.
The Bank has established a global middle office
network to monitor and control the market risk
in the investment book and the trading book
(treasury business). The head office is
responsible for directly monitoring the treasury
business of our domestic branches. The Bank is
also continuously improving the capability of
the back office, especially the independent
evaluation of the mark-to-market values of
financial instruments.
Market Risk Management for theBanking Book
The primary market risk for our banking book is
interest rate risk. Interest rate risk arises mainly
from mismatches in the maturities or repricing
periods of the assets and liabilities of our
banking book. We manage the interest rate risk
of the banking book primarily through gap
analysis. Gap analysis measures the difference
between the amount of interest-earning assets
and interest-bearing liabilities that mature or
must be repriced within certain periods. We also
use the data generated by gap analysis to
perform sensitivity analysis and stress testing,
which provide us with relevant information in
adjusting the maturities of the interest-earning
assets and interest-bearing liabilities.
Meanwhile, we closely follow the local and
foreign currency interest rate trends and
promptly adjust the interest rates of local and
foreign currency deposits and loans in order to
avoid interest rate risk.
In 2006, the benchmark rates on RMB-
denominated deposits were raised in August
and those on RMB-denominated loans were

Management Discussion and Analysis 79
increased both in April and August. The rising
RMB interest rates, as a whole, were beneficial
to the Bank’s financial results of 2006, although
the cumulative RMB interest rate sensitivity gap
of the Bank within one year remained negative
in 2006. The main reason was that the yield of
loans was increased due to the RMB interest
rate increase in April while the cost of deposits
remained unchanged. In addition, the interest
rate on demand deposits, which accounted for
around 40% of the total deposits, was not
affected by the RMB deposit rate increase in
August. The U.S. Federal Reserve raised the
federal funds target rate four times in January,
March, May and June 2006. The rising USD
interest rates were favorable to the financial
results of the Bank although the cumulative
USD interest rate sensitivity gap of the Bank
within one year was essentially negative in
2006. The main reason was that the interest
rates on small balance USD-denominated
deposits were unchanged in domestic
operations. Domestic deposits of small balance
denominated in USD accounted for over 80% of
the total domestic USD-denominated deposits.
At the end of 2006 and 2005, the Group’s and
the Bank’s interest rate sensitivity gaps were as
follows (For details on interest rate sensitivity
gaps, please refer to Notes III.6 to the Financial
Statements).
By the end of 2006, the gap of the Group for a
time period of up to 1 month was negative and
the gaps for the remaining time periods were
positive. The gap up to 1 month was negative
because the substantial amount of the demand
deposits was placed in the time bucket of up to
1 month. The gap within all the other time
periods was positive because the interest-
earning assets were more than interest-bearing
liabilities in those time periods.
Assuming the yield curves of all the currencies
shift up 100 basis points in parallel at the
beginning of 2007, the net interest income of the
Group will decrease by RMB6.818 billion.
Assuming the yield curves of all the currencies
shift down 100 basis points at the beginning of
2007, the net interest income of the Group will
increase by RMB6.818 billion. This analysis is
based on the Group’s gap position at the end of
2006 and does not take into consideration any
Group
Unit: RMB million
1 to 3 3 to 12 1 to 5 NonUp to 1 months months years Over 5 interest-month (incl.) (incl.) (incl.) years bearing
31 December 2006 (1,127,311) 220,794 591,503 347,020 341,294 39,656
31 December 2005 (894,734) 33,843 464,652 402,985 241,871 6,902
Note: interest rate sensitivity gap = interest rate sensitive assets – interest rate sensitive liabilities
BankUnit: RMB million
1 to 3 3 to 12 1 to 5 NonUp to 1 months months years Over 5 interest-month (incl.) (incl.) (incl.) years bearing
31 December 2006 (928,376) 155,514 547,218 267,636 246,984 66,418
31 December 2005 (828,023) 40,274 423,374 323,711 195,677 48,800
Bank of China Annual Report 200680
changes in the asset-liability position during
2007 and the impact on customer behavior due
to interest rate changes.
The RMB interest rate liberalization has
developed steadily in 2006. Some commercial
banks launched RMB-denominated fixed-rate
residential mortgage loans. The RMB interest
rate derivative markets including swap markets
became active gradually. In particular, the
formal implementation of SHIBOR on 4 January
2007 provided a foundation to establish China’s
money market benchmark rate system, which
will further accelerate RMB interest rate
liberalization in the near future. Under such
circumstances, the Bank has begun to improve
the interest rate pricing system and enhance
pricing capability by developing and promoting
the loan rate pricing model progressively. In
addition, the Bank closely followed the potential
risk arising from new businesses and products
and started to consider the possibility of
hedging interest rate risk by RMB interest rate
derivative transactions.
Market Risk Management of theInvestment Book
Pursuant to the regulatory requirements, our
banking book also includes the investment book
under which we purchase financial instruments
with our excess funding for investment
purposes. Apart from applying gap analysis to
the interest rate risk underlying the investment
book, the senior management of the Bank also
reviews and approves the investment guidelines
of the investment book annually based on the
market risk management policy and the market
risk limit approved by the Board (the Risk Policy
Committee). The investment guidelines cover
the relevant market risk limit, the size of the
investment portfolios, authorized investment
products, the duration of the portfolio, the
concentration limit by issuer and the minimum
rating requirement, etc. Business departments
must strictly comply with these investment
guidelines, and will be monitored and examined
by the independent market risk management
function. The Bank has been improving its risk
management ability continuously. The Bank
manage the market risk of the investment book
mainly through the monitoring of VAR and the
present value of a basis point and through the
stress testing of the current investment
portfolio.
Exchange Rate Risk
The Bank’s management of exchange rate risk
covers both non-trading books and trading
books. Non-trading exchange rate risk mainly
arises from foreign currency capital
contribution, investment in overseas
subsidiaries, and foreign currency profit and
loss. The Bank seeks to reduce the foreign
exchange exposure by matching the sources
and utilization of our funds on a currency-by-
currency basis. In addition, we also manage and
control exchange risk through settlement or
hedging transactions. Trading exchange rate
risk mainly arises from the foreign exchange
transactions the Bank is engaged for its own
account or on behalf of customers. The Bank
controls the foreign currency position within the
required limits according to its risk tolerance
and operating capability.
For details of the foreign currency position of
the Bank, please refer to the section under
“Financial Review”.
Liquidity Risk
Summary
Liquidity risk relates to the risk associated with
the failure to obtain funds at a reasonable cost
when required to meet a repayment obligation
and fund its asset portfolio. The objective of our
liquidity risk management is to ensure that all

Management Discussion and Analysis 81
our branches/outlets maintain appropriate
liquidity to meet the need of normal operations,
and are able to raise enough funds at
reasonable cost within a certain period to
ensure payments can be made in the case of
emergency or for business development
opportunity.
By adhering to the tier-one legal person
management principle, the head office is solely
responsible for the management of liquidity risk
throughout the Bank. Liquidity management
policy and measures are applied across the
Bank from using a top down approach with the
effect that the higher tier management units are
responsible for overseeing the lower tier
management units. The liquidity management
policies and the risk measurement benchmark
are largely implemented centrally. We take full
account of our market financing capability and
other factors when developing the relevant
proposals on a prudent basis.
The Bank has adopted both asset liquidity
management and l iabil i ty l iquidity
management. Our asset liquidity management
strategies are intended to encourage
diversification, the realizability of assets, and to
hold an appropriate level of highly liquid assets
in the portfolio. The strategies on liability
management are intended to increase the
proportion of core deposits and to maintain the
stability of liabilities and financing ability.
Our liquidity management process considers
operations under normal circumstances, as well
as contingency measures under abnormal
circumstances. In a normal business
environment, the Bank regularly updates its
management policies and guidelines and its
liquidity benchmark management, its cash
positions, the funds transfer between the head
office and branches, the liquid asset portfolio
and delegated authorities of financing activities
so as to control the liquidity level across the
Bank within an appropriate range. In addition,
we established a funding forecast system to
keep track of the movements in position. We
also formulated a contingency plan as well as
developed liquidity stress testing in order to
promptly identify and mitigate any liquidity
risks.
In 2006, the Bank’s liquidity was, in general,
sufficient with occasional liquidity pressures.
Market conditions posed challenges to our
liquidity position. Firstly, since the second half
of 2006, a significant slow-down in the growth
of new RMB-denominated deposits due to the
continuing recovery of the stock market and
fund market resulted in a decrease in stable
sources of funds, while loan growth maintained
at a fast pace, which resulted in liquidity
pressure. Secondly, the Bank experienced
significant fund inflows and outflows due to the
increase in numbers of new share issuances.
Third, on a number of occasions the central
bank implemented restrictive monetary policies
in order to control the fast growth in lending.
The central bank increased the benchmark
interest rate twice, raised the mandatory deposit
reserve ratio three times, and issued notes to
target investors four times. The number of
restrictive monetary policy launched on the
market and the frequency with which they have
occurred during the year were historical high.
In these circumstances, we constantly improved
our liquidity management ability, proactively
managed the Bank’s liability structure and
shortened the duration of our bonds investment
portfolio. We managed to maintain the proper
liquidity level to meet normal business needs.

Bank of China Annual Report 200682
Regulatory As at 31 December
Main regulatory ratios standard 2006 2005 2004
Liquidity ratio (%) RMB �25 37.7 48.9 35.3
Foreign currency �25 64.1 87.4 78.6
Loan to deposit ratio (%) RMB �75 57.6 51.7 59.6
Foreign currency �85 70.1 70.4 67.9
Excess reserve ratio (%) RMB 2.8 3.0 3.7
Foreign currency 25.8 16.9 13.4
Note: Liquidity ratio = current assets/current liabilities; Liquidity ratio is calculated in accordance with the relevant provisions of
the PBOC and the CBRC, and the financial data are based on the PRC Accounting Standard for Business Enterprises and
the Accounting Systems for Financial Institutions.
Loan to deposit ratio = outstanding loans/outstanding deposits.
Excess reserve ratio for RMB=(reserve in excess of the mandatory requirements+cash)/(balance of deposits+remittance
payables).
Excess reserve ratio for foreign currency=(reserve in excess of the mandatory requirements+cash+due from banks and
due from overseas branches and subsidiaries)/outstanding deposits.
Regulatory Ratios on Liquidity
At the end of 2006, the Bank’s liquidity position
met all the regulatory requirements as shown in
the table below: (“liquidity ratio” is the indicator
of the Group; “loan to deposit ratio” and the
“excess reserve ratio” are the indicators of the
Bank’s domestic operations in the Chinese
Mainland).
Liquidity Gap Analysis
We assess liquidity risk through liquidity gap
analysis. We periodically monitor and calculate
the liquidity gap (i.e. the difference between
assets and liabilities which mature within a
specified period), and perform sensitivity
analysis and stress testing using gap data. At
the end of 2006 and 2005, the liquidity gap
position was as follows (For details on the
liquidity position, please refer to Note III.7 to the
Financial Statements):
GroupUnit: RMB million
1–3 3–12 1–5On Up to 1 months months years Over 5
Overdue demand month (incl.) (incl.) (incl.) years Total
31 December 2006 48,754 (1,889,251) 4,183 55,597 41,576 1,070,214 1,081,883 412,956
31 December 2005 40,452 (1,637,566) (12,384) (75,143) 167,958 968,682 803,520 255,519
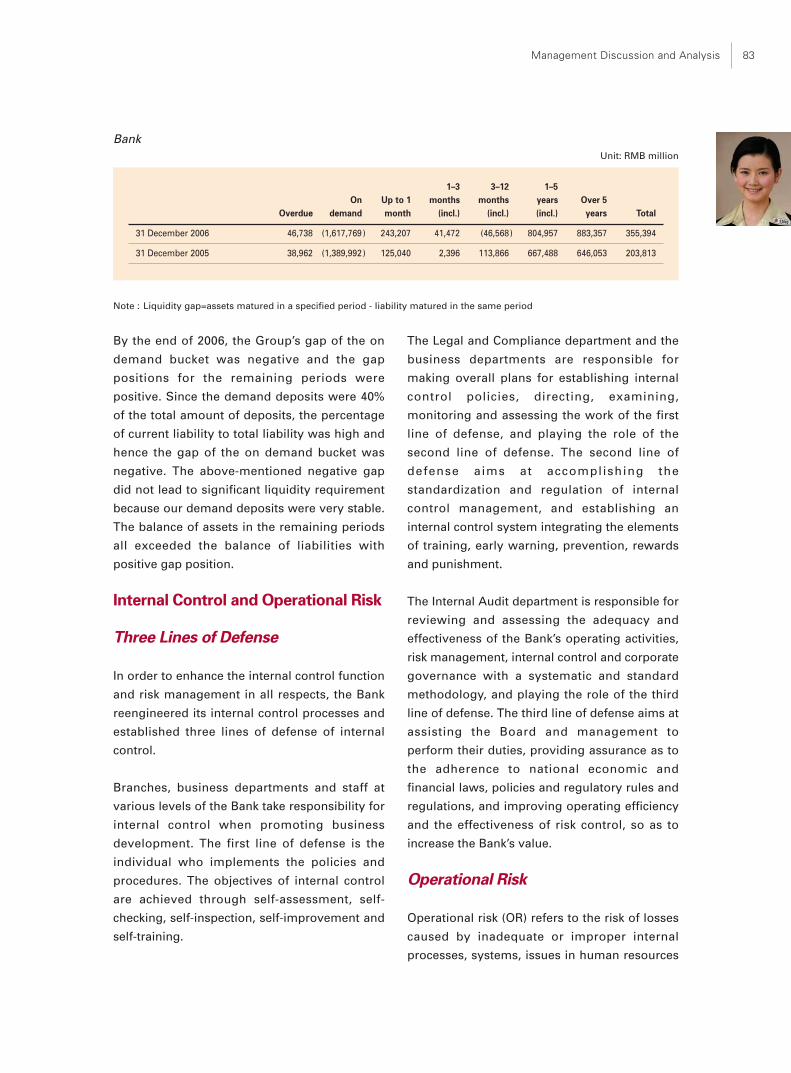
Management Discussion and Analysis 83
BankUnit: RMB million
1–3 3–12 1–5On Up to 1 months months years Over 5
Overdue demand month (incl.) (incl.) (incl.) years Total
31 December 2006 46,738 (1,617,769) 243,207 41,472 (46,568) 804,957 883,357 355,394
31 December 2005 38,962 (1,389,992) 125,040 2,396 113,866 667,488 646,053 203,813
Note : Liquidity gap=assets matured in a specified period - liability matured in the same period
By the end of 2006, the Group’s gap of the on
demand bucket was negative and the gap
positions for the remaining periods were
positive. Since the demand deposits were 40%
of the total amount of deposits, the percentage
of current liability to total liability was high and
hence the gap of the on demand bucket was
negative. The above-mentioned negative gap
did not lead to significant liquidity requirement
because our demand deposits were very stable.
The balance of assets in the remaining periods
all exceeded the balance of liabilities with
positive gap position.
Internal Control and Operational Risk
Three Lines of Defense
In order to enhance the internal control function
and risk management in all respects, the Bank
reengineered its internal control processes and
established three lines of defense of internal
control.
Branches, business departments and staff at
various levels of the Bank take responsibility for
internal control when promoting business
development. The first line of defense is the
individual who implements the policies and
procedures. The objectives of internal control
are achieved through self-assessment, self-
checking, self-inspection, self-improvement and
self-training.
The Legal and Compliance department and the
business departments are responsible for
making overall plans for establishing internal
control policies, directing, examining,
monitoring and assessing the work of the first
line of defense, and playing the role of the
second line of defense. The second line of
defense aims at accomplishing the
standardization and regulation of internal
control management, and establishing an
internal control system integrating the elements
of training, early warning, prevention, rewards
and punishment.
The Internal Audit department is responsible for
reviewing and assessing the adequacy and
effectiveness of the Bank’s operating activities,
risk management, internal control and corporate
governance with a systematic and standard
methodology, and playing the role of the third
line of defense. The third line of defense aims at
assisting the Board and management to
perform their duties, providing assurance as to
the adherence to national economic and
financial laws, policies and regulatory rules and
regulations, and improving operating efficiency
and the effectiveness of risk control, so as to
increase the Bank’s value.
Operational Risk
Operational risk (OR) refers to the risk of losses
caused by inadequate or improper internal
processes, systems, issues in human resources
Bank of China Annual Report 200684
or external events. In 2006, the Bank primarily
commenced the following initiatives in
connection with OR management:
In order to improve the work of Operational Risk
Management (the “ORM”), the Bank cooperated
with RBS Group in the ORM project, and
formulated after conducting the relevant
research, the fundamental ORM rules based on
the circumstances of the Bank.
The Bank formulated the operational risk and
control assessment (the “RACA”) working
process and conducted its pilot testing, and
plans to roll out such processes in domestic
branches in 2007. These processes can help the
business lines being kept informed of the risk
profile and risk exposure by regularly
identifying and assessing the risks and controls
of the key business processes.
Meanwhile, the Bank started to study the
management process of the key risk indicators
in relation to operational risk, and commenced
the drafting of certain such indicators. It has
also initiated the monitoring of, and providing
guidances to the branches on ORM work.
The Bank tested the fulfillments of CBRC’s
Notice of Strengthening the Prevention
Measures Against Operational Risk, conducted
OR inspection on certain of the Bank’s
businesses, and took corrective actions timely to
rectify the problems identified in accordance
with the assessment and test results.
Internal Audit
As the third line of defense of the internal
control of the Bank, internal audit forms the
independent and objective confirmation and
consultation process of the Bank under the
leadership of the Board of Directors and the
Audit Committee. Based on the principle of
improving the operations of the Bank and
creating values, the risk-oriented internal audit
aims to assist the Board, the Audit Committee
and senior management in the performance of
their duties, and employs systematic and
standardized approaches to provide audit
services including audit confirmation, internal
control evaluation, consultation and anti-fraud
inspections to accomplish its goals.
In 2006, the Bank adopted a vertically integrated
management model in internal audit, whereby
the head office Internal Audit department
oversees the internal audit departments of the
branches subject to internal audit in respect of
human resources, finance and functions. The
audit work of the Bank was reported to the
Board or the Audit Committee authorized by the
Board, and to the management in respect of
administration issues.
Independence, Professionalism andAuthority of the Audit System
In 2006, the Audit Committee of the Board
engaged independent external institutions to
complete an overall evaluation on the audit
work of the Bank. By consolidating the
evaluation results and supervisory
requirements, and by referring to the
international standards and best practices of
internal audit, the Bank established a special
work team under the leadership of the Board,
the Audit Committee and senior management,
which studied and prepared a comprehensive
plan on the improvement of the internal audit
functions of the Bank including all aspects such
as organizational structure, management
systems, policies and procedures, and practices
and technologies, and steadily implemented the
plan according to the planned schedule upon
the approval of the Board. The Bank completed
the separation of inspection and audit functions
in the course of the year and established an
Management Discussion and Analysis 85
independent audit department, which clarified
its functions, reporting lines and organizational
structure. The department updated the audit
policies and set up a vertically integrated audit
management model. Meanwhile, in order to
meet the requirements of new audit functions in
terms of staff expertise, the Bank engaged
internal audit professionals of globally-known
accounting firms to provide special and
centralized training for more than 600 auditors
of the Bank. Through the above measures, the
Bank further strengthened the management of
internal audit in terms of its independence,
professionalism and authority.
Enhanced Depth and Breadth ofInternal Audit Inspection
Focusing on the target of continuously
improving the effectiveness of internal control,
the Bank has continued to further enhance the
depth of internal audit inspections focusing on
high-risk areas and the improvement of weak
internal controls in 2006. The Bank has
completed 5 internal audit projects at the head
office, 23 projects in tier one branches or
branches directly controlled by the head office
(coverage of 72%) and 12 projects at overseas
institutions or affiliated companies (coverage of
42%). Meanwhile, the Bank devoted most audit
resources to the internal control inspection of
grassroot operations, and has completed
regular internal audit at 254 tier two branches
(coverage of 88%), 2,171 sub-branches in urban
regions (coverage of 57%) and 3,228 sub-
branches in counties (coverage of 50%), 775
special audit projects, 1,132 audit projects of
former employees and senior management, and
83 investigations of individual cases.
Anti-money Laundering
In 2001, the Bank established the Anti-Money
Laundering Committee, which serves as the
highest decision making body on anti-money
laundering issues of the Group. According to
the provisions set forth in the Articles for the
Anti-Money Laundering Committee of the Bank,
the main functions of the committee are as
follows:
• To formulate the anti-money laundering
policy through discussion in response to
changes in the domestic and overseas
legal and policy environment as well as
development of trends in anti-money
laundering;
• To plan for anti-money laundering work,
recommend resolutions to major and
unexpected events, and supervise the
implementation of such plans.
Domestic and overseas branches of the Bank
have also established anti-money laundering
teams in charge of their respective work of anti-
money laundering under the leadership and
supervision of the Anti-Money Laundering
Committee.
To standardize the Group’s work on anti-money
laundering and to combat the financing of
terrorism, the Bank, based on the laws and
regulations on anti-money laundering in the
PRC has formulated the Policy of the Bank of
China Limited on Anti-Money Laundering and
Combating the Financing of Terrorism, which
adequately embodies the basic international
requirements of anti-money laundering and
combating financing of terrorism for financial
institutions. At the same time, the Bank

Bank of China Annual Report 200686
endeavored to increase the quality of data
acquisition through advanced technology, and
the upgrade and reconstruction of relevant IT
systems were carried out systematically to
further strengthen the Bank’s anti-money
laundering technology.
In full consideration of the relevant laws and
regulations of the country or region where the
Bank’s overseas branches are located, the Bank
has implemented risk evaluation of anti-money
laundering in overseas institutions during the
year to obtain comprehensive knowledge of
their progress in implementing anti-money
laundering measures. Based on the evaluation
results, the Bank has monitored and guided
these branches.
In respect of anti-money laundering, a relatively
comprehensive system has been established. A
comprehensive anti-money laundering
organizational structure has also been put in
place. The scale of the anti-money laundering
system basically meets the requirements of the
regulatory authority and our Bank on risk
control. The Bank has in all respects strictly
performed its obligations on anti-money
laundering.

Management Discussion and Analysis 87
Management Discussion and Analysis— Capital Management and Fund
Transfer Pricing
The Group’s capital management framework
mainly comprises three parts: capital adequacy
ratio (CAR) management, capital funding
management and economic capital allocation.
The primary objective of the Group’s capital
management is to keep the CAR at an
appropriate level, through necessary means of
capital funding management and economic
capital allocation.
Objective of Capital Management
The objective of the Group ’s capital
management is to ensure that the Group
maintains sufficient capital at an appropriate
level, meeting the requirements of all applicable
regulatory standards and guidelines, credit
rating agencies, risk compensation, and returns
to stockholders. In addition, through effective
allocation of capital, and capital investment
instruments, the Group strives to continuously
enhance its financial effectiveness, improve
capital value, and ultimately maximize
stockholders’ value while controlling risk.
CAR Management
CAR is the most important measure of a Bank’s
stabilization and capacity to withstand risks. In
order to fully safeguard against risk, the Group
establishes various target CAR levels. Firstly, at
no time should the minimum level of the
Group’s CAR level be less than the regulatory
required 8% level. Secondly, the Group
stipulates and maintains an operational target
range of CAR levels. Based on the risks faced by
the Group, the Group sets prudent level of CAR
as its operational target for routine
management, taking into consideration CAR
levels of international peers and the Group’s
operating situations.
The Group uses stress testing to forecast,
design and manage CAR level. The scenarios
involved in the stress testings take into account
business development, fluctuations in major risk
exposures, changes in exchange rates for
foreign currency capital contributions, and other
significant factors.
The Group calculates and discloses CAR level in
line with Regulation Governing Capital Adequacy
of Commercial Banks, promulgated by CBRC on
23 February 2004 (CBRC Order Issuance [2004]
No.2). The Group calculates market risk capital in
accordance with the Notice of CBRC General
Office on Release of Calculation Tables and Notes
for Market Risk Capital Requirements for
Commercial Banks (Yinjianfa [2004] No.374) from
2005. In 2006, the Group’s CAR level increased
significantly, largely as a result of the increase in
the Group’s core capital due to the Bank’s IPOs
on the Hong Kong and Shanghai stock
exchanges. The other reason is that the Group’s
foreign exchange exposure has reduced
substantially, and hence corresponding market
risk capital requirement decreased. At the end of
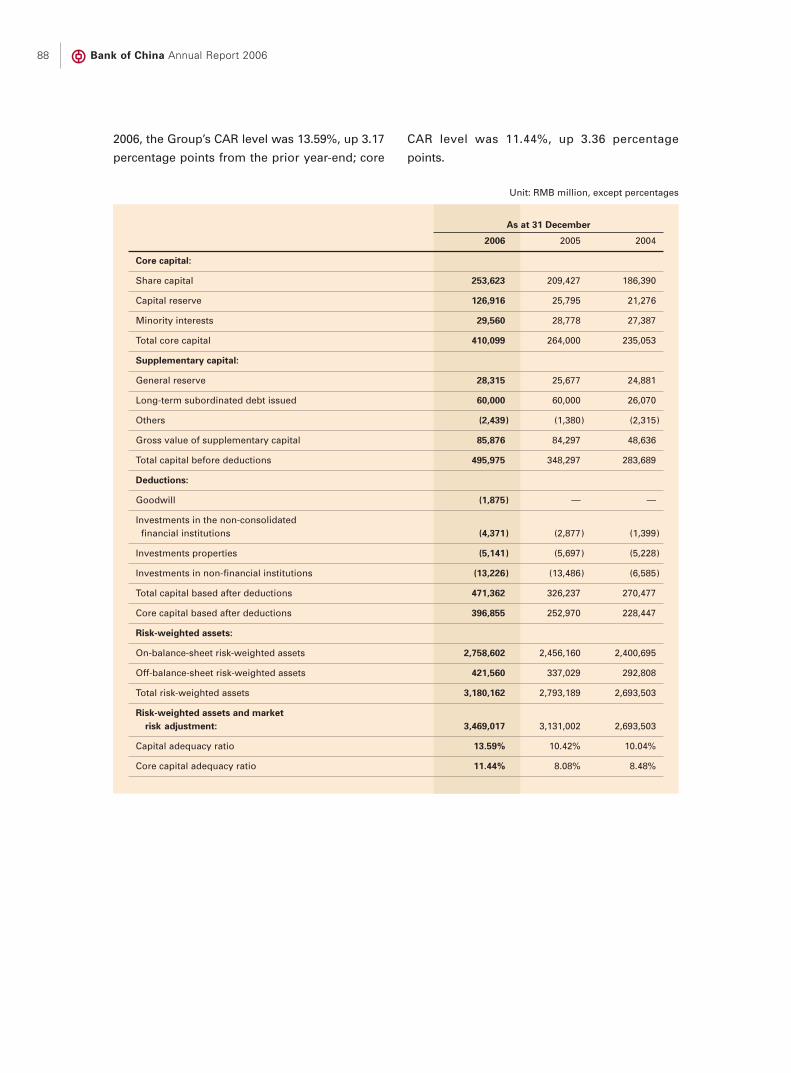
Bank of China Annual Report 200688
Unit: RMB million, except percentages
As at 31 December
2006 2005 2004
Core capital:
Share capital 253,623 209,427 186,390
Capital reserve 126,916 25,795 21,276
Minority interests 29,560 28,778 27,387
Total core capital 410,099 264,000 235,053
Supplementary capital:
General reserve 28,315 25,677 24,881
Long-term subordinated debt issued 60,000 60,000 26,070
Others (2,439) (1,380) (2,315)
Gross value of supplementary capital 85,876 84,297 48,636
Total capital before deductions 495,975 348,297 283,689
Deductions:
Goodwill (1,875) — —
Investments in the non-consolidated financial institutions (4,371) (2,877) (1,399)
Investments properties (5,141) (5,697) (5,228)
Investments in non-financial institutions (13,226) (13,486) (6,585)
Total capital based after deductions 471,362 326,237 270,477
Core capital based after deductions 396,855 252,970 228,447
Risk-weighted assets:
On-balance-sheet risk-weighted assets 2,758,602 2,456,160 2,400,695
Off-balance-sheet risk-weighted assets 421,560 337,029 292,808
Total risk-weighted assets 3,180,162 2,793,189 2,693,503
Risk-weighted assets and marketrisk adjustment: 3,469,017 3,131,002 2,693,503
Capital adequacy ratio 13.59% 10.42% 10.04%
Core capital adequacy ratio 11.44% 8.08% 8.48%
2006, the Group’s CAR level was 13.59%, up 3.17
percentage points from the prior year-end; core
CAR level was 11.44%, up 3.36 percentage
points.
Management Discussion and Analysis 89
Capital Funding Management
The primary objective of capital funding
management is to keep the Group’s CAR level
within the target range through timely and
proper capital funding management, with a
view to allowing the Group to operate on a
prudent basis. The objective should be fulfilled
through effective planning and management of
accounting capital, regulatory capital and
economic capital so as to fulfil requirements of
dividend payments, stabilization of share price,
management of CAR level, and economic
capital allocation.
The capital funding strategy stresses that capital
funding should be in compliance with
international practice and regulatory
requirements and with a view to broadening
capital replenishment channels, and enhancing
financial structure’s flexibility. In terms of its
implementation, the Group puts emphasis on
optimizing the capital structure to control cost of
capital funding. Effort is also put into currency-
optimization with the aim of minimizing
exchange rate risk, and reducing the impact of
RMB’s appreciation on the CAR level. It is also
important to enhance the maturity gap
matching of the Group’s assets and liabilities,
reducing liquidity risk and interest rate risk of
the Group.
Economic Capital Allocation
The Group developed its economic capital
allocation process on a trial basis for several
domestic branches in 2004. The Group formally
started to implement the process for all
domestic provincial branches in 2005. The
economic capital allocation process calculates
each branch’s relevant economic capital
requirements according to its risk-taking
activities, and measures risk-adjusted return on
capital (RAROC) and economic value added
(EVA) to assess each branch’s performance. The
formule of RAROC and EVA are as follows:
RAROC = Risk-adjusted Profits/
Economic Capital Charge x 100%
EVA = Risk-adjusted Profit
– Cost of Economic Capital
Cost of Economic Capital = Economic Capital
Charge x Hurdle Rate
In 2006, the Group designed and launched
BOCECA System, enabling the monitoring,
analyzing and assessing the economic capital
performance for the different level of domestic
operations. The risk type covered by economic
capital will be expanded from merely credit risk
into market risk and operational risk.
The primary objective of economic capital
allocation is to match returns with risks
undertaken. It is inappropriate to place
emphasis either on increasing income or on
controlling risk separately. Through calculation
and monitoring of economic capital
performance, management at different levels
raised awareness of cost of risk and cost of
capital, significantly enhanced the matching of
risks and rewards. Economic capital allocation
has not only enhanced the coverage ratio of
capital on risk exposures, but also enhanced the
returns on risk and capital.

Bank of China Annual Report 200690
Capital Management in the Future
The Bank streamlines the process of capital
management timely and continuously so as to
enhance its leading role in Banking
management.
In order to strengthen our capital base and
provide this as support for the sustainable
growth of our business, we will continue with
effective capital adequacy ratio management,
capital funding management and economic
capital allocation.
Fund Transfer Pricing
Fund transfer refers to all forms of internal fund
allocation among entities (including the Head
Office, domestic and overseas branches and
subsidiaries) within the Bank. In 2005, the Bank
adopted the concept and principle for
management by Fund Transfer Pricing (FTP) and
started to explore the use of FTP as a means to
optimize resources allocation, reduce operating
cost and increase returns. In 2006, the Bank
formulated The Guidance to BOC FTP, which
clarified the objectives, pricing mechanism and
transfer basis of FTP as well as the direction for
the Bank’s internal fund management. The
major objectives for the Bank’s FTP policies are
as follows:
(1) To centralize the management functions of
liquidity risks and market risks embedded
in the Banking book to the Head Office
Treasury so as to build a Bank-wide
“centralized funding pool” . By
incorporating interest rate risk factor into
the FTP price, it removes interest rate risks
in the Banking book from business units
(such as branches and departments) so
that these business units could make sure
that their profits are not affected by the
uncertainties caused by fluctuations in
interest rates and thus could concentrate
on their own operations. Through
centralizing the management of these risks
at the Head Office Treasury, the Head
Office Treasury will use hedging
instruments to control the risks effectively,
reducing the fluctuations of the Bank’s
profits caused by the uncertainties in
movements in market interest rates.
(2) To provide a benchmark for performance
evaluation by branch, department, product
and customer, and to provide a common
ground for product profitability
assessment so that objectivity could be
ensured in the process of profitability
comparison.
(3) To communicate to the branches’ and
business departments’ management in the
right way and provide correct guidance for
the operations of business units so that the
Bank could maintain continual growth.
In 2006, the Bank adopted the multiple terms
matching method for the FTP of the business
segments. In the meantime, currency and terms
matching fund support was provided to
overseas branches’ operation in respect of their
syndicated loan business. As a result, the new
FTP method helps to strengthen the Bank’s
asset and liability management as well as fund
management.

Management Discussion and Analysis 91
Management Discussion and Analysis— Organizational Information, Human
Resources Management and Development
Organizational Management
Organizational Information
At the end of 2006, the Bank had 11,241
domestic and overseas branches and outlets, a
reduction of 405 from the beginning of 2006.
There were 37 tier one branches, 283 tier two
branches and 10,277 outlets in domestic
operation, and 643 branches, subsidiaries and
representative offices in overseas operation.
The following table presents the geographic
breakdown of the domestic outlets by the end of
2006.
As at 31 December 2006Branches and outlets % of total
Northern China 1,625 15.3%
Northeastern China 931 8.8%
Eastern China 3,539 33.4%
Central and Southern China 2,856 26.9%
Western China 1,647 15.6%
Total 10,598 100.0%

Bank of China Annual Report 200692
Process Reengineering andOrganizational Restructuring
In 2006, the Bank actively pushed forward
process reengineering and organizational
restructuring. The Bank’s corporate and
personal loans were all centralized to the Head
Office and tier-one branches for approval.
Perceptible progress has been made in the
centralization of the functions of post
monitoring, clearing, finance management, cash
delivery, bill exchange, bill processing and
account reconciliation between companies and
the Bank. The internal control system was
reformed and improved with the establishment
of the three lines of defense, which included
function management, internal control and
compliance and internal audit to ensure the
adequacy and effectiveness of internal control.
The internal audit system started to exercise
vertical line management. CROs and CFOs were
dispatched to tier-one branches. The business
line management was further strengthened.
The Bank clarified the overall goal of business
structure and process reengineering. The
General Framework of Business Architecture
and Process Integration was formulated. It
stressed an intensive and centralized reform
direction, with the synchronized implementation
of IT blueprint and business process integration.
The Bank planned to realize its goals of a
customer-centered business and management
process, a bank-wide general ledger, logically
centralized business processing, strengthened
line management and enhanced product
innovation within two or three years.
The Bank pushed forward institutions
integration. In 2006, the Bank further adjusted
its branch network. Some small branches and
outlets with poor development potential were
closed. New branches and outlets were
established in key cities and areas, to optimize
and rationalize the Bank’s entire branch network
distribution.
Human Resources Management andDevelopment
The Bank recognizes that the key to a company’s
success is talented staff and regards its
employees as the fundamental driving force
behind a company’s growth and development.
Therefore, the Bank sticks to the principle of
“People First” to create every opportunity
possible for the staff to tap their talent, so that
everyone can do their best in a harmonious
environment. Bank of China strives to be the
best choice for employees to realize their dream
and actualize their value. Human resource
strategy as an important part of the Bank’s
overall development strategies plays an
important role in the Bank’s development.
The Staff Profile
At the end of 2006, the Bank had 232,6321
employees (including 40,620 dispatch
contractors working in domestic institutions), of
which 20,204 were local staff of overseas
branches and subsidiaries. By the end of 2006,
there were 7,278 retirees whose expenses
should be borne by the Bank.
1 The number is calculated according to the Chinese Accounting Standards.
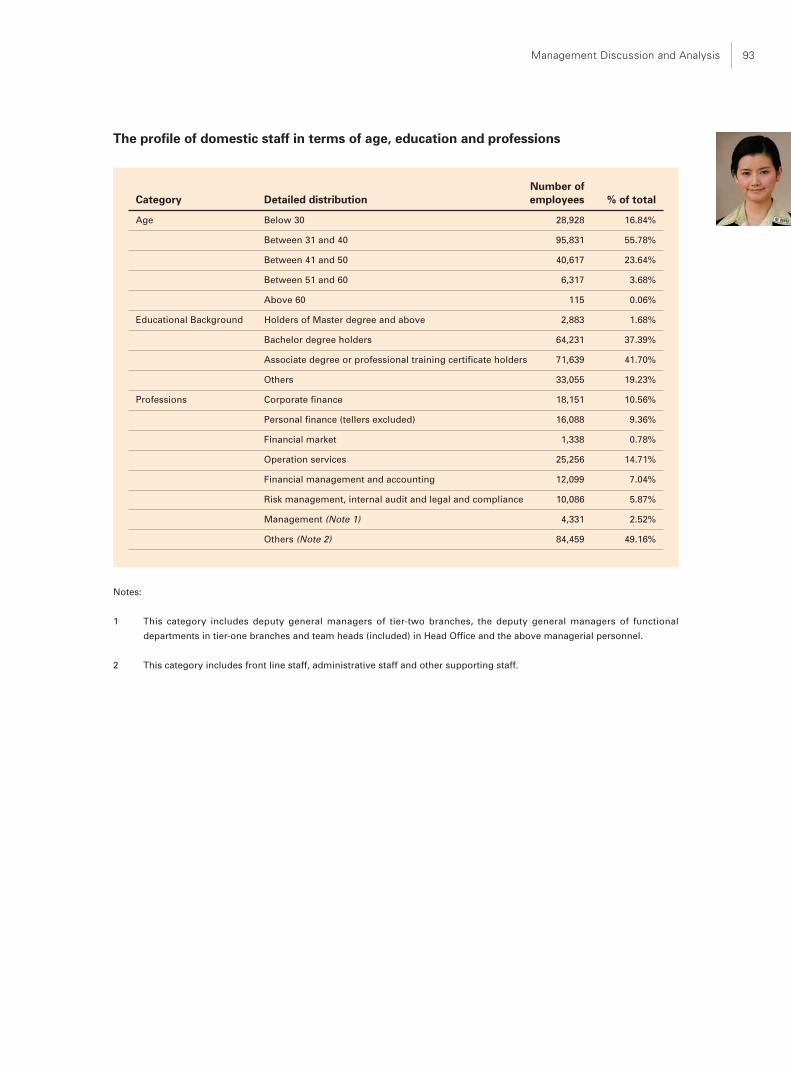
Management Discussion and Analysis 93
The profile of domestic staff in terms of age, education and professions
Number ofCategory Detailed distribution employees % of total
Age Below 30 28,928 16.84%
Between 31 and 40 95,831 55.78%
Between 41 and 50 40,617 23.64%
Between 51 and 60 6,317 3.68%
Above 60 115 0.06%
Educational Background Holders of Master degree and above 2,883 1.68%
Bachelor degree holders 64,231 37.39%
Associate degree or professional training certificate holders 71,639 41.70%
Others 33,055 19.23%
Professions Corporate finance 18,151 10.56%
Personal finance (tellers excluded) 16,088 9.36%
Financial market 1,338 0.78%
Operation services 25,256 14.71%
Financial management and accounting 12,099 7.04%
Risk management, internal audit and legal and compliance 10,086 5.87%
Management (Note 1) 4,331 2.52%
Others (Note 2) 84,459 49.16%
Notes:
1 This category includes deputy general managers of tier-two branches, the deputy general managers of functional
departments in tier-one branches and team heads (included) in Head Office and the above managerial personnel.
2 This category includes front line staff, administrative staff and other supporting staff.
Bank of China Annual Report 200694
Deepening Human ResourcesManagement Reform and ImprovingIncentive and AccountabilityMechanism
In 2006, the Bank further improved the market-
based human resources management
mechanism, which is in line with a modern
commercial bank’s operation.
Pursuant to its development needs and business
strategy, the Bank has taken steps to establish a
position-based, performance-oriented human
resources mechanism. For domestic institutions,
the Bank established a new position
classification system and staff recruitment
policies, adopted the practice of competition-
based appointments, strengthened staff
allocation and structural adjustment,
streamlined the new employees recruitment
standards, centralized staff recruitment, and
fostered the specialized human resources
practitioners’ development.
The Bank continued to improve its performance
management by establishing and implementing
a staff performance management system
focused on “Balanced Score Card” and
“Performance Process Management”.
Performance evaluation, which had relied solely
on post-appraisal and results grading, was
virtually changed to an all-round, full process
based performance management system. A
sound performance management culture is
being built up, which contributes to represent
the Bank’s core value of “Performance Led,
Effective Incentive, Value Creation and
Sustainable Development”.
Steadily pushing forward the remuneration
management reform. The enterprise annuity
plan was widely deployed, which further
improved the staff welfare scheme.
Strengthening Employee Training
In 2006, sticking to the theme of “fully
implementing the scientific approach of
development and persistently building a labor
force characterized by honesty, creditworthiness,
professionalism, innovation and collaboration”,
the Bank developed a set of training plans for all
levels of employees, such as middle and senior
managerial personnel, core talents and front line
staff, to strengthen the development of three
types of employees, namely managerial
personnel, professionals and operational staff.
The Bank attached great importance to the
development of middle and senior managerial
personnel by developing leadership models,
establishing rudimentary, intermediate and
advanced leadership courses, actively
cooperating with our strategic investors and
introducing RBS Group senior management
programs, cooperating with Harvard Business
School to develop the leadership programs for
our senior management, and organizing core
EMBA courses to upgrade the training for all
levels of managerial personnel.
The Bank also placed emphasis on the training
of front line staff by way of, in light of its
business strategy, organizing various technical
and professional training programs to
strengthen the development of core talents and
front line staff. The Bank prioritized the
nurturing of risk management professionals,
personal wealth management managers and
corporate customer managers. The Bank also
organized group-wide training and tests for
front line employees, such as fully-skilled tellers,
customer service managers, wealth managers
and outlet managers, and the test pass rate
Management Discussion and Analysis 95
reached 97.9%. To support the building of
compliance and internal control mechanisms,
the Bank established compliance testing
questions pool and organized the second round
of legal and compliance testing on all
employees, in which over 200, 000 employees
took part, and the pass rate was 99.25%.
In China Financial Education Development
Fund’s appraisal of research results of the year
2006, the Bank won three awards for its
achievements in training and development:
“Bank of China’s e-training system” was
awarded the first prize in the distance education
category; “Bank of China’s series training
materials for front line staff” was awarded the
second prize for the publication category; and
“commercial bank’s marketing training
materials” received the excellent publication
prize.
Strengthening Our Corporate Culture
The Bank realizes that a strong and healthy
corporate culture is essential for corporate
survival and development. In 2006, the Bank
devoted itself to further building its corporate
culture. On the basis of the cultural essence
emanated from the Bank’s century-old history,
the Bank further developed the underlying
connotations and concept of its corporate
culture in an innovative manner. The Bank
further refined its corporate culture of “the
pursuit of excellence“ and distilled its distinctive
century-old core values into “honesty and
integrity, drive for performance, accountability,
creativity and harmoniousness”.
In 2007, the Bank will gradually intensify the
promotion of its corporate culture of “the
pursuit of excellence” and entrench its core
values of “honesty and integrity, drive for
performance, accountability, creativity and
harmoniousness”. We will integrate these core
values into the Bank‘s business process and
management structure and the building of its IT
Blueprint. Guided by the core values, the Bank
will continuously inspire the creativeness and
enthusiasm of its employees, enhance internal
cohesiveness and the sense of recognition, and
establish a reliable credit standing as well as an
excellent image for its brand name.
Management Discussion and Analysis— Cooperation with Strategic Investors
Bank of China Annual Report 200696
In 2006, the Bank deepened cooperation with its
strategic investors — RBS Group, AFH, UBS and
ADB, who have played an important role both in
expanding the Bank’s business and improving
its corporate governance.
Overview
In 2006, the Bank and RBS Group held 4 joint
steering committee meetings. RBS Group has
totally seconded 47 experts in 7 successive
groups to the Bank. RBS Group has provided
trainings for about 500 BOC staff coming from
the Head Office as well as domestic and
overseas branches, covering such major fields
as credit risk, operational risk, market risk,
financial management, project finance, wealth
management and credit card. The Bank has also
established joint steering committee with UBS
who seconded totally 3 experts to the Bank.
Corporate Banking Business
The Bank actively promoted its cooperation with
RBS Group and achieved notable progress in
the fields of aircraft financing, shipping
financing, syndicated loans, supply chain
financing, customer referral and business
training. In 2006, the Bank successfully worked
together with RBS Group in several large-scale
projects both in domestic and overseas markets,
improving its capability to provide high-end
financial products and services to preferred
corporate clients. The cooperative project of
Shipping Debt Deal of Shanghai Time Shipping
Co., Ltd. was granted the honour of Shipping
Debt Deal of the Year — Asia in 2006 by Jane’s
in Britain. The Bank held seminars on supply
chain financing with RBS Group to discuss
feasible business solutions. Customer referral
arrangements were made between the Bank
and RBS Group, including its US subsidiary
Citizens Bank. The Bank learned from Asia
Financial (Holdings) the experience of small
business financing. It was in the process of
forming its own service model for small
business. Meanwhile, the Bank worked together
with strategic investors in optimisation of
corporate banking organizational structure,
business process reengineering and training in
high-end and sophisticated financing products.
Management capability was further enhanced.
The cooperation with UBS included successful
referral and investment in a number of IPOs
UBS led and assistance in the acquisition of
SALE.
Personal Banking Business
The Bank’s cooperation with RBS Group
proceeded in setting up a card Business Unit
(the “BU”). The BU’s Management Committee
has been established, and started to direct the
BU’s founding and development. Senior
Managers of the Bank Card Center have been
appointed. The Bank is considering expanding
the cooperation scope with RBS Group to the
credit card business, the quasi credit card
business and the acquiring services. Both sides
have made a 2007–2011 Credit Card Finance
Plan, and have jointly developed Internal
Scoring Card System, and established the
mechanism of risk budgeting and the
monitoring of risk profile. In addition, according
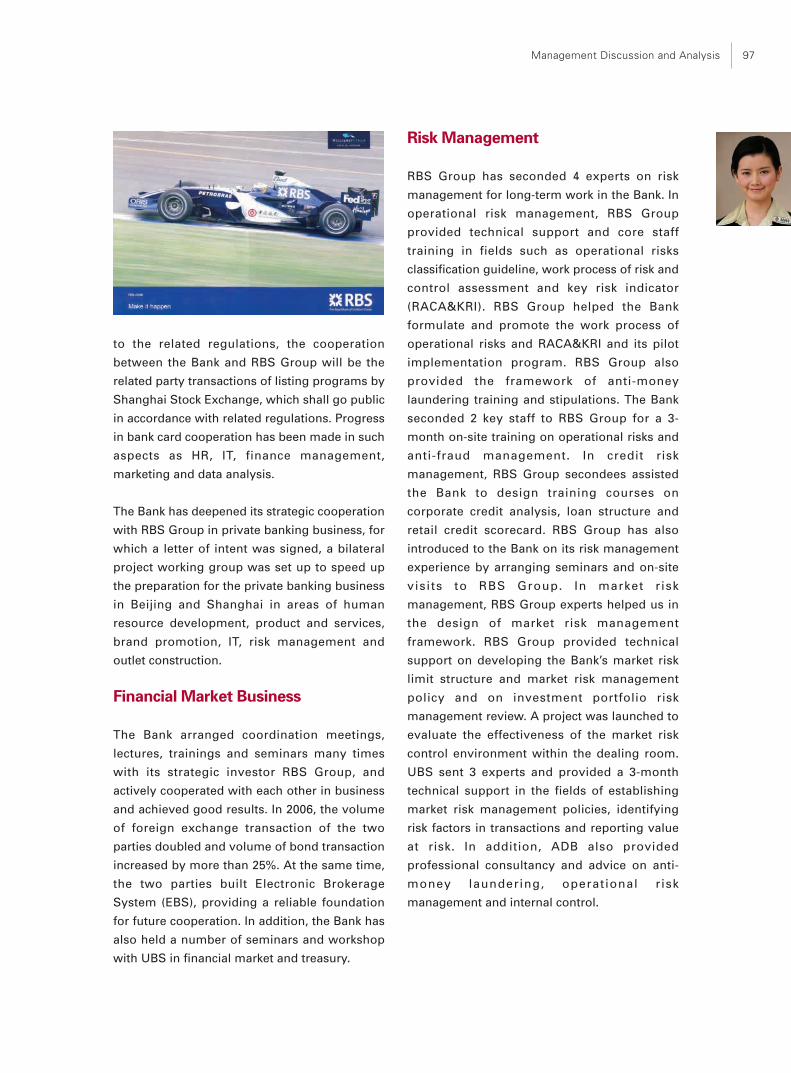
Management Discussion and Analysis 97
to the related regulations, the cooperation
between the Bank and RBS Group will be the
related party transactions of listing programs by
Shanghai Stock Exchange, which shall go public
in accordance with related regulations. Progress
in bank card cooperation has been made in such
aspects as HR, IT, finance management,
marketing and data analysis.
The Bank has deepened its strategic cooperation
with RBS Group in private banking business, for
which a letter of intent was signed, a bilateral
project working group was set up to speed up
the preparation for the private banking business
in Beijing and Shanghai in areas of human
resource development, product and services,
brand promotion, IT, risk management and
outlet construction.
Financial Market Business
The Bank arranged coordination meetings,
lectures, trainings and seminars many times
with its strategic investor RBS Group, and
actively cooperated with each other in business
and achieved good results. In 2006, the volume
of foreign exchange transaction of the two
parties doubled and volume of bond transaction
increased by more than 25%. At the same time,
the two parties built Electronic Brokerage
System (EBS), providing a reliable foundation
for future cooperation. In addition, the Bank has
also held a number of seminars and workshop
with UBS in financial market and treasury.
Risk Management
RBS Group has seconded 4 experts on risk
management for long-term work in the Bank. In
operational risk management, RBS Group
provided technical support and core staff
training in fields such as operational risks
classification guideline, work process of risk and
control assessment and key risk indicator
(RACA&KRI). RBS Group helped the Bank
formulate and promote the work process of
operational risks and RACA&KRI and its pilot
implementation program. RBS Group also
provided the framework of anti-money
laundering training and stipulations. The Bank
seconded 2 key staff to RBS Group for a 3-
month on-site training on operational risks and
anti-fraud management. In credit risk
management, RBS Group secondees assisted
the Bank to design training courses on
corporate credit analysis, loan structure and
retail credit scorecard. RBS Group has also
introduced to the Bank on its risk management
experience by arranging seminars and on-site
visits to RBS Group. In market risk
management, RBS Group experts helped us in
the design of market risk management
framework. RBS Group provided technical
support on developing the Bank’s market risk
limit structure and market risk management
policy and on investment portfolio risk
management review. A project was launched to
evaluate the effectiveness of the market risk
control environment within the dealing room.
UBS sent 3 experts and provided a 3-month
technical support in the fields of establishing
market risk management policies, identifying
risk factors in transactions and reporting value
at risk. In addition, ADB also provided
professional consultancy and advice on anti-
money laundering, operational risk
management and internal control.
Bank of China Annual Report 200698
Treasury and Capital Management
The Bank has reviewed and learned from the
practices adopted by RBS Group in the fields of
internal funds transfer, treasury, planning,
budgeting and product pricing. Accordingly, the
Bank developed The Guidance to BOC FTP
Objectives System and its implementation plan.
UBS has introduced to the Bank on its practices
and experience on treasury management,
interest rate risk management, liquidity
management, fund raising management, group
treasury and funding management etc.
Human Resources and ProcessIntegration
The Bank carried out cooperation with RBS
Group in the fields of leadership modeling,
leadership development, human resources
shared service, human capital management and
business architecture. RBS Group experts
provided consultancy and advices to the Bank
on developing leadership models. The Bank
sent 8 senior managers to take the leadership
program co-developed by RBS Group and
Harvard University. With the assistance of RBS
Group, the Bank reached an agreement with
Harvard Business School to co-develop training
programs. With the support of RBS Group, the
Bank carried out a full-scope review on the
management structure and mechanisms of RBS
Group and on which the Bank will draw
reference for process integration and
organization restructuring.
Information Technology
RBS Group consecutively assigned 3 teams of
personnel (totaling 18 person-time) to provide
assistance for the Bank on its Core Banking
System (CBS) project, including sending an
evaluation team of experts to offer on-site
assistance on CBS package selection,
introducing on CBS and related application
systems, and sharing experience on IT system
development. In 2006, the Bank also assigned 2
senior managers from IT Department and
Information Center to RBS Group IT
departments for a 3-month training program.
Management Discussion and Analysis 99
Management Discussion and Analysis— Corporate Honors and Responsibilities
Recognition in the Market
In 2006, the Bank received wide recognition on
its performance from well-known media both at
home and abroad. The awards covered many
areas including banking business and
management systems.
Emerging MarketsBanking Achievement of the Year
The Banker
Ranked 17th among the “Top 1,000 World
Banks”
Global FinanceBest Foreign Exchange Bank-China
Best Trade Finance Bank-China
The Asset2006 Triple A Best Cash Management Bank in
China, Best Trade Finance Bank in China
Asia RiskHouse of the Year China
FortuneRanked 255 in Fortune’s “Global 500”
China’s Most Admired Company (Chinese
Version)
Asia MoneyBest Local Cash Management Bank in China
voted by large corporations in China
Asian Legal BusinessBanking & Financial Services In-House Team of
the Year (the only awarded domestic financial
institution)
UniversumIdeal Employer for Chinese College Students
(awarded for the second time)
21st Century Business HeraldBest International Business in Asian Banks
Investors RelationsBest IR for a Corporate Transaction
Best IR for an IPO in the Hong Kong Market

Bank of China Annual Report 2006100
14th China International Financial(Banking) Technology & EquipmentExhibitionFinancial Business Innovation (Cybertariff)
Charity and Community Initiatives
Aiming at building a harmonious society, the
Bank is committed to its social responsibilities
and reciprocates to the society in various ways.
Over the years, the Bank has made its own
contributions in poverty alleviation, disaster
relief, aiding the disabled and vulnerable groups
and sponsorship of cultural and sports activities.
Poverty reduction and disaster relief In 2006,
the Bank sent its poverty alleviation work team
to Xian Yang in Shanxi Province for the
consecutive fourth year. The team spared no
efforts to help the people in poverty-stricken
areas and completed infrastructure programs
including drinking water projects. They also
built and reconstructed a number of middle and
primary schools and provided assistance to 100
children lacking education opportunity and 30
college students in financial difficulty. With all
these measures, the living conditions of the
local people and backwardness in education
were greatly improved. Their efforts won high
appraisal from local people.
Donation for disaster-stricken regions In 2006,
the Bank provided over a million of RMB funds
to typhoon-affected Zhejiang and Guangdong
Provinces and earthquake-affected Kashe area
in Xinjiang Uigur Autonomous Region as well
as other regions heavily struck by natural
disasters. Donations showing care and help
from the Bank staff were made to help people in
these regions to return to normal state of work
and carry out reconstruction after the disasters.
Sponsorship of China Children and Teenagers
Fund Among the first to join the “collection
box of affection” program launched by the
China Children and Teenagers Fund, as of the
end of 2006, the Bank has established over 1,700
collection boxes and collected over 1 million
RMB funds for the China Children and
Teenagers Fund. The Bank was thus conferred
the honorary title of “The Best Unit of Children
Affection” by the Fund.
Culture and Education
Launch of college education loans In 2006, the
Bank continued to extend the education loan to
all 115 colleges and universities affiliated to the
Ministry of Education, and provided financial
support to students suffering financial difficulty
to help them finish their college education.
Since the launch of the college education loans,
the Bank has made 17.9 billion RMB loans

Management Discussion and Analysis 101
accumulatively and the balance for education
loans has exceeded 6.95 billion RMB by the end
of 2006.
The Bank established the Tan Kah Kee Science
Award Foundation jointly with the Chinese
Academy of Sciences, awarding top Chinese
scientists for their outstanding scientific
achievements. The Foundation set up awards in
five areas: science (including mathematics,
physics, mechanics and astronomy), chemistry,
life science (including biology, medicine and
agriculture), geoscience and technology science,
which are awarded every two years. In 2006, the
Foundation awarded the winners for the first
time, obtaining very positive feedbacks and
promoting the scientific and technological
development in China.
Provide Financial Services for SportsEvents
In February 2006, as the 2008 Beijing Olympics
official banking partner, the Bank established
on-site financial service work team during the
Torino Winter Olympics at the request of
BOCOG and General Administration of Sport of
China, and provided comprehensive financial
services to the Chinese delegation and BOCOG.
In December 2006, the Bank sent its work team
to Doha in Qatar to provide on-site financial
services to the Chinese delegation during the
15th Asian Games.
In 2006, the Bank organized a number of
Olympic theme activities, such as “Long-
distance Walk with Beijing Citizens to Welcome
Olympics” in Beijing, “True Understanding,
Sincere Care-Bank of China Welcomes the
Paralytics and with You” in Tianjin, and “Bank of
China Olympic Festival” in Hangzhou. These
activities have led local people to a better
understanding of and the participation in
Olympics.
In 2006, the Bank sponsored various sports
activities. It sponsored after its name the FIG
2006 World Cup Gymnastics in Shanghai. In
August 2006, the Bank sponsored “Goodluck
Beijing” ISF XI Women’s Fast Pitch World
Championship in Beijing as well as the
“Goodluck Beijing” 2006 Qingdao International
Regatta, and provided on-site financial services
for the two events.

Changes in Share Capital andShareholdings of SubstantialShareholders
Bank of China Annual Report 2006102
Changes in Share Capital during the Reporting PeriodUnit: Share
1 January 2006 Increase/decrease during the reporting period 31 December 2006Issue of
Number shares Issue of Issue of Numberof shares % before IPO H Shares A Shares Others Sub-total of shares %
I. Shares subject to sellingrestriction 173,487,740,209 68.34%1. State-owned shares
(promoters’ shares) 174,128,718,217 83.15% (2,803,313,477) (2,803,313,477) 171,325,404,740 67.49%2. Shares held by state-owned
legal persons 8,514,415,652 (8,514,415,652) —3. Shares held by other
domestic investors 3,038,959,000 (876,623,531) 2,162,335,469 2,162,335,469 0.85%Incl.:Shares held by domestic
legal personsShares held by domestic
natural persons4. Shares held by foreign
investors 35,298,644,140 16.85% (35,298,644,140) (35,298,644,140)Incl.:Shares held by overseas
legal persons 35,298,644,140 16.85% (35,298,644,140) (35,298,644,140)Shares held by overseas
natural personsII. Shares not subject to selling
restriction 80,351,421,800 31.66%1. RMB-denominated ordinary
shares 3,454,547,000 876,623,531 4,331,170,531 4,331,170,531 1.71%2. Domestically listed foreign
shares3. Overseas listed foreign
shares 29,403,878,000 46,616,373,269 76,020,251,269 76,020,251,269 29.95%4. Others
III. Total 209,427,362,357 100.00% 8,514,415,652 29,403,878,000 6,493,506,000 — 44,411,799,652 253,839,162,009 100.00%
Notes:
1 The Bank issued 8,514,415,652 ordinary shares toNCSSF on 13 March 2006.
2 On 1 June 2006, the Bank completed a successfulinitial public offering of 25,568,590,000 H Shares andwas listed on the Hong Kong Stock Exchange. On 9June 2006, pursuant to the exercise of the over-allotment option, 3,835,288,000 H Shares were furtherissued, thereby issuing in aggregate a total of29,403,878,000 H shares. During the offering andlisting of H Shares, 35,298,644,140 unlisted foreignshares held by overseas strategic investors of theBank, 8,514,415,652 ordinary shares held by NCSSF,and 2,803,313,477 ordinary shares transferred by thepromoter — Huijin to NCSSF according to stateprovisions were all converted into H Shares andbecame listed on the Hong Kong Stock Exchange.
3 In June 2006, 6,493,506,000 A Shares were offered tothe public. On 29 June 2006, the A shares offered tothe public by the Bank and 171,325,404,740 ordinary
shares held by the promoter — Huijin were registeredas A shares. On 5 July 2006, the Bank’s A Shares werelisted on the Shanghai Stock Exchange. Of the AShares offered, 1,285,712,000 shares were placed to 14strategic investors with a lock-up period of eighteenmonths, 876,623,531 shares were placed with a lock-up period of three months and 876,623,469 shareswith a lock-up period of six months to the offlineinvestors, and 3,454,547,000 shares were not subjectto selling restriction. The shares placed to offlineinvestors have been unfrozen and allowed to betradable on the stock exchange on 5 October 2006 and5 January 2007 respectively.
4 By the end of 2006, the Bank has issued253,839,162,009 shares, including 177,818,910,740 AShares and 76,020,251,269 H Shares.
5 “Selling restriction” in the above-mentioned tablerefers to A Shares issued by the Bank only.
6 In the reporting period, the Bank has not issued bonusshares or transferred shares from the surplus reserve.

Changes in Share Capital and Shareholdings of Substantial Shareholders 103
Shareholder Information in theReport Period
Number of Shareholders andShareholdings
Issue and Listing of Shares
The Bank successfully floated H Shares on the
Hong Kong Stock Exchange on 1 June 2006,
including 25,568,590,000 shares issued in the
IPO and 3,835,288,000 shares issued pursuant to
the exercise of the over-allotment option on 9
June 2006. The number of H Shares issued, at
an offer price of HKD2.95 per share, accounted
for 11.89% of the Bank’s total equity after the
offering. The Bank raised approximately
HKD86.7 billion in the offering. Thereafter, the
Bank successfully offered A Shares from 19 to
23 June 2006, at an issue price of RMB3.08 per
share and was listed on Shanghai Stock
Exchange on 5 July 2006. 6,493,506,000 A
Shares were issued in the IPO, accounting for
approximately 2.56% of the fully diluted total
equity. Approximately RMB20 billion was raised
in the offering.
The IPOs of H Shares and A Shares accounted
for 14.14% of the total enlarged share capital of
the Bank. After the IPOs, the share capital of the
Bank increased to RMB253,839,162,009 or
253,839,162,009 shares.
Issue of Subordinated Bonds and Use ofProceeds
For the issue of subordinated bonds, please
refer to Note V.29 to the Financial Statements.
The purpose of the Bank’s issue of the
subordinated bonds was to effectively mitigate
liquidity risk and optimize the maturity structure
of assets and liabilities. The Bank plans to utilize
the long-term funds raised by the issuance to
grant long and medium-term loans, especially
those relating to high-quality infrastructure
construction projects. During the reporting
period, the Bank has not issued subordinated
bonds.
Shareholder Information at the End of theReport Period
As at 31 December 2006, the Bank had 846,127
shareholders of which, there were 378,972
holders of H Shares and 467,155 holders of A
Shares.

Bank of China Annual Report 2006104
Shareholdings
Trading Schedule of A Shares subject to selling restriction
Unit: Share
Number of shares Remainingallowed to be Remaining shares not
tradable at the shares subject subject tomaturity of to selling selling
Date lock-up period restriction restriction Remarks
5 January 2007 876,623,469 172,611,116,740 5,207,794,000 Shares placed to offlineinstitutional investors (witha lock-up period of 6months) were unfrozen
5 January 2008 1,285,712,000 171,325,404,740 6,493,506,000 Shares placed to strategicinvestors (with a lock-upperiod of 18 months) willbe unfrozen
5 July 2009 171,325,404,740 — 177,818,910,740 Commitment of the company
Note: Huijin undertook that within three years of the Bank’s A Shares listing, it would not transfer the A Shares of the Bank
directly or indirectly held by itself or entrust other persons to manage the shares, nor would it allow the Bank to
repurchase such shares, with the exception of those allowed to be converted into H Shares following approval of the
China Securities Regulatory Commission and other authorised securities approval authority of the State Council. Any
withdrawal of Huijin’s shares that are deposited with the China Securities Depository and Clearing Corporation Limited
and the re-registration of such shares as H Shares would not affect any pre-existing restrictions on the sale or transfer
applicable to Huijin’s shares.

Changes in Share Capital and Shareholdings of Substantial Shareholders 105
Number of shares subject to selling restriction held by top 10 shareholders and the selling restriction
as at 31 December 2006
Unit: Share
Number ofshares subject Number of new
to selling Time for shares available SellingNo. Name of shareholder restriction trading for trading restriction
1 Central SAFE Investments 171,325,404,740 5 July 2009 171,325,404,740 Commitment ofLimited the company
2 China Life Insurance 144,559,043 See Note See Note Lock-up period(Group) Company — below belowTraditional — Ordinaryinsurance products
3 China Life Insurance 123,376,000 5 January 2008 123,376,000 Lock-up periodCompany Limited —Traditional — Ordinaryinsurance products— 005L-CT001 SH
4 State Development & 90,909,000 5 January 2008 90,909,000 Lock-up periodInvestment Corp.
4 Baosteel Group Co., Ltd 90,909,000 5 January 2008 90,909,000 Lock-up period4 China Southern Power Grid
Co., Ltd 90,909,000 5 January 2008 90,909,000 Lock-up period4 China Huaneng Group 90,909,000 5 January 2008 90,909,000 Lock-up period4 Chinese People Property 90,909,000 5 January 2008 90,909,000 Lock-up period
Insurance CompanyLimited — Traditional —Ordinary insuranceproducts —008C-CT001 SH
4 China Reinsurance (Group) 90,909,000 5 January 2008 90,909,000 Lock-up periodCompany — Group level— Fund owned by theGroup — 007G-ZY001 SH
4 CNOOC 90,909,000 5 January 2008 90,909,000 Lock-up period4 Ping An Life Insurance 90,909,000 5 January 2008 90,909,000 Lock-up period
Company of China —Traditional — Ordinaryinsurance products
4 Shenhua Group Co., Ltd 90,909,000 5 January 2008 90,909,000 Lock-up period4 China National Aviation 90,909,000 5 January 2008 90,909,000 Lock-up period
Holding Company4 China Aluminum Corporation 90,909,000 5 January 2008 90,909,000 Lock-up period
Note: Among the 144,559,043 shares held by China Life Insurance (Group) Company — Traditional — Ordinary insurance
products, 47,157,043 shares have been unfrozen and available for trading on the market on 5 January 2007, the remaining
97,402,000 will be unfrozen and available for trading on the market on 5 January 2008.

Bank of China Annual Report 2006106
Top ten shareholders as at 31 December 2006Unit: Share
ProportionType of Type of Number of in total share
No. Name of shareholder Shareholder shares shares held capital
1 Central SAFE Investments Limited State-owned A 171,325,404,740 67.49%2 HKSCC Nominees Limited Foreign H 30,262,318,674 11.92%3 RBS China Investments S.à.r.l. Foreign H 20,942,736,236 8.25%4 Asia Financial Holdings Pte. Ltd Foreign H 10,471,368,118 4.13%5 National Council for Social Security Fund, PRC State-owned H 8,377,341,329 3.30%6 UBS AG Foreign H 3,377,860,684 1.33%7 Asian Development Bank Foreign H 506,679,102 0.20%8 The Bank of Tokyo-Mitsubishi UFJ Ltd Foreign H 473,052,000 0.19%9 Wingreat International Limited Foreign H 420,490,000 0.17%10 Best Sense Investments Limited Foreign H 236,526,000 0.09%10 Turbo Top Limited Foreign H 236,526,000 0.09%
The number of shares held by H share shareholders was recorded in the Register of Members as
kept by the H Share Registrar of the Bank as at 31 December 2006.
The Bank is not aware of whether the shares held by the aforesaid shareholders have been pledged
or frozen, nor is the Bank aware of the existence of connected relations among the above-mentioned
shareholders.
Top ten shareholders of A Shares not subject to selling restriction as at 31 December 2006Unit: Share
Number ofshares notsubject to
selling Type ofNo. Name of shareholder restriction shares
1 ICBC — Southern Securities Investment Fund for Stocks with 210,000,000 AGood Performance and Growth
2 Agricultural Bank of China — Jingshun Great Wall Domestic 96,629,963 ADemand Growth No. 2 Stock Securities Investment Fund
3 ICBC — Lion Value Growth Stock Securities Investment Fund 73,469,700 A4 IFC — Standard Chartered — CITIGROUP GLOBAL MARKETS LIMITED 62,858,475 A5 ICBC — SSE 50 Trading Open-end Index Securities Investment Fund 49,869,579 A6 ICBC — E Fund Value Selective Stock Securities Investment Fund 42,000,000 A7 China Pacific Life Insurance Co., Ltd — traditional — 35,179,154 A
ordinary insurance products8 Tiance Investment Management and Consulting (Shanghai) Co., Ltd 31,575,159 A9 China Life Insurance Company Limited — traditional — 27,058,100 A
ordinary insurance products — 005L-CT001 SH10 Xinghe Securities Investment Fund 25,843,028 A
Some of the above shareholders are managed by the same legal entity. Save for that, the Bank is not
aware of any connected relations and concerted action among the above-mentioned shareholders.

Changes in Share Capital and Shareholdings of Substantial Shareholders 107
Substantial Interest in Share Capital
The register maintained by the Bank pursuant to section 336 of the SFO recorded that, as at 31
December 2006, the following corporations had the following interests (as defined in the SFO) in the
Bank set opposite their respective names:
PercentagePercentage Percentage of total
of total of total issuedNumber of Type of issued issued share
Name of Shareholder shares held shares A Shares H Shares capital Capacity
Central SAFE Investments 171,325,404,740 A 96.35% — 67.49% Beneficial ownerLimited
The Royal Bank of Scotland 20,944,789,236 H — 27.55% 8.25% Attributable interest &Group PLC1 beneficial owner
RBS CI Limited1 20,942,736,236 H — 27.54% 8.25% Attributable interest &beneficial owner
RBS China Investments S.à.r.l. 20,942,736,236 H — 27.54% 8.25% Beneficial ownerTemasek Holdings (Private) 11,792,559,118 H — 15.51% 4.65% Attributable interest
Limited2
National Council for Social 11,317,729,129 H — 14.89% 4.46% Beneficial ownerSecurity Fund
UBS AG 4,582,523,525 H — 6.03% 1.81% Attributable interest,1,084,612,402 (S)3 1.43% 0.43% beneficial owner &
person having asecurity interestin shares
Notes:
1 The Royal Bank of Scotland Group PLC (“RBS Group”) holds the entire issued share capital of RBS CI Limited, which in
turn holds 51.61% of RBS China Investments S.à.r.l. (“RBS China”). Accordingly, RBS Group and RBS CI Limited are
deemed to have the same interests in the Bank as RBS China for the purpose of the SFO.
2 Temasek Holdings (Private) Limited (“Temasek”) holds the entire issued share capital of Fullerton Management Pte Ltd,
which in turn holds the entire issued share capital of Asia Financial Holdings Pte Ltd. Accordingly, for the purpose of the
SFO, Temasek and Fullerton Management Pte Ltd are deemed to have the same interests in the Bank as Asia Financial
Holdings Pte Ltd, which has an interest in 11,785,825,118 shares of the Bank.
3 “S” denotes short positions.
All the interests stated above represented long positions except stated otherwise. Save as disclosed
above, as at 31 December 2006, no other interests or short positions were recorded in the register
maintained by the Bank under section 336 of the SFO.
The Controlling Shareholder of the Bank
Central SAFE Investments Limited (“Huijin”)
Huijin is a wholly state-owned company with limited liability. Established on 16 December 2003, the
company has a registered capital of RMB372.465 billion and paid-in capital of RMB496.6125 billion.
Its legal representative is Hu Xiaolian. On behalf of the state, Huijin performs the rights and
obligations as an investor in the Bank, and implements the equity investment subject to the approval
of the State Council and policies and arrangement relating to the state’s reform of state-owned
financial institutions. Huijin does not engage in other business activities.


Directors, Supervisors and SeniorManagement
Bank of China Annual Report 2006110
Basic Information
Total amount of Whether alsopre-tax compensated by
compensation a controllingreceived from shareholder
the company in company orthe report period other associated
Name Age Gender Position Term of office (RMB thousand) companies
XIAO Gang 48 Male Chairman From August 2004 to 1,523.770 YesAugust 2007
LI Lihui 54 Male Vice Chairman From August 2004 to 1,528.657 Yesand President August 2007
ZHANG Jinghua 50 Male Non-Executive From August 2004 to — YesDirector August 2007
YU Erniu 57 Male Non-Executive From August 2004 to — YesDirector August 2007
ZHU Yan 50 Female Non-Executive From August 2004 to — YesDirector August 2007
ZHANG Xinze 60 Male Non-Executive From August 2004 to — YesDirector August 2007
HONG Zhihua 54 Female Non-Executive From August 2004 to — YesDirector August 2007
HUANG Haibo 54 Female Non-Executive From August 2004 to — YesDirector August 2007
Sir Frederick 48 Male Non-Executive From January 2006 to — NoAnderson Director January 2009GOODWIN
SEAH Lim 60 Male Non-Executive From June 2006 to — NoHuat Peter Director June 2009
HUA Qingshan 53 Male Executive Director From August 2004 to 1,307.831 Yesand Executive August 2007Vice President
LI Zaohang 51 Male Executive Director From August 2004 to 1,307.235 Yesand Executive August 2007Vice President

Directors, Supervisors and Senior Management 111
Total amount of Whether alsopre-tax compensated by
compensation a controllingreceived from shareholder
the company in company orthe report period other associated
Name Age Gender Position Term of office (RMB thousand) companies
Anthony Francis 60 Male Independent From August 2004 to 400 NoNEOH Non-Executive August 2007
Director
William Peter 75 Male Independent From December 2004 to 606.464 YesCOOKE Non-Executive December 2007
Director
Patrick de 58 Male Independent From January 2006 to 400 NoSAINT- Non-Executive January 2009AIGNAN Director
Alberto TOGNI 68 Male Independent From June 2006 to 145.833 NoNon-Executive June 2009Director
LIU Ziqiang 58 Male Chairman of From August 2004 to 1,312.599 NoBoard of August 2007Supervisors
WANG Xueqiang 49 Male Supervisor From August 2004 to 878.334 NoAugust 2007
LIU Wanming 48 Male Supervisor From August 2004 to 874.247 NoAugust 2007
LI Chunyu 47 Male Employee From December 2004 to 478.632 NoSupervisor December 2007
LIU Dun 43 Male Employee From December 2004 to 422.972 NoSupervisor December 2007
ZHOU Zaiqun 54 Male Executive From August 2004 to 1,437.055 YesVice President August 2007
ZHANG Yanling 55 Female Executive From August 2004 to 1,313.222 YesVice President August 2007
ZHANG Lin 50 Female Secretary of From August 2004 to 1,230.033 NoParty Discipline August 2007Committee
ZHU Min 54 Male Executive Vice From August 2006 to 1,193.880 NoPresident August 2009
WANG Yongli 42 Male Executive Vice From August 2006 to 1,187.267 NoPresident August 2009

Bank of China Annual Report 2006112
Total amount of Whether alsopre-tax compensated by
compensation a controllingreceived from shareholder
the company in company orthe report period other associated
Name Age Gender Position Term of office (RMB thousand) companies
YEUNG Jason 52 Male Secretary to the From November 2005 to 5,618.777 YesChi Wai Board of November 2008
Directors
ZHU Xinqiang1 54 Male Executive From November 2003 to 1,030.727 YesAssistant August 2006President
Lonnie DOUNN2 54 Male Chief Credit From March 2005 to 7,915.785 NoOfficer September 2006
1 Zhu Xinqiang resigned in August 2006 for personal reason.2 Lonnie Dounn resigned in September 2006 for personal reason.
Notes:
1 In the report period, none of the directors, supervisors or senior management holds the Bank’s shares.
2 Independent Non-Executive Directors’ compensation is based on “the resolution of the fifth session of the first board of
directors’ meeting of the Bank”. The supervisors’ compensation is based on “the resolution of the second extraordinary
meeting of shareholders of the Bank in 2005”. The annual compensation of Independent Non-Executive Directors and
supervisors should be proposed by the Personnel and Remuneration Committee and submitted to the board of directors
and shareholders’ meeting for review and approval. The compensation of the senior management is based on the Bank’s
Management Measures on Remuneration of Senior Management. The employee supervisors’ compensation is based on
staff salary control system.
3 Non-Executive Director holding a position in any corporate shareholder of the Bank does not receive any compensation
from the Bank. They are remunerated by the respective shareholder entity where they hold a position.
The Bank’s Executive Directors and Supervisors,
who are also our employees and our senior
management personnel, receive compensation
in the form of salaries, bonuses, benefits in kind,
contributions to pension schemes, as well as
other pensions through our contribution to their
social insurance and housing funds. Our
Independent Non-Executive Directors receive
directors’ fees and allowance. Our Non-
Executive Directors do not receive any salary or
directors’ fees from the Bank.
The aggregate fees and compensation paid by
the Bank to all Directors, Supervisors and senior
management members in 2006 were
RMB32.1133 million. A total of RMB2.6 million
was contributed for the social insurance,
supplementary insurance expenses and housing
funds for Directors, Supervisors and senior
management members.

Directors, Supervisors and Senior Management 113
Compensation for Directors, Supervisors and Senior Managementin 2006
RMB million
Total amount of fees and compensation 32.1133Independent Non-Executive Directors’ fees and other income 1.5523
Compensation range Number of persons
Above and including RMB7.00 million up to RMB7.99 million 1Above and including RMB6.00 million up to RMB6.99 million 0Above and including RMB5.00 million up to RMB5.99 million 1Above and including RMB2.00 million up to RMB4.99 million 0Above and including RMB1.00 million up to RMB1.99 million 11RMB0.99 million and below 8
Holding of Positions in Shareholder Companies by Directors,Supervisors and Senior Management
During the report period and save as disclosed, none of our Bank’s directors, supervisors or senior
management holds any position in our shareholder companies.

Bank of China Annual Report 2006114
Brief Working Experience and Other Positionsheld by Directors, Supervisors and SeniorManagement
Directors
CHEN Muhua, Honorary Chairpersonhas been the Honorary Chairperson of the Board of Directors since August 2004.
Ms. Chen was formerly Vice Chairwoman of the Standing Committee of the
National People’s Congress.
CHUANG Shih Ping, Honorary Vice Chairmanhas been the Honorary Vice Chairman of the Board of Directors since August
2004. Mr. Chuang previously served as the Standing Commissioner of Chinese
People’s Political Consultative Conference, the Chairman of Nanyang Commercial
Bank as well as a Director of our bank.
Note: Under PRC law, the honorary directors are not members of the Board of Directors and do not have any power or right to
vote on any matters considered by our Board under our Articles of Association.

Directors, Supervisors and Senior Management 115
XIAO Gang, Chairmanhas served as Chairman of the Board of Directors since March 2003. He also
served as our President from March 2003 to August 2004. From October 1996 to
March 2003, Mr. Xiao served as Deputy Governor and Assistant Governor of the
People’s Bank of China (PBOC). During this period, he was also Director of the
Fund Planning Department and the Monetary Policy Department of the PBOC,
Governor of the Guangdong Branch of the PBOC and Governor of the Guangdong
Branch of the State Administration of Foreign Exchange. From October 1989 to
October 1996, Mr. Xiao held various positions at the PBOC, including Director of
the Policy Research Office, Director of the China Foreign Exchange Trading Center
and Director General of the Fund and Planning Department. Mr. Xiao graduated
from the Finance Department of Hunan Institute of Finance and Economics in
1981 and was awarded a Master’s degree in International Economic Law by
Renmin University of China in 1996. Since May 2003, Mr. Xiao has been serving
as Chairman of the Board of Directors of BOCHK Holdings.
LI Lihui, Vice Chairman and Presidenthas served as Vice Chairman of the Board of Directors and our President since
August 2004. From September 2002 to August 2004, Mr. Li served as Deputy
Governor of Hainan Province, and from July 1994 to September 2002, Mr. Li was
an Executive Vice President of Industrial and Commercial Bank of China (“ICBC”).
From 1988 to July 1994, he served in a number of positions at ICBC, including
Deputy General Manager of the Fujian Branch, Chief Representative of the
Singapore Representative Office and General Manager of the International
Business Department. Mr. Li graduated from the Economics Department of
Xiamen University in 1977 majoring in finance, and also holds an Economics
Doctorate degree in finance from the Guanghua School of Management at Peking
University. Since June 2005, Mr. Li has been serving as Chairman of Board of
Directors in BOCI. Mr. Li has also served as Chairman of Bohai Industry
Investment Management Ltd. since December 2006.
HUA Qingshan, Executive Director and Executive VicePresidenthas served as an Executive Director of the Bank since August 2004. He joined our
bank in 1994 and served as our Assistant President from May 1994 to December
1998. Since December 1998, he has served as a Vice President. He is currently
also a Director of Visa International Asia-Pacific. Mr. Hua obtained a Master’s
degree in Engineering from Hunan University in 1996. Since June 2002, Mr. Hua
has been serving as a Non-Executive Director of BOCHK Holdings.

Bank of China Annual Report 2006116
LI Zaohang, Executive Director and Executive Vice Presidenthas served as an Executive Director of the Bank since August 2004. He joined our
bank in November 2000 and has served as a Vice President since then. From
November 1980 to November 2000, Mr. Li served in various capacities at China
Construction Bank (“CCB”), including Manager, Branch Manager, General
Manager of various departments of the Head Office and Executive Vice President.
Mr. Li graduated from Nanjing University of Information Science and Technology
in 1978. Since June 2002, Mr. Li has been serving as a Non-Executive Director of
BOCHK Holdings, one of our subsidiaries with shares listed on the Hong Kong
Stock Exchange.
ZHANG Jinghua, Non-Executive Directorhas served as a Non-Executive Director of Bank of China Limited since August
2004. Mr. Zhang worked for the China Securities Regulatory Commission from
January 1993 to August 2004 in various capacities, including Director of Listed
Companies Department, Director of Market Supervision Department, Director of
Fund Supervision Department, Director of International Cooperation and a
member of the Planning and Development Commission. Mr. Zhang graduated
from Northeast Forestry Institute in 1982 and obtained a MBA degree from the
State University of New York in 1988.
YU Erniu, Non-Executive Directorhas served as a Non-Executive Director of the Bank since August 2004. Mr. Yu
previously worked for the Ministry of Finance from October 1987 to August 2004
in various capacities, including the Director of the Personnel and Education
Department. Mr. Yu attended a post-graduate program in economic law at the
Capital University of Economics and Business and graduated in 2001.

Directors, Supervisors and Senior Management 117
ZHU Yan, Non-Executive Directorhas served as a Non-Executive Director of the Bank since August 2004. From
August 1994 to August 2004, Ms. Zhu held numerous positions at the Ministry of
Finance (MOF), including Assistant Inspector and Deputy Director General of the
Surveillance Bureau, Deputy Director of the Department of Central Enterprises,
Director of Management Department II of the Dispatching Organ, Director of
Central Department I, and Director of Inspection Department I. From September
1993 to July 1994, Ms. Zhu worked as deputy head of the Liaoning provincial
Finance Department resident financial supervision team, where she oversaw
State-Owned-Enterprises in Anshan and reported directly to the Ministry of
Finance. From March 1990 to September 1993, she worked as head of the
resident financial supervision team of Anshan Finance Bureau overseeing Anshan
Iron & Steel Group. Prior to that, Ms. Zhu served as the Finance Department head,
Deputy Chief Accountant and Deputy General Manager at the Anshan Coach
Automotive Factory from October 1983 to February 1990. Ms. Zhu attended a
post-graduate program in investment management at the Chinese Academy of
Social Sciences and graduated in 1998. She studied law at the Central Communist
Party School and graduated in 2001. Ms. Zhu also attended a post-graduate
program in international economics at the Central Communist Party School and
graduated in January 2006. Ms. Zhu is a senior accountant, and Certified Public
Accountant of the Chinese Institute of Certified Public Accountants.
ZHANG Xinze, Non-Executive Directorhas served as a Non-Executive Director of the Bank since August 2004. Mr. Zhang
worked for the PBOC from May 1975 to October 1978 and from September 1982
to August 2004 in various capacities, including Deputy Director and Inspector of
the Survey and Statistics Department, the Inspector of the Credit Reporting
Administration and Deputy Director of the Credit Reporting Center of Credit
Reporting Administration. Mr Zhang is a research fellow and received a
Bachelor’s degree in finance from the Finance Department, Renmin University of
China in 1982.

Bank of China Annual Report 2006118
HONG Zhihua, Non-Executive Directorhas served as a Non-Executive Director of the Bank since August 2004. Ms. Hong
previously worked for the State Administration of Foreign Exchange from
January 1982 to August 2004 in various capacities, including Deputy Director
General of the Policy and Regulation Department, Deputy Director General of the
International Balance Department and Inspector of the General Affairs
Department. Ms. Hong is a senior economist and graduated from Yunnan
University with a Bachelor’s degree in Chinese Literature in 1982.
HUANG Haibo, Non-Executive Directorhas served as a Non-Executive Director of the Bank since August 2004. Ms. Huang
worked for the PBOC from August 1977 to August 2004 in various capacities,
including Deputy Director General of the Treasury Bureau. Ms. Huang graduated
from the Accounting Department, Shanxi Finance University. She is a senior
accountant and Certified Public Accountant of the Chinese Institute of Certified
Public Accountants.
Sir Frederick Anderson GOODWIN, Non-Executive Directorhas served as a Non-Executive Director of the Bank since January 2006. Sir Fred
Goodwin is the Group Chief Executive of RBS. Prior to joining RBS Group in 1998,
he served as the Chief Executive of Clydesdale Bank Plc from 1995 to 1998 and
was a partner of Touche Ross from 1988 to 1995. Sir Fred Goodwin currently is
also the Chairman of the Prince’s Trust. Sir Fred Goodwin graduated from
University of Glasgow with a Bachelor’s degree in Law in 1979. RBS China, one of
our strategic investors, is a subsidiary of RBS Group. Since August 1998, Sir Fred
Goodwin has served as a Director of RBS Group, the holding company of one of
the world’s largest banking and financial services groups with its primary listing
on the London Stock Exchange.
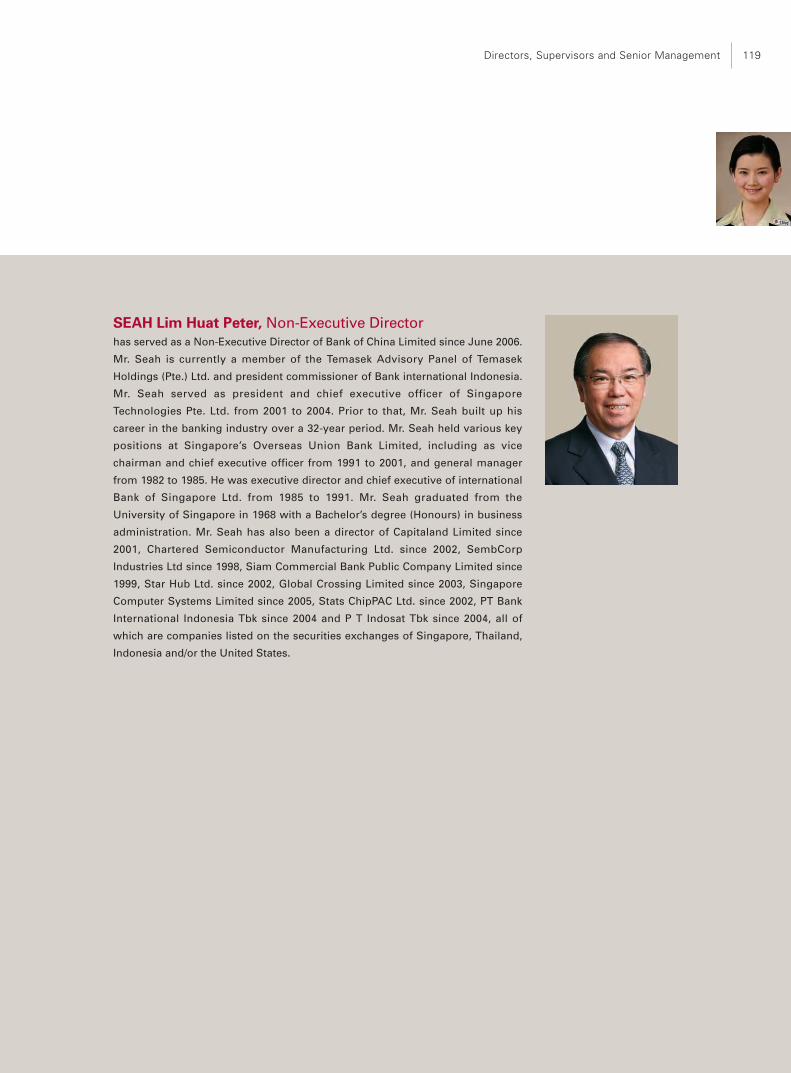
Directors, Supervisors and Senior Management 119
SEAH Lim Huat Peter, Non-Executive Directorhas served as a Non-Executive Director of Bank of China Limited since June 2006.
Mr. Seah is currently a member of the Temasek Advisory Panel of Temasek
Holdings (Pte.) Ltd. and president commissioner of Bank international Indonesia.
Mr. Seah served as president and chief executive officer of Singapore
Technologies Pte. Ltd. from 2001 to 2004. Prior to that, Mr. Seah built up his
career in the banking industry over a 32-year period. Mr. Seah held various key
positions at Singapore’s Overseas Union Bank Limited, including as vice
chairman and chief executive officer from 1991 to 2001, and general manager
from 1982 to 1985. He was executive director and chief executive of international
Bank of Singapore Ltd. from 1985 to 1991. Mr. Seah graduated from the
University of Singapore in 1968 with a Bachelor’s degree (Honours) in business
administration. Mr. Seah has also been a director of Capitaland Limited since
2001, Chartered Semiconductor Manufacturing Ltd. since 2002, SembCorp
Industries Ltd since 1998, Siam Commercial Bank Public Company Limited since
1999, Star Hub Ltd. since 2002, Global Crossing Limited since 2003, Singapore
Computer Systems Limited since 2005, Stats ChipPAC Ltd. since 2002, PT Bank
International Indonesia Tbk since 2004 and P T Indosat Tbk since 2004, all of
which are companies listed on the securities exchanges of Singapore, Thailand,
Indonesia and/or the United States.

Bank of China Annual Report 2006120
Anthony Francis NEOH, Independent Non-ExecutiveDirectorhas served as an Independent Non-Executive Director of the Bank since August
2004. Mr. Neoh currently serves as a member of the International Consultation
Committee of CSRC and member of the Basic Law Committee of the Hong Kong
Special Administrative Region under the Standing Committee of the National
People’s Congress. Mr. Neoh previously served as Chief Advisor to the CSRC,
Chairman of the Hong Kong Securities and Futures Commission, a member of the
Hong Kong Stock Exchange Council and its Listing Committee, Deputy Judge of
the Hong Kong High Court, and Administrative officer of the Hong Kong
Government. From 1996 to 1998, Mr. Neoh was Chairman of the Technical
Committee of the International Organization of Securities Commissions. Mr. Neoh
was appointed as Queen’s Counsel (currently retitled to as Senior Counsel) in
Hong Kong in 1990. Mr. Neoh graduated from the University of London with an
honours degree in Law in 1976. Mr. Neoh is a barrister of England and Wales and
admitted to the State Bar of California. Mr. Neoh was a non-executive director of
Global Digital Creations Holdings Limited from November 2002 to December
2005, and an independent non-executive director of the Link Management
Limited, the manager of the Link Real Estate Investment Trust, from September
2004 to March 2006. Since November 2004, Mr. Neoh has been serving as an
Independent Non-Executive Director of China Shenhua Energy Co., Limited. The
shares of the Global Digital Creations Holdings Limited are listed on the Growth
Enterprise Market of the Hong Kong Stock Exchange, and the units and shares of
the Link Real Estate Investment Trust and China Shenhua Energy Company
Limited, respectively, are listed on the Main Board of the Hong Kong Stock
Exchange.

Directors, Supervisors and Senior Management 121
William Peter COOKE, Independent Non-Executive Directorhas served as an Independent Non-Executive Director of the Bank since
December 2004. Mr. Cooke retired from the Bank of England in 1988 after a 33-
year career. Prior to his retirement, Mr. Cooke was Associate Director and Head of
Banking Supervision at the Bank of England. From 1977 to 1988, he was also
Chairman of the Basel Committee of Banking Regulation and Supervisory
Practices at the Bank for International Settlements, which formulated the first
Basel Capital Accord. From 1989 to 2002, Mr. Cooke served as the Chairman of
Price Waterhouse World Regulatory Advisory Practice and advisor to
PricewaterhouseCoopers. From 1996 to 1998, Mr. Cooke was a director of BOCI
(U.K.) Holding Limited. Since 1992, 1998 and 1999, Mr. Cooke respectively served
as a Non-Executive Director of Financial Security Assurance (U.K.) Ltd., State
Street Bank (U.K.) Ltd. and BOC International (U.K.) Limited. Mr. Cooke holds a
Bachelor’s and Master’s degree in Modern History from Merton College, Oxford.
Patrick de SAINT-AIGNAN, Independent Non-Executive Directorhas served as an Independent Non-Executive Director of the Bank since January
2006. Mr. de Saint-Aignan is a Senior Advisor and a former Managing Director of
Morgan Stanley. Since joining Morgan Stanley in 1974, he has served in various
capacities at Morgan Stanley, including as Firm Risk Manager, Chairman of
Morgan Stanley SA, France, Head of the Debt Capital Market and Head of the
Derivative Products Group. From 1985 to 1992, Mr. de Saint-Aignan held various
positions as a Director and Chairman of the International Swaps and Derivatives
Association. Mr. de Saint-Aignan is also a Statutory Advisor to the Supervisory
Board of IXIS Corporate and Investment Bank, a subsidiary of Natixis. Mr. de
Saint-Aignan graduated from the Ecole des Hautes Etudes Commerciales in 1971
and received a Master’s degree with distinction in Business Administration from
Harvard Business School in 1974.

Bank of China Annual Report 2006122
Alberto TOGNI, Independent Non-Executive Directorhas served as an Independent Non-Executive Director of the Bank since June
2006. Mr. Togni joined Swiss Bank Corporation, a predecessor of UBS AG in 1959
and after the merger between Swiss Bank Corporation and Union Bank of
Switzerland in 1998, continued in UBS AG’s employment until his retirement in
April 2005. During his 46-year career with Swiss Bank Corporation and (after
1998) UBS AG, Mr. Togni served in various capacities. From 1998 to 2005, he was
executive vice chairman of UBS AG overseeing the risk profile of the group. From
1994 to 1997, he was group chief credit officer and group chief risk officer at
Swiss Bank Corporation. Prior to 1994, he held various positions at Swiss Bank
Corporation in charge of the bank’s worldwide credit portfolio. Mr. Togni held a
banking certificate from the Swiss Business School. He graduated in 1965 from
the New York Institute of Finance with a degree in investment analysis.
Supervisors
LIU Ziqiang, Chairman of Board of Supervisorshas served as Chairman of our Board of Supervisors since August 2004. Mr. Liu
was Chairman of the Board of Supervisors of our bank before our corporate
restructuring from July 2003 to August 2004. He was Chairman of the Board of
Supervisors of the Agricultural Development Bank of China from June 2000 to
July 2003, and Vice President of the CCB from April 1997 to June 2000 and head
of Planning Department of CCB from February 1995 to April 1997. From
November 1986 to May 1994, Mr. Liu held various positions in financial
institutions in Shenzhen, including as Chief of the Shenzhen Development Bank
Preparation Team, Deputy General Manager of Shenzhen Agricultural Bank, and
Acting President, Board Chairman and General Manager of Shenzhen
Development Bank. Mr. Liu received a Master’s degree in Economics from the
Graduate School of the PBOC in 1984.
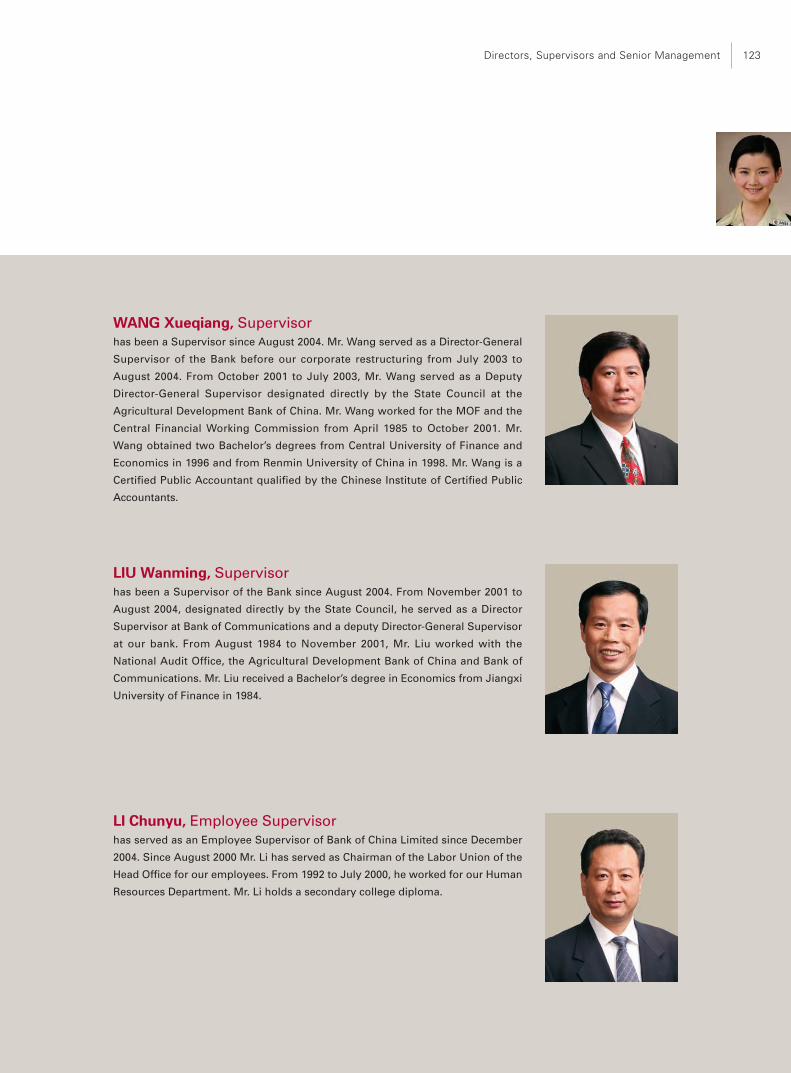
Directors, Supervisors and Senior Management 123
WANG Xueqiang, Supervisorhas been a Supervisor since August 2004. Mr. Wang served as a Director-General
Supervisor of the Bank before our corporate restructuring from July 2003 to
August 2004. From October 2001 to July 2003, Mr. Wang served as a Deputy
Director-General Supervisor designated directly by the State Council at the
Agricultural Development Bank of China. Mr. Wang worked for the MOF and the
Central Financial Working Commission from April 1985 to October 2001. Mr.
Wang obtained two Bachelor’s degrees from Central University of Finance and
Economics in 1996 and from Renmin University of China in 1998. Mr. Wang is a
Certified Public Accountant qualified by the Chinese Institute of Certified Public
Accountants.
LIU Wanming, Supervisorhas been a Supervisor of the Bank since August 2004. From November 2001 to
August 2004, designated directly by the State Council, he served as a Director
Supervisor at Bank of Communications and a deputy Director-General Supervisor
at our bank. From August 1984 to November 2001, Mr. Liu worked with the
National Audit Office, the Agricultural Development Bank of China and Bank of
Communications. Mr. Liu received a Bachelor’s degree in Economics from Jiangxi
University of Finance in 1984.
LI Chunyu, Employee Supervisorhas served as an Employee Supervisor of Bank of China Limited since December
2004. Since August 2000 Mr. Li has served as Chairman of the Labor Union of the
Head Office for our employees. From 1992 to July 2000, he worked for our Human
Resources Department. Mr. Li holds a secondary college diploma.

Bank of China Annual Report 2006124
LIU Dun, Employee Supervisorhas served as an Employee Supervisor of Bank of China Limited since December
2004. Since 1991, Mr. Liu has worked for the International Settlement Division,
Credit Division and Corporate Business Division of our Shandong Branch. Mr. Liu
received a Master’s degree in Economics from the University of Science and
Technology of China in 1991.

Directors, Supervisors and Senior Management 125
Senior Management
LI Lihui, PresidentPlease refer to the part on “Directors”.
HUA Qingshan, Executive Director and Executive Vice PresidentPlease refer to the part on “Directors”.
LI Zaohang, Executive Director and Executive Vice PresidentPlease refer to the part on “Directors”.
ZHOU Zaiqun, Executive Vice Presidenthas served as an Executive Vice President of the Bank since November 2000.
From November 2000 to August 2004, Mr. Zhou also concurrently served as
Executive Vice President and Director of MasterCard International, Asia-Pacific.
Prior to joining us, Mr. Zhou was the General Manager of the Beijing Branch of
ICBC from December 1999 to November 2000 and the General Manager of the
Accounting and Financial Planning Departments of the ICBC from January 1997 to
December 1999. Mr. Zhou received a Master’s degree from the Northeast Institute
of Finance and Economics in 1996. Since June 2002, Mr. Zhou has been serving
as a Non-Executive Director of BOCHK Holdings, one of our subsidiaries with
shares listed on the Hong Kong Stock Exchange.
ZHANG Yanling, Executive Vice Presidenthas served as an Executive Vice President of Bank of China Limited since March
2002. Ms. Zhang joined our bank in 1977. From October 2000 to March 2002, she
was an Assistant President of our bank. From April 1997 to August 2002, Ms.
Zhang successively served as General Manager of our Banking Department,
General Manager of our Milan Branch and General Manager of our Legal and
Compliance Department. Ms. Zhang has also served as Vice Chairperson of the
International Chamber of Commerce Banking Commission since July 2003. Ms.
Zhang graduated from Liaoning University in 1977 and received a Master’s
degree from Wuhan University in 1999. Since June 2002, Ms. Zhang has been
serving as a Non-Executive Director of BOCHK Holdings, one of our subsidiaries
with shares listed on the Hong Kong Stock Exchange. Since September 2003, Ms.
Zhang has been in succession serving as Chairman and Vice Chairman of the
Board of Directors in BOCI.

Bank of China Annual Report 2006126
ZHANG Lin, Secretary of Party Discipline Committeehas served as Secretary of Party Discipline Committee of the Bank since August
2004. Prior to joining our bank, Ms. Zhang held various positions in the Export-
Import Bank of China, including Assistant President from June 2002 to August
2004 and Deputy Director and Director of its Personnel Education Division from
August 1998 to July 2002. Ms. Zhang graduated from the Politics and Economy
Department of the Party School of the Inner Mongolian Autonomous Region’s
Communist Party Committee in 1983.
ZHU Min, Executive Vice Presidenthas served as Executive Vice President of the Bank since August 2006. Mr. Zhu
joined our bank in 1996 and served as Assistant President of Bank of China since
November 2003. Mr. Zhu sequentially served as General Manager of the Institution
of International Finance, General Manager of the BOCHK Restructuring and Listing
Office for BOCHK IPO, and then General Manager of BOC Restructuring and Listing
Office for BOC IPO. He also serves as General Manager of the Board Secretariat of
the BOCHK. Mr. Zhu graduated from Fudan University with a Bachelor’s degree in
1982. He also obtained a Master’s Degree in Public Affairs from Princeton
University and a Ph.D. degree from Johns Hopkins University.
WANG Yongli, Executive Vice Presidenthas served as Executive Vice President of the Bank since August 2006. He joined
our bank in 1989 and served as Assistant President of the Bank since November
2003. From April 1999 to January 2004, Mr. Wang held various positions in our
bank, including General Manager of the Asset-Liability Management Department,
Acting Deputy General Manager and General Manager of our Fujian Branch, and
General Manager of our Hebei Branch. Mr. Wang graduated from Renmin
University of China and received a Master’s degree in 1987. He also obtained a
Doctor’s degree from Xiamen University in 2005.

Directors, Supervisors and Senior Management 127
YEUNG Jason Chi Wai, Secretary to the Board of Directorswas appointed as the Board and Company Secretary of the Bank in November
2005. He is also the Company Secretary of BOCHK Holdings and BOCHK. Prior to
joining BOCHK, Mr. Yeung was the General Counsel and a Director of China
Everbright Limited and, before that, a partner of Woo, Kwan, Lee & Lo. He has
also served at the Securities and Futures Commission in Hong Kong as a
Corporate Finance Manager. Mr. Yeung graduated from the University of Hong
Kong with a Bachelor’s degree in Social Sciences in 1978. He also graduated from
the College of Law, UK in 1985 and further obtained a Bachelor’s degree in Law
from the University of Western Ontario, Canada in 1991 and a MBA degree from
the Richard Ivey Business School, University of Western Ontario, Canada in 2001.
Changes in Directors, Supervisors and SeniorManagement During the Period
For details of the changes in the Bank’s directors during the period
please refer to Directors and the Board of Directors in Corporate
Governance.
There has been no change in the Bank’s Supervisors during the report
period.
During the period, the changes in the Bank’s senior management are as
follows:
(1) Mr. Lonnie DOUNN, Chief Credit Officer (CCO), tendered his
resignation for personal reason in April 2006, effective in
September 2006.
(2) At the meeting of Board of Directors, held on 29 August 2006, the
Board approved the appointments of Mr. Zhu Min and Mr. Wang
Yong Li as Executive Vice Presidents of the Bank. The Board also
approved the resignation of Mr. Zhu Xinqiang as Executive
Assistant President of the Bank.
Corporate Governance
Bank of China Annual Report 2006128
In 2006, the Bank continued its efforts to
promote sound corporate governance and the
improvement of its corporate governance
framework as a modern joint-stock company,
which is composed of the Shareholders’
Meeting, the Board of Directors, the Board of
Supervisors and Senior Management in
compliance with the PRC Company Law and the
PRC Commercial Banking Law, and relevant
regulations promulgated by regulatory
authorities. The Bank further revised its Articles
of Association in accordance with which all
relevant parties lawfully and independently
exercised their rights and discharged their
obligations.
The Bank has adopted incremental measures to
enable it to observe the Code on Corporate
Governance Practices (“the Code”) as set out in
Appendix 14 of the Hong Kong Listing Rules.
The Bank has complied with the code provisions
and has substantially complied with the
recommended best practices set out in the
Code. The Bank also observes the laws and
regulations of the places of business operations
as well as various provisions and guidelines of
regulatory authorities.
Corporate Governance Framework
The Bank’s corporate governance framework
centers on the Board of Directors, which
provides guidance and effective oversight of the
Senior Management, and is separated from the
business operation undertaken by Senior
Management. The major responsibilities of the
Board of Directors are as follows: developing
strategic guidelines and business plans for the
Bank; formulating annual budgets, profit
distribution and other major financial plans;
approving annual and interim business results;
appointing members of special committees and
senior management personnel; approving the
Bank’s fundamental management process;
proposing the appointment, re-appointment or
replacement of the external auditors; reviewing
reports from and monitoring the work of Senior
Management.

Corporate Governance 129
The Board of Directors has set up the Strategic Development Committee, Audit Committee, Risk
Policy Committee, Personnel and Remuneration Committee, and Connected Transaction Control
Committee, which assist the Board in performing its functions in different aspects. The positions of
the Chairman and the President are assumed by two persons respectively, in order to avoid undue
concentration of power.
The Bank’s corporate governance framework is shown below:
Shareholders’ Meeting
Board of Directors Board of Supervisors
Senior Management
Business DevelopmentCommittee
Internal Control Committee
Asset-LiabilityManagement Committee
Procurement ReviewCommittee
Asset Disposal Committee
Anti-Money LaunderingCommittee
Strategic DevelopmentCommittee
Audit Committee
Risk Policy Committee
Personnel andRemuneration Committee
Connected TransactionControl Committee
Shareholders and Shareholders’Meeting
The Shareholder’s Meeting is the highest
authority within the Bank. The Bank establishes
an effective channel to communicate with
shareholders, to ensure that all shareholders are
treated equally, are properly informed and are
able to participate in and exercise their voting
and other rights on major issues of the Bank as
shareholders. In 2006, the Bank held an Annual
Shareholders’ Meeting and four Extraordinary
Shareholders’ Meetings in compliance with the
provisions of the Articles of Association, and
reviewed the proposals relating to the working
reports of the Board of Directors and the Board
of Supervisors, appointment of external
auditors and approval of auditors’ fees,
amendments to the Articles of Association,
annual financial report, issue and allotment of
shares and public listing, appointment of
independent non-executive directors and non-
executive directors, and profit distribution plan.
These were instrumental to the Bank’s
successful H-share and A-share IPOs in Hong
Kong and on the Chinese Mainland, and to its
long-term, sound and sustainable development.
Bank of China Annual Report 2006130
Directors and the Board of Directors
Being responsible for the Shareholders’
Meeting, the Board of Directors is the Bank’s
decision-making body. In 2006, two independent
non-executive directors and two non-executive
directors were appointed to the Board. Mr.
Patrick de Saint-Aignan and Mr. Alberto Togni
were appointed as Independent Non-Executive
Directors of the Bank respectively on 14 January
and 1 June 2006. Sir. Frederick Anderson
Goodwin and Mr. Seah Lim Huat Peter were
appointed as Non-Executive Directors of the
Bank respectively on 14 January and 1 June
2006. The Board of Directors currently
comprises 16 members. Other than the
Chairman, there are four Independent Non-
Executive Directors, eight Non-Executive
Directors and three Executive Directors. For a
detailed background of the board members,
please refer to the section “Directors,
Supervisors and Senior Management” in this
annual report.
Xiao Gang, Chairman of the Bank, also serves as
the Chairman of BOCHK Holdings, and
Executive Director Messrs Hua Qingshan and Li
Zaohang, also serve as non-executive directors
of BOCHK Holdings.
The Bank purchased Directors and Officers
liability insurance in 2006 for members of the
Board to provide protection against claims
arising from the lawful discharge of duties on
the part of the Directors.
In 2006, the Board of Directors held eight
meetings (including three extraordinary
meetings) respectively on 29 January, 7 March,
27 March, 17 & 20 April, 2 June, 29 August, 30
October and 14 December, and passed seven
written resolutions. The resolutions relate
mainly to the Bank’s development strategy,
business plan and financial budget, financial
reports, profit distribution plan, self-evaluation
of the Board of Directors, revision of the Articles
of Association, appointment of external auditors
and approval of auditors’ fees, performance
evaluation and distribution of bonus for Senior
Management, appointment of non-executive
directors and independent non-executive
directors, IPO, changes in the Senior
Management, market risk limits, reform of the
business process and organization, and
information disclosure policy of the Bank. The
Board Meetings also reviewed the management
report rendered by the external auditors and the
response of the Management, on-site inspection
report by CBRC and the corrective measures
taken by the Bank, and progress report on the
implementation of the IT Blueprint.

Corporate Governance 131
The average attendance rate of the board meetings reached 96%. The attendance rate of each
director is shown below:
Number ofDirector Board Meetings Attended1 Attendance Rate
XIAO Gang Attended 8 out of a total of 8 meetings 100%LI Lihui Attended 8 out of a total of 8 meetings 100%ZHANG Jinghua Attended 8 out of a total of 8 meetings 100%YU Erniu Attended 8 out of a total of 8 meetings 100%ZHU Yan Attended 8 out of a total of 8 meetings 100%ZHANG Xinze Attended 8 out of a total of 8 meetings 100%HONG Zhihua Attended 8 out of a total of 8 meetings 100%HUANG Haibo Attended 8 out of a total of 8 meetings 100%Sir Frederick Anderson GOODWIN2 Attended 5 out of a total of 8 meetings 63%SEAH Lim Huat Peter3 Attended 4 out of a total of 4 meetings 100%HUA Qingshan4 Attended 7 out of a total of 8 meetings 88%LI Zaohang Attended 8 out of a total of 8 meetings 100%Anthony Francis NEOH Attended 7 out of a total of 8 meetings 88%William Peter COOKE Attended 8 out of a total of 8 meetings 100%Patrick de SAINT-AIGNAN Attended 8 out of a total of 8 meetings 100%Alberto TOGNI3 Attended 4 out of a total of 4 meetings 100%
Notes:
1 According to the Articles of Association of the Bank, a Director can entrust another director to attend the Board Meeting
and excise the voting right on his or her behalf.
2 Sir Frederick Anderson Goodwin was unable to personally attend the board meetings held on 19 January, 27 March and
14 December. He entrusted another director to attend and exercise the voting right on his behalf at the meetings on 27
March and 14 December.
3 The appointment of Mr. Seah Lim Huat Peter and Mr. Alberto Togni as directors of the Bank were approved at the
Shareholders’ Meeting held on April 21, 2006, and were given regulatory approval by CBRC on 1 June 2006. They were
present at the board meetings held on 2 June, 29 August, 30 October and 14 December 2006.
4 Mr. Hua Qingshan was unable to personally attend the board meeting held on 14 December 2006, but entrusted another
director to attend and exercise voting right on his behalf.
The Strategic DevelopmentCommittee
The Strategic Development Committee
comprises 11 members, including the Chairman
of the Board, one executive director, eight non-
executive directors and one independent non-
executive director. Xiao Gang, Chairman, serves
as committee chairman. Committee members
include Li Lihui, Zhang Jinghua, Yu Erniu, Zhu
Yan, Zhang Xinze, Hong Zhihua, Huang Haibo,
Sir Frederick Anderson Goodwin, Seah Lim
Huat Peter and Alberto Togni. The committee is
mainly responsible for developing the strategic
plan of the Bank, assessing the effectiveness of
the plan and reviewing and assessing programs
on the following issues and submitting them to
the Board of Directors for review:
• Strategic development plans;
• Annual budgets;
• Capital allocation plans;
• Merger and acquisition plans;

Bank of China Annual Report 2006132
• Major investment and financing plans;
• Substantial internal restructuring and
adjustment.
The Strategic Development Committee held six
meetings (including three extroaordinary
meetings) in 2006, and passed one written
resolution. At these meetings, the Committee
reviewed the Bank’s development strategy,
business development plan for 2006-2008,
business plan for 2007-2009, and other
proposals.
The average attendance rate of the meetings of
the Strategic Development Committee reached
91%. The attendance rates of relevant directors
are shown below:
Number ofDirector Committee Meetings Attended Attendance Rate
XIAO Gang Attended 6 out of a total of 6 meetings 100%LI Lihui Attended 6 out of a total of 6 meetings 100%ZHANG Jinghua Attended 6 out of a total of 6 meetings 100%YU Erniu1 Attended 5 out of a total of 6 meetings 83%ZHU Yan Attended 6 out of a total of 6 meetings 100%ZHANG Xinze Attended 6 out of a total of 6 meetings 100%HONG Zhihua Attended 6 out of a total of 6 meetings 100%HUANG Haibo Attended 6 out of a total of 6 meetings 100%Sir Frederick Anderson GOODWIN2 Attended 1 out of a total of 6 meetings 17%SEAH Lim Huat Peter Attended 2 out of a total of 2 meetings 100%Alberto TOGNI Attended 2 out of a total of 2 meetings 100%
Notes:
1 Director Yu Erniu entrusted another director to attend and exercise voting right on his behalf at one meeting.
2 Sir Frederick Anderson Goodwin entrusted other directors to attend and exercise voting right on his behalf at three
meetings.
The Audit Committee
The Audit Committee comprises seven
members, including three non-executive
directors and four independent non-executive
directors. Independent non-executive director
Patrick de Saint-Aignan acts as committee
chairman. Committee members include Zhu
Yan, Huang Haibo, Anthony Francis Neoh,
William Peter Cooke, Seah Lim Huat Peter and
Alberto Togni. The committee is mainly
responsible for:
• Recommending the replacement/
appointment of and the fees paid to the
external auditors and assessing their
performance and independence;
• Reviewing the external auditors’ audit
report, internal control report and audit
plan;
• Reviewing the financial reports, other
financial disclosure and significant
accounting and auditing policies and
regulations;
• Approving the internal audit charter,
overseeing and providing guidance on the
organizational structure re-engineering,
promoting the vertical management to
ensure their independence, approving the
internal audit plan and the budget and
evaluating its performance;

Corporate Governance 133
• Nominating Chief Audit Officer who
reports directly to and is evaluated by the
Committee, refining the Chief Audit
Officer’s responsibilities and evaluating his
or her performance;
• Overseeing the Bank’s internal controls
and persistently keeping track with the
rectification progress in relation to issues
raised by the external auditors, including
reviewing internal audit report findings,
management’s feedback and rectification
plans, and discussing the adequacy of
internal control with the Chief Audit Officer
and the external auditors;
• Promoting self-evaluation of internal
control and compliance with relevant
disclosure requirements of stock
exchanges.
The Audit Committee held six meetings in 2006,
mainly reviewing financial reports, dividend and
profit distribution plan; the Bank’s financial
management measures, business plan and
expense budget for 2006; management
suggestion by the external auditors for 2005 and
feedback of the Management, external auditors’
audit plan, scope and fees; internal audit plan
and budget, internal audit improvement
program, and candidates for Chief Audit Officer.
The attendance rate of the meetings of the Audit
Committee was 100%. The attendance rates of
relevant directors are shown below:
Number ofDirector Committee Meetings Attended Attendance Rate
Patrick de SAINT-AIGNAN Attended 6 out of a total of 6 meetings 100%ZHU Yan Attended 6 out of a total of 6 meetings 100%HUANG Haibo Attended 6 out of a total of 6 meetings 100%Anthony Francis NEOH Attended 6 out of a total of 6 meetings 100%William Peter COOKE Attended 6 out of a total of 6 meetings 100%SEAH Lim Huat Peter Attended 2 out of a total of 2 meetings 100%Alberto TOGNI Attended 2 out of a total of 2 meetings 100%
The Audit Committee has reviewed the 2006
Annual Report of the Bank. The Bank’s external
auditors, PricewaterhouseCoopers Zhong Tian
CPAs Limited Company has audited the 2006
financial statements of the Bank prepared in
accordance w i th PRC GAAP and
PricewaterhouseCoopers Hong Kong has
audited the financial statements of the Bank
prepared in accordance with IFRS. Both firms
have issued unqualified audit reports. The Audit
Committee has discussed matters relating to the
accounting standards and practices adopted in
the financial statements, internal control and the
financial statements.
The Group has established a basic framework of
self-assessment of its internal control. The self-
assessment focused on key areas of internal
control, including financial control, operation
control, compliance and risk management.
Management has reported the result of the
assessment on key controls to the Audit
Committee and the Board.

Bank of China Annual Report 2006134
The Risk Policy Committee
The Risk Policy Committee comprises 6
members, including two non-executive
directors, one executive director, and three
independent non-executive directors. Mr.
Anthony Francis Neoh, an independent non-
executive director, acts as the committee
chairman. Committee members include Zhang
Jinghua, Zhang Xinze, Hua Qingshan, Patrick de
Saint-Aignan and Alberto Togni. The committee
is mainly responsible for:
• Assessing and monitor ing the
implementation of the Bank’s risk
management and internal control policies,
including credit policies;
• Overseeing the exposure against
established parameters while monitoring
and assessing the Bank’s risk appetite;
• Reviewing the effectiveness of our legal
and compliance process and monitoring
its implementation;
• Reviewing and approving credit decisions
in excess of the credit authorization limits
delegated to the Bank’s President.
The Risk Policy Committee held four meetings
in 2006. At these meetings, the committee
reviewed proposals relating to the suggestions
on risk appetite of the Bank in 2006, market risk
management policies, market risk exposure
limits in 2006, amendments to the Regulations
on the Management of Credit Approval
Authorization of Head Office of the Bank,
policies on anti-money laundering and anti-
terrorism financing, and credit proposals in
excess of the credit authorization limits
delegated to the Management.
The attendance rate of the meetings of the Risk
Policy Committee was 100%. The attendance
rates of relevant directors are shown below:
Number ofDirector Committee Meetings Attended Attendance Rate
Anthony Francis NEOH Attended 4 out of a total of 4 meetings 100%ZHANG Jinghua Attended 4 out of a total of 4 meetings 100%ZHANG Xinze Attended 4 out of a total of 4 meetings 100%HUA Qingshan Attended 4 out of a total of 4 meetings 100%Patrick de SAINT-AIGNAN Attended 4 out of a total of 4 meetings 100%Alberto TOGNI Attended 1 out of a total of 1 meeting 100%
The Personnel and RemunerationCommittee
The Personnel and Remuneration Committee
comprises five members, including two non-
executive directors and three independent non-
executive directors. Non-executive director Yu
Erniu acts as the committee chairman.
Committee members include Hong Zhihua,
Anthony Francis Neoh, William Peter Cooke and
Patrick de Saint-Aignan. The committee is
mainly responsible for:
• Reviewing the Bank’s human resource and
remuneration policies and overseeing their
implementation;
• Nominating the Bank’s directors and the
members of Senior Management;

Corporate Governance 135
• Reviewing the standards and procedures
for selecting, nominating and appointing
directors, members of the Bank’s board
committees and Senior Management;
• Reviewing the remuneration policies
submitted by the Bank’s management;
• Formulating the standards for reviewing
the performance of the Bank’s Senior
Management, and appraising the
performance of the directors and senior
management personnel.
The Personnel and Remuneration Committee held
five meetings in 2006, at which it reviewed the
remuneration plans and incentive measures for
directors, supervisors and senior management
personnel, set the performance evaluation targets
and formulated evaluation measures for
management personnel, determined total amount
of personnel expenses and the distribution
principle, reviewed the suitability of candidates for
directors, executive vice presidents, chief financial
officer, chief risk officer, chief audit officer and
members of the board committees, and reviewed
the evaluation guidelines and plans for the Board
of Directors and the accountability measures for
management personnel.
The average attendance rate of the meetings of
the Personnel and Remuneration Committee
reached 92%. The attendance rates of relevant
directors are shown below:
Number ofDirector Committee Meetings Attended Attendance Rate
YU Erniu Attended 5 out of a total of 5 meetings 100%HONG Zhihua Attended 5 out of a total of 5 meetings 100%Anthony Francis NEOH Attended 4 out of a total of 5 meetings 80%William Peter COOKE Attended 4 out of a total of 5 meetings 80%Patrick de SAINT-AIGNAN Attended 5 out of a total of 5 meetings 100%
The Connected Transaction ControlCommittee
The Connected Transaction Control Committee
comprises four members, including two
executive directors and two independent non-
executive directors. Independent non-executive
director William Peter Cooke acts as the
committee chairman. Committee members
include Hua Qingshan, Li Zaohang and Anthony
Francis Neoh.
The committee is mainly responsible for:
• Formulating policies and procedures with
regard to connected transactions;
• Identifying the related parties of the Bank
and reporting to the Board of Directors and
the Board of Supervisors;
• Identifying the connected transactions
pursuant to related laws and regulations;
• Reviewing the major connected
transactions of the Bank according to
Chinese laws and regulations.
The Connected Transaction Control Committee
held four meetings in 2006, at which it reviewed
the proposals regarding the Bank’s connected
transaction management measures, division of
responsibilities for connected transaction
control, and letters of undertaking by related
parties.

Bank of China Annual Report 2006136
The average attendance rate of the meetings of
the Connected Transaction Control Committee
reached 88%. The attendance rates of relevant
directors are shown below:
Number ofDirector Committee Meetings Attended Attendance Rate
William Peter COOKE Attended 4 out of a total of 4 meetings 100%HUA Qingshan Attended 3 out of a total of 4 meetings 75%LI Zaohang Attended 4 out of a total of 4 meetings 100%Anthony Francis NEOH Attended 3 out of a total of 4 meetings 75%
Appointment of Directors
In compliance with Rules A.4.1 and A.4.2 of
Appendix 14 of the Hong Kong Listing Rules and
provisions of the Bank’s Articles of Association,
the Bank’s directors are elected at the
Shareholders’ Meeting, with a term of office of
three years starting from the date when the
Bank receives the approval of the CBRC. A
director, at the expiry of the term of office, could
be re-elected at the Shareholder’s Meeting, and
may serve consecutive terms by re-election and
re-appointment.
Independent Non-Executive Directors
Members of the Board of Directors include four
independent non-executive directors, in
compliance with the requirement on quorum
specified in the Articles of Association. These
independent non-executive directors serve as
members of five special committees under the
Board of Directors.
As stipulated in Rule 3.13 of the Hong Kong
Listing Rules, the Bank has received the annual
confirmation in writing from every independent
non-executive director with regard to his
independence. Based on such confirmation and
relevant information in our possession, the Bank
confirms their independent status.
Information on the attendance of independent
non-executive directors at board meetings in
2006 can be found in the section “Directors and
the Board of Directors” under “Corporate
Governance”.
Different Opinions Raised byIndependent Non-Executive Directorson Relevant Matters of the Bank
On 29 August 2006, the Board resolved to
approve the Bank’s market risk limits during
which 14 directors voted for, 1 director voted
against and 1 director abstained. Independent
Non-Executive Director Patrick de Saint-Aignan
voted against the resolution, stating that the
limits were too high particularly given the state
of risk management capabilities of the Bank.
Specific Explanation andIndependent Opinions ofIndependent Non-Executive Directorson the Guarantee Business of theBank
Pursuant to the provisions and requirements set
forth in the circular (ZJF [2003] No.56) issued by
the China Securities Regulatory Commission
and guided by the principle of equity, fairness
and objectiveness, the independent directors of
the Bank Anthony Francis Neoh, William Peter
Cooke, Patrick de Saint-Aignan, and Alberto
Togni provide the following information
regarding the Bank’s guarantee business:
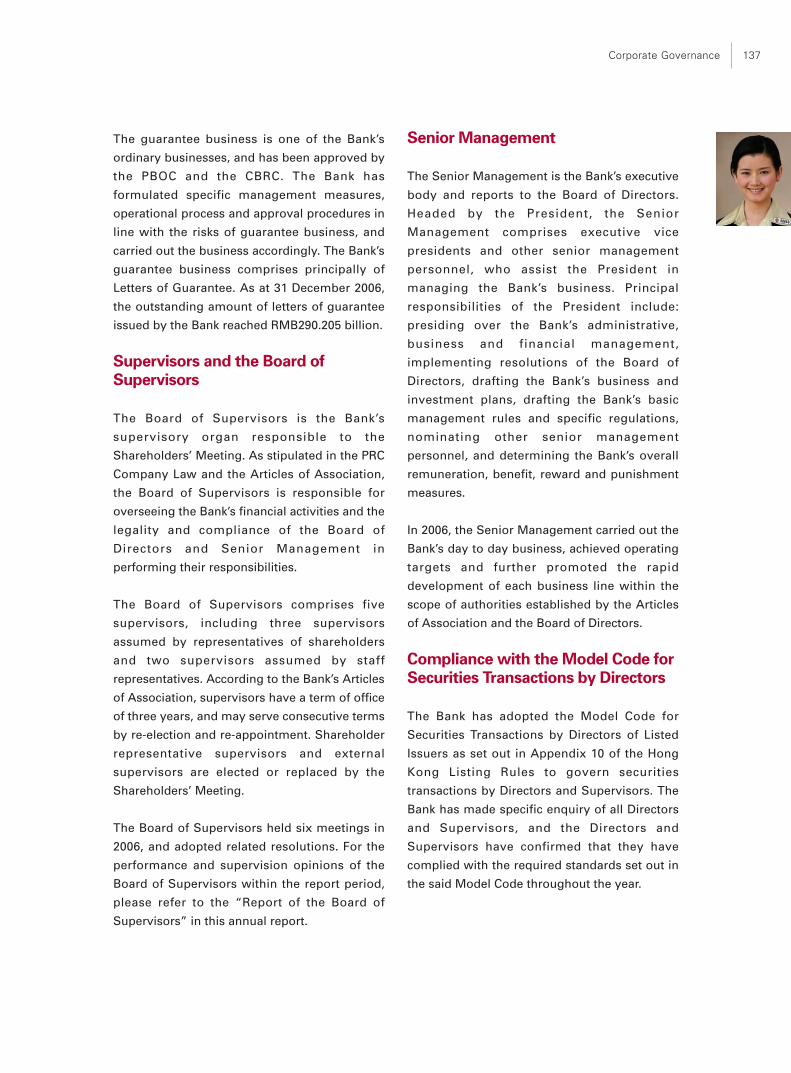
Corporate Governance 137
The guarantee business is one of the Bank’s
ordinary businesses, and has been approved by
the PBOC and the CBRC. The Bank has
formulated specific management measures,
operational process and approval procedures in
line with the risks of guarantee business, and
carried out the business accordingly. The Bank’s
guarantee business comprises principally of
Letters of Guarantee. As at 31 December 2006,
the outstanding amount of letters of guarantee
issued by the Bank reached RMB290.205 billion.
Supervisors and the Board ofSupervisors
The Board of Supervisors is the Bank’s
supervisory organ responsible to the
Shareholders’ Meeting. As stipulated in the PRC
Company Law and the Articles of Association,
the Board of Supervisors is responsible for
overseeing the Bank’s financial activities and the
legality and compliance of the Board of
Directors and Senior Management in
performing their responsibilities.
The Board of Supervisors comprises five
supervisors, including three supervisors
assumed by representatives of shareholders
and two supervisors assumed by staff
representatives. According to the Bank’s Articles
of Association, supervisors have a term of office
of three years, and may serve consecutive terms
by re-election and re-appointment. Shareholder
representative supervisors and external
supervisors are elected or replaced by the
Shareholders’ Meeting.
The Board of Supervisors held six meetings in
2006, and adopted related resolutions. For the
performance and supervision opinions of the
Board of Supervisors within the report period,
please refer to the “Report of the Board of
Supervisors” in this annual report.
Senior Management
The Senior Management is the Bank’s executive
body and reports to the Board of Directors.
Headed by the President, the Senior
Management comprises executive vice
presidents and other senior management
personnel, who assist the President in
managing the Bank’s business. Principal
responsibilities of the President include:
presiding over the Bank’s administrative,
business and financial management,
implementing resolutions of the Board of
Directors, drafting the Bank’s business and
investment plans, drafting the Bank’s basic
management rules and specific regulations,
nominating other senior management
personnel, and determining the Bank’s overall
remuneration, benefit, reward and punishment
measures.
In 2006, the Senior Management carried out the
Bank’s day to day business, achieved operating
targets and further promoted the rapid
development of each business line within the
scope of authorities established by the Articles
of Association and the Board of Directors.
Compliance with the Model Code forSecurities Transactions by Directors
The Bank has adopted the Model Code for
Securities Transactions by Directors of Listed
Issuers as set out in Appendix 10 of the Hong
Kong Listing Rules to govern securities
transactions by Directors and Supervisors. The
Bank has made specific enquiry of all Directors
and Supervisors, and the Directors and
Supervisors have confirmed that they have
complied with the required standards set out in
the said Model Code throughout the year.
Bank of China Annual Report 2006138
Responsibility Statement of Directorson Financial Reports
The following statement, which set out the
responsibilities of the Directors regarding
financial statements, should be read in
conjunction with, but distinguished from, the
auditor’s statement of their responsibilities as
set out in the auditor’s report contained in this
annual report.
The Directors acknowledge that they are
responsible for preparing financial statements
of the Bank that truly represents the operating
results of the Bank for each financial year. To the
best of the Directors’ knowledge, there was no
material event or condition that might have a
material adverse effect on the continuing
operation of the Bank.
Appointment or Termination ofExternal Auditors
At the 2005 annual general meeting of the Bank,
our shareholders approved the resolution in
r e s p e c t o f t h e a p p o i n t m e n t s o f
PricewaterhouseCoopers Zhong Tian CPAs
Limited Company as our domestic auditor and
PricewaterhouseCoopers Hong Kong as our
international auditor for 2006. The directors
were authorised to negotiate and determine the
fees of such auditors in accordance with market
practice.
Auditors’ fees paid to PricewaterhouseCoopers
and its member firms for the audit of the
financial statements of the Group, including
those of the Bank’s overseas subsidiaries and
branches, for the year ended 31 December 2006
were RMB183 million.
The Bank also incurred approximately RMB136
mi l l ion for serv ices provided by
PricewaterhouseCoopers Hong Kong and
PricewaterhouseCoopers Zhong Tian CPAs
Limited Company in respect of the IPOs and
listing of the Bank’s shares on the Hong Kong
Stock Exchange and Shanghai Stock Exchange.
This amount has been charged to the capital
reserve account.
Except for the above-mentioned IPO service
fees, neither PricewaterhouseCoopers Hong
Kong nor PricewaterhouseCoopers Zhong Tian
CPAs Limited Company has provided any
material non-audit services to us. The total
professional fees paid for non-audit services,
exclusive of the IPO service fees, to
PricewaterhouseCoopers Hong Kong and
PricewaterhouseCoopers Zhong Tian CPAs
Limited Company were RMB18 million in 2006.
PricewaterhouseCoopers Hong Kong and
PricewaterhouseCoopers Zhong Tian CPAs
Limited Company have provided audit services
to the Bank for four years. Mr. Zhu Yu and Ms.
Tu Yi are the certified public accountants who
signed the auditor’s report on the Group’s
financial statements prepared in accordance
with PRC GAAP for the year ended 31 December
2006.
The Board will table a resolution at the
forthcoming Annual General Meeting,
proposing to reappoint PricewaterhouseCoopers
Zhong Tian CPAs Limited Company and
PricewaterhouseCoopers Hong Kong as our
auditors for the year 2007.
Investor Relations and InformationDisclosure
The Bank discloses information in compliance
with securities regulations promulgated in the
place where its shares were listed, and
publishes periodic reports and announcements
to the public in accordance with the law, to
ensure that information disclosure is timely, fair,
accurate, truthful and complete, and the
legitimate rights and interests of investors and

Corporate Governance 139
related stakeholders are safeguarded. Since we
are dual listed in Hong Kong and Shanghai, the
Bank carries out information disclosures
according to the stricter of the two regulatory
standards to ensure that all investors are treated
fairly. To expedite the establishment of the
information disclosure process and enhance the
transparency of information disclosure, the
Bank formulated the Information Disclosure
Policy pursuant to securities regulations
promulgated in the place where its shares were
listed. The Policy has been adopted by the
Board of Directors, and provides in principle for
the content, form, procedure and management
of information disclosure. Based on the Policy,
the Bank will prepare more specific and practical
measures on information disclosure
management.
The Bank communicates with and promotes
understanding from investors by means of
results presentation, press conference, road
show, reception of visits from institutional
investors, online live broadcast, e-mail, and
telephone hotline. We also actively participate in
meetings with investors at conferences held by
international and domestic securities
institutions, so as to enable investors to
understand the Bank’s specific development
strategy, business management and
performance in a timely manner, and receive
investor feedback on the Bank. Apart from
communications with analysts during the
announcement of annual and interim results,
the Bank’s senior management also meets
institutional investors and analysts from time to
time.
After the IPO, the Bank enhances understanding
and communications with investors by many
means. It held a total of 83 meetings
participated by senior management personnel,
domestic and overseas investors and analysts.
Market Recognition
In the report period, the Bank won the award of
“2006 Best IR for an IPO in the Hong Kong
Market”, and two honorable mentions: the
“Best Annual Report and Other Company
Communications” and the “Best IR for Chinese
Companies in the Hong Kong Market” in the
Hong Kong and Taiwan awards selection
campaign held by IR Magazine in 2006. In the
Chinese Mainland awards selection campaign
held by the magazine, the Bank was granted the
award of “2006 Best IR for a Corporate
Transaction” and nominated for the “Grand Prix
for Best Overall IR — SOE”. IR Magazine is a
monthly magazine on investor relations that is
most authoritative in the world. The said awards
and nominations were appraised by 342 buy-
side and sell-side analysts and fund managers
from Chinese Mainland, Hong Kong, Taiwan,
Singapore and other regions in Asia at the
invitation of IR Magazine.

Report of the Board of Directors
Bank of China Annual Report 2006140
The Board of Directors are pleased to present
their report together with the audited
consolidated financial statements of the Bank
and its subsidiaries (the “Group”) for the year
ended 31 December 2006.
Principal Activities
The Bank is engaged in the provision of a range
of banking and related financial services,
including commercial banking, investment
banking and insurance businesses.
Major Customers
During the year, the five largest customers of
the Group accounted for less than 30% of the
interest income and other operating income of
the Group.
Results and Appropriations
The results of the Group for the year are set out
in the financial statements and notes thereof.
The Board has recommended a final dividend of
RMB0.04 per share, amounting to
approximately RMB10.154 billion, subject to the
approval of shareholders at the forthcoming
Annual General Meeting to be held on
Thursday, 14 June 2007. If approved, detail
arrangement of the final dividend distribution
(including the closure of H Share Register of
Members; the record date to determine H Share
and A Share shareholders’ entitlement to the
final dividend) for each holder of A Share and H
Share will be announced after the Annual
General Meeting separately.
The 2006 final dividend of the Bank will be
denominated and declared in RMB. Dividend for
A Share shareholders will be paid in RMB and
dividend for H Share shareholders will be paid
in Hong Kong dollars. RMB will be converted
into Hong Kong dollars based on the average
exchange rate prevailing one week before 14
June 2007 (such day inclusive), being the date
of holding the Bank’s Annual General Meeting,
as announced by the PBOC for such conversion.
No interim dividend was paid for the period
ended 30 June 2006. At the shareholders’
meeting held in April 2006, it was approved that
a dividend amounting to RMB1.375 billion in
total, was paid to shareholders whose names
appeared on the register of members of the
Bank on 31 December 2005.
Closure of Register of H ShareShareholders
The H Share Register of Members of the Bank
will be closed, for the purpose of determining H
Share shareholders’ entitlement to attend the
Annual General Meeting, from Wednesday, 16
May 2007 to Thursday, 14 June 2007 (both days
inclusive), during which period no transfer of
shares will be registered. In order to attend the
Annual General Meeting, H Share shareholders
should ensure that all transfer documents,
accompanied by the relevant share certificates,
are lodged with the Bank’s H Share Registrar,
Computershare Hong Kong Investor Services
Limited, at Rooms 1712–1716, 17th Floor,
Hopewell Centre, 183 Queen’s Road East, Hong
Kong, not later than 4:30 p.m. on Tuesday, 15
May 2007.

Report of the Board of Directors 141
There is no book closure period for A Share
Register of Members. A notice of Annual
General Meeting setting out the record date for
the meeting and related issues will be published
in due course.
Donations
Charitable and other donations made by the
Group during the year amounted to
approximately RMB12.35 million.
Share Capital
As at the latest practicable date prior to the
issue of this Annual Report and based on
publicly available information, the Bank has
sufficient public float, in compliance with the
minimum requirement of the Hong Kong Listing
Rules and the waiver granted by the Hong Kong
Stock Exchange at the time of our listing.
Distributable Reserves
Please refer to Note V.36 to the Financial
Statements for details of distributable reserves
of the Bank.
Fixed Assets
Please refer to Note V.22 to the Financial
Statements for details of the fixed assets of the
Bank.
Financial Summary
The Bank was listed on Hong Kong Stock
Exchange and Shanghai Stock Exchange
respectively in 2006. A summary of the annual
results, assets and liabilities of the Bank for the
last four years is set out in the section of
“Financial Highlights”.
Connected Transactions
Under Chapter 14A of the Hong Kong Listing
Rules, transactions between connected persons
(as defined under the Hong Kong Listing Rules)
and the Bank will constitute connected
transactions to the Bank. The details of such
connected transactions are as follows:
Exempt Continuing ConnectedTransactions
Commercial banking services and products
provided by the Bank in the ordinary and usual
course of business
The Bank provides commercial banking services
and products to customers in the ordinary and
usual course of business. Such commercial
banking services and products include the
taking of deposits. Customers who place
deposits with the Bank may include the Bank’s
substantial shareholders, directors, supervisors
and chief executive officers, ex-directors who
were in office within 12 months preceding the
H-share Listing Date and their respective
associates, each of whom is a connected
person. According to Chapter 14A of the Hong
Kong Listing Rules, connected persons place
deposits with the Bank will constitute continuing
connected transactions for the Bank.
Furthermore, BOCHK has preferential interest
rates for deposits placed by employees of
BOCHK. The deposits placed by connected
persons who are not the Bank’s employees are
at market rates and on normal commercial
terms. To the extent staff rates are available for
employees, the interest paid by the Bank on
deposits placed by connected persons who are
the Bank’s employees are at staff rates, but such
deposits are nevertheless on normal
commercial terms as such terms are no more
favorable than the staff rates applicable to other
employees who are not connected persons.

Bank of China Annual Report 2006142
The provision of commercial banking services
and products to connected persons in the
ordinary and usual course of business and on
normal commercial terms that are comparable
or no more favorable than those offered to
independent third parties (including other
comparable employees who are not connected
persons) will be exempt continuing connected
transactions under Rule 14A.65(4) of the Hong
Kong Listing Rules, namely, financial assistance
provided by a connected person in the form of
deposits placed with a listed issuer for the
benefit of a listed issuer on normal commercial
terms (or better to the listed issuer) where no
security over the assets of the listed issuer is
granted in respect of the financial assistance,
and thus will be exempt from the reporting,
announcement and independent shareholders’
approval requirements contained in Rules
14A.35 and 14A.45 to 14A.48 of the Hong Kong
Listing Rules.
Loan and credit facilities granted by the Bank to
connected persons
The Bank extends loans and credit facilities
(including provision of long-term loans, short-
term loans, consumer loans, credit card
facilities, mortgages, guarantees, security for
third party loans, comfort letters and billing
discounting facilities) to customers in the
ordinary and usual course of business on
normal commercial terms with reference to
prevailing market rates. Customers who utilize
loans and credit facilities include the Bank’s
substantial shareholders, directors, supervisors
and chief executive officers, ex-directors who
were in office within 12 months preceding the
H-share Listing Date and their respective
associates, each of whom is a connected person
under Chapter 14A of the Hong Kong Listing
Rules. According to Chapter 14A of the Hong
Kong Listing Rules, loans and credit facilities
granted by the Bank to connected persons
constitute continuing connected transactions for
the Bank.
The Bank has preferential staff rates for
employees who utilize Great Wall Renminbi
credit cards and BOC credit cards. Such
preferential rates include waiver of annual fees
and reduced handling fees. Furthermore,
BOCHK has preferential staff rates for
employees who use its credit cards.
The Bank also has preferential staff rates for
residential loans and mortgages taken out by
the Bank’s employees, and the head office and
branches have preferential staff rates for
consumer loans taken out by the Bank’s
employees. These preferential staff rates are all
within the range set by the PBOC. Furthermore,
BOCHK has preferential staff rates for residential
loans and mortgages taken out by its
employees.
The loans and credit facilities the Bank provides
to connected persons who are not employees of
the Bank are on normal commercial terms with
reference to prevailing market rates. To the
extent staff rates are available for certain loans
and credit facilities, the loans and credit facilities
the Bank provides to connected persons who
are the Bank’s employees are provided at staff
rates and are on normal commercial terms no
more favorable than the staff rates applicable to
other employees who are not connected
persons.
Report of the Board of Directors 143
The provision of loans and credit facilities to
connected persons in the ordinary and usual
course of business and on normal commercial
terms that are comparable or no more favorable
than those offered to independent third parties
(which include other comparable employees
who are not connected persons) will be exempt
continuing connected transactions under Rule
14A.65(1) of the Hong Kong Listing Rules,
namely, financial assistance provided by a listed
issuer in its ordinary and usual course of
business for the benefit of a connected person
on normal commercial terms, and thus will be
exempt from all reporting, announcement and
independent shareholders’ approval
requirements contained in Rules 14A.35 and
14A.45 to 14A.48 of the Hong Kong Listing
Rules.
Continuing connected transactions between
Prudential Corporation Holdings Limited & Its
Subsidiaries and the Bank
Prudential Corporation Holdings Limited
respectively owns 36% of BOCI-Prudential Asset
Management Limited (“BOCI-Prudential”) and
36% of BOCI-Prudential Trustee Limited
(“BPTL”), both of which are indirect subsidiaries
of the Bank. Accordingly, Prudential Corporation
Holdings Limited and its associate are
connected persons to the Bank for the purposes
of the Hong Kong Listing Rules. In particular,
BOCI-Prudential and BPTL, being associates of
Prudential Corporation Holdings Limited, are
also connected persons to the Bank.
In 2006, the Bank engaged on a regular basis in
a number of transactions with Prudential
Corporation Holdings Limited and its associates
in ordinary and usual course of business, such
as fund distribution services, fund management
services, fund investment advisory services,
client referral services, IT services, office rental
and consumption services, deposit placing,
insurance services and corporate management
services. These transactions are on normal
commercial terms and each percentage ratio
(the profits ratio not applicable) set out in
Chapter 14A of the Hong Kong Listing Rules is
less than 0.1% based on the transaction
categories. According to Rule 14A.33 (“De
Minimis Transactions”), these transactions are
exempted from the reporting, announcement
and independent shareholders’ approval
requirements.
Corporate Governance
The Bank endeavors to observe high level
corporate governance principles and practices.
For details of the Bank’s compliance with the
Code on Corporate Governance Practices
contained in Appendix 14 of the Hong Kong
Listing Rules, please refer to the section on
Corporate Governance.
Directors and Supervisors
The Directors and Supervisors of the Bank as at
31 December 2006 are set out in the section of
Directors, Supervisors and Senior Management.
Bank of China Annual Report 2006144
Directors’ Interests in CompetingBusiness
Since August 1998, Sir Frederick Anderson
Goodwin, a non-executive director of our Bank,
has been serving as a Director of the RBS Group
which is the holding company of one of the
world’s largest banking and financial services
groups. The business of RBS Group may
compete directly or indirectly with our Bank.
Save as disclosed above, none of the Directors
is interested in any business which competes or
is likely to compete, either directly or indirectly,
with the business of the Bank.
Emoluments of Directors,Supervisors and Senior Management
Details of the emoluments of Directors,
Supervisors and Senior Management of the
Bank are set out in the section of Directors,
Supervisors, and Senior Management.
Directors’ and Supervisors’ ServiceContracts
None of the Directors or Supervisors has a
service contract with the Bank or any of its
subsidiaries which is not determinable by the
employing company within one year without
payment of compensation other than the
normal statutory compensation.
Directors’ and Supervisors’ Interestsin Contract of Significance
No contracts of significance, in relation to the
Bank’s business to which the Bank, its holding
companies, or any of its subsidiaries or fellow
subsidiaries was a party and in which a Director
or a Supervisor had a material interest, whether
directly or indirectly, subsisted at the end of the
year or at any time during the year.
Directors’ and Supervisors’ Rights toAcquire Shares
On 5 July 2002, the following Directors were
granted options by BOCHK (BVI), the immediate
holding company of BOCHK Holdings, pursuant
to a Pre-Listing Share Option Scheme to
purchase from BOCHK (BVI) existing issued
ordinary shares of BOCHK Holdings at a price of
HK$8.50 per share. BOCHK Holdings is a
subsidiary of the Bank which is also listed on
the Hong Kong Stock Exchange. These options
have a vesting period of four years from 25 July
2002 with a valid exercise period of ten years.
Twenty-five percent of the shares subject to
such options will vest at the end of each year.
Particulars of the outstanding options granted to the Directors of the Bank under the Pre-Listing
Share Option Scheme as at 31 December 2006 are set out below:
Number of share options
Balances BalancesExercise as at as at
price Exercisable Granted on 1 January 31 DecemberDate of grant (HKD) Period 5 July 2002 2006 2006
HUA Qingshan 5 July 2002 8.50 25 July 2003 to 1,446,000 1,446,000 1,446,0004 July 2012
LI Zaohang 5 July 2002 8.50 25 July 2003 to 1,446,000 1,446,000 1,446,0004 July 2012
During the report period, none of the above Directors exercised his options nor had there been any
change in their option rights.

Report of the Board of Directors 145
Save as disclosed above, at no time during the
year was the Bank, its holding companies, or
any of its subsidiaries or fellow subsidiaries a
party to any arrangements to enable the
Directors, Supervisors of the Bank, and their
respective spouses or children below the age of
18 to acquire benefits by means of the
acquisition of shares in, or debentures of, the
Bank or any other body corporate.
Directors’ and Supervisors’ Interestsin Shares, Underlying Shares andDebentures
Save as disclosed above, as at 31 December
2006, none of the Directors or Supervisors of the
Bank had any interests or short positions in the
shares, underlying shares or debentures of the
Bank or any associated corporation (within the
meaning of Part XV of the SFO) as recorded in
the register required to be kept by the Bank
pursuant to section 352 of the SFO or as
otherwise notified to the Bank and the Hong
Kong Stock Exchange pursuant to the Model
Code for Securities Transactions by Directors of
Listed Issuers as set out in Appendix 10 of the
Hong Kong Listing Rules.
Substantial Interests in Share Capital
Please refer to Changes in Share Capital and
Shareholdings of Substantial Shareholders for
details.
Management Contracts
No contracts concerning the management or
administration of the whole or any substantial
part of the business of the Bank were entered
into or existed during the year.
Share Appreciation Rights Plan andShare Option Scheme
Please refer to Note V.32 to the Financial
Statements for details of the share appreciation
rights plan and share option schemes of the
Group.
Please refer to the section “Directors’ and
Supervisors’ Rights to Acquire Shares” for
details of the options granted by BOCHK (BVI)
over shares of BOCHK Holdings pursuant to the
Pre-Listing Share Option Scheme.
Purchase, Sale or Redemption of theBank’s Shares
The Bank issued 8,514,415,652 ordinary shares
to NCSSF on 13 March 2006.
The Bank issued 25,568,590,000 H shares in the
initial public offering and was listed on the Hong
Kong Stock Exchange on 1 June 2006.
3,835,288,000 H shares were further issued
pursuant to the exercise of over allotment
option on 9 June 2006.
The Bank issued 6,493,506,000 A shares on 29
June 2006, and the Bank was listed on the
Shanghai Stock Exchange on 5 July 2006.
As at 31 December 2006, approximately 50
million shares of the Bank were held as treasury
shares. Please refer to Note V.35 to the Financial
Statements for details.

Bank of China Annual Report 2006146
Pre-emptive Rights
There are no provisions for pre-emptive rights
requiring the Bank to offer new shares to
existing shareholders in proportion to their
existing shareholdings under the Articles of
Association. The Articles of Association
provides that if the Bank wishes to increase its
capital, it may offer new shares to non-specified
investors, may issue rights of new shares to
existing shareholders or allot new shares to
existing shareholders, may transfer capital
reserve fund, may issue convertible bonds, or
through other means permitted by competent
supervisory authorities or by laws and
administrative regulations. There are no
compulsory provisions for shareholders to
exercise their pre-emptive rights under the
Articles of Association.
Use of Proceeds from the IPO
All proceeds from its IPO have been used to
strengthen the capital base of the Bank.
Tax Deduction and Exemption
The bank’s salary expense deductible amount
for domestic operations in 2006 approved by the
Ministry of Finance and State Administration of
Taxation is RMB15,669 million, which is larger
than the statutory deductibility limit. Please
refer to Note V.10 to the Financial Statements
for details.
In January 2007, in light of the Notice of
Relating Taxation Issues about the Sponsor Fee
by Bank of China Limited to the Games of the
XXIX Olympiad by the Ministry of Finance and
the State Administration of Taxation (Cai
Shui[2006] No.163), the Ministry of Finance and
the State Administration of Taxation have given
support to the Bank’s donation to the Games of
the XXIX Olympiad, which mainly includes
deduction of the Bank’s sponsor fee to the
Olympic Games and the business tax exemption
in regard to the services rendered to the Beijing
Organizing Committee for the Games of the
XXIX Olympiad.
Auditors
Please refer to Corporate Governance for details
of external auditors. A resolution for the
appointment of external auditors will be
proposed at the forthcoming Annual General
Meeting.
On behalf of the Board
XIAO Gang
Chairman
22 March 2007

Report of the Board of Supervisors 147
Report of the Board of Supervisors
I. Meetings of the Board ofSupervisors
The Board of Supervisors held six meetings in
2006:
(1) The first meeting (on 23 February) was
held by written circulation, examining and
approving the Performance Evaluation
Measures for Full-time Supervisors
Appointed by Shareholders of Bank of
China, for submission to the General
Meeting of Shareholders for review.
(2) The second meeting (on 27 March)
examined and approved the 2005 Financial
Report of Bank of China Limited.
(3) The third meeting (on 12 April) examined
and approved the Report Delivered by the
Board of Supervisors at the 2006 General
Meeting of Shareholders, for submission
to the General Meeting of Shareholders for
review; the meeting also examined and
approved the 2005 performance evaluation
result of full-time supervisors appointed by
shareholders, for submission to the
General Meeting of Shareholders for
review.
(4) The fourth meeting (on 29 April) examined
and approved the Opinions on the Profit
Distribution Plan of Bank of China to be
Submitted to the 2006 General Meeting of
Shareholders (Resumed Session), for
submission to the General Meeting of
Shareholders.
(5) The fifth meeting (on 29 August) examined
and approved the 2006 Interim Report of
Bank of China.
(6) The sixth meeting (on 31 October)
examined and approved the 2006 Third
Quarter Report of Bank of China.
II. Supervision and Inspection Workof the Board of Supervisors
In 2006, pursuant to the PRC Company Law and
the Articles of Association of the Bank, the
Board of Supervisors diligently discharged its
responsibilities by supervising the Board of
Directors and Senior Management, with focus
on financial supervision and compliance
supervision.
Employees of the Office of the Board of
Supervisors, headed by each supervisor,
exercised supervision and inspection in the
Head Office by means of participating in
meetings, having access to documents,
conducting inquiry and interviews; during the
report period. They conducted on-site
inspection on financial and other activities of
seven departments, including the Accounting
Department, Risk Management Department,
Credit Administration Department, and Bank
Card Center. The Board of Supervisors also
assigned staff familiar with the business
operation of the Bank to conduct on-site
inspection of 16 domestic tier-1 branches and
one wholly-owned subsidiary of the Bank,
spending 11 days on average for each entity.
The inspections covered the completeness and

Bank of China Annual Report 2006148
truthfulness of financial reports, truthfulness of
the credit quality, compliance of governing
measures over provisions for loans, and asset
disposal and punishment of its responsible
persons held liable, treasury business risk
management, and circumstances relating to
certain connected transactions.
During the report period, the Board of
Supervisors also conducted an “online survey
and research” among employees by the Bank’s
internal e-mail system. The survey covered the
Bank’s reform, development, management, and
lending business, finance and accounting
affairs, etc. The Board of Supervisors received a
lot of valuable information in the survey, and
summarized the content of the survey into a
document with more than 40,000 words, which
has been delivered to all directors and senior
managers for their reference.
III. Independent Opinions of theBoard of Supervisors onRelevant Issues of the Bankwithin the Report Period
(1) Operations according to the law
It was found that, during the report period, the
Bank’s Board of Directors and Senior
Management did not violate the law, regulation
or the Bank’s Articles of Association, nor did
they infringe upon the Bank’s interests. The
Bank’s internal control system was further
strengthened and improved during the report
period.
(2) Financial position
The financial statements contained in the annual
report truly and fairly reflect the Bank’s financial
position and business performance in the report
period.
(3) Use of the capital raised
During the report period, the Bank raised
USD11.2 billion and RMB20 billion in domestic
and overseas capital market. The use of these
funds is consistent with the Bank’s undertaking
in the prospectus.
(4) Purchase and sale of assets
It was found that there was no purchase or sale
of assets of the Bank that might infringe upon
the interests of shareholders or cause asset
dissipation in the report period.
(5) Affiliated transactions
It was found that there was no unfair connected
transactions that might infringe upon the Bank’s
interests occurred in the report period.
(6) The issue of annual profit largelybeyond the forecast
The Board of Supervisors agrees to the reasons
given by the Board of Directors in relation to the
fact that profits recorded by the Bank in the
report period exceeded its forecast by a
substantial margin in the report period.

Significant Events 149
Significant Events
Listing of H Shares and A Shares
The H Shares of the Bank was listed on the
Hong Kong Stock Exchange on 1 June 2006.
25,568,590,000 H Shares were issued at the
initial public offering. Following the exercise of
the over-allotment option on 9 June 2006, a
further 3,835,288,000 H Shares were issued. The
issuance of H Shares accounted for 11.9% of the
total enlarged share capital at an issue price of
HKD2.95 per share. With the issuance of the
shares, USD11.2 billion was raised.
The Bank conducted a public offer of its A
Shares in the domestic market from 19 to 23
June 2006. These shares were issued at
RMB3.08 per share and commenced trading on
the Shanghai Stock Exchange on 5 July 2006.
6,493,506,000 A Shares were offered,
representing 2.56% of the fully diluted share
capital. A total of RMB20 billion was raised.
The IPOs of H Shares and A Shares accounted
for 14.14% of the total enlarged share capital of
the Bank. After the IPOs, the share capital of the
Bank increased to RMB253,839,162,009 or
253,839,162,009 shares.
Acquisition and Disposal of Asset
On 15 December 2006, the Bank completed its
first post-IPO overseas acquisition with the
purchase of Singapore Aircraft Leasing
Enterprise Pte. Ltd. (“SALE”) for USD965 million
after several rounds of international competitive
bidding.
The selling shareholders are Singapore Airlines
Limited (56.67%1 held by Temasek Holdings
(Private) Limited) (35.5%), WestLB AG (35.5%),
Apfarge Investment Pte. Ltd. (an investment
1 As of 30 May 2006, the share volume held by Temasek
Holdings (Private) Limited in Singapore Airlines
Limited derives from the 05/06 Annual Report of
Singapore Airlines Limited.

Bank of China Annual Report 2006150
vehicle of Singapore government’s Special
Investments Pte. Ltd.) (14.5%), and Seletar
Investments Pte. Ltd. (a wholly-owned
subsidiary of Temasek Holdings (Private)
Limited) (14.5%).
On 31 December 2005, Temasek Holdings
(Private) Limited indirectly held 5% shares of the
Bank via its wholly owned subsidiary, AFH. Its
shareholding proportion declined to 4.805%
after the NCSSF completed its investment in the
Bank on 13 March 2006. According to the
register maintained by the Bank pursuant to
Section 336 of the SFO, the shares held by
Temasek Holdings (Private) Limited in the Bank
accounted for 4.65% of the Bank’s total issued
share capital on 31 December 2006. According
to the opinions of the Bank’s domestic and
overseas legal advisors, the transaction did not
constitute a connected transaction of the Bank.
SALE has been profitable since its
establishment in 1993. After-tax profit reached
USD4.7 million, USD5.2 million and USD34.7
million respectively in 2004–2006. It is a leading
Asia-based aircraft leasing company, with a fleet
of modern Airbus and Boeing aircraft, offering
services to almost 27 airlines in 20 countries
worldwide. The acquisition price represents 1.8
times of SALE’s book value in September 2006,
determined after taking into account its
competitive aircraft orders, purchase price as
well as its management teams which is well
recognized by the market and its international
platform.
Following the acquisition, SALE became the
205th subsidiary of the Group and the first
Chinese-owned international aircraft leasing
company. The acquisition provides the Bank
with a well-established platform to expand into
the global leasing business.
Major Contracts and thePerformance Thereof
During the report period and except as
disclosed, the Bank did not take custody of or
sub-contract the operation or lease any material
business assets from third parties or allowed its
material business assets being subject to such
arrangements. No material cash assets of the
Bank were entrusted to others for management.
The guarantee business is one of our off-
balance sheet items in the ordinary course of
business. The Bank operates guarantee
business in a prudent manner and adopt credit
risk management approach.
During the report period, the Bank or (to the
Bank’s best knowledge) shareholders holding
5% or more shares in the Bank have not made
undertakings that might have significant
adverse impact on the operational results and
financial position of the Bank.
Related Party Transactions
Please refer to Note V.40 to the Financial
Statements for related party transactions during
the report period.
Internal Control
Please refer to Management Discussion and
Analysis for details.

Significant Events 151
Material Litigation and Arbitration
During the report period and except as
disclosed herein, there were no material
litigation and arbitration proceedings that might
have significant adverse impact on the
operation of the Bank.
The Bank has been involved in certain litigation
and arbitration cases in the ordinary course of
business. After consulting professional legal
firms, the Management considers that these
litigation and arbitration cases will not have a
significant adverse impact on the operation of
the Bank.
Handling of Cases
In 2006, the Bank investigated and dealt with 30
cases of offences relating to breaches of laws
and regulations, representing a decrease of
42.31% compared to 52 cases in the previous
year. These cases involved a total of RMB806
million, 25.37% less than last year. The Bank
recovered RMB391 million, which represents
48.51% of the total amount involved, with the
remaining RMB415 million at risk.
The Bank adopts a strict accountability system
with regard to cases relating to breaches of laws
and regulations. In every case, not only persons
directly responsible will be held liable, those
that are indirectly involved, such as supervisors
in the relevant business unit, and management
of the business line at one or even two levels
above as well as the key management
personnel of the relevant entity, will also be held
accountable. Where the case involves more than
RMB1 million, the person in charge of the
business unit will be held accountable and be
allowed to resign or be removed from such
position. The occurrence of such an event will
have a significant adverse impact on the
performance evaluation of the relevant entity. In
2006, a total of 10,413 persons have been held
accountable for breach of laws and regulations,
of which 97 directors of tier two branches or
sub-branches have been removed from their
positions or summarily dismissed. 119 of the
management personnel directly involved and
114 of those indirectly involved were also held
accountable.
Convergence of Enterprise IncomeTax and Income Tax on ForeignInvested Enterprises and ForeignEnterprises
On 16 March 2007, the National People’s
Congress enacted the new PRC Enterprise
Income Tax Law. The enterprise income tax rate
applicable to the Bank will decline from 33% to
25% taking effect from 2008. The Bank will
benefit from the reduction of tax rates
prospectively from 2008. Meanwhile, the Bank
will adjust the deferred income tax assets
according to the new tax rate. Please refer to
Note V.43(1) to the Financial Statements for
detailed information.
Penalty Imposed on Directors,Supervisors and Senior ManagementPersonnel
During the report period, none of the directors,
supervisors or any member of senior
management was subject to any investigation
or administrative punishment from the CSRC,
nor were they publicly reprimanded by any
stock exchange.


1059
7-2
(BO
C -
H S
hare
) \ 2
3/03
/200
7 \ M
03 \
P.15
4
Bank of China Annual Report 2006154
Delivering Growthand Excellence

To the Shareholders of Bank of China Limited
(Incorporated in the People’s Republic of China with Limited Liability)
We have audited the accompanying consolidated financial statements of Bank of China Limited (the ‘‘Bank’’) and its
subsidiaries (together, the ‘‘Group’’) which comprise the consolidated and company balance sheets as at 31
December 2006, and the consolidated income statement, the consolidated statement of changes in equity and the
consolidated cash flow statement for the year then ended, and a summary of significant accounting policies and
other explanatory notes.
DIRECTORS’ RESPONSIBILITY FOR THE FINANCIAL STATEMENTS
The directors of the Bank are responsible for the preparation and the true and fair presentation of these consolidated
financial statements in accordance with International Financial Reporting Standards and the disclosure requirements
of the Hong Kong Companies Ordinance. This responsibility includes: designing, implementing and maintaining
internal control relevant to the preparation and the true and fair presentation of financial statements that are free
from material misstatement, whether due to fraud or error; selecting and applying appropriate accounting policies;
and making accounting estimates that are reasonable in the circumstances.
AUDITOR’S RESPONSIBILITY
Our responsibility is to express an opinion on these consolidated financial statements based on our audit. We
conducted our audit in accordance with International Standards on Auditing. Those Standards require that we
comply with ethical requirements and plan and perform the audit to obtain reasonable assurance whether the
financial statements are free from material misstatement.
An audit involves performing procedures to obtain audit evidence about the amounts and disclosures in the financial
statements. The procedures selected depend on the auditor’s judgment, including the assessment of the risks of
material misstatement of the financial statements, whether due to fraud or error. In making those risk assessments,
the auditor considers internal control relevant to the entity’s preparation and true and fair presentation of the
financial statements in order to design audit procedures that are appropriate in the circumstances, but not for the
purpose of expressing an opinion on the effectiveness of the entity’s internal control. An audit also includes
evaluating the appropriateness of accounting policies used and the reasonableness of accounting estimates made by
the directors, as well as evaluating the overall presentation of the financial statements.
We believe that the audit evidence we have obtained is sufficient and appropriate to provide a basis for our audit
opinion.
Independent Auditor’s Report
Independent Auditor’s Report 155

OPINION
In our opinion, the accompanying consolidated financial statements give a true and fair view of the financial position
of the Bank and the Group as at 31 December 2006, and of the Group’s financial performance and cash flows for the
year then ended in accordance with International Financial Reporting Standards and have been properly prepared in
accordance with the disclosure requirements of the Hong Kong Companies Ordinance.
OTHER MATTERS
This report, including the opinion, has been prepared for and only for you, as a body, and for no other purpose. We
do not assume responsibility towards or accept liability to any other person for the contents of this report.
PricewaterhouseCoopers
Certified Public Accountants
Hong Kong, 22 March 2007
Bank of China Annual Report 2006156

Note 2006 2005
Interest income V.2 215,334 167,948
Interest expense V.2 (93,963) (66,940)
Net interest income 121,371 101,008
Fee and commission income V.3 17,139 12,698
Fee and commission expense V.3 (2,816) (3,451)
Net fee and commission income 14,323 9,247
Net trading (losses)/gains V.4 (1,544) 4,283
Net gains/(losses) on investment securities V.5 1,132 (582)
Other operating income V.6 13,096 11,150
Impairment losses on loans and advances V.17 (12,342) (11,486)
Operating expenses and others V.7 (68,731) (59,984)
Operating profit 67,305 53,636
Share of results of associates and joint ventures V.21 632 175
Profit before income tax 67,937 53,811
Income tax expense V.10 (19,673) (22,253)
Profit for the year 48,264 31,558
Attributable to:
Equity holders of the Bank 42,830 25,921
Minority interest 5,434 5,637
48,264 31,558
Earnings per share for profit attributable to the equity holders of
the Bank during the year
(Expressed in Renminbi per ordinary share)
— Basic and diluted V.11 0.18 0.14
Dividends V.36
Dividends declared and paid during the year — 12,737
Dividends proposed after the balance sheet date 10,154 1,375
10,154 14,112
The accompanying notes form an integral part of these financial statements.
Consolidated Income StatementFor the year ended 31 December 2006 (Amount in millions of Renminbi, unless otherwise stated)
Consolidated Income Statement 157

As at 31 December
Note 2006 2005
ASSETS
Cash and due from banks V.12 39,812 41,082
Balances with central banks V.13 379,631 316,941
Placements with banks and other financial institutions V.14 399,138 332,099
Government certificates of indebtedness for bank notes issued V.26 36,626 35,586
Precious metals 42,083 26,974
Trading assets and other financial instruments at fair value
through profit or loss V.15 115,828 111,782
Derivative financial instruments V.16 24,837 16,808
Loans and advances to customers, net V.17 2,337,726 2,152,112
Investment securities V.18
— available-for-sale 815,178 602,221
— held-to-maturity 461,140 607,459
— loans and receivables 500,336 361,851
Investment in associates and joint ventures V.21 5,931 5,061
Property and equipment V.22 86,200 62,417
Investment property V.23 8,221 8,511
Deferred income tax assets V.33 21,396 20,504
Other assets V.24 53,570 38,640
Total assets 5,327,653 4,740,048
The accompanying notes form an integral part of these financial statements.
Consolidated Balance SheetAs at 31 December 2006 (Amount in millions of Renminbi, unless otherwise stated)
Bank of China Annual Report 2006158

As at 31 December
Note 2006 2005
LIABILITIES
Due to banks and other financial institutions 178,777 134,217
Due to central banks V.25 42,374 30,055
Bank notes in circulation V.26 36,823 35,731
Certificates of deposit and placements from banks
and other financial institutions 146,908 212,626
Derivative financial instruments and liabilities at fair value
through profit or loss V.27 113,048 91,174
Due to customers V.28 4,091,118 3,699,464
Bonds issued V.29 60,173 60,179
Other borrowings V.30 63,398 52,164
Current tax liabilities 18,149 23,459
Retirement benefit obligations V.31 7,444 7,052
Deferred income tax liabilities V.33 3,029 2,136
Other liabilities V.34 153,456 136,272
Total liabilities 4,914,697 4,484,529
EQUITY
Capital and reserves attributable to equity holders of the Bank
Share capital V.35 253,839 209,427
Capital reserve V.35 66,617 (5,954)
Statutory reserves V.36 10,380 5,987
General and regulatory reserves V.36 13,934 5,109
Undistributed profits V.36 38,425 10,188
Reserve for fair value changes of available-for-sale securities V.37 2,009 1,899
Currency translation differences (2,071) (237)
Treasury shares V.35 (216) —
382,917 226,419
Minority interest 30,039 29,100
Total equity 412,956 255,519
Total equity and liabilities 5,327,653 4,740,048
Approved and authorized for issue by the Board of Directors on 22 March 2007.
Xiao Gang
Director
Li Lihui
Director
The accompanying notes form an integral part of these financial statements.
Consolidated Balance Sheet 159

As at 31 December
Note 2006 2005
ASSETS
Cash and due from banks V.12 37,842 38,275
Balances with central banks V.13 354,881 284,373
Placements with banks and other financial institutions V.14 303,002 243,654
Government certificates of indebtedness for bank notes issued V.26 1,713 1,641
Precious metals 40,542 25,238
Trading assets and other financial instruments at fair value
through profit or loss V.15 76,581 82,082
Derivative financial instruments V.16 16,363 11,329
Loans and advances to customers, net V.17 1,971,865 1,788,742
Investment securities V.18
— available-for-sale 706,739 542,142
— held-to-maturity 287,398 415,143
— loans and receivables 458,606 343,910
Investment in subsidiaries V.20 45,451 45,080
Investment in associates and joint ventures V.21 21 45
Property and equipment V.22 49,473 48,061
Investment property V.23 620 461
Deferred income tax assets V.33 21,843 20,389
Other assets V.24 30,272 25,837
Total assets 4,403,212 3,916,402
The accompanying notes form an integral part of these financial statements.
Balance SheetAs at 31 December 2006 (Amount in millions of Renminbi, unless otherwise stated)
Bank of China Annual Report 2006160

As at 31 December
Note 2006 2005
LIABILITIES
Due to banks and other financial institutions 164,376 124,948
Due to central banks V.25 42,349 30,030
Bank notes in circulation V.26 1,909 1,786
Certificates of deposits and placements from banks and other
financial institutions 146,596 215,923
Derivative financial instruments and liabilities at fair value through
profit or loss V.27 91,084 76,323
Due to customers V.28 3,358,565 3,009,187
Bonds issued V.29 60,173 60,179
Other borrowings V.30 46,006 52,164
Current tax liabilities 16,757 22,440
Retirement benefit obligations V.31 7,444 7,052
Deferred income tax liabilities V.33 32 23
Other liabilities V.34 112,527 112,534
Total liabilities 4,047,818 3,712,589
EQUITY
Capital and reserves attributable to equity holders of the Bank
Share capital V.35 253,839 209,427
Capital reserve V.35 66,166 (6,054)
Statutory reserves V.36 9,714 5,465
General and regulatory reserves V.36 11,393 2,618
Undistributed profits/(accumulated losses) V.36 14,385 (8,709)
Reserve for fair value changes of available-for-sale securities V.37 (1,038) 280
Currency translation differences 935 786
Total equity 355,394 203,813
Total equity and liabilities 4,403,212 3,916,402
Approved and authorized for issue by the Board of Directors on 22 March 2007.
Xiao Gang
Director
Li Lihui
Director
The accompanying notes form an integral part of these financial statements.
Balance Sheet 161
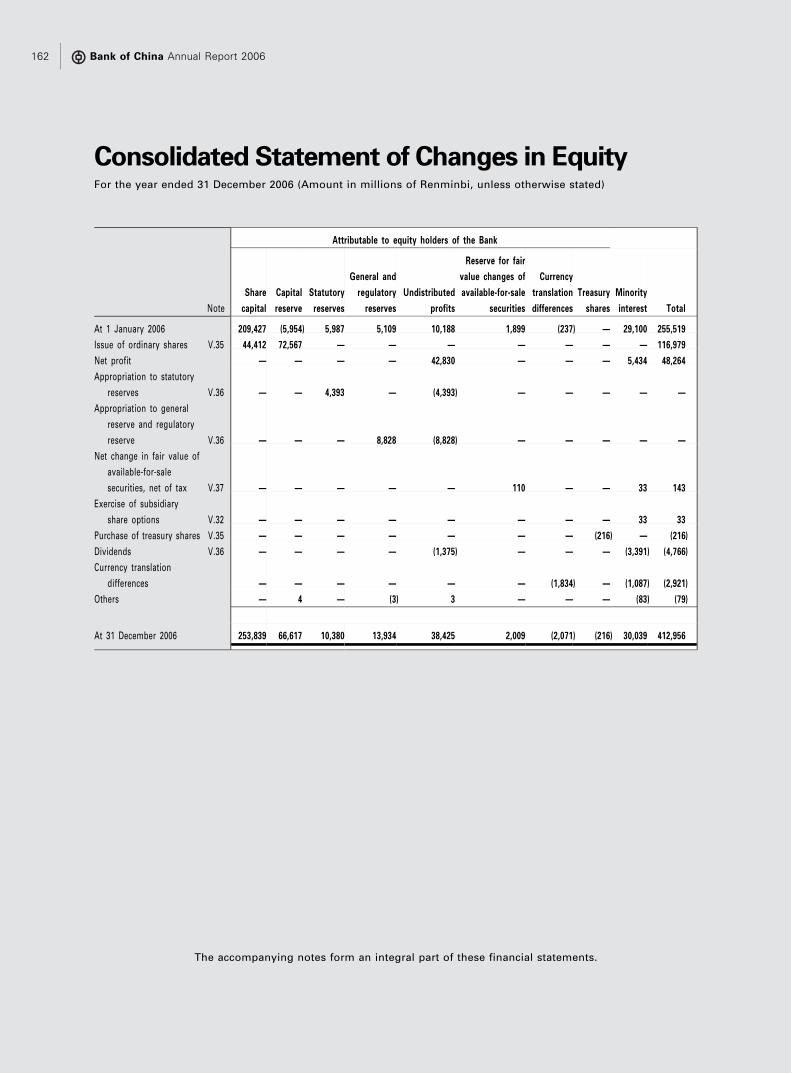
Attributable to equity holders of the Bank
Note
Share
capital
Capital
reserve
Statutory
reserves
General and
regulatory
reserves
Undistributed
profits
Reserve for fair
value changes of
available-for-sale
securities
Currency
translation
differences
Treasury
shares
Minority
interest Total
At 1 January 2006 209,427 (5,954) 5,987 5,109 10,188 1,899 (237) — 29,100 255,519
Issue of ordinary shares V.35 44,412 72,567 — — — — — — — 116,979
Net profit — — — — 42,830 — — — 5,434 48,264
Appropriation to statutory
reserves V.36 — — 4,393 — (4,393) — — — — —
Appropriation to general
reserve and regulatory
reserve V.36 — — — 8,828 (8,828) — — — — —
Net change in fair value of
available-for-sale
securities, net of tax V.37 — — — — — 110 — — 33 143
Exercise of subsidiary
share options V.32 — — — — — — — — 33 33
Purchase of treasury shares V.35 — — — — — — — (216) — (216)
Dividends V.36 — — — — (1,375) — — — (3,391) (4,766)
Currency translation
differences — — — — — — (1,834) — (1,087) (2,921)
Others — 4 — (3) 3 — — — (83) (79)
At 31 December 2006 253,839 66,617 10,380 13,934 38,425 2,009 (2,071) (216) 30,039 412,956
The accompanying notes form an integral part of these financial statements.
Consolidated Statement of Changes in EquityFor the year ended 31 December 2006 (Amount in millions of Renminbi, unless otherwise stated)
Bank of China Annual Report 2006162

For the year ended 31 December 2005 (Amount in millions of Renminbi, unless otherwise stated)
Attributable to equity holders of the Bank
Note
Share
capital
Capital
reserve
Statutory
reserves
General and
regulatory
reserves
Undistributed
profits
Reserve for fair
value changes of
available-for-sale
securities
Currency
translation
differences
Treasury
shares
Minority
interest Total
At 1 January 2005 186,390 (10,432) 3,140 419 16,547 2,730 1,961 — 27,152 227,907
Issue of ordinary shares V.35 23,037 3,964 — — — — — — — 27,001
Net profit — — — — 25,921 — — — 5,637 31,558
Appropriation to Statutory
reserves V.36 — — 2,847 — (2,847) — — — — —
Appropriation to general
reserve and regulatory
reserve V.36 — — — 4,690 (4,690) — — — — —
Net change in fair value
of available-for-sale
securities, net of tax V.37 — — — — — 1,423 — — (110) 1,313
Exercise of subsidiary
share options V.32 — — — — — — — — 17 17
Capital contribution from
Huijin V.35 — 500 — — — — — — — 500
Adoption of equity
accounting for
investment in
associates
V.21;
V.36 — — — — 2,194 (2,254) — — — (60)
Dividends V.36 — — — — (26,937) — — — (2,954) (29,891)
Currency translation
differences — — — — — — (2,198) — (642) (2,840)
Others — 14 — — — — — — — 14
At 31 December 2005 209,427 (5,954) 5,987 5,109 10,188 1,899 (237) — 29,100 255,519
The accompanying notes form an integral part of these financial statements.
Consolidated Statement of Changes in Equity 163

Note 2006 2005
Cash flows from operating activities
Profit before income tax 67,937 53,811
Adjustments:
Impairment losses on loans and advances 12,342 11,486
Reversal of impairment losses on other assets (125) (457)
Depreciation of property and equipment 5,209 5,186
Amortization of intangible assets and other assets 817 1,128
Net gains on disposal of property and equipment and other assets (569) (665)
Net gains on disposal of investments in subsidiaries, associates and
joint ventures (789) (320)
Share of results of associates and joint ventures (632) (175)
Interest expense arising from bonds issued 2,840 2,611
Net changes in operating assets and liabilities:
Net increase in balances with central banks (69,063) (41,130)
Net decrease in due from banks and placements with banks and
other financial institutions 5,266 56,168
Net increase in loans and advances to customers (197,956) (90,679)
Net increase in investment securities (151,786) (375,150)
Net (increase)/decrease in other assets (13,878) 1,139
Net increase in due to banks and other financial institutions 44,560 22,429
Net increase/(decrease) in due to central banks 12,319 (36,683)
Net (decrease)/increase in certificates of deposits and placements
from banks and other financial institutions (65,718) 71,539
Net increase in due to customers 391,654 361,016
Net increase/(decrease) in other liabilities 14,514 (10,274)
Net cash from operating activities 56,942 30,980
Income tax paid (25,536) (17,249)
Net cash inflow from operating activities 31,406 13,731
The accompanying notes form an integral part of these financial statements.
Bank of China Annual Report 2006164
Consolidated Cash Flow StatementFor the year ended 31 December 2006 (Amount in millions of Renminbi, unless otherwise stated)

Note 2006 2005
Cash flows from investing activities
Acquisition of a subsidiary, net of cash acquired V.42 (5,373) —
Payment for increase of investments in subsidiaries, associates
and joint ventures (185) (3,187)
Proceeds from disposal of investments in subsidiaries, associates
and joint ventures 1,120 2,264
Proceeds from disposal of property and equipment, intangible assets
and other assets 1,732 4,291
Dividends received 320 310
Purchase of property and equipment, intangible assets and other assets (7,425) (5,951)
Net cash outflow from investing activities (9,811) (2,273)
Net cash inflow before financing activities 21,595 11,458
Cash flows from financing activities
Proceeds from issuance of ordinary shares 117,423 27,001
Cash received from issuance of subordinated bonds — 33,930
Proceeds from minority equity holders of a subsidiary upon exercise
of subsidiary share options 33 17
Proceeds from minority equity holders of subsidiaries 55 —
Payment of interest on bonds issued (2,774) (1,485)
Dividend paid to equity holders of the Bank (1,375) (26,937)
Dividend paid to minority interest (3,391) (2,954)
Purchases of treasury shares (216) —
Payment of share issuance costs (413) —
Net cash inflow from financing activities 109,342 29,572
Effect of exchange rate changes on cash and cash equivalents (8,105) (10,060)
Net increase in cash and cash equivalents 122,832 30,970
Cash and cash equivalents as at 1 January V.39 397,112 366,142
Cash and cash equivalents as at 31 December V.39 519,944 397,112
The accompanying notes form an integral part of these financial statements.
Consolidated Cash Flow Statement 165

I GENERAL INFORMATION AND PRINCIPAL ACTIVITIES
The Bank, formerly known as Bank of China, was founded on 5 February 1912. From its formation
until 1949, the Bank performed various functions of a central bank, foreign exchange bank and
commercial bank specializing in trade finance. Following the founding of the People’s Republic of
China (the ‘‘PRC’’) in 1949, the Bank was designated as a specialized foreign exchange bank. Since
1994, the Bank has evolved into a state-owned commercial bank. In accordance with the Master
Implementation Plan for the Joint Stock Reform (‘‘Joint Stock Reform Plan’’) approved by the State
Council of the PRC, the Bank was converted into a joint stock commercial bank on 26 August 2004
and its name was changed from Bank of China to Bank of China Limited.
The PRC Government, through Central SAFE Investments Limited (‘‘Huijin’’), owned 83.15% of the
ordinary shares of the Bank as of 31 December 2005 with the remaining shares owned by strategic
investors. During 2006, the Bank issued 8,514,415,652 ordinary shares to the National Council for
Social Security Fund (‘‘NCSSF’’) and 35,897,384,000 ordinary shares through offerings related to
listings on the Stock Exchange of Hong Kong Limited (‘‘Hong Kong Stock Exchange’’) and the
Shanghai Stock Exchange. Huijin owned 67.49% of the Bank’s outstanding ordinary shares as at 31
December 2006. The Bank remains a state-controlled joint stock commercial bank. See Note V 35.
The Bank is licensed as a financial institution by the China Banking Regulatory Commission (the
‘‘CBRC’’) [No. B10311000H0001] and is registered as a business enterprise with the State
Administration of Industry and Commerce of the PRC [No. 1000001000134].
The Group provides a full range of corporate banking, personal banking, treasury operations,
investment banking, insurance and related financial services to its customers in the PRC, Hong
Kong Special Administrative Region of the PRC (‘‘Hong Kong’’), Macau Special Administrative
Region of the PRC (‘‘Macau’’) and other major international financial centers.
The Head Office of the Bank and its branches operating in the PRC are referred to as Domestic
Operations. Branches and subsidiaries domiciled outside the PRC, including those located in Hong
Kong and Macau, are referred to as Overseas Operations.
The Bank’s principal regulator is the CBRC. The Overseas Operations of the Group are subject to
the supervision of local regulators.
These financial statements have been approved by the Board of Directors on 22 March 2007.
Notes to the Financial StatementsFor the year ended 31 December 2006 (Amount in millions of Renminbi, unless otherwise stated)
Bank of China Annual Report 2006166
II SUMMARY OF PRINCIPAL ACCOUNTING POLICIES
1 Basis of presentation
The principal accounting policies adopted in the preparation of the financial statements are
set out below. These policies have been applied consistently to all periods presented.
The financial statements have been prepared in accordance with International Financial
Reporting Standards (‘‘IFRS’’) and have been prepared under the historical cost convention
as modified by the revaluation of available-for-sale investment securities, investment
property, financial assets and financial liabilities at fair value through profit or loss and
derivative financial instruments.
The preparation of the financial statements in conformity with IFRS requires the use of
certain critical accounting estimates. It also requires management to exercise its judgment in
the process of applying the Group’s accounting policies. The areas involving a higher degree
of judgment or complexity, or areas where assumptions and estimates are significant to the
financial statements are disclosed in Note IV.
(1) Amendments and interpretations to published standards effective in 2006 and relevant
to the Group’s operations
. IAS 19 (Amendment), Employee Benefits, was effective for accounting periods
beginning on or after 1 January 2006. It introduces the option of an alternative
recognition approach for actuarial gains and losses. It imposes additional
recognition requirements for multi-employer plans where insufficient
information is available to apply defined benefit accounting. It also adds new
disclosure requirements. The Group does not intend to adopt this option and the
effect of this amendment is limited to the format and extent of disclosures
presented in the financial statements.
. IAS 21 (Amendment), Net Investment in a Foreign Operation, requires that
exchange differences on monetary items forming a part of the net investment in a
foreign operation should be reclassified as equity, whether or not the monetary
item is denominated in the functional currency of either the reporting entity or the
foreign operation. An additional example is included to clarify that sister-
company loans can form part of a group’s net investment in a foreign
operation. This amendment was effective for annual periods beginning on or
after 1 January 2006, and had no material effect on the Group’s results of
operations or financial position.
Notes to the Financial Statements 167
II SUMMARY OF PRINCIPAL ACCOUNTING POLICIES (Continued)
1 Basis of presentation (Continued)
(1) Amendments and interpretations to published standards effective in 2006 and relevant
to the Group’s operations (Continued)
. IAS 39 (Amendment), The Fair Value Option, was effective for accounting periods
beginning on or after 1 January 2006. This amendment restricts the
circumstances under which the fair value option in IAS 39 can be used, as
compared to the previously existing provisions of IAS 39. The adoption of this
amendment to IAS 39 does not have a material effect on the Group’s results of
operations or financial position. The Group’s use of the fair value option in the
past had complied with the more restrictive provisions of the amendment to IAS
39.
. IAS 39 and IFRS 4 (Amendments), Financial Guarantee Contracts, are effective for
accounting periods beginning on or after 1 January 2006. These amendments
require any new or existing financial guarantee contracts that were previously not
accounted for under IFRS 4 to be accounted for under IAS 39. The adoption of
these amendments did not have a material impact on the Group’s results of
operations or financial position. No material amounts of financial guarantees
were accounted for under IFRS 4.
(2) Standards, amendments and interpretations that are not yet effective and have not
been adopted early by the Group
The Group has chosen not to early adopt the following standards, amendments and
interpretations to existing standards that were issued but are not yet effective for
accounting periods beginning on 1 January 2006:
. IFRS 7, Financial Instruments: Disclosures and IAS 1, Presentation of Financial
Statements — Capital Disclosures (Amendment), are effective for annual periods
beginning on or after 1 January 2007. IFRS 7 introduces certain new disclosures
relating to financial instruments while incorporating many of the requirements
presently in IAS 32. IFRS 7 will supersede IAS 30 Disclosures in the Financial
Statements of Banks and Similar Financial Institutions, and the disclosure
requirements of IAS 32 Financial Instruments: Disclosure and Presentation. The
Group has assessed the impact of IFRS 7 and the amendment to IAS 1 and
concluded that the key impact will be more qualitative and quantitative
disclosures primarily related to fair value measurement and risk management.
The adoption of this standard will have no effect on the Group’s results of
operations or financial position. The Group will apply IFRS 7 and the amendment
to IAS 1 from annual periods beginning 1 January 2007.
Bank of China Annual Report 2006168
(Amount in millions of Renminbi, unless otherwise stated)
II SUMMARY OF PRINCIPAL ACCOUNTING POLICIES (Continued)
1 Basis of presentation (Continued)
(2) Standards, amendments and interpretations that are not yet effective and have not
been adopted early by the Group (Continued)
. IFRS 8, Operating Segments is effective for annual periods beginning on or after 1
January 2009. IFRS 8 supersedes IAS 14, Segment Reporting, under which
segments were identified and reported on the basis of a risk and return analysis.
Items were reported on the basis of the accounting policies used for external
reporting. Under IFRS 8, segments are components of an entity regularly
reviewed by an entity’s chief operating decision-maker. Items are reported
based on internal reporting. This interpretation is not expected to have a material
effect on the Group’s operating results or financial position.
(3) Standards, amendments and interpretations that are not yet effective and have not
been early adopted by the Group
. IFRIC 8, Scope of IFRS 2 is effective for annual periods beginning on or after 1 May
2006. IFRIC 8 requires consideration of transactions involving the issuance of
equity instruments — where the identifiable consideration received is less than
the fair value of the equity instruments issued — to establish whether or not they
fall within the scope of IFRS 2. This interpretation is not expected to have a
material effect on the Group’s operating results or financial position.
. IFRIC 9, Reassessment of Embedded Derivatives is effective for annual periods
beginning on or after 1 June 2006 and requires an entity to assess whether an
embedded derivative is required to be separated from the host contract and
accounted for as a derivative when the entity first becomes a party to the contract.
Subsequent reassessment is prohibited unless there is a change in the terms of
the contract that significantly modifies the cash flows that otherwise would be
required under the contract, in which case reassessment is required. This
interpretation is not expected to have a material effect on the Group’s
operating results or financial position.
. IFRIC 10, Interim Financial Reporting and Impairment is effective for annual
periods beginning on or after 1 November 2006 and prohibits the impairment
losses recognized in an interim period on goodwill, investments in equity
instruments and investments in financial assets carried at cost to be reversed at a
subsequent balance sheet date. This interpretation is not expected to have a
material effect on the Group’s operating results or financial position.
Notes to the Financial Statements 169
II SUMMARY OF PRINCIPAL ACCOUNTING POLICIES (Continued)
1 Basis of presentation (Continued)
(3) Standards, amendments and interpretations that are not yet effective and have not
been early adopted by the Group (Continued)
. IFRIC 11, IFRS 2 — Group and Treasury Share Transactions is effective for annual
periods beginning on of after 1 March 2007 and clarifies the accounting by a
subsidiary when its employees receive shares of its parent as equity-settled or
cash-settled transactions. It also addresses the accounting for share-based
payment transactions involving two or more entities within one group. This
interpretation is not expected to have a material effect on the Group’s operating
results or financial position.
2 Group accounts
(1) Consolidation
(a) Subsidiaries
Subsidiaries are all entities (including special purpose entities) over which the
Group has the power to govern the financial and operating policies generally
accompanying a shareholding of more than one half of the voting rights. The
existence and effect of potential voting rights that are currently exercisable or
convertible are considered when assessing whether the Group controls another
entity. Subsidiaries are fully consolidated from the date on which control is
transferred to the Group. They are de-consolidated from the date that control
ceases.
The purchase method of accounting is used to account for the acquisition of
subsidiaries by the Group. The cost of an acquisition is measured as the fair value
of the assets given, equity instruments issued and liabilities incurred or assumed
at the date of exchange, plus costs directly attributable to the acquisition.
Identifiable assets (including intangible assets) acquired and liabilities and
contingent liabilities assumed in a business combination are measured initially
at their fair values at the acquisition date, irrespective of the extent of any
minority interest. The excess of the cost of acquisition over the fair value of the
Group’s share of the identifiable net assets acquired is recorded as goodwill. If
the cost of acquisition is less than the fair value of the net assets of the subsidiary
acquired, the difference is recognized directly in the income statement.
Bank of China Annual Report 2006170
(Amount in millions of Renminbi, unless otherwise stated)
II SUMMARY OF PRINCIPAL ACCOUNTING POLICIES (Continued)
2 Group accounts (Continued)
(1) Consolidation (Continued)
(a) Subsidiaries (Continued)
Inter-company transactions, balances and unrealized gains on transactions
between group companies are eliminated; unrealized losses are also eliminated
unless the transaction provides evidence of impairment of the assets transferred.
Where necessary, accounting policies of subsidiaries have been changed to
ensure consistency with the policies adopted by the Group.
In the Bank’s balance sheets, investment in subsidiaries is stated at cost less
allowance for impairment losses. The results of subsidiaries are accounted for by
the Bank on the basis of dividends received or receivable.
(b) Transactions with minority interests
The Group applies a policy of treating transactions with minority interests as
transactions with parties external to the Group. Disposal to minority interests
results in gains and losses to the Group that is recorded in the income statement.
Purchases from minority interests result in goodwill, being the difference
between any consideration paid and the relevant share acquired of the carrying
value of net assets of the subsidiary.
(c) Associates and joint ventures
Associates are entities over which the Group has significant influence but not
control, generally accompanying a shareholding of between 20% and 50% of the
voting rights.
Joint ventures exist where the Group has a contractual arrangement with one or
more parties to undertake economic activities which are subject to joint control.
These economic activities typically, though not necessarily, are undertaken
through separately established entities.
Investments in associates and joint ventures are accounted for using the equity
method of accounting and are initially recognized at cost. The Group’s investment
in associates and joint ventures includes goodwill, net of accumulated
impairment loss.
Notes to the Financial Statements 171

II SUMMARY OF PRINCIPAL ACCOUNTING POLICIES (Continued)
2 Group accounts (Continued)
(1) Consolidation (Continued)
(c) Associates and joint ventures (Continued)
The Group’s share of the post-acquisition profits or losses of associates and joint
ventures is recognized in the income statement, and its share of post-acquisition
movements in reserves is recognized in reserves. The cumulative post-acquisition
movements are adjusted against the cost of the investment. When the Group’s
share of losses in an associate or joint venture equals or exceeds its interest in the
associate or joint venture, the Group does not recognize further losses unless the
Group has incurred obligations or made payments on behalf of the associate or
joint venture.
Unrealized gains on transactions between the Group and its associates and joint
ventures are eliminated to the extent of the Group’s interest in the associates or
joint ventures; unrealized losses are also eliminated unless the transaction
provides evidence of impairment of the asset transferred.
In the Bank’s balance sheets, the investments in associated companies and joint
ventures are stated at cost less allowance for impairment losses. The results of
associated companies and joint ventures are accounted for by the Bank on the
basis of dividends received or receivable.
(2) Segment reporting
A business segment is a group of assets and operations engaged in providing products
and services that are subject to risks and returns that are different from those of other
business segments. A geographical segment is engaged in providing products and
services within a particular economic environment that are subject to risks and returns
that are different from those of segments operating in other economic environments.
3 Derivative financial instruments
Derivatives are initially recognized at fair value on the date on which a derivative contract is
entered into and are subsequently re-measured at their fair value. Fair values are obtained
from quoted market prices in active markets, including recent market transactions, and
through the use of valuation techniques, including discounted cash flow models and option
pricing models, as appropriate. All derivatives are carried as assets when fair value is
positive and as liabilities when fair value is negative.
Bank of China Annual Report 2006172
(Amount in millions of Renminbi, unless otherwise stated)

II SUMMARY OF PRINCIPAL ACCOUNTING POLICIES (Continued)
3 Derivative financial instruments (Continued)
The best evidence of the fair value of a derivative at initial recognition is the transaction price
(i.e. the fair value of the consideration given or received) unless the fair value of that
instrument is evidenced by comparison with other observable current market transactions in
the same instrument (i.e. without modification or repackaging) or based on a valuation
technique whose variables include only data from observable markets. When such evidence
exists, the Group recognizes profits on day one.
Certain derivatives embedded in other financial instruments, such as the conversion option
in a convertible bond, are treated as separate derivatives when their economic
characteristics and risks are not closely related to those of the host contract and the host
contract is not carried as at fair value through profit or loss. These embedded derivatives are
measured at fair value with changes in fair value recognized in the income statement unless
the Group chooses to designate the hybrid contracts at fair value through profit or loss.
While certain derivative transactions are intended to provide effective economic hedges of
specific interest rate and foreign exchange risks, they do not qualify for hedge accounting
under the specific requirements of IAS 39 and are treated as derivatives held for trading with
changes in fair value reported as net trading (losses)/gains. The Group has no derivative
positions that are designated as hedging instruments.
4 Foreign currency translation
(1) Functional and presentation currency
Items included in the financial statements of each of the Group’s entities are measured
using the currency of the primary economic environment in which the entity operates
(the ‘‘functional currency’’). The financial statements are presented in RMB, which is the
Bank’s functional and presentation currency.
(2) Transactions and balances
Foreign currency transactions are translated into the functional currency using the
exchange rates prevailing at the dates of the transactions. Foreign exchange gains and
losses resulting from the settlement of such transactions and from the translation at
year-end exchange rates of monetary assets and liabilities denominated in foreign
currencies are recognized in the income statement.
Translation differences on non-monetary financial assets and liabilities are reported as
part of the fair value gain or loss. Translation differences on non-monetary financial
assets and liabilities such as equities held at fair value through profit or loss are
recognized in income statement as part of the fair value gain or loss. Translation
differences on non-monetary financial assets such as equities classified as available-
for-sale are included in the available-for-sale reserve in equity.
Notes to the Financial Statements 173
II SUMMARY OF PRINCIPAL ACCOUNTING POLICIES (Continued)
4 Foreign currency translation (Continued)
(3) Group companies
The results and financial position of all the group entities that have a functional
currency different from RMB are translated into RMB as follows:
i. assets and liabilities for each balance sheet presented are translated at the closing
rate at the date of that balance sheet;
ii. income and expenses for each income statement are translated at average
exchange rates; and
iii. all resulting exchange differences are recognized as a separate component of
equity.
On consolidation, exchange differences arising from the translation of the net
investment in foreign entities and monetary items that are part of the net investment
in foreign entities are recognized in equity. When a foreign entity is sold, these
exchange differences are recognized in the income statement, as part of the gain or
loss on sale.
Goodwill and fair value adjustments arising on the acquisition of a foreign entity are
treated as assets and liabilities of the foreign entity and translated at the closing rate.
5 Interest income and expense
Interest income and expense are recognized in the income statement for all instruments
measured at amortized cost using the effective interest method.
The effective interest method is a method of calculating the amortized cost of a financial
asset or a financial liability and of allocating the interest income or interest expense over the
relevant period. The effective interest rate is the rate that exactly discounts estimated future
cash payments or receipts through the expected life of the financial instrument or, when
appropriate, a shorter period to the net carrying amount of the financial asset or financial
liability. When calculating the effective interest rate, the Group estimates cash flows
considering all contractual terms of the financial instrument but does not consider future
credit losses. The calculation includes all amounts paid or received by the Group that are an
integral part of the effective interest rate, including transaction costs and all other premiums
or discounts.
Once a financial asset or a group of similar financial assets has been written down as a result
of an impairment loss, interest income is recognized using the rate of interest used to
discount the future cash flows for the purpose of measuring the impairment loss.
Bank of China Annual Report 2006174
(Amount in millions of Renminbi, unless otherwise stated)
II SUMMARY OF PRINCIPAL ACCOUNTING POLICIES (Continued)
6 Fee and commission income
Fees and commissions are recognized on an accrual basis when the related service has been
provided.
Loan commitment fees for loans that are likely to be drawn down are deferred (together with
related direct costs) and recognized as an adjustment to the effective interest rate on the
loan. Loan syndication fees are recognized as revenue when the related syndication
arrangement has been completed and the Group has retained no part of the loan package for
itself or has retained a part at the same effective interest rate as that of other participants.
Commission and fees arising from negotiating, or participating in the negotiation of, a
transaction for a third party, such as the arrangement of the acquisition of shares or other
securities or the purchase or sale of businesses, are generally recognized on completion of
the underlying transaction.
Portfolio and other management advisory and service fees are recognized based on the
applicable service contracts, usually on a time-apportionate basis. Fund management fees
and custodian service fees are recognized ratably over the period that the service is
provided.
7 Financial assets
The Group classifies its financial assets into the following categories: financial assets at fair
value through profit or loss; loans and receivables; held-to-maturity investments and
available-for-sale investments. Management determines the classification of its financial
assets at initial recognition.
(1) Financial assets at fair value through profit or loss
This category has two sub-categories: financial assets held for trading, and those
designated at fair value through profit or loss at inception.
A financial asset which has been acquired or received principally for the purpose of
selling or repurchasing in the near term or is part of a portfolio of identified financial
instruments that are managed together and for which there is evidence of a recent
actual pattern of short-term profit-taking, is classified as held-for-trading. All
derivatives are also classified as held for trading.
Notes to the Financial Statements 175
II SUMMARY OF PRINCIPAL ACCOUNTING POLICIES (Continued)
7 Financial assets (Continued)
(1) Financial assets at fair value through profit or loss (Continued)
A financial asset, other than one held for trading, is classified as financial assets at fair
value through profit or loss if it meets the criteria set out below and is so designated by
management:
. the designation eliminates or significantly reduces a measurement or recognition
inconsistency that would otherwise arise from measuring the financial assets or
liabilities or recognizing the gains and losses on them on different bases; or
. applies to a group of financial assets, financial liabilities or both that is managed
and its performance evaluated on a fair value basis, in accordance with a
documented risk management or investment strategy, and where information
about that group of financial instruments is provided internally on that basis to
key management personnel; or
. relates to financial instruments containing one or more embedded derivatives
that significantly modifies the cash flows resulting from those financial
instruments.
These assets are recognized initially at fair value, with transaction costs taken directly
to the income statement on the trade date, the date on which the Group commits to
purchase or sell the asset, and are subsequently remeasured at fair value.
Gains and losses from changes in the fair value of such assets (excluding interest
accruals) are reported in net trading (losses)/gains. The accrual of interest is reported in
interest income.
(2) Loans and receivables
Loans and receivables are non-derivative financial assets with fixed or determinable
payments that are not quoted in an active market, including balances with central
banks, placements with banks and other financial institutions, investment securities
classified as loans and receivables and loans and advances to customers. They arise
when the Group advances cash directly to a borrower or issuer with no intention of
trading the receivables. Loans and advances to customers are recognized when cash is
advanced to borrowers. Regular way purchases and sales of loans and receivables are
recognized on the trade date. They are initially recorded at fair value plus any directly
attributable transaction costs and are subsequently measured at amortized cost using
the effective interest rate, less allowances for impairment losses.
Bank of China Annual Report 2006176
(Amount in millions of Renminbi, unless otherwise stated)

II SUMMARY OF PRINCIPAL ACCOUNTING POLICIES (Continued)
7 Financial assets (Continued)
(2) Loans and receivables (Continued)
The Group transfers (or ‘‘re-discounts’’) certain trade bills to banks and other financial
institutions. These trade bills are derecognized on transfer when all risks and rewards
have been transferred. When the criteria for derecognition have not been met, the
related transactions are accounted for as secured borrowings and an obligation is
recorded as placements from banks and other financial institutions, as appropriate.
(3) Held-to-maturity
Financial assets classified as held-to-maturity are non-derivative financial assets traded
in active markets, with fixed or determinable payments and fixed maturities that the
Group’s management has both the positive intention and the ability to hold to maturity.
Were the Group to sell other than an insignificant amount of held-to-maturity assets,
the entire category would be tainted and reclassified as available-for-sale investments.
They are initially recorded at fair value plus any directly attributable transaction costs
on the trade date, the date on which the Group commits to purchase the asset, and are
subsequently measured at amortized cost using the effective interest rate, less
allowance for impairment losses.
(4) Available-for-sale
Financial assets classified as available-for-sale are non-derivatives that are either
designated as such or are not classified in any of the other categories. They are
intended to be held for an indefinite period of time, which may be sold in response to
needs for liquidity or changes in interest rates, exchange rates or equity prices.
Available-for-sale financial assets are initially recorded at fair value plus any directly
attributable transaction costs on the trade date, the date on which the Group commits
to purchase the asset and are subsequently re-measured at fair value. Gains and losses
arising from changes in the fair value of financial assets classified as available-for-sale
are recognized directly in equity, until the financial asset is derecognized or impaired at
which time the cumulative gain or loss previously recognized in equity should be
recognized in profit or loss. Interest calculated using the effective interest method is
recognized in the income statement. Dividends on equity instruments classified as
available-for-sale are recognized in the income statement when the Group’s right to
receive payment is established.
Notes to the Financial Statements 177
II SUMMARY OF PRINCIPAL ACCOUNTING POLICIES (Continued)
7 Financial assets (Continued)
(4) Available-for-sale (Continued)
Changes in the fair value of monetary securities denominated in a foreign currency and
classified as available-for-sale are analyzed between translation differences resulting
from changes in amortized cost of the securities and other changes in the carrying
amount of the securities. The translation differences on monetary securities are
recognized in income statement; translation differences on non-monetary securities are
recognized in equity. Changes in the fair value of monetary and non-monetary
securities classified as available-for-sale are recognized in equity.
(5) Derecognition of financial assets
Financial assets are derecognized when the rights to receive cash flows from the
investments have expired or have been transferred and the Group has transferred
substantially all risks and rewards of ownership.
(6) Determination of fair value
The fair values of quoted investments are based on current bid prices. If the market for
a financial asset is not active or the security is unlisted, the Group establishes fair value
by using valuation techniques. These include the use of recent arm’s length
transactions, reference to other instruments that are substantially the same,
discounted cash flow analysis and option pricing models, making maximum use of
market inputs and relying as little as possible on entity-specific inputs.
8 Insurance contracts
(1) Insurance contracts classification, recognition and measurement
The Group’s insurance subsidiaries issue insurance contracts that transfer significant
insurance risk. As a general guideline, the Group defines as significant insurance risk
the possibility of having to pay benefits on the occurrence of an insured event that are
at least 10% more than the benefit payable if the insured event did not occur. The
Group issues general insurance contracts, which cover casualty and property insurance
risk, and long term business insurance contracts, which insure events associated with
human life (for example death, or survival) over a long duration. The Group does not
separately measure embedded derivatives that meet the definition of an insurance
contract or options to surrender insurance contracts for a fixed amount (or an amount
based on a fixed amount and an interest rate).
Bank of China Annual Report 2006178
(Amount in millions of Renminbi, unless otherwise stated)

II SUMMARY OF PRINCIPAL ACCOUNTING POLICIES (Continued)
8 Insurance contracts (Continued)
(1) Insurance contracts classification, recognition and measurement (Continued)
Premiums on general insurance contracts are recognized as revenue (earned
premiums) proportionally over the period of coverage. The portion of premium
received on in-force contracts that relates to unexpired risks at the balance sheet date is
reported as the unearned premium liability. Premiums are recognized before the
deduction of commissions.
Claims and loss adjustment expenses are charged to the income statement as incurred
based on the estimated liability for compensation owed to contract holders or third
parties damaged by the contract holders. They include direct and indirect claims
settlement costs and arise from events that have occurred up to the balance sheet date
even if they have not yet been reported to the Group.
Premiums on long-term business insurance contracts are recognized as revenue when
they become payable by the contract holders. Premiums are recognized before the
deduction of commissions. Benefits and claims are recorded as an expense when they
are incurred. A liability for contractual benefits that are expected to be incurred in the
future is recorded when premiums are recognized. For certain long-term insurance
contracts (linked long term insurance contracts) with embedded derivatives linking
payments on the contract to units of an investment fund set up by the Group with the
consideration received from the contract holders, the liability is adjusted for all
changes in the fair value of the underlying assets, and includes a liability for
contractual benefits that are expected to be incurred in the future which is recorded
when the premiums are recognized.
(2) Deferred policy acquisition costs (‘‘DAC’’)
Commissions and other acquisition costs for general insurance contracts that vary with
and are related to securing new contracts and renewing existing contracts are
capitalized as DAC, an intangible asset. All other costs are recognized as expenses
when incurred. The DAC is subsequently amortized over the terms of the policies as
premiums are earned.
(3) Liability adequacy test
At each balance sheet date, liability adequacy tests are performed to ensure the
adequacy of the insurance contract liabilities (including unearned premium in the case
of general insurance contracts). Any deficiency is immediately charged to the income
statement, with a provision established for losses arising from the liability adequacy
test.
Notes to the Financial Statements 179
II SUMMARY OF PRINCIPAL ACCOUNTING POLICIES (Continued)
9 Sale and repurchase agreements
Securities and bills sold subject to repurchase agreements (‘‘repos’’) are recorded as
investment securities or loans and advances to customers. The counterparty liability is
included in Placements from banks and other financial institutions or Due to central banks,
as appropriate. Securities and bills purchased under agreements to resell (‘‘reverse repos’’)
are recorded as Placements with banks and other financial institutions, as appropriate. The
difference between sale and repurchase price is treated as interest and accrued over the life
of the agreements using the effective interest method.
Securities lending transactions are generally secured, with collateral taking the form of
securities or cash advanced or received. Securities lent to counterparties are retained in the
financial statements. Cash collateral advanced or received is recorded as an asset or a
liability respectively.
10 Foreclosed assets
Foreclosed assets are accounted as ‘‘Assets held for sale’’ and reported in ‘‘Other assets’’ and
the relevant loans are derecognized. The foreclosed assets are measured at lower of carrying
amount and net realizable value.
11 Precious metals and precious metals swaps
Precious metals comprise gold, silver and other precious metals. Precious metals that are
not related to the Group’s precious metals trading activities are carried at cost. Precious
metals that are related to the Group’s trading activities are initially recognized at cost and
subsequently re-measured at their respective market prices at the balance sheet date.
Marked-to-market gains or losses on precious metals related to the Group’s trading activities
are included in Net trading (losses)/gains.
The Group receives all risks and rewards of ownership related to bullion deposited with the
Group as bullion deposits, including the right to freely pledge or transfer, and it records the
gold bullion received as an asset. A liability to return the amount of gold bullion deposited is
also recognized. This obligation is measured at cost unless the Group does not possess
sufficient gold bullion to meet the obligation giving rise to the liability. To the extent the
liability exceeds the related asset, the open position is marked to market.
Gold bullion and other precious metals sold subject to linked repurchase agreements are not
derecognized and the related counter-party liability is recorded as Placements from banks
and other financial institutions or Due to central bank, as appropriate.
Bank of China Annual Report 2006180
(Amount in millions of Renminbi, unless otherwise stated)

II SUMMARY OF PRINCIPAL ACCOUNTING POLICIES (Continued)
12 Impairment of financial assets
(1) Assets carried at amortized cost
The Group assesses at each balance sheet date whether there is objective evidence that
a financial asset or group of financial assets is impaired. A financial asset or a group of
financial assets is impaired and impairment losses are incurred if, and only if, there is
objective evidence of impairment as a result of one or more events that occurred after
the initial recognition of the asset (a ‘‘loss event’’) and that loss event (or events) has an
impact on the estimated future cash flows of the financial asset or group of financial
assets that can be reliably estimated. Objective evidence that a financial asset or group
of assets is impaired includes observable data that comes to the attention of the Group
about the following loss events:
(i) significant financial difficulty of the issuer or obligor;
(ii) a breach of contract, such as a default or delinquency in interest or principal
payments;
(iii) the Group granting to the borrower, for economic or legal reasons relating to the
borrower’s financial difficulty, a concession that the lender would not otherwise
consider;
(iv) it becoming probable that the borrower will enter into bankruptcy or other
financial reorganization;
(v) the disappearance of an active market for that financial asset because of financial
difficulties; or
(vi) observable data indicating that there is a measurable decrease in the estimated
future cash flows from a group of financial assets since the initial recognition of
those assets, although the decrease cannot yet be identified with the individual
financial assets in the group, including:
— adverse changes in the payment status of borrowers in the group; or
— national or local economic conditions that correlate with defaults on the
assets in the group.
Notes to the Financial Statements 181

II SUMMARY OF PRINCIPAL ACCOUNTING POLICIES (Continued)
12 Impairment of financial assets (Continued)
(1) Assets carried at amortized cost (Continued)
The Group first assesses whether objective evidence of impairment exists individually
for financial assets that are individually significant. The Group then performs a
collective assessment for all other financial assets that are not individually significant
or for which impairment has not yet been identified. If the Group determines that no
objective evidence of impairment exists for an individually assessed financial asset, it
includes the asset in a group of financial assets with similar credit risk characteristics
and collectively assesses them for impairment. Assets that are individually assessed
for impairment and for which an impairment loss is or continues to be recognized are
not included in a collective assessment of impairment.
If there is objective evidence that an impairment loss on loans and receivables or held-
to-maturity investments has been incurred, the amount of the loss is measured as the
difference between the asset’s carrying amount and the present value of estimated
future cash flows (excluding future credit losses that have not been incurred)
discounted at the financial asset’s original effective interest rate. The carrying
amount of the asset is reduced through the use of an allowance account and the
amount of the loss is recognized in the income statement. If a loan or held-to-maturity
investment has a variable interest rate, the discount rate for measuring any impairment
loss is the current effective interest rate determined under the contract. As a practical
expedient, the Group may measure impairment on the basis of an instrument’s fair
value using an observable market price.
The calculation of the present value of the estimated future cash flows of a
collateralized financial asset reflects the cash flows that may result from foreclosure
less costs for obtaining and selling the collateral, whether or not foreclosure is
probable.
For the purposes of a collective assessment of impairment, financial assets are
grouped on the basis of similar and relevant credit risk characteristics. Those
characteristics are relevant to the estimation of future cash flows for groups of such
assets by being indicative of the debtors’ ability to pay all amounts due according to
the contractual terms of the assets being evaluated.
Future cash flows in a group of financial assets that are collectively evaluated for
impairment are estimated on the basis of the contractual cash flows of the assets in the
group and historical loss experience for assets with credit risk characteristics similar to
those in the group. Historical loss experience is adjusted on the basis of current
observable data to reflect the effects of current conditions that did not affect the period
on which the historical loss experience is based and to remove the effects of conditions
in the historical period that do not exist currently.
Bank of China Annual Report 2006182
(Amount in millions of Renminbi, unless otherwise stated)

II SUMMARY OF PRINCIPAL ACCOUNTING POLICIES (Continued)
12 Impairment of financial assets (Continued)
(1) Assets carried at amortized cost (Continued)
Estimates of changes in future cash flows for groups of assets should reflect and be
directionally consistent with changes in related observable data from period to period.
The methodology and assumptions used for estimating future cash flows are reviewed
regularly by the Group to reduce any differences between loss estimates and actual
loss experience.
When a loan is uncollectable, it is written off against the related allowances for loan
impairment. Such loans are written off after all the necessary procedures have been
completed and the amount of the loss has been determined. Subsequent recoveries of
amounts previously written off decrease the amount of the allowances for loan
impairment in the income statement.
If, in a subsequent period, the amount of the impairment loss decreases and the
decrease can be related objectively to an event occurring after the impairment was
recognized (such as an improvement in the debtor’s credit rating), the previously
recognized impairment loss is reversed by adjusting the allowance account. The
amount of the reversal is recognized in the income statement.
(2) Assets classified as available for sale
The Group assesses at each balance sheet date whether there is objective evidence that
a financial asset or a group of financial assets is impaired. In the case of equity
investments classified as available-for-sale, a significant or prolonged decline in the
fair value of the security below its cost is considered in determining whether the assets
are impaired. If any such evidence exists for available-for-sale financial assets, the
cumulative losses, measured as the difference between the acquisition cost (net of any
principal repayment and amortization) and the current fair value, less any impairment
loss on that financial asset previously recognized in profit or loss, is removed from
equity and recognized in the income statement. If, in a subsequent period, the fair
value of a debt instrument classified as available-for-sale increases and the increase
can be objectively related to an event occurring after the impairment loss was
recognized in the income statement, the impairment loss is reversed through the
income statement. With respect to equity instruments, such reversals are made
through the available-for-sale reserve within equity.
Notes to the Financial Statements 183

II SUMMARY OF PRINCIPAL ACCOUNTING POLICIES (Continued)
13 Intangible assets
(1) Goodwill
Goodwill represents the excess of the cost of an acquisition over the fair value of the
Group’s share of the net identifiable assets of the acquired subsidiary/associate at the
date of acquisition. Goodwill on acquisition of subsidiaries is included in intangible
assets. Goodwill on acquisition of associates is included in investment in associates
and is tested annually for impairment as part of the overall balance. Separately
recognized goodwill is tested annually for impairment and carried at cost less
accumulated impairment losses. Impairment losses on goodwill are not reversed.
Gains and losses on the disposal of an entity include the carrying amount of goodwill
relating to the entity sold.
Goodwill is allocated to cash-generating units for the purpose of impairment testing.
The allocation is made to those cash-generating units or groups of cash-generating
units that are expected to benefit from the business acquisition in which the goodwill
arose.
(2) Other intangible assets
Other intangible assets principally comprise computer software; and options and firm
orders for aircraft.
Computer software is stated at cost less accumulated amortization and impairment.
These costs are amortized on a straight-line basis over their estimated useful lives with
the amortization recognized in the income statement. When the estimated recoverable
amount of an intangible asset is lower than its carrying amount, an impairment loss is
recognized in the income statement.
Options and firm orders for aircraft which arose from the acquisition of a subsidiary are
initially recorded at fair value at the date of acquisition. The value of such options and
firm orders, which are not amortized, will be added to the cost of aircraft when the
related aircraft are purchased. The value of options is charged to the income statement
upon expiry if they are not exercised.
Bank of China Annual Report 2006184
(Amount in millions of Renminbi, unless otherwise stated)
II SUMMARY OF PRINCIPAL ACCOUNTING POLICIES (Continued)
14 Impairment of investment in subsidiaries and associates and non-financial assets
Assets that have an indefinite useful life or are not yet available for use are not subject to
amortization, but are tested annually for impairment. Assets that are subject to amortization
are reviewed for impairment whenever events or changes in circumstances indicate that the
carrying amount may not be recoverable. An impairment loss is recognized for the amount
by which the asset’s carrying amount exceeds its recoverable amount. The recoverable
amount is the higher of an asset’s fair value less costs to sell and value in use. For the
purposes of assessing impairment, assets are grouped at the lowest levels for which there
are separately identifiable cash flows (cash-generating units). Assets other than goodwill
that suffered impairment are reviewed for possible reversal of the impairment at each
reporting date.
15 Property and equipment
(1) Buildings, improvements, equipment and motor vehicles
Buildings comprise primarily branches and office premises. All buildings,
improvements, equipment and motor vehicles are stated at historical cost less
accumulated depreciation and impairment. Historical cost includes expenditures that
are directly attributable to the acquisition of the items.
Subsequent costs are included in an asset’s carrying amount or are recognized as a
separate asset, as appropriate, only when it is probable that future economic benefits
associated with the item will flow to the Group and the cost of the item can be
measured reliably. All other repairs and maintenance costs are charged to the income
statement during the financial period in which they are incurred.
Depreciation is calculated on the straight-line method to write down the cost of such
assets to their residual values over their estimated useful lives as follows:
Buildings 15–50 years
Improvements Shorter of economic useful life or remaining lease term
Equipment 3–15 years
Motor vehicles 4–6 years
The residual values and useful lives of assets are reviewed, and adjusted if appropriate,
at each balance sheet date.
Notes to the Financial Statements 185

II SUMMARY OF PRINCIPAL ACCOUNTING POLICIES (Continued)
15 Property and equipment (Continued)
(1) Buildings, improvements, equipment and motor vehicles (Continued)
Buildings, improvements, equipment and motor vehicles are periodically reviewed for
impairment whenever events or changes in circumstances indicate that the carrying
amount may not be recoverable. Where the carrying amount of an asset is greater than
its estimated recoverable amount, it is written down immediately to its recoverable
amount. The recoverable amount is the higher of the asset’s fair value less costs to sell
and value in use.
Gains and losses on disposals are determined by comparing proceeds with carrying
amount, relevant taxes and expenses. These are included in the income statement.
(2) Aircraft
Aircraft are stated at cost less accumulated depreciation and any impairment loss. The
cost of aircraft is stated net of manufacturers’ credits. Modifications, improvements
and all other costs associated with maintaining the aircraft in a serviceable state are
capitalized.
Aircraft are depreciated using the straight-line method over a period of 25 years, being
the expected useful life, less the years of their service at the time of purchase to an
estimated residual value.
Aircraft are periodically reviewed for impairment when events or changes in
circumstances indicate that the carrying value may not be recoverable.
Gains and losses on disposal of the aircraft are determined by comparing proceeds
with carrying amount, relevant taxes and expenses. These are included in the income
statement.
(3) Construction in progress
Construction in progress consists of assets under construction or being installed and is
stated at cost. Cost includes equipment cost, cost of construction, installation and other
direct costs. Items classified as construction in progress are transferred to property and
equipment when such assets are ready for their intended use, and the depreciation
charge commences from the following month after such assets are transferred to
property and equipment.
Bank of China Annual Report 2006186
(Amount in millions of Renminbi, unless otherwise stated)

II SUMMARY OF PRINCIPAL ACCOUNTING POLICIES (Continued)
15 Property and equipment (Continued)
(3) Construction in progress (Continued)
Impairment losses are recognized for idle projects with respect to which management
has determined that resumption in the foreseeable future is not probable, including
those projects that are the subject of litigation. The impairment loss is equal to the
extent to which the estimated recoverable amount of a specific project is less than its
carrying amount. Impairment losses are charged to the income statement.
16 Investment property
Investment property, principally consisting of office buildings, is held to generate rental
income over the long term or earn capital gains or both and is not occupied by the Group.
Investment property is carried at fair value, representing open market value determined
periodically by independent appraisers. Changes in fair values are recorded in the income
statement as part of other operating income.
17 Leases
(1) Operating lease
Leases in which a significant portion of the risks and rewards of ownership are retained
by the lessor are classified as operating leases. The total payments made under
operating leases (net of any incentives received from the lessor) which include land use
rights with payments that are separately identifiable at inception of the lease are
charged to the income statement on a straight-line basis over the period of the lease.
When an operating lease is terminated before the lease period has expired, any
payment required to be made to the lessor by way of penalty is recognized as an
expense in the period in which termination takes place.
Where the Group is the lessor under operating leases, the assets subject to the
operating lease are accounted for as property and equipment and investment property.
Rental income (net of any incentives given to the lessees) is recognized on a straight-
line basis over the lease term.
Notes to the Financial Statements 187
II SUMMARY OF PRINCIPAL ACCOUNTING POLICIES (Continued)
17 Leases (Continued)
(2) Finance lease
Leases of assets where the Group has substantially all the risks and rewards of
ownership are classified as finance leases. Finance leases are capitalized at the present
value of the minimum lease payments at the inception of the lease term. Lease
payments are apportioned between the finance charges and reduction of the lease
liability so as to achieve a constant rate of interest on the remaining balance of the
liability. Finance charges are charged directly against the income statement.
When assets are leased out under a finance lease, the present value of the lease
payments is recognized as a receivable. The difference between the gross receivables
and the present value of the receivables is recognized as unearned finance income.
Lease income is recognized over the term of the lease using the net investment
method, which reflects a constant periodic rate of return.
18 Cash and cash equivalents
For the purposes of the cash flow statement, cash and cash equivalents comprise balances
with an original maturity of less than three months, including: cash, non-restricted balances
with central banks, due from banks, placements with banks and other financial institutions,
and short-term bills and notes classified as investment securities.
19 Provisions
Provisions are recognized when the Group has a present legal or constructive obligation as a
result of past events, it is probable that an outflow of resources embodying economic
benefits will be required to settle the obligation, and a reliable estimate of the amount of the
obligation can be made.
Bank of China Annual Report 2006188
(Amount in millions of Renminbi, unless otherwise stated)

II SUMMARY OF PRINCIPAL ACCOUNTING POLICIES (Continued)
20 Financial liabilities
Financial liabilities are classified into two categories: financial liabilities at fair value through
profit or loss and other financial liabilities. All financial liabilities are classified at inception
and recognised initially at fair value.
(1) Financial liabilities at fair value through profit or loss
This category has two sub-categories: financial liabilities held for trading, and those
designated at fair value through profit or loss at inception.
A financial liability is classified as held for trading if it is incurred principally for the
purpose of repurchasing in the short term. It is carried at fair value and any gains and
losses from changes in fair value are recognised in the income statement.
A financial liability is typically classified as fair value through profit or loss at inception
if it meets the following criteria:
. the designation eliminates or significantly reduces a measurement or recognition
inconsistency (sometimes referred to as ‘‘an accounting mismatch’’) that would
otherwise arise from measuring the financial assets or financial liabilities or
recognising the gains and losses on them on different bases;
. a group of financial assets and/or financial liabilities is managed and its
performance is evaluated on a fair value basis, in accordance with a
documented risk management or investment strategy, and this is the basis on
which information about the financial assets and/or financial liabilities is provided
internally to the key management personnel; or
. relates to financial instruments containing one or more embedded derivative that
significantly modifies the cash flows resulting from those financial instruments.
Financial liabilities designated as at fair value through profit or loss, including deposits
received from customers that are embedded with certain derivatives, are designated as
such at inception. Financial liabilities designated at fair value through profit or loss are
carried at fair value. Any gains and losses (excluding interest accruals) from changes in
fair value are recognised in the income statement and reported in Net trading (losses)/
gains. The accrual of interest is reported in Interest expenses.
Notes to the Financial Statements 189

II SUMMARY OF PRINCIPAL ACCOUNTING POLICIES (Continued)
20 Financial liabilities (Continued)
(2) Other financial liabilities
Other financial liabilities including borrowings are recognized initially at fair value, net
of transaction costs incurred. Other financial liabilities are subsequently stated at
amortized cost; any difference between proceeds net of transaction costs and the
redemption value is recognized in the income statement over the period of the other
financial liabilities using the effective interest method.
If the Group purchases its own debt, it is removed from the consolidated balance sheet,
and the difference between the carrying amount of a liability and the consideration
paid is included in the income statement.
21 Offsetting financial instruments
Financial assets and liabilities are offset and the net amount reported in the balance sheet
when there is a legally enforceable right to set off the recognized amounts and there is an
intention to settle on a net basis, or realize the asset and settle the liability simultaneously.
22 Employee benefits
(1) Defined contribution plans
In accordance with the policies of relevant state and local governments, domestic
employees participate in various defined contribution retirement schemes
administered by local Labour and Social Security Bureaus. Domestic Operations
contribute to pension and insurance schemes administered by the local pension and
insurance agencies using applicable contribution rates stipulated in the relevant local
regulations. Upon retirement, the local Labour and Social Security Bureaus are
responsible for the payment of the basic retirement benefits to the retired employees.
In addition to these basic staff pension schemes, domestic employees can also
voluntarily participate in a contribution retirement benefit program established by the
Bank during 2005 (‘‘the Annuity Plan’’). The Bank contributes to the Annuity Plan based
on certain percentages of the employees’ gross salaries.
All eligible employees in Overseas Operations participate in local defined contribution
schemes. Overseas Operations contribute to these defined contribution plans based on
certain percentages of the employees’ basic salaries.
Bank of China Annual Report 2006190
(Amount in millions of Renminbi, unless otherwise stated)

II SUMMARY OF PRINCIPAL ACCOUNTING POLICIES (Continued)
22 Employee benefits (Continued)
(1) Defined contribution plans (Continued)
Contributions made by the Group to the retirement schemes described above are
recorded as an expense in the income statement as accrued. Forfeited contributions by
those employees who leave the schemes prior to the full vesting of their contributions
are used to reduce the existing level of contributions or retained in the retirement
schemes in accordance with the requirements of the respective defined contribution
plans. The Group has no further legal obligation to pay additional pensions even if the
defined contribution schemes in which the Group’s employees participate are not
sufficient to fund withdrawals by participants.
(2) Retirement benefit obligations
Historically, the Group has paid supplemental retirement benefits to all retired
domestic employees and early retirement benefits to those employees who accepted
an early retirement arrangement. Supplemental retirement benefits include
supplemental pension income payments and medical expense coverage, the
amounts of which are calculated based on the difference between the basic benefits
received and enhanced benefit levels determined by management from time to time.
Early retirement benefits have been paid to those employees who accept voluntary
retirement before the normal retirement date, as approved by management. The
related benefit payments are made from the date of early retirement through the
normal retirement date.
The Group has recorded a liability for its obligation related to supplemental and early
retirement obligations to retired and early retired employees. No liability has been
recorded related to benefits that current domestic employees may receive in the future,
as the Group has not incurred a constructive obligation to pay such benefits. In
connection with the implementation of the Joint Stock Reform Plan, management has
undertaken a comprehensive re-design of its employee compensation including
establishing the Annuity Plan. A number of the elements of this re-design are
consistent with and reinforce management’s position that the Group has had no
obligation to pay supplemental retirement benefits to current domestic employees.
These include relevant amendments to the domestic employee policy handbook and a
written acknowledgement by domestic employees of a clarification of the Group’s
obligations only to fund the mandatory payments to state administered defined
contribution.
All employees who retired after 1 January 2004 are eligible to make withdrawals from
the Annuity Plan fund from 1 January 2006.
Notes to the Financial Statements 191

II SUMMARY OF PRINCIPAL ACCOUNTING POLICIES (Continued)
22 Employee benefits (Continued)
(2) Retirement benefit obligations (Continued)
The liability related to the supplemental benefit obligation for employees who retired
prior to 31 December 2003 and early retirement obligations existing at each year-end
with respect to early retired employees, is calculated by the independent actuaries
using the projected unit credit method and recorded as a liability under Retirement
benefit obligations in the balance sheet. The present value of the liability is determined
through estimated future cash outflows using interest rates of RMB treasury bills which
have terms to maturity approximating the terms of the related liability. Actuarial gains
and losses, changes in actuarial assumptions and amendments to pension plans are
charged or credited to the income statement immediately as they occur. Past-service
costs are recognized immediately in the income statement.
(3) Housing funds
Pursuant to local government regulations, all domestic employees participate in
various local housing funds administered by local governments. Domestic Operations
contribute on a monthly basis to these funds based on certain percentages of the
salaries of the employees. These payments are expensed as incurred.
(4) Share-based compensation
(a) Equity-settled share-based compensation schemes
The Group operates a number of equity-settled share-based compensation
schemes. The fair value of the employee services received in exchange for the
grant of the options under these schemes is recognized as an expense over the
vesting period, with a corresponding increase in equity. The total amount to be
expensed over the vesting period is determined by reference to the fair value of
the options granted, excluding the impact of any non-market vesting conditions.
The fair value of the equity instruments is measured at grant date, and is not
subsequently re-measured. Non-market vesting conditions are included in
assumptions about the number of options that are expected to become
exercisable. At each balance sheet date, the entity revises its estimates of the
number of options that are expected to become exercisable. It recognizes the
impact of the revision of original estimates, if any, in the income statement, with a
corresponding adjustment to equity over the remaining vesting period.
The proceeds received net of any directly attributable transaction costs are
credited to share capital (nominal value) and share premium when the options are
exercised.
Bank of China Annual Report 2006192
(Amount in millions of Renminbi, unless otherwise stated)
II SUMMARY OF PRINCIPAL ACCOUNTING POLICIES (Continued)
22 Employee benefits (Continued)
(4) Share-based compensation (Continued)
(b) Cash-settled share-based compensation scheme
The Bank also operates a cash-settled, share appreciation rights plan. The related
cost of services received from the employees and the liability to pay for such
services are measured at fair value and recognized over the vesting period as the
employees render services. Fair value is established at the grant date and until the
liability is settled, the fair value is re-measured at each reporting date with any
changes in fair value recognized in profit or loss for the period. Fair value is
determined by using an appropriate valuation model.
The total amount to be expensed over the vesting period is determined by
reference to the fair value of the rights granted, excluding the impact of any non-
market vesting conditions. Non-market conditions are included in the
assumptions about the number of rights that are expected to vest. At each
balance sheet date, the entity revises its estimates of the number of rights that are
expected to vest. It recognizes the impact of the revision to original estimates, if
any, in the income statement, with a corresponding adjustment to liability.
(5) Bonus plans
The Group recognizes a liability and an expense for bonuses, taking into consideration
its business performance and profit attributable to the Bank’s equity holders. The
Group recognizes a provision where contractually obliged or where there is a past
practice that has created a constructive obligation.
23 Deferred income taxes
Deferred income tax is provided in full, using the balance sheet liability method, on
temporary differences arising between the tax bases of assets and liabilities and their
carrying amounts in the consolidated financial statements. Deferred income tax is
determined using tax rates and laws that have been enacted or substantially enacted by
the balance sheet date and are expected to apply when the related deferred income tax asset
is realized or the deferred income tax liability is settled.
Notes to the Financial Statements 193
II SUMMARY OF PRINCIPAL ACCOUNTING POLICIES (Continued)
23 Deferred income taxes (Continued)
The principal temporary differences arise from asset impairment allowances, depreciation of
property and equipment, revaluation of certain financial assets and liabilities including
derivative contracts, provisions for pension and benefit costs and tax losses carried forward.
However, deferred income tax is not recognized if it arises from initial recognition of an asset
or liability in a transaction other than a business combination that at the time of the
transaction affects neither accounting nor taxable profit or loss.
Deferred income tax assets are recognized to the extent that it is probable that future taxable
profit will be available against which the temporary differences can be utilized.
Deferred income tax is provided on temporary differences arising from investments in
subsidiaries and associates, except where the timing of the reversal of the temporary
difference can be controlled and it is probable that the difference will not reverse in the
foreseeable future.
Income tax payable on profits, based on the applicable tax law in each jurisdiction, is
recognized as an expense in the period in which profits arise. The tax effects of income tax
losses available for carry forward are recognized as an asset when it is probable that future
taxable profits will be available against which these losses can be utilized.
Deferred income tax related to fair value re-measurement of available-for-sale investments
which are charged or credited directly to equity, is also credited or charged directly to equity
and is subsequently recognized in the income statement together with the deferred gain and
loss.
24 Share capital
Ordinary shares are classified as equity when there is no contractual obligation to transfer
cash or other financial assets. Consideration received on the issuance of shares in excess of
the share cost is reported in the Capital reserve.
(1) Share issue costs
Incremental costs directly attributable to the issue of new ordinary shares are shown in
equity as a deduction, net of tax, from the proceeds.
(2) Dividends
Dividends are recognized as liabilities in the period in which they are approved by the
Bank’s equity holders.
Dividends for the year that are declared after the balance sheet date are addressed in
the subsequent event note to the financial statements.
Bank of China Annual Report 2006194
(Amount in millions of Renminbi, unless otherwise stated)

II SUMMARY OF PRINCIPAL ACCOUNTING POLICIES (Continued)
24 Share capital (Continued)
(3) Treasury shares
Where the Bank or other members of the Group purchase the Bank’s ordinary shares,
treasury shares are recorded at the amount of consideration paid and deducted from
total shareholders’ equity until they are cancelled, sold or reissued. Where such shares
are subsequently sold or reissued, any consideration received is included in
shareholders’ equity.
25 Acceptances
Acceptances comprise undertakings by the Group to pay bills of exchange drawn on
customers. The Group expects most acceptances to be settled simultaneously with the
reimbursement from the customers. Acceptances are accounted for as off-balance sheet
transactions and are disclosed as Credit commitments in Note V.38 (6).
26 Fiduciary activities
The Group commonly acts as a custodian, trustee or in other fiduciary capacities, that result
in its holding or placing of assets on behalf of securities investment funds, social security
funds, insurance companies, qualified foreign institutional investors, annuity schemes and
other institutions. These assets are excluded from these financial statements, as they are not
assets of the Group.
The Group also administers entrusted loans on behalf of third-party lenders. In this regard,
the Group grants loans to borrowers, as an intermediary, at the direction of third-party
lenders, who fund these loans. The Group has been contracted by these third-party lenders
to manage the administration and collection of these loans on their behalf. The third-party
lenders determine both the underwriting criteria for and all terms of the entrusted loans,
including their purpose, amounts, interest rates, and repayment schedule. The Group
charges a commission related to its activities in connection with the entrusted loans, but the
risk of loss is borne by the third-party lenders. Entrusted loans are not recognized in the
financial statements of the Group.
27 Contingent liabilities
A contingent liability is a possible obligation that arises from past events and whose
existence will only be confirmed by the occurrence or non-occurrence of one or more
uncertain future events not wholly within the control of the Group. It can also be a present
obligation arising from past events that is not recognized because it is not probable that an
outflow of economic resources will be required or the amount of obligation cannot be
measured reliably.
Notes to the Financial Statements 195

II SUMMARY OF PRINCIPAL ACCOUNTING POLICIES (Continued)
27 Contingent liabilities (Continued)
A contingent liability is not recognized as a provision but is disclosed in the notes to the
financial statements. When a change in the probability of an outflow occurs so that outflow
is probable, it will then be recognized as a provision.
28 Financial guarantee contracts
Financial guarantee contracts are contracts that require the issuer to make specified
payments to reimburse the holder for a loss it incurs because a specified debtor fails to make
payments when due, in accordance with the terms of a debt instrument. Such financial
guarantees are given to banks, financial institutions and other bodies on behalf of customers
to secure loans, overdrafts and other banking facilities.
Financial guarantees are initially recognized in the financial statements at fair value on the
date the guarantee was given. Subsequent to initial recognition, the Group’s liabilities under
such guarantees are measured at the higher of the initial measurement, less amortization
calculated to recognize in the income statement the fee income earned on a straight line
basis over the life of the guarantee and the best estimate of the expenditure required to settle
any financial obligation arising at the balance sheet date. These estimates are determined
based on experience of similar transactions and history of past losses, supplemented by the
judgment of management.
Any increase in the liability relating to guarantees is taken to the income statement under
other operating expenses.
29 Comparative figures
Where necessary, comparative figures have been adjusted to conform with changes in
presentation in the current year. These reclassifications do not have any impact to the
Group’s or the Bank’s total assets, total liabilities and total shareholders’ equity as at 31
December 2005 and the Group’s profit for the year then ended.
Bank of China Annual Report 2006196
(Amount in millions of Renminbi, unless otherwise stated)
III FINANCIAL RISK MANAGEMENT
1 Strategy in using financial instruments
This section presents information about the Group’s exposure to and its management and
control of risks, in particular the primary risks associated with its use of financial
instruments:
— credit risk is the risk of loss resulting from client or counterparty default and arises on
credit exposure in all forms, including settlement risk;
— market risk is exposure to observable market variables such as interest rates, exchange
rates and equity markets;
— funding and liquidity risk is the risk that the Group is unable to meet its payment
obligations when due, or that it is unable, on an ongoing basis, to borrow funds in the
market on an unsecured, or even secured basis at an acceptable price to fund actual or
proposed commitments.
2 Credit risk
Credit risk is increased when counterparties are concentrated in the same industries or
geographical regions. The Group operates in the PRC, Hong Kong and Macau, and other
international locations. Each of these has its own unique characteristics in terms of
economic development and of its financial markets. Therefore, each area presents different
credit risks.
The Group structures the levels of credit risk it undertakes by placing limits on the amount of
risk accepted in relation to individual borrowers.
Exposure to credit risk is managed through regular analysis of the ability of borrowers and
potential borrowers to meet interest and principal repayment obligations and by changing
these lending limits where appropriate. Exposure to credit risk is also managed in part by
obtaining collateral and guarantees.
The primary purpose of credit-related commitments is to ensure that funds are available to a
customer, as required. Guarantees and standby letters of credit, which represent irrevocable
assurances that the Group will make payments in the event that a customer cannot meet its
obligations to third parties, carry the same credit risk as loans and advances. Guarantee
deposits are received by the Group to lessen the credit risks related to certain of these
commitments provided by the Group. When received, such deposits are typically established
as a certain percentage of the notional amount of a guarantee, standby letter of credit or
other credit related commitment. The percentage of such deposits over the related credit
commitments is determined by the creditworthiness of the related customer.
Notes to the Financial Statements 197

III FINANCIAL RISK MANAGEMENT (Continued)
3 Concentrations of operating income, assets, liabilities and off-balance sheet items
The geographical concentrations of the Group’s operating income, assets, liabilities, and
credit commitments are set forth below:
As at and for the year ended 31 December 2006
Group
Total
operating
income Total assets
Total
liabilities
Credit
commitments
Capital
expenditure
Chinese Mainland(1) 108,510 4,287,692 3,921,219 884,607 5,954
Hong Kong and Macau 37,669 1,084,078 980,389 203,476 1,406
Other overseas locations 2,744 214,766 204,675 61,297 52
Elimination(1) (545) (258,883) (191,586) (61,558) —
148,378 5,327,653 4,914,697 1,087,822 7,412
As at and for the year ended 31 December 2005
Group
Total
operating
income Total assets
Total
liabilities
Credit
commitments
Capital
expenditure
Chinese Mainland(1) 91,396 3,797,520 3,586,428 699,066 5,379
Hong Kong and Macau 30,590 969,872 872,995 182,334 660
Other overseas locations 3,120 186,995 178,855 52,434 67
Elimination(1) — (214,339) (153,749) (38,072) —
125,106 4,740,048 4,484,529 895,762 6,106
(1) Includes investments in subsidiaries and related elimination. These are excluded in the presentation of segment
asset disclosure and related elimination in Note V.1.
Total operating income includes net interest income, net fee and commission income, net trading (losses)/gains,
net gains on investment securities and other operating income.
(2) Over 90% of the Bank’s operating income, assets, liabilities and credit commitments are attributable to the
Chinese Mainland segment and therefore no geographical analysis is presented for the Bank.
Bank of China Annual Report 2006198
(Amount in millions of Renminbi, unless otherwise stated)
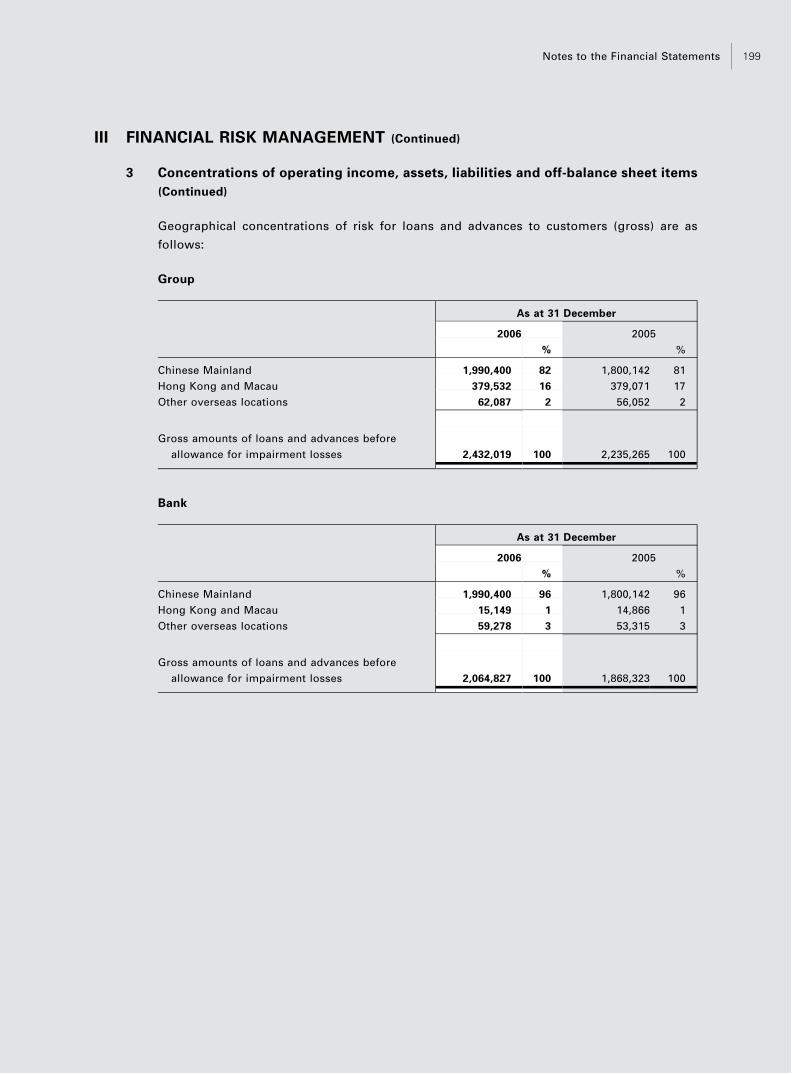
III FINANCIAL RISK MANAGEMENT (Continued)
3 Concentrations of operating income, assets, liabilities and off-balance sheet items
(Continued)
Geographical concentrations of risk for loans and advances to customers (gross) are as
follows:
Group
As at 31 December
2006 2005
% %
Chinese Mainland 1,990,400 82 1,800,142 81
Hong Kong and Macau 379,532 16 379,071 17
Other overseas locations 62,087 2 56,052 2
Gross amounts of loans and advances before
allowance for impairment losses 2,432,019 100 2,235,265 100
Bank
As at 31 December
2006 2005
% %
Chinese Mainland 1,990,400 96 1,800,142 96
Hong Kong and Macau 15,149 1 14,866 1
Other overseas locations 59,278 3 53,315 3
Gross amounts of loans and advances before
allowance for impairment losses 2,064,827 100 1,868,323 100
Notes to the Financial Statements 199
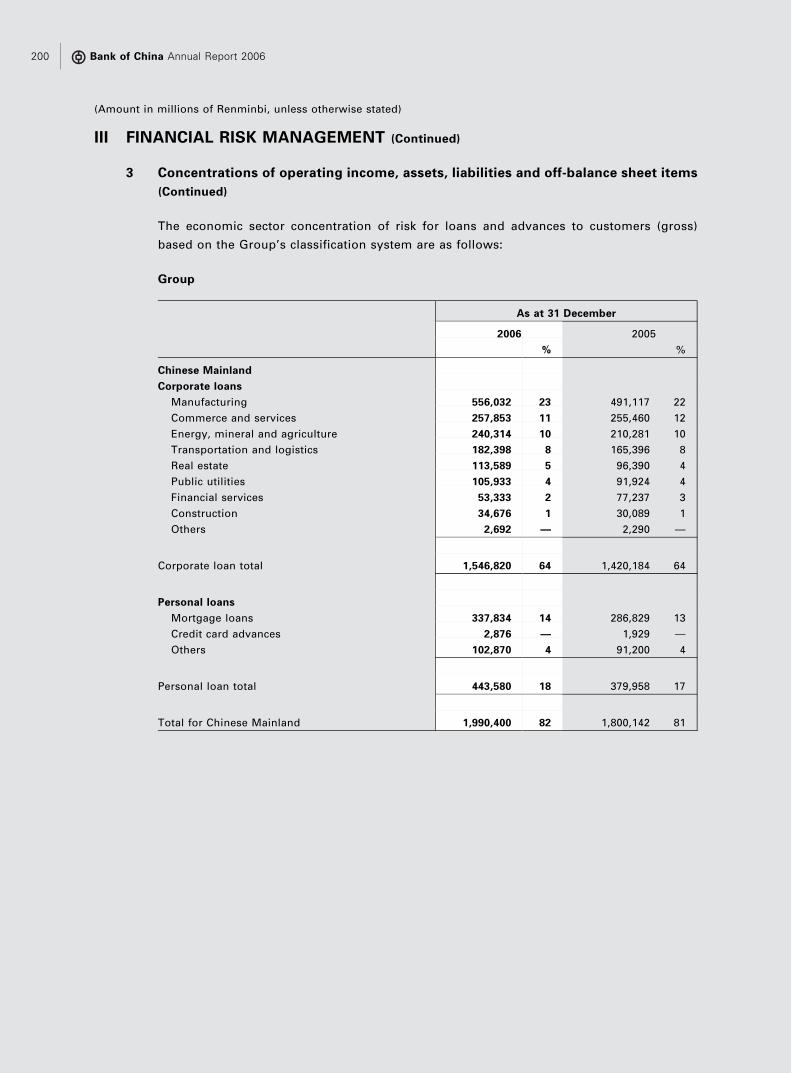
III FINANCIAL RISK MANAGEMENT (Continued)
3 Concentrations of operating income, assets, liabilities and off-balance sheet items
(Continued)
The economic sector concentration of risk for loans and advances to customers (gross)
based on the Group’s classification system are as follows:
Group
As at 31 December
2006 2005
% %
Chinese Mainland
Corporate loans
Manufacturing 556,032 23 491,117 22
Commerce and services 257,853 11 255,460 12
Energy, mineral and agriculture 240,314 10 210,281 10
Transportation and logistics 182,398 8 165,396 8
Real estate 113,589 5 96,390 4
Public utilities 105,933 4 91,924 4
Financial services 53,333 2 77,237 3
Construction 34,676 1 30,089 1
Others 2,692 — 2,290 —
Corporate loan total 1,546,820 64 1,420,184 64
Personal loans
Mortgage loans 337,834 14 286,829 13
Credit card advances 2,876 — 1,929 —
Others 102,870 4 91,200 4
Personal loan total 443,580 18 379,958 17
Total for Chinese Mainland 1,990,400 82 1,800,142 81
Bank of China Annual Report 2006200
(Amount in millions of Renminbi, unless otherwise stated)

III FINANCIAL RISK MANAGEMENT (Continued)
3 Concentrations of operating income, assets, liabilities and off-balance sheet items
(Continued)
Group (Continued)
As at 31 December
2006 2005
% %
Hong Kong and Macau
Corporate loans
Real estate 94,391 4 86,419 3
Manufacturing 35,853 1 34,285 2
Commerce and services 33,443 1 35,137 2
Transportation and logistics 24,481 1 21,783 1
Energy, mineral and agriculture 12,256 1 12,429 1
Financial services 12,107 1 14,367 1
Construction 4,053 — 4,874 —
Others 25,328 1 27,613 1
Corporate loan total 241,912 10 236,907 11
Personal loans
Mortgage loans 117,972 5 125,514 6
Credit card advances 5,516 — 4,856 —
Others 14,132 1 11,794 —
Personal loan total 137,620 6 142,164 6
Total for Hong Kong and Macau 379,532 16 379,071 17
Other overseas locations 62,087 2 56,052 2
Gross amounts of loans and advances before
allowance for impairment losses 2,432,019 100 2,235,265 100
Notes to the Financial Statements 201

III FINANCIAL RISK MANAGEMENT (Continued)
3 Concentrations of operating income, assets, liabilities and off-balance sheet items
(Continued)
Bank
As at 31 December
2006 2005
% %
Corporate loans
Manufacturing 568,398 27 498,363 26
Commerce and services 268,522 13 267,967 14
Energy, mineral and agriculture 248,865 12 218,777 12
Transportation and logistics 188,606 9 173,003 9
Real estate 127,287 6 105,794 6
Public utilities 106,141 5 91,924 5
Financial services 60,969 3 82,566 4
Construction 34,866 2 31,203 2
Others 12,398 1 14,336 1
Corporate loan total 1,616,052 78 1,483,933 79
Personal loans
Mortgage loans 341,576 17 290,342 16
Credit card advances 2,942 — 1,929 —
Others 104,257 5 92,119 5
Personal loan total 448,775 22 384,390 21
Gross amounts of loans and advances before
allowance for impairment losses 2,064,827 100 1,868,323 100
Over 90% of the Bank’s gross balances of loans and advances are attributable to the Chinese
Mainland segment and therefore no geographical segment analysis is presented.
Bank of China Annual Report 2006202
(Amount in millions of Renminbi, unless otherwise stated)
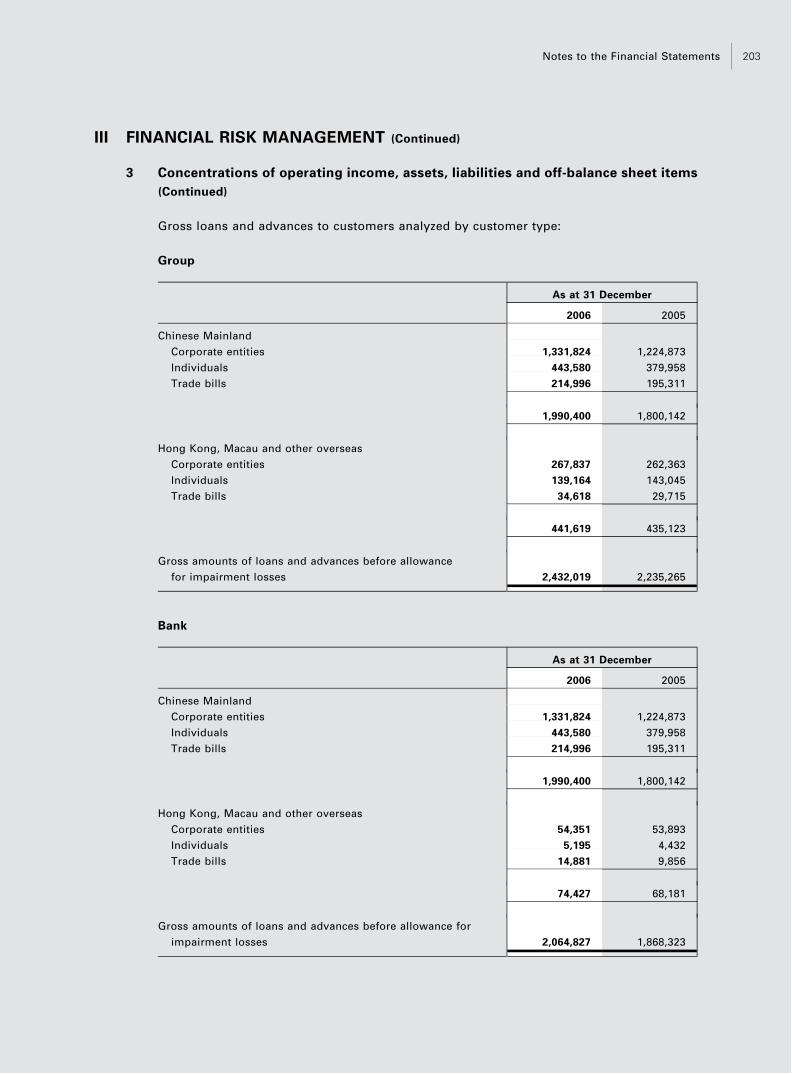
III FINANCIAL RISK MANAGEMENT (Continued)
3 Concentrations of operating income, assets, liabilities and off-balance sheet items
(Continued)
Gross loans and advances to customers analyzed by customer type:
Group
As at 31 December
2006 2005
Chinese Mainland
Corporate entities 1,331,824 1,224,873
Individuals 443,580 379,958
Trade bills 214,996 195,311
1,990,400 1,800,142
Hong Kong, Macau and other overseas
Corporate entities 267,837 262,363
Individuals 139,164 143,045
Trade bills 34,618 29,715
441,619 435,123
Gross amounts of loans and advances before allowance
for impairment losses 2,432,019 2,235,265
Bank
As at 31 December
2006 2005
Chinese Mainland
Corporate entities 1,331,824 1,224,873
Individuals 443,580 379,958
Trade bills 214,996 195,311
1,990,400 1,800,142
Hong Kong, Macau and other overseas
Corporate entities 54,351 53,893
Individuals 5,195 4,432
Trade bills 14,881 9,856
74,427 68,181
Gross amounts of loans and advances before allowance for
impairment losses 2,064,827 1,868,323
Notes to the Financial Statements 203

III FINANCIAL RISK MANAGEMENT (Continued)
4 Market risk
The Group takes on exposure to market risks. Market risk is the risk of potential loss to
earnings or cash flows that may result from the Group’s on and off-balance-sheet positions
as a result of adverse changes in market prices (such as interest rates, exchange rates, equity
prices and commodity prices). The principal types of market risk for the Group are interest
rate risk and exchange rate risk. The Group controls its market risk with risk limits approved
by the Board of Directors in respect of its trading and banking book (including investment
book). Market risk in its trading book is monitored and controlled by establishing an overall
Value at Risk limit and stop loss limits. Based on the different characteristics of specific
products, the qualifications of the dealers and position amounts, stop loss limits are
established for each trading desk and each dealer. On each trading day, the position and
profit or loss of trading desks are monitored to identify transactions that are in excess of
authorized limits. The market risk in its investment book is controlled and managed at both
portfolio and product levels by establishing different types of limits including duration,
concentration, Value at Risk limit, present value of a basis point change in interest rates and
stress tests limit.
The management of the specific market risks is summarized below in Note III.5 and Note III.6.
5 Currency risk
The Group conducts the majority of its business in RMB, with certain transactions
denominated in USD, Hong Kong dollars (‘‘HKD’’) and, to a much lesser extent, other
currencies. The exchange rates of the RMB to the USD and HKD respectively are set by the
People’s Bank of China (‘‘PBOC’’) and have fluctuated in the last decade within a narrow band
of less than 1% prior to July 2005. On 21 July 2005, the PRC Government introduced a
managed floating exchange rate system to allow the value of the RMB to fluctuate within a
regulated band based on market supply and demand and by reference to a basket of
currencies. On the same day, the value of the RMB appreciated by approximately 2% against
the USD. The PRC Government in the future may make further adjustments to the exchange
rate system.
Bank of China Annual Report 2006204
(Amount in millions of Renminbi, unless otherwise stated)

III FINANCIAL RISK MANAGEMENT (Continued)
5 Currency risk (Continued)
The Group’s net foreign currency positions as at 31 December 2006 and 31 December 2005
are analyzed below:
Foreign Currency Position
As at 31 December 2006 As at 31 December 2005
RMB billion
USD billion
equivalent* RMB billion
USD billion
equivalent*
Net on-balance sheet foreign currency
position of the Group 669 86 485 60
Less: Net off-balance sheet foreign
currency position of the Group (433) (55) (171) (21)
Net foreign currency position of the Group 236 31 314 39
Less: Foreign currency denominated
net investments in foreign
operations (ii) (114) (15) (106) (13)
Net position (excluding structural position
in foreign operations) 122 16 208 26
The key movements of the Group’s net foreign currency position during 2006 are analyzed as
follows:
Foreign Currency Position
USD billion equivalent*
Net
on-balance
sheet
position
Net
off-balance
sheet
position
Net
investments
in foreign
operations (ii)
Net
position
Opening position as at 1 January 2006 60 (21) (13) 26
— Proceeds from a global offering 11 — — 11
— Spot transactions to reduce foreign
currency position (i) (26) — — (26)
— Funding swap transactions (i) 42 (42) — —
— Funding swap transactions expired (4) 4 — —
— Others 3 4 (2) 5
Closing position as at 31 December 2006 86 (55) (15) 16
* The Group’s foreign currency position expressed in USD equivalent in the above tables comprises all net foreign
currency exposures as of 31 December 2006 and 2005 based on the respective year-end closing foreign exchange
rates of each currency with the USD.
Notes to the Financial Statements 205

III FINANCIAL RISK MANAGEMENT (Continued)
5 Currency risk (Continued)
(i) The Group endeavors to manage its sources and uses of foreign currencies to minimize
potential mismatches in accordance with management directives. However, the
Group’s ability to manage its foreign currency positions in relation to the RMB is
limited as RMB is not a freely convertible currency. The PRC government’s current
foreign currency regulations require the conversion of foreign currency to be approved
by relevant PRC government authorities. The Bank has significant foreign currency
positions, which arose largely through foreign currency capital contributions from the
equity holders and its foreign currency operations.
In 2005, the Bank entered into a foreign currency option agreement with Huijin (‘‘Huijin
option’’), having a notional amount of USD18 billion, to economically hedge a portion
of its net foreign currency position (see Note V.16(2)).
During the year ended 31 December 2006, the Bank has entered into certain foreign
exchange spot transactions, having an aggregate notional amount of USD26.3 billion
(2005: Nil), to further reduce its net foreign currency position.
During the year ended 31 December 2006, the Bank has also entered into a series of
USD/RMB funding swaps, having an aggregate notional amount of USD41.5 billion
(2005: USD4.2 billion), with maturities of either 1 year or 3 years to benefit from the
interest differentials between USD and RMB. These USD/RMB funding swaps have no
impact on the Group’s net foreign currency position. As at 31 December 2006, the
outstanding notional amount of these transactions amounted to USD41.5 billion (2005 :
USD4.2 billion) and the fair value of these outstanding positions as at 31 December
2006 amounted to RMB2.2 billion (2005 : RMB0.01 billion). See Note V.16(1).
Subsequent to the balance sheet date and up to the date of this report, the Bank has
exercised three tranches of the Huijin option and sold USD4.5 billion to Huijin for RMB
at the exchange rate as agreed in the foreign currency option agreement. In addition,
the Bank has entered into foreign exchange spot transactions of USD6.8 billion to
further reduce its net foreign currency position after the balance sheet date (Note V.43).
Concurrently, the Bank entered into Cross Currency Interest Rate Swap contracts
(‘‘CIRS’’) with a notional amount of USD11.3 billion after the balance sheet date. Under
the CIRS, the Bank swapped in USD with RMB at the applicable spot rates and agreed to
settle the USD in exchange for RMB after one year. Interest is exchanged on a quarterly
basis over the life of the CIRS based on market rates (Note V.43).
Bank of China Annual Report 2006206
(Amount in millions of Renminbi, unless otherwise stated)
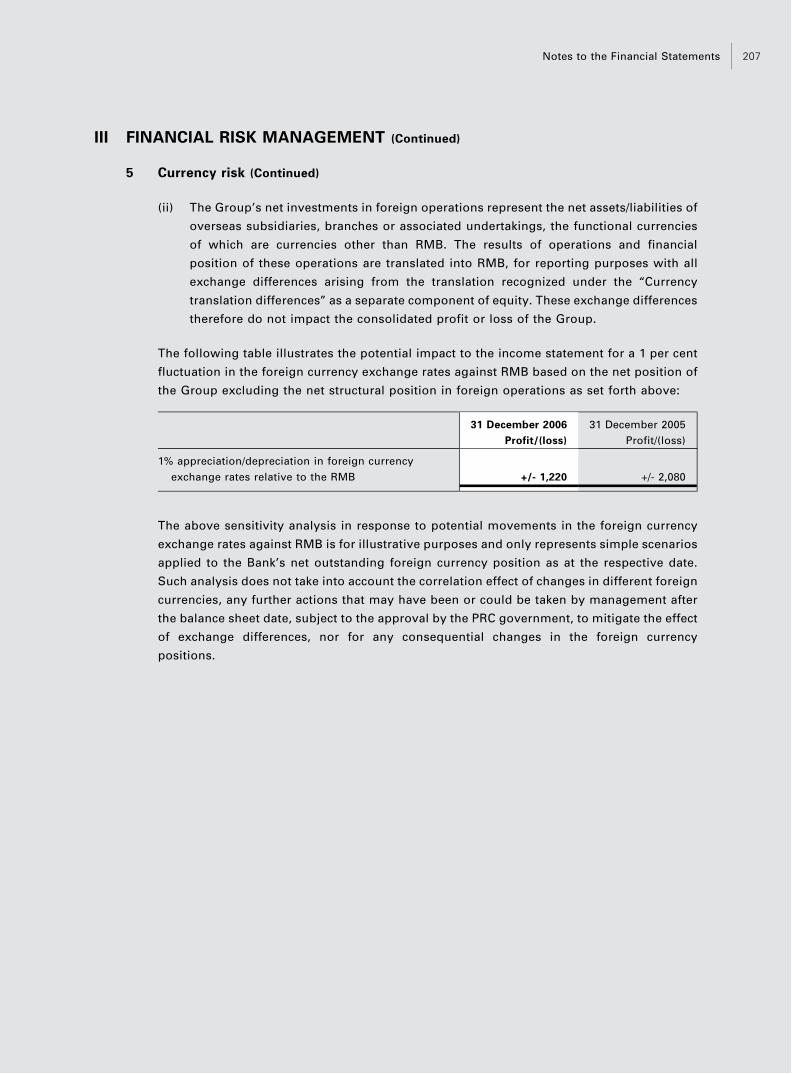
III FINANCIAL RISK MANAGEMENT (Continued)
5 Currency risk (Continued)
(ii) The Group’s net investments in foreign operations represent the net assets/liabilities of
overseas subsidiaries, branches or associated undertakings, the functional currencies
of which are currencies other than RMB. The results of operations and financial
position of these operations are translated into RMB, for reporting purposes with all
exchange differences arising from the translation recognized under the ‘‘Currency
translation differences’’ as a separate component of equity. These exchange differences
therefore do not impact the consolidated profit or loss of the Group.
The following table illustrates the potential impact to the income statement for a 1 per cent
fluctuation in the foreign currency exchange rates against RMB based on the net position of
the Group excluding the net structural position in foreign operations as set forth above:
31 December 2006
Profit/(loss)
31 December 2005
Profit/(loss)
1% appreciation/depreciation in foreign currency
exchange rates relative to the RMB +/- 1,220 +/- 2,080
The above sensitivity analysis in response to potential movements in the foreign currency
exchange rates against RMB is for illustrative purposes and only represents simple scenarios
applied to the Bank’s net outstanding foreign currency position as at the respective date.
Such analysis does not take into account the correlation effect of changes in different foreign
currencies, any further actions that may have been or could be taken by management after
the balance sheet date, subject to the approval by the PRC government, to mitigate the effect
of exchange differences, nor for any consequential changes in the foreign currency
positions.
Notes to the Financial Statements 207

III FINANCIAL RISK MANAGEMENT (Continued)
5 Currency risk (Continued)
The table below summarizes the Group’s exposure to foreign currency exchange rate risk as
at 31 December 2006 and 2005. Included in the table are the carrying amounts of the assets
and liabilities of the Group and the Bank along with off-balance sheet positions and credit
commitments in RMB equivalent, categorized by the original currency. Option products are
included in net off-balance sheet position using notional amounts.
Group
As at 31 December 2006
RMB USD HKD EURO JPY GBP Others Total
Assets
Cash and due from banks 20,313 9,174 4,478 2,020 1,691 658 1,478 39,812
Balances with central banks 349,839 19,556 2,322 425 4,865 — 2,624 379,631
Placements with banks and
other financial institutions 50,136 185,382 111,652 20,085 8,346 6,984 16,553 399,138
Government certificates of
indebtedness for bank
notes issued — — 34,913 — — — 1,713 36,626
Precious metals — — 1,541 — — — 40,542 42,083
Trading assets and other
financial instruments at fair
value through profit or loss 34,273 38,772 23,677 8,688 6,491 80 3,847 115,828
Derivative financial
instruments 7,418 9,161 7,694 150 88 174 152 24,837
Loans and advances to
customers, net 1,614,521 329,663 316,546 33,913 21,422 4,468 17,193 2,337,726
Investment securities
— available-for-sale 313,323 398,383 45,325 31,962 10,684 2,870 12,631 815,178
— held-to-maturity 180,914 192,383 63,521 6,325 — 1,794 16,203 461,140
— loans and receivables 350,159 76,235 43,609 — 13,520 1,065 15,748 500,336
Investments in associates and
joint ventures 2,461 762 2,708 — — — — 5,931
Property and equipment 47,346 22,538 12,864 134 1,064 511 1,743 86,200
Investment property — — 7,601 — — — 620 8,221
Deferred income tax assets 21,200 4 73 — 37 — 82 21,396
Other assets 14,343 21,303 13,987 1,252 307 227 2,151 53,570
Total assets 3,006,246 1,303,316 692,511 104,954 68,515 18,831 133,280 5,327,653
Bank of China Annual Report 2006208
(Amount in millions of Renminbi, unless otherwise stated)

III FINANCIAL RISK MANAGEMENT (Continued)
5 Currency risk (Continued)
Group
As at 31 December 2006
RMB USD HKD EURO JPY GBP Others Total
Liabilities
Due to banks and other
financial institutions 99,311 27,643 5,044 2,542 8,322 270 35,645 178,777
Due to central banks — 36,598 5,776 — — — — 42,374
Bank notes in circulation — — 34,914 — — — 1,909 36,823
Certificates of deposits and
placements from banks
and other financial
institutions 78,497 59,308 5,037 2,397 120 147 1,402 146,908
Derivative financial
instruments and liabilities
at fair value through profit
or loss 9,688 73,876 28,083 282 78 762 279 113,048
Due to customers 2,902,584 420,197 572,423 42,529 44,032 23,210 86,143 4,091,118
Bonds issued 60,000 173 — — — — — 60,173
Other borrowings — 40,014 — 15,247 3,984 786 3,367 63,398
Current tax liabilities 16,072 223 1,269 13 13 3 556 18,149
Retirement benefit
obligations 7,444 — — — — — — 7,444
Deferred income tax liabilities — 806 2,178 — — — 45 3,029
Other liabilities 88,800 25,753 33,339 2,190 968 556 1,850 153,456
Total liabilities 3,262,396 684,591 688,063 65,200 57,517 25,734 131,196 4,914,697
Net on-balance sheet position (256,150) 618,725 4,448 39,754 10,998 (6,903) 2,084 412,956
Net off-balance sheet position 439,850 (468,346) 79,804 (37,825) (13,762) 7,222 156 7,099
Credit commitments 505,383 345,814 152,091 51,404 16,424 4,440 12,266 1,087,822
Notes to the Financial Statements 209

III FINANCIAL RISK MANAGEMENT (Continued)
5 Currency risk (Continued)
Bank
As at 31 December 2006
RMB USD HKD EURO JPY GBP Others Total
Assets
Cash and due from banks 19,674 8,757 3,952 1,932 1,604 615 1,308 37,842
Balances with central banks 326,117 19,389 2,269 425 4,865 — 1,816 354,881
Placements with banks and
other financial institutions 50,932 173,541 29,164 22,310 8,408 6,360 12,287 303,002
Government certificates of
indebtedness for bank
notes issued — — — — — — 1,713 1,713
Precious metals — — — — — — 40,542 40,542
Trading assets and other
financial instruments at fair
value through profit or loss 31,497 30,533 — 6,437 6,324 — 1,790 76,581
Derivative financial
instruments 7,418 8,391 61 126 88 169 110 16,363
Loans and advances to
customers, net 1,609,963 274,178 22,619 31,003 19,735 3,476 10,891 1,971,865
Investment securities
— available-for-sale 312,925 336,857 12,343 27,613 10,684 750 5,567 706,739
— held-to-maturity 180,914 92,451 10,915 2,540 — 13 565 287,398
— loans and receivables 350,159 73,668 10,546 — 13,520 761 9,952 458,606
Investments in subsidiaries — 1,413 43,155 45 — — 838 45,451
Investments in associates and
joint ventures — 10 — — — — 11 21
Property and equipment 46,668 215 — 134 1,064 511 881 49,473
Investment property — — — — — — 620 620
Deferred income tax assets 21,742 4 — — 37 — 60 21,843
Other assets 14,044 12,803 1,280 1,062 302 115 666 30,272
Total assets 2,972,053 1,032,210 136,304 93,627 66,631 12,770 89,617 4,403,212
Bank of China Annual Report 2006210
(Amount in millions of Renminbi, unless otherwise stated)

III FINANCIAL RISK MANAGEMENT (Continued)
5 Currency risk (Continued)
Bank
As at 31 December 2006
RMB USD HKD EURO JPY GBP Others Total
Liabilities
Due to banks and other
financial institutions 84,378 29,206 3,960 2,412 8,460 320 35,640 164,376
Due to central banks — 36,573 5,776 — — — — 42,349
Bank notes in circulation — — — — — — 1,909 1,909
Certificates of deposits and
placements from banks
and other financial
institutions 78,156 57,015 7,102 3,163 142 147 871 146,596
Derivative financial
instruments and liabilities
at fair value through profit
or loss 9,688 66,257 13,913 243 78 753 152 91,084
Due to customers 2,891,429 268,327 69,661 36,405 40,242 11,075 41,426 3,358,565
Bonds issued 60,000 173 — — — — — 60,173
Other borrowings — 24,000 — 15,247 3,984 786 1,989 46,006
Current tax liabilities 16,058 223 — 9 13 3 451 16,757
Retirement benefit
obligations 7,444 — — — — — — 7,444
Deferred income tax liabilities — 20 — — — — 12 32
Other liabilities 87,583 17,979 2,467 1,986 879 418 1,215 112,527
Total liabilities 3,234,736 499,773 102,879 59,465 53,798 13,502 83,665 4,047,818
Net on-balance sheet position (262,683) 532,437 33,425 34,162 12,833 (732) 5,952 355,394
Net off-balance sheet position 439,686 (407,017) 22,467 (32,369) (15,426) 1,170 (4,795) 3,716
Credit commitments 502,965 310,418 11,297 48,725 15,890 4,323 8,610 902,228
Notes to the Financial Statements 211

III FINANCIAL RISK MANAGEMENT (Continued)
5 Currency risk (Continued)
Group
As at 31 December 2005
RMB USD HKD EURO JPY GBP Others Total
Assets
Cash and due from banks 17,632 12,507 5,016 1,688 1,422 540 2,277 41,082
Balances with central banks 274,107 13,503 10,655 852 15,826 — 1,998 316,941
Placements with banks and
other financial institutions 71,563 124,632 95,603 13,023 474 5,573 21,231 332,099
Government certificates of
indebtedness for bank
notes issued — — 33,945 — — — 1,641 35,586
Precious metals — — 1,736 — — — 25,238 26,974
Trading assets and other
financial instruments at fair
value through profit or loss 29,051 41,333 15,592 12,061 8,260 143 5,342 111,782
Derivative financial
instruments — 11,493 4,552 149 548 57 9 16,808
Loans and advances to
customers, net 1,411,382 346,718 315,727 34,443 24,866 4,192 14,784 2,152,112
Investment securities
— available-for-sale 230,512 284,807 29,829 28,884 13,891 5,128 9,170 602,221
— held-to-maturity 271,612 232,005 78,267 7,376 921 1,777 15,501 607,459
— loans and receivables 305,762 8,230 31,166 1,723 — — 14,970 361,851
Investments in associates and
joint ventures 4,547 31 483 — — — — 5,061
Property and equipment 46,004 289 12,850 135 1,121 480 1,538 62,417
Investment property — — 8,040 — — — 471 8,511
Deferred income tax assets 20,177 24 86 — 30 — 187 20,504
Other assets 14,520 11,251 9,757 1,025 618 247 1,222 38,640
Total assets 2,696,869 1,086,823 653,304 101,359 67,977 18,137 115,579 4,740,048
Bank of China Annual Report 2006212
(Amount in millions of Renminbi, unless otherwise stated)

III FINANCIAL RISK MANAGEMENT (Continued)
5 Currency risk (Continued)
Group
As at 31 December 2005
RMB USD HKD EURO JPY GBP Others Total
Liabilities
Due to banks and other
financial institutions 67,518 22,498 8,351 2,319 7,571 236 25,724 134,217
Due to central banks 1,084 24,162 4,650 29 — 32 98 30,055
Bank notes in circulation — — 33,945 — — — 1,786 35,731
Certificates of deposits and
placements from banks
and other financial
institutions 142,106 55,077 8,065 2,081 3,968 278 1,051 212,626
Derivative financial
instruments and liabilities
at fair value through profit
or loss — 70,625 19,552 420 384 117 76 91,174
Due to customers 2,531,878 438,881 527,118 46,854 37,565 26,634 90,534 3,699,464
Bonds issued 60,000 179 — — — — — 60,179
Other borrowings — 28,370 — 16,251 4,665 1,092 1,786 52,164
Current tax liabilities 21,728 191 946 15 — 10 569 23,459
Retirement benefit
obligations 7,052 — — — — — — 7,052
Deferred income tax liabilities — — 2,114 — — — 22 2,136
Other liabilities 95,714 17,028 19,571 1,510 1,139 518 792 136,272
Total liabilities 2,927,080 657,011 624,312 69,479 55,292 28,917 122,438 4,484,529
Net on-balance sheet position (230,211) 429,812 28,992 31,880 12,685 (10,780) (6,859) 255,519
Net off-balance sheet position 173,666 (229,776) 73,943 (29,586) (16,344) 15,331 15,197 2,431
Credit commitments 394,938 295,280 137,425 30,874 21,185 2,049 14,011 895,762
Notes to the Financial Statements 213

III FINANCIAL RISK MANAGEMENT (Continued)
5 Currency risk (Continued)
Bank
As at 31 December 2005
RMB USD HKD EURO JPY GBP Others Total
Assets
Cash and due from banks 17,167 9,617 6,046 1,593 1,256 489 2,107 38,275
Balances with central banks 251,430 13,415 1,787 852 15,826 — 1,063 284,373
Placements with banks and
other financial institutions 72,014 101,144 34,644 14,326 3,909 2,497 15,120 243,654
Government certificates of
indebtedness for bank
notes issued — — — — — — 1,641 1,641
Precious metals — — — — — — 25,238 25,238
Trading assets and other
financial instruments at fair
value through profit or loss 28,069 33,978 — 9,881 8,260 71 1,823 82,082
Derivative financial
instruments — 10,449 156 118 540 57 9 11,329
Loans and advances to
customers, net 1,409,349 295,757 19,143 30,114 22,347 3,346 8,686 1,788,742
Investment securities
— available-for-sale 230,361 255,249 6,740 26,286 13,891 4,089 5,526 542,142
— held-to-maturity 271,612 125,084 13,268 3,125 670 452 932 415,143
— loans and receivables 305,762 6,428 20,994 1,723 — — 9,003 343,910
Investments in subsidiaries 17 404 42,762 45 — — 1,852 45,080
Investments in associates and
joint ventures — 1 — — — — 44 45
Property and equipment 44,991 288 — 135 1,121 480 1,046 48,061
Investment property — — — — — — 461 461
Deferred income tax assets 20,177 24 — — 30 — 158 20,389
Other assets 14,649 8,132 850 855 289 101 961 25,837
Total assets 2,665,598 859,970 146,390 89,053 68,139 11,582 75,670 3,916,402
Bank of China Annual Report 2006214
(Amount in millions of Renminbi, unless otherwise stated)
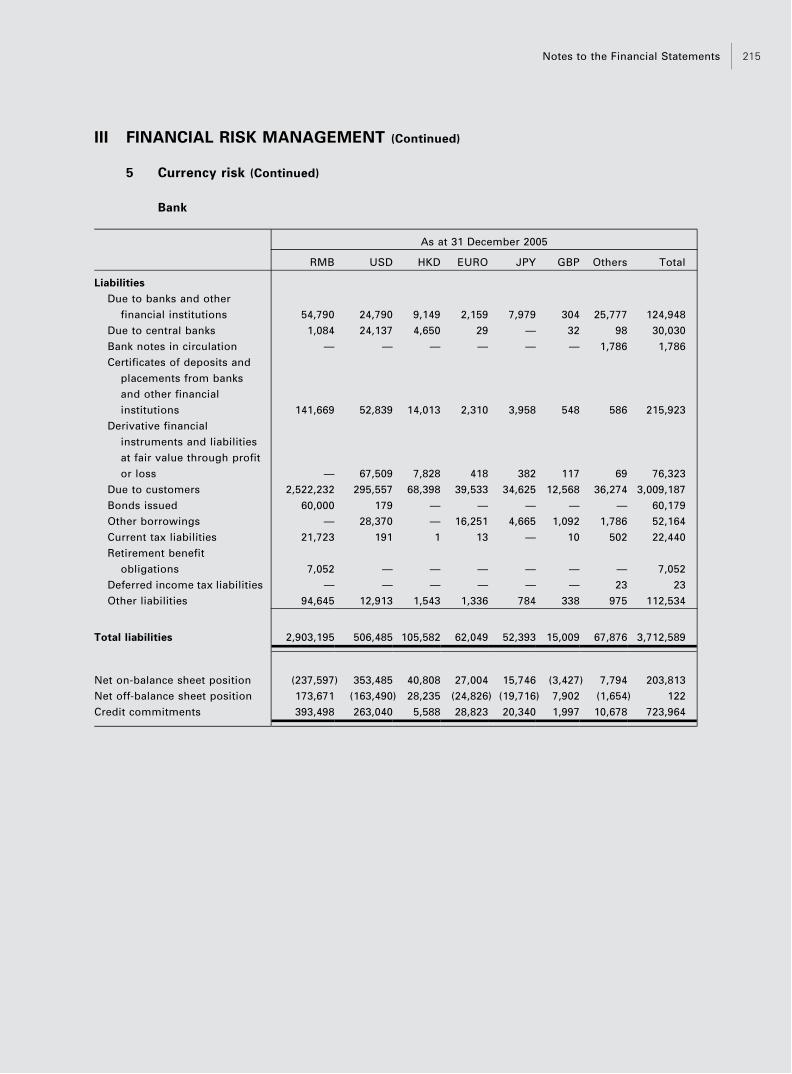
III FINANCIAL RISK MANAGEMENT (Continued)
5 Currency risk (Continued)
Bank
As at 31 December 2005
RMB USD HKD EURO JPY GBP Others Total
Liabilities
Due to banks and other
financial institutions 54,790 24,790 9,149 2,159 7,979 304 25,777 124,948
Due to central banks 1,084 24,137 4,650 29 — 32 98 30,030
Bank notes in circulation — — — — — — 1,786 1,786
Certificates of deposits and
placements from banks
and other financial
institutions 141,669 52,839 14,013 2,310 3,958 548 586 215,923
Derivative financial
instruments and liabilities
at fair value through profit
or loss — 67,509 7,828 418 382 117 69 76,323
Due to customers 2,522,232 295,557 68,398 39,533 34,625 12,568 36,274 3,009,187
Bonds issued 60,000 179 — — — — — 60,179
Other borrowings — 28,370 — 16,251 4,665 1,092 1,786 52,164
Current tax liabilities 21,723 191 1 13 — 10 502 22,440
Retirement benefit
obligations 7,052 — — — — — — 7,052
Deferred income tax liabilities — — — — — — 23 23
Other liabilities 94,645 12,913 1,543 1,336 784 338 975 112,534
Total liabilities 2,903,195 506,485 105,582 62,049 52,393 15,009 67,876 3,712,589
Net on-balance sheet position (237,597) 353,485 40,808 27,004 15,746 (3,427) 7,794 203,813
Net off-balance sheet position 173,671 (163,490) 28,235 (24,826) (19,716) 7,902 (1,654) 122
Credit commitments 393,498 263,040 5,588 28,823 20,340 1,997 10,678 723,964
Notes to the Financial Statements 215

III FINANCIAL RISK MANAGEMENT (Continued)
6 Interest rate risk
The Group takes on exposure to the effects of changes in the prevailing level of market
interest rates on its financial position and cash flows. Interest margins may increase as a
result of such changes but may reduce or create losses in the event that unexpected
movements arise. Currently, interest rates for RMB loans and deposits in the PRC are set by
the PBOC. The PBOC establishes RMB benchmark interest rates, which create a floor for RMB
loan rates and a cap for RMB deposit rates. The Group’s Domestic Operations are subject to
an interest rate scheme regulated by the PBOC. It is normal practice for the interest rates of
both interest-bearing assets and liabilities to move in tandem, although the timing of such
movements may not be synchronized. This significantly mitigates the exposure of the Group
to RMB interest rate risk. However, there is no guarantee that the PBOC will continue this
practice in future.
The Group is proactive in managing its exposure to foreign currency interest rates. It
monitors changes in foreign currency interest rates closely. In order to control its foreign
currency interest rate risk exposure, the Group will adjust foreign currency interest levels on
loans and deposits where necessary. It may also use financial instruments as economic
hedges against this exposure.
The tables below summarize the Group’s exposure to interest rates, showing the carrying
amounts of the assets and liabilities of the Group and the Bank, categorized by the earlier of
contractual re-pricing or maturity dates at the carrying amounts.
Bank of China Annual Report 2006216
(Amount in millions of Renminbi, unless otherwise stated)

III FINANCIAL RISK MANAGEMENT (Continued)
6 Interest rate risk (Continued)
Group
As at 31 December 2006
Less than
1 month
Between
1 to 3
months
Between
4 to 12
months
Between
1 to 5
years
Over
5 years
Non-
interest
bearing Total
Assets
Cash and due from banks 7,724 — — — — 32,088 39,812
Balances with central banks 352,873 — — — — 26,758 379,631
Placements with banks and other
financial institutions 265,023 106,212 27,783 120 — — 399,138
Government certificates of
indebtedness for bank notes
issued — — — — — 36,626 36,626
Precious metals — — — — — 42,083 42,083
Trading assets and other
financial instruments at fair
value through profit or loss 8,409 17,950 17,787 35,507 29,405 6,770 115,828
Derivative financial instruments — — — — — 24,837 24,837
Loans and advances to
customers, net 766,022 391,764 1,128,407 26,320 18,942 6,271 2,337,726
Investment securities
— available-for-sale 119,182 86,881 143,113 249,999 208,133 7,870 815,178
— held-to-maturity 56,479 93,807 116,519 121,376 72,959 — 461,140
— loans and receivables 52,744 62,973 92,151 249,868 42,600 — 500,336
Investments in associates and
joint ventures — — — — — 5,931 5,931
Property and equipment — — — — — 86,200 86,200
Investment property — — — — — 8,221 8,221
Deferred income tax assets — — — — — 21,396 21,396
Other assets 193 — — — — 53,377 53,570
Total assets 1,628,649 759,587 1,525,760 683,190 372,039 358,428 5,327,653
Notes to the Financial Statements 217
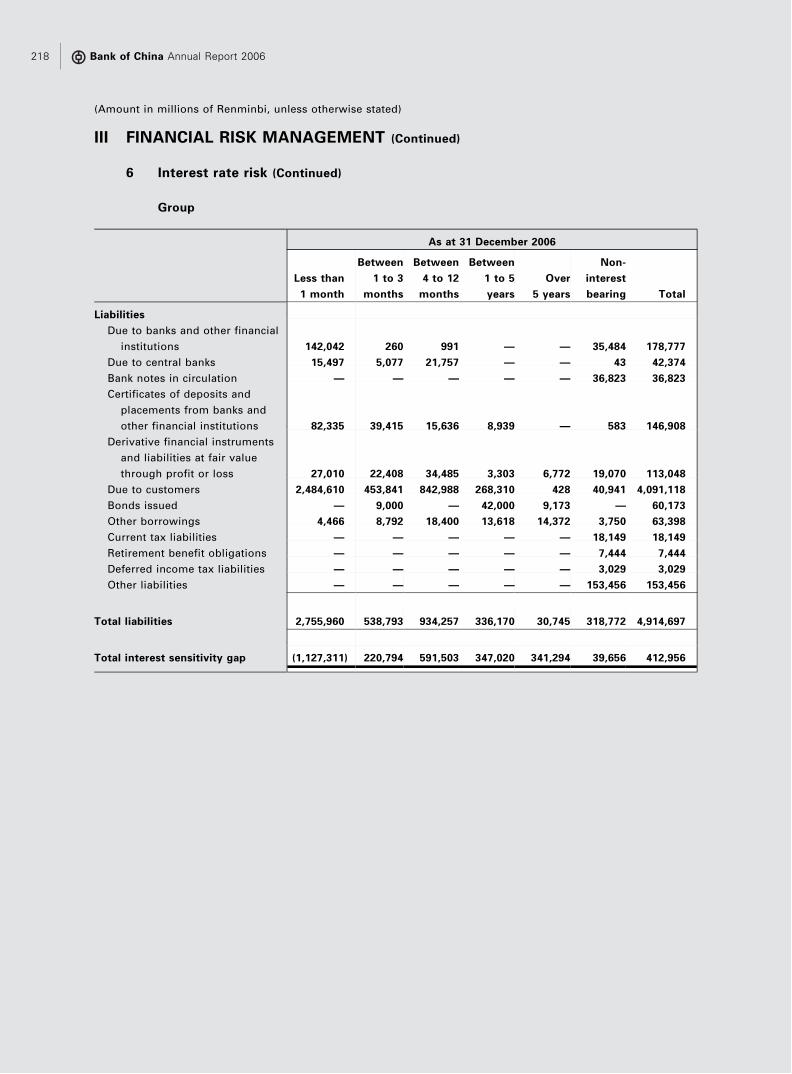
III FINANCIAL RISK MANAGEMENT (Continued)
6 Interest rate risk (Continued)
Group
As at 31 December 2006
Less than
1 month
Between
1 to 3
months
Between
4 to 12
months
Between
1 to 5
years
Over
5 years
Non-
interest
bearing Total
Liabilities
Due to banks and other financial
institutions 142,042 260 991 — — 35,484 178,777
Due to central banks 15,497 5,077 21,757 — — 43 42,374
Bank notes in circulation — — — — — 36,823 36,823
Certificates of deposits and
placements from banks and
other financial institutions 82,335 39,415 15,636 8,939 — 583 146,908
Derivative financial instruments
and liabilities at fair value
through profit or loss 27,010 22,408 34,485 3,303 6,772 19,070 113,048
Due to customers 2,484,610 453,841 842,988 268,310 428 40,941 4,091,118
Bonds issued — 9,000 — 42,000 9,173 — 60,173
Other borrowings 4,466 8,792 18,400 13,618 14,372 3,750 63,398
Current tax liabilities — — — — — 18,149 18,149
Retirement benefit obligations — — — — — 7,444 7,444
Deferred income tax liabilities — — — — — 3,029 3,029
Other liabilities — — — — — 153,456 153,456
Total liabilities 2,755,960 538,793 934,257 336,170 30,745 318,772 4,914,697
Total interest sensitivity gap (1,127,311) 220,794 591,503 347,020 341,294 39,656 412,956
Bank of China Annual Report 2006218
(Amount in millions of Renminbi, unless otherwise stated)
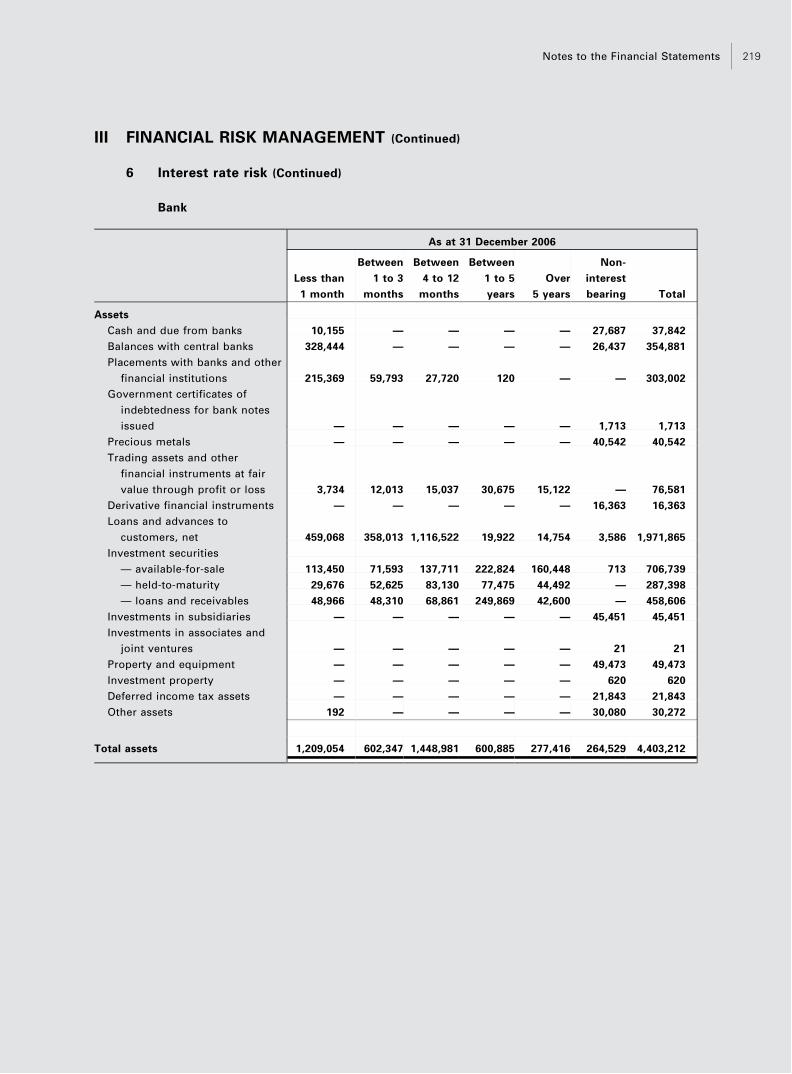
III FINANCIAL RISK MANAGEMENT (Continued)
6 Interest rate risk (Continued)
Bank
As at 31 December 2006
Less than
1 month
Between
1 to 3
months
Between
4 to 12
months
Between
1 to 5
years
Over
5 years
Non-
interest
bearing Total
Assets
Cash and due from banks 10,155 — — — — 27,687 37,842
Balances with central banks 328,444 — — — — 26,437 354,881
Placements with banks and other
financial institutions 215,369 59,793 27,720 120 — — 303,002
Government certificates of
indebtedness for bank notes
issued — — — — — 1,713 1,713
Precious metals — — — — — 40,542 40,542
Trading assets and other
financial instruments at fair
value through profit or loss 3,734 12,013 15,037 30,675 15,122 — 76,581
Derivative financial instruments — — — — — 16,363 16,363
Loans and advances to
customers, net 459,068 358,013 1,116,522 19,922 14,754 3,586 1,971,865
Investment securities
— available-for-sale 113,450 71,593 137,711 222,824 160,448 713 706,739
— held-to-maturity 29,676 52,625 83,130 77,475 44,492 — 287,398
— loans and receivables 48,966 48,310 68,861 249,869 42,600 — 458,606
Investments in subsidiaries — — — — — 45,451 45,451
Investments in associates and
joint ventures — — — — — 21 21
Property and equipment — — — — — 49,473 49,473
Investment property — — — — — 620 620
Deferred income tax assets — — — — — 21,843 21,843
Other assets 192 — — — — 30,080 30,272
Total assets 1,209,054 602,347 1,448,981 600,885 277,416 264,529 4,403,212
Notes to the Financial Statements 219

III FINANCIAL RISK MANAGEMENT (Continued)
6 Interest rate risk (Continued)
Bank
As at 31 December 2006
Less than
1 month
Between
1 to 3
months
Between
4 to 12
months
Between
1 to 5
years
Over
5 years
Non-
interest
bearing Total
Liabilities
Due to banks and other financial
institutions 129,396 — — — — 34,980 164,376
Due to central banks 15,497 5,077 21,757 — — 18 42,349
Bank notes in circulation — — — — — 1,909 1,909
Certificates of deposits and
placements from banks and
other financial institutions 78,339 42,201 19,084 6,972 — — 146,596
Derivative financial instruments
and liabilities at fair value
through profit or loss 21,154 18,822 31,606 3,085 6,772 9,645 91,084
Due to customers 1,891,308 370,618 817,744 267,573 115 11,207 3,358,565
Bonds issued — 9,000 — 42,000 9,173 — 60,173
Other borrowings 1,736 1,115 11,572 13,619 14,372 3,592 46,006
Current tax liabilities — — — — — 16,757 16,757
Retirement benefit obligations — — — — — 7,444 7,444
Deferred income tax liabilities — — — — — 32 32
Other liabilities — — — — — 112,527 112,527
Total liabilities 2,137,430 446,833 901,763 333,249 30,432 198,111 4,047,818
Total interest sensitivity gap (928,376) 155,514 547,218 267,636 246,984 66,418 355,394
Bank of China Annual Report 2006220
(Amount in millions of Renminbi, unless otherwise stated)

III FINANCIAL RISK MANAGEMENT (Continued)
6 Interest rate risk (Continued)
Group
As at 31 December 2005
Less than
1 month
Between
1 to 3
months
Between
4 to12
months
Between
1 to 5
years
Over
5 years
Non-
interest
bearing Total
Assets
Cash and due from banks 11,624 — — — — 29,458 41,082
Balances with central banks 282,601 1,019 20 — — 33,301 316,941
Placements with banks and other
financial institutions 219,459 95,367 17,224 49 — — 332,099
Government certificates of
indebtedness for bank notes
issued — — — — — 35,586 35,586
Precious metals — — — — — 26,974 26,974
Trading assets and other
financial instruments at fair
value through profit or loss 6,678 13,594 20,951 44,592 21,456 4,511 111,782
Derivative financial instruments — — — — — 16,808 16,808
Loans and advances to
customers, net 739,411 309,707 1,046,662 30,557 21,685 4,090 2,152,112
Investment securities
— available-for-sale 83,297 39,436 132,426 222,989 114,862 9,211 602,221
— held-to-maturity 73,197 120,609 184,638 155,890 73,125 — 607,459
— loans and receivables 29,505 16,996 12,965 259,785 42,600 — 361,851
Investments in associates and
joint ventures — — — — — 5,061 5,061
Property and equipment — — — — — 62,417 62,417
Investment property — — — — — 8,511 8,511
Deferred income tax assets — — — — — 20,504 20,504
Other assets — — — — — 38,640 38,640
Total assets 1,445,772 596,728 1,414,886 713,862 273,728 295,072 4,740,048
Notes to the Financial Statements 221

III FINANCIAL RISK MANAGEMENT (Continued)
6 Interest rate risk (Continued)
Group
As at 31 December 2005
Less than
1 month
Between
1 to 3
months
Between
4 to12
months
Between
1 to 5
years
Over
5 years
Non-
interest
bearing Total
Liabilities
Due to banks and other financial
institutions 105,902 — — — — 28,315 134,217
Due to central banks 29,911 20 — — — 124 30,055
Bank notes in circulation — — — — — 35,731 35,731
Certificates of deposits and
placements from banks and
other financial institutions 78,728 51,316 75,595 3,899 — 3,088 212,626
Derivative financial instruments
and liabilities at fair value
through profit or loss 12,207 22,678 26,291 8,151 5,609 16,238 91,174
Due to customers 2,111,931 478,588 835,252 240,849 1,279 31,565 3,699,464
Bonds issued — 9,000 — 42,000 9,179 — 60,179
Other borrowings 1,827 1,283 13,096 15,978 15,790 4,190 52,164
Current tax liabilities — — — — — 23,459 23,459
Retirement benefit obligations — — — — — 7,052 7,052
Deferred income tax liabilities — — — — — 2,136 2,136
Other liabilities — — — — — 136,272 136,272
Total liabilities 2,340,506 562,885 950,234 310,877 31,857 288,170 4,484,529
Total interest sensitivity gap (894,734) 33,843 464,652 402,985 241,871 6,902 255,519
Bank of China Annual Report 2006222
(Amount in millions of Renminbi, unless otherwise stated)

III FINANCIAL RISK MANAGEMENT (Continued)
6 Interest rate risk (Continued)
Bank
As at 31 December 2005
Less than
1 month
Between
1 to 3
months
Between
4 to12
months
Between
1 to 5
years
Over
5 years
Non-
interest
bearing Total
Assets
Cash and due from banks 12,963 — — — — 25,312 38,275
Balances with central banks 251,351 — — — — 33,022 284,373
Placements with banks and other
financial institutions 160,496 64,610 13,197 5,351 — — 243,654
Government certificates of
indebtedness for bank notes
issued — — — — — 1,641 1,641
Precious metals — — — — — 25,238 25,238
Trading assets and other
financial instruments at fair
value through profit or loss 2,587 7,675 17,506 40,731 13,583 — 82,082
Derivative financial instruments — — — — — 11,329 11,329
Loans and advances to
customers, net 447,603 265,919 1,032,329 21,545 17,256 4,090 1,788,742
Investment securities
— available-for-sale 78,067 31,481 130,426 201,875 97,088 3,205 542,142
— held-to-maturity 42,279 70,698 147,654 98,065 56,447 — 415,143
— loans and receivables 24,763 11,368 5,393 259,785 42,601 — 343,910
Investments in subsidiaries — — — — — 45,080 45,080
Investments in associates and
joint ventures — — — — — 45 45
Property and equipment — — — — — 48,061 48,061
Investment property — — — — — 461 461
Deferred income tax assets — — — — — 20,389 20,389
Other assets — — — — — 25,837 25,837
Total assets 1,020,109 451,751 1,346,505 627,352 226,975 243,710 3,916,402
Notes to the Financial Statements 223

III FINANCIAL RISK MANAGEMENT (Continued)
6 Interest rate risk (Continued)
Bank
As at 31 December 2005
Less than
1 month
Between
1 to 3
months
Between
4 to12
months
Between
1 to 5
years
Over
5 years
Non-
interest
bearing Total
Liabilities
Due to banks and other financial
institutions 97,279 — — — — 27,669 124,948
Due to central banks 29,910 20 — — — 100 30,030
Bank notes in circulation — — — — — 1,786 1,786
Certificates of deposits and
placements from banks and
other financial institutions 83,104 53,078 75,041 2,524 — 2,176 215,923
Derivative financial instruments
and liabilities at fair value
through profit or loss 10,384 20,494 24,783 5,309 5,609 9,744 76,323
Due to customers 1,625,628 327,602 810,211 237,830 720 7,196 3,009,187
Bonds issued — 9,000 — 42,000 9,179 — 60,179
Other borrowings 1,827 1,283 13,096 15,978 15,790 4,190 52,164
Current tax liabilities — — — — — 22,440 22,440
Retirement benefit obligations — — — — — 7,052 7,052
Deferred income tax liabilities — — — — — 23 23
Other liabilities — — — — — 112,534 112,534
Total liabilities 1,848,132 411,477 923,131 303,641 31,298 194,910 3,712,589
Total interest sensitivity gap (828,023) 40,274 423,374 323,711 195,677 48,800 203,813
Bank of China Annual Report 2006224
(Amount in millions of Renminbi, unless otherwise stated)

III FINANCIAL RISK MANAGEMENT (Continued)
6 Interest rate risk (Continued)
The tables below summarize the effective interest rate by major currencies for monetary
financial instruments not carried at fair value through profit or loss:
Group
As at 31 December 2006
RMB USD HKD EURO JPY GBP
Assets
Cash and due from banks 0.06% 1.74% 0.60% 0.11% — 0.17%
Balances with central banks 1.68% 0.25% 0.17% 1.71% — —
Placements with banks and other
financial institutions 2.64% 5.25% 4.06% 3.58% 0.38% 5.17%
Loans and advances to customers, net 5.92% 5.70% 5.19% 3.78% 1.10% 5.27%
Investment securities
— available-for-sale 2.75% 5.29% 4.21% 3.23% 0.83% 4.97%
— held-to-maturity 2.75% 4.43% 4.04% 3.43% — 5.50%
— loans and receivables 2.19% 5.40% 3.92% — 0.28% 4.96%
Liabilities
Due to banks and other financial
institutions 1.10% 1.72% 1.43% 0.46% 0.14% 0.97%
Due to central banks — 4.05% 2.96% — — —
Certificates of deposits and placements
from banks and other financial
institutions 2.76% 4.92% 4.02% 3.66% 0.14% 3.66%
Due to customers 1.67% 2.97% 2.91% 1.19% — 3.36%
Bonds issued 4.76% 8.42% — — — —
Other borrowings — 4.66% — 3.94% 1.90% 4.05%
Notes to the Financial Statements 225

III FINANCIAL RISK MANAGEMENT (Continued)
6 Interest rate risk (Continued)
Bank
As at 31 December 2006
RMB USD HKD EURO JPY GBP
Assets
Cash and due from banks 0.08% 1.88% 2.20% 0.03% — 0.05%
Balances with central banks 1.68% 0.25% 0.14% 1.71% — —
Placements with banks and other
financial institutions 2.64% 5.26% 4.03% 3.58% 0.39% 5.15%
Loans and advances to customers, net 5.92% 5.59% 4.89% 2.80% 1.08% 5.30%
Investment securities
— available-for-sale 2.75% 5.24% 4.73% 3.19% 0.83% 4.36%
— held-to-maturity 2.74% 3.93% 3.57% 3.23% — 5.29%
— loans and receivables 2.18% 5.41% 3.98% — 0.28% 5.06%
Liabilities
Due to banks and other financial
institutions 1.10% 1.92% 0.96% 0.46% 0.14% 0.97%
Due to central banks — 4.05% 2.98% — — —
Certificates of deposits and placements
from banks and other financial
institutions 2.76% 4.90% 4.12% 3.66% 0.01% 3.66%
Due to customers 1.67% 2.47% 1.71% 1.04% — 2.95%
Bonds issued 4.76% 8.42% — — — —
Other borrowings — 3.81% — 3.94% 1.90% 4.05%
Bank of China Annual Report 2006226
(Amount in millions of Renminbi, unless otherwise stated)

III FINANCIAL RISK MANAGEMENT (Continued)
6 Interest rate risk (Continued)
Group
As at 31 December 2005
RMB USD HKD EURO JPY GBP
Assets
Cash and due from banks 0.04% 1.93% 0.57% 0.24% — 0.14%
Balances with central banks 1.58% 0.09% 3.21% 2.28% — —
Placements with banks and other
financial institutions 1.56% 4.18% 4.04% 2.29% 0.14% 4.57%
Loans and advances to customers, net 5.60% 4.79% 5.27% 2.60% 1.05% 4.64%
Investment securities
— available-for-sale 2.53% 4.52% 3.51% 3.11% 1.20% 4.72%
— held-to-maturity 2.05% 3.90% 3.92% 2.86% 1.59% 4.79%
— loans and receivables 2.17% 4.27% 3.82% 2.30% — —
Liabilities
Due to banks and other financial
institutions 1.12% 1.39% 1.31% 0.32% — 0.50%
Due to central banks 1.45% 1.15% 1.00% 2.36% — 4.16%
Certificates of deposits and placements
from banks and other financial
institutions 2.52% 3.99% 3.89% 2.38% 0.19% 4.16%
Due to customers 1.59% 2.13% 2.83% 0.79% — 2.64%
Bonds issued 4.60% 8.42% — — — —
Other borrowings — 3.70% — 4.13% 2.00% 4.11%
Notes to the Financial Statements 227
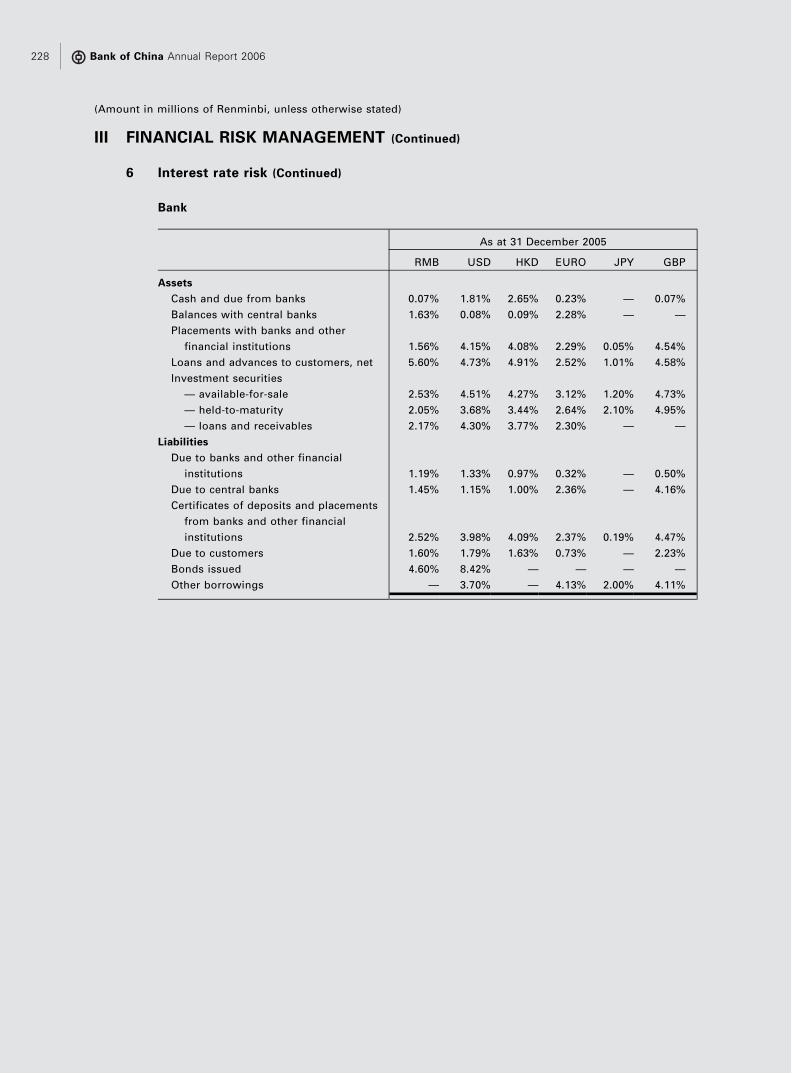
III FINANCIAL RISK MANAGEMENT (Continued)
6 Interest rate risk (Continued)
Bank
As at 31 December 2005
RMB USD HKD EURO JPY GBP
Assets
Cash and due from banks 0.07% 1.81% 2.65% 0.23% — 0.07%
Balances with central banks 1.63% 0.08% 0.09% 2.28% — —
Placements with banks and other
financial institutions 1.56% 4.15% 4.08% 2.29% 0.05% 4.54%
Loans and advances to customers, net 5.60% 4.73% 4.91% 2.52% 1.01% 4.58%
Investment securities
— available-for-sale 2.53% 4.51% 4.27% 3.12% 1.20% 4.73%
— held-to-maturity 2.05% 3.68% 3.44% 2.64% 2.10% 4.95%
— loans and receivables 2.17% 4.30% 3.77% 2.30% — —
Liabilities
Due to banks and other financial
institutions 1.19% 1.33% 0.97% 0.32% — 0.50%
Due to central banks 1.45% 1.15% 1.00% 2.36% — 4.16%
Certificates of deposits and placements
from banks and other financial
institutions 2.52% 3.98% 4.09% 2.37% 0.19% 4.47%
Due to customers 1.60% 1.79% 1.63% 0.73% — 2.23%
Bonds issued 4.60% 8.42% — — — —
Other borrowings — 3.70% — 4.13% 2.00% 4.11%
Bank of China Annual Report 2006228
(Amount in millions of Renminbi, unless otherwise stated)

III FINANCIAL RISK MANAGEMENT (Continued)
7 Liquidity risk
The Group’s objective in liquidity management is to ensure the availability of adequate
funding at all times to meet its needs to fund deposit withdrawals and other liabilities as they
fall due, as well as being able to meet its obligations to fund loan originations and
commitments and to take advantage of new investment opportunities.
In developing its liquidity management strategy, the Group has considered its financing
position, business development plans, market conditions and convertibility of currencies in
the local market and developed a liquidity management plan in accordance with prudent
principles. This plan addresses the Group’s liquidity needs in multiple currencies and
regions.
The Group’s liquidity management policies related to assets encourage diversification and
the maintenance of sufficient levels of liquid assets. The Group’s policies related to liabilities
focus on the stability of liabilities and the growth of the core deposit base.
In addition, the Group limits its loan to deposit ratio to 75%, as required by the PBOC. As at
31 December 2006 and 2005, the Domestic Operations of the Group are required to maintain
reserves equal to 9.0%, and 7.5%, respectively, of total RMB denominated deposits and 4.0%,
and 3.0%, respectively, of total foreign currency denominated deposits with the PBOC.
Details are set out in Note V.13.
The tables below summarize the assets and liabilities of the Group and the Bank by relevant
maturity groupings based on the remaining period at balance sheet date to the contractual
maturity date.
For purposes of these tables, loans and advances to customers are considered overdue only
if principal payments are overdue. In addition, for loans and advances to customers that are
repayable by installments, only the portion of the loan that is actually overdue is reported as
overdue. Any part of the loan that is not due is reported according to residual maturity.
Notes to the Financial Statements 229

III FINANCIAL RISK MANAGEMENT (Continued)
7 Liquidity risk (Continued)
Group
As at 31 December 2006
Overdue
On
demand
Less than
1 month
Between
1–3
months
Between
4–12
months
Between
1–5 years
Over
5 years Total
Assets
Cash and due from banks — 39,812 — — — — — 39,812
Balances with central banks — 102,017 277,614 — — — — 379,631
Placements with banks and other financial
institutions — — 264,913 106,193 27,909 123 — 399,138
Government certificates of indebtedness for bank
notes issued — 36,626 — — — — — 36,626
Precious metals — 42,083 — — — — — 42,083
Trading assets and other financial instruments at
fair value through profit or loss — — 9,611 10,043 14,868 41,703 39,603 115,828
Derivative financial instruments — 6,466 2,516 1,699 8,181 3,321 2,654 24,837
Loans and advances to customers, net 48,388 32,925 129,262 251,375 646,647 624,209 604,920 2,337,726
Investment securities
— available-for-sale — — 23,457 47,972 132,998 293,914 316,837 815,178
— held-to-maturity — — 26,616 57,308 102,015 186,741 88,460 461,140
— loans and receivables — — 52,744 62,973 85,706 250,169 48,744 500,336
Investments in associates and joint ventures — — — — — 147 5,784 5,931
Property and equipment — — — — — — 86,200 86,200
Investment property — — — — — — 8,221 8,221
Deferred income tax assets — — — — 23 21,321 52 21,396
Other assets 366 8,473 10,994 6,422 16,733 4,131 6,451 53,570
Total assets 48,754 268,402 797,727 543,985 1,035,080 1,425,779 1,207,926 5,327,653
Bank of China Annual Report 2006230
(Amount in millions of Renminbi, unless otherwise stated)

III FINANCIAL RISK MANAGEMENT (Continued)
7 Liquidity risk (Continued)
Group
As at 31 December 2006
Overdue
On
demand
Less than
1 month
Between
1–3
months
Between
4–12
months
Between
1–5 years
Over
5 years Total
Liabilities
Due to banks and other financial institutions — 178,777 — — — — — 178,777
Due to central banks — 11,116 4,412 5,078 21,768 — — 42,374
Bank notes in circulation — 36,823 — — — — — 36,823
Certificates of deposits and placements from banks
and other financial institutions — 2,515 79,096 19,698 25,160 20,439 — 146,908
Derivative financial instruments and liabilities at
fair value through profit or loss — 2,977 22,020 16,288 40,967 18,639 12,157 113,048
Due to customers — 1,854,295 671,453 439,215 847,843 277,401 911 4,091,118
Bonds issued — — — — — — 60,173 60,173
Other borrowings — — 947 743 5,754 22,633 33,321 63,398
Current tax liabilities — 14 26 6 17,792 271 40 18,149
Retirement benefit obligations — — 82 163 713 3,087 3,399 7,444
Deferred income tax liabilities — — — — 1,808 1,201 20 3,029
Other liabilities — 71,136 15,508 7,197 31,699 11,894 16,022 153,456
Total liabilities — 2,157,653 793,544 488,388 993,504 355,565 126,043 4,914,697
Net liquidity gap 48,754 (1,889,251) 4,183 55,597 41,576 1,070,214 1,081,883 412,956
Notes to the Financial Statements 231

III FINANCIAL RISK MANAGEMENT (Continued)
7 Liquidity risk (Continued)
Bank
As at 31 December 2006
Overdue
On
demand
Less than
1 month
Between
1–3
months
Between
4–12
months
Between
1–5 years
Over
5 years Total
Assets
Cash and due from banks — 37,842 — — — — — 37,842
Balances with central banks — 77,810 277,071 — — — — 354,881
Placements with banks and other financial
institutions — 40 214,335 59,378 21,562 7,687 — 303,002
Government certificates of indebtedness for bank
notes issued — 1,713 — — — — — 1,713
Precious metals — 40,542 — — — — — 40,542
Trading assets and other financial instruments at
fair value through profit or loss — — 2,967 7,254 10,311 33,203 22,846 76,581
Derivative financial instruments — 77 1,726 1,391 7,863 2,861 2,445 16,363
Loans and advances to customers, net 46,546 2,730 118,855 233,901 605,283 481,126 483,424 1,971,865
Investment securities
— available-for-sale — — 21,494 42,162 125,821 250,249 267,013 706,739
— held-to-maturity — — 21,077 47,967 62,063 98,480 57,811 287,398
— loans and receivables — — 48,966 48,310 62,417 250,169 48,744 458,606
Investment in subsidiaries — — — — — 376 45,075 45,451
Investments in associates and joint ventures — — — — — 10 11 21
Property and equipment — — — — — — 49,473 49,473
Investment property — — — — — — 620 620
Deferred income tax assets — — — — — 21,791 52 21,843
Other assets 192 3,625 1,691 5,741 15,591 56 3,376 30,272
Total assets 46,738 164,379 708,182 446,104 910,911 1,146,008 980,890 4,403,212
Bank of China Annual Report 2006232
(Amount in millions of Renminbi, unless otherwise stated)
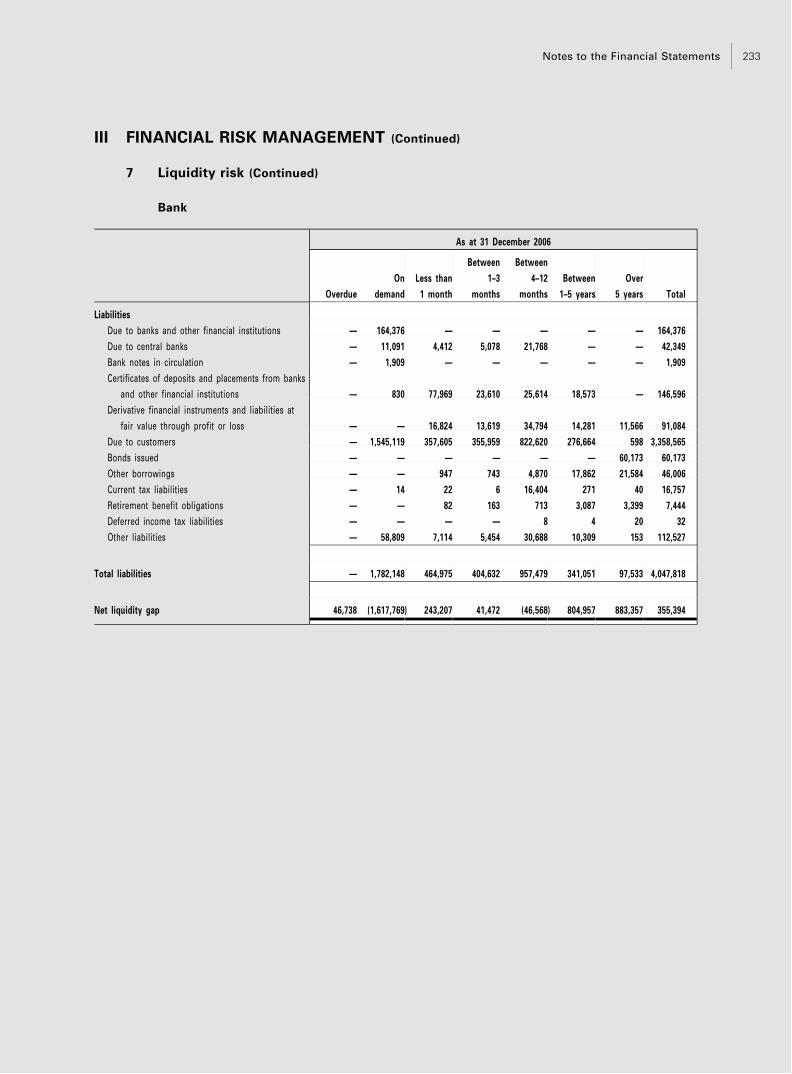
III FINANCIAL RISK MANAGEMENT (Continued)
7 Liquidity risk (Continued)
Bank
As at 31 December 2006
Overdue
On
demand
Less than
1 month
Between
1–3
months
Between
4–12
months
Between
1–5 years
Over
5 years Total
Liabilities
Due to banks and other financial institutions — 164,376 — — — — — 164,376
Due to central banks — 11,091 4,412 5,078 21,768 — — 42,349
Bank notes in circulation — 1,909 — — — — — 1,909
Certificates of deposits and placements from banks
and other financial institutions — 830 77,969 23,610 25,614 18,573 — 146,596
Derivative financial instruments and liabilities at
fair value through profit or loss — — 16,824 13,619 34,794 14,281 11,566 91,084
Due to customers — 1,545,119 357,605 355,959 822,620 276,664 598 3,358,565
Bonds issued — — — — — — 60,173 60,173
Other borrowings — — 947 743 4,870 17,862 21,584 46,006
Current tax liabilities — 14 22 6 16,404 271 40 16,757
Retirement benefit obligations — — 82 163 713 3,087 3,399 7,444
Deferred income tax liabilities — — — — 8 4 20 32
Other liabilities — 58,809 7,114 5,454 30,688 10,309 153 112,527
Total liabilities — 1,782,148 464,975 404,632 957,479 341,051 97,533 4,047,818
Net liquidity gap 46,738 (1,617,769) 243,207 41,472 (46,568) 804,957 883,357 355,394
Notes to the Financial Statements 233
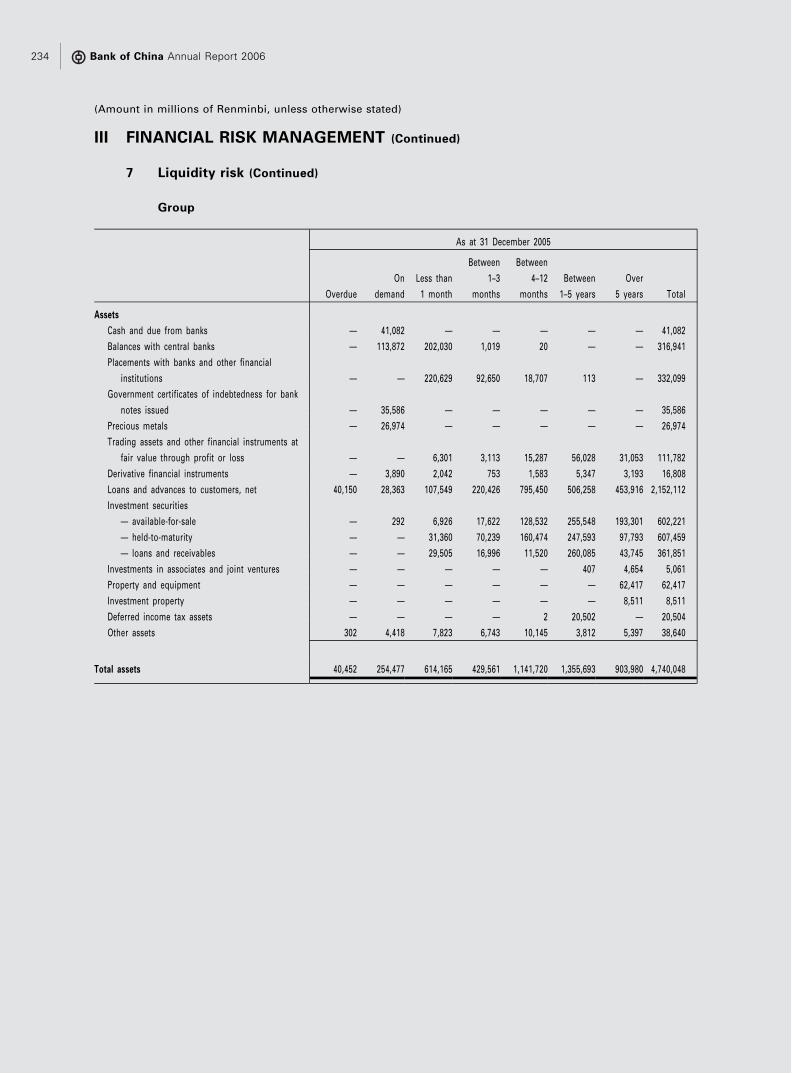
III FINANCIAL RISK MANAGEMENT (Continued)
7 Liquidity risk (Continued)
Group
As at 31 December 2005
Overdue
On
demand
Less than
1 month
Between
1–3
months
Between
4–12
months
Between
1–5 years
Over
5 years Total
Assets
Cash and due from banks — 41,082 — — — — — 41,082
Balances with central banks — 113,872 202,030 1,019 20 — — 316,941
Placements with banks and other financial
institutions — — 220,629 92,650 18,707 113 — 332,099
Government certificates of indebtedness for bank
notes issued — 35,586 — — — — — 35,586
Precious metals — 26,974 — — — — — 26,974
Trading assets and other financial instruments at
fair value through profit or loss — — 6,301 3,113 15,287 56,028 31,053 111,782
Derivative financial instruments — 3,890 2,042 753 1,583 5,347 3,193 16,808
Loans and advances to customers, net 40,150 28,363 107,549 220,426 795,450 506,258 453,916 2,152,112
Investment securities
— available-for-sale — 292 6,926 17,622 128,532 255,548 193,301 602,221
— held-to-maturity — — 31,360 70,239 160,474 247,593 97,793 607,459
— loans and receivables — — 29,505 16,996 11,520 260,085 43,745 361,851
Investments in associates and joint ventures — — — — — 407 4,654 5,061
Property and equipment — — — — — — 62,417 62,417
Investment property — — — — — — 8,511 8,511
Deferred income tax assets — — — — 2 20,502 — 20,504
Other assets 302 4,418 7,823 6,743 10,145 3,812 5,397 38,640
Total assets 40,452 254,477 614,165 429,561 1,141,720 1,355,693 903,980 4,740,048
Bank of China Annual Report 2006234
(Amount in millions of Renminbi, unless otherwise stated)

III FINANCIAL RISK MANAGEMENT (Continued)
7 Liquidity risk (Continued)
Group
As at 31 December 2005
Overdue
On
demand
Less than
1 month
Between
1–3
months
Between
4–12
months
Between
1–5 years
Over
5 years Total
Liabilities
Due to banks and other financial institutions — 134,217 — — — — — 134,217
Due to central banks — 29,506 529 20 — — — 30,055
Bank notes in circulation — 35,731 — — — — — 35,731
Certificates of deposits and placements from banks
and other financial institutions — 640 79,584 47,363 50,464 34,575 — 212,626
Derivative financial instruments and liabilities at
fair value through profit or loss — 1,805 9,124 9,301 22,996 38,091 9,857 91,174
Due to customers — 1,615,637 521,284 441,468 840,668 278,098 2,309 3,699,464
Bonds issued — — — — — — 60,179 60,179
Other borrowings — — 1,046 816 5,361 20,840 24,101 52,164
Current tax liabilities — 13 — — 23,446 — — 23,459
Retirement benefit obligations — — 76 151 661 2,883 3,281 7,052
Deferred income tax liabilities — — — — 1,782 354 — 2,136
Other liabilities — 74,494 14,906 5,585 28,384 12,170 733 136,272
Total liabilities — 1,892,043 626,549 504,704 973,762 387,011 100,460 4,484,529
Net liquidity gap 40,452 (1,637,566) (12,384) (75,143) 167,958 968,682 803,520 255,519
Notes to the Financial Statements 235

III FINANCIAL RISK MANAGEMENT (Continued)
7 Liquidity risk (Continued)
Bank
As at 31 December 2005
Overdue
On
demand
Less than
1 month
Between
1–3
months
Between
4–12
months
Between
1–5 years
Over
5 years Total
Assets
Cash and due from banks — 38,275 — — — — — 38,275
Balances with central banks — 82,936 201,437 — — — — 284,373
Placements with banks and other financial
institutions — — 160,496 62,996 14,748 5,414 — 243,654
Government certificates of indebtedness for bank
notes issued — 1,641 — — — — — 1,641
Precious metals — 25,238 — — — — — 25,238
Trading assets and other financial instruments at
fair value through profit or loss — — 1,229 1,972 12,465 44,796 21,620 82,082
Derivative financial instruments — — 798 521 1,587 5,263 3,160 11,329
Loans and advances to customers, net 38,671 837 98,739 200,848 760,911 362,141 326,595 1,788,742
Investment securities
— available-for-sale — — 5,132 14,716 126,386 221,832 174,076 542,142
— held-to-maturity — — 29,117 59,606 126,218 122,175 78,027 415,143
— loans and receivables — — 24,763 11,368 3,948 260,085 43,746 343,910
Investment in subsidiaries and joint ventures — — — — — 421 44,659 45,080
Investments in associates — — — — — 1 44 45
Property and equipment — — — — — — 48,061 48,061
Investment property — — — — — — 461 461
Deferred income tax assets — — — — — 20,389 — 20,389
Other assets 291 2,689 1,782 6,485 9,399 558 4,633 25,837
Total assets 38,962 151,616 523,493 358,512 1,055,662 1,043,075 745,082 3,916,402
Bank of China Annual Report 2006236
(Amount in millions of Renminbi, unless otherwise stated)

III FINANCIAL RISK MANAGEMENT (Continued)
7 Liquidity risk (Continued)
Bank
As at 31 December 2005
Overdue
On
demand
Less than
1 month
Between
1–3
months
Between
4–12
months
Between
1–5 years
Over
5 years Total
Liabilities
Due to banks and other financial institutions — 124,948 — — — — — 124,948
Due to central banks — 29,481 529 20 — — — 30,030
Bank notes in circulation — 1,786 — — — — — 1,786
Certificates of deposits and placements from banks
and other financial institutions — 535 82,241 49,993 50,320 32,834 — 215,923
Derivative financial instruments and liabilities at
fair value through profit or loss — — 6,937 7,460 20,048 32,766 9,112 76,323
Due to customers — 1,323,694 301,258 292,438 815,485 274,519 1,793 3,009,187
Bonds issued — — — — — — 60,179 60,179
Other borrowings — — 1,046 816 5,361 20,840 24,101 52,164
Current tax liabilities — 13 — — 22,427 — — 22,440
Retirement benefit obligations — — 76 151 661 2,883 3,281 7,052
Deferred income tax liabilities — — — — — 23 — 23
Other liabilities — 61,151 6,366 5,238 27,494 11,722 563 112,534
Total liabilities — 1,541,608 398,453 356,116 941,796 375,587 99,029 3,712,589
Net liquidity gap 38,962 (1,389,992) 125,040 2,396 113,866 667,488 646,053 203,813
The matching and controlled mismatching of the maturities and interest rates of assets and
liabilities is fundamental to the management of the Group’s business. It is unusual for a
banks’ asset and liability exposures to be completely matched, as transactions vary in nature
and have different settlement terms. An unmatched position potentially enhances
profitability, but also increases the risk of losses.
The maturities of assets and liabilities and the ability to replace, at an acceptable cost,
interest-bearing liabilities as they mature are important factors in assessing the liquidity of
the Group and its exposure to changes in interest rates and exchange rates.
Liquidity requirements to support calls under guarantees and standby letters of credit are
considerably less than the amount of the commitment because the Group does not generally
expect the third party to draw funds under the agreement. The total outstanding contractual
amount of commitments to extend credit does not necessarily represent future cash
requirements, as many of these commitments will expire or terminate without being funded
and therefore these amounts are not included in the liquidity risk tables above.
Notes to the Financial Statements 237
III FINANCIAL RISK MANAGEMENT (Continued)
8 Insurance risk
Insurance contracts are mainly sold in Hong Kong and are mainly denominated in Hong
Kong Dollars. The risk under any one insurance contract is the possibility that the insured
event occurs and the uncertainty of the amount of the resulting claim. This risk is inherently
random and, therefore, unpredictable. The Group manages its portfolio of insurance risks
through its underwriting policies, portfolio management techniques, and claims processing.
For a portfolio of insurance contracts where the theory of probability is applied to pricing
and provisioning, the principal risk that the Group faces under its insurance contracts is that
the actual claims and benefit payments exceed the carrying amount of the insurance
liabilities. This could occur because the frequency or severity of the claims and benefits are
greater than estimated. Insurance events are random and the actual number and amount of
claims and benefits will vary from year to year from the level established using statistical
techniques.
The Group manages these risks through its underwriting strategy, adequate reinsurance
arrangements and proactive claims handling. The underwriting strategy attempts to ensure
that the underwritten risks are well diversified in terms of type and amount of risk and
industry.
Uncertainty in the estimation of future benefit payments and premium receipts for long-term
insurance contracts arises from the unpredictability of long-term changes in overall levels of
mortality. In order to assess the uncertainty due to the mortality assumption and lapse
assumption, the Group conducted mortality studies and lapse studies in order to determine
the appropriate assumptions. These studies reflect consistent results in both assumptions
with appropriate margin.
9 Fair values of financial assets and liabilities
Fair value estimates are made at a specific point in time based on relevant market
information and information about the various financial instruments. The following methods
and assumptions were used to estimate the fair value of each class of financial instrument
which were not presented on the Group’s and the Bank’s balance sheet at their fair value.
Cash and due from banks, balances with central banks, placements with banks and other
financial institutions, due to banks and other financial institutions and due to central banks
These financial assets and liabilities generally have a maturity or re-pricing of less than one
year and their carrying value approximates fair value.
Bank of China Annual Report 2006238
(Amount in millions of Renminbi, unless otherwise stated)

III FINANCIAL RISK MANAGEMENT (Continued)
9 Fair values of financial assets and liabilities (Continued)
Loans and advances to customers and investment securities classified as loans and
receivables
Loans and advances are recorded, net of the allowance for impairment losses. The fair value
of loans and advances represents the discounted amount of their estimated future cash
flows discounted at current market rates (Note IV.2).
Held-to-maturity investment securities
The fair value of held-to-maturity investment securities is based on ‘‘bid’’ market prices or
broker/dealer price quotations. Where this information is not available, fair value has been
estimated using quoted market prices for securities with similar credit, maturity and yield
characteristics.
Due to customers, certificates of deposits and placements from banks and other financial
institutions
The fair value of deposits with no stated maturity, which includes non-interest bearing
deposits, is the amount repayable on demand.
The fair value of fixed interest-bearing deposits and placements without a quoted market
price is based on discounted cash flows using interest rates for new debt issuances with
similar remaining maturities.
Bonds issued and other borrowings
The fair value of these instruments is calculated based on quoted ‘‘ask’’ market prices. For
those instruments where quoted market prices are not available, a discounted cash flow
model is used based on a current market rate appropriate for the nature of the obligation and
the remaining term to maturity.
Notes to the Financial Statements 239

III FINANCIAL RISK MANAGEMENT (Continued)
9 Fair values of financial assets and liabilities (Continued)
The following tables summarize the carrying amounts and the approximate fair values of
those financial assets and liabilities not presented on the Group’s and the Bank’s balance
sheets at their fair value.
As at 31 December 2006
Group Bank
Carrying
value
Fair
value
Carrying
value
Fair
value
Financial assets
Loans and advances to customers, net 2,337,726 2,337,710 1,971,865 1,971,846
Investment securities
— held-to-maturity 461,140 459,897 287,398 287,082
— loans and receivables 500,336 500,359 458,606 458,581
Financial liabilities
Certificates of deposit and placements from banks
and other financial institutions 146,908 146,967 146,596 146,655
Due to customers 4,091,118 4,091,513 3,358,565 3,358,960
Bonds issued 60,173 60,931 60,173 60,931
Other borrowings 63,398 57,441 46,006 40,049
As at 31 December 2005
Group Bank
Carrying
value
Fair
value
Carrying
value
Fair
value
Financial assets
Loans and advances to customers, net 2,152,112 2,152,232 1,788,742 1,788,873
Investment securities
— held-to-maturity 607,459 605,287 415,143 414,341
— loans and receivables 361,851 361,613 343,910 343,692
Financial liabilities
Certificates of deposit and placements from
banks and other financial institutions 212,626 212,689 215,923 215,988
Due to customers 3,699,464 3,700,445 3,009,187 3,010,241
Bonds issued 60,179 62,071 60,179 62,071
Other borrowings 52,164 42,547 52,164 42,547
Bank of China Annual Report 2006240
(Amount in millions of Renminbi, unless otherwise stated)

III FINANCIAL RISK MANAGEMENT (Continued)
10 Fiduciary activities
The Group provides custody, entrusted loan administration, trustee and investment
management services to third parties. Assets that are held in a fiduciary capacity are not
included in these financial statements. As at 31 December 2006 and 2005, the balances of
securities and other financial instruments held in custody accounts amounted to
approximately RMB707,953 million and RMB562,823 million, respectively; entrusted loans
amounted to approximately RMB98,046 million and RMB51,626 million, respectively; and the
balances of precious metals held in custody accounts amounted to approximately RMB3,150
million and RMB2,696 million, respectively.
IV CRITICAL ACCOUNTING ESTIMATES AND JUDGEMENTS IN APPLYINGACCOUNTING POLICIES
The Group makes estimates and assumptions that affect the reported amounts of assets and
liabilities within the next financial year. Estimates and judgments are continually evaluated and
are based on historical experience and other factors, including expectations of future events that
are believed to be reasonable under the circumstances. Areas susceptible to changes in essential
estimates and judgments, which affect the carrying value of assets and liabilities, are set out
below. It is impracticable to determine the effect of changes to either the key assumptions
discussed below or other estimation uncertainties. It is possible that actual results may be
materially different from the estimates referred to below.
1 Impairment losses on loans and advances
The Group reviews its loan portfolios to assess impairment on a periodic basis, unless
known circumstances indicate that impairment may have occurred as of an interim date. In
determining whether an impairment loss should be recorded in the income statement, the
Group makes judgments as to whether there is any observable data indicating that there is a
measurable decrease in the estimated future cash flows from a portfolio of loans and
advances before the decrease can be identified with an individual loan in that portfolio. This
evidence may include observable data indicating that there has been an adverse change in
the payment status of borrowers in a group (e.g. payment delinquency or default), or
national or local economic conditions that correlate with defaults on assets in the group.
Management uses estimates based on historical loss experience for assets with credit risk
characteristics and objective evidence of impairment similar to those in the portfolio when
estimating expected future cash flows. The methodology and assumptions used for
estimating both the amount and timing of future cash flows are reviewed regularly to
reduce any differences between loss estimates and actual loss experience.
Notes to the Financial Statements 241

IV CRITICAL ACCOUNTING ESTIMATES AND JUDGEMENTS IN APPLYINGACCOUNTING POLICIES (Continued)
2 Fair value of financial instruments
The fair values of financial instruments that are not quoted in active markets are determined
by using valuation techniques. Valuation techniques used include discounted cash flows
analysis and models. To the extent practical, models use only observable data, however
areas such as credit risk (both own and counterparty’s), volatilities and correlations require
management to make estimates. Changes in assumptions about these factors could affect
reported fair value of financial instruments. With respect to PRC government obligations
related to large-scale policy directed financing transactions, such as the one described in
Note V.18(4), fair value is determined using the stated interest rate of the related instrument.
In this regard, there are no relevant market prices or yields reflecting arm’s length
transactions of a comparable size and tenor, available.
3 Held-to-maturity investments
The Group follows the guidance of IAS 39 on classifying non-derivative financial assets with
fixed or determinable payments and fixed maturity as held-to-maturity. This classification
requires significant judgment. In making this judgment, the Group evaluates its intention
and ability to hold such investments to maturity. If the Group fails to hold these investments
to maturity other than for specific circumstances defined in IAS 39 such as, selling an
insignificant amount close to maturity, it will be required to reclassify the entire portfolio of
assets as available-for-sale.
4 Employee retirement benefit obligations
As described more fully in Notes II.22 (2) and V.31, the Bank has established liabilities in
connection with benefits paid to certain retired and early retired employees. The amounts of
employee benefit expense and these liabilities are dependent on assumptions used in
calculating such amounts. These assumptions include discount rates, pension benefit
inflation rates, medical benefit inflation rates, and other factors. Actual results that differ
from the assumptions are recognized immediately and, therefore, affect recognized expense
in the year in which such differences arise. While management believes that its assumptions
are appropriate, differences in actual experience or changes in assumptions may affect the
Bank’s expense related to its employee retirement benefit obligations.
Bank of China Annual Report 2006242
(Amount in millions of Renminbi, unless otherwise stated)

IV CRITICAL ACCOUNTING ESTIMATES AND JUDGEMENTS IN APPLYINGACCOUNTING POLICIES (Continued)
5 Income taxes
The Group is subject to income taxes in numerous jurisdictions; principally, however in the
Chinese Mainland and Hong Kong. Significant estimates are required in determining the
provision for income taxes. There are many transactions and calculations for which the
ultimate tax determination is uncertain during the ordinary course of business. The Group
recognizes liabilities for anticipated tax audit issues based on estimates of whether
additional taxes will be due. In particular, the deductibility of certain items in the Chinese
Mainland is subject to government approval. Where the final tax outcome of these matters is
different from the amounts that were initially recorded, such differences will impact the
income tax and deferred income tax provisions in the period during which such a
determination is made.
V NOTES TO THE FINANCIAL STATEMENTS
1 Segment information
The Group’s businesses operate in three principal geographical areas: the Chinese Mainland,
Hong Kong and Macau, and other overseas locations. Significant other overseas locations
include New York, London, Singapore and Tokyo. Within Hong Kong and Macau, BOCHK
Holdings and its intermediate holding companies, collectively referred to as BOC Hong Kong
Group, account for the majority of the Group’s overseas operating activities.
The geographical analysis of revenues, segment results, segment assets, segment liabilities
and capital expenditure reflects the process through which the Group’s operating activities
are managed. In accordance with the Group’s organizational structure and its internal
financial reporting process, the Group has determined that geographical segments should
be presented as its primary segment.
Interest and fee income, total assets, total liabilities, credit commitments and capital
expenditure have generally been based on the country in which the branch or subsidiary is
located.
Notes to the Financial Statements 243

V NOTES TO THE FINANCIAL STATEMENTS (Continued)
1 Segment information (Continued)
As at and for the year ended 31 December 2006
Hong Kong & Macau
Chinese
Mainland
BOC
Hong Kong
Group(1) Others Sub-total
Other
overseas
locations Elimination Total
Interest income 167,024 41,061 4,870 45,931 7,563 (5,184) 215,334
Interest expense (65,575) (24,668) (3,158) (27,826) (5,750) 5,188 (93,963)
Net interest income 101,449 16,393 1,712 18,105 1,813 4 121,371
Fee and commission income 9,593 4,893 2,311 7,204 911 (569) 17,139
Fee and commission expense (964) (1,306) (529) (1,835) (82) 65 (2,816)
Net fee and commission income 8,629 3,587 1,782 5,369 829 (504) 14,323
Net trading (losses)/gains (3,927) 1,835 570 2,405 (22) — (1,544)
Net gains/(losses) on investment
securities 664 (5) 434 429 39 — 1,132
Other operating income(1) 1,695 7,317 4,044 11,361 85 (45) 13,096
Impairment (losses)/write back on
loans and advances (15,546) 1,836 1,147 2,983 221 — (12,342)
Operating expenses and others(1) (50,357) (13,431) (3,520) (16,951) (1,483) 60 (68,731)
Operating profit 42,607 17,532 6,169 23,701 1,482 (485) 67,305
Share of results of associates and
joint ventures — 4 683 687 — (55) 632
Profit before income tax 42,607 17,536 6,852 24,388 1,482 (540) 67,937
Income tax expense (16,138) (2,902) (533) (3,435) (290) 190 (19,673)
Profit for the year 26,469 14,634 6,319 20,953 1,192 (350) 48,264
Bank of China Annual Report 2006244
(Amount in millions of Renminbi, unless otherwise stated)
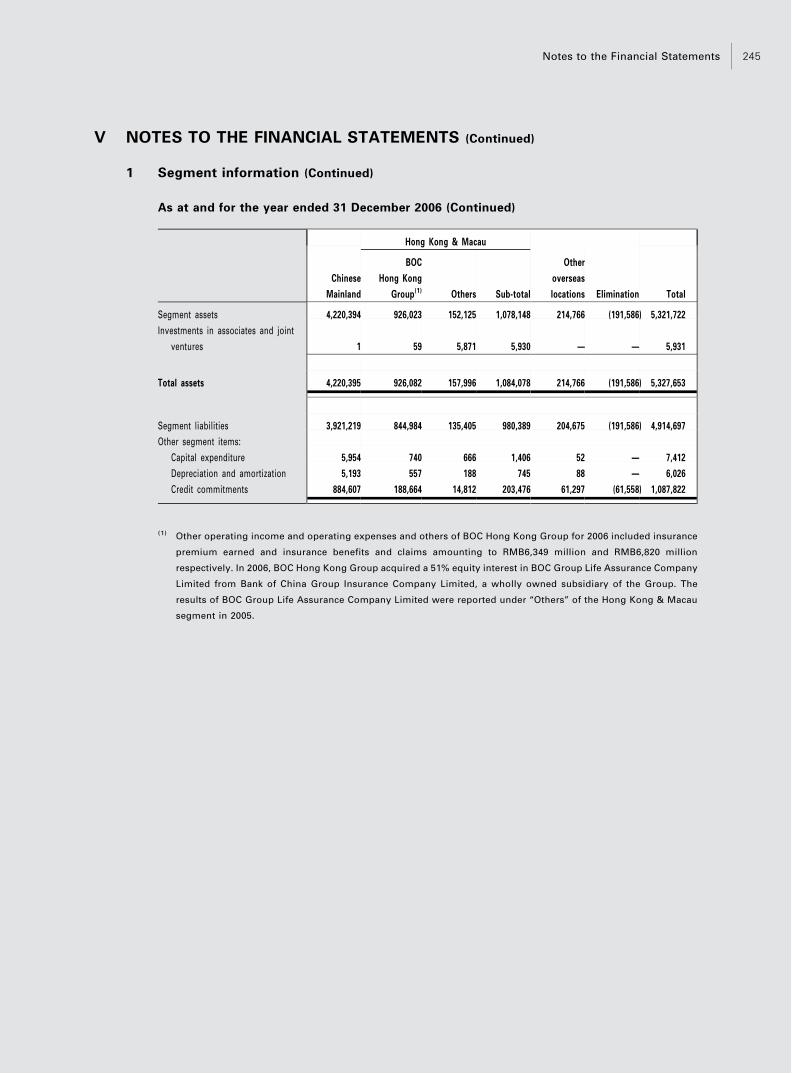
V NOTES TO THE FINANCIAL STATEMENTS (Continued)
1 Segment information (Continued)
As at and for the year ended 31 December 2006 (Continued)
Hong Kong & Macau
Chinese
Mainland
BOC
Hong Kong
Group(1) Others Sub-total
Other
overseas
locations Elimination Total
Segment assets 4,220,394 926,023 152,125 1,078,148 214,766 (191,586) 5,321,722
Investments in associates and joint
ventures 1 59 5,871 5,930 — — 5,931
Total assets 4,220,395 926,082 157,996 1,084,078 214,766 (191,586) 5,327,653
Segment liabilities 3,921,219 844,984 135,405 980,389 204,675 (191,586) 4,914,697
Other segment items:
Capital expenditure 5,954 740 666 1,406 52 — 7,412
Depreciation and amortization 5,193 557 188 745 88 — 6,026
Credit commitments 884,607 188,664 14,812 203,476 61,297 (61,558) 1,087,822
(1) Other operating income and operating expenses and others of BOC Hong Kong Group for 2006 included insurance
premium earned and insurance benefits and claims amounting to RMB6,349 million and RMB6,820 million
respectively. In 2006, BOC Hong Kong Group acquired a 51% equity interest in BOC Group Life Assurance Company
Limited from Bank of China Group Insurance Company Limited, a wholly owned subsidiary of the Group. The
results of BOC Group Life Assurance Company Limited were reported under ‘‘Others’’ of the Hong Kong & Macau
segment in 2005.
Notes to the Financial Statements 245
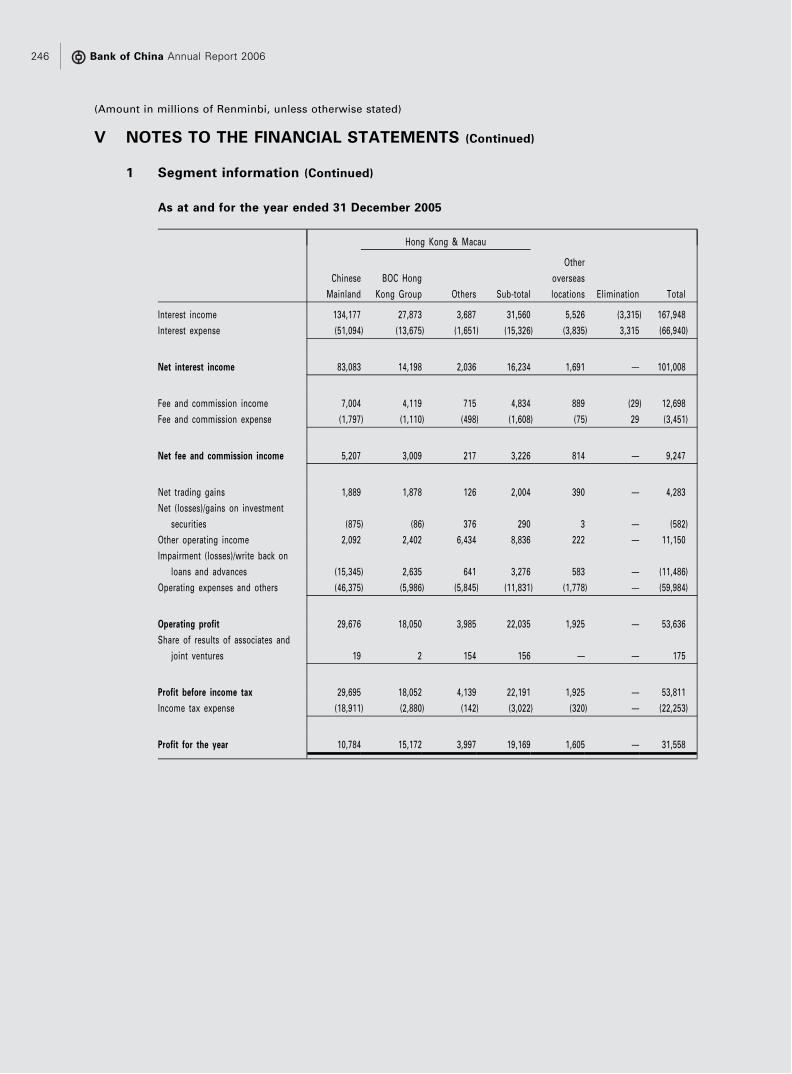
V NOTES TO THE FINANCIAL STATEMENTS (Continued)
1 Segment information (Continued)
As at and for the year ended 31 December 2005
Hong Kong & Macau
Chinese
Mainland
BOC Hong
Kong Group Others Sub-total
Other
overseas
locations Elimination Total
Interest income 134,177 27,873 3,687 31,560 5,526 (3,315) 167,948
Interest expense (51,094) (13,675) (1,651) (15,326) (3,835) 3,315 (66,940)
Net interest income 83,083 14,198 2,036 16,234 1,691 — 101,008
Fee and commission income 7,004 4,119 715 4,834 889 (29) 12,698
Fee and commission expense (1,797) (1,110) (498) (1,608) (75) 29 (3,451)
Net fee and commission income 5,207 3,009 217 3,226 814 — 9,247
Net trading gains 1,889 1,878 126 2,004 390 — 4,283
Net (losses)/gains on investment
securities (875) (86) 376 290 3 — (582)
Other operating income 2,092 2,402 6,434 8,836 222 — 11,150
Impairment (losses)/write back on
loans and advances (15,345) 2,635 641 3,276 583 — (11,486)
Operating expenses and others (46,375) (5,986) (5,845) (11,831) (1,778) — (59,984)
Operating profit 29,676 18,050 3,985 22,035 1,925 — 53,636
Share of results of associates and
joint ventures 19 2 154 156 — — 175
Profit before income tax 29,695 18,052 4,139 22,191 1,925 — 53,811
Income tax expense (18,911) (2,880) (142) (3,022) (320) — (22,253)
Profit for the year 10,784 15,172 3,997 19,169 1,605 — 31,558
Bank of China Annual Report 2006246
(Amount in millions of Renminbi, unless otherwise stated)

V NOTES TO THE FINANCIAL STATEMENTS (Continued)
1 Segment information (Continued)
As at and for the year ended 31 December 2005 (Continued)
Hong Kong & Macau
Chinese
Mainland
BOC Hong
Kong Group Others Sub-total
Other
overseas
locations Elimination Total
Segment assets 3,736,929 848,767 116,045 964,812 186,995 (153,749) 4,734,987
Investments in associates and joint
ventures 1 64 4,996 5,060 — — 5,061
Total assets 3,736,930 848,831 121,041 969,872 186,995 (153,749) 4,740,048
Segment liabilities 3,586,428 770,166 102,829 872,995 178,855 (153,749) 4,484,529
Other segment items:
Capital expenditure 5,379 592 68 660 67 — 6,106
Depreciation and amortization 5,528 543 127 670 116 — 6,314
Credit commitments 699,066 168,203 14,131 182,334 52,434 (38,072) 895,762
Business segments comprise the Group’s secondary segment. The Group provides services
through six main business segments: corporate banking, personal banking, treasury
operations, investment banking, insurance and other operations. Segment revenue,
segment results, segment assets and capital expenditure presented in business segments
include items directly attributable to a segment as well as those that can be allocated on a
reasonable basis. Funding is provided to and from individual business segments through
treasury operations as part of the asset and liability management process. The pricing of
these transactions is based on management’s assessment of its average cost of funding and
interest bearing assets and liabilities. The transactions are eliminated on consolidation.
Notes to the Financial Statements 247

V NOTES TO THE FINANCIAL STATEMENTS (Continued)
1 Segment information (Continued)
Corporate banking — providing services to corporate customers including current accounts,
deposits, overdrafts, lending, trade related products and other credit facilities, custody,
foreign currency and derivative products.
Personal banking — providing services to retail customers including current accounts,
savings, deposits, investment savings products, credit and debit cards, consumer loans and
mortgages and wealth management.
Treasury operations — consisting of foreign exchange transactions, customer-based interest
rate and foreign exchange derivative transactions, money market transactions, proprietary
trading and asset-liability management. The results of this segment include the inter-
segment funding income and expenses, resulting from interest bearing assets and liabilities;
and foreign currency translation gains and losses.
Investment banking — consisting of debt and equity underwriting and financial advisory,
sales and trading of securities, stock brokerage, investment research and asset management
services, and private equity investment services.
Insurance — underwriting of general and life insurance business and insurance agency
services.
Other operations of the Group comprise investment holding and other miscellaneous
activities, none of which constitutes a separately reportable segment or can be allocated on a
reasonable basis.
Bank of China Annual Report 2006248
(Amount in millions of Renminbi, unless otherwise stated)

V NOTES TO THE FINANCIAL STATEMENTS (Continued)
1 Segment information (Continued)
As at and for the year ended 31 December 2006
Corporate
banking
Personal
banking
Treasury
operations
Investment
banking Insurance Others Elimination Total
Interest income 96,920 88,291 84,521 679 594 536 (56,207) 215,334
Interest expenses (41,111) (51,877) (54,661) (543) (19) (1,963) 56,211 (93,963)
Net interest income/(expense) 55,809 36,414 29,860 136 575 (1,427) 4 121,371
Fee and commission income 7,039 7,774 930 2,039 3 385 (1,031) 17,139
Fee and commission expense (365) (1,537) (171) (396) (546) (270) 469 (2,816)
Net fee and commission income/
(expense) 6,674 6,237 759 1,643 (543) 115 (562) 14,323
Net trading gains/(losses) 4,105 2,264 (8,810) 310 546 40 1 (1,544)
Net gains/(losses) on investment
securities — — 695 — — 437 — 1,132
Other operating income* 136 396 32 149 7,968 5,700 (1,285) 13,096
Impairment losses on loans and
advances (11,542) (794) — (6) — — — (12,342)
Operating expenses and others* (22,904) (27,121) (8,818) (1,177) (7,965) (2,096) 1,350 (68,731)
Operating profit 32,278 17,396 13,718 1,055 581 2,769 (492) 67,305
Share of results of associates and
joint ventures — — — 238 2 440 (48) 632
Profit before income tax 32,278 17,396 13,718 1,293 583 3,209 (540) 67,937
Income tax expense (19,673)
Profit for the year 48,264
Segment assets 1,795,152 687,553 2,725,362 22,755 19,933 108,722 (37,755) 5,321,722
Investments in associates and joint
ventures — — — 911 244 4,844 (68) 5,931
Total assets 1,795,152 687,553 2,725,362 23,666 20,177 113,566 (37,823) 5,327,653
Capital expenditure 1,542 2,744 105 24 19 2,978 — 7,412
* Other operating income includes insurance premium income earned and operating expenses and others include
insurance benefits and claims.
Notes to the Financial Statements 249
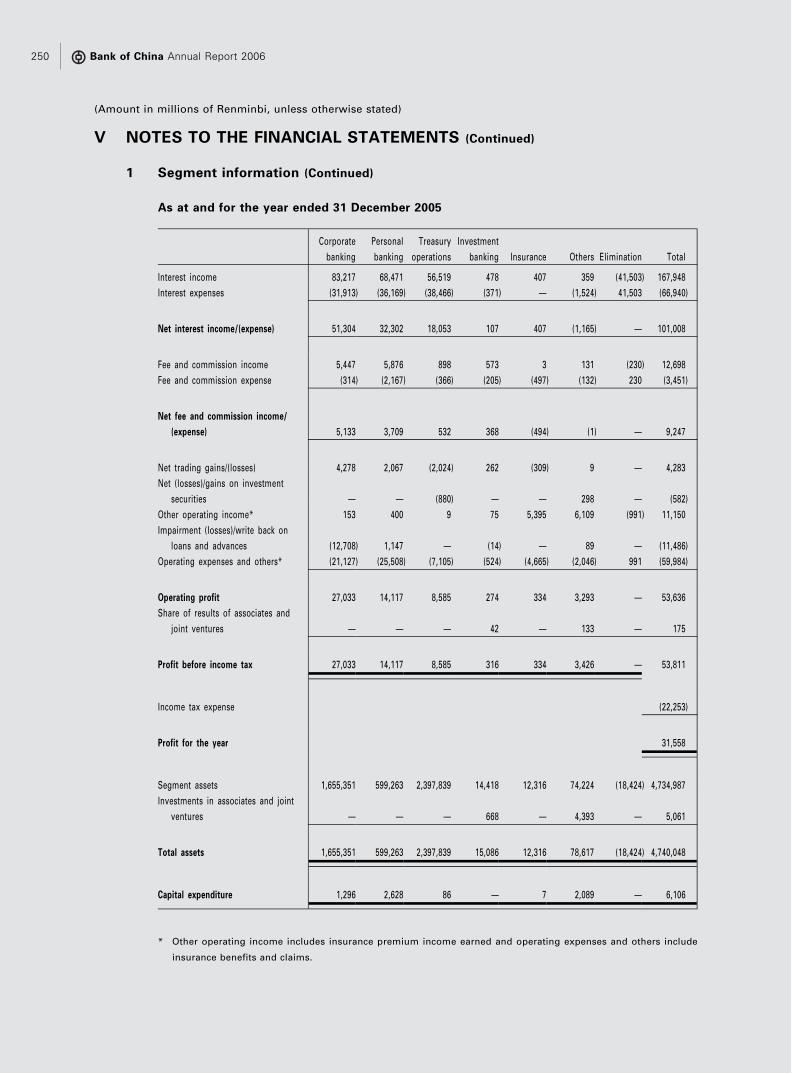
V NOTES TO THE FINANCIAL STATEMENTS (Continued)
1 Segment information (Continued)
As at and for the year ended 31 December 2005
Corporate
banking
Personal
banking
Treasury
operations
Investment
banking Insurance Others Elimination Total
Interest income 83,217 68,471 56,519 478 407 359 (41,503) 167,948
Interest expenses (31,913) (36,169) (38,466) (371) — (1,524) 41,503 (66,940)
Net interest income/(expense) 51,304 32,302 18,053 107 407 (1,165) — 101,008
Fee and commission income 5,447 5,876 898 573 3 131 (230) 12,698
Fee and commission expense (314) (2,167) (366) (205) (497) (132) 230 (3,451)
Net fee and commission income/
(expense) 5,133 3,709 532 368 (494) (1) — 9,247
Net trading gains/(losses) 4,278 2,067 (2,024) 262 (309) 9 — 4,283
Net (losses)/gains on investment
securities — — (880) — — 298 — (582)
Other operating income* 153 400 9 75 5,395 6,109 (991) 11,150
Impairment (losses)/write back on
loans and advances (12,708) 1,147 — (14) — 89 — (11,486)
Operating expenses and others* (21,127) (25,508) (7,105) (524) (4,665) (2,046) 991 (59,984)
Operating profit 27,033 14,117 8,585 274 334 3,293 — 53,636
Share of results of associates and
joint ventures — — — 42 — 133 — 175
Profit before income tax 27,033 14,117 8,585 316 334 3,426 — 53,811
Income tax expense (22,253)
Profit for the year 31,558
Segment assets 1,655,351 599,263 2,397,839 14,418 12,316 74,224 (18,424) 4,734,987
Investments in associates and joint
ventures — — — 668 — 4,393 — 5,061
Total assets 1,655,351 599,263 2,397,839 15,086 12,316 78,617 (18,424) 4,740,048
Capital expenditure 1,296 2,628 86 — 7 2,089 — 6,106
* Other operating income includes insurance premium income earned and operating expenses and others include
insurance benefits and claims.
Bank of China Annual Report 2006250
(Amount in millions of Renminbi, unless otherwise stated)

V NOTES TO THE FINANCIAL STATEMENTS (Continued)
1 Segment information (Continued)
With effect from 1 January 2006, the internal funds transfer pricing mechanism of the Bank
was revised and the above tabulation of segment information is calculated on this new basis.
The new pricing mechanism is based on market deposit and lending rates, adjusted for pre-
determined margins. These margins reflect differentiation based on product features and
maturity. Previously, blended mid prices between the Bank’s average cost of funding and
average yield on interest bearing assets were used, without product or maturity
differentiation. The intent of the change is to better reflect actual market conditions and
the asset-liability management process.
The effect of the change in basis of pricing between business segments for the year ended 31
December 2005 is summarized below. Under the new basis , the net interest income of the
Treasury operation has increased as the new basis has resulted in an increase in the inter-
segment pricing margin in relation to the funding provided by Treasury operations to
Corporate and Personal banking.
Year ended 31 December 2005
Corporate
banking
Personal
banking
Treasury
operations
Investment
banking Insurance Others Total
Net interest income as reported
previously 52,215 37,008 12,436 107 407 (1,165) 101,008
Effect of change — (decrease)/increase (911) (4,706) 5,617 — — — —
Net interest income as revised 51,304 32,302 18,053 107 407 (1,165) 101,008
Operating profit as reported previously 27,944 18,823 2,968 274 334 3,293 53,636
Effect of change — (decrease)/increase (911) (4,706) 5,617 — — — —
Operating profit as revised 27,033 14,117 8,585 274 334 3,293 53,636
Profit before income tax as reported
previously 27,944 18,823 2,968 316 334 3,426 53,811
Effect of change — (decrease)/increase (911) (4,706) 5,617 — — — —
Profit before income tax as revised 27,033 14,117 8,585 316 334 3,426 53,811
Notes to the Financial Statements 251

V NOTES TO THE FINANCIAL STATEMENTS (Continued)
2 Net interest income
Year ended 31 December
2006 2005
Interest income
Loans and advances to customers 128,934 110,313
Investment securities 67,195 44,938
Due from banks and other financial institutions 19,205 12,697
Sub-total 215,334 167,948
Interest expense
Due to customers (79,939) (55,914)
Due to banks and other financial institutions (9,393) (6,512)
Other borrowed funds (4,631) (4,514)
Sub-total (93,963) (66,940)
Net interest income 121,371 101,008
Included in interest income is RMB628 million and RMB529 million related to the unwinding
of the discount on the allowance for identified impaired loans for the years ended 31
December 2006 and 2005 respectively (Notes V.17).
3 Net fee and commission income
Year ended 31 December
2006 2005
Agency commissions 4,621 2,735
Settlement and clearing fees 3,848 2,941
Credit commitment fees 3,064 2,693
Bank card fees 2,937 2,340
Custodian and other fiduciary service fees 531 483
Others 2,138 1,506
Fee and commission income 17,139 12,698
Fee and commission expense (2,816) (3,451)
Net fee and commission income 14,323 9,247
Bank of China Annual Report 2006252
(Amount in millions of Renminbi, unless otherwise stated)
V NOTES TO THE FINANCIAL STATEMENTS (Continued)
4 Net trading (losses)/gains
Year ended 31 December
2006 2005
Net (losses)/gains from foreign exchange and foreign exchange
products(1) (2,290) 2,226
Net (losses)/gains from precious metal transactions (68) 150
Net gains from interest rate instruments 492 1,753
Net gains from trading equity securities 324 130
Others (2) 24
(1,544) 4,283
(1) The net (losses)/gains from foreign exchange and foreign exchange products include spread income in respect
of the Group’s operations in foreign exchange transactions business, realised and unrealised gains/losses of
foreign exchange derivatives, and exchange differences arising from the retranslation of foreign currency
denominated monetary assets and liabilities.
In connection with the retranslation of its foreign currency denominated monetary assets and liabilities, the
Group recognised losses of approximately RMB14.2 billion (2005 : RMB8.5 billion). These foreign currency
translation losses mainly resulted from an increase in the Group’s on balance sheet USD exposure and further
appreciation of RMB against USD during 2006. These losses were partially offset by the change in fair value
gains of the Huijin option RMB1.9 billion (2005: RMB3.2 billion), the USD/RMB swaps of RMB2.2 billion (2005:
RMB0.01 billion), and a gain of RMB0.3 billion (2005: RMB0.6 billion) arising from other foreign exchange
related products (Note III.5). While the net changes in fair value of the USD/RMB swaps above include the swap
funding costs borne by the Bank, the related interest on the higher yielding financial assets denominated in USD
earned by the Bank is reported in the Interest income.
5 Net gains/(losses) on investment securities
Year ended 31 December
2006 2005
Derecognition of available-for-sale securities 1,178 (606)
(Provision)/write back for impairment losses (46) 24
1,132 (582)
The net gains on derecognition of available-for-sale securities for the year ended 31
December 2006 include a gain of RMB1,309 million arising from the disposal of the Group’s
equity interest in a state owned enterprise to the parent company of this enterprise. Such
interest was previously acquired by the Group through a debt restructuring.
Notes to the Financial Statements 253

V NOTES TO THE FINANCIAL STATEMENTS (Continued)
6 Other operating income
Year ended 31 December
2006 2005
Insurance premiums
— Long term insurance contracts 6,349 3,807
— General insurance contracts 1,359 1,430
Gains on disposal of subsidiaries and associates 789 320
Gains on disposal of property and equipment and other assets 717 870
Changes in fair value of investment properties 595 1,697
Dividend income 186 194
Others 3,101 2,832
Total 13,096 11,150
7 Operating expenses and others
Year ended 31 December
2006 2005
Staff costs (Note V.8) 30,896 27,106
General operating and administrative expenses(1) 14,603 13,251
Depreciation and amortization 6,026 6,314
Business and other taxes 6,462 5,680
Insurance benefits and claims
— Long term insurance contracts 6,820 3,497
— General insurance contracts 664 656
Operating lease rentals 1,775 1,550
Impairment (write back)/losses on other assets (171) 433
Losses on disposal of property and equipment 148 205
Provision for litigation losses (Note V.34) 897 712
Other expenses 611 580
Total 68,731 59,984
(1) Included in the general operating and administrative expenses are auditors’ remuneration paid to
PricewaterhouseCoopers of RMB183 million (2005: RMB154 million) for the year ended 31 December 2006.
Bank of China Annual Report 2006254
(Amount in millions of Renminbi, unless otherwise stated)
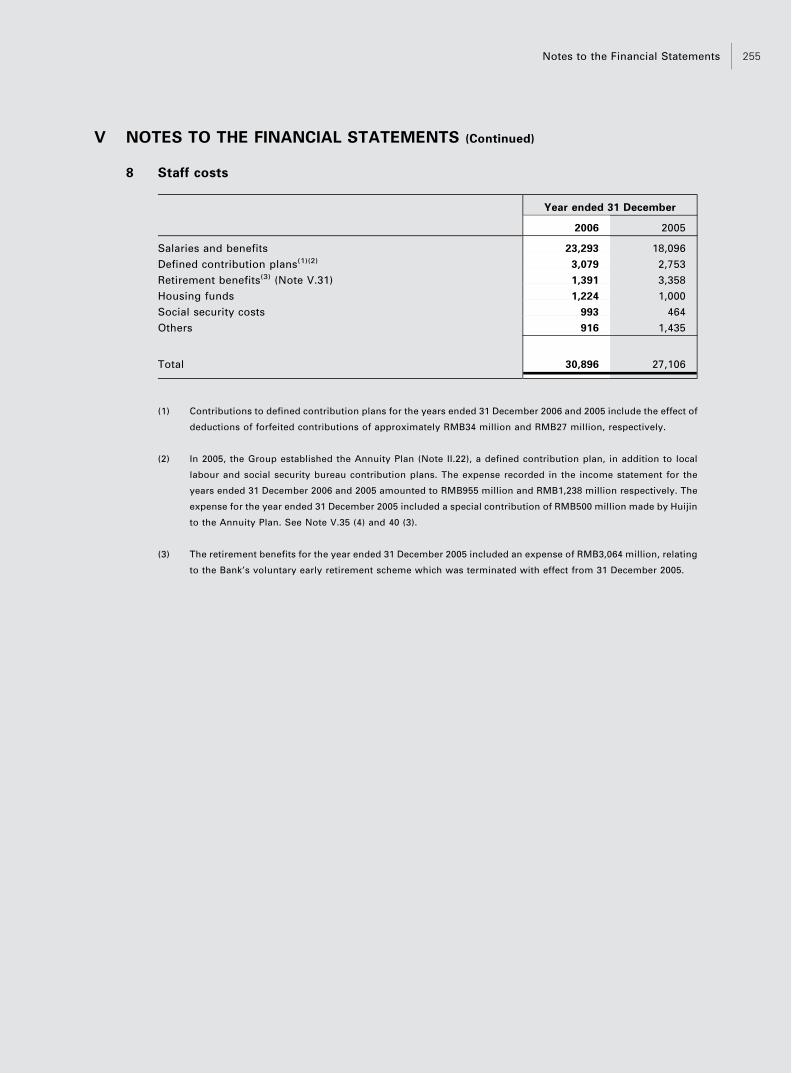
V NOTES TO THE FINANCIAL STATEMENTS (Continued)
8 Staff costs
Year ended 31 December
2006 2005
Salaries and benefits 23,293 18,096
Defined contribution plans(1)(2) 3,079 2,753
Retirement benefits(3) (Note V.31) 1,391 3,358
Housing funds 1,224 1,000
Social security costs 993 464
Others 916 1,435
Total 30,896 27,106
(1) Contributions to defined contribution plans for the years ended 31 December 2006 and 2005 include the effect of
deductions of forfeited contributions of approximately RMB34 million and RMB27 million, respectively.
(2) In 2005, the Group established the Annuity Plan (Note II.22), a defined contribution plan, in addition to local
labour and social security bureau contribution plans. The expense recorded in the income statement for the
years ended 31 December 2006 and 2005 amounted to RMB955 million and RMB1,238 million respectively. The
expense for the year ended 31 December 2005 included a special contribution of RMB500 million made by Huijin
to the Annuity Plan. See Note V.35 (4) and 40 (3).
(3) The retirement benefits for the year ended 31 December 2005 included an expense of RMB3,064 million, relating
to the Bank’s voluntary early retirement scheme which was terminated with effect from 31 December 2005.
Notes to the Financial Statements 255
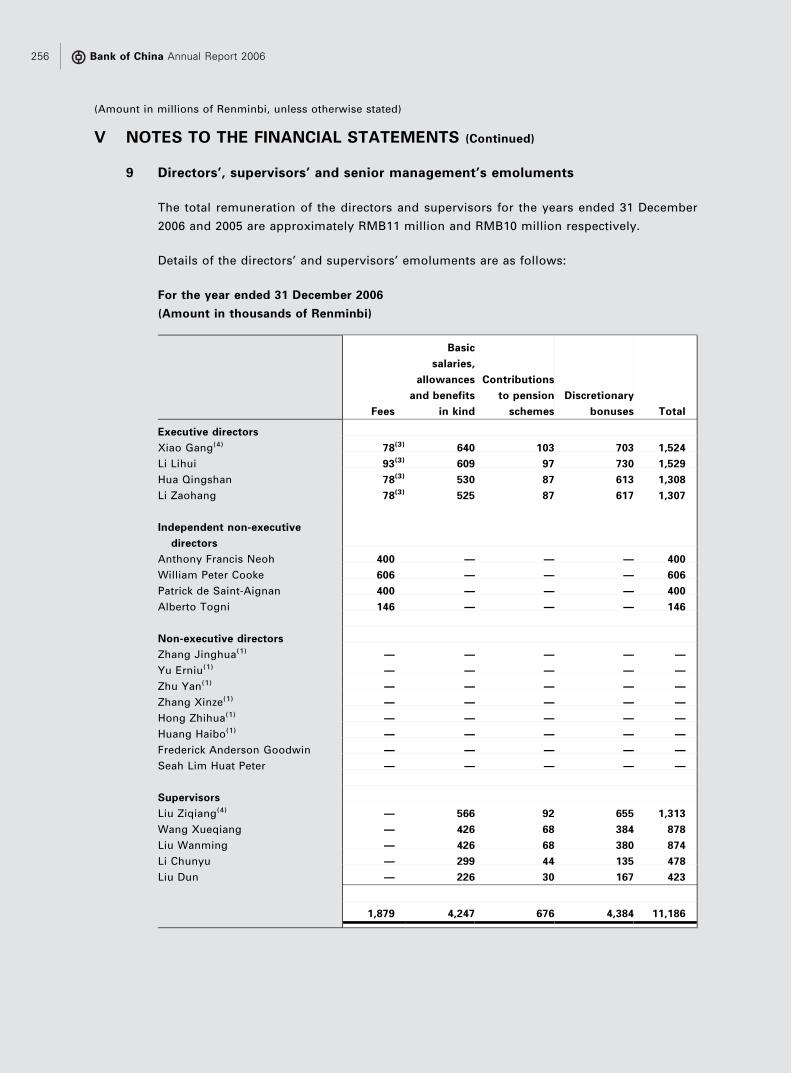
V NOTES TO THE FINANCIAL STATEMENTS (Continued)
9 Directors’, supervisors’ and senior management’s emoluments
The total remuneration of the directors and supervisors for the years ended 31 December
2006 and 2005 are approximately RMB11 million and RMB10 million respectively.
Details of the directors’ and supervisors’ emoluments are as follows:
For the year ended 31 December 2006
(Amount in thousands of Renminbi)
Fees
Basic
salaries,
allowances
and benefits
in kind
Contributions
to pension
schemes
Discretionary
bonuses Total
Executive directors
Xiao Gang(4) 78(3) 640 103 703 1,524
Li Lihui 93(3) 609 97 730 1,529
Hua Qingshan 78(3) 530 87 613 1,308
Li Zaohang 78(3) 525 87 617 1,307
Independent non-executive
directors
Anthony Francis Neoh 400 — — — 400
William Peter Cooke 606 — — — 606
Patrick de Saint-Aignan 400 — — — 400
Alberto Togni 146 — — — 146
Non-executive directors
Zhang Jinghua(1) — — — — —
Yu Erniu(1) — — — — —
Zhu Yan(1) — — — — —
Zhang Xinze(1) — — — — —
Hong Zhihua(1) — — — — —
Huang Haibo(1) — — — — —
Frederick Anderson Goodwin — — — — —
Seah Lim Huat Peter — — — — —
Supervisors
Liu Ziqiang(4) — 566 92 655 1,313
Wang Xueqiang — 426 68 384 878
Liu Wanming — 426 68 380 874
Li Chunyu — 299 44 135 478
Liu Dun — 226 30 167 423
1,879 4,247 676 4,384 11,186
Bank of China Annual Report 2006256
(Amount in millions of Renminbi, unless otherwise stated)
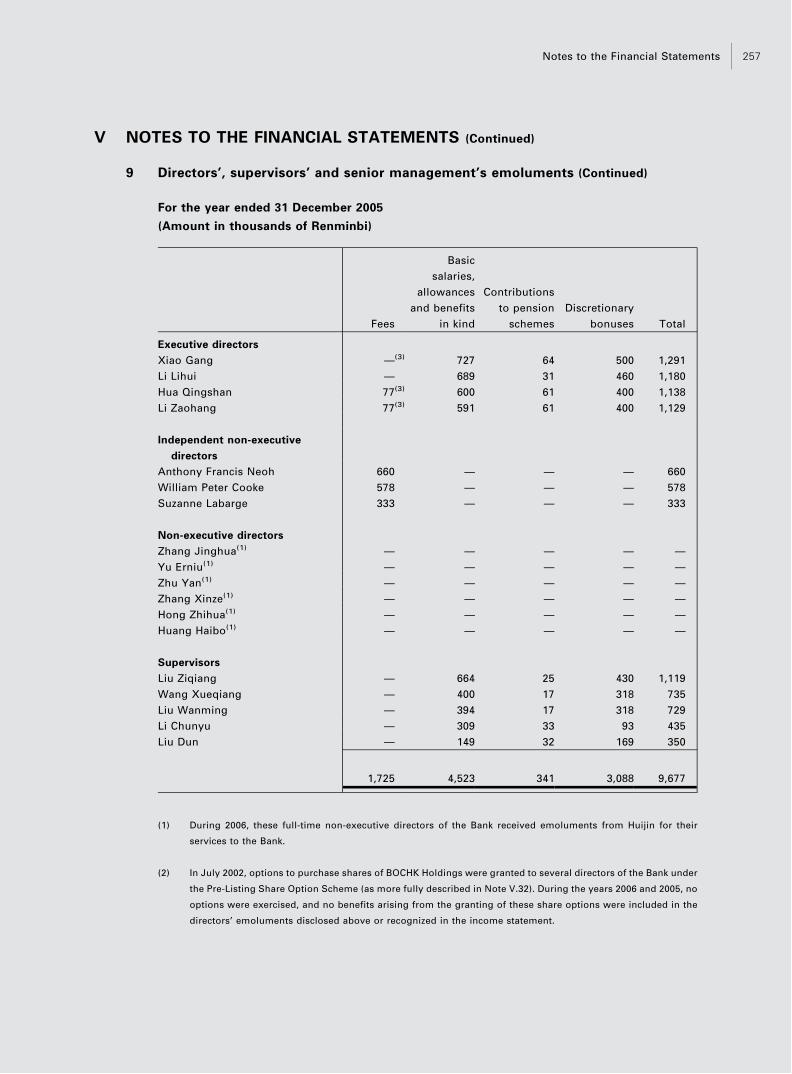
V NOTES TO THE FINANCIAL STATEMENTS (Continued)
9 Directors’, supervisors’ and senior management’s emoluments (Continued)
For the year ended 31 December 2005
(Amount in thousands of Renminbi)
Fees
Basic
salaries,
allowances
and benefits
in kind
Contributions
to pension
schemes
Discretionary
bonuses Total
Executive directors
Xiao Gang —(3) 727 64 500 1,291
Li Lihui — 689 31 460 1,180
Hua Qingshan 77(3) 600 61 400 1,138
Li Zaohang 77(3) 591 61 400 1,129
Independent non-executive
directors
Anthony Francis Neoh 660 — — — 660
William Peter Cooke 578 — — — 578
Suzanne Labarge 333 — — — 333
Non-executive directors
Zhang Jinghua(1) — — — — —
Yu Erniu(1) — — — — —
Zhu Yan(1) — — — — —
Zhang Xinze(1) — — — — —
Hong Zhihua(1) — — — — —
Huang Haibo(1) — — — — —
Supervisors
Liu Ziqiang — 664 25 430 1,119
Wang Xueqiang — 400 17 318 735
Liu Wanming — 394 17 318 729
Li Chunyu — 309 33 93 435
Liu Dun — 149 32 169 350
1,725 4,523 341 3,088 9,677
(1) During 2006, these full-time non-executive directors of the Bank received emoluments from Huijin for their
services to the Bank.
(2) In July 2002, options to purchase shares of BOCHK Holdings were granted to several directors of the Bank under
the Pre-Listing Share Option Scheme (as more fully described in Note V.32). During the years 2006 and 2005, no
options were exercised, and no benefits arising from the granting of these share options were included in the
directors’ emoluments disclosed above or recognized in the income statement.
Notes to the Financial Statements 257
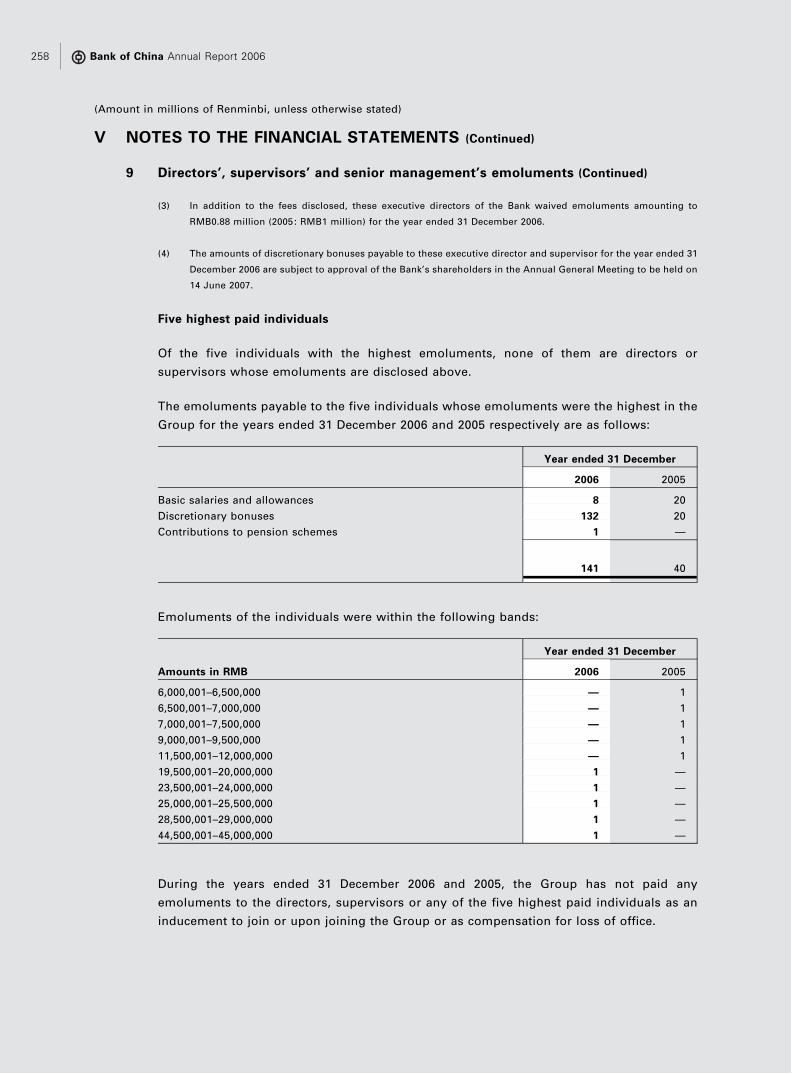
V NOTES TO THE FINANCIAL STATEMENTS (Continued)
9 Directors’, supervisors’ and senior management’s emoluments (Continued)
(3) In addition to the fees disclosed, these executive directors of the Bank waived emoluments amounting to
RMB0.88 million (2005 : RMB1 million) for the year ended 31 December 2006.
(4) The amounts of discretionary bonuses payable to these executive director and supervisor for the year ended 31
December 2006 are subject to approval of the Bank’s shareholders in the Annual General Meeting to be held on
14 June 2007.
Five highest paid individuals
Of the five individuals with the highest emoluments, none of them are directors or
supervisors whose emoluments are disclosed above.
The emoluments payable to the five individuals whose emoluments were the highest in the
Group for the years ended 31 December 2006 and 2005 respectively are as follows:
Year ended 31 December
2006 2005
Basic salaries and allowances 8 20
Discretionary bonuses 132 20
Contributions to pension schemes 1 —
141 40
Emoluments of the individuals were within the following bands:
Year ended 31 December
Amounts in RMB 2006 2005
6,000,001–6,500,000 — 1
6,500,001–7,000,000 — 1
7,000,001–7,500,000 — 1
9,000,001–9,500,000 — 1
11,500,001–12,000,000 — 1
19,500,001–20,000,000 1 —
23,500,001–24,000,000 1 —
25,000,001–25,500,000 1 —
28,500,001–29,000,000 1 —
44,500,001–45,000,000 1 —
During the years ended 31 December 2006 and 2005, the Group has not paid any
emoluments to the directors, supervisors or any of the five highest paid individuals as an
inducement to join or upon joining the Group or as compensation for loss of office.
Bank of China Annual Report 2006258
(Amount in millions of Renminbi, unless otherwise stated)

V NOTES TO THE FINANCIAL STATEMENTS (Continued)
10 Income tax expense
Year ended 31 December
2006 2005
Current income tax
Chinese Mainland income tax 16,477 18,536
Hong Kong profits tax 2,717 2,453
Overseas taxation 570 302
19,764 21,291
Deferred income tax (Note V.33) (91) 962
19,673 22,253
The provision for Chinese Mainland income tax is calculated based on the statutory rate of
33% of the assessable income of the Bank and each of the subsidiaries established in
Chinese Mainland as determined in accordance with the relevant PRC income tax rules and
regulations for the years ended 31 December 2006 and 2005. In addition, the Bank’s Overseas
Operations are subject to supplementary PRC tax at tax rate determined by the relevant PRC
Authority.
The Group’s operations in Hong Kong are subject to Hong Kong profits tax at the rate of
17.5% on the estimated assessable income for the years ended 31 December 2006 and 2005.
Taxation on overseas profits has been calculated on the estimated assessable profit at the
rates of taxation prevailing in the countries or regions in which the Group operates.
Notes to the Financial Statements 259

V NOTES TO THE FINANCIAL STATEMENTS (Continued)
10 Income tax expense (Continued)
The tax on the Group’s profit before tax differs from the theoretical amount that would arise
using the basic domestic tax rate of the Bank as follows:
Year ended 31 December
2006 2005
Profit before income tax 67,937 53,811
Tax calculated at 33% 22,419 17,758
Effect of different tax rates in Overseas Operations (3,880) (3,713)
Supplementary tax on overseas income paid in the PRC 2,510 1,388
Prior year tax expense adjustment(1) (300) 2,376
Income not subject to tax(2) (2,402) (1,862)
Expenses not deductible for tax purposes(3) 781 5,264
Others(4) 545 1,042
Income tax expense 19,673 22,253
(1) The prior year tax expense adjustments for the year 2005 included RMB1,921 million related to the reversal in
2004 of certain provisions recorded in prior years. The relevant domestic tax authorities determined that these
reversals constituted taxable income as they related to the implementation of the Joint Stock Reform Plan.
(2) It mainly comprised the interest income from the PRC treasury bills.
(3) In 2005, non tax-deductible expenses primarily included staff salary costs in excess of the deduction limit
permitted under relevant PRC tax regulations. Following the completion of the listings of the Bank’s ordinary
shares in June 2006 on the Hong Kong Stock Exchange and Shanghai Stock Exchange, the Bank has successfully
obtained approval from the Ministry of Finance (‘‘MOF’’) and the State Administration of Taxation (‘‘SAT’’) for
deduction of its domestic staff salary costs amounting to RMB15,669 million when determining the Bank’s
taxable income for the 2006 financial year.
(4) Others primarily included non-performing loans sold in 2005 and 2006. The deferred income tax assets arising
from the associated loan loss provisions were subsequently derecognized.
Subsequent to the balance date on 16 March 2007, the National People’s Congress approved
the new PRC Enterprise Income Tax Law. The details and the Group’s preliminary
assessment of the impact of the relevant changes are discussed in Note V.43 (1).
Bank of China Annual Report 2006260
(Amount in millions of Renminbi, unless otherwise stated)

V NOTES TO THE FINANCIAL STATEMENTS (Continued)
11 Earnings per share (Basic and diluted)
Basic and diluted earnings per share for the years ended 31 December 2006 and 2005 have
been computed by dividing the profit for each year by the weighted average number of
ordinary shares in issue during the period.
The Group had no dilutive potential ordinary shares as at 31 December 2006 and 2005.
Year ended 31 December
2006 2005
Profit attributable to equity holders of the Bank 42,830 25,921
Weighted average number of ordinary shares in issue (in millions) 236,055 186,425
Basic and diluted earnings per share (in RMB) 0.18 0.14
12 Cash and due from banks
Group
As at 31 December
2006 2005
Cash 31,110 28,644
Due from banks 8,702 12,438
Total 39,812 41,082
As at 31 December 2006 and 2005, the Group’s Cash and Due from banks included in Cash
and cash equivalents amounted to RMB38,805 million and RMB40,087 million, respectively
(Note V.39).
Bank
As at 31 December
2006 2005
Cash 27,632 25,144
Due from banks 10,210 13,131
Total 37,842 38,275
Notes to the Financial Statements 261

V NOTES TO THE FINANCIAL STATEMENTS (Continued)
13 Balances with central banks
Group
As at 31 December
2006 2005
Mandatory reserves 277,855 202,030
Other deposits 101,776 114,911
Total 379,631 316,941
Bank
As at 31 December
2006 2005
Mandatory reserves 277,071 201,437
Other deposits 77,810 82,936
Total 354,881 284,373
The Group places mandatory reserve funds with the PBOC and the central banks of other
countries or regions where it has operations. As at 31 December 2006, mandatory reserve
funds placed with the PBOC were calculated at 9% (2005: 7.5%) and 4% (2005: 3%) of eligible
RMB deposits and foreign currency deposits from customers of domestic branches of the
Bank respectively. The amounts of mandatory reserve funds placed with the central banks of
other countries are determined by local jurisdiction.
These mandatory reserve funds are not available for use in the Group’s day to day
operations.
As at 31 December 2006 and 2005, the Group’s balances with central banks included in cash
and cash equivalents amounted to RMB101,776 million and 108,149 million, respectively
(Note V.39).
Bank of China Annual Report 2006262
(Amount in millions of Renminbi, unless otherwise stated)
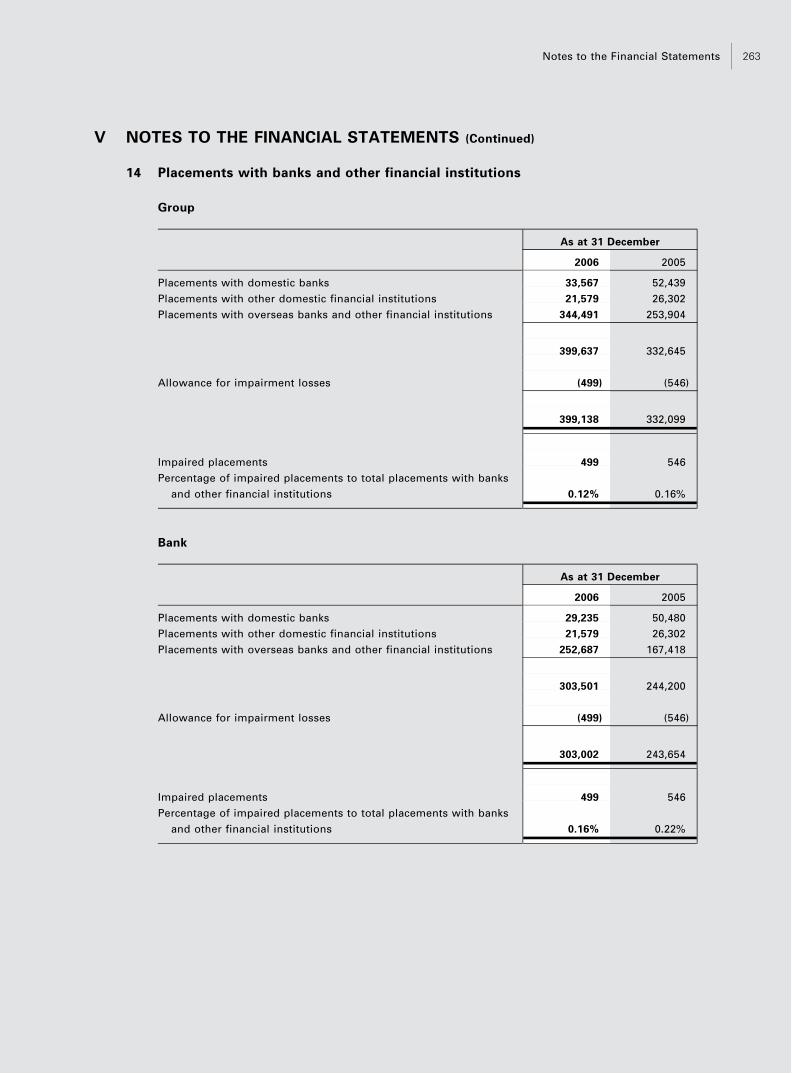
V NOTES TO THE FINANCIAL STATEMENTS (Continued)
14 Placements with banks and other financial institutions
Group
As at 31 December
2006 2005
Placements with domestic banks 33,567 52,439
Placements with other domestic financial institutions 21,579 26,302
Placements with overseas banks and other financial institutions 344,491 253,904
399,637 332,645
Allowance for impairment losses (499) (546)
399,138 332,099
Impaired placements 499 546
Percentage of impaired placements to total placements with banks
and other financial institutions 0.12% 0.16%
Bank
As at 31 December
2006 2005
Placements with domestic banks 29,235 50,480
Placements with other domestic financial institutions 21,579 26,302
Placements with overseas banks and other financial institutions 252,687 167,418
303,501 244,200
Allowance for impairment losses (499) (546)
303,002 243,654
Impaired placements 499 546
Percentage of impaired placements to total placements with banks
and other financial institutions 0.16% 0.22%
Notes to the Financial Statements 263
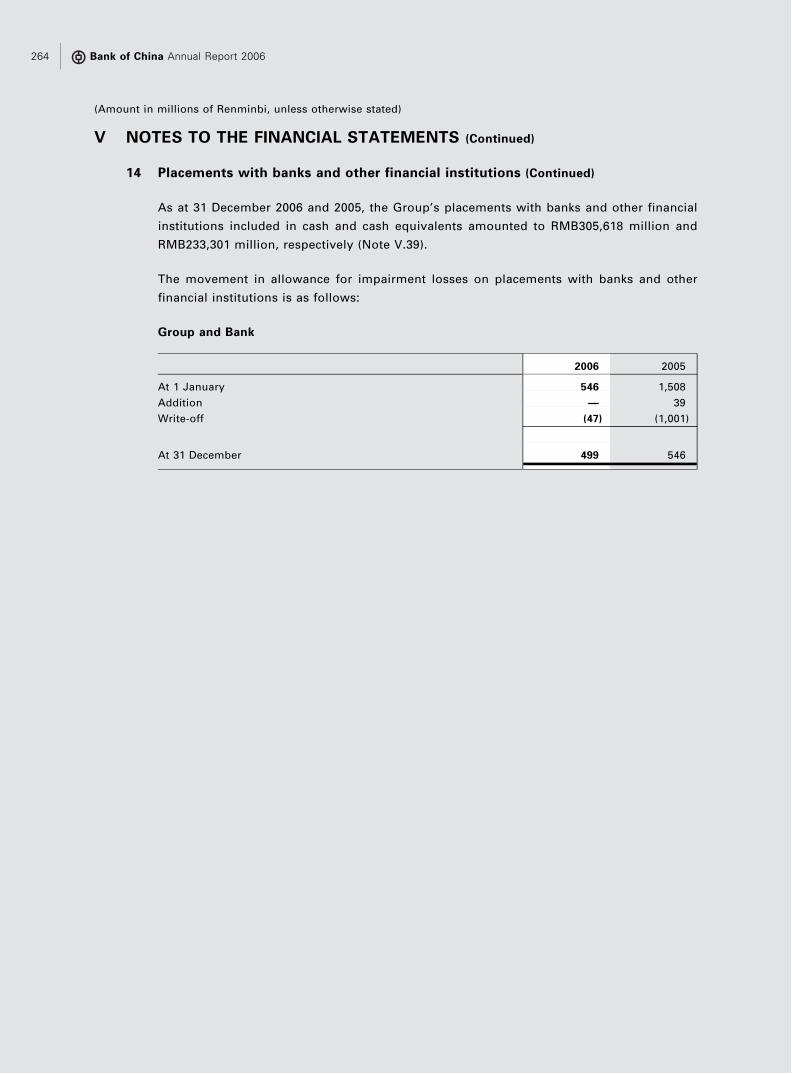
V NOTES TO THE FINANCIAL STATEMENTS (Continued)
14 Placements with banks and other financial institutions (Continued)
As at 31 December 2006 and 2005, the Group’s placements with banks and other financial
institutions included in cash and cash equivalents amounted to RMB305,618 million and
RMB233,301 million, respectively (Note V.39).
The movement in allowance for impairment losses on placements with banks and other
financial institutions is as follows:
Group and Bank
2006 2005
At 1 January 546 1,508
Addition — 39
Write-off (47) (1,001)
At 31 December 499 546
Bank of China Annual Report 2006264
(Amount in millions of Renminbi, unless otherwise stated)
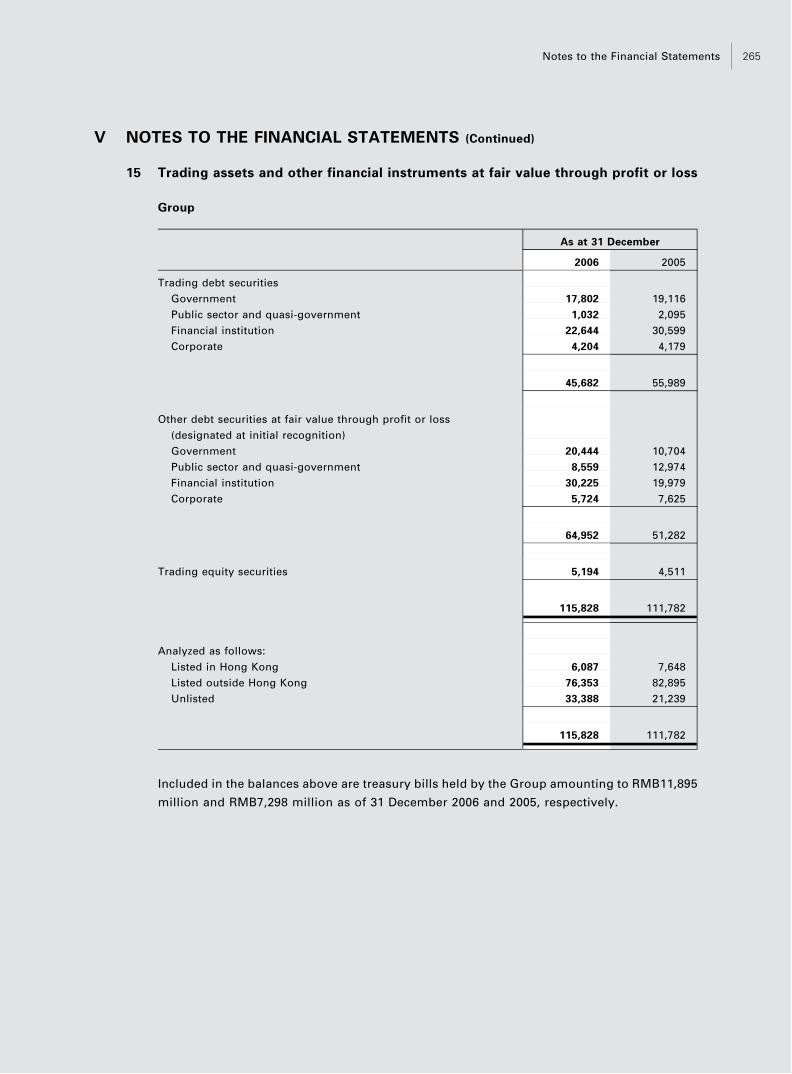
V NOTES TO THE FINANCIAL STATEMENTS (Continued)
15 Trading assets and other financial instruments at fair value through profit or loss
Group
As at 31 December
2006 2005
Trading debt securities
Government 17,802 19,116
Public sector and quasi-government 1,032 2,095
Financial institution 22,644 30,599
Corporate 4,204 4,179
45,682 55,989
Other debt securities at fair value through profit or loss
(designated at initial recognition)
Government 20,444 10,704
Public sector and quasi-government 8,559 12,974
Financial institution 30,225 19,979
Corporate 5,724 7,625
64,952 51,282
Trading equity securities 5,194 4,511
115,828 111,782
Analyzed as follows:
Listed in Hong Kong 6,087 7,648
Listed outside Hong Kong 76,353 82,895
Unlisted 33,388 21,239
115,828 111,782
Included in the balances above are treasury bills held by the Group amounting to RMB11,895
million and RMB7,298 million as of 31 December 2006 and 2005, respectively.
Notes to the Financial Statements 265

V NOTES TO THE FINANCIAL STATEMENTS (Continued)
15 Trading assets and other financial instruments at fair value through profit or loss
(Continued)
Bank
As at 31 December
2006 2005
Trading debt securities
Government 13,571 16,072
Public sector and quasi-government — 100
Financial institution 13,149 14,439
Corporate 1,031 1,149
27,751 31,760
Other debt securities at fair value through profit or loss (designated at
initial recognition)
Government 20,281 10,704
Public sector and quasi-government 7,877 12,974
Financial institution 16,913 19,666
Corporate 3,759 6,978
48,830 50,322
76,581 82,082
Analyzed as follows:
Listed in Hong Kong 2,441 3,004
Listed outside Hong Kong 63,507 71,902
Unlisted 10,633 7,176
76,581 82,082
Included in the balances above are treasury bills held by the Bank amounting to RMB8,262
million, and RMB5,621 million as of 31 December 2006 and 2005, respectively.
Included in other debt securities designated at fair value through profit or loss are certain
non-trading debt securities which are economically hedged with derivative instruments.
Gains and losses arising on the related derivative instruments are intended to substantially
offset the gains and losses arising on these securities.
Bank of China Annual Report 2006266
(Amount in millions of Renminbi, unless otherwise stated)

V NOTES TO THE FINANCIAL STATEMENTS (Continued)
16 Derivative financial instruments
The Group enters into the following foreign currency exchange rate or interest rate related
derivative financial instruments for trading, asset and liability management and on behalf of
customers:
Currency forwards represent commitments to purchase and sell foreign currency on a future
date. Foreign currency and interest rate futures are contractual obligations to receive or pay
a net amount based on changes in currency rates or interest rates or buy or sell a foreign
currency or interest rate financial instrument on a future date at an agreed price in the
financial market under the administration of the stock exchanges. Forward rate agreements
are individually negotiated interest rate futures that call for a cash settlement at a future date
for the difference between a contracted rate of interest and the current market rate, based on
a notional principal amount.
Currency and interest rate swaps are commitments to exchange one set of cash flows for
another. Swaps result in an exchange of currencies or interest rates (for example, fixed rate
for floating rate) or a combination of all these (i.e. cross-currency interest rate swaps). Except
for certain currency swap contracts, no exchange of principal takes place.
Foreign currency and interest rate options are contractual agreements under which the seller
(writer) grants the purchaser (holder) the right, but not the obligation, either to buy (a call
option) or sell (a put option) at or by a set date or during a set period, a specific amount of a
foreign currency or a financial instrument at a predetermined price. In consideration for the
assumption of foreign exchange or interest rate risk, the seller receives a premium from the
purchaser. Options may be either negotiated over-the-counter (‘‘OTC’’) between the Group
and its counterparty or exchange-traded.
The contractual/notional amounts and fair values of derivative instruments held by the
Group and the Bank are set out in the following table. The contractual/notional amounts of
financial instruments provide a basis for comparison with fair value instruments recognized
on the balance sheet but do not necessarily indicate the amounts of future cash flows
involved or the current fair value of the instruments and, therefore, do not indicate the
Group’s exposure to credit or market risks. The derivative instruments become favorable
(assets) or unfavorable (liabilities) as a result of fluctuations in market interest rates or
foreign exchange rates or equity/commodity prices relative to their terms. The aggregate fair
values of derivative financial assets and liabilities can fluctuate significantly from time to
time.
Notes to the Financial Statements 267
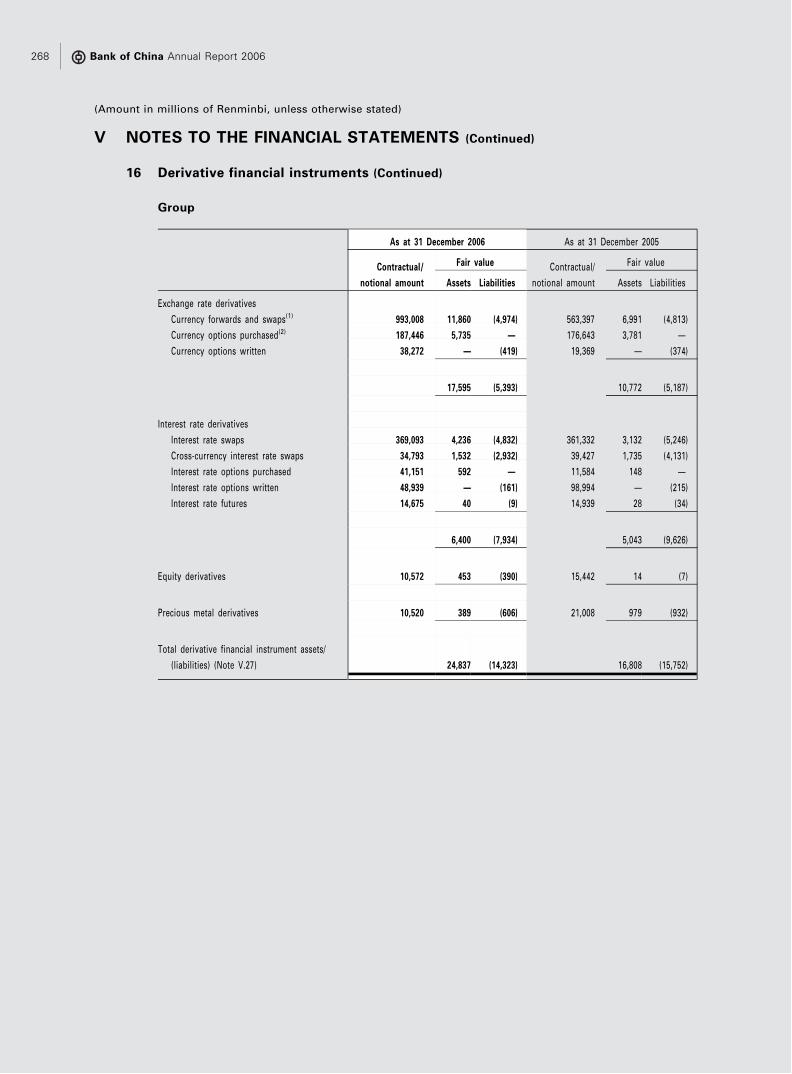
V NOTES TO THE FINANCIAL STATEMENTS (Continued)
16 Derivative financial instruments (Continued)
Group
As at 31 December 2006 As at 31 December 2005
Contractual/
notional amount
Fair value Contractual/
notional amount
Fair value
Assets Liabilities Assets Liabilities
Exchange rate derivatives
Currency forwards and swaps(1) 993,008 11,860 (4,974) 563,397 6,991 (4,813)
Currency options purchased(2) 187,446 5,735 — 176,643 3,781 —
Currency options written 38,272 — (419) 19,369 — (374)
17,595 (5,393) 10,772 (5,187)
Interest rate derivatives
Interest rate swaps 369,093 4,236 (4,832) 361,332 3,132 (5,246)
Cross-currency interest rate swaps 34,793 1,532 (2,932) 39,427 1,735 (4,131)
Interest rate options purchased 41,151 592 — 11,584 148 —
Interest rate options written 48,939 — (161) 98,994 — (215)
Interest rate futures 14,675 40 (9) 14,939 28 (34)
6,400 (7,934) 5,043 (9,626)
Equity derivatives 10,572 453 (390) 15,442 14 (7)
Precious metal derivatives 10,520 389 (606) 21,008 979 (932)
Total derivative financial instrument assets/
(liabilities) (Note V.27) 24,837 (14,323) 16,808 (15,752)
Bank of China Annual Report 2006268
(Amount in millions of Renminbi, unless otherwise stated)

V NOTES TO THE FINANCIAL STATEMENTS (Continued)
16 Derivative financial instruments (Continued)
Bank
As at 31 December 2006 As at 31 December 2005
Contractual/
notional amount
Fair value Contractual/
notional amount
Fair value
Assets Liabilities Assets Liabilities
Exchange rate derivatives
Currency forwards and swaps(1) 694,961 4,651 (2,097) 286,268 2,515 (2,391)
Currency options purchased(2) 185,956 5,724 — 173,993 3,759 —
Currency options written 35,153 — (403) 17,866 — (346)
10,375 (2,500) 6,274 (2,737)
Interest rate derivatives
Interest rate swaps 331,111 3,712 (3,930) 328,245 3,050 (4,559)
Cross-currency interest rate swaps 32,313 1,520 (2,895) 37,786 1,785 (4,062)
Interest rate options purchased 40,293 586 — 11,377 148 —
Interest rate options written 48,125 — (151) 96,950 — (180)
Interest rate futures 5,180 1 (1) 9,701 1 (4)
5,819 (6,977) 4,984 (8,805)
Precious metal derivatives 3,156 169 (166) 2,482 71 (64)
Total derivative financial instrument assets/
(liabilities) (Note V.27) 16,363 (9,643) 11,329 (11,606)
(1) Since 2005, the Bank has entered into foreign exchange swap transactions with the PBOC to manage its assets
and liabilities. Under these agreements, the PBOC sold USD to the Bank in spot transactions for RMB and agreed
to buy back the USD after one year or three years at agreed exchange and swap rates, which reflect the interest
rate differentials between USD and RMB at the respective inception date of the transactions. See Note III. 5(i).
(2) On 5 January 2005, the Bank entered into a foreign currency option agreement with Huijin whereby the Bank
acquired options to sell to Huijin USD, totaling USD18 billion, of no more than USD1,500 million at the
beginning of each calendar month during the year ending 31 December 2007 at a fixed exchange rate of USD1 to
RMB8.2769. The related option premium of RMB4,469 million is payable by the Bank to Huijin in 12 equal
monthly installments at the beginning of each calendar month during the year ending 31 December 2007. The
fair value of the Huijin option, which has taken into consideration this option premium payable, as at 31
December 2006 amounted to RMB5,180 million (2005: RMB3,231 million). See Note III.5 (i).
The tables above provide a breakdown of the contractual or notional amounts and the fair
values of the Group’s and the Bank’s derivative financial instruments outstanding at the year
end. These instruments, comprising foreign exchange and interest rate derivatives are
intended to enable the Group and the Bank and its customers to transfer, modify or reduce
their foreign exchange and interest rate risks.
Notes to the Financial Statements 269

V NOTES TO THE FINANCIAL STATEMENTS (Continued)
16 Derivative financial instruments (Continued)
The Group and the Bank primarily undertake transactions in foreign exchange and interest
rate contracts with other financial institutions. Management has established position limits
of these contracts by counterparties. Actual credit exposures and limits are regularly
monitored and controlled by management.
Credit risk weighted amounts
The credit risk weighted amounts are the amounts calculated with reference to the
guidelines issued by the CBRC and are dependent on, among other factors, the
creditworthiness of the counterparty and the maturity characteristics of each type of
contract.
Group
As at 31 December
2006 2005
Derivatives
Exchange rate contracts 4,468 3,744
Interest rate contracts 3,379 3,543
Other derivative contracts 35 45
7,882 7,332
Bank
As at 31 December
2006 2005
Derivatives
Exchange rate contracts 3,880 3,208
Interest rate contracts 3,228 3,469
7,108 6,677
Bank of China Annual Report 2006270
(Amount in millions of Renminbi, unless otherwise stated)

V NOTES TO THE FINANCIAL STATEMENTS (Continued)
16 Derivative financial instruments (Continued)
Replacement costs
Replacement costs are the costs of replacing all contracts which have a positive value when
marked to market (should the counterparty default on its obligations) and is obtained by
marking contracts to market. Replacement cost is a close approximation of the credit risk for
these contracts as of the balance sheet date.
Group
As at 31 December
2006 2005
Derivatives
Exchange rate contracts 17,595 10,772
Interest rate contracts 6,400 5,043
Other derivative contracts 842 993
24,837 16,808
Bank
As at 31 December
2006 2005
Derivatives
Exchange rate contracts 10,375 6,274
Interest rate contracts 5,819 4,984
Other derivative contracts 169 71
16,363 11,329
The credit risk weighted amounts and replacement costs stated above have not taken the
effects of netting arrangements into account.
Notes to the Financial Statements 271

V NOTES TO THE FINANCIAL STATEMENTS (Continued)
17 Loans and advances to customers, net
Group
As at 31 December
2006 2005
Corporate loans and advances 1,849,275 1,712,262
Personal loans and advances 582,744 523,003
2,432,019 2,235,265
Allowance for impairment losses (94,293) (83,153)
Loans and advances to customers, net 2,337,726 2,152,112
Bank
As at 31 December
2006 2005
Corporate loans and advances 1,616,052 1,483,933
Personal loans and advances 448,775 384,390
2,064,827 1,868,323
Allowance for impairment losses (92,962) (79,581)
Loans and advances to customers, net 1,971,865 1,788,742
As at 31 December 2006, there were no bills pledged as collateral under repurchase
agreements by the Group and Bank (2005 : RMB11,968 million). See Note V. 38(2).
Bank of China Annual Report 2006272
(Amount in millions of Renminbi, unless otherwise stated)

V NOTES TO THE FINANCIAL STATEMENTS (Continued)
17 Loans and advances to customers, net (Continued)
Group
Loans and
advances for
which
allowance is
collectively
assessed(1)
Identified impaired loans and advances(2)
Total
Identified
impaired loans
and advances as
a % of gross
total loans and
advances
for which
allowance is
collectively
assessed
for which
allowance is
individually
assessed Sub-total
At 31 December 2006
Gross loans and advances 2,328,787 21,502 81,730 103,232 2,432,019 4.2%
Allowance for impairment losses (27,712) (12,735) (53,846) (66,581) (94,293)
Net loans and advances 2,301,075 8,767 27,884 36,651 2,337,726
At 31 December 2005
Gross loans and advances 2,125,735 26,288 83,242 109,530 2,235,265 4.9%
Allowance for impairment losses (25,406) (12,009) (45,738) (57,747) (83,153)
Net loans and advances 2,100,329 14,279 37,504 51,783 2,152,112
Bank
Loans and
advances for
which
allowance is
collectively
assessed(1)
Identified impaired loans and advances(2)
Total
Identified
impaired loans
and advances as
a % of gross
total loans and
advances
for which
allowance is
collectively
assessed
for which
allowance is
individually
assessed Sub-total
At 31 December 2006
Gross loans and advances 1,963,822 20,342 80,663 101,005 2,064,827 4.9%
Allowance for impairment losses (27,043) (12,688) (53,231) (65,919) (92,962)
Net loans and advances 1,936,779 7,654 27,432 35,086 1,971,865
At 31 December 2005
Gross loans and advances 1,765,174 24,116 79,033 103,149 1,868,323 5.5%
Allowance for impairment losses (24,813) (11,644) (43,124) (54,768) (79,581)
Net loans and advances 1,740,361 12,472 35,909 48,381 1,788,742
(1) Loans and advances for which allowance is collectively assessed consist of loans and advances which have not
been identified as impaired i.e. primarily loans graded pass and special mention.
Notes to the Financial Statements 273
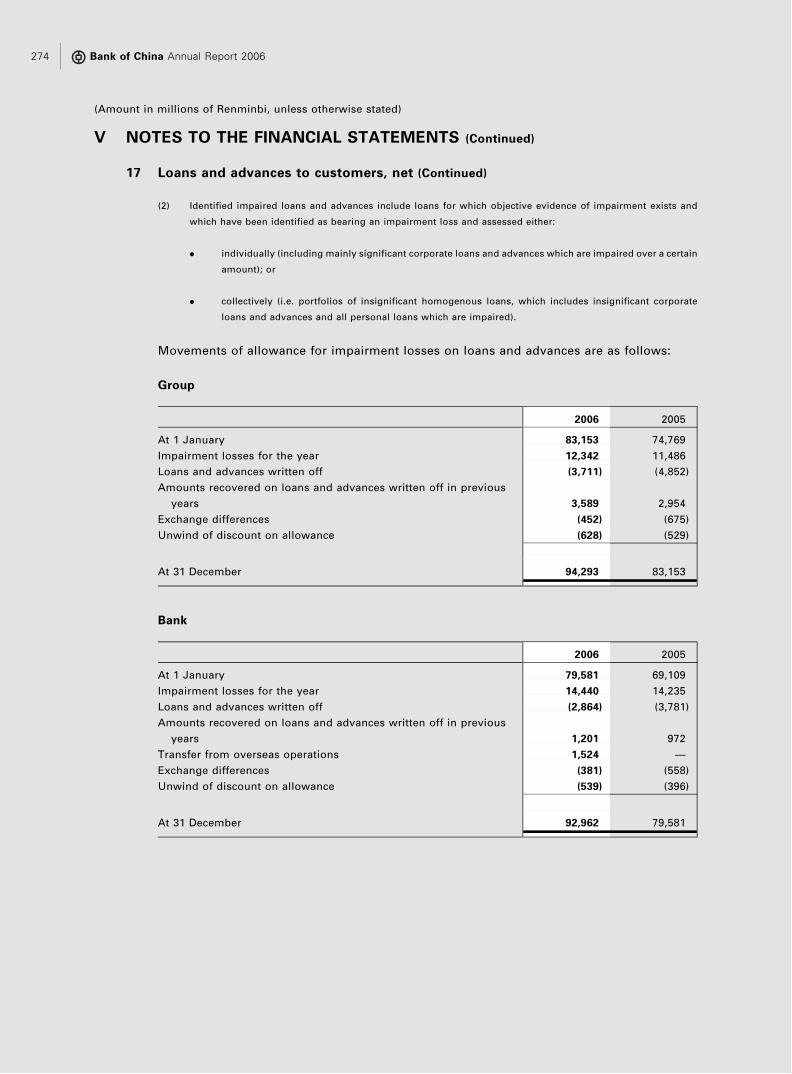
V NOTES TO THE FINANCIAL STATEMENTS (Continued)
17 Loans and advances to customers, net (Continued)
(2) Identified impaired loans and advances include loans for which objective evidence of impairment exists and
which have been identified as bearing an impairment loss and assessed either:
. individually (including mainly significant corporate loans and advances which are impaired over a certain
amount); or
. collectively (i.e. portfolios of insignificant homogenous loans, which includes insignificant corporate
loans and advances and all personal loans which are impaired).
Movements of allowance for impairment losses on loans and advances are as follows:
Group
2006 2005
At 1 January 83,153 74,769
Impairment losses for the year 12,342 11,486
Loans and advances written off (3,711) (4,852)
Amounts recovered on loans and advances written off in previous
years 3,589 2,954
Exchange differences (452) (675)
Unwind of discount on allowance (628) (529)
At 31 December 94,293 83,153
Bank
2006 2005
At 1 January 79,581 69,109
Impairment losses for the year 14,440 14,235
Loans and advances written off (2,864) (3,781)
Amounts recovered on loans and advances written off in previous
years 1,201 972
Transfer from overseas operations 1,524 —
Exchange differences (381) (558)
Unwind of discount on allowance (539) (396)
At 31 December 92,962 79,581
Bank of China Annual Report 2006274
(Amount in millions of Renminbi, unless otherwise stated)

V NOTES TO THE FINANCIAL STATEMENTS (Continued)
18 Investment securities
Group
As at 31 December
2006 2005
Debt securities available-for-sale (at fair value)
Government 297,129 229,064
Public sector and quasi-government 152,822 106,840
Financial institution 230,999 170,038
Corporate 126,358 87,068
807,308 593,010
Equity securities (at fair value) 7,870 9,211
Total securities available-for-sale 815,178 602,221
Debt securities held-to-maturity (at amortized cost):
Government 146,502 231,156
Public sector and quasi-government 97,025 135,002
Financial institution 172,666 203,724
Corporate 44,947 37,577
Total securities held-to-maturity 461,140 607,459
Debt securities classified as loans and receivables (at amortized cost):
China Orient Bond(1) 160,000 160,000
PBOC Special Bills(2) 91,612 91,530
PBOC Target Bills(3) 28,702 —
Special Purpose Treasury Bond(4) 42,500 42,500
Long term notes — Financial institution 14,545 1,545
Short term bills and notes(5)
Public sector and quasi-government 3,895 6,096
Financial institution 139,659 49,993
Corporate 6,623 —
Certificate Treasury Bonds and others 12,952 10,343
500,488 362,007
Allowance for impairment losses (152) (156)
Total securities classified as loans and receivables 500,336 361,851
Total(6), (7) 1,776,654 1,571,531
Notes to the Financial Statements 275

V NOTES TO THE FINANCIAL STATEMENTS (Continued)
18 Investment securities (Continued)
Group
As at 31 December
2006 2005
Analyzed as follows:
Securities available-for-sale
Debt securities
— Listed 430,550 344,872
— Unlisted 376,758 248,138
807,308 593,010
Equity securities
— Listed 4,350 1,757
— Unlisted 3,520 7,454
7,870 9,211
815,178 602,221
Debt securities held-to-maturity
— Listed 228,815 332,841
— Unlisted 232,325 274,618
461,140 607,459
Debt securities classified as loans and receivables
— Unlisted 500,336 361,851
Total 1,776,654 1,571,531
Listed in Hong Kong 16,561 14,223
Listed outside Hong Kong 647,154 665,247
Unlisted 1,112,939 892,061
Total(6) 1,776,654 1,571,531
Bank of China Annual Report 2006276
(Amount in millions of Renminbi, unless otherwise stated)

V NOTES TO THE FINANCIAL STATEMENTS (Continued)
18 Investment securities (Continued)
Bank
As at 31 December
2006 2005
Debt securities available-for-sale (at fair value)
Government 283,860 219,566
Public sector and quasi-government 145,929 102,200
Financial institution 195,235 146,373
Corporate 81,002 70,798
706,026 538,937
Equity securities (at fair value) 713 3,205
Total securities available-for-sale 706,739 542,142
Debt securities held-to-maturity (at amortized cost)
Government 144,292 227,718
Public sector and quasi-government 75,749 103,074
Financial institution 62,702 74,791
Corporate 4,655 9,560
Total securities held-to-maturity 287,398 415,143
Debt securities classified as loans and receivables (at amortized cost):
China Orient Bond(1) 160,000 160,000
PBOC Special Bills(2) 91,612 91,530
PBOC Target Bills(3) 28,702 —
Special Purpose Treasury Bond(4) 42,500 42,500
Long term notes — Financial institution 14,545 1,545
Short term bills and notes
Public sector and quasi-government 3,895 5,992
Financial institution 98,006 32,156
Corporate 6,546 —
Certificate Treasury Bonds and others 12,952 10,343
Sub-total 458,758 344,066
Allowance for impairment losses (152) (156)
Total securities classified as loans and receivables 458,606 343,910
Total(6), (7) 1,452,743 1,301,195
Notes to the Financial Statements 277

V NOTES TO THE FINANCIAL STATEMENTS (Continued)
18 Investment securities (Continued)
Bank
As at 31 December
2006 2005
Analyzed as follows:
Securities available-for-sale
Debt securities
— Listed 411,933 332,413
— Unlisted 294,093 206,524
706,026 538,937
Equity securities
— Listed 81 1
— Unlisted 632 3,204
713 3,205
706,739 542,142
Debt securities held-to-maturity
— Listed 199,520 296,266
— Unlisted 87,878 118,877
287,398 415,143
Debt securities classified as loans and receivables
— Unlisted 458,606 343,910
Total 1,452,743 1,301,195
Listed in Hong Kong 3,336 4,110
Listed outside Hong Kong 608,198 624,570
Unlisted 841,209 672,515
Total 1,452,743 1,301,195
Bank of China Annual Report 2006278
(Amount in millions of Renminbi, unless otherwise stated)

V NOTES TO THE FINANCIAL STATEMENTS (Continued)
18 Investment securities (Continued)
The market values of the above listed held-to-maturity securities are set out below:
Group
As at 31 December
2006 2005
Carrying
value
Market
value
Carrying
value
Market
value
Investment securities held-to-maturity
Listed in Hong Kong 4,596 4,563 5,129 5,107
Listed outside Hong Kong 224,219 225,162 327,712 329,128
Bank
As at 31 December
2006 2005
Carrying
value
Market
value
Carrying
value
Market
value
Investment securities held-to-maturity
Listed in Hong Kong 412 412 427 420
Listed outside Hong Kong 199,108 200,295 295,839 297,360
(1) The Bank transferred certain non-performing assets to China Orient Asset Management Corporation (‘‘China
Orient’’) in 1999 and 2000. On 1 July 2000, China Orient issued a ten-year bond with a par value of RMB160,000
million to the Bank as consideration. The interest rate of the bonds is 2.25% per annum. Pursuant to Caijin [2004]
No. 87 ‘‘Notice of the MOF regarding Relevant Issues relating to the Principal and Interest of Debt Securities of
Financial Asset Management Companies Held by Bank of China and China Construction Bank’’, from 1 January
2005, should China Orient fail to pay in full the interest on the debt securities or repay the principal in full
according to the contractual terms of the bond, the MOF shall provide funding support to enable China Orient to
fulfill its obligations.
(2) On 30 June 2004, the PBOC issued a Special Bill with a par value of RMB18,100 million in exchange for certain
policy-related assets of the Bank. The tenor of the bill is 3 years, with an interest rate of 1.89% per annum. The
Bank has also been appointed as an agent to collect the policy-related assets.
On 30 June 2004, the Bank sold a portfolio of non-performing loans to China Cinda Asset Management
Corporation (‘‘Cinda’’) and received consideration in the form of a Special Bill issued by the PBOC, with a par
value of RMB73,430 million. The tenor of the bill is 5 years, with an interest rate of 1.89% per annum.
On 22 June 2006, the PBOC issued special PBOC Bills amounting to RMB82 million in exchange for certain non-
performing loans, as previously approved by the State Council. The tenor of the bill is 5 years, with an interest
rate of 1.89% per annum.
Notes to the Financial Statements 279

V NOTES TO THE FINANCIAL STATEMENTS (Continued)
18 Investment securities (Continued)
Without the approval of the PBOC, the special PBOC Bills referred to above are non-transferable and may not be
used as collateral for borrowings. The PBOC has the option to settle these bills in whole or in part before their
maturity.
(3) On 16 May and 13 July 2006, the Bank invested in PBOC Bills for commercial banks, with a par value of
RMB8,000 million and RMB21,000 million, respectively. The bills have tenor of 1 year with an interest rate of
2.11% per annum.
Without the approval of the PBOC, these PBOC bills are non-transferable and may not be used as collateral for
borrowings.
(4) This represents a Special Purpose Treasury Bond issued by the MOF with a par value of RMB42,500 million
maturing on 18 August 2028. This bond was originally issued with an annual coupon interest rate of 7.2% per
annum. In accordance with Ren Da Chang Hui Zi [2004] No. 25 ‘‘Resolution of the Standing Committee of the
National People’s Congress on the Approval of the Report of the State Council on the Payment of Interest on the
Special Purpose Treasury Bond of 1998’’, the Special Purpose Treasury Bond was restructured among other
things to reduce the annual coupon interest rate to 2.25%, the rate established by the PRC Government for use in
connection with large-scale policy directed financing transactions, and reinstate cash interest payments from 1
December 2004. This restructuring was accounted for as the derecognition of the original Special Purpose
Treasury Bond yielding 7.2% and recognition of a restructured Special Purpose Treasury Bond yielding 2.25%,
with a remaining maturity equal to that of the original Special Purpose Treasury Bond.
The transactions related to the Special Purpose Treasury Bond described above were accounted for with
reference to rates determined by the PRC Government in similar transactions engaged in or directed by the PRC
Government, the sole owner of the Bank’s equity capital at the time of the transaction. As discussed in Note IV.2,
there were no relevant market prices or yields, reflecting arm’s length transactions of a comparable size and
tenor available.
(5) As at 31 December 2006 and 2005, the Group’s short term bills and notes included in cash and cash equivalents
amounted to RMB73,745 million and RMB15,575 million, respectively (Note V.39).
(6) Included in the balance as of 31 December 2006 are treasury bills held by the Group and the Bank amounting to
RMB248,292 million (2005 : RMB228,154 million) and RMB235,233 million (2005 : RMB222,625 million)
respectively.
(7) As at 31 December 2006, the Group’s and the Bank’s debt securities of RMB55,212 million (2005: RMB49,658
million) and RMB51,632 million (2005 : RMB45,106 million), respectively, were pledged as collateral to third
parties under agreements to repurchase (Note V.38 (2)).
Bank of China Annual Report 2006280
(Amount in millions of Renminbi, unless otherwise stated)
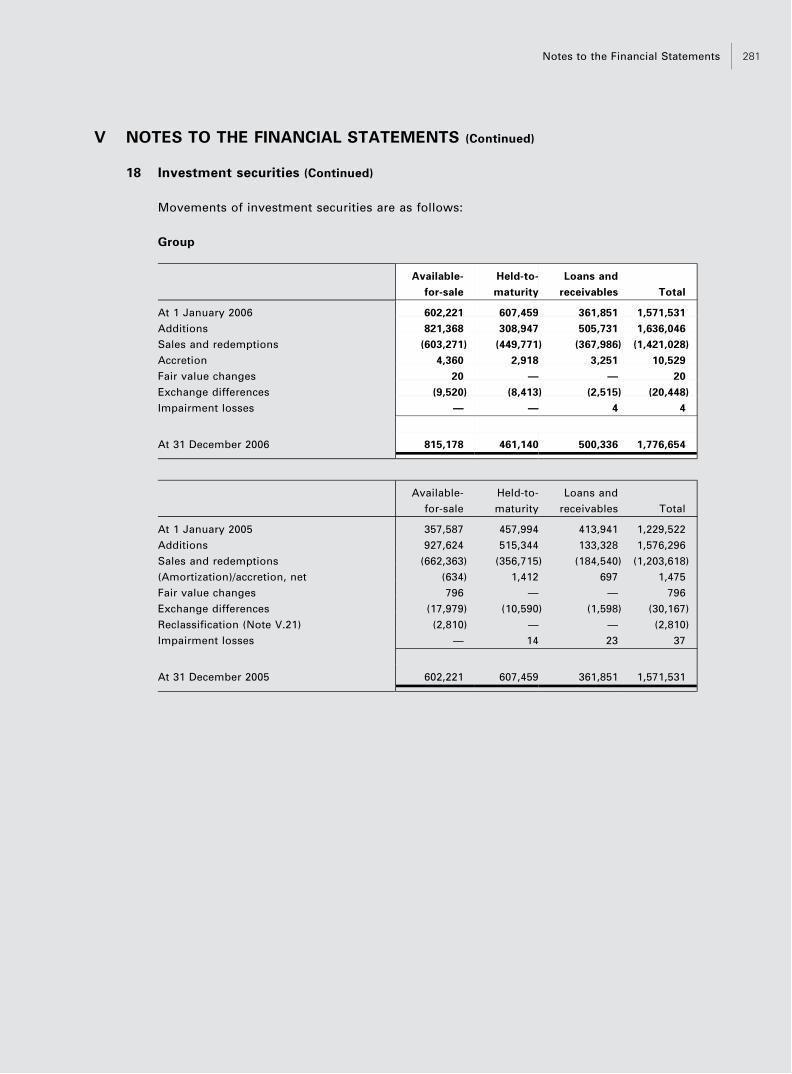
V NOTES TO THE FINANCIAL STATEMENTS (Continued)
18 Investment securities (Continued)
Movements of investment securities are as follows:
Group
Available-
for-sale
Held-to-
maturity
Loans and
receivables Total
At 1 January 2006 602,221 607,459 361,851 1,571,531
Additions 821,368 308,947 505,731 1,636,046
Sales and redemptions (603,271) (449,771) (367,986) (1,421,028)
Accretion 4,360 2,918 3,251 10,529
Fair value changes 20 — — 20
Exchange differences (9,520) (8,413) (2,515) (20,448)
Impairment losses — — 4 4
At 31 December 2006 815,178 461,140 500,336 1,776,654
Available-
for-sale
Held-to-
maturity
Loans and
receivables Total
At 1 January 2005 357,587 457,994 413,941 1,229,522
Additions 927,624 515,344 133,328 1,576,296
Sales and redemptions (662,363) (356,715) (184,540) (1,203,618)
(Amortization)/accretion, net (634) 1,412 697 1,475
Fair value changes 796 — — 796
Exchange differences (17,979) (10,590) (1,598) (30,167)
Reclassification (Note V.21) (2,810) — — (2,810)
Impairment losses — 14 23 37
At 31 December 2005 602,221 607,459 361,851 1,571,531
Notes to the Financial Statements 281
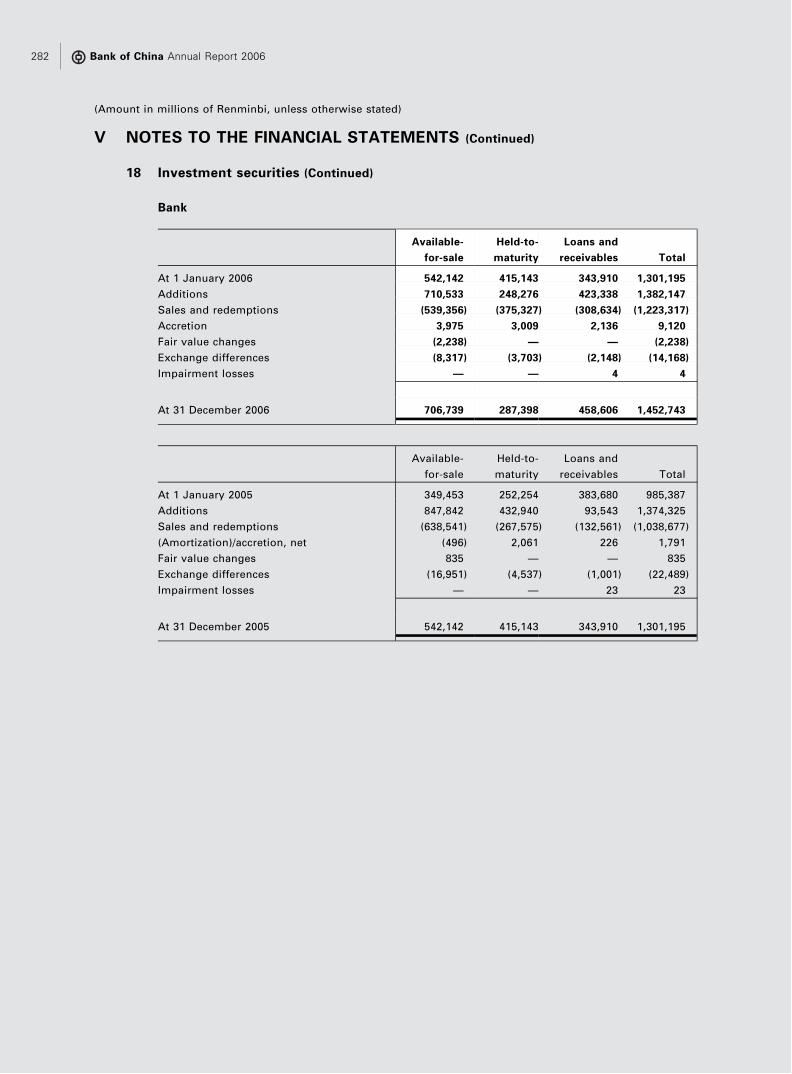
V NOTES TO THE FINANCIAL STATEMENTS (Continued)
18 Investment securities (Continued)
Bank
Available-
for-sale
Held-to-
maturity
Loans and
receivables Total
At 1 January 2006 542,142 415,143 343,910 1,301,195
Additions 710,533 248,276 423,338 1,382,147
Sales and redemptions (539,356) (375,327) (308,634) (1,223,317)
Accretion 3,975 3,009 2,136 9,120
Fair value changes (2,238) — — (2,238)
Exchange differences (8,317) (3,703) (2,148) (14,168)
Impairment losses — — 4 4
At 31 December 2006 706,739 287,398 458,606 1,452,743
Available-
for-sale
Held-to-
maturity
Loans and
receivables Total
At 1 January 2005 349,453 252,254 383,680 985,387
Additions 847,842 432,940 93,543 1,374,325
Sales and redemptions (638,541) (267,575) (132,561) (1,038,677)
(Amortization)/accretion, net (496) 2,061 226 1,791
Fair value changes 835 — — 835
Exchange differences (16,951) (4,537) (1,001) (22,489)
Impairment losses — — 23 23
At 31 December 2005 542,142 415,143 343,910 1,301,195
Bank of China Annual Report 2006282
(Amount in millions of Renminbi, unless otherwise stated)

V NOTES TO THE FINANCIAL STATEMENTS (Continued)
19 Certificates of deposit held
Certificates of deposit held are included within the following balance sheet captions:
Group
As at 31 December
2006 2005
Trading assets and other financial instruments at fair value through
profit or loss 3,813 3,147
Investment securities
— available-for-sale 8,663 4,540
— held-to-maturity 12,681 18,817
— loans and receivables 388 460
25,545 26,964
Analyzed as follows:
Listed in Hong Kong 492 163
Listed outside Hong Kong 31 1,008
Unlisted 25,022 25,793
25,545 26,964
Market value of listed certificates of deposit held 523 1,169
Notes to the Financial Statements 283

V NOTES TO THE FINANCIAL STATEMENTS (Continued)
19 Certificates of deposit held (Continued)
Bank
As at 31 December
2006 2005
Trading assets and other financial instruments at fair value through
profit or loss 927 154
Investment securities
— available-for-sale 75 239
— held-to-maturity — 405
— loans and receivables 388 460
1,390 1,258
Analyzed as follows:
Listed in Hong Kong — —
Listed outside Hong Kong — 154
Unlisted 1,390 1,104
1,390 1,258
Market value of listed certificates of deposit held — 154
20 Investment in subsidiaries
As at 31 December
2006 2005
Investments at cost:
Unlisted shares 45,451 45,080
Details of the Bank’s principal subsidiaries are set out below. These principal subsidiaries are
private companies except otherwise stated. All holdings are in the ordinary share capital of
the undertaking concerned.
Bank of China Annual Report 2006284
(Amount in millions of Renminbi, unless otherwise stated)

V NOTES TO THE FINANCIAL STATEMENTS (Continued)
20 Investment in subsidiaries (Continued)
Name
Place of
incorporation
and operation
Date of
incorporation/
establishment Paid-in capital Equity held
Principal
business
(in millions) (%)
Directly held
BOC Hong Kong (Group) Limited Hong Kong 12 September 2001 HKD34,806 100 Holding
company
BOC International Holdings Limited Hong Kong 10 July 1998 HKD3,539 100 Investment
banking
Bank of China Group Insurance
Company Limited
Hong Kong 23 July 1992 HKD1,269 100 Insurance
services
Bank of China Group Investment
Limited (‘‘BOCGI’’)
Hong Kong 18 May 1993 HKD200 100 Investment
holding
Tai Fung Bank Limited Macau 1942 MOP1,000 50.31 Commercial
banking
Indirectly held
BOC Hong Kong (Holdings) Limited
(‘‘BOCHK Holdings’’)(1)Hong Kong 12 September 2001 HKD52,864 65.87 Holding
company
Bank of China (Hong Kong) Limited(2) Hong Kong 16 October 1964 HKD43,043 65.87 Commercial
banking
Nanyang Commercial Bank, Limited(3) Hong Kong 2 February 1948 HKD600 65.87 Commercial
banking
Chiyu Banking Corporation Limited(2), (3) Hong Kong 24 April 1947 HKD300 46.43 Commercial
banking
BOC Credit Card (International) Limited Hong Kong 9 September 1980 HKD480 65.87 Credit card
services
BOC Group Trustee Company, Limited(3) Hong Kong 1 December 1997 HKD200 76.31 Provision of
trustee
services
Singapore Aircraft Leasing Enterprise
Pte. Limited(4) (Note V. 42)
Singapore 25 November 1993 USD308 100.00 Aircraft leasing
Notes to the Financial Statements 285
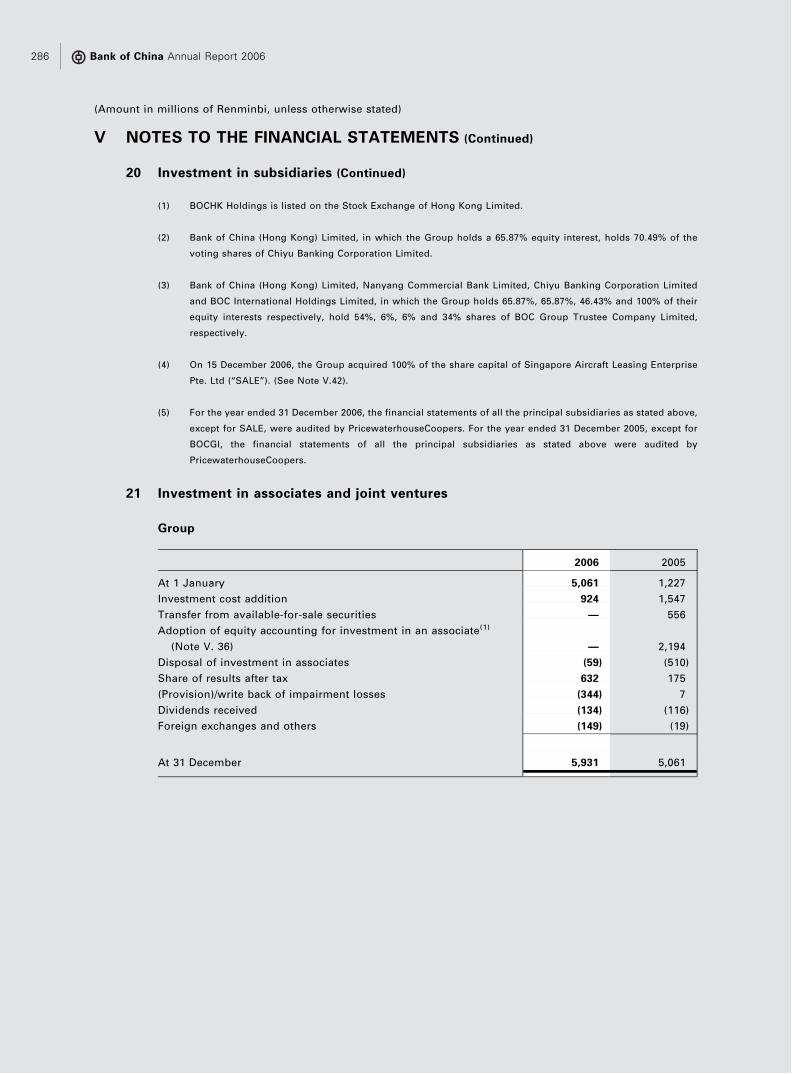
V NOTES TO THE FINANCIAL STATEMENTS (Continued)
20 Investment in subsidiaries (Continued)
(1) BOCHK Holdings is listed on the Stock Exchange of Hong Kong Limited.
(2) Bank of China (Hong Kong) Limited, in which the Group holds a 65.87% equity interest, holds 70.49% of the
voting shares of Chiyu Banking Corporation Limited.
(3) Bank of China (Hong Kong) Limited, Nanyang Commercial Bank Limited, Chiyu Banking Corporation Limited
and BOC International Holdings Limited, in which the Group holds 65.87%, 65.87%, 46.43% and 100% of their
equity interests respectively, hold 54%, 6%, 6% and 34% shares of BOC Group Trustee Company Limited,
respectively.
(4) On 15 December 2006, the Group acquired 100% of the share capital of Singapore Aircraft Leasing Enterprise
Pte. Ltd (‘‘SALE’’). (See Note V.42).
(5) For the year ended 31 December 2006, the financial statements of all the principal subsidiaries as stated above,
except for SALE, were audited by PricewaterhouseCoopers. For the year ended 31 December 2005, except for
BOCGI, the financial statements of all the principal subsidiaries as stated above were audited by
PricewaterhouseCoopers.
21 Investment in associates and joint ventures
Group
2006 2005
At 1 January 5,061 1,227
Investment cost addition 924 1,547
Transfer from available-for-sale securities — 556
Adoption of equity accounting for investment in an associate(1)
(Note V. 36) — 2,194
Disposal of investment in associates (59) (510)
Share of results after tax 632 175
(Provision)/write back of impairment losses (344) 7
Dividends received (134) (116)
Foreign exchanges and others (149) (19)
At 31 December 5,931 5,061
Bank of China Annual Report 2006286
(Amount in millions of Renminbi, unless otherwise stated)

V NOTES TO THE FINANCIAL STATEMENTS (Continued)
21 Investment in associates and joint ventures (Continued)
(1) In 2005, the Group entered into a contract with an independent third party to acquire a further 5% of the equity
shares of Huaneng International Power Development Corporation. The carrying value of this investment on
purchase was RMB1,255 million and is included in Investment securities cost additions for 2005. As a result of
this transaction, the Group holds 20% of the equity of Huaneng International Power Development Corporation
and accounts for the investment using the equity method. Consequently, the then existing 15% investment in
Huaneng International Power Development Corporation was reclassified from available-for-sale securities to
Investment in associates, resulting in a reclassification of RMB2,810 million from Investment securities
representing the original cost of RMB556 million and the reversal of the cumulative change in fair value
recorded in the Reserve for fair value changes of available-for-sale securities of RMB2,254 million (Note V.37).
The cumulative impact resulting from the adoption of the equity method of RMB2,194 million representing the
post acquisition share of net profits, has been credited to Undistributed profits.
Bank
As at 31 December
2006 2005
Investment at cost:
Unlisted shares 21 45
Particulars of the principal associates and joint ventures of the Group are set out as follows:
Place of
incorporation/
establishment
Equity
held
Paid-in
capital Principal business
(%) (in millions)
Huaneng International
Power Development
Corporation
PRC 20 USD450 Power plant operations
BOC International (China)
Limited
PRC 49 RMB1,500 Securities underwriting,
investment advisory, and
brokerage services
CJM Insurance Brokers
Limited
Hong Kong 33 HKD6 Insurance broker
Joint Electronic Teller
Services Limited
Hong Kong 19.96 HKD10 Private inter-bank message
switching network and
ATM services
Dongfeng Peugeot Citroen
Auto Finance Company
Limited
PRC 50 RMB500 Car loan and financing
services
Notes to the Financial Statements 287

V NOTES TO THE FINANCIAL STATEMENTS (Continued)
22 Property and equipment
Group
Buildings and
improvements
Equipment
and motor
vehicles
Construction
in progress Aircraft Total
At 31 December 2006
Cost 67,660 32,132 6,973 20,572 127,337
Accumulated depreciation (15,317) (23,891) — (34) (39,242)
Allowance for impairment
losses (1,494) — (401) — (1,895)
Net book amount 50,849 8,241 6,572 20,538 86,200
At 31 December 2005
Cost 67,216 29,739 3,861 — 100,816
Accumulated depreciation (15,066) (21,306) — — (36,372)
Allowance for impairment
losses (1,494) (2) (531) — (2,027)
Net book amount 50,656 8,431 3,330 — 62,417
Bank of China Annual Report 2006288
(Amount in millions of Renminbi, unless otherwise stated)
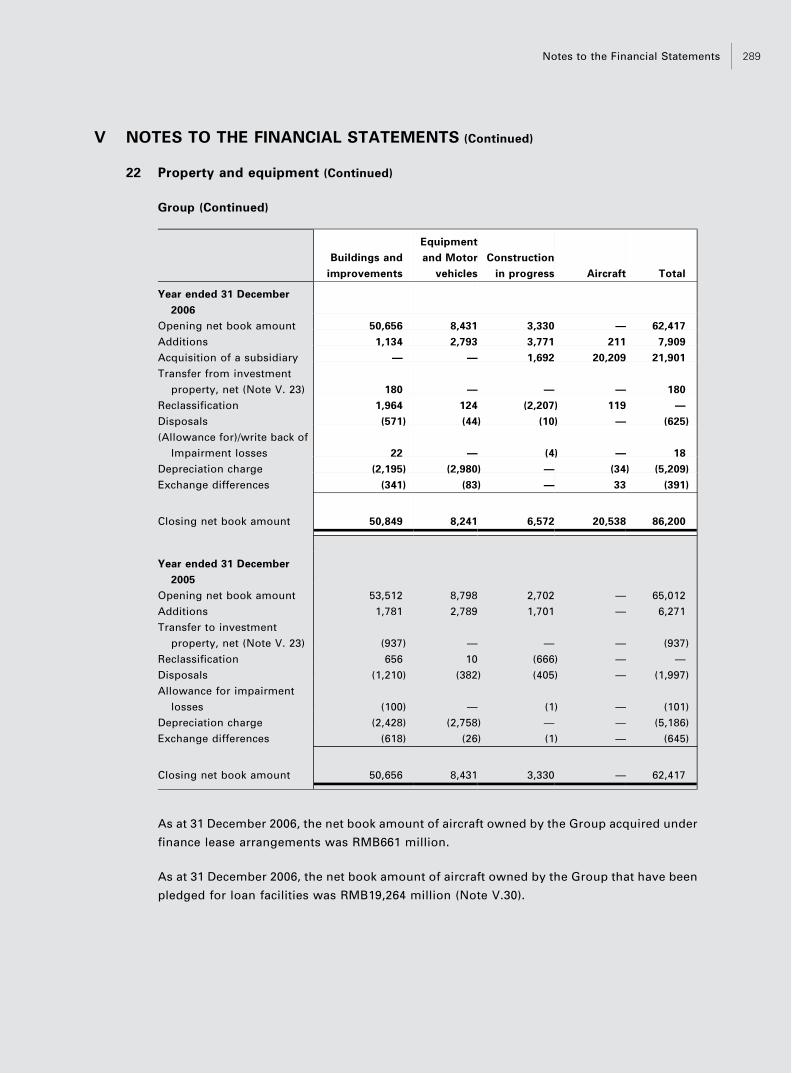
V NOTES TO THE FINANCIAL STATEMENTS (Continued)
22 Property and equipment (Continued)
Group (Continued)
Buildings and
improvements
Equipment
and Motor
vehicles
Construction
in progress Aircraft Total
Year ended 31 December
2006
Opening net book amount 50,656 8,431 3,330 — 62,417
Additions 1,134 2,793 3,771 211 7,909
Acquisition of a subsidiary — — 1,692 20,209 21,901
Transfer from investment
property, net (Note V. 23) 180 — — — 180
Reclassification 1,964 124 (2,207) 119 —
Disposals (571) (44) (10) — (625)
(Allowance for)/write back of
Impairment losses 22 — (4) — 18
Depreciation charge (2,195) (2,980) — (34) (5,209)
Exchange differences (341) (83) — 33 (391)
Closing net book amount 50,849 8,241 6,572 20,538 86,200
Year ended 31 December
2005
Opening net book amount 53,512 8,798 2,702 — 65,012
Additions 1,781 2,789 1,701 — 6,271
Transfer to investment
property, net (Note V. 23) (937) — — — (937)
Reclassification 656 10 (666) — —
Disposals (1,210) (382) (405) — (1,997)
Allowance for impairment
losses (100) — (1) — (101)
Depreciation charge (2,428) (2,758) — — (5,186)
Exchange differences (618) (26) (1) — (645)
Closing net book amount 50,656 8,431 3,330 — 62,417
As at 31 December 2006, the net book amount of aircraft owned by the Group acquired under
finance lease arrangements was RMB661 million.
As at 31 December 2006, the net book amount of aircraft owned by the Group that have been
pledged for loan facilities was RMB19,264 million (Note V.30).
Notes to the Financial Statements 289

V NOTES TO THE FINANCIAL STATEMENTS (Continued)
22 Property and equipment (Continued)
Bank
Buildings and
improvements
Equipment
and motor
vehicles
Construction
in process Total
At 31 December 2006
Cost 52,276 27,076 5,019 84,371
Accumulated depreciation (12,584) (20,420) — (33,004)
Allowance for impairment losses (1,493) — (401) (1,894)
Net book amount 38,199 6,656 4,618 49,473
At 31 December 2005
Cost 51,885 24,922 3,842 80,649
Accumulated depreciation (12,656) (17,922) — (30,578)
Allowance for impairment losses (1,485) (2) (523) (2,010)
Net book amount 37,744 6,998 3,319 48,061
Year ended 31 December 2006
Opening net book amount 37,744 6,998 3,319 48,061
Additions 928 2,220 3,391 6,539
Transfer to investment property, net (197) — — (197)
Reclassification 1,964 124 (2,088) —
Disposals (402) (104) (4) (510)
Write back of impairment losses 14 — — 14
Depreciation charge (1,859) (2,574) — (4,433)
Exchange differences 7 (8) — (1)
Closing net book amount 38,199 6,656 4,618 49,473
Year ended 31 December 2005
Opening net book amount 38,581 7,386 2,666 48,633
Additions 1,697 2,346 1,700 5,743
Reclassification 657 9 (666) —
Disposals (691) (377) (381) (1,449)
Impairment losses (100) — — (100)
Depreciation charge (2,082) (2,368) — (4,450)
Exchange differences (318) 2 — (316)
Closing net book amount 37,744 6,998 3,319 48,061
Bank of China Annual Report 2006290
(Amount in millions of Renminbi, unless otherwise stated)

V NOTES TO THE FINANCIAL STATEMENTS (Continued)
22 Property and equipment (Continued)
According to relevant PRC laws and regulations, after conversion into a joint stock limited
liability company, the Bank is required to re-register its property and equipment under the
name of Bank of China Limited. As at 31 December 2006, the process of re-registration has
not been completed. However, this registration process does not affect the rights of Bank of
China Limited to these assets.
The carrying value of buildings and improvements is analyzed based on the remaining terms
of the leases as follows:
Group
As at 31 December
2006 2005
Held in Hong Kong
on long-term lease (over 50 years) 7,330 7,041
on medium-term lease (10–50 years) 4,009 4,031
11,339 11,072
Held outside Hong Kong
on long-term lease (over 50 years) 3,766 3,719
on medium-term lease (10–50 years) 35,099 35,338
on short-term lease (less than 10 years) 645 527
39,510 39,584
50,849 50,656
Bank
As at 31 December
2006 2005
Held outside Hong Kong
on long-term lease (over 50 years) 3,092 2,911
on medium-term lease (10–50 years) 34,532 34,384
on short-term lease (less than 10 years) 575 449
38,199 37,744
Notes to the Financial Statements 291
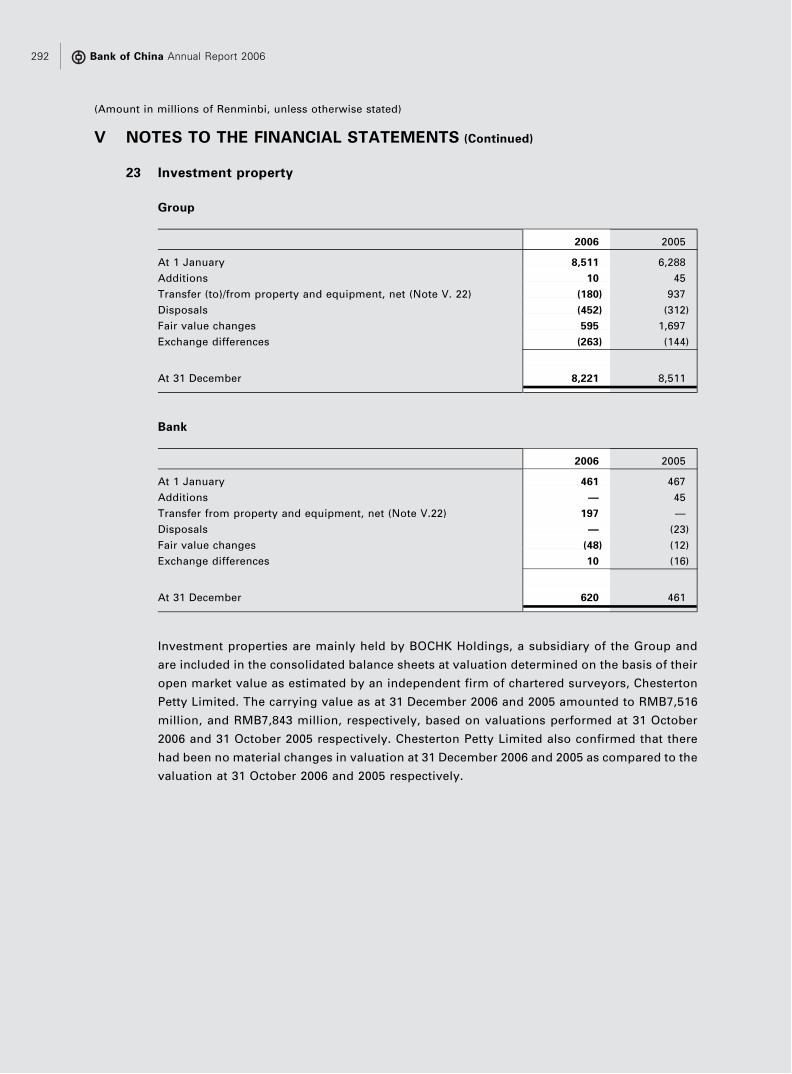
V NOTES TO THE FINANCIAL STATEMENTS (Continued)
23 Investment property
Group
2006 2005
At 1 January 8,511 6,288
Additions 10 45
Transfer (to)/from property and equipment, net (Note V. 22) (180) 937
Disposals (452) (312)
Fair value changes 595 1,697
Exchange differences (263) (144)
At 31 December 8,221 8,511
Bank
2006 2005
At 1 January 461 467
Additions — 45
Transfer from property and equipment, net (Note V.22) 197 —
Disposals — (23)
Fair value changes (48) (12)
Exchange differences 10 (16)
At 31 December 620 461
Investment properties are mainly held by BOCHK Holdings, a subsidiary of the Group and
are included in the consolidated balance sheets at valuation determined on the basis of their
open market value as estimated by an independent firm of chartered surveyors, Chesterton
Petty Limited. The carrying value as at 31 December 2006 and 2005 amounted to RMB7,516
million, and RMB7,843 million, respectively, based on valuations performed at 31 October
2006 and 31 October 2005 respectively. Chesterton Petty Limited also confirmed that there
had been no material changes in valuation at 31 December 2006 and 2005 as compared to the
valuation at 31 October 2006 and 2005 respectively.
Bank of China Annual Report 2006292
(Amount in millions of Renminbi, unless otherwise stated)
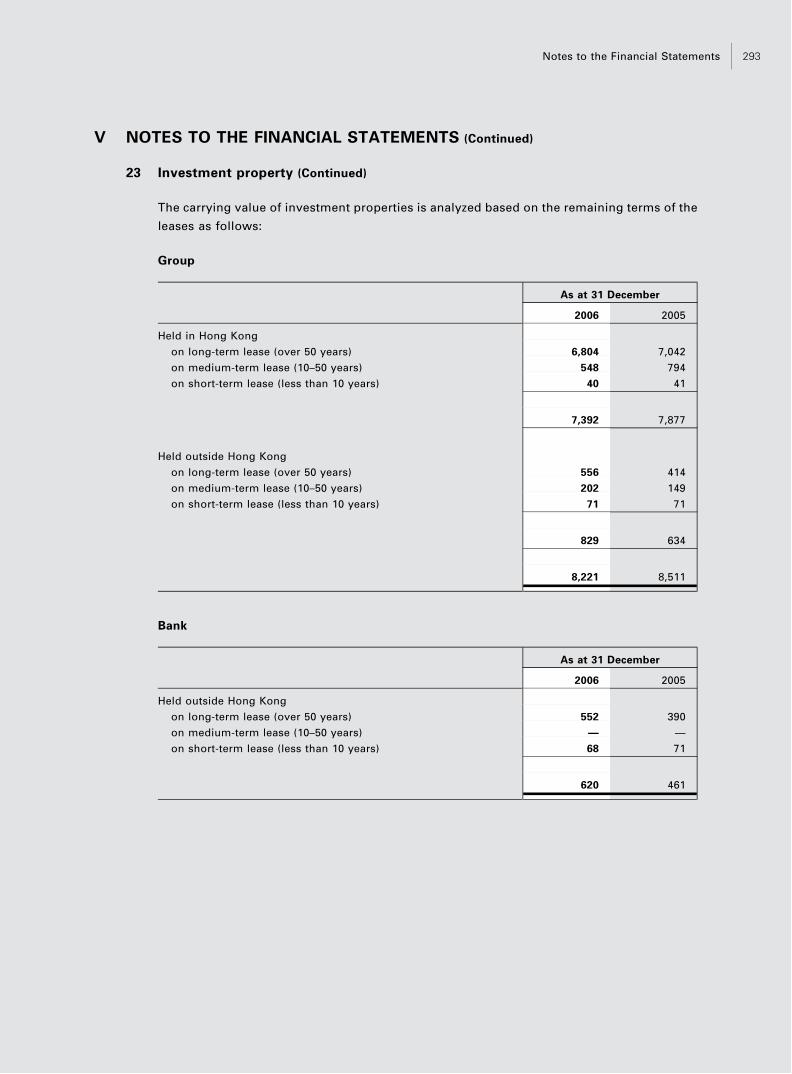
V NOTES TO THE FINANCIAL STATEMENTS (Continued)
23 Investment property (Continued)
The carrying value of investment properties is analyzed based on the remaining terms of the
leases as follows:
Group
As at 31 December
2006 2005
Held in Hong Kong
on long-term lease (over 50 years) 6,804 7,042
on medium-term lease (10–50 years) 548 794
on short-term lease (less than 10 years) 40 41
7,392 7,877
Held outside Hong Kong
on long-term lease (over 50 years) 556 414
on medium-term lease (10–50 years) 202 149
on short-term lease (less than 10 years) 71 71
829 634
8,221 8,511
Bank
As at 31 December
2006 2005
Held outside Hong Kong
on long-term lease (over 50 years) 552 390
on medium-term lease (10–50 years) — —
on short-term lease (less than 10 years) 68 71
620 461
Notes to the Financial Statements 293
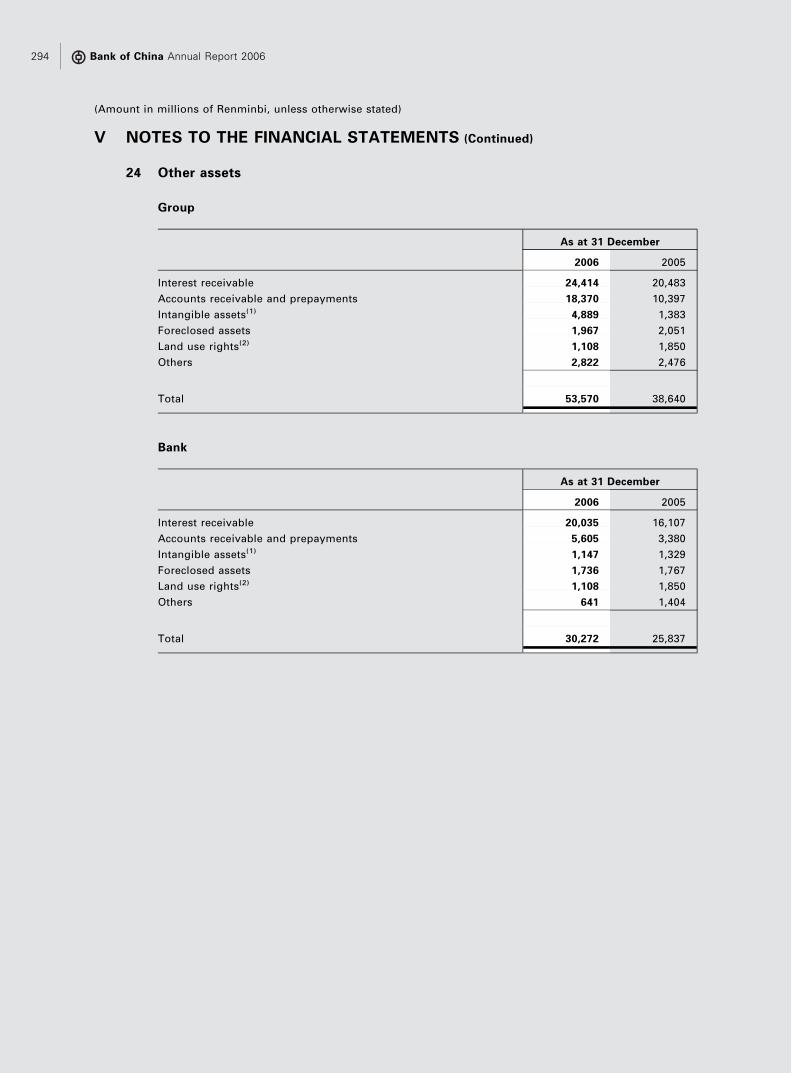
V NOTES TO THE FINANCIAL STATEMENTS (Continued)
24 Other assets
Group
As at 31 December
2006 2005
Interest receivable 24,414 20,483
Accounts receivable and prepayments 18,370 10,397
Intangible assets(1) 4,889 1,383
Foreclosed assets 1,967 2,051
Land use rights(2) 1,108 1,850
Others 2,822 2,476
Total 53,570 38,640
Bank
As at 31 December
2006 2005
Interest receivable 20,035 16,107
Accounts receivable and prepayments 5,605 3,380
Intangible assets(1) 1,147 1,329
Foreclosed assets 1,736 1,767
Land use rights(2) 1,108 1,850
Others 641 1,404
Total 30,272 25,837
Bank of China Annual Report 2006294
(Amount in millions of Renminbi, unless otherwise stated)

V NOTES TO THE FINANCIAL STATEMENTS (Continued)
24 Other assets (Continued)
(1) Intangible assets
Group
Goodwill
Aircraft firm
orders and
options
Computer
software and
others Total
Year ended 31 December 2006
Opening net book amount — — 1,383 1,383
Acquisition of a subsidiary (Note V. 42) 1,875 1,856 — 3,731
Additions — — 329 329
Amortization — — (520) (520)
Transfer (out)/in — (47) 6 (41)
Exchange difference 3 4 — 7
Closing net book amount 1,878 1,813 1,198 4,889
Year ended 31 December 2005
Opening net book amount — — 1,647 1,647
Additions — — 260 260
Amortization — — (518) (518)
Transfer out — — (6) (6)
Closing net book amount — — 1,383 1,383
Bank
Computer software and others
Year ended 31 December
2006 2005
Opening net book amount 1,329 1,591
Additions 329 260
Amortization (520) (518)
Transfer in/(out) 9 (4)
Closing net book amount 1,147 1,329
Notes to the Financial Statements 295

V NOTES TO THE FINANCIAL STATEMENTS (Continued)
24 Other assets (Continued)
(2) Land use rights
Land use rights represent the right to use land appropriated by the PRC Government. According to MLR [2004]
No. 253 ‘‘Response Concerning the Disposal of Land Assets in the Restructuring of Bank of China’’ and MLR
[2005] No. 165 ‘‘Response Concerning the Additional Disposal of Land Assets of Bank of China Limited’’ issued
by the Ministry of Land and Resources, the rights to use 4,032 pieces of land originally appropriated by the PRC
Government have been transferred to the Bank. The land must be used for the purposes originally approved by
the PRC Government. Upon obtaining the rights to the use of the lands appropriated by the PRC Government for
specified uses, the Bank can allocate the land in the form of capital contributions (through equity investment) or
leases to direct investees of the Bank. If the use of the land is altered or the land is allocated to parties other than
those mentioned above, applications for approval must be filed with the related municipal and county level land
and resources authorities where the underlying pieces of land are located, and the fees for land assignments
should be paid as required.
These land use rights are primarily used by the Bank for its operating activities. There were no significant
alterations to the use of the land and no significant disposals to third parties during the years ended 31
December 2006 and 2005.
The carrying value of land use rights is analyzed based on the remaining terms of the leases as follows:
Group and Bank
As at 31 December
2006 2005
Held outside Hong Kong
on long-term lease (over 50 years) 27 21
on medium-term lease (10–50 years) 1,068 1,823
on short-term lease (less than 10 years) 13 6
1,108 1,850
Bank of China Annual Report 2006296
(Amount in millions of Renminbi, unless otherwise stated)

V NOTES TO THE FINANCIAL STATEMENTS (Continued)
25 Due to central banks
Group
As at 31 December
2006 2005
Special foreign exchange deposits from PRC Government agencies 41,956 28,873
Borrowings from central banks 25 520
Others 393 662
42,374 30,055
Bank
As at 31 December
2006 2005
Special foreign exchange deposits from PRC Government agencies 41,956 28,848
Borrowings from central banks — 520
Others 393 662
42,349 30,030
26 Government certificates of indebtedness for bank notes issued and bank notes in
circulation
Bank of China (Hong Kong) Limited and Bank of China Macau Branch are note issuing banks
for Hong Kong dollar and Macau Pataca notes in Hong Kong and Macau, respectively. Under
local regulations, these two entities are required to place deposits of funds to the Hong Kong
and Macau governments respectively to secure the currency notes in circulation.
Bank notes in circulation represent the liabilities in respect of Hong Kong Dollar notes and
Macau Pataca notes in circulation, issued respectively by Bank of China (Hong Kong) Limited
and Bank of China Macau branch.
Notes to the Financial Statements 297

V NOTES TO THE FINANCIAL STATEMENTS (Continued)
27 Derivative financial instruments and liabilities at fair value through profit or loss
Group
As at 31 December
2006 2005
Derivative financial instruments liabilities (Note V.16) 14,323 15,752
Liabilities at fair value through profit or loss
Structured deposits 86,474 70,069
Short positions in foreign currency debt securities 8,690 3,740
Short position in exchange fund bills 3,561 1,613
98,725 75,422
113,048 91,174
Bank
As at 31 December
2006 2005
Derivative financial instruments liabilities (Note V.16) 9,643 11,606
Liabilities at fair value through profit or loss
Structured deposits 77,498 63,507
Short positions in foreign currency debt securities 3,943 1,210
81,441 64,717
91,084 76,323
Bank of China Annual Report 2006298
(Amount in millions of Renminbi, unless otherwise stated)

V NOTES TO THE FINANCIAL STATEMENTS (Continued)
28 Due to customers
Group
As at 31 December
2006 2005
Demand deposits
Corporate customers 979,653 836,763
Individual customers 770,583 667,957
1,750,236 1,504,720
Time deposits
Corporate customers 549,118 511,983
Individual customers 1,645,914 1,554,369
2,195,032 2,066,352
Security and margin deposits 145,850 128,392
Total 4,091,118 3,699,464
Bank
As at 31 December
2006 2005
Demand deposits
Corporate customers 883,939 747,059
Individual customers 565,893 492,876
1,449,832 1,239,935
Time deposits
Corporate customers 434,924 404,500
Individual customers 1,334,994 1,242,669
1,769,918 1,647,169
Security and margin deposits 138,815 122,083
Total 3,358,565 3,009,187
Notes to the Financial Statements 299
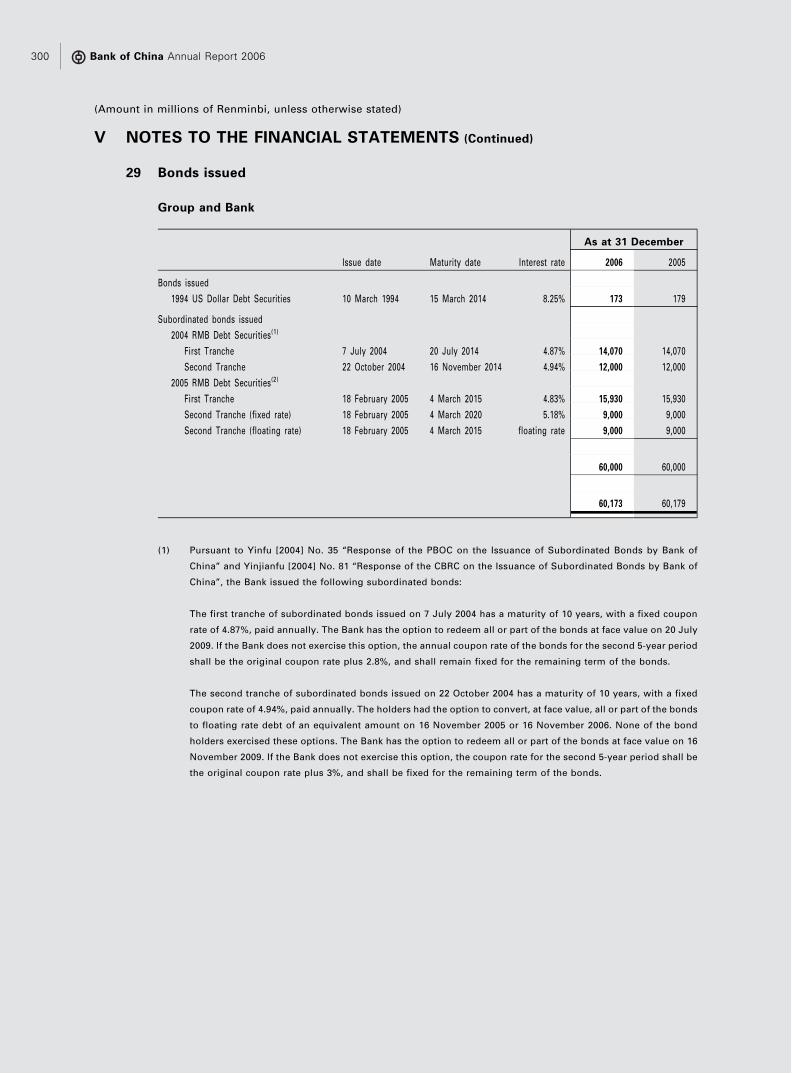
V NOTES TO THE FINANCIAL STATEMENTS (Continued)
29 Bonds issued
Group and Bank
As at 31 December
Issue date Maturity date Interest rate 2006 2005
Bonds issued
1994 US Dollar Debt Securities 10 March 1994 15 March 2014 8.25% 173 179
Subordinated bonds issued
2004 RMB Debt Securities(1)
First Tranche 7 July 2004 20 July 2014 4.87% 14,070 14,070
Second Tranche 22 October 2004 16 November 2014 4.94% 12,000 12,000
2005 RMB Debt Securities(2)
First Tranche 18 February 2005 4 March 2015 4.83% 15,930 15,930
Second Tranche (fixed rate) 18 February 2005 4 March 2020 5.18% 9,000 9,000
Second Tranche (floating rate) 18 February 2005 4 March 2015 floating rate 9,000 9,000
60,000 60,000
60,173 60,179
(1) Pursuant to Yinfu [2004] No. 35 ‘‘Response of the PBOC on the Issuance of Subordinated Bonds by Bank of
China’’ and Yinjianfu [2004] No. 81 ‘‘Response of the CBRC on the Issuance of Subordinated Bonds by Bank of
China’’, the Bank issued the following subordinated bonds:
The first tranche of subordinated bonds issued on 7 July 2004 has a maturity of 10 years, with a fixed coupon
rate of 4.87%, paid annually. The Bank has the option to redeem all or part of the bonds at face value on 20 July
2009. If the Bank does not exercise this option, the annual coupon rate of the bonds for the second 5-year period
shall be the original coupon rate plus 2.8%, and shall remain fixed for the remaining term of the bonds.
The second tranche of subordinated bonds issued on 22 October 2004 has a maturity of 10 years, with a fixed
coupon rate of 4.94%, paid annually. The holders had the option to convert, at face value, all or part of the bonds
to floating rate debt of an equivalent amount on 16 November 2005 or 16 November 2006. None of the bond
holders exercised these options. The Bank has the option to redeem all or part of the bonds at face value on 16
November 2009. If the Bank does not exercise this option, the coupon rate for the second 5-year period shall be
the original coupon rate plus 3%, and shall be fixed for the remaining term of the bonds.
Bank of China Annual Report 2006300
(Amount in millions of Renminbi, unless otherwise stated)

V NOTES TO THE FINANCIAL STATEMENTS (Continued)
29 Bonds issued (Continued)
(2) The first tranche of subordinated bonds issued on 18 February 2005 has a maturity of 10 years, with a fixed
coupon rate of 4.83%, paid annually. The Bank has the option to redeem all or part of the bonds at face value on
4 March 2010. If the Bank does not exercise this option, the annual coupon rate of the bonds for the second 5-
year period shall be the original coupon rate plus 3%, and shall remain fixed for the remaining term of the
bonds.
The second tranche of subordinated bonds issued on 18 February 2005 comprises a fixed rate portion and a
floating rate portion.
The second tranche of fixed rate subordinated bonds issued on 18 February 2005 has a maturity of 15 years, with
a fixed coupon rate of 5.18%, paid annually. The Bank has the option to redeem all or part of the bonds at face
value on 4 March 2015. If the Bank does not exercise this option, the annual coupon rate of the bonds for the
third 5-year period shall be the original coupon rate plus 3%, and shall remain fixed through the maturity date.
The second tranche of floating rate subordinated bonds issued on 18 February 2005 has a maturity of 10 years,
with a floating rate based on a 7-day domestic money market rate, paid semi-annually. The Bank has the option
to redeem all or part of the bonds at face value on 4 March 2010. If the Bank does not exercise this option, the
floating rate for the second 5-year period shall be the original floating rate plus 1%.
These RMB denominated bonds are subordinated to all other claims on the assets of the Bank, except those of
the equity holders. In the calculation of the Group’s capital adequacy ratio, these bonds qualify for inclusion as
supplementary capital in accordance with the relevant CBRC guidelines.
Notes to the Financial Statements 301
V NOTES TO THE FINANCIAL STATEMENTS (Continued)
30 Other borrowings
Group
As at 31 December
2006 2005
Special purpose borrowings(1)
Export credit loans 13,955 17,147
Foreign government loans 17,577 18,414
Other subsidized loans 14,474 16,603
46,006 52,164
Term loans and other borrowings(2) 17,392 —
63,398 52,164
Bank
As at 31 December
2006 2005
Special purpose borrowings(1)
Export credit loans 13,955 17,147
Foreign government loans 17,577 18,414
Other subsidized loans 14,474 16,603
46,006 52,164
(1) Special purpose borrowings are long-term borrowings in multiple currencies from foreign governments and/or
banks in the form of export credit loans, foreign government loans and other subsidized loans. These special
purpose loans are normally used to finance projects of special commercial purpose in the PRC and the Bank is
obliged to repay these loans when they fall due.
As of 31 December 2006, the maturity of special purpose borrowings ranges from within 1 month to 36 years.
The interest bearing special purpose borrowings bear floating and fixed interest rates ranging from 0.2% to
9.2%. These terms are consistent with those related to similar development loans from these entities.
(2) These term loans and other borrowings relate to the financing of the aircraft leasing business of SALE, a wholly
owned subsidiary of the Bank.
As at 31 December 2006, these term loans and other borrowings have a maturity ranging from within 5 months
to 12 years and bear floating and fixed interest rates ranging from 5.55% to 7.56%. The term loans and other
borrowings of RMB16.2 billion are secured by aircraft of the Group. See Note V.22.
Bank of China Annual Report 2006302
(Amount in millions of Renminbi, unless otherwise stated)
V NOTES TO THE FINANCIAL STATEMENTS (Continued)
31 Retirement benefit obligations
The Group recognizes a liability for the present value of the unfunded obligation relating to
retirement benefits payable to certain retired and early retired employees in the consolidated
balance sheet. As of 31 December 2006 and 2005, the actuarial liabilities in relation to the
supplemental benefit obligation for employees who retired prior to 31 December 2003 and
early retirement obligation existing at the respective year-end dates were RMB7,444 million
and RMB7,052 million, which were assessed by Hewitt Associates LLC and BOC Group Life
Assurance Company Limited respectively, using the projected unit credit actuarial cost
method.
The amounts of retirement benefit costs recognized in the income statement comprise:
Group and Bank
2006 2005
Interest cost 236 274
Net actuarial loss recognized in the year 1,155 3,084
Total (Note V.8) 1,391 3,358
The movements of the net liabilities recognized in the balance sheets are as follow:
Group and Bank
2006 2005
At 1 January 7,052 4,274
Amounts recognized in the income statement as above 1,391 3,358
Benefits paid (999) (580)
At 31 December 7,444 7,052
Primary assumptions used:
As at 31 December
2006 2005
Discount rate 3.60% 4.60%
Pension Benefit Inflation rate 2.00% 2.00%
Medical Benefit Inflation rate 7.12% 7.12%
Notes to the Financial Statements 303
V NOTES TO THE FINANCIAL STATEMENTS (Continued)
32 Share option schemes
(1) Share Appreciation Rights Plan
In November 2005, the Bank’s Board of Directors and equity holders approved and
adopted a Share Appreciation Rights Plan under which eligible participants including
directors, supervisors, management and other personnel designated by the Board, will
be granted share appreciation rights, up to 25% of which will be exercisable each year
beginning on the third anniversary date from the date of the grant. The share
appreciation rights will be valid for seven years from the date of grant. Eligible
participants will be entitled to receive an amount equal to the difference, if any,
between the average closing market price of the Bank’s H shares in the ten days prior to
the date of grant and the average closing market price of the Bank’s H shares in the 12
months prior to the date of exercise as adjusted for any change in the Bank’s equity.
The plan provides cash-settled share-based payment only and accordingly, no shares
will be issued under the share appreciation rights plan.
No share appreciation rights were granted during the year ended 31 December 2006
and 2005, and no rights were outstanding under such plan as of 31 December 2006 and
2005.
(2) Share Option Scheme and Sharesave Plan
On 10 July 2002, the shareholders of BOCHK Holdings, approved and adopted two
share option schemes, namely, the Share Option Scheme and the Sharesave Plan.
No options were granted pursuant to the Share Option Scheme or the Sharesave Plan
during the period from 10 July 2002 to 31 December 2006.
(3) BOCHK Holdings Pre-listing Share Option Scheme
On 5 July 2002, certain of the Bank’s directors, senior management personnel and
employees of the Group were granted options by BOC Hong Kong (BVI) Limited
(‘‘BOCHK (BVI)’’), the immediate holding company of BOCHK Holdings, pursuant to a
Pre-listing Share Option Scheme to purchase from BOCHK (BVI) an aggregate of
31,132,600 previously issued and outstanding shares of BOCHK Holdings for HKD8.50
per share. These options, with a ten-year term, vest ratably over four years from 25 July
2002. No further offers to grant any options under the Pre-listing Share Option Scheme
will be made. The Group has no legal or constructive obligation to repurchase or settle
the options in cash. The Group has taken advantage of the transitional provision of
IFRS 2 under which the required recognition and measurements have not been applied
to the options granted to employees of the Group on or before 7 November 2002.
Bank of China Annual Report 2006304
(Amount in millions of Renminbi, unless otherwise stated)
V NOTES TO THE FINANCIAL STATEMENTS (Continued)
32 Share option schemes (Continued)
(3) BOCHK Holdings Pre-listing Share Option Scheme (Continued)
Details of the movement of share options outstanding are as follows:
Directors and
key
management
of BOCHK
(BVI)
Other
employees Others(1)
Total number
of share
options
At 1 January 2006 6,142,500 10,619,250 1,446,000 18,207,750
Transferred 239,000 (239,000) — —
Less: Share options exercised
during the year — (4,278,700) — (4,278,700)
Less: Share options lapsed during
the year — (43,500) — (43,500)
At 31 December 2006 6,381,500 6,058,050 1,446,000 13,885,550
At 1 January 2005 6,142,500 12,849,300 1,446,000 20,437,800
Less: Share options exercised
during the year — (2,121,550) — (2,121,550)
Less: Share options lapsed during
the year — (108,500) — (108,500)
At 31 December 2005 6,142,500 10,619,250 1,446,000 18,207,750
(1) These represent share options held by former directors or former employees of BOCHK Holdings.
Regarding the share options exercised during the years ended 31 December 2006 and
2005 the weighted average share price of BOCHK Holdings’ shares at the time of
exercise was HKD16.50 (equivalent to RMB16.91), and HKD15.01 (equivalent to
RMB15.61) respectively.
Notes to the Financial Statements 305
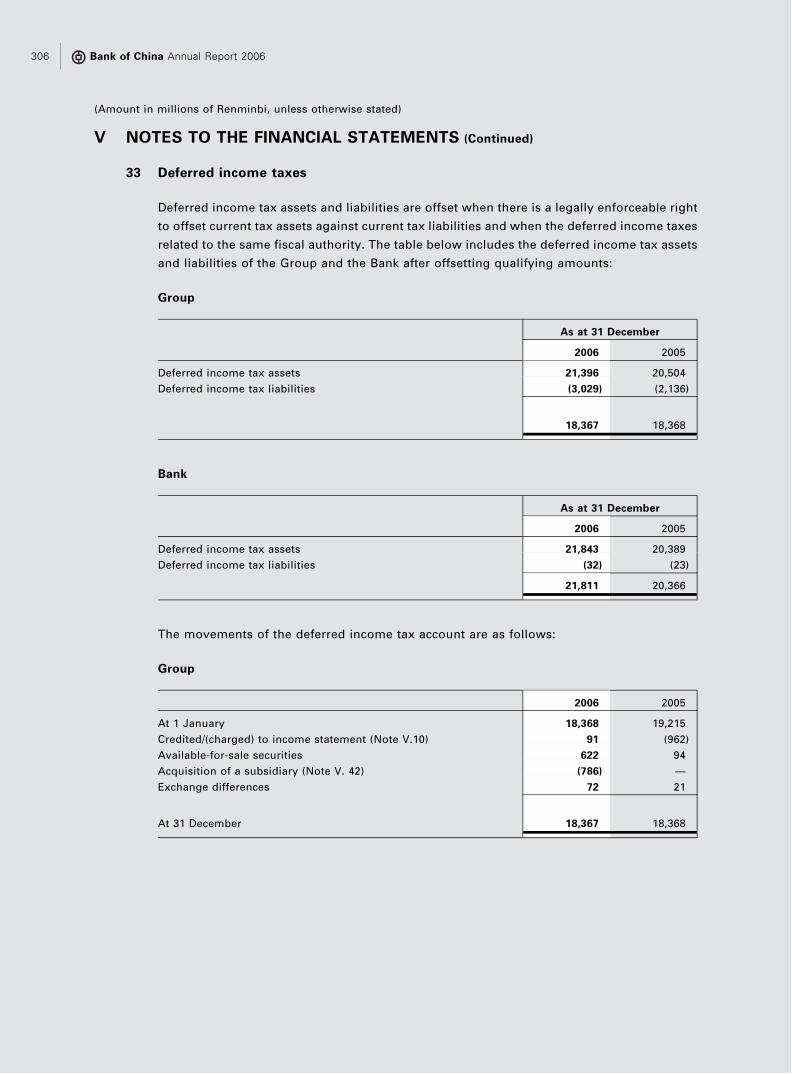
V NOTES TO THE FINANCIAL STATEMENTS (Continued)
33 Deferred income taxes
Deferred income tax assets and liabilities are offset when there is a legally enforceable right
to offset current tax assets against current tax liabilities and when the deferred income taxes
related to the same fiscal authority. The table below includes the deferred income tax assets
and liabilities of the Group and the Bank after offsetting qualifying amounts:
Group
As at 31 December
2006 2005
Deferred income tax assets 21,396 20,504
Deferred income tax liabilities (3,029) (2,136)
18,367 18,368
Bank
As at 31 December
2006 2005
Deferred income tax assets 21,843 20,389
Deferred income tax liabilities (32) (23)
21,811 20,366
The movements of the deferred income tax account are as follows:
Group
2006 2005
At 1 January 18,368 19,215
Credited/(charged) to income statement (Note V.10) 91 (962)
Available-for-sale securities 622 94
Acquisition of a subsidiary (Note V. 42) (786) —
Exchange differences 72 21
At 31 December 18,367 18,368
Bank of China Annual Report 2006306
(Amount in millions of Renminbi, unless otherwise stated)
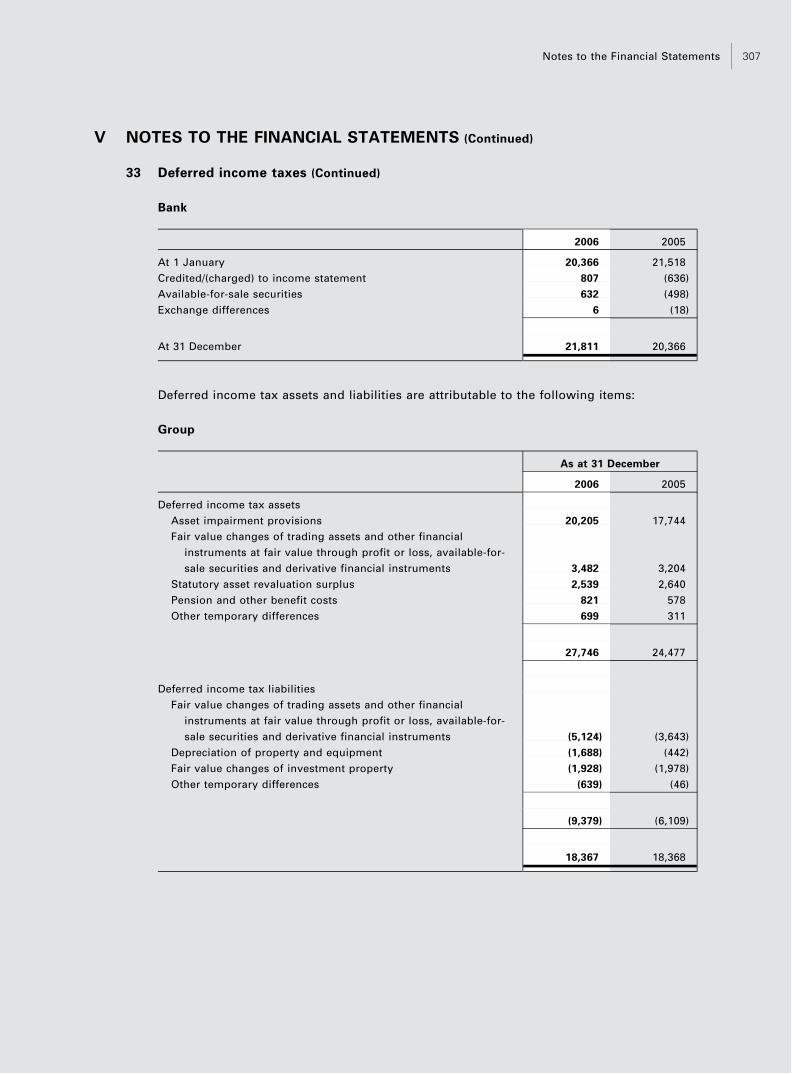
V NOTES TO THE FINANCIAL STATEMENTS (Continued)
33 Deferred income taxes (Continued)
Bank
2006 2005
At 1 January 20,366 21,518
Credited/(charged) to income statement 807 (636)
Available-for-sale securities 632 (498)
Exchange differences 6 (18)
At 31 December 21,811 20,366
Deferred income tax assets and liabilities are attributable to the following items:
Group
As at 31 December
2006 2005
Deferred income tax assets
Asset impairment provisions 20,205 17,744
Fair value changes of trading assets and other financial
instruments at fair value through profit or loss, available-for-
sale securities and derivative financial instruments 3,482 3,204
Statutory asset revaluation surplus 2,539 2,640
Pension and other benefit costs 821 578
Other temporary differences 699 311
27,746 24,477
Deferred income tax liabilities
Fair value changes of trading assets and other financial
instruments at fair value through profit or loss, available-for-
sale securities and derivative financial instruments (5,124) (3,643)
Depreciation of property and equipment (1,688) (442)
Fair value changes of investment property (1,928) (1,978)
Other temporary differences (639) (46)
(9,379) (6,109)
18,367 18,368
Notes to the Financial Statements 307

V NOTES TO THE FINANCIAL STATEMENTS (Continued)
33 Deferred income taxes (Continued)
Bank
As at 31 December
2006 2005
Deferred income tax assets
Asset impairment provisions 20,103 17,596
Fair value changes of trading assets and other financial
instruments at fair value through profit or loss, available-for-
sale securities and derivative financial instruments 3,458 3,159
Statutory asset revaluation surplus 2,539 2,640
Pension and other benefit costs 821 578
Other temporary differences 91 131
27,012 24,104
Deferred income tax liabilities
Fair value changes of trading assets and other financial
instruments at fair value through profit or loss, available-for-
sale securities and derivative financial instruments (5,124) (3,643)
Depreciation of property and equipment (69) (63)
Other temporary differences (8) (32)
(5,201) (3,738)
21,811 20,366
Bank of China Annual Report 2006308
(Amount in millions of Renminbi, unless otherwise stated)
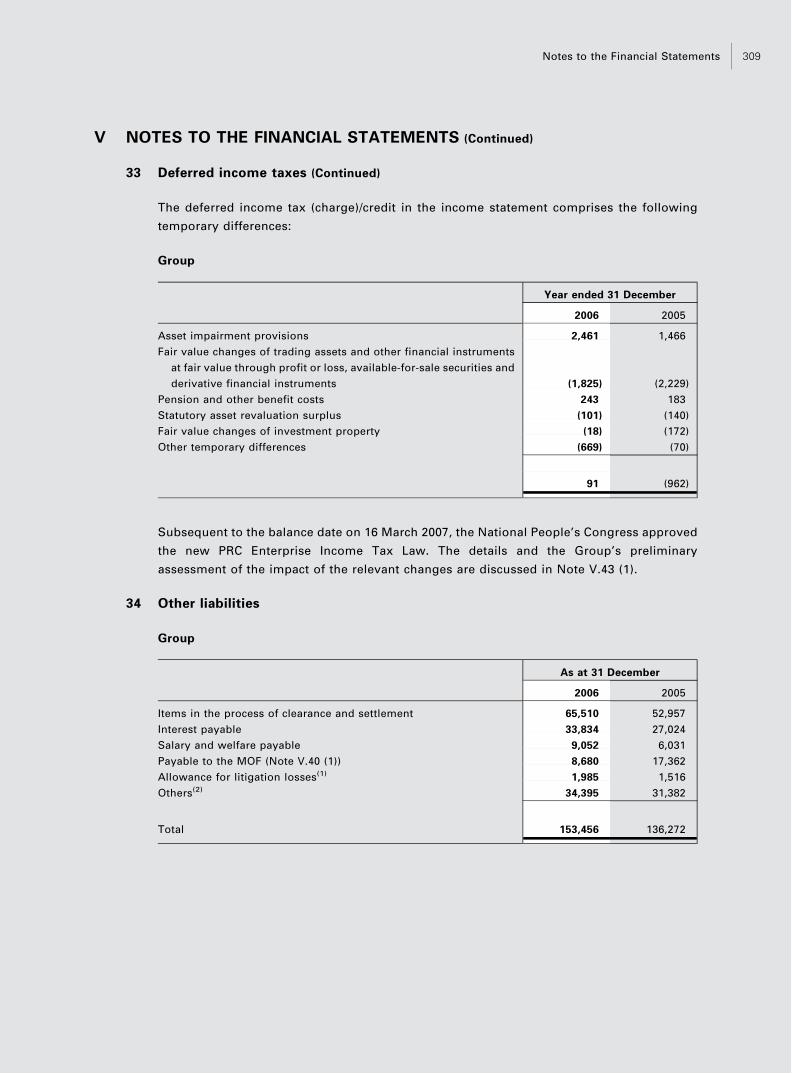
V NOTES TO THE FINANCIAL STATEMENTS (Continued)
33 Deferred income taxes (Continued)
The deferred income tax (charge)/credit in the income statement comprises the following
temporary differences:
Group
Year ended 31 December
2006 2005
Asset impairment provisions 2,461 1,466
Fair value changes of trading assets and other financial instruments
at fair value through profit or loss, available-for-sale securities and
derivative financial instruments (1,825) (2,229)
Pension and other benefit costs 243 183
Statutory asset revaluation surplus (101) (140)
Fair value changes of investment property (18) (172)
Other temporary differences (669) (70)
91 (962)
Subsequent to the balance date on 16 March 2007, the National People’s Congress approved
the new PRC Enterprise Income Tax Law. The details and the Group’s preliminary
assessment of the impact of the relevant changes are discussed in Note V.43 (1).
34 Other liabilities
Group
As at 31 December
2006 2005
Items in the process of clearance and settlement 65,510 52,957
Interest payable 33,834 27,024
Salary and welfare payable 9,052 6,031
Payable to the MOF (Note V.40 (1)) 8,680 17,362
Allowance for litigation losses(1) 1,985 1,516
Others(2) 34,395 31,382
Total 153,456 136,272
Notes to the Financial Statements 309

V NOTES TO THE FINANCIAL STATEMENTS (Continued)
34 Other liabilities (Continued)
Bank
As at 31 December
2006 2005
Items in the process of clearance and settlement 50,877 48,829
Interest payable 31,747 25,291
Salary and welfare payable 7,652 5,389
Payable to the MOF (Note V.40 (1)) 8,680 17,362
Allowance for litigation losses(1) 1,783 1,516
Others 11,788 14,147
Total 112,527 112,534
(1) Movements of allowance for litigation losses are as follows:
Group
2006 2005
At 1 January 1,516 1,310
Provision for the year (Note V.7) 897 712
Utilized during the year (428) (506)
At 31 December (Note V. 38(1)) 1,985 1,516
Bank
2006 2005
At 1 January 1,516 1,310
Provision for the year 692 712
Utilized during the year (425) (506)
At 31 December (Note V. 38(1)) 1,783 1,516
Bank of China Annual Report 2006310
(Amount in millions of Renminbi, unless otherwise stated)

V NOTES TO THE FINANCIAL STATEMENTS (Continued)
34 Other liabilities (Continued)
(2) Included in other liabilities of the Group are insurance liabilities as of 31 December 2006 and 31 December 2005
arising from insurance contracts analyzed as follows:
Group
As at 31 December
2006 2005
Long term insurance contracts 14,625 8,383
General insurance contracts 2,200 2,079
Total insurance liabilities, net 16,825 10,462
35 Share capital and capital reserve
Group
Number of
ordinary
shares
Ordinary
shares of
RMB1 each
Capital
reserve
Treasury
shares Total
(in millions)
Balance at 1 January 2005 186,390 186,390 (10,432) — 175,958
Issue of ordinary shares (net of
issuance costs)(1) 23,037 23,037 3,964 — 27,001
Capital contribution from
an equity holder(4) — — 500 — 500
Others — — 14 — 14
Balance at 31 December 2005/
1 January 2006 209,427 209,427 (5,954) — 203,473
Issue of ordinary shares (net of
issuance costs)(1) 44,412 44,412 72,567 — 116,979
Purchase of treasury Shares(3) (50) — — (216) (216)
Others — — 4 — 4
Balance at 31 December 2006 253,789 253,839 66,617 (216) 320,240
Notes to the Financial Statements 311
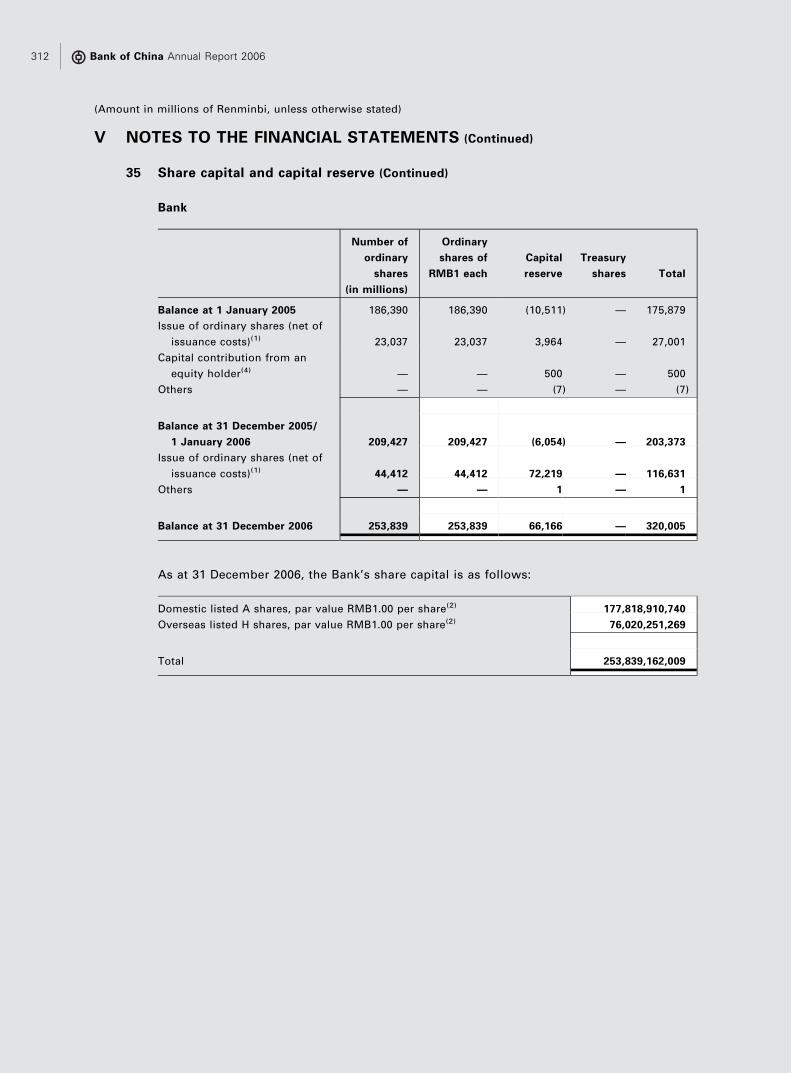
V NOTES TO THE FINANCIAL STATEMENTS (Continued)
35 Share capital and capital reserve (Continued)
Bank
Number of
ordinary
shares
Ordinary
shares of
RMB1 each
Capital
reserve
Treasury
shares Total
(in millions)
Balance at 1 January 2005 186,390 186,390 (10,511) — 175,879
Issue of ordinary shares (net of
issuance costs)(1) 23,037 23,037 3,964 — 27,001
Capital contribution from an
equity holder(4) — — 500 — 500
Others — — (7) — (7)
Balance at 31 December 2005/
1 January 2006 209,427 209,427 (6,054) — 203,373
Issue of ordinary shares (net of
issuance costs)(1) 44,412 44,412 72,219 — 116,631
Others — — 1 — 1
Balance at 31 December 2006 253,839 253,839 66,166 — 320,005
As at 31 December 2006, the Bank’s share capital is as follows:
Domestic listed A shares, par value RMB1.00 per share(2) 177,818,910,740
Overseas listed H shares, par value RMB1.00 per share(2) 76,020,251,269
Total 253,839,162,009
Bank of China Annual Report 2006312
(Amount in millions of Renminbi, unless otherwise stated)

V NOTES TO THE FINANCIAL STATEMENTS (Continued)
35 Share capital and capital reserve (Continued)
(1) In December 2005, the Bank issued 23,037,009,860 ordinary shares with a par value of RMB1 per share to certain
strategic investors for total consideration of RMB27,057 million.
In March 2006, the Bank issued 8,514,415,652 ordinary shares to the National Council for Social Security Fund at
a cash consideration of RMB10,000 million including share premium of RMB1,481 million.
In June 2006, the Bank issued 29,403,878,000 H shares with a par value of RMB1 per share, with share premium
totaling RMB58,128 million (net of share issuance costs of RMB2,435 million), through a global offering to Hong
Kong and overseas investors (‘‘Global Offering’’). As part of the Global Offering, 46,616,373,269 shares owned by
equity holders prior to the Global Offering, except Huijin, were converted into H shares. Each of these investors,
with the exception of Huijin, had previously entered into separate investor rights agreements with Huijin and the
Bank. Among other things, the provisions of these investor rights agreements included net asset protection,
price protection and put options where Huijin has agreed to undertake to meet the settlement of these rights and
obligations. Except for the net asset protection which will expire in 2008, the related price protection and put
option rights lapsed following the completion of the Global Offering by the Bank. The Bank has no obligation to
Huijin with respect to the potential settlement of these rights and obligations.
In June 2006, the Bank issued 6,493,506,000 A shares with a par value of RMB1 per share with share premium
totaling RMB12,958 million (net of share issuance costs of RMB549 million), through the A share initial public
offering to domestic investors. Upon the completion of the A share initial public offering, 171,325,404,740
shares held by Huijin prior to the A share initial public offering were converted into A shares.
(2) All A shares and H shares rank pari passu with the same rights and benefits.
(3) As at 31 December 2006, a wholly owned subsidiary of the Group held certain listed shares of the Bank in
relation to its derivative and arbitrage business. These shares are treated as treasury shares, a deduction from
shareholders’ equity. Gains and losses on sale or redemption of the treasury shares are credited or charged to
reserves. The total number of treasury shares as at 31 December 2006 was 50 million (2005: Nil).
(4) In accordance with the resolution of the seventh extraordinary meeting of the shareholder in 2005, Huijin agreed
to make a payment of RMB500 million, funded by a specific dividend paid by the Bank relating to 2004
undistributed profits, as initial funding for the Bank’s Annuity Plan. This payment has been recorded as a capital
contribution in the capital reserve and as an operating expense in the income statement in 2005 (Note V.8).
Notes to the Financial Statements 313
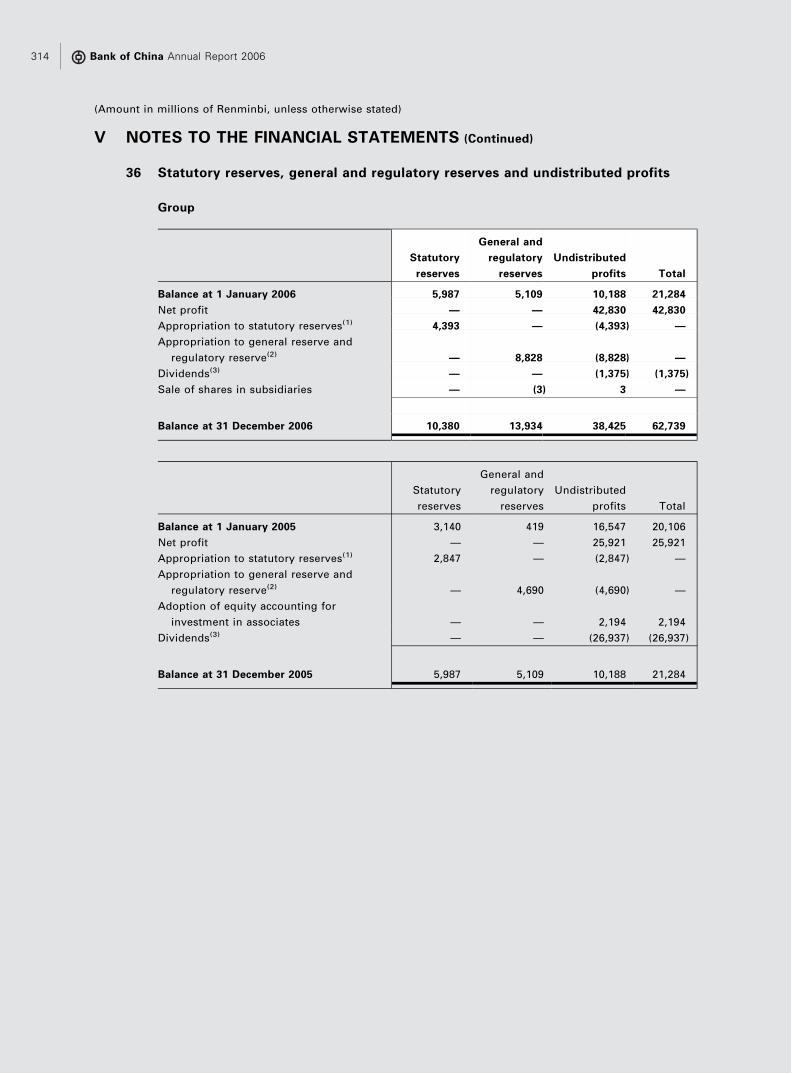
V NOTES TO THE FINANCIAL STATEMENTS (Continued)
36 Statutory reserves, general and regulatory reserves and undistributed profits
Group
Statutory
reserves
General and
regulatory
reserves
Undistributed
profits Total
Balance at 1 January 2006 5,987 5,109 10,188 21,284
Net profit — — 42,830 42,830
Appropriation to statutory reserves(1) 4,393 — (4,393) —
Appropriation to general reserve and
regulatory reserve(2) — 8,828 (8,828) —
Dividends(3) — — (1,375) (1,375)
Sale of shares in subsidiaries — (3) 3 —
Balance at 31 December 2006 10,380 13,934 38,425 62,739
Statutory
reserves
General and
regulatory
reserves
Undistributed
profits Total
Balance at 1 January 2005 3,140 419 16,547 20,106
Net profit — — 25,921 25,921
Appropriation to statutory reserves(1) 2,847 — (2,847) —
Appropriation to general reserve and
regulatory reserve(2) — 4,690 (4,690) —
Adoption of equity accounting for
investment in associates — — 2,194 2,194
Dividends(3) — — (26,937) (26,937)
Balance at 31 December 2005 5,987 5,109 10,188 21,284
Bank of China Annual Report 2006314
(Amount in millions of Renminbi, unless otherwise stated)

V NOTES TO THE FINANCIAL STATEMENTS (Continued)
36 Statutory reserves, general and regulatory reserves and undistributed profits
(Continued)
Bank
Statutory
reserves
General and
regulatory
reserves
Undistributed
profits Total
Balance at 1 January 2006 5,465 2,618 (8,709) (626)
Net profit — — 37,493 37,493
Appropriation to statutory reserves(1) 4,249 — (4,249) —
Appropriation to general reserve and
regulatory reserve(2) — 8,775 (8,775) —
Dividends(3) — — (1,375) (1,375)
Balance at 31 December 2006 9,714 11,393 14,385 35,492
Statutory
reserves
General and
regulatory
reserves
Undistributed
profits Total
Balance at 1 January 2005 2,766 417 2,943 6,126
Net profit — — 20,185 20,185
Appropriation to statutory reserves(1) 2,699 — (2,699) —
Appropriation to general reserve and
regulatory reserve(2) — 2,201 (2,201) —
Dividends(3) — — (26,937) (26,937)
Balance at 31 December 2005 5,465 2,618 (8,709) (626)
(1) Statutory reserves
Under relevant PRC Laws, the Bank is required to transfer 10% of its net profit, as determined under PRC GAAP,
to a non-distributable Statutory surplus reserve. Appropriation to the Statutory surplus reserve may cease when
the balance of such reserves has reached 50% of the share capital. Subject to the approval of the shareholders,
the Statutory surplus reserve can be used for replenishing the accumulated loss or increasing the Bank’s share
capital. The Statutory surplus reserve amount used to increase the share capital is limited to a level where the
balance of Statutory surplus reserve after such capitalization is not less than 25% of the share capital.
In addition, some overseas branches and subsidiaries are required to transfer certain percentages of their net
profit to the Statutory surplus reserve as stipulated by local banking authorities.
In accordance with a resolution of the Board of Directors dated 22 March 2007, the Bank appropriated 10% of the
net profit for the year ended 31 December 2006 as reported in the PRC statutory financial statements to the
Statutory surplus reserves, amounting to RMB4,249 million (2005: RMB2,749 million).
Notes to the Financial Statements 315
V NOTES TO THE FINANCIAL STATEMENTS (Continued)
36 Statutory reserves, general and regulatory reserves and undistributed profits
(Continued)
(2) General and regulatory reserves
Pursuant to Caijin [2005] No. 49 ‘‘Measures on General Provision for Bad and Doubtful Debts for Financial
Institutions’’ issued by MOF on 17 May 2005, banks and certain other financial institutions in the PRC are
required to maintain an adequate allowance for impairment losses against their risk assets as defined. In
addition to the specific allowance for impairment losses, financial institutions are required to establish and
maintain a general reserve within Shareholders’ equity, through the appropriation of income to address
unidentified potential impairment losses. According to Caijin [2005] No.49, the general reserve should not be
less than 1% of the aggregate amount of risk assets as defined by this policy, before any allowance for
impairment losses at the balance sheet date. The Bank intends to achieve the required reserve level within 3
years.
In accordance with a resolution dated 22 March 2007 and on the basis of the Bank’s profit for the year ended 31
December 2006, the Board of Directors of the Bank approved the appropriation of RMB8,764 million (2005:
RMB2,184 million) to the general reserves for the year ended 31 December 2006. Total amount of general
reserves achieved 40% of the required level.
The Regulatory reserve mainly refers to the reserve amount set aside by BOC Hong Kong (Group) Limited, a
subsidiary of the Group, for general banking risks, including future losses or other unforeseeable risks. As at 31
December 2006 and 2005, the reserve amount set aside by BOC Hong Kong (Group) Limited was RMB2,533
million and RMB2,475 million respectively.
(3) Dividends
According to the 2004 profit distribution plan approved at the second extraordinary general shareholder’s
meeting held on 7 September 2005, the Bank distributed a cash dividend of RMB0.076 per ordinary share
totalled RMB14,200 million.
According to the profit distribution plan for the first half of 2005 approved at the seventh extraordinary general
shareholders’ meeting held on 31 December 2005, the Bank distributed a cash dividend of RMB0.068 per
ordinary shares totalled RMB12,737 million to the equity holder of the Bank as of 29 December 2005.
According to the 2005 profit distribution plan approved at a post-adjournment session of the Annual General
Meeting held on 30 April 2006, the Bank distributed a dividend of RMB0.0066 per ordinary share totalled
RMB1,375 million to the equity holders of the Bank as of 31 December 2005.
A dividend in respect of 2006 of RMB0.04 per share, amounting to a total dividend of RMB10,154 million is to be
proposed for approval at the Annual General Meeting to be held on 14 June 2007. These financial statements do
not reflect this dividend payable, which will be accounted for in shareholders’ equity as an appropriation of
undistributed profits in the year ending 31 December 2007.
Bank of China Annual Report 2006316
(Amount in millions of Renminbi, unless otherwise stated)

V NOTES TO THE FINANCIAL STATEMENTS (Continued)
37 Reserve for fair value changes of available-for-sale securities
Group
2006 2005
At 1 January 1,899 2,730
Net (losses)/gains from changes in fair value (1) 813
Net (gains)/losses transferred to net profit on disposal (508) 525
Reversal of fair value changes of Huaneng International Power
Development Corporation (Note V.21) — (2,254)
Deferred income taxes 619 85
At 31 December 2,009 1,899
Bank
2006 2005
At 1 January 280 (815)
Net (losses)/gains from changes in fair value (2,237) 835
Net losses transferred to net profit on disposal 287 758
Deferred income taxes 632 (498)
At 31 December (1,038) 280
38 Contingent liabilities and commitments
(1) Legal proceedings
As at 31 December 2006, the Group was involved in certain lawsuits as defendants
arising from its normal business operations. As at 31 December 2006 and 2005,
provisions of RMB1,985 million and RMB1,516 million were made based on court
judgments or the advice of counsel. After consulting legal professionals, management
of the Group believes that the ultimate outcome of these lawsuits will not have a
material impact on the financial position or operations of the Group. Allowances for
litigation losses based on the opinions of the Group’s internal and external legal
counsel are set forth in Note V.34.
Notes to the Financial Statements 317

V NOTES TO THE FINANCIAL STATEMENTS (Continued)
38 Contingent liabilities and commitments (Continued)
(2) Assets pledged
Assets pledged as collateral for repurchase and short positions with other banks and
financial institutions are set forth in the tables below. As at 31 December 2006, the
Group and the Bank had such Repo agreements and short positions amounting to
RMB54,806 million (2005 : RMB62,108 million) and RMB51,245 million (2005:
RMB59,340 million) respectively. All such agreements mature within twelve months
from inception.
Group
As at 31 December
2006 2005
Precious metals — 2,617
Bills (Note V.17) — 11,968
Debt securities (Note V.18(7)) 55,212 49,658
Total 55,212 64,243
Bank
As at 31 December
2006 2005
Precious metals — 2,617
Bills (Note V.17) — 11,968
Debt securities (Note V.18(7)) 51,632 45,106
Total 51,632 59,691
The Group has accepted cash collateral and security collateral that it is permitted to sell
or re-pledge in connection with its Reverse repo agreements and securities lending
transactions. The fair value of the collateral accepted by the Group and the Bank was
RMB77,657 million (2005 : RMB69,789 million) as of 31 December 2006. Both the Group
and the Bank had an obligation to return collateral that it has sold with a fair value of
RMB3,728 million (2005 : RMB1,130 million) as of 31 December 2006.
Bank of China Annual Report 2006318
(Amount in millions of Renminbi, unless otherwise stated)

V NOTES TO THE FINANCIAL STATEMENTS (Continued)
38 Contingent liabilities and commitments (Continued)
(3) Capital commitments
Group
As at 31 December
2006 2005
Contracted but not provided for 38,741 1,893
Authorized but not contracted for 1,536 2,687
40,277 4,580
Bank
As at 31 December
2006 2005
Contracted but not provided for 3,210 1,731
Authorized but not contracted for 1,531 2,671
4,741 4,402
(4) Operating leases
According to the irrevocable operating lease contracts, the minimum rental payments
that should be paid by the Group and the Bank in the future are summarized as follows:
Group
As at 31 December
2006 2005
Within one year 1,604 1,371
One to two years 1,281 1,085
Two to three years 969 807
Above three years 2,832 2,546
6,686 5,809
Notes to the Financial Statements 319

V NOTES TO THE FINANCIAL STATEMENTS (Continued)
38 Contingent liabilities and commitments (Continued)
(4) Operating leases (Continued)
Bank
As at 31 December
2006 2005
Within one year 1,286 1,157
One to two years 1,069 949
Two to three years 863 756
Above three years 2,808 2,532
6,026 5,394
(5) Certificate Treasury Bond redemption commitments
The Bank is entrusted by the MOF to underwrite certain Certificate Treasury Bonds. The
investors of Certificate Treasury Bonds have a right to redeem the bonds at par any
time prior to maturity and the Bank is committed to redeem those bonds. The
redemption price is the principal value of the Certificate Treasury Bonds plus unpaid
interest in accordance with the early redemption arrangement.
As at 31 December 2006, the principal value of the bonds amounts to RMB84,500
million (2005 : RMB80,965 million). The original maturities of these bonds vary from 1
to 5 years. As the deposits base rate established by PBOC is currently lower than the
yields on all issue of Certificate Treasury Bonds, management expects the amount of
redemption before the maturity dates of those bonds through the Bank will not be
material.
The MOF will not provide funding for the early redemption of these Certificate Treasury
Bonds on a back-to-back basis but will pay interest and repay the principal at maturity.
Bank of China Annual Report 2006320
(Amount in millions of Renminbi, unless otherwise stated)

V NOTES TO THE FINANCIAL STATEMENTS (Continued)
38 Contingent liabilities and commitments (Continued)
(6) Credit commitments
Group
As at 31 December
2006 2005
Credit commitments(i)
with an original maturity of under one year 212,179 182,965
with an original maturity of one year or over 258,392 201,745
Acceptances 217,093 195,234
Letters of guarantee issued 290,205 212,987
Letters of credit issued 109,083 101,195
Others 870 1,636
Total 1,087,822 895,762
Bank
As at 31 December
2006 2005
Credit commitments(i)
with an original maturity of under one year 98,392 72,359
with an original maturity of one year or over 211,520 169,322
Acceptances 212,163 191,034
Letters of guarantee issued 286,050 202,994
Letters of credit issued 93,613 86,824
Others 490 1,431
Total 902,228 723,964
(i) Credit commitments represent general credit facility limits for our corporate customers. These credit
facilities may be drawn in the form of cash advances or the issuance of letters of credit, acceptances or
letters of guarantee.
Notes to the Financial Statements 321

V NOTES TO THE FINANCIAL STATEMENTS (Continued)
38 Contingent liabilities and commitments (Continued)
(7) Credit risk weighted amounts of off balance sheet exposures
Group
As at 31 December
2006 2005
Contingent liabilities and commitments 413,678 329,697
The credit risk weighted amounts are the amounts calculated in accordance with the
guidelines issued by the CBRC and are dependent on, among other factors, the
creditworthiness of the counterparty and the maturity characteristics. The risk weights
used range from 0% to 100% for contingent liabilities and commitments.
The credit risk weighted amounts stated above have not taken into account the effects
of netting arrangements.
39 Cash and cash equivalents
For the purposes of the cash flow statement, cash and cash equivalents comprise the
following balances with an original maturity of less than three months:
Group
As at 31 December
2006 2005
Cash and due from banks (Note V.12) 38,805 40,087
Balances with central banks (Note V.13) 101,776 108,149
Placements with banks and other financial institutions (Note V.14) 305,618 233,301
Short term bills and notes (Note V.18(5)) 73,745 15,575
Total 519,944 397,112
Bank of China Annual Report 2006322
(Amount in millions of Renminbi, unless otherwise stated)

V NOTES TO THE FINANCIAL STATEMENTS (Continued)
40 Related party transactions
Related parties are those parties that have the ability to control the other party or exercise
significant influence over the other party in making financial or operational decisions. Parties
are also considered to be related if they are subject to common control. Related parties may
be individuals or other entities. The Group is subject to the control of the State Council of the
PRC Government through Huijin.
(1) Financial restructuring arrangements with the MOF
As at 31 December 2006, the Group had a liability of RMB8,680 million (2005:
RMB17,362 million) to the MOF in respect of the excess of the appraised value of the
net assets of the Bank as at 31 December 2003 over the amount of the share capital of
the Bank as at the date of the government directed financial restructuring which
involved the sales of non performing loans and policy related assets and various
capital injections by the government through Huijin in the conversion of the Bank into a
joint stock limited company during 2003 and 2004. This liability included in ‘‘other
liabilities’’ is non-interest bearing and is to be paid in four annual installments before
31 December 2008 (Note V.34).
(2) Transactions with the MOF and the PBOC
The Group enters into banking transactions with the MOF and the PBOC in the normal
course of business. These include purchase and redemption of investment securities
issued by the MOF and the PBOC; maintenance of mandatory reserves; other deposits
and amounts due to the PBOC; underwriting and distribution of Certificate Treasury
Bonds issued by the MOF through the Group’s branch network and earning
commission income based on such bonds sold. Details of mandatory reserves and
other deposits with and investments in securities issued by the PBOC are set out in
Note V.13 and Note V.18 respectively. Details of foreign currency spot and swap
transactions with the PBOC are set out in Note III.5 and Note V.16. Details of balances
due to the PBOC are set out in Note V.25. Details of other transactions and balances are
set forth below.
Notes to the Financial Statements 323

V NOTES TO THE FINANCIAL STATEMENTS (Continued)
40 Related party transactions (Continued)
(2) Transactions with the MOF and the PBOC (Continued)
(i) Treasury bonds and PBOC bonds
The Group purchases and redeems bonds issued by the MOF and the PBOC. The
volume of such transactions and related interest rate range for the years ended 31
December 2006 and 2005 and the outstanding balances as of the respective year
end dates are set out below:
Year ended 31 December
2006 2005
Purchases during the year 574,169 642,574
Redemption/sales during the year 570,554 384,559
Interest rate range (Note V.40(7)) 1.22%–9.00% 0.41%–9.00%
2006 2005
Outstanding balance at 1 January 533,625 271,120
Outstanding balance at 31 December 539,828 533,625
(ii) Transactions with the MOF in relation to the underwriting and distribution of
Certificate Treasury Bonds
The Group underwrites Certificate Treasury Bonds issued by the MOF and
undertakes the role of a distributor of these bonds through its branch network and
earns commission income based on the amount of such bonds sold (Note
V.38(5)).
Year ended 31 December
2006 2005
Total distribution of Certificate Treasury Bonds
in the year 25,350 26,000
Commission income earned in the year 269 252
2006 2005
Outstanding balance at 1 January 10,185 8,717
Outstanding balance at 31 December 12,800 10,185
Bank of China Annual Report 2006324
(Amount in millions of Renminbi, unless otherwise stated)
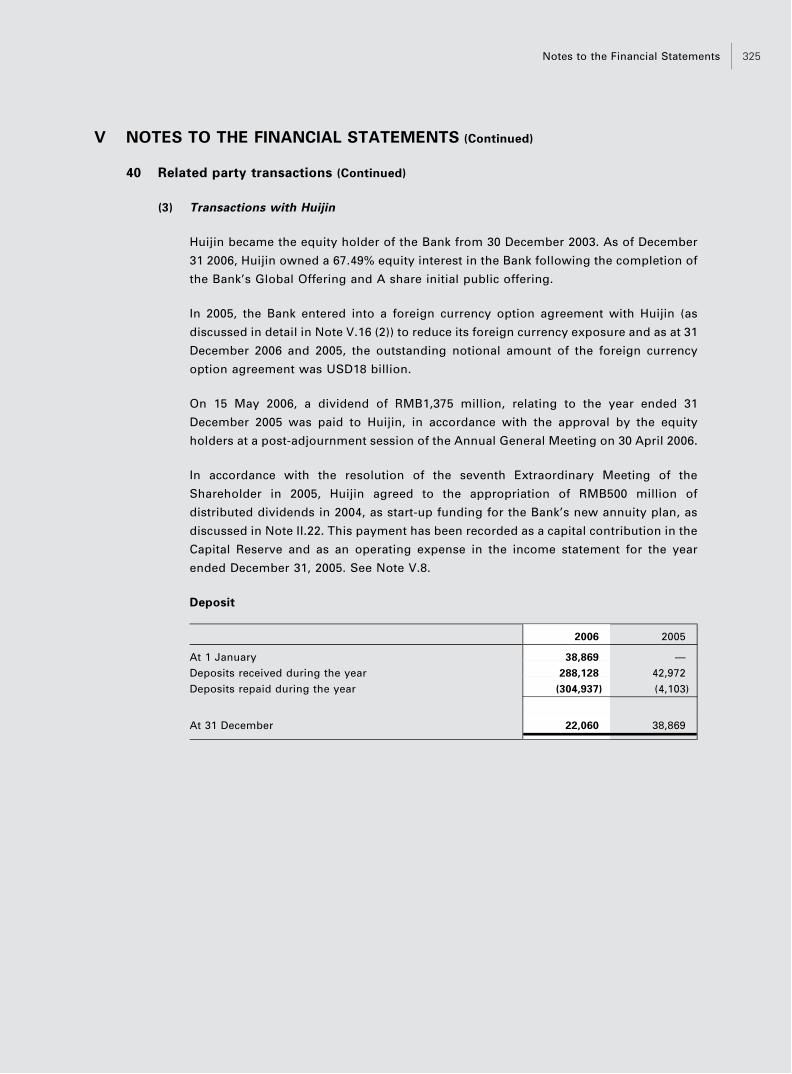
V NOTES TO THE FINANCIAL STATEMENTS (Continued)
40 Related party transactions (Continued)
(3) Transactions with Huijin
Huijin became the equity holder of the Bank from 30 December 2003. As of December
31 2006, Huijin owned a 67.49% equity interest in the Bank following the completion of
the Bank’s Global Offering and A share initial public offering.
In 2005, the Bank entered into a foreign currency option agreement with Huijin (as
discussed in detail in Note V.16 (2)) to reduce its foreign currency exposure and as at 31
December 2006 and 2005, the outstanding notional amount of the foreign currency
option agreement was USD18 billion.
On 15 May 2006, a dividend of RMB1,375 million, relating to the year ended 31
December 2005 was paid to Huijin, in accordance with the approval by the equity
holders at a post-adjournment session of the Annual General Meeting on 30 April 2006.
In accordance with the resolution of the seventh Extraordinary Meeting of the
Shareholder in 2005, Huijin agreed to the appropriation of RMB500 million of
distributed dividends in 2004, as start-up funding for the Bank’s new annuity plan, as
discussed in Note II.22. This payment has been recorded as a capital contribution in the
Capital Reserve and as an operating expense in the income statement for the year
ended December 31, 2005. See Note V.8.
Deposit
2006 2005
At 1 January 38,869 —
Deposits received during the year 288,128 42,972
Deposits repaid during the year (304,937) (4,103)
At 31 December 22,060 38,869
Notes to the Financial Statements 325

V NOTES TO THE FINANCIAL STATEMENTS (Continued)
40 Related party transactions (Continued)
(4) Transactions with other companies controlled by Huijin
Huijin also has controlling equity interests in certain other bank and non-bank entities
in the PRC. The Group enters into banking transactions with these companies in the
normal course of its business. These include trading assets, investment securities and
money market transactions.
The volume of such transactions and related interest rate range for the years ended 31
December 2006 and 2005 and the outstanding balances with these companies as of 31
December 2006 and 2005 are as follows:
(i) Trading assets and investment securities
Year ended 31 December
2006 2005
Purchases during the year 1,207 1,499
Redemptions/sales during the year 1,804 1,218
Interest rate range (Note V.40 (7)) 3.15%–6.54% 0.26%–5.90%
2006 2005
Outstanding balance at 1 January 2,400 2,183
Outstanding balance at 31 December 1,762 2,400
(ii) Due from banks
Year ended 31 December
2006 2005
Interest rate range (Note V.40 (7)) 0.00%–5.40% 0.00%–3.74%
2006 2005
Outstanding balance at 1 January 88 94
Outstanding balance at 31 December 121 88
Bank of China Annual Report 2006326
(Amount in millions of Renminbi, unless otherwise stated)

V NOTES TO THE FINANCIAL STATEMENTS (Continued)
40 Related party transactions (Continued)
(4) Transactions with other companies controlled by Huijin (Continued)
(iii) Placements with banks and other financial institutions
Year ended 31 December
2006 2005
Interest rate range (Note V.40 (7)) 2.40%–6.05% 0.37%–5.50%
2006 2005
Outstanding balance at 1 January 2,318 3,537
Outstanding balance at 31 December 1,662 2,318
(iv) Due to banks and other financial institutions
Year ended 31 December
2006 2005
Interest rate range (Note V.40 (7)) 0.00%–3.00% 0.00%–2.50%
2006 2005
Outstanding balance at 1 January 2,076 1,895
Outstanding balance at 31 December 1,971 2,076
(v) Placements from banks and other financial institutions
Year ended 31 December
2006 2005
Interest rate range (Note V.40 (7)) 0.99%–4.25% 0.09%–4.50%
2006 2005
Outstanding balance at 1 January 243 —
Outstanding balance at 31 December 106 243
Notes to the Financial Statements 327

V NOTES TO THE FINANCIAL STATEMENTS (Continued)
40 Related party transactions (Continued)
(5) Transactions with other state controlled entities
The Bank is subject to the control of the State Council of the PRC Government through
Huijin, which also directly and indirectly controls a significant number of entities
through its government authorities, agencies and affiliates. Accordingly, the Group has
extensive transactions with other state controlled entities. The nature of these
transactions for the year ended 31 December 2006 and 2005, conducted in the
ordinary course of business, includes, but is not limited to, the following:
— Lending, provision of credit and guarantees and deposit taking;
— Inter-bank balance taking and placing;
— Sale, purchase, underwriting and redemption of bonds issued by other state
controlled entities;
— Rendering of foreign exchange, remittance, investment related services;
— Entrusted lending and provision of other custody services; and
— Purchasing of utilities, telecommunication and postal services.
Bank of China Annual Report 2006328
(Amount in millions of Renminbi, unless otherwise stated)

V NOTES TO THE FINANCIAL STATEMENTS (Continued)
40 Related party transactions (Continued)
(5) Transactions with other state controlled entities (Continued)
(i) Due from banks
Year ended 31 December
2006 2005
Interest rate range (Note V.40 (7)) 0.00%–11.00% 0.00%–4.67%
2006 2005
Outstanding balance at 1 January 3,547 2,085
Outstanding balance at 31 December 3,499 3,547
No allowance for impairment losses on amounts due from banks has been
recognized during the years ended 31 December 2006 and 2005.
(ii) Placements with banks and other financial institutions
Year ended 31 December
2006 2005
Interest rate range (Note V.40 (7)) 0.07%–7.40% 0.00%–6.09%
2006 2005
Outstanding balance at 1 January 68,794 55,747
Outstanding balance at 31 December 42,963 68,794
Allowance for impairment losses (499) (546)
Impairment losses on placements with banks and other financial institutions
recognized at 31 December 2006 and 2005 are immaterial.
Notes to the Financial Statements 329
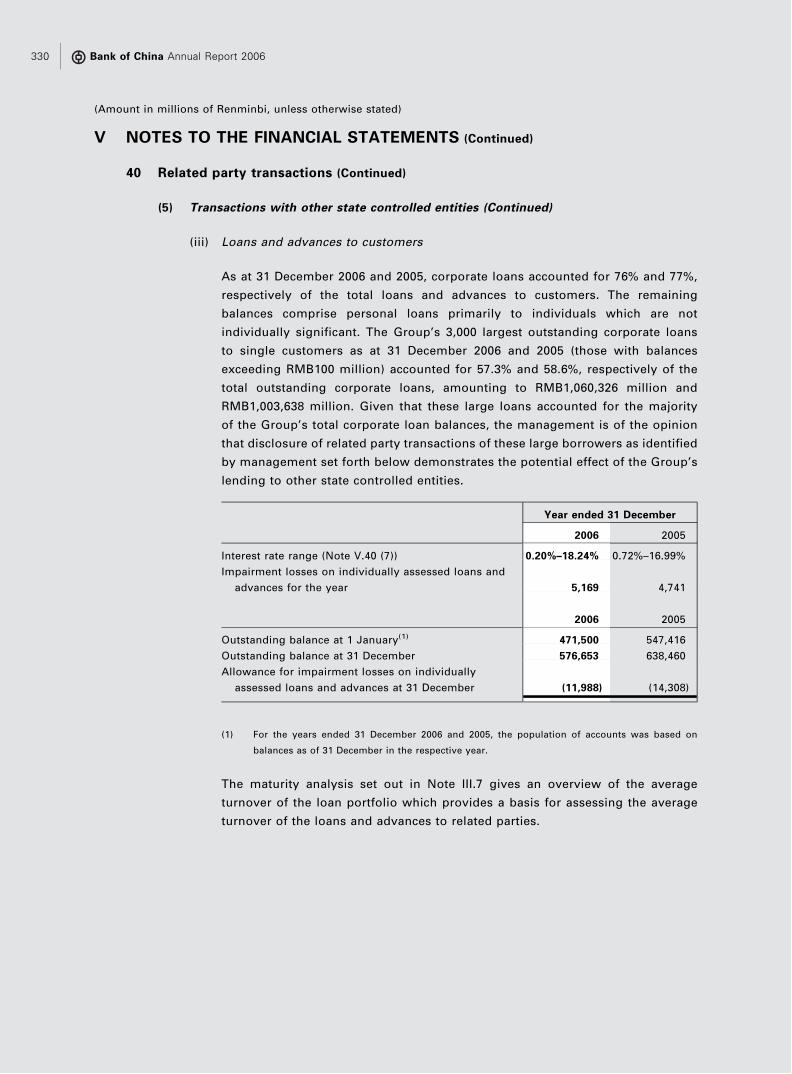
V NOTES TO THE FINANCIAL STATEMENTS (Continued)
40 Related party transactions (Continued)
(5) Transactions with other state controlled entities (Continued)
(iii) Loans and advances to customers
As at 31 December 2006 and 2005, corporate loans accounted for 76% and 77%,
respectively of the total loans and advances to customers. The remaining
balances comprise personal loans primarily to individuals which are not
individually significant. The Group’s 3,000 largest outstanding corporate loans
to single customers as at 31 December 2006 and 2005 (those with balances
exceeding RMB100 million) accounted for 57.3% and 58.6%, respectively of the
total outstanding corporate loans, amounting to RMB1,060,326 million and
RMB1,003,638 million. Given that these large loans accounted for the majority
of the Group’s total corporate loan balances, the management is of the opinion
that disclosure of related party transactions of these large borrowers as identified
by management set forth below demonstrates the potential effect of the Group’s
lending to other state controlled entities.
Year ended 31 December
2006 2005
Interest rate range (Note V.40 (7)) 0.20%–18.24% 0.72%–16.99%
Impairment losses on individually assessed loans and
advances for the year 5,169 4,741
2006 2005
Outstanding balance at 1 January(1) 471,500 547,416
Outstanding balance at 31 December 576,653 638,460
Allowance for impairment losses on individually
assessed loans and advances at 31 December (11,988) (14,308)
(1) For the years ended 31 December 2006 and 2005, the population of accounts was based on
balances as of 31 December in the respective year.
The maturity analysis set out in Note III.7 gives an overview of the average
turnover of the loan portfolio which provides a basis for assessing the average
turnover of the loans and advances to related parties.
Bank of China Annual Report 2006330
(Amount in millions of Renminbi, unless otherwise stated)

V NOTES TO THE FINANCIAL STATEMENTS (Continued)
40 Related party transactions (Continued)
(5) Transactions with other state controlled entities (Continued)
(iv) Trading assets and investment securities
Year ended 31 December
2006 2005
Purchases during the year 276,278 192,532
Redemptions/sales during the year 245,303 95,920
Interest rate range (Note V.40 (7)) 0.48%–8.25% 0.39%–9.20%
2006 2005
Outstanding balance at 1 January 319,039 222,084
Outstanding balance at 31 December 349,173 319,039
Allowance for impairment losses at 31 December (152) (156)
(v) Due to banks and other financial institutions
Year ended 31 December
2006 2005
Interest rate range (Note V.40 (7)) 0.00%–4.82% 0.00%–3.75%
2006 2005
Outstanding balance at 1 January 87,033 54,802
Outstanding balance at 31 December 124,466 87,033
(vi) Placements from banks and other financial institutions
Year ended 31 December
2006 2005
Interest rate range (Note V.40 (7)) 0.01%–7.60% 0.00%–7.08%
2006 2005
Outstanding balance at 1 January 152,409 84,813
Outstanding balance at 31 December 104,486 152,409
Notes to the Financial Statements 331
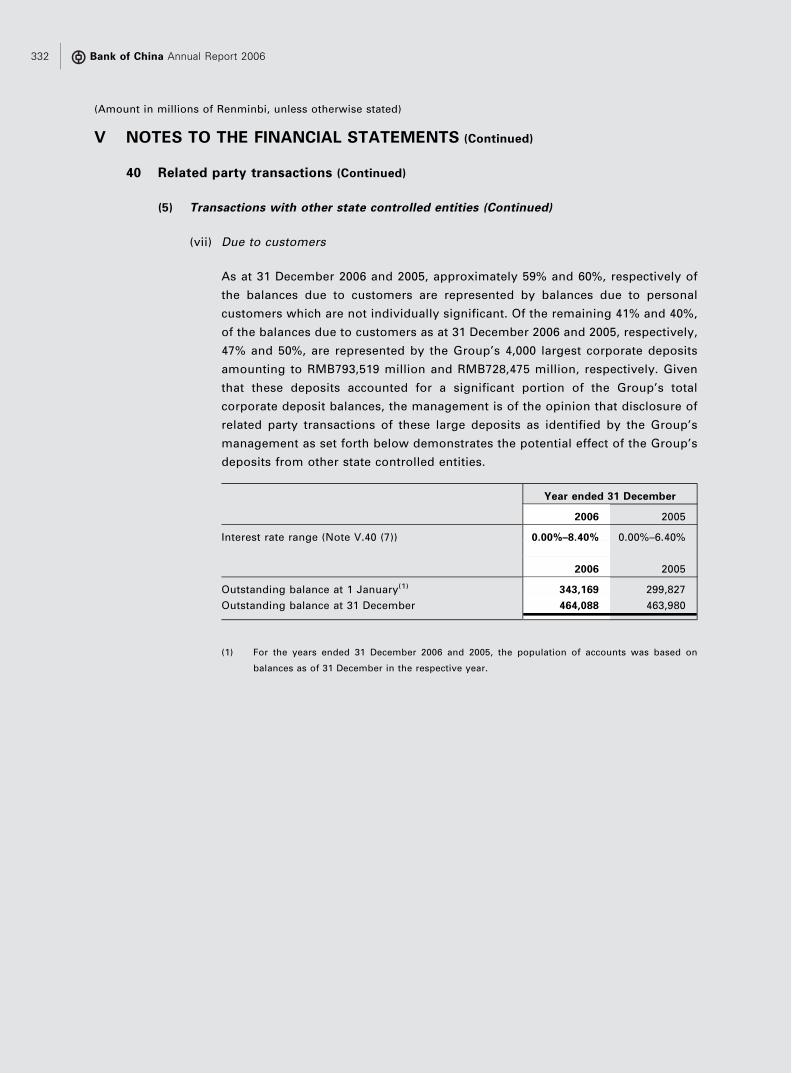
V NOTES TO THE FINANCIAL STATEMENTS (Continued)
40 Related party transactions (Continued)
(5) Transactions with other state controlled entities (Continued)
(vii) Due to customers
As at 31 December 2006 and 2005, approximately 59% and 60%, respectively of
the balances due to customers are represented by balances due to personal
customers which are not individually significant. Of the remaining 41% and 40%,
of the balances due to customers as at 31 December 2006 and 2005, respectively,
47% and 50%, are represented by the Group’s 4,000 largest corporate deposits
amounting to RMB793,519 million and RMB728,475 million, respectively. Given
that these deposits accounted for a significant portion of the Group’s total
corporate deposit balances, the management is of the opinion that disclosure of
related party transactions of these large deposits as identified by the Group’s
management as set forth below demonstrates the potential effect of the Group’s
deposits from other state controlled entities.
Year ended 31 December
2006 2005
Interest rate range (Note V.40 (7)) 0.00%–8.40% 0.00%–6.40%
2006 2005
Outstanding balance at 1 January(1) 343,169 299,827
Outstanding balance at 31 December 464,088 463,980
(1) For the years ended 31 December 2006 and 2005, the population of accounts was based on
balances as of 31 December in the respective year.
Bank of China Annual Report 2006332
(Amount in millions of Renminbi, unless otherwise stated)

V NOTES TO THE FINANCIAL STATEMENTS (Continued)
40 Related party transactions (Continued)
(6) Transactions with associates and joint ventures
The Group enters into banking transactions with associates and joint ventures in the
normal course of business at commercial terms. These include loans and advances,
deposit taking and such other normal banking businesses. The outstanding balances
with associates and joint ventures and related allowance for impairment losses as of
the respective year end dates, and the volume of transactions for the years ended 31
December 2006 and 2005 are stated below. The related interest income and expense
amounts are not considered significant.
(i) Loans and advances
2006 2005
Outstanding balance as of 1 January 7,240 1,246
Granted during the year 381 8,128
Repaid during the year (6,616) (989)
Write-off and other changes during the year (191) (1,145)
Outstanding balance as of 31 December 814 7,240
Allowance for impairment losses (18) (119)
(ii) Deposits
2006 2005
Outstanding balance as of 1 January 856 1,227
Received during the year 6,498 3,879
Repaid and other changes during the year (4,065) (4,250)
Outstanding balance as of 31 December 3,289 856
Notes to the Financial Statements 333

V NOTES TO THE FINANCIAL STATEMENTS (Continued)
40 Related party transactions (Continued)
(6) Transactions with associates and joint ventures (Continued)
(iii) Trading assets and investment securities
2006 2005
Purchases during the year — 1,307
Redemptions/sales during the year 188 1,123
Interest rate range (Note V.40 (7)) 2.70–2.92% 1.61–2.92%
2006 2005
Outstanding balance at 1 January 188 —
Outstanding balance at 31 December — 188
(7) Interest rate
Interest rate disclosed in Note V.40(2) to (6) varies across product groups and
transactions depending on maturity, credit risk of the counterparty and currency. In
particular, given local market conditions, the spread of certain significant or long dated
transactions can vary across the market.
(8) Transactions with key management personnel
Key management personnel are those persons having authority and responsibility for
planning, directing and controlling the activities of the Group, directly or indirectly,
including Directors and Executive officers.
The Group enters into banking transactions with key management personnel in the
normal course of business. During 2006 and 2005, there were no material transactions
and balances with key management personnel on an individual basis.
The key management compensation for the year ended 31 December 2006 and 2005 is
detailed as follows:
Year ended 31 December
2006 2005
Short-term employment benefits 32 30
Post-employment benefits 1 1
Total 33 31
Included in the above key management compensation are RMB3.90 million and
RMB3.34 million paid by Huijin in 2006 and 2005, respectively.
Bank of China Annual Report 2006334
(Amount in millions of Renminbi, unless otherwise stated)

V NOTES TO THE FINANCIAL STATEMENTS (Continued)
41 Balances with subsidiaries
Included in the following captions of the Bank’s Balance sheets are balances with
subsidiaries:
As at 31 December
2006 2005
Due from banks 3,234 5,154
Placements with other banks and financial institutions 36,673 27,128
Due to other banks (4,111) (6,787)
Placements from other banks and financial institutions (11,647) (13,441)
42 Acquisition of subsidiaries
On 15 December 2006, Bank of China Group Investment Limited, a wholly owned subsidiary
of the Bank, acquired 100% of the share capital of SALE for cash consideration of USD978
million (RMB7,627 million equivalent). See Note V.20.
The operating income of the acquired company was not significant to the Group for the year
ended 31 December 2006.
The details of the fair value of the assets and liabilities acquired and goodwill arising as at 15
December 2006 are as follows:
Fair value
Acquiree’s
carrying
amount
Cash and cash equivalents 2,254 2,254
Property and equipment 21,901 21,693
Intangible assets 1,856 —
Other assets 428 428
Deferred income tax liabilities (777) (260)
Other liabilities (19,910) (19,910)
Net assets acquired 5,752 4,205
Goodwill (Note V.24) 1,875
Total purchase consideration paid by cash 7,627
Less: Cash and cash equivalents in subsidiary acquired (2,254)
Net cash outflow on acquisition 5,373
Notes to the Financial Statements 335

V NOTES TO THE FINANCIAL STATEMENTS (Continued)
42 Acquisition of subsidiaries (Continued)
The goodwill is attributable to the high profitability of the acquired business and the
significant synergies expected to arise. Fair value of assets and liabilities acquired were
based on discounted cash flow models.
There was no provision required in connection with this acquisition.
43 Events after the balance sheet date
(1) On 16 March 2007, the National People’s Congress approved the new PRC Enterprise
Income Tax Law. This legislation reduces the enterprise income tax rate for domestic
enterprises from 33% to 25% with effect from 2008. This reduction in enterprise income
tax rate will directly reduce the Group’s effective tax rate, and the Group will benefit
from this prospectively from 2008. The tax rate reduction will also affect the carrying
value of the net deferred tax assets of the Group’s domestic operations as IAS 12
requires deferred tax items to be written down to reflect future realization at the newly
enacted tax rate of 25% upon approval by the National People’s Congress. The Group
has performed a preliminary assessment based on the relevant net deferred tax asset
balance as at 31 December 2006 and estimated that the amount of write-down will be
approximately RMB4.4 billion.
(2) Subsequent to the balance sheet date, the Bank exercised three tranches of the Huijin
option, having a notional amount of USD4.5 billion and also entered into certain
foreign exchange spot transactions of USD6.8 billion to further reduce its net foreign
currency exposure. See Note III.5 (i).
Concurrently the Bank entered into a series of CIRS, having a notional amount of
USD11.3 billion. See Note III.5 (i).
Bank of China Annual Report 2006336
(Amount in millions of Renminbi, unless otherwise stated)

1 LIQUIDITY RATIOS
As at 31 December
2006 2005
RMB current assets to RMB current liabilities 37.65% 48.92%
Foreign currency current assets to foreign currency current liabilities 64.14% 87.36%
The above liquidity ratios are calculated in accordance with the formula promulgated by the PBOC
and CBRC and based on the financial information prepared in accordance with PRC GAAP as at 31
December 2006 and 2005.
The basis of calculation for the 2006 liquidity ratios has taken into consideration the changes
pursuant to Yin Jian Fa [2006] No. 175 issued by the CBRC whereby ‘‘Other liabilities due within
one month’’ are also included as current liabilities and hence reducing the liquidity ratios so
derived compared to 2005.
2 CAPITAL ADEQUACY RATIOS
As at 31 December
2006 2005
Core capital adequacy ratio 11.44% 8.08%
Capital adequacy ratio 13.59% 10.42%
The above capital adequacy ratios are calculated in accordance with the rules and regulations
promulgated by the CBRC and based on the financial information prepared in accordance with
PRC GAAP as at 31 December 2006 and 2005.
Unaudited Supplementary Financial Information(Amount in millions of Renminbi, unless otherwise stated)
Unaudited Supplementary Financial Information 337
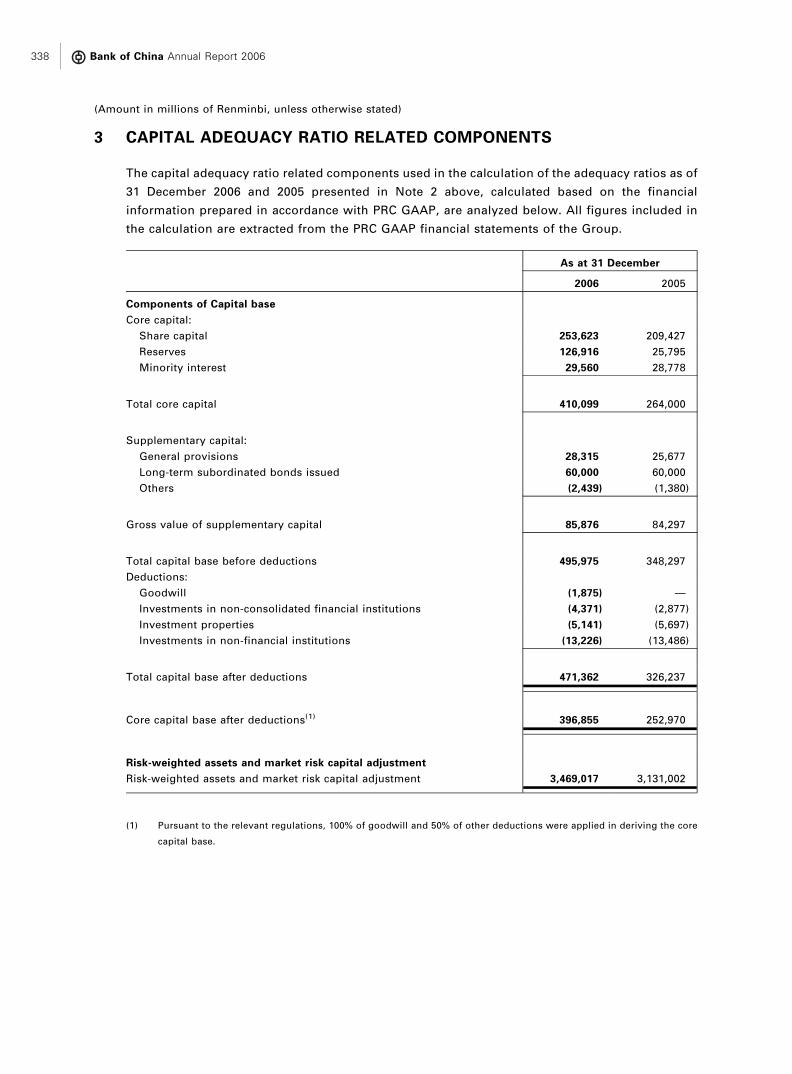
3 CAPITAL ADEQUACY RATIO RELATED COMPONENTS
The capital adequacy ratio related components used in the calculation of the adequacy ratios as of
31 December 2006 and 2005 presented in Note 2 above, calculated based on the financial
information prepared in accordance with PRC GAAP, are analyzed below. All figures included in
the calculation are extracted from the PRC GAAP financial statements of the Group.
As at 31 December
2006 2005
Components of Capital base
Core capital:
Share capital 253,623 209,427
Reserves 126,916 25,795
Minority interest 29,560 28,778
Total core capital 410,099 264,000
Supplementary capital:
General provisions 28,315 25,677
Long-term subordinated bonds issued 60,000 60,000
Others (2,439) (1,380)
Gross value of supplementary capital 85,876 84,297
Total capital base before deductions 495,975 348,297
Deductions:
Goodwill (1,875) —
Investments in non-consolidated financial institutions (4,371) (2,877)
Investment properties (5,141) (5,697)
Investments in non-financial institutions (13,226) (13,486)
Total capital base after deductions 471,362 326,237
Core capital base after deductions(1) 396,855 252,970
Risk-weighted assets and market risk capital adjustment
Risk-weighted assets and market risk capital adjustment 3,469,017 3,131,002
(1) Pursuant to the relevant regulations, 100% of goodwill and 50% of other deductions were applied in deriving the core
capital base.
Bank of China Annual Report 2006338
(Amount in millions of Renminbi, unless otherwise stated)

4 CURRENCY CONCENTRATIONS OTHER THAN RMB
Equivalent in millions of RMB
USD HKD Others Total
As at 31 December 2006
Spot assets 1,293,462 673,839 323,070 2,290,371
Spot liabilities (698,037) (692,564) (281,209) (1,671,810)
Forward purchases 354,019 132,513 144,966 631,498
Forward sales (694,752) (47,811) (182,891) (925,454)
Net option position* (133,930) (1,446) (1,456) (136,832)
Net long position 120,762 64,531 2,480 187,773
Net structural position 23,300 23,173 4,072 50,545
As at 31 December 2005
Spot assets 1,098,680 635,734 300,855 2,035,269
Spot liabilities (669,188) (628,115) (277,674) (1,574,977)
Forward purchases 276,202 141,283 160,668 578,153
Forward sales (367,380) (65,733) (172,536) (605,649)
Net option position* (141,639) (1,637) (1,834) (145,110)
Net long position 196,675 81,532 9,479 287,686
Net structural position 320 21,373 3,745 25,438
* The net option position is calculated using the delta equivalent approach as set out in the requirements of the banking
return of the Hong Kong Monetary Authority.
Included in the spot assets and liabilities and net long position above are those positions related
to the Group’s overseas subsidiaries and branches. Such positions are excluded from the net
structural position above.
Unaudited Supplementary Financial Information 339

4 CURRENCY CONCENTRATIONS OTHER THAN RMB (Continued)
On the basis that these positions are excluded from the spot assets, spot liabilities and net long
position; and are included in the net structural position, the positions would be as follows. All
exchange differences arising from the translation of the net structural position shown below are
recognized under the ‘‘Currency translation differences’’ as a separate component of equity, and
therefore do not impact the Group’s profit or loss.
Equivalent in millions of RMB
USD HKD Others Total
As at 31 December 2006
Net long position 142,546 (9,691) (8,317) 124,538
Net structural position 1,516 97,395 14,869 113,780
As at 31 December 2005
Net long position 197,107 9,868 (74) 206,901
Net structural position (112) 93,037 13,298 106,223
5 CROSS-BORDER CLAIMS
The Group is principally engaged in business operations within Chinese Mainland, and regards all
claims on third parties outside Chinese Mainland as cross-border claims.
Cross-border claims include balances with central banks, placements with banks and other
financial institutions, government certificates of indebtedness for bank notes issued, trading
assets and other financial instruments at fair value through profit or loss, loans and advances to
customers and investment securities.
Bank of China Annual Report 2006340
(Amount in millions of Renminbi, unless otherwise stated)

5 CROSS-BORDER CLAIMS (Continued)
Cross-border claims have been disclosed by different country or geographical areas. A country or
geographical area is reported where it constitutes 10% or more of the aggregate amount of cross-
border claims, after taking into account any risk transfers. Risk transfer is only made if the claims
are guaranteed by a party in a country which is different from that of the counterparty or if the
claims are on an overseas branch of a bank whose head office is located in another country.
Banks and
other financial
institutions
Public
sector
entities Others Total
As at 31 December 2006
Asia Pacific excluding Chinese Mainland
— Hong Kong 22,622 22,438 351,754 396,814
— Other Asia Pacific locations 122,713 60,160 58,340 241,213
145,335 82,598 410,094 638,027
North and South America 270,758 239,871 168,179 678,808
Europe 357,164 74,259 62,525 493,948
Middle East and Africa 1,936 314 3,137 5,387
775,193 397,042 643,935 1,816,170
Banks and
other financial
institutions
Public
sector
entities Others Total
As at 31 December 2005
Asia Pacific excluding Chinese Mainland
— Hong Kong 26,914 28,355 346,806 402,075
— Other Asia Pacific locations 113,010 49,388 52,757 215,155
139,924 77,743 399,563 617,230
North and South America 99,082 247,242 157,515 503,839
Europe 327,745 14,108 58,315 400,168
Middle East and Africa 1,463 977 3,494 5,934
568,214 340,070 618,887 1,527,171
Unaudited Supplementary Financial Information 341

6 OVERDUE ASSETS
For the purposes of the tables below, loans and advances to customers and placements with
banks and other financial institutions are considered overdue if either principal or interest
payment is overdue.
(i) Gross amount of overdue loans and advances to customers
As at 31 December
2006 2005
Gross loans and advances to customers which have been
overdue for:
— between 3 and 6 months 8,957 14,012
— between 6 and 12 months 15,203 21,778
— over 12 months 50,058 40,231
74,218 76,021
Percentage:
— between 3 and 6 months 0.37% 0.63%
— between 6 and 12 months 0.63% 0.97%
— over 12 months 2.06% 1.80%
3.06% 3.40%
(ii) Gross amount of overdue placements with banks and other financial institutions
As at 31 December
2006 2005
Gross placements with banks and other financial institutions which
have been overdue for:
— between 3 and 6 months — —
— between 6 and 12 months — —
— over 12 months 499 546
499 546
Percentage:
— between 3 and 6 months — —
— between 6 and 12 months — —
— over 12 months 0.12% 0.16%
0.12% 0.16%
Bank of China Annual Report 2006342
(Amount in millions of Renminbi, unless otherwise stated)

6 OVERDUE ASSETS (Continued)
(iii) Overdue loans and advances to customers by geographical area
As at 31 December
2006 2005
Chinese Mainland 114,003 118,032
Hong Kong and Macau 4,360 8,260
Other overseas locations 191 179
118,554 126,471
Less: gross loans and advances to customers which have been
overdue for less than 3 months (44,336) (50,450)
74,218 76,021
Unaudited Supplementary Financial Information 343
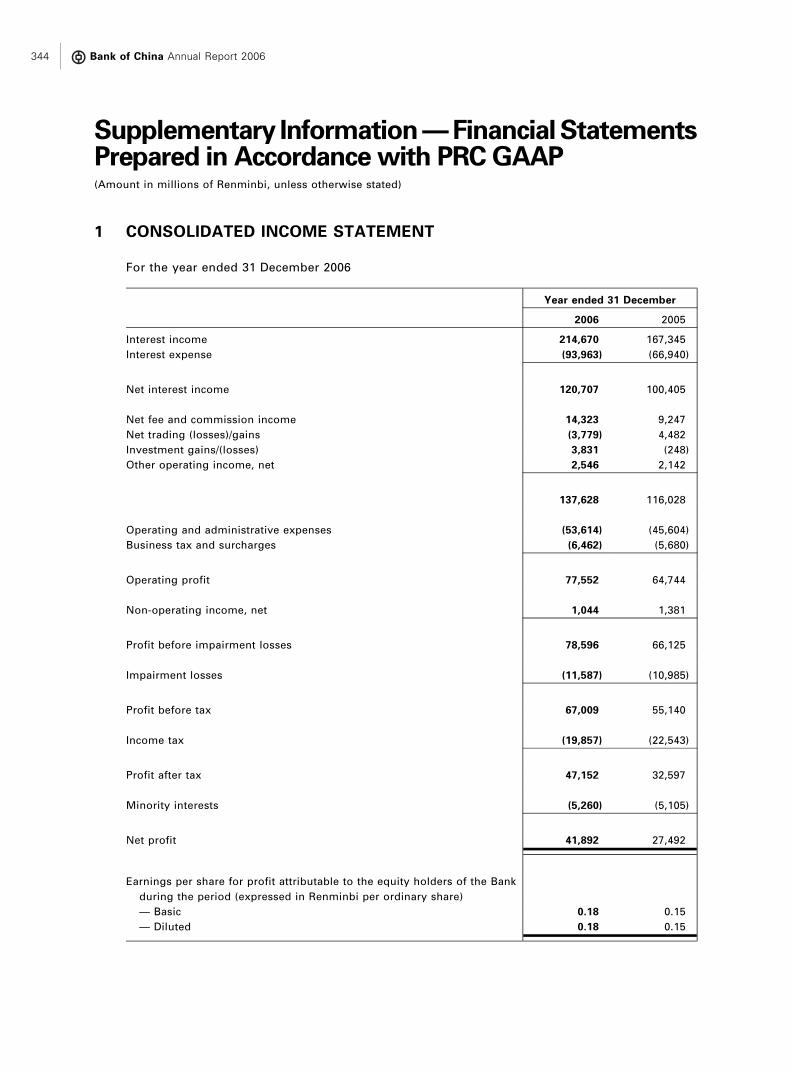
1 CONSOLIDATED INCOME STATEMENT
For the year ended 31 December 2006
Year ended 31 December
2006 2005
Interest income 214,670 167,345
Interest expense (93,963) (66,940)
Net interest income 120,707 100,405
Net fee and commission income 14,323 9,247
Net trading (losses)/gains (3,779) 4,482
Investment gains/(losses) 3,831 (248)
Other operating income, net 2,546 2,142
137,628 116,028
Operating and administrative expenses (53,614) (45,604)
Business tax and surcharges (6,462) (5,680)
Operating profit 77,552 64,744
Non-operating income, net 1,044 1,381
Profit before impairment losses 78,596 66,125
Impairment losses (11,587) (10,985)
Profit before tax 67,009 55,140
Income tax (19,857) (22,543)
Profit after tax 47,152 32,597
Minority interests (5,260) (5,105)
Net profit 41,892 27,492
Earnings per share for profit attributable to the equity holders of the Bank
during the period (expressed in Renminbi per ordinary share)
— Basic 0.18 0.15
— Diluted 0.18 0.15
Supplementary Information—FinancialStatementsPrepared in Accordancewith PRCGAAP(Amount in millions of Renminbi, unless otherwise stated)
Bank of China Annual Report 2006344

2 CONSOLIDATED BALANCE SHEET
As at 31 December 2006
As at 31 December
ASSETS 2006 2005
Cash 31,110 28,644
Precious metals 42,873 30,314
Due from central banks 379,631 316,941
Government certificates of indebtedness for bank notes issued 36,626 35,586
Trading and other debt securities at fair value through profit or loss 110,634 107,271
Derivative financial instruments 24,837 16,808
Due from and placements with banks and other financial institutions 407,840 344,537
Debt securities 1,768,784 1,562,320
Loans and advances to customers 2,431,806 2,235,046
Less: Provision for loan losses (94,293) (83,153)
Interest receivable 24,306 20,408
Equity investments 18,280 15,393
Fixed assets 91,808 72,978
Construction in progress 6,585 3,342
Deferred tax assets 17,605 17,561
Other assets 26,841 18,810
Total assets 5,325,273 4,742,806
Supplementary Information — Financial Statements Prepared in Accordance with PRC GAAP 345

2 CONSOLIDATED BALANCE SHEET (Continued)
As at 31 December 2006 (Continued)
As at 31 December
LIABILITIES 2006 2005
Due to central banks 42,374 30,055
Bank notes in circulation 36,823 35,731
Derivative financial instruments and liabilities at fair value through profit
or loss 113,048 91,174
Due to and placements from banks and other financial institutions 321,381 345,233
Deposits from customers 4,095,422 3,703,777
Interest payable 33,834 27,024
Other borrowings 63,398 52,164
Bonds issued 60,173 60,179
Deferred tax liabilities 1,104 184
Other liabilities 139,902 134,665
Total liabilities 4,907,459 4,480,186
Minority interests 29,560 28,778
SHAREHOLDER’S EQUITY
Share capital 253,839 209,427
Capital reserve 76,549 3,978
Surplus reserve 10,380 5,987
General reserve and statutory reserve of subsidiary 13,934 5,109
Undistributed profits 39,884 12,585
Reserve for fair value changes of available-for-sale securities (2,439) (1,380)
Currency translation differences (3,677) (1,864)
Treasury shares (216) —
Total shareholder’s equity 388,254 233,842
Total liabilities and shareholder’s equity 5,325,273 4,742,806
Bank of China Annual Report 2006346
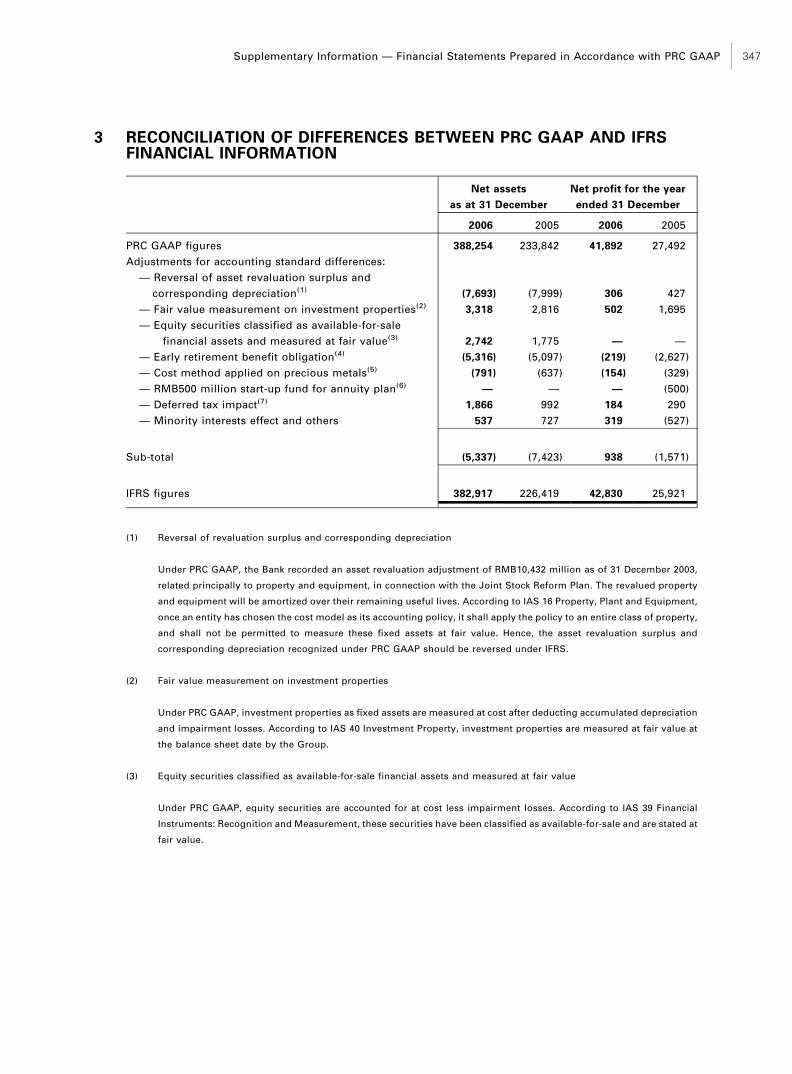
3 RECONCILIATION OF DIFFERENCES BETWEEN PRC GAAP AND IFRSFINANCIAL INFORMATION
Net assets
as at 31 December
Net profit for the year
ended 31 December
2006 2005 2006 2005
PRC GAAP figures 388,254 233,842 41,892 27,492
Adjustments for accounting standard differences:
— Reversal of asset revaluation surplus and
corresponding depreciation(1) (7,693) (7,999) 306 427
— Fair value measurement on investment properties(2) 3,318 2,816 502 1,695
— Equity securities classified as available-for-sale
financial assets and measured at fair value(3) 2,742 1,775 — —
— Early retirement benefit obligation(4) (5,316) (5,097) (219) (2,627)
— Cost method applied on precious metals(5) (791) (637) (154) (329)
— RMB500 million start-up fund for annuity plan(6) — — — (500)
— Deferred tax impact(7) 1,866 992 184 290
— Minority interests effect and others 537 727 319 (527)
Sub-total (5,337) (7,423) 938 (1,571)
IFRS figures 382,917 226,419 42,830 25,921
(1) Reversal of revaluation surplus and corresponding depreciation
Under PRC GAAP, the Bank recorded an asset revaluation adjustment of RMB10,432 million as of 31 December 2003,
related principally to property and equipment, in connection with the Joint Stock Reform Plan. The revalued property
and equipment will be amortized over their remaining useful lives. According to IAS 16 Property, Plant and Equipment,
once an entity has chosen the cost model as its accounting policy, it shall apply the policy to an entire class of property,
and shall not be permitted to measure these fixed assets at fair value. Hence, the asset revaluation surplus and
corresponding depreciation recognized under PRC GAAP should be reversed under IFRS.
(2) Fair value measurement on investment properties
Under PRC GAAP, investment properties as fixed assets are measured at cost after deducting accumulated depreciation
and impairment losses. According to IAS 40 Investment Property, investment properties are measured at fair value at
the balance sheet date by the Group.
(3) Equity securities classified as available-for-sale financial assets and measured at fair value
Under PRC GAAP, equity securities are accounted for at cost less impairment losses. According to IAS 39 Financial
Instruments: Recognition and Measurement, these securities have been classified as available-for-sale and are stated at
fair value.
Supplementary Information — Financial Statements Prepared in Accordance with PRC GAAP 347

3 RECONCILIATION OF DIFFERENCES BETWEEN PRC GAAP AND IFRSFINANCIAL INFORMATION (Continued)
(4) Early retirement benefit obligation
According to the MOF requirement, the early retirement benefit expenditures during the early retirement period (from
early retirement date to legal retirement date) to those employees who accepted an early retirement arrangement is
recognized on a cash basis by the Group. According to IAS 19 Employee Benefits, the early retirement benefit at the
balance sheet date should be recorded based on the present value of the future payment obligation after adjusting for
actuarial gain or loss and past servicing cost.
(5) Cost method applied on precious metals
According to the accounting practice of the PRC banking industry, all precious metals are initially recognized at cost
and subsequently re-measured at fair value at the balance sheet date by the Group. According to IAS 2 Inventories,
precious metals that are not related to the Group’s precious metals trading activities are carried at cost.
(6) RMB500 million start-up fund for annuity plan
BOC established an annuity plan to provide supplementary retirement benefits to its domestic current employees.
Huijin, as the parent company, committed a start-up fund of RMB500 million for the annuity plan in 2005. IFRS requires
this amount to be recorded in operating expenses and capital reserve.
(7) Deferred tax impact
Under IFRS, deferred income tax is provided using the balance sheet liability method, on temporary differences arising
between the tax bases of assets and liabilities and their carrying amounts in the consolidated financial statements.
Under PRC GAAP, deferred income tax is provided using the liability method, on timing differences between the
Group’s taxable profits and its results as stated in the financial statements that arise from the inclusion of gains and
losses in tax assessments in periods different from those in which they are recognised in the financial statements.
The difference between PRC GAAP and IFRS in 2006 mainly represents the deferred income tax credited or charged
directly to equity under IFRS relating to the fair value re-measurement of available-for-sale investments charged or
credited directly to equity.
Bank of China Annual Report 2006348

I. The original Financial Statements with the signatures of the Bank’s Chairman and President.
II. The original auditor’s report with the signature of the accounting firm.
III. The originals of all documents and announcements published by the Bank on the Hong Kong
newspapers during the report period.
IV. The Articles of Association of the Bank.
Documents Available for Inspection
Documents Available for Inspection 349
Financial Calendar for 2007
Announcement of 2006 annual result 23 March 2007
Annual report of 2006 To be delivered to H Share shareholders in late April 2007
Annual General Meeting of 2006 To be held on 14 June 2007
Announcement of 2007 interim results To be announced not later than 31 August 2007
Annual General Meeting
The Bank is scheduled to hold the Annual General Meeting in Central Garden Hotel, No. 18
Gaoliangqiaoxiejie, Xizhimenwai Ave., Hai Dian District, Beijing, China at 3 : 00 pm on 14 June 2007
(Thursday).
Dividends
The Board has recommended a final dividend of RMB0.04 per share subject to the approval of
shareholders at the Annual General Meeting of 2006.
Share Information
Listing
The Bank’s ordinary shares were listed on the Hong Kong Stock Exchange and Shanghai Stock
Exchange on 1 June and 5 July 2006 respectively.
Ordinary Shares
Issued shares: 253,839,162,009 shares
Market Value
As of the last trading day in 2006 (29 December 2006), the Bank’s market value was RMB1,291.7 billion
(equivalent to HKD1,285.6 billion).
Share Price
Closing price of H Shares on 29 December 2006 : HKD4.27
Closing price of A Shares on 29 December 2006 : RMB5.43
Highest price of H Shares in 2006 : HKD4.28
Lowest price of H Shares in 2006: HKD2.95
Highest price of A Shares in 2006 : RMB5.43
Lowest price of A Shares in 2006: RMB3.08
Reference for Shareholders
Bank of China Annual Report 2006350
Stock Codes
Stock name: Bank of China
H Shares:
Hong Kong Stock Exchange 3988
Reuters 3988.HK
Bloomberg 3988 HK
A Shares:
Shanghai Stock Exchange 601988
Reuters 601988.SS
Bloomberg 601988 CH
Shareholder Inquiry
If a shareholder intends to inquire share transfer, changes of name or address, loss of share certificate
and other information concerning the shares held, he/she may write to the Bank at the following
address:
H Shares:
Computershare Hong Kong Investor Services Limited
Rooms 1806–1807, 18/F, Hopewell Center, 183 Queen’s Road East, Wan Chai, Hong Kong
Telephone: (852) 2862 8555
Fax: (852) 2865 0990/(852) 2529 6087
E-mail: [email protected]
A Shares:
Shanghai Branch of China Securities Depository and Clearing Corporation Limited
3/F, China Insurance Building
166 East Lujiazui Road, Pudong New Area, Shanghai
Telephone: (86)021-38874800
Credit Ratings (Long Term)
Fitch Ratings: A–
Moody’s Investors Services: A2
Rating and Investment Information, Inc.: A
Standard & Poor’s: BBB+
Dagong Global Credit Rating Co., Ltd.: AAA
Reference for Shareholders 351

Index Constituent
Hang Seng Index (with effect from 4 December 2006)
Hang Seng China H-Financial Index (launched on 27 November 2006)
Hang Seng China Enterprises Index
Hang Seng Composite Index(HSCI) Series
Hang Seng Freefloat Index (HSFI) Series
MSCI China Index Series
Shanghai Stock Exchange Index Series
FTSE/Xinhua China 25 Index
FTSE/Xinhua Hong Kong Index
FTSE Index Series
Investor Inquiry
For H Share investors, please contact:
Investor Relation Team (Hong Kong) of Bank of China Limited
52/F, Bank of China Tower, 1 Garden Road, Hong Kong
Telephone: (852) 2826 6469
Fax: (852) 2865 0990/(852) 2529 6087
E-mail: [email protected]
For A Share investors, please contact:
Investor Relation Team (Beijing) of Bank of China Limited
9/F, Bank of China Building, 1 Fuxingmen Nei Dajie, Beijing, China
Telephone: (86)010-6659 4626
Fax: (86)010-6659 4579
E-mail: [email protected]
Other Information
You may obtain a copy of the annual report prepared in accordance with the International Financial
Reporting Standards by writing to the Bank’s H Share Registrar (address: Rooms 1806–1807, 18/F,
Hopewell Center, 183 Queen’s Road East, Wan Chai, Hong Kong), and the annual report prepared in
accordance with PRC GAAP by writing to the Bank’s business place. The English and Chinese versions
of the annual report for 2006 are available on the following websites: www.boc.cn, www.sse.com.cn,
and www.hkex.com.hk.
If you have any queries about how to obtain copies of the annual report or how to access the document
on the Bank’s websites, please call the Bank’s hotlines at (852) 2862 8633 or (86)010-6659 6688.
Bank of China Annual Report 2006352

The organizational chart1 of the Group as at 31 December 2006 is as follows:
Notes:
1 Prepared based on the interests recorded in the register maintained pursuant to section 336 of the SFO.
2 UBS AG also holds 1,084,612,402 shares of short position, representing 0.43% of the Bank’s total issued share capital.
3 Incorporated in the PRC.
4 Listed on the Hong Kong Stock Exchange.
Organizational Chart
Organizational Chart 353

BRANCHES, SUB-BRANCHES AND SUBSIDIARIES AUTHORISED TO HANDLEINTERNATIONAL BUSINESS
HEADOFFICE
1 FUXINGMENNEI DAJIE,BEIJING 100818, CHINASWIFT: BKCH CN BJTLX: 22254 BCHO CNTEL: (86) 010-66596688FAX: (86) 010-66593777POST CODE: 100818Website: www.boc.cn
ANHUI PROVINCE
ANHUI BRANCH
313 MID-CHANGJIANG ROAD,HEFEI 230061, ANHUI PROV., CHINASWIFT: BKCH CN BJ 780TEL: (86) 0551-2926114FAX: (86) 0551-2926993POST CODE: 230061
WUHU BRANCH
258 JIU HUA SHAN ROAD,WUHU241000, ANHUI PROV., CHINASWIFT: BKCH CN BJ 79ATLX: 91120WHBOC CNTEL: (86) 0553-3830735FAX: (86) 0553-3823492POST CODE: 241000
MAANSHAN BRANCH
INTERNATIONAL FINANCEBUILDING, 1 HUAYU ROAD,MA_ANSHAN 243011,ANHUI PROV., CHINATEL: (86) 0555-2345674FAX: (86) 0555-2345674POST CODE: 243011
BEIJING CITY
BEIJING BRANCH
8 YABAO LU, CHAOYANGDISTRICT,BEIJING 100020, CHINASWIFT: BKCH CN BJ 110TEL: (86) 010-65199988FAX: (86) 010-65199572
010-65199586POST CODE: 100020
BOC INTERNATIONAL HOLDINGSLIMITED BEIJING REPRESENTATIVEOFFICE
15/F., TOWER2, YINGTAI BUSINESS CENTER,NO.28, FINANCE STREET, XICHENG DISTRICTBEIJING 100032, CHINATEL: (86) 010-66229000FAX: (86) 010-66578950POST CODE: 100032Website: www.bocigroup.comEmail: [email protected]
BOC GROUP LIFE ASSURANCE CO., LTD.BEIJING REPRESENTATIVE OFFICE
8/F., BOC BLDG., 1 FUXINGMENNEIDAJIE, BEIJING 100818, CHINATEL: (86) 010-66533316FAX: (86) 010-66080048POST CODE: 100818Email: [email protected]
BANK OF CHINA INSURANCE CO., LTD.
12/F., BOC BLDG., 1 FUXINGMENNEI DAJIE,XICHENGDISTRICT, BEIJING 100818, CHINATEL: (86) 010-66596288FAX: (86) 010-66596301POST CODE: 100818Website: www.bocins.com
CHONGQING CITY
CHONGQING BRANCH
218 ZHONG SHAN 1 ROAD,YU ZHONGDISTRICT,CHONGQING 400013, CHINASWIFT: BKCH CN BJ 59ATEL: (86) 023-63889471
023-63889461FAX: (86) 023-63889585POST CODE: 400013
FUJIAN PROVINCE
FUJIAN BRANCH
BOC BLDG., 136WUSI ROAD,FUZHOU 350003,FUJIAN PROV., CHINASWIFT: BKCH CN BJ 720TLX: 92109 BOCFJ CNTEL: (86) 0591-87848741
0591-87849504FAX: (86) 0591-87804522POST CODE: 350003
XIAMEN BRANCH
BOC BLDG., 40 NORTH HUBIN ROAD,XIAMEN 361012,FUJIAN PROV., CHINASWIFT: BKCH CN BJ 73ATLX: 923012 XMBOC CNTEL: (86) 0592-5066415FAX: (86) 0592-5066443POST CODE: 361012
FUZHOUSHI SHIZHONG SUB-BRANCH
27 GUTIAN ROAD, GULOUDISTRICT,FUZHOU 350005, FUJIAN PROV., CHINASWIFT: BKCH CN BJ 73ETEL: (86) 0591-83321310
0591-83318034FAX: (86) 0591-83321700POST CODE: 350005
FUQING SUB-BRANCH
SHENGTIAN SQUARE,QINGCHANG ROAD,FUQING 350300, FUJIAN PROV., CHINASWIFT: BKCH CN BJ 73LTLX: 924006 BOCFQ CNTEL: (86) 0591-85169031
0591-85239999FAX: (86) 0591-85226149POST CODE: 350300
PUTIAN BRANCH
933WENXIAN ROAD,CHENG XIANG DISTRICT,PUTIAN 351100, FUJIAN PROV., CHINASWIFT: BKCH CN BJ 73CTLX: 925003 CBKPT CNTEL: (86) 0594-2698904
0594-2695974FAX: (86) 0594-2690761POST CODE: 351100
QUANZHOU BRANCH
BOC BLDG. FENGZE JIE,QUANZHOU 362000,FUJIAN PROV., CHINASWIFT: BKCH CN BJ 73BTEL: (86) 0595-21152162FAX: (86) 0595-22110636POST CODE: 362000
ZHANGZHOU BRANCH
2 SOUTH YUANGUANG ROAD,XIANG CHENG DISTRICT,ZHANG ZHOU 363000,FUJIAN PROV., CHINASWIFT: BKCH CN BJ 73DTEL: (86) 0596-2972809FAX: (86) 0596-2972867POST CODE: 363000
GANSU PROVINCE
GANSU BRANCH
525 TIANSHUI SOUTH ROAD,LANZHOU 730000,GANSU PROV., CHINASWIFT: BKCH CN BJ 660TEL: (86) 0931-8410884FAX: (86) 0931-8410884POST CODE: 730000
GUANGDONG PROVINCE
GUANGDONG BRANCH
197 DONGFENGXI LU,GUANGZHOU 510180,GUANGDONG PROV., CHINASWIFT: BKCH CN BJ 400TLX: 441042 GZBOC CNTEL: (86) 020-83338080FAX: (86) 020-83344066POST CODE: 510180
List of Domestic and Overseas Operations
Bank of China Annual Report 2006354

GUANGZHOUZHUJIANG SUB-BRANCH
DEVELOPMENT CENTER,LINJIANG DADAO, 3,GUANGZHOU,GUANGDONG PROV., CHINATEL: (86) 020-83340998FAX: (86) 020-37851023POST CODE: 510623
ZHUHAI BRANCH
1148 YUEHAI EAST ROAD,GONGBEI, ZHUHAI 519020,GUANGDONG PROV., CHINASWIFT: BKCH CN BJ 45PTLX: 456228 ZUBOC CNTEL: (86) 0756-8883333FAX: (86) 0756-8883366POST CODE: 519020
SHANTOU BRANCH
98 JIN SHA ROAD, SHANTOU 515041,GUANGDONG PROV., CHINASWIFT: BKCH CN BJ 41ATEL: (86) 0754-8262955FAX: (86) 0754-8262843POST CODE: 515041
CHAOZHOU BRANCH
BANK OF CHINA BLDG.,CROSSING OF CHAOZHOU ROAD,CHAOZHOU 521011,GUANGDONG PROV., CHINASWIFT: BKCH CN BJ 41PTLX: 450020 CZBOC CNTEL: (86) 0768-2863008FAX: (86) 0768-2863022POST CODE: 521011
DONGGUAN BRANCH
72 GUANTAI ROAD,DONGGUAN 523072,GUANGDONG PROV., CHINATEL: (86) 0769-22819888FAX: (86) 0769-22818181POST CODE: 523072
FOSHAN BRANCH
2 RENMIN XI ROAD,CHAN CHENG DISTRICT,FOSHAN, GUANGDONG PROV., CHINASWIFT: BKCH CN BJ 44ATLX: 425011 FSBOC CNTEL: (86) 0757-82683367FAX: (86) 0757-82221638POST CODE: 528000
GUANGZHOU K. F. Q. BRANCH
2 QINGNIAN ROAD,GUANGZHOU 510730,GUANGDONG PROV., CHINASWIFT: BKCH CN BJ 42GTLX: 440802 GDZXG CNTEL: (86) 020-82215911FAX: (86) 020-82212766POST CODE: 510730
HUIZHOU BRANCH
22 MAI DI ROAD, HUIZHOU 516001,GUANGDONG PROV., CHINASWIFT: BKCH CN BJ 47ATEL: (86) 0752-2289988FAX: (86) 0752-2289525POST CODE: 516001
JIANGMEN BRANCH
22 GANGKOU ROAD, JIANGMEN529051, GUANGDONG PROV., CHINASWIFT: BKCH CN BJ 44KTEL: (86) 0750-3163160FAX: (86) 0750-3163166POST CODE: 529051
MAOMING BRANCH
13 YOUCHENG 5 LU,MAOMING 525000,GUANGDONG PROV., CHINASWIFT: BKCH CN BJ 42PTEL: (86) 0668-2889134FAX: (86) 0668-2285300POST CODE: 525000
MEIZHOU BRANCH
53 MEIJIANG 1 ROAD,MEIZHOU 514021,GUANGDONG PROV., CHINASWIFT: BKCH CN BJ 47KTEL: (86) 0753-2189333FAX: (86) 0753-2189359POST CODE: 514021
SHAOGUAN BRANCH
ZHONGYIN BUILDING,160 JIEFANG ROAD,SHAOGUAN 512000,GUANGDONG PROV., CHINASWIFT: BKCH CN BJ 46PTEL: (86) 0751-8186948FAX: (86) 0751-8883976POST CODE: 512000
YANGJIANG BRANCH
29 DONGFENG 1 LU, YANGJIANG,GUANGDONG PROV., CHINASWIFT: BKCH CN BJ 42WTEL:(86) 0662-3216110FAX:(86) 0662-3227743POST CODE: 529500
ZHANJIANG BRANCH
50 RENMIN DADAO ZHONG,ZHANJIANG 524022,GUANGDONG PROV., CHINASWIFT: BKCH CN BJ 43PTEL: (86) 0759-3189813FAX: (86) 0759-3189888POST CODE: 524022
ZHAOQING BRANCH
3 DUAN ZHOU 6 ROAD,ZHAOQING 526020,GUANGDONG PROV., CHINASWIFT: BKCH CN BJ 43ATEL: (86) 0758-2813336FAX: (86) 0758-2834311POST CODE: 526020
ZHONGSHAN BRANCH
18 ZHONG SHAN 3rd ROAD,ZHONGSHAN 528400,GUANGDONG PROV., CHINASWIFT: BKCH CN BJ 44TTEL: (86) 0760-8336688FAX: (86) 0760-8337788POST CODE: 528400
HESHAN SUB-BRANCH
228 XIN CHENG ROAD,SHAPING TOWN, HESHAN 529700,GUANGDONG PROV., CHINASWIFT: BKCH CN BJ 44NTEL: (86) 0750-8993388FAX: (86) 0750-8988411POST CODE: 529700
KAIPING SUB-BRANCH
1 ZHONG YIN ROAD,KAIPING 529300,GUANGDONG PROV., CHINASWIFT: BKCH CN BJ 44PTEL: (86) 0750-2322222FAX: (86) 0750-2311111POST CODE: 529300
NANHAI SUB-BRANCH
31 THEMIDDLE OF NANHAI DADAO,GUICHENG, NANHAI DISTRICT, FOSHAN,GUANGDONGPROV., CHINASWIFT: BKCH CN BJ 44ETEL: (86) 0757-86285268FAX: (86) 0757-86285265POST CODE: 528200
SANSHUI SUB-BRANCH
4WEN FENG ZHONGROAD,XINAN, SANSHUI DISTRICT,FOSHAN, GUANGDONG PROV., CHINASWIFT: BKCH CN BJ 44CTEL: (86) 0757-87735286FAX: (86) 0757-87732139POST CODE: 528100
SHUNDE SUB-BRANCH
2 FENG SHANXI ROAD, DALIANG JIEDAO,SHUNDE DISTRICT,FOSHAN, GUANGDONGPROV., CHINASWIFT: BKCH CN BJ 44BTEL: (86) 0757-22389881FAX: (86) 0757-22389880POST CODE: 528300
TAISHAN SUB-BRANCH
46 QIAO HU LU, TAICHENG TOWN,TAISHAN 529200,GUANGDONG PROV., CHINASWIFT: BKCH CN BJ 44MTEL: (86) 0750-5551601FAX: (86) 0750-5526820POST CODE: 529200
List of Domestic and Overseas Operations 355

XINHUI SUB-BRANCH
7 ZHUZI ROAD, HUICHENG TOWN,XINHUI 529100, GUANGDONGPROV., CHINASWIFT: BKCH CN BJ 44LTEL: (86) 0750-6622073FAX: (86) 0750-666602lPOST CODE: 529100
GUANGXI ZHUANG*
GUANGXI ZHUANG* BRANCH
39 GUCHENG ROAD, NANNING530022, GUANGXI ZHUANG*, CHINASWIFT: BKCH CN BJ 480TLX: 48122 BOCGX CNTEL: (86) 0771-2879607FAX: (86) 0771-2811267POST CODE: 530022
BEIHAI BRANCH
INTERNATIONAL FINANCIAL BUILDING,BEIHAI STREET,BEIHAI 536000, GUANGXI ZHUANG*,CHINASWIFT: BKCH CN BJ 49BTEL: (86) 0779-3061133-206\207FAX: (86) 0779-3034431POST CODE: 536000
FANGCHENGGANG BRANCH
38 FU YU STREET,FANGCHENGGANG 538001,GUANGXI ZHUANG*, CHINASWIFT: BKCH CN BJ 49HTEL: (86) 0770-2802318FAX: (86) 0770-2831115POST CODE: 538001
GUILIN BRANCH
2 ZHONGSHAN ZHONG ROAD,GUILIN 541001, GUANGXI ZHUANG*, CHINASWIFT: BKCH CN BJ 49CTEL: (86) 0773-2581918FAX: (86) 0773-2582020POST CODE: 541002
LIUZHOU BRANCH
178 PING SHANAVENUE,LIUZHOU 545005,GUANGXI ZHUANG*, CHINASWIFT: BKCH CN BJ 49DTEL: (86) 0772-3881862FAX: (86) 0772-3881999POST CODE: 545005
WUZHOU BRANCH
1 XINXING 1 ROAD,WUZHOU 543002,GUANGXI ZHUANG*, CHINASWIFT: BKCH CN BJ 49ATLX: 48680WZBOC CNTEL: (86) 0774-2812531FAX: (86) 0774-3829800POST CODE: 543002
YULIN BRANCH
248 YI HUANDONG ROAD,YULIN 537000, GUANGXI ZHUANG*, CHINASWIFT: BKCH CN BJ 49GTEL: (86) 0775-2650928FAX: (86) 0775-2825524POST CODE: 537000
GUIZHOU PROVINCE
GUIZHOU BRANCH
30 DUSI ROAD, GUIYANG,GUIZHOU PROV., CHINASWIFT: BKCH CN BJ 240TEL: (86) 0851-5815261FAX: (86) 0851-5825746POST CODE: 550002
HAINAN PROVINCE
HAINAN BRANCH
33 DATONG ROAD, HAIKOU 570102,HAINAN PROV., CHINASWIFT: BKCH CN BJ 740TLX: 490172 HABOC CNTEL: (86) 0898-66778001FAX: (86) 0898-66562040POST CODE: 570102
SANYA BRANCH
035 JIEFANG 4 ROAD, SANYA572000,HAINAN PROV., CHINASWIFT: BKCH CN BJ 75ATEL: (86) 0898-88676001FAX: (86) 0898-88676003POST CODE: 572000
HEBEI PROVINCE
HEBEI BRANCH
80 XINHUA ROAD,SHIJIAZHUANG 050000,HEBEI PROV., CHINASWIFT: BKCH CN BJ 220TEL: (86) 0311-87866681FAX: (86) 0311-87866692POST CODE: 050000
QINHUANGDAO BRANCH
157 YINGBIN ROAD,QINHUANGDAO 066001,HEBEI PROV., CHINASWIFT: BKCH CN BJ 23ATEL: (86) 0335-3619050FAX: (86) 0335-3068179POST CODE: 066001
TANGSHAN BRANCH
67 XINHUA XIDAO,TANGSHAN 063004,HEBEI PROV., CHINASWIFT: BKCH CN BJ 23HTEL: (86) 0315-2221569FAX: (86) 0315-2221569POST CODE: 063004
HEILONGJIANG PROVINCE
HEILONGJIANG BRANCH
19 HONGJUN STREET,HARBIN 150001,HEILONGJIANG PROV., CHINASWIFT: BKCH CN BJ 860TLX: 87009 BCHB CNTEL: (86) 0451-53626785FAX: (86) 0451-53624147POST CODE: 150001
ZHAOLIN SUB- BRANCH
NO.37 ZHAOLIN STREET,DAOLI DISTRICT, HARBIN 150010,HEILONGJIANG PROV., CHINASWIFT: BKCH CN BJ 87ATEL: (86) 0451-84648124FAX: (86) 0451-84610769POST CODE: 150010
DAQING BRANCH
6WAN BAO STREET,SA ER TU DONG FENGXIN CUN, DAQING,HEILONGJIANG PROV., CHINASWIFT: BKCH CN BJ 87DTEL: (86) 0459-6385681FAX: (86) 0459-6385679POST CODE: 163311
HEIHE BRANCH
149 XING_LIN STREET,HEIHE 164300,HEILONGJIANG PROV., CHINASWIFT: BKCH CN BJ 87FTEL: (86) 0456-8277693FAX: (86) 0456-8222093POST CODE: 164300
JIAMUSI BRANCH
57 ZHONGSHAN STREET,JIAMUSI 154002,HEILONGJIANG PROV., CHINASWIFT: BKCH CN BJ 87BTEL: (86) 0454-8628208FAX: (86) 0454-8628208POST CODE: 154002
MUDANJIANG BRANCH
9 TAIPING ROAD,MUDANJIANG 157000,HEILONGJIANG PROV., CHINASWIFT: BKCH CN BJ 87ETEL: (86) 0453-6678036
0453-6678035FAX: (86) 0453-6678032POST CODE: 157000
QIQIHAR BRANCH
6 BUKUI SOUTH STREET,LONGSHA DISTRICT,QIQIHAR 161000,HEILONGJIANG PROV., CHINASWIFT: BKCH CN BJ 87CTEL: (86) 0452-2408041FAX: (86) 0452-2408041POST CODE: 161000
Bank of China Annual Report 2006356

HENAN PROVINCE
HENAN BRANCH
40 HUA YUAN ROAD,ZHENGZHOU 450008,HENAN PROV., CHINASWIFT: BKCH CN BJ 530TEL: (86) 0371-65779966FAX: (86) 0371-65779878POST CODE: 450008
HUBEI PROVINCE
HUBEI BRANCH
65 HUANGSHI ROAD,WUHAN430013, HUBEI PROV., CHINASWIFT: BKCH CN BJ 600TEL: (86) 027-82813723
027-82811707FAX: (86) 027-82838479POST CODE: 430013
HANKOU SUB-BRANCH
593 ZHONGSHANAVENUE,WUHAN 430021,HUBEI PROV., CHINASWIFT: BKCH CN BJ 61ATEL: (86) 027-82834891FAX: (86) 027-82815221POST CODE: 430021
HUNAN PROVINCE
HUNAN BRANCH
593 FURONG ROAD(M),CHANGSHA 410011,HUNAN PROV., CHINASWIFT: BKCH CN BJ 970TEL: (86) 0731-2580703FAX: (86) 0731-2580707POST CODE: 410011
XIANGTAN BRANCH
249 JIANSHE NORTH ROAD,XIANGTAN 411100,HUNAN PROV., CHINASWIFT: BKCH CN BJ 98DTEL: (86) 0732-8222758FAX: (86) 0732-8227476POST CODE: 411100
ZHUZHOU BRANCH
23 TIANTAI ROAD, ZHUZHOU412007, HUNAN PROV., CHINASWIFT: BKCH CN BJ 98CTEL: (86) 0733-8817047FAX: (86) 0733-8817003POST CODE: 412007
INNERMONGOLIA*
INNERMONGOLIA BRANCH
12 XINHUA DAJIE,XIN CHENGDISTRICTHUHHOT 010010,INNERMONGOLIA*, CHINASWIFT: BKCH CN BJ 880TEL: (86) 0471-4690024FAX: (86) 0471-4690039POST CODE: 010010
BAOTOU BRANCH
NO.28, GANGTIE DAJIE,QINGSHANQU, BAOTOU 014030,INNERMONGOLIA*, CHINASWIFT: BKCH CN BJ 89ATEL: (86) 0472-6965000FAX: (86) 0472-6965000POST CODE: 014030
ERDOS CITY BRANCH
29 YIJINHUOLUOXI STREET,DONGSHENGDISTRICT, ERDOS 017000,INNERMONGOLIA*, CHINATEL: (86) 0477-8369680FAX: (86) 0477-8369980POST CODE: 017000
HULUNBEIR CITY BRANCH
16 ALIHE ROAD,HULUNBEIR CITY 021008,INNERMONGOLIA*, CHINATEL: (86) 0470-8291688FAX: (86) 0470-8291688POST CODE: 021008
MANZHOULI BRANCH
28 SANDAO JIE, MANZHOULI,INNERMONGOLIA*, CHINATEL: (86) 0470-6237306FAX: (86) 0470-6237306POST CODE: 021400
JIANGSU PROVINCE
JIANGSU BRANCH
148 ZHONG SHANNAN LU,NANJING 210005,JIANGSU PROV., CHINASWIFT: BKCH CN BJ 940TLX: 34116 BOCJS CNTEL: (86) 025-84207888FAX: (86) 025-84208843POST CODE: 210005
CHANGZHOU BRANCH
150 HEPING SOUTH ROAD,CHANGZHOU, 213003,JIANGSU PROV., CHINASWIFT: BKCH CN BJ 95ETEL: (86) 0519-8122988FAX: (86) 0519-8119666POST CODE: 213003
LIANYUNGANG BRANCH
1MIDDLE HAILIAN ROAD,XIN PU DISTRICT,LIANYUNGANG 222002,JIANGSU PROV., CHINASWIFT: BKCH CN BJ 95ATEL: (86) 0518-5319920
0518-5319921FAX: (86) 0518-5319869
0518-5411983POST CODE: 222002
NANTONG BRANCH
19 QINGNIAN XI ROAD,NANTONG 226006,JIANGSU PROV., CHINASWIFT: BKCH CN BJ 95GTEL: (86) 0513-83516888FAX: (86) 0513-83518921POST CODE: 226006
SUZHOU BRANCH
188 GANJIANG XI ROAD,SUZHOU 215002,JIANGSU PROV., CHINASWIFT: BKCH CN BJ 95BTEL: (86) 0512-65112719FAX: (86) 0512-65114906POST CODE: 215002
WUXI BRANCH
258 ZHONG SHAN ROAD,WUXI 214002,JIANGSU PROV., CHINASWIFT: BKCH CN BJ 95CTEL: (86) 0510-82705888FAX: (86) 0510-82751687
0510-82705888-1000POST CODE: 214002
YANGZHOU BRANCH
541WEN CHANGMIDDLE ROAD,YANGZHOU 225002,JIANGSU PROV., CHINASWIFT: BKCH CN BJ 95HTEL: (86) 0514-7361078FAX: (86) 0514-7361010POST CODE: 225002
ZHENJIANG BRANCH
235 EAST ZHONGSHANROAD, ZHENJIANG 212001,JIANGSU PROV., CHINASWIFT: BKCH CN BJ 95DTEL: (86) 0511-5020712FAX: (86) 0511-5027934POST CODE: 212001
ZHANGJIAGANG SUB-BRANCH
111 RENMIN ROAD(M),ZHANGJIAGANG 215600,JIANGSU PROV., CHINASWIFT: BKCH CN BJ 95LTEL: (86) 0512-58685888FAX: (86) 0512-58684349POST CODE: 215600
JIANGXI PROVINCE
JIANGXI BRANCH
1 ZHANQIANWEST ROAD,NANCHANG 330002,JIANGXI PROV., CHINASWIFT: BKCH CN BJ 550TLX: 95013 BOCNC CNTEL: (86) 0791-6471503FAX: (86) 0791-6471505POST CODE: 330002
List of Domestic and Overseas Operations 357

JINGDEZHEN BRANCH
1053 CI DU AVENUE,JINGDEZHEN 333000,JIANGXI PROV., CHINASWIFT: BKCH CN BJ 56ATEL: (86) 0798-8570628FAX: (86) 0798-8570625POST CODE: 333000
JILIN PROVINCE
JILIN BRANCH
699 XI AN DA LU, CHANG CHUN130061, JILIN PROV., CHINASWIFT: BKCH CN BJ 840TLX: 83006 CCBOC CNTEL: (86) 0431-8409055FAX: (86) 0431-8409054POST CODE: 130061
CHANGCHUN Xl AN DA LU SUB-BRANCH
91 TONGZHI STREET,CHANGCHUN 130061,JILIN PROV., CHINASWIFT: BKCH CN BJ 85ATEL: (86) 0431-8948671FAX: (86) 0431-8948667POST CODE: 130061
JILIN CITY BRANCH
1 SHENZHENAVENUE, JILIN 132011,JILIN PROV., CHINASWIFT: BKCH CN BJ 85BTEL: (86) 0432-4670216FAX: (86) 0432-4670299POST CODE: 132011
YANBIAN BRANCH
107 RENMIN LU, YANBIAN 133000,JILIN PROV., CHINATEL: (86) 0433-2536454FAX: (86) 0433-2516877POST CODE: 133000
LIAONING PROVINCE
LIAONING BRANCH
9 ZHONGSHAN SQUARE,ZHONG SHAN DISTRICT,DALIAN 116001,LIAONING PROV., CHINASWIFT: BKCH CN BJ 810TEL: (86) 0411-82586666FAX: (86) 0411-82586366POST CODE: 116001
DALIAN ZHONGSHAN SQUARESUB-BRANCH
5 JIEFANG STREET,ZHONG SHAN DISTRICT,DALIAN 116001,LIAONING PROV., CHINASWIFT: BKCH CN BJ 82NTEL: (86) 0411-82641655FAX: (86) 0411-82519786POST CODE: 116001
SHENYANG BRANCH
253 SHIFU ROAD, SHENHE DISTRICT,SHENYANG 110013,LIAONING PROV., CHINASWIFT: BKCH CN BJ 82ATEL: (86) 024-22810556FAX: (86) 024-22810536POST CODE: 110013
ANSHAN BRANCH
298 ROAD, NANZHONGHUA TIEDONG,ANSHAN, LIAONING PROV., CHINASWIFT: BKCH CN BJ 82DTEL: (86) 0412-5933011FAX: (86) 0412-5933013POST CODE: 114000
DALIAN DEVELOPMENT ZONE BRANCH
BANK OF CHINA TOWER, 158 JINMA LU,DALIAN ECONOMIC ANDTECHNICAL DEVELOPMENT ZONE,DALIAN 116600,LIAONING PROV., CHINASWIFT: BKCH CN BJ 82HTEL: (86) 0411-87612223FAX: (86) 0411-87648411POST CODE: 116600
JINZHOU BRANCH
25 SECTIONS, 5 JIEFANG ROAD,LINGHE DISTRICT, JINZHOU121000, LIAONING PROV., CHINATEL: (86) 0416-3185513FAX: (86) 0416-3185869POST CODE: 121000
YINGKOU BRANCH
8WEST, BOHAI DAJIE,ZHANQIAN DISTRICT,YINGKOU 115000,LIAONING PROV., CHINATEL: (86) 0417-2805159FAX: (86) 0417-2833680POST CODE: 115000
NINGXIA HUI*
NINGXIA BRANCH
170 JIEFANGXI STREET,YINCHUAN 750001,NINGXIA HUI*, CHINASWIFT: BKCH CN BJ 260TEL: (86) 0951-5044671FAX: (86) 0951-5044671POST CODE: 750001
QINGHAI PROVINCE
QINGHAI BRANCH
218 DONGGUAN STREET,XINING 810000,QINGHAI PROV., CHINASWIFT: BKCH CN BJ 280TEL: (86) 0971-8180186FAX: (86) 0971-8180192POST CODE: 810000
SHAANXI PROVINCE
SHAANXI BRANCH
38 JUHUA YUAN DONGDA STREET,XI_AN 710001, SHAANXI PROV., CHINASWIFT: BKCH CN BJ 620TEL: (86) 029-87261726FAX: (86) 029-87261933POST CODE: 710001
SHANDONG PROVINCE
SHANDONG BRANCH
59 XIANGGANG ZHONG LU,QINGDAO 266071,SHANDONG PROV., CHINASWIFT: BKCH CN BJ 500TEL: (86) 0532-81858201FAX: (86) 0532-81858185POST CODE: 266071
JINAN BRANCH
22 LUO YUANDAJIE, JINAN 250063,SHANDONG PROV., CHINASWIFT: BKCH CN BJ 51BTEL: (86) 0531-86995076
0531-86995004FAX: (86) 0531-86995223POST CODE: 250063
RIZHAO BRANCH
18 HUANGHAI 1 LU, RIZHAO 276826,SHANDONG PROV., CHINASWIFT: BKCH CN BJ 51ETEL: (86) 0633-8329526FAX: (86) 0633-8331264POST CODE: 276826
WEIHAI BRANCH
9 NORTH QINGDAO ROAD,WEIHAI 264200, SHANDONG PROV.,CHINASWIFT: BKCH CN BJ 51DTEL: (86) 0631-5326988FAX: (86) 0631-5317207POST CODE: 264200
YANTAI BRANCH
166 JIE FANG ROAD,YANTAI 264001,SHANDONG PROV., CHINASWIFT: BKCH CN BJ 5lATEL: (86) 0535-6238888FAX: (86)0535-6238888-6738POST CODE: 264001
SHANGHAI CITY
SHANGHAI BRANCH
200 MID. YINCHENG RD.,PUDONGNEWDISTRICT,SHANGHAI 200121, CHINASWIFT: BKCH CN BJ 300TLX: 33062 BOCSH CNTEL: (86) 021-38824588FAX: (86) 021-64729384POST CODE: 200121
Bank of China Annual Report 2006358

BOC INTERNATIONAL (CHINA) LIMITED
39–40/F., BANK OF CHINA TOWER,200 YINCHENG ZHONG LU,PUDONG, SHANGHAI 200121, CHINATEL: (86) 021-68604866FAX: (86) 021-58883554POST CODE: 200121Website: www.bocichina.comEmail: [email protected]
BOC INTERNATIONAL INVESTMENTMANAGERS LIMITED
45/F., BANK OF CHINA TOWER,200 YINCHENG ZHONG LU,PUDONG, SHANGHAI 200121, CHINATEL: (86) 021-38834999FAX: (86) 021-68872488POST CODE: 200121Website: www.bociim.com
SHANXI PROVINCE
SHANXI BRANCH
288 YINGZE DAJIE, TAIYUAN 030001,SHANXI PROV., CHINASWIFT: BKCH CN BJ 680TEL: (86) 0351-8266282FAX: (86) 0351-4040364POST CODE: 030001
SHUOZHOU BRANCH
19 KAIFA NAN LU,SHUOZHOU 036000,SHANXI PROV., CHINATEL: (86) 0349-2022180FAX: (86) 0349-2020861POST CODE: 036000
SICHUAN PROVINCE
SICHUAN BRANCH
35 MIDDLE RENMIN ROAD(2 DUAN), CHENGDU 610015,SICHUAN PROV., CHINASWIFT: BKCH CN BJ 570TLX: 60306 BOCCD CNTEL: (86) 028-86403267
028-86741950FAX: (86) 028-86403346POST CODE: 610015
CHENGDU SHUDUDADAO SUB-BRANCH
18 NORTH SHUWA 3 STREET,CHENGDU 610016,SICHUAN PROV., CHINATEL: (86) 028-86668221 86671909 86662260FAX: (86) 028-86676787 86720847POST CODE: 610016
SHENZHEN CITY
SHENZHEN BRANCH
INTERNATIONAL FINANCE BUILDING,2022 JIANSHE ROAD,LUOHUDISTRICT,SHENZHEN 518001,GUANGDONG PROV., CHINASWIFT: BKCH CN BJ 45ATLX: 420309 BOCSZ CN
420243 BOCSZ CNTEL: (86) 0755-22338888FAX: (86) 0755-82259209POST CODE: 518005
SHEKOU SUB-BRANCH
18 TAIZI ROAD, HAIJING PLAZA,SHEKOU, SHENZHEN 518067,GUANGDONG PROV., CHINASWIFT: BKCH CN BJ 45BTEL: (86) 0755-26811848
0755-26811823FAX: (86) 0755-26811829POST CODE: 518067
BANK OF CHINA INSURANCE CO., LTDSHENZHEN BRANCH
31/F., INTERNATIONALFINANCE BUILDING,2022 JIANSHE ROAD,LUOHUDISTRICT,SHENZHEN 518005,GUANGDONG PROV., CHINATEL: (86) 0755-25155678FAX: (86) 0755-25179843POST CODE: 518005Website: www.boc-ins.com
TIANJIN CITY
TIANJIN BRANCH
80 JIEFANGNORTH ROAD,HEPING DISTRICT,TIANJIN 300040, CHINASWIFT: BKCH CN BJ 200TEL: (86) 022-27102335
022-27102329FAX: (86) 022-23312809
022-27102349POST CODE: 300040
BINHAI BRANCH
AB1-11, C1-2 BUILD, 5WEST AREA,BINHAI FINANCIAL STREET,51 THE 3rd STREET,ECONOMIC ANDTECHNOLOGICALDEVELOPMENT AREA,TIANJIN 300457, CHINASWIFT: BKCH CN BJ 2lATEL: (86) 022-66283917FAX: (86) 022-66283918POST CODE: 300457
TIBET*
TIBET BRANCH
28 LINKUO XI LU,LHASA CITY 850000,TIBET*, CHINASWIFT: BKCH CN BJ 900TEL: (86) 0891-6835078FAX: (86) 0891-6835078POST CODE: 850000
XINJIANGUYGUR*
XINJIANG BRANCH
BANK OF CHINA BUILDING,2 DONGFENG ROAD,URUMQI 830002,XINJIANGUYGUR*, CHINASWIFT: BKCH CN BJ 760TEL: (86) 0991-2336007FAX: (86) 0991-2828619POST CODE: 830002
YUNNAN PROVINCE
YUNNAN BRANCH
515 BEIJING ROAD,KUNMING 650051,YUNNAN PROV., CHINASWIFT: BKCH CN BJ 640TLX: 64034 KMBNK CNTEL: (86) 0871-3192910FAX: (86) 0871-3188976POST CODE: 650051
ZHEJIANG PROVINCE
ZHEJIANG BRANCH
321 FENGQI ROAD,HANGZHOU 310003,ZHEJIANG PROV., CHINASWIFT: BKCH CN BJ 910TLX: 35019 BOCHZ CNTEL: (86) 0571-85011888FAX: (86) 0571-87074837POST CODE: 310003
NINGBO BRANCH
139 YAOXING JIE,NINGBO 315000,ZHEJIANG PROV., CHINASWIFT: BKCH CN BJ 92ATLX: 37039 NBBOC CNTEL: (86) 0574-87196666FAX: (86) 0574-87198889POST CODE: 315000
SHAOXING BRANCH
201 MIDDLE RENMIN ROADSHAOXING 312000,ZHEJIANG PROV., CHINASWIFT: BKCH CN BJ 92DTLX: 37429 BOCSX CNTEL: (86) 0575-5111333FAX: (86) 0575-5134405POST CODE: 312000
WENZHOU BRANCH
XIHU JINYUAN, RENMINWEST ROAD,WENZHOU 325000,ZHEJIANG PROV., CHINASWIFT: BKCH CN BJ 92BTLX: 37110WZBOC CNTEL: (86) 0577-88265566FAX: (86) 0577-88267887POST CODE: 325000
ZHOUSHAN BRANCH
33 JIEFANGDONGLU ROAD,DINGHAI, ZHOUSHAN 316000,ZHEJIANG PROV., CHINASWIFT: BKCH CN BJ 92ETEL: (86) 0580-2068120FAX: (86) 0580-2068008POST CODE: 316000
* REFERS TO AUTONOMOUS REGION
List of Domestic and Overseas Operations 359
MAJOR HONG KONG AND MACAU NETWORK
BOC HONG KONG (HOLDINGS) LIMITED
52/F., BANK OF CHINA TOWER,
1 GARDEN ROAD, HONG KONG
TEL: (852) 28462700
FAX: (852) 28105830
Website: www.bochk.com
BANK OF CHINA (HONG KONG) LIMITED
1 GARDEN ROAD, HONG KONG
SWIFT: BKCH HK HH
TLX: 73772 BKCHI HX
TEL: (852) 28266888
FAX: (852) 28105963
Website: www.bochk.com
NANYANG COMMERCIAL BANK LIMITED
151 DES VOEUX ROAD CENTRAL,
HONG KONG
TEL: (852) 28520888
FAX: (852) 28153333
Website: www.ncb.com.hk
Email: [email protected]
CHIYU BANKING CORPORATIONLIMITED
78 DES VOEUX ROAD CENTRAL,
HONG KONG
TEL: (852) 28430111
FAX: (852) 28104207
Website: www.chiyubank.com
Email: [email protected]
BOC CREDIT CARD (INTERNATIONAL)LIMITED
20/F., BOC CREDIT CARD CENTRE
68 CONNAUGHT ROAD WEST,
HONG KONG
TEL: (852) 28538888
FAX: (852) 25415415
Website: www.boci.com..hk
BOC INTERNATIONAL HOLDINGSLIMITED
26/F., BANK OF CHINA TOWER,
1 GARDEN ROAD, HONG KONG
TEL: (852) 22308888
FAX: (852) 21479065
Website: www.bocigroup.com
Email: [email protected]
BOCI ASIA LIMITED
26/F., BANK OF CHINA TOWER,
1 GARDEN ROAD, HONG KONG
TEL: (852) 22308888
FAX: (852) 25226797
Email: [email protected]
BOCI SECURITIES LIMITED
20/F., BANK OF CHINA TOWER,
1 GARDEN ROAD, HONG KONG
TEL: (852) 28676333
FAX: (852) 25247327
Email: [email protected]
18/F., LOW BLOCK,
GRAND MILLENNIUM PLAZA,
181 QUEEN’S ROAD CENTRAL,
HONG KONG
TEL: (852) 27189888
FAX: (852) 27189966
Email: [email protected]
BOCI RESEARCH LIMITED
20/F., BANK OF CHINA TOWER,
1 GARDEN ROAD, HONG KONG
TEL: (852) 28676333
FAX: (852) 21479513
Website: www.bociresearch.com
Email: [email protected]
BOCI CAPITAL LIMITED
26/F., BANK OF CHINA TOWER,
1 GARDEN ROAD, HONG KONG
TEL: (852) 22308888
FAX: (852) 21479065
Email: [email protected]
BOCI COMMODITIES & FUTURESLIMITED
SUITES 1601–7, 16/F.,
CITY PLAZA
1111 KING’S ROAD,
HONG KONG
TEL: (852) 28676600
FAX: (852) 21970290
Email: [email protected]
BOCI-PRUDENTIAL ASSETMANAGEMENT LIMITED
27/F., BANK OF CHINA TOWER,
1 GARDEN ROAD, HONG KONG
TEL: (852) 22808000
FAX: (852) 21510968
Website: www.boci-pru.com.hk
Email: [email protected]
BOCI-PRUDENTIAL TRUSTEE LIMITED
27/F., BANK OF CHINA TOWER,
1 GARDEN ROAD, HONG KONG
TEL: (852) 22808000
FAX: (852) 25166757
Website: www.boci-pru.com.hk
Email: [email protected]
BANK OF CHINA GROUP INSURANCECOMPANY LIMITED
9/F., WING ON HOUSE,
71 DES VOEUX ROAD CENTRAL,
HONG KONG
TEL: (852) 28670888
FAX: (852) 25221705
Website: www.bocgroup.com/bocg-ins/
Email: [email protected]
BOC GROUP LIFE ASSURANCECOMPANY LIMITED
13–21/F., BOCG INSURANCE TOWER,
134–136 DES VOEUX ROAD CENTRAL,
HONG KONG
TEL: (852) 28629898
FAX: (852) 28660938
Website: www.bocgroup.com/bocg-life
Email: [email protected]
BANK OF CHINA GROUP INVESTMENTLIMITED
23/F., BANK OF CHINA TOWER,
1 GARDEN ROAD CENTRAL,
HONG KONG
TEL: (852) 22007500
FAX: (852) 28772629
Website: www.bocgi.com
Email: [email protected]
MACAU BRANCH
BANK OF CHINA BUILDING,
AVENIDA DOUTOR MARIO SOARES,
MACAU
SWIFT: BKCHMOMX
TLX: 88231 BKCHI OM
TEL: (853) 28781828
FAX: (853) 28781833
Website: www.bocmacau.com
Bank of China Annual Report 2006360

MAJOR OVERSEAS NETWORK
ASIA-PACIFIC AREA(EXCLUDING HONG KONG& MACAU)
SINGAPORE BRANCH
4 BATTERY ROAD,
BANK OF CHINA BUILDING,
SINGAPORE 049908
SWIFT: BKCHSGSG
TEL: (65) 65352411
FAX: (65) 65343401
Email: [email protected]
SOUTH SUB-BRANCH
20 MAXWELL ROAD
#01-01, MAXWELL HOUSE,
SINGAPORE 069113
TEL: (65) 62233466
FAX: (65) 62236601
NORTH SUB-BRANCH
133 MIDDLE ROAD, BOC PLAZA,
SINGAPORE 188974
TEL: (65) 68328108
FAX: (65) 63339281
KATONG SUB-BRANCH
188–192 EAST COAST ROAD,
SINGAPORE 428898
TEL: (65) 64402440
FAX: (65) 63440737
CENTRAL SUB-BRANCH
60 CECIL STREET, KPB BUILDING,
SINGAPORE 049709
TEL: (65) 62239622
FAX: (65) 62218820
CHINATOWN SUB-BRANCH
60 EU TONG SEN STREET #01-01,
FURAMA HOTEL, SINGAPORE 059804
TEL: (65) 65337453
FAX: (65) 65345571
BOC INTERNATIONAL (SINGAPORE)PTE. LTD.
4 BATTERY ROAD #04-00,
BANK OF CHINA BUILDING,
SINGAPORE 049908
TEL: (65) 64128899
FAX: (65) 65343996
Email: [email protected]
BANK OF CHINA (MALAYSIA) BERHAD
GROUND, MEZZANINE, &1st FLOOR,
PLAZA OSK, 25 JALAN AMPANG,
50450 KUALA LUMPUR, MALAYSIA
SWIFT: BKCHMYKL
TEL: (603) 21626633
FAX: (603) 21615150
Email: [email protected]
SYDNEY BRANCH
39–41 YORK STREET,
SYDNEY NSW 2000, AUSTRALIA
SWIFT: BKCHAU2S
TEL: (612) 82355888
FAX: (612) 92621794
Email: [email protected]
BANK OF CHINA (AUSTRALIA) LIMITED
39–41 YORK STREET, SYDNEY NSW 2000,
AUSTRALIA
SWIFT: BKCHAU2A
TEL: (612) 82355888
FAX: (612) 92621794
Email: [email protected]
HAYMARKET BRANCH
681 GEORGE STREET,
HAYMARKET NSW 2000, AUSTRALIA
TEL: (612) 92123877
FAX: (612) 92123962
MELBOURNE BRANCH
270 QUEEN STREET,
MELBOURNE VIC 3000, AUSTRALIA
TEL: (613) 96023655
FAX: (613) 96023383
PARRAMATTA OFFICE
SHOP 2104, LEVEL 2,
WESTFIELD SHOPPING TOWN,
PARRAMATTA NSW 2150, AUSTRALIA
TEL: (612) 98938833
FAX: (612) 96872919
TOKYO BRANCH
BOC BLDG. 3-4-1 AKASAKA, MINATO-KU,
TOKYO, 107-0052 JAPAN
SWIFT: BKCHJPJT
TEL: (813) 35058818
FAX: (813) 35058433
Email: [email protected]
OSAKA BRANCH
BOC BLDG. 1-1-35 KITAHORIE,
NISHI-KU, OSAKA, 550-0014 JAPAN
SWIFT: BKCHJPJTOSA
TEL: (816) 65393666
FAX: (816) 65381177
YOKOHAMA BRANCH
1/F., FINCL BLDG.89-1 YAMASHITA-CHO,
NAKA-KU, YOKOHAMA, 231-0023 JAPAN
SWIFT: BKCHJPJTYHA
TEL: (8145) 6632288
FAX: (8145) 6638688
OTEMACHI OFFICE
1/F., SHIN-OTEMACHI BLDG.,
2-2-1 OTEMACHI,
CHIYODA-KU, 100-0004 JAPAN
TEL: (813) 32770288
FAX: (813) 32770289
JSC AB <BANK OF CHINAKAZAKHSTAN>
201, STR. GOGOL, 050026, ALMATY,
REPUBLIC OF KAZAKHSTAN
SWIFT: BKCHKZKA
TEL: (7327) 2585510
FAX: (7327) 2585514/2501896
Email: [email protected]
YALIAN BRANCH
9, NORTH RING ROAD, 050060, ALMATY,
REPUBLIC OF KAZAKHSTAN
TEL: (7327) 2452373
FAX: (7327) 2452373
SEOUL BRANCH
1/2F., YOUNG POONG BLDG., 33 SEOLIN-DONG,
CHONGRO-GU SEOUL 110–752, KOREA
SWIFT: BKCHKRSEXXX
TEL: (822) 3996268/3996272
FAX: (822) 3996265/3995938
Email: [email protected]
ANSAN BRANCH
1/F., DONG YANG BLDG., 801–11,
WONGOK-DONG, DANWON-GU, ANSAN,
KYONGGI-DO 425-846,KOREA
SWIFT:BKCHKRSEANS
TEL:(8231) 4934638/4954518
FAX:(8231) 4956407
List of Domestic and Overseas Operations 361

DAEGU BRANCH
1/F., ASIA CEMENT BUILDING.,
220–14, NAEDANG DONG DAEGU,
703-802 KOREA
SWIFT: BKCHKRSEDAE
TEL: (8253) 5232020/5238859
FAX: (8253) 5238861
BANGKOK BRANCH
179/4 BANGKOK CITY TOWER,
SOUTH SATHORN RD.,
TUNGMAHAMEK, SATHORN DISTRICT,
BANGKOK 10120, THAILAND
SWIFT: BKCHTHBK
TLX: 81091 BOCBKK TH
TEL: (662) 2861010
FAX: (662) 2861020
Email: [email protected]
HO CHI MINH CITY BRANCH
19/F., SUN WAH TOWER,
115 NGUYEN HUE BLVD.,
DISTRICT 1, HO CHI MINH CITY, VIETNAM
SWIFT: BKCHVNVX
TEL: (848) 8219949
FAX: (848) 8219948
Email: [email protected]
MANILA BRANCH
G/F & 36/F, PHILAMLIFE TOWER,
8767 PASEO DE ROXAS, MAKATI CITY, MANILA
PHILIPPINES
SWIFT: BKCHPHMM
TEL: (632) 8850111
FAX: (632) 8850532
Email: [email protected]
JAKARTA BRANCH
WISMA TAMARA SUITE 101&201 JALAN
JEND. SUDIRMAN KAV.24 JAKARTA
12920, INDONESIA
SWIFT: BKCHIDJA
TEL: (6221) 5205502
FAX: (6221) 5201113
Email: [email protected]
BAHRAIN REPRESENTATIVE OFFICE
OFFICE 152, AL JASRAH TOWER,
DIPLOMATIC AREA BUILDING 95,
ROAD 1702, BLOCK 317,
P.O.BOX 10059 MANAMA,
KINGDOM OF BAHRAIN
TEL: (973) 17531119
FAX: (973) 17531009
Email: [email protected]
EUROPE
LONDON BRANCH
90 CANNON STREET,
LONDON EC4N 6HA, U.K.
SWIFT: BKCHGB2L
TLX: 8812913 BKCHI G
TEL: (4420) 72828888
FAX: (4420) 76263892
Email: [email protected]
WEST END BRANCH
107 SHAFTESBURY AVE.,
LONDON WlD 5DA, U.K.
TEL: (4420) 74375975
FAX: (4420) 77341704
MANCHESTER BRANCH
67–69 MOSLEY STREET,
MANCHESTER M2 3JB, U.K.
TEL: (4416) 12368302
FAX: (4416) 12280285
GLASGOW BRANCH
450 SAUCHIEHALL STREET,
GLASGOW G2 3JD, U.K.
TEL: (4414) 13323354
FAX: (4414) 13326728
BIRMINGHAM BRANCH
33 HORSE FAIR, BIRMINGHAM B1 1DD, U.K.
TEL: (4412) 16227002
FAX: (4412) 16227082
BANK OF CHINA INTERNATIONAL (UK)LIMITED
90 CANNON STREET,
LONDON EC4N 6HA, U.K.
TEL: (4420) 70228888
FAX: (4420) 70228877
Email: [email protected]
LUXEMBOURG BRANCH
37/39 BOULEVARD PRINCE HENRI L-1724,
LUXEMBOURG P. O. BOX 114 L-2011,
LUXEMBOURG
SWIFT: BKCHLULL
TLX: 3546 CHUNG LU
TEL: (352) 221791/4667911
FAX: (352) 221795
Website: www.bank-of-china.com/lu/
Email: [email protected]
BANK OF CHINA (LUXEMBOURG) S.A.
37/39 BOULEVARD PRINCE HENRI L-1724,
LUXEMBOURG P. O. BOX 721 L-2017,
LUXEMBOURG
TEL: (352) 228777/4667911
FAX: (352) 228776
Website: www.bank-of-china.com/lu/
Email: [email protected]
PARIS BRANCH
23–25 AVENUE DE LA GRANDE ARMEE, 75116
PARIS, FRANCE
SWIFT: BKCHFRPP
TLX: 281 090 BDCSP
TEL: (331) 49701370
FAX: (331) 49701372
Email: [email protected]
AGENCE ITALIE
11 PLACE D’ITALIE 75013
PARIS, FRANCE
SWIFT: BKCHFRPP013
TEL: (331) 45828710
FAX: (331) 45857449
FRANKFURT BRANCH
BOCKENHEIMER LANDSTR.39
D-60325 FRANKFURT AM MAIN, GERMANY
SWIFT: BKCHDEFF
TEL: (4969) 1700900
FAX: (4969) 17009050
Website: www.bocffm.com
Email: [email protected]
HAMBURG BRANCH
RATHAUSMARKT 5, D-20095 HAMBURG,
GERMANY
SWIFT: BKCHDEFFHMB
TEL: (4940) 3410668-0
FAX: (4940) 3410668-88
MILAN BRANCH
VIA SANTA MARGHERITA,
NO.14/16 20121 MILANO, ITALY
SWIFT: BKCHITMM
TLX: 326011
TEL: (3902) 864731
FAX: (3902) 89013411
Email: [email protected]
BANK OF CHINA (ELUOSI)
6/F., MOSBUSINESS CENTER, NO. 72,
PROSPECT MIRA, 129110 MOSCOW,
RUSSIA
SWIFT: BKCHRUMM
TLX: 413973 BOCR RU
TEL: (7495) 7950451
FAX: (7495) 7950454
Website: www.boc.ru
Email: [email protected]
BANK OF CHINA (HUNGARY) CLOSELTD.
BANK CENTER, 7 SZABADSAG TER,
1054 BUDAPEST, HUNGARY
SWIFT: BKCHHUHB
TEL: (361) 3543240
FAX: (361) 3029009
Email: [email protected]
AMERICA
NEW YORK BRANCH
410 MADISON AVENUE, NEW YORK,
NY 10017, U.S.A.
SWIFT: BKCHUS33
TLX: 661723BKCHI
TEL: (1212) 9353101
FAX: (1212) 5931831
Website: www.bocusa.com
Email: [email protected]
Bank of China Annual Report 2006362

NEW YORK CHINATOWN BRANCH
42 EAST BROADWAY, NEW YORK,
NY 10002, U.S.A.
SWIFT: BKCHUS33CTX
TLX: 661723BKCHI
TEL: (1212) 9252355
FAX: (1212) 4316157
LOS ANGELES BRANCH
444 SOUTH FLOWER STREET,
39th FLOOR, LOS ANGELES, CA 90071, U.S.A.
SWIFT: BKCHUS33LAX
TLX: 188127BOCLA UT
TEL: (1213) 6888700
FAX: (1213) 6880198
BOC INTERNATIONAL (USA) INC.
Room 202, 1270 Avenue of the Americas
New York. NY 10020, USA
TEL: (212) 2590888
FAX: (212) 2590889
Email: [email protected]
GRAND CAYMAN BRANCH
GRAND PAVILION COMMERCIAL CENTER
802 WEST BAY ROAD
P.O. BOX 30995
GRAND CAYMAN KY1-1204
CAYMAN ISLANDS
SWIFT: BKCHKYKY
TEL: (1345) 9452000
FAX: (1345) 9452200
Email: [email protected]
PANAMA BRANCH
P.O.BOX 0823-01030,
CALLE MANUEL M. ICAZA NO.14,
PANAMA, REPUBLIC OF PANAMA
SWIFT: BKCHPAPA
TEL: (507) 2635522
FAX: (507) 2239960
Email: [email protected]
BANK OF CHINA (CANADA)
THE EXCHANGE TOWER,
130 KING STREET WEST, SUITE 2730,
P.O.BOX 356, TORONTO,
ONTARIO, CANADA M5X 1E1
SWIFT: BKCHCATT
TLX: 06217598 BOCC TOR
TEL: (1416) 3622991
FAX: (1416) 3623047
Email: [email protected]
TORONTO DOWNTOWN BRANCH
396 DUNDAS STREET WEST, TORONTO,
ONTARIO, CANADA M5T 1G7
SWIFT: BKCHCATTCTX
TEL: (1416) 9718806
FAX: (1416) 9716551
TORONTO SCARBOROUGH BRANCH
UNIT 33, 3300 MIDLAND AVE.,
SCARBORO VILLAGE MALL
SCARBOROUGH,
ONTARIO, CANADA M1V 4A1
TEL: (1416) 2977921
FAX: (1416) 2976187
VANCOUVER BRANCH
1025 DUNSMUIR STREET,
P.O.BOX 49277, FOUR BENTALL CENTRE,
VANCOUVER, B.C., CANADA V7X 1L3
SWIFT: BKCHCATTVAN
TLX: 06959308 BOCC VCR
TEL: (1604) 6831088
FAX: (1604) 6839228
SAO PAULO REPRESENTATIVE OFFICE
AVENIDA PAULISTA, 1337-21 ANDAR, CJ.212,
01311-200 SAO PAULO, S.P.BRASIL
TEL: (5511) 35499958/35499978
FAX: (5511) 35499966
Email: [email protected]
AFRICA
BANK OF CHINA (ZAMBIA) LIMITED
AMANDRA HOUSE, BEN BELLA ROAD,
LUSAKA, ZAMBIA P.O.BOX 34550
SWIFT: BKCHZMLU
TEL: (2601) 235349/222549
FAX: (2601) 235350
Email: [email protected]
JOHANNESBURG BRANCH
4/F., SOUTH TOWER,
NELSON MANDELA SQUARE,
SANDOWN, SANDTON, SOUTH AFRICA
P.O.BOX 782616 SANDTON, 2146 RSA
SWIFT: BKCHZAJJ
TEL: (2711) 5209600
FAX: (2711) 7832336
Email: [email protected]
List of Domestic and Overseas Operations 363

In this annual report, unless the context otherwise requires, the following terms shall have the
meaning set out below:
‘‘AFH’’ Asia Financial Holdings Pte. Ltd., a wholly-owned subsidiary of Temasek
Holdings (Private) Limited
‘‘Annual General
Meeting’’
the annual general meeting of the Bank to be held on Thursday, 14 June
2007 at 3 : 00 pm at Central Garden Hotel, No. 18 Gaoliangqiaoxiejie,
Xizhimenwai Ave., Haidian District, Beijing, the People’s Republic of China
‘‘Articles of Association’’ the articles of association of our bank, approved by the China Banking
Regulatory Commission on 27 September 2006
‘‘basis point’’ Refer to 0.01 percentage point
‘‘BOCG Insurance’’ Bank of China Group Insurance Company Limited
‘‘BOCG Investment’’ Bank of China Group Investment Limited
‘‘BOCG Life’’ BOC Group Life Assurance Company Limited
‘‘BOCHK’’ Bank of China (Hong Kong) Limited, an authorized financial institution
incorporated under the laws of Hong Kong and a wholly-owned subsidiary
of BOCHK Holdings
‘‘BOCHK (BVI)’’ BOC Hong Kong (BVI) Limited
‘‘BOCHK Group’’ BOC Hong Kong (Group) Limited
‘‘BOCHK Holdings’’ BOC Hong Kong (Holdings) Limited, a company incorporated under the laws
of Hong Kong and the ordinary shares of which are listed on the Hong Kong
Stock Exchange
‘‘BOCI’’ BOC International Holdings Limited
‘‘BOCI China’’ BOC International (China) Limited
‘‘BOCI Group’’ BOCI and its subsidiaries and associated companies
‘‘BOCI-Prudential’’ BOCI-Prudential Asset Management Limited
‘‘CBRC’’ China Banking Regulatory Commission
Definitions
Bank of China Annual Report 2006364
‘‘Central and Southern
China’’
the area including Henan, Hubei, Hunan, Guangdong, Shenzhen, Guangxi
and Hainan
‘‘China Orient’’ China Orient Asset Management Corporation
‘‘CSRC’’ China Securities Regulatory Commission
‘‘Eastern China’’ the area including Shanghai, Jiangsu, Zhejiang, Anhui, Fujian, Jiangxi and
Shandong
‘‘Hong Kong Listing
Rules’’
the Rules Governing the Listing of Securities on The Stock Exchange of
Hong Kong Limited
‘‘Hong Kong Stock
Exchange’’
The Stock Exchange of Hong Kong Limited
‘‘Huijin’’ Central SAFE Investments Limited
‘‘Impaired loan’’ According to the accounting practices of international banking, if objective
impairment evidence shows that the future cash flow of loans will decrease
and the amount can be estimated, and then the Bank identifies the loan as
impaired loan and recognizes the losses as well.
‘‘Interest-bearing
liabilities’’
Includes customer deposits, due to and placements from banks and other
financial institutions, special purpose borrowings and etc.
‘‘Interest-earning
assets’’
Includes customer loans, debt securities, due from and placements with
banks and other financial institutions.
‘‘Nanyang’’ Nanyang Commercial Bank Limited
‘‘NCSSF’’ National Council for Social Security Fund
‘‘Non-performing loans’’ According to the Guiding Principles on the Classification of Loan Risk
Management, loans are divided into five categories by the degree of risk
involved. Non-performing loans refer to the Substandard, Doubtful and Loss
loans. Five categories are adopted in this report unless otherwise stated.
‘‘Northeastern China’’ the area including Heilongjiang, Jilin and Liaoning
‘‘Northern China’’ the area including Beijing, Tianjin, Hebei, Shanxi and Inner Mongolia
‘‘our Bank’’, ‘‘the Bank’’,
‘‘the Company’’, the
‘‘Group’’, ‘‘we’’, and
‘‘us’’
Bank of China Limited or its predecessors and, except where the context
otherwise requires, all of the subsidiaries of Bank of China Limited
‘‘PBOC’’ People’s Bank of China, the central bank of the PRC
Definitions 365
‘‘PRC Commercial
Banking Law’’
the Commercial Banking Law of the People’s Republic of China
‘‘PRC Company Law’’ the Company Law of the People’s Republic of China
‘‘RBS China’’ RBS China Investments S. a r.l.
‘‘RBS Group’’ The Royal Bank of Scotland Group plc
‘‘RMB’’ or ‘‘Renminbi’’ Renminbi, the lawful currency of the PRC
‘‘SALE’’ Singapore Aircraft Leasing Enterprise Pte. Ltd.
‘‘SFO’’ Securities and Futures Ordinance of the laws of HKSAR.
‘‘SHIBOR’’ Shanghai Inter-Bank Offered Rate
‘‘UBS’’ UBS AG
‘‘Western China’’ the area including Chongqing, Sichuan, Guizhou, Yunnan, Shaanxi, Gansu,
Ningxia, Qinghai, Tibet and Xinjiang
Bank of China Annual Report 2006366

�������� ��� ����� � �� ��������� ����� ��������� ���������� �� � � !"�#��$ !�$% "�"� &���� ������$� ��$'����� ��%�()��� �� *+���� �+� "�"� #�,"���� -./ ���� 0���� 1./ ��'��%�� "���'#���&,� 2���� ��� 3./ ,�$$ ��%�( &$"� &��� ���$�,����$ #+$����'0��(
4+� 5!* $��� ������0��� "��&#�� 2+�#+ #������ 2��� 0�, 2�$$',������ 0����� #���0��� �� �##����#� 2��+ �+� &$�� �0 �+�5���� !��2���+�" *�&�#�$(

ANNUAL REPORT 2006
Stock Code: 3988
Strive Excellence
Bank o
f China Lim
itedA
nnual Report 2006
Stock Code: 3988
Bank of China Limited(a joint stock company incorporated in the People’s Republic of China with limited liability)
1 Fuxingmen Nei Dajie, Beijing 100818, China
Tel: (86) 010-66596688 Fax: (86) 010-66593777 http://www.boc.cn
for


![[XLS] · Web viewVikas Tiwari N/C/200905/15 Vijendra Singh Chaudhary N/C/200905/16 Dalwinder Kaur Shah N/C/200905/17 Brajesh Kumar Singh N/C/200905/18 Himanshu Gupta N/C/200905/19](https://static.fdocuments.in/doc/165x107/5ab776317f8b9ac1058b746d/xls-viewvikas-tiwari-nc20090515-vijendra-singh-chaudhary-nc20090516-dalwinder.jpg)