ofr20191134.pdf - Regional Hydrostratigraphic Framework of ...
54
U.S. Department of the Interior U.S. Geological Survey Open-File Report 2019–1134 Prepared in cooperation with the U.S. Air Force Regional Hydrostratigraphic Framework of Joint Base McGuire-Dix-Lakehurst and Vicinity, New Jersey, in the Context of Perfluoroalkyl Substances Contamination of Groundwater and Surface Water
Transcript of ofr20191134.pdf - Regional Hydrostratigraphic Framework of ...

U.S. Department of the InteriorU.S. Geological Survey
Open-File Report 2019–1134
Prepared in cooperation with the U.S. Air Force
Regional Hydrostratigraphic Framework of Joint Base McGuire-Dix-Lakehurst and Vicinity, New Jersey, in the Context of Perfluoroalkyl Substances Contamination of Groundwater and Surface Water

Cover. Clay-sand facies of the Cohansey Formation exposed in a gully, Manchester Township, New Jersey. Notebook for scale.

Regional Hydrostratigraphic Framework of Joint Base McGuire-Dix-Lakehurst and Vicinity, New Jersey, in the Context of Perfluoroalkyl Substances Contamination of Groundwater and Surface Water
By Alex R. Fiore
Prepared in cooperation with the U.S. Air Force
Open-File Report 2019–1134
U.S. Department of the InteriorU.S. Geological Survey

U.S. Department of the InteriorDAVID BERNHARD, Secretary
U.S. Geological SurveyJames F. Reilly II, Director
U.S. Geological Survey, Reston, Virginia: 2020
For more information on the USGS—the Federal source for science about the Earth, its natural and living resources, natural hazards, and the environment—visit https://www.usgs.gov or call 1–888–ASK–USGS.
For an overview of USGS information products, including maps, imagery, and publications, visit https://store.usgs.gov/.
Any use of trade, firm, or product names is for descriptive purposes only and does not imply endorsement by the U.S. Government.
Although this information product, for the most part, is in the public domain, it also may contain copyrighted materials as noted in the text. Permission to reproduce copyrighted items must be secured from the copyright owner.
Suggested citation:Fiore, A.R., 2020, Regional hydrostratigraphic framework of Joint Base McGuire-Dix-Lakehurst and vicinity, New Jersey, in the context of perfluoroalkyl substances contamination of groundwater and surface water: U.S. Geological Survey Open-File Report 2019–1134, 42 p., https://doi.org/ 10.3133/ ofr20191134.
ISSN 2331-1258 (online)

iii
Acknowledgments
The author would like to acknowledge the staff of the Air Force Civil Engineer Center for sup-port and cooperation, as well as colleagues from HydroGeoLogic, Inc.; Burns & McDonnell; and Tehama, LLC, working at Joint Base McGuire-Dix-Lakehurst. Technical reviews of this manu-script were provided by Stephen Cauller (U.S. Geological Survey [USGS]), Emmanuel Charles (USGS), and Peter Sugarman (New Jersey Geological and Water Survey). USGS interns Michael DeBonis, Orion Farr, Matthew Pronschinske, and Morgan Torstenson assisted in the preparation of the data used in this report.


v
ContentsAcknowledgments ........................................................................................................................................iiiAbstract ...........................................................................................................................................................1Introduction.....................................................................................................................................................1
Purpose and Scope ..............................................................................................................................3Area of Investigation ............................................................................................................................4Previous Investigations........................................................................................................................4Well Numbering System ......................................................................................................................4
Data and Methods .........................................................................................................................................4Hydrostratigraphic Framework....................................................................................................................6
Kirkwood-Cohansey Aquifer System .................................................................................................6Semiconfining Subunits Within the Kirkwood-Cohansey Aquifer System .........................7
Piney Point Aquifer ...............................................................................................................................8Manasquan-Shark River Confining Unit ...........................................................................................8Confined Portion of the Vincentown Aquifer....................................................................................9
Downdip Limit of the Confined Portion of the Vincentown Aquifer .....................................9Unconfined Portion of the Vincentown Aquifer .............................................................................12Navesink-Hornerstown Confining Unit ...........................................................................................15
Summary........................................................................................................................................................15References Cited..........................................................................................................................................16Appendix 1 Lithologic Logs and Drillers’ Logs for Selected Wells ...................................................19
Figures
1. Map showing location of Joint Base McGuire-Dix-Lakehurst and reconnaissance areas, New Jersey .........................................................................................2
2. Map showing downdip limit of the confined portion of the Vincentown aquifer in the vicinity of Joint Base McGuire-Dix-Lakehurst, New Jersey, from various publications .................................................................................................................................11
3. Map showing location of wells 051250 / 08-MW-52 and 051251 / 08-MW-102, Joint Base McGuire-Dix-Lakehurst, New Jersey .................................................................13
4. Log interpretation of wells 051250 / 08-MW-52 and 051251 / 08-MW-102, Joint Base McGuire-Dix-Lakehurst, New Jersey ...........................................................................14
5. Hydrographs of continuous groundwater levels at wells 051250 / 08-MW-52 and 051251 / 08-MW-102, Joint Base McGuire-Dix-Lakehurst, New Jersey, 2018 .................14
Tables
1. Stratigraphic relations between selected hydrogeologic units and geologic formations in the vicinity of Joint Base McGuire-Dix-Lakehurst, New Jersey ..................3
2. Identifiers for wells on Joint Base McGuire-Dix-Lakehurst, New Jersey ..........................5 3. Wells used to develop a hydrostratigraphic framework, and interpreted aquifer
structure points, Joint Base McGuire-Dix-Lakehurst and vicinity, New Jersey ...............5

vi
Plates
Plate 1 Map of well locations and outcrop areas of hydrostratigraphic units, Joint Base McGuire-Dix-Lakehurst and vicinity, New Jersey
Plate 2 Map of the bottom of the Kirkwood-Cohansey aquifer system, Joint Base McGuire-Dix-Lakehurst and vicinity, New Jersey
Plate 3 Map of the top of semiconfining subunits within the Kirkwood-Cohansey aquifer system, Joint Base McGuire-Dix-Lakehurst and vicinity, New Jersey
Plate 4 Map of the thickness of semiconfining subunits within the Kirkwood-Cohansey aquifer system, Joint Base McGuire-Dix-Lakehurst and vicinity, New Jersey
Plate 5 Map of the top of the Piney Point aquifer, Joint Base McGuire-Dix-Lakehurst and vicinity, New Jersey
Plate 6 Map of the top of the confined portion of the Vincentown aquifer, Joint Base McGuire-Dix-Lakehurst and vicinity, New Jersey
Plate 7 Map of the thickness of the confined portion of the Vincentown aquifer, Joint Base McGuire-Dix-Lakehurst and vicinity, New Jersey
Plate 8 Map of the bottom of the unconfined portion of the Vincentown aquifer, Joint Base McGuire-Dix-Lakehurst and vicinity, New Jersey
Plate 9 Map of the bottom of the Navesink-Hornerstown confining unit, Joint Base McGuire-Dix-Lakehurst and vicinity, New Jersey
Plate 10 Sections A-A’ through E-E’, Joint Base McGuire-Dix-Lakehurst and vicinity, New Jersey
Plate 11 Sections F-F’ through I-I’, Joint Base McGuire-Dix-Lakehurst and vicinity, New Jersey
Plate 12 Sections J-J’ through L-L’, Joint Base McGuire-Dix-Lakehurst and vicinity, New Jersey

vii
Conversion FactorsU.S. customary units to International System of Units
Multiply By To obtain
Length
foot (ft) 0.3048 meter (m)mile (mi) 1.609 kilometer (km)
Area
acre 4,047 square meter (m2)acre 0.4047 hectare (ha)acre 0.4047 square hectometer (hm2)acre 0.004047 square kilometer (km2)square mile (mi2) 259.0 hectare (ha)square mile (mi2) 2.590 square kilometer (km2)
Volume
ounce, fluid (fl. oz) 0.02957 liter (L)pint (pt) 0.4732 liter (L)quart (qt) 0.9464 liter (L)gallon (gal) 3.785 liter (L)cubic inch (in3) 0.01639 liter (L)
DatumVertical coordinate information is referenced to the North American Vertical Datum of 1988 (NAVD 88).
Horizontal coordinate information is referenced to the North American Datum of 1983 (NAD 83).
Altitude, as used in this report, refers to distance above the vertical datum.

AbbreviationsAFFF aqueous film forming foam
AFCEC U.S. Air Force Civil Engineer Center
CSM conceptual site model
DWPS drinking water protection study
EPA U.S. Environmental Protection Agency
JBMDL Joint Base McGuire-Dix-Lakehurst
NJDEP New Jersey Department of Environmental Protection
PFAS per- and polyfluoroalkyl substances
PFHxS perfluorohexanesulphonic acid
PFNA perfluorononanoic acid
PFOA perfluorooctanoic acid
PFOS perfluorooctanesulfonic acid
USGS U.S. Geological Survey
viii

Regional Hydrostratigraphic Framework of Joint Base McGuire-Dix-Lakehurst and Vicinity, New Jersey, in the Context of Perfluoroalkyl Substances Contamination of Groundwater and Surface Water
By Alex R. Fiore
AbstractA study was conducted by the U.S. Geological Survey, in
cooperation with the U.S. Air Force, to describe the regional hydrostratigraphy of shallow aquifers and confining units underlying Joint Base McGuire-Dix-Lakehurst (JBMDL) and vicinity, New Jersey, in the context of contamination of groundwater and surface water by per- and polyfluoroalkyl substances (PFAS) potentially originating from JBMDL sources. The aquifers studied are two that crop out within JBMDL boundaries—the Kirkwood-Cohansey aquifer sys-tem and the Vincentown aquifer—and another aquifer near JBMDL that does not crop out at land surface—the Piney Point aquifer. The unconfined portion of the Vincentown aquifer and portions of the Kirkwood-Cohansey aquifer system that overlie the unconfined portion of the Vincentown aquifer are consolidated into, and described as, a single, separate unconfined aquifer system. Regionally extensive clay subunits that potentially create semiconfined hydrologic conditions within the mostly unconfined Kirkwood-Cohansey aquifer system also are identified. Two confining units were studied—the Manasquan-Shark River confining unit underly-ing the Kirkwood-Cohansey aquifer system, which includes the basal confining sediment in the Kirkwood Formation, and the Navesink-Hornerstown confining unit underlying the Vincentown aquifer. The hydrostratigraphic units are defined using available borehole geophysical logs, lithologic logs, and (or) drillers’ logs from 131 wells and are presented in a series of 8 aquifer structure maps and 12 cross sections. The framework positions JBMDL into a regional hydrostrati-graphic structure for which higher-resolution delineation of the shallow aquifers can be constructed to determine potential pathways of PFAS contamination in groundwater to off-site drinking water wells in areas adjacent to JBMDL.
IntroductionJoint Base McGuire-Dix-Lakehurst (JBMDL) is a
triservice military installation composed of McGuire Air Force Base, Army post Fort Dix, and Naval Air Engineering Station Lakehurst and covers about 42,000 contiguous acres (66 square miles) in Burlington and Ocean Counties in New Jersey (fig. 1). The U.S. Air Force Civil Engineer Center (AFCEC) is evaluating groundwater contamination issues associated with per- and polyfluoroalkyl substances (PFAS) at JBMDL, including perfluorooctanoic acid (PFOA), per-fluorooctane sulfonic acid (PFOS), and perfluorononanoic acid (PFNA). Most of the PFAS have been introduced by fire-suppressing aqueous film forming foam (AFFF), which originated at multiple fire training areas, AFFF storage or dis-posal areas, or past aircraft, vehicle, or fuel fires on the base. Concerns that PFAS have migrated to civilian domestic wells in areas adjacent to JBMDL has prompted AFCEC to initiate a Drinking Water Protection Study (DWPS) to investigate the multiple releases of PFAS within the hydrologic system and provide a higher-resolution update to the hydrogeologic con-ceptual site model (CSM) previously developed by AECOM (2010). Five reconnaissance areas have been delineated by the Air Force in neighborhoods adjacent to the JBMDL boundary (fig. 1) where off-base civilian domestic wells are potentially at risk for PFAS contamination by on-base sources (HGL, 2011).
New Jersey, through the New Jersey Department of Environmental Protection (NJDEP), became the first State to adopt a maximum contaminant level and water-quality standard for any PFAS. In 2018, a groundwater quality stan-dard of 13 parts per trillion (ppt; 13 nanograms per liter) was adopted by the State for PFNA. NJDEP announced an interim groundwater quality criterion of 10 ppt for PFOA and PFOS in

2 Regional hydrostratigraphic framework of Joint Base McGuire-Dix-Lakehurst and Vicinity, New Jersey
EXPLANATIONLand-surface altitude—
in feet NAVD 88
PFAS reconnaissance area
Site 4
Site 14
Site 16
Site 17
Site 18
Base boundary
OCEAN COUNTY
BURLINGTON COUNTY
MONMOUTHCOUNTY
ManchesterTownship
Jackson Township
Pemberton Township
PlumstedTownship
New HanoverTownship
North HanoverTownship
SpringfieldTownship
ChesterfieldTownship
Woodland Township
Upper FreeholdTownship
SouthamptonTownship
MansfieldTownship
WrightstownBorough
LakehurstBorough
PembertonBorough
Fort Dix
McGuireAir Force
Base
Naval Air EngineeringStation Lakehurst
74°18'74°20'74°22'74°24'74°26'74°28'74°30'74°32'74°34'74°36'74°38'74°40'
40°06'
40°04'
40°02'
40°00'
39°58'
39°56'
Maparea
0 1 2 3 4 5 MILES
0 1 2 3 4 5 KILOMETERS
Base from Lidar digital elevation model from New Jersey Office of Information Technology,Office of Geographic Information Systems, 2012
High : 200
Low : 50
Figure 1. Location of Joint Base McGuire-Dix-Lakehurst and reconnaissance areas, New Jersey. (NAVD 88, North American Vertical Datum of 1988; PFAS, per- and polyfluoroalkyl substances)

Introduction 3
a press release on January 18, 2019 (NJDEP, 2019). In 2016, the U.S. Environmental Protection Agency (EPA) issued a non-regulatory lifetime Health Advisory of 70 ppt for individ-ual and combined PFOA and PFOS in drinking water (EPA, 2019). Studies indicate that exposure to PFOA and PFOS at greater than certain levels may result in adverse health effects (EPA, 2019).
The U.S. Geological Survey (USGS), in cooperation with the U.S. Air Force, conducted a study of the regional-scale hydrostratigraphic framework of shallow aquifers underlying JBMDL and vicinity and provided data for use in the ongo-ing DWPS in the updating of the CSM being performed by contractors of the U.S. Army Corps of Engineers. The frame-work includes the two aquifers that crop out within JBMDL boundaries—the Kirkwood-Cohansey aquifer system and the Vincentown aquifer, another shallow aquifer in the vicinity of the JBMDL—the Piney Point aquifer, and two interlying confining units amongst these aquifers—the Manasquan-Shark River and Navesink-Hornerstown (table 1). Assessing the structure of these aquifers and confining units at a regional scale provides a better understanding of the overall hydro-stratigraphic context into which the higher-resolution CSM hydrogeology can be situated. Positioning the CSM region-ally is essential given the large geographic area of JBMDL,
the multiple source areas of PFAS, and the groundwater flow distances the PFAS can potentially travel to civilian drinking water wells outside the boundaries of JBMDL.
Purpose and Scope
This report describes the extent and configuration of the Kirkwood-Cohansey aquifer system, Piney Point aquifer, confined portion of the Vincentown aquifer, and unconfined portion of the Vincentown aquifer that includes overlying por-tions of the Kirkwood-Cohansey aquifer system in the vicinity of JBMDL. The extent and configuration of the Manasquan-Shark River and Navesink-Hornerstown confining units and potential regional confining or semiconfining subunits within the Kirkwood-Cohansey aquifer system also are described. The hydrostratigraphic framework is presented in a series of 12 cross sections and 8 maps developed primarily through correlations of borehole geophysical logs, lithologic logs, and drillers’ logs collected from 131 wells during previous inves-tigations. The framework will provide the regional hydro-stratigraphic context to the U.S. Army Corps of Engineers contractors who are updating the CSM of JBMDL and provide the overall setting for concurrent PFAS-related studies at JBMDL and vicinity. The hydrostratigraphy also can serve as
Table 1. Stratigraphic relations between selected hydrogeologic units and geologic formations in the vicinity of Joint Base McGuire-Dix-Lakehurst, New Jersey.
[Modified from Sugarman and others (2013, 2018a, b), Rea (2017), and Zapecza (1989)]
Geologic Epoch1 Formation name Hydrogeologic unit
HoloceneSurficial units
Kirkwood-Cohansey aquifer systemPleistocenePliocene
MioceneCohansey FormationKirkwood Formation
Manasquan-Shark River confining unitEocene
Shark River Formation Piney Point aquiferManasquan Formation
Composite confining unitPaleocene
Vincentown Formation Vincentown aquiferHornerstown Formation
Navesink-Hornerstown confining unit
Late Cretaceous
Tinton Sand2
Red Bank Sand2
Navesink FormationMount Laurel Formation
Wenonah-Mount Laurel aquiferWenonah Formation
1Oligocene units are not present in the study area and are not included on this chart.2The Red Bank Sand and Tinton Sand are minor aquifers in Monmouth County, New Jersey, but are not mapped in Burlington and Ocean Counties.

4 Regional hydrostratigraphic framework of Joint Base McGuire-Dix-Lakehurst and Vicinity, New Jersey
the basis for the subsurface hydrogeologic structure for inclu-sion in a USGS-developed groundwater flow simulation model of JBMDL.
Area of Investigation
The JBMDL regional study area, as delineated in this report, is defined by the outcrop area of the Navesink-Hornerstown confining unit in the northwest, the presumed groundwater flow boundary created by the Toms River and its tributaries in the northeast and southeast, and the presumed groundwater flow boundary created by the North Branch Rancocas Creek and its tributaries in the southwest (pl. 1). These boundaries were chosen to represent the overall uncon-fined groundwater flow domain for JBMDL and vicinity.
The study area spans northern Burlington and Ocean County, and a small area of southern Monmouth County (fig. 1; pl. 1). Municipalities in close proximity to JBMDL include Springfield Township, North Hanover Township, New Hanover Township, Wrightstown Borough, and Pemberton Township in Burlington County, and Plumsted Township, Jackson Township, Lakehurst Borough, and Manchester Township in Ocean County (fig. 1)
Previous Investigations
The hydrogeology of the area encompassed by JBMDL is discussed in the preliminary CSM by AECOM (2010). Work on the hydrostratigraphy of McGuire Air Force Base and por-tions of Fort Dix was completed in 1996 (O. Zapecza, U.S. Geological Survey, written commun., 1996). Fiore (2016), Szabo and others (2005), and Jacobsen (2000) provided site-scale hydrogeologic information for shallow portions of the Kirkwood-Cohansey aquifer system for small geographic areas in Fort Dix but provide limited hydrostratigraphic context. Walker and others (2008) developed a Kirkwood-Cohansey aquifer system framework for a drainage basin close to the southwestern border of JBMDL.
Zapecza (1989) provided a regional-scale hydrostrati-graphic framework for the entire New Jersey Coastal Plain. County-specific aquifer maps and sections, and other hydro-logic information, are available for Ocean County (Sugarman and others, 2013; Anderson and Appel, 1969) and Burlington County (Sugarman and others, 2018a; Rush, 1968). The hydrostratigraphy of large portions of Ocean County has been delineated in other groundwater studies (Mullikin, 2011; Cauller and others, 2016; Fiore and others, 2018).
Bedrock and (or) surficial 1:24,000-scale geologic maps of USGS 7.5-minute quadrangles that contain parts of JBMDL are available in reports by Minard and Owens (1962), Owens and Minard (1962), Minard and Owens (1963), Owens and Minard (1964), Stanford (2016), and Sugarman and others (2016). Other 1:24,000-scale geologic maps of the study area, but not containing parts of JBMDL, are available in reports by Minard (1964), Sugarman and others (1991, 2018b), Stanford (2000a, b), and Stanford and Sugarman (2017).
Well Numbering System
This report utilizes a well-numbering system used by USGS in New Jersey since 1978. The unique well number consists of a numerical two-digit county code followed by a four-digit sequence number. In this report, the county codes used are 05, Burlington County; 25, Monmouth County; and 29, Ocean County. For example, well 050330 is the 330th well inventoried in Burlington County. With this method, each well has a unique identifier. Table 2 includes the unique identi-fiers for wells located on JBMDL that are used in this report, along with the names used locally at JBMDL.
Data and Methods
The correlations used in this hydrostratigraphic frame-work are primarily based on existing borehole geophysical logs and (or) detailed lithologic descriptions by the USGS, New Jersey Geological and Water Survey, or others from 131 wells in or near the study area (table 3, in a separate file on the web page). Some wells outside the study area were used to fill data gaps where no wells were present in the study area. No new data were collected by the USGS for hydrostrati-graphic analysis in this study. All logs used in this report are accessible in the online USGS GeoLog Locator database (U.S. Geological Survey, 2019a).
Borehole geophysical logs allow for the delineation of aquifers and confining units in the subsurface. Two types of borehole geophysical logs were used in this study, natural gamma logs and resistivity logs. Fine-grained, low perme-ability sediments generally have larger quantities of gamma-emitting radioisotopes, such as potassium-40, and are less resistive to the flow of electrical current than other sediments; thus, inflections to the right on a natural gamma log and inflec-tions to the left on a resistivity log generally correspond to clays and silts (Keys, 1990).
Drillers’ logs were used in areas where no other data sources were available. Given that drillers’ logs are inherently less consistent in terms of descriptions and accuracy of depths and sediment textures compared to coring and descriptions by geologists, the structure of the units is considered approximate and not necessarily an exact representation; depths of actual subsurface conditions are also approximate.
Topographic contouring of the top and bottom altitudes and thicknesses of hydrostratigraphic units was performed manually. The contour lines were then rasterized electroni-cally using an iterative finite-difference interpolation process in the geographic information system (Esri, 2018). Some wells, particularly those in close proximity to others but for which aquifer structure depths and altitudes may differ, may not appear to be perfectly within the contours illustrated on the maps as a result of this technique.

Data and Methods 5
Table 2. Identifiers for wells on Joint Base McGuire-Dix-Lakehurst, New Jersey.
[NWIS, U.S. Geological Survey National Water Information System database]
NWIS site number Unique identifier Local name
395949074365501 050330 Fort Dix 4400034074362101 050331 Fort Dix 1400105074352101 050332 Fort Dix 5400129074365601 050333 Fort Dix 2400138074375301 050334 Fort Dix 3400141074352501 050335 McGuire D400216074360701 050337 McGuire A (old)400300074351701 050340 McGuire B395938074374201 050388 Fort Dix 6395941074325001 050754 Range HQ 7400148074352001 051250 08-MW-52400148074352101 051251 08-MW-102400057074382301 051319 MAG-71400056074382801 051326 MAG-69400154074381901 051365 DXGB-4395953074332601 051416 R&G Club Range 14400156074342401 051795 McGuire C400048074341701 051901 ASP-1395851074365501 051938 MW-3D400210074354201 051992 McGuire A-R400055074382501 052018 MAG-106C400101074354001 052019 00-PZ-102400115074375701 052020 GTG-02400144074352601 052021 00-PZ-103400146074340201 052022 00-PZ-104400217074360901 052023 00-PZ-101400218074343901 052024 BGMW-6D400105074224401 290118 Lakehurst 32400101074224301 291265 Lakehurst 45400144074192801 291577 Lakehurst 48400207074303201 291578 Fort Dix Brindle Lake400148074313001 292196 ARDEC-1395736074255001 292238 COL Liberty PW-2
Table 3. Wells used to develop a hydrostratigraphic framework, and interpreted aquifer structure points, Joint Base McGuire-Dix-Lakehurst and vicinity, New Jersey.
[NWIS, USGS National Water Information System database; lidar, light detection and ranging; ft, feet; NAVD 88, North American Vertical Datum of 1988; --, not applicable; G, natural gamma log; R, resistivity log; L, lithologic log; D, driller log. Table 3 is downloadable as a CSV file from https://doi.org/10.3133/ ofr20191134]

6 Regional hydrostratigraphic framework of Joint Base McGuire-Dix-Lakehurst and Vicinity, New Jersey
Hydrostratigraphic FrameworkThe hydrostratigraphic framework and the geometry
of the aquifer units are presented in a series of 8 maps (pls. 2–9) and 12 cross sections (pls. 10–12). Maps delineate the structural contours for the bottom of the Kirkwood-Cohansey aquifer system, the top of the regional semiconfining subunits within the Kirkwood-Cohansey aquifer system, the thickness of these subunits, the top of the Piney Point aquifer, the top of the confined portion of the Vincentown aquifer, the thickness of the confined portion of the Vincentown aquifer, the bottom of the unconfined portion of the Vincentown aquifer, and the bottom of the Navesink-Hornerstown confining unit. Altitudes for each aquifer and confining unit are given on the associated map and in table 3; wells without an altitude value either do not penetrate the given aquifer or the log quality was deemed too poor to determine a value for that particular unit at that site. Lines of section A–A′ through L–L′ are aligned roughly subparallel to the northwest–southeast direction of dip, and each extends to an altitude of -300 feet (ft) to encompass each of the aquifers included in the study area.
Surficial deposits commonly overlie the Coastal Plain formations at land surface and can be up to 100 ft thick (Stanford and others, 2007). Where present, the surficial deposits are assumed to be part of the aquifer over which they reside. Thus, the altitude of the top of each hydrologic unit in its outcrop area would equate to land-surface altitude. A simi-lar treatment is given to the outcrop areas in Sugarman and others (2013, 2018b), but Zapecza (1989) does not consider outcrop areas part of that hydrostratigraphic unit.
Borehole geophysical logs used in developing the frame-work are shown directly on the cross sections. The wells with borehole geophysical logs used for the framework are listed in table 3. For wells with gamma logs and resistivity logs avail-able for the same well, only gamma logs are shown on the cross section for ease of viewing. Drillers’ logs and lithologic logs discussed in this report are provided in appendix 1.
Kirkwood-Cohansey Aquifer System
The Kirkwood-Cohansey aquifer system consists of the Miocene-age Kirkwood Formation and Cohansey Formation, as well as younger surficial formations such as the Beacon Hill Gravel (not shown in a figure) in some locations. The Kirkwood-Cohansey aquifer system primarily consists of fine- to coarse-grained sand with interbedded lenses of clay-silt and locally prevalent gravel lenses (Sugarman and others, 2013). The sediments in the Kirkwood-Cohansey aquifer system typically are in shades of brown, red, yellow, gray, and white (Stanford, 2013, 2016). The Cohansey Formation may be cemented with iron oxide in some locations, and the Kirkwood Formation contains some mica (Stanford, 2013, 2016); these features can reasonably be used as identifying characteristics of the Kirkwood-Cohansey aquifer system in drillers’ logs.
The bottom of the Kirkwood-Cohansey aquifer system is equivalent to the top of the Manasquan-Shark River confining unit. The basal portion of the Kirkwood-Formation is primar-ily composed of silt and clay (Sugarman and others, 2016) and is included with the underlying confining unit (Manasquan-Shark River) rather than the Kirkwood-Cohansey aquifer system. Outliers of the Kirkwood Formation and Cohansey Formation are present in topographically high, updip areas (Sugarman and others, 2013, 2018b). These outliers are isolated occurrences of Kirkwood Formation or Cohansey Formation not hydraulically connected to the Kirkwood-Cohansey aquifer system and thus not considered part of the aquifer system in this report. Instead the outliers are regarded as surficial deposits overlying other hydrostratigraphic units.
Contours of the altitude of the bottom of the Kirkwood-Cohansey aquifer system are depicted in plate 2. In the study area, the altitude of the bottom of the Kirkwood-Cohansey aquifer system ranges from more than 135 ft to less than -145 ft. Within JBMDL, the bottom of the Kirkwood-Cohansey aquifer system is shallowest at an altitude of about 124 ft at well 051365 on section C–C′ where it is mapped as overlying the unconfined portion of the Vincentown aquifer, described below. The altitude of the bottom of the aquifer system may reach 140 ft farther updip from well 050340 on section F–F′. The Kirkwood-Cohansey aquifer system is deep-est at JBMDL at an altitude of about -53 ft at well 292238 on section G–G′ (pl. 2) but may reach as deep or deeper at the southeasternmost corner of Lakehurst between wells 291577 and 290429 on section J–J′. Given the higher altitude at well 292238, that location is where the Kirkwood-Cohansey aqui-fer system is thickest at JBMDL. The Kirkwood-Cohansey aquifer system is thinnest updip along the outcrop areas and is particularly thin at JBMDL near the Site 4 reconnaissance area (pl. 11) and updip from well 052021 on section E–E′ where the aquifer is generally less than 20 ft thick (pl. 10).
Contours of the bottom of the aquifer system indicate an undulating topography that appears to plateau or level off in some areas owing to a slightly higher altitude of the Kirkwood-Cohansey indicated at some wells compared to others along the strike direction. The most noticeable of these plateaus is the large zone of 0- to 20-ft altitude south of the Site 14 reconnaissance area. On JBMDL, the bottom of the Kirkwood-Cohansey aquifer system appears to plateau around 100–120 ft on the western side of McGuire Air Force Base and part of Fort Dix, as indicated by wells on sections C–C′ and D–D′. Much of this leveling off is caused by the interpreted 108-ft altitude at well 050331 on section C–C′. The lithologic log for this well describes a yellow fine-grained sand from the 0- to 26-ft depth below land surface, underlain by a yellow very fine-grained clayey sand from 26 to 58 ft; no sample was collected from 58 to 65 ft, and a greenish-grey sandy clay and glauconite was present at 65 to 174 ft (app. 1). The bottom of the Kirkwood-Cohansey aquifer system, the entire Manasquan-Shark River confining unit, and the top of the Vincentown aquifer are not clear in this log, primarily owing

Hydrostratigraphic Framework 7
to the unknown lithology from the 58- to 65-ft depth and the lack of detailed lithology from the 65- to 174-ft depth. The upper 26 ft was assumed to be the Kirkwood-Cohansey aqui-fer system, which corresponds to a bottom altitude of 108 ft, but the clayey sand from 26 to 58 ft may also be Kirkwood-Cohansey aquifer system, in which case the bottom altitude would occur at 76 ft, which is also reasonable. The 26-ft depth was used because the 65-ft depth indicates a reason-able approximation for the top of the Vincentown aquifer and because the other wells farther downdip on section C–C′ also indicate shallower Kirkwood-Cohansey aquifer system bottom altitudes compared to the wells around it.
Because the Kirkwood-Cohansey aquifer system is the largest unconfined aquifer system at JBMDL by area, it seems likely that the Kirkwood-Cohansey aquifer system would contain most of the PFAS contamination in groundwater on JBMDL. The hydrogeologic heterogeneity and complexity in the Kirkwood-Cohansey aquifer system need to be considered when interpreting potential groundwater flow paths and PFAS migration pathways.
Semiconfining Subunits Within the Kirkwood-Cohansey Aquifer System
Despite being categorized as an unconfined aquifer, the low-permeability clay subunits in the Kirkwood-Cohansey aquifer system create high vertical and horizontal heterogene-ity and can cause semiconfined conditions and perched water tables within the aquifer (Zapecza, 1989; Sugarman and oth-ers, 2013; Fiore and others, 2018). The subunits of interbedded clays can be continuous over several miles (Stanford, 2016). Clays in the Kirkwood-Cohansey aquifer system can be rich in organic carbon when deposited in back-bay settings, making them black in color (Stanford, 2013; Stanford, 2016). These areas of high organic carbon have high sorption potential for PFAS compounds in the subsurface, which would pose an important consideration in assessing the fate, transport, and remediation of PFAS. Thus, mapping the extent and configura-tion of these subunits within the Kirkwood-Cohansey aquifer system that extend regionally across large portions of the study area is important for full characterization of the aquifer.
The top altitudes and thicknesses of the subunits within the Kirkwood-Cohansey aquifer system that may cause semi-confined conditions within the aquifer are shown in plates 3 and 4, respectively. Six subunits were substantial enough to be identified in the study area. Another subunit was identified at well 051390 on section A–A′, but it did not correlate well with others around it and is assumed to be part of another subunit outside the study area. The top surface of each of these identified subunits strikes parallel to the general strike of the Kirkwood-Cohansey aquifer system and is thicker in the middle and thinner around the edges. The top surfaces of 4 of the 6 subunits share the same general southeastern dip direction of the Kirkwood-Cohansey aquifer system. The top
surfaces of the subunit spanning from well 050683 on sec-tion A–A′ to 290425 on section G–G′ and the subunit from well 051597 on section B–B′ to wells 051600 and 050357 on section F–F′ dip generally toward the northwest. This incon-sistency likely stems from the composition of these subunits; they may be composed of a series of interbedded clays and sands rather than a single large clay lens. Although mapped as one subunit, it may in reality consist of multiple small subunits whose geometry is obscured by the resolution of this mapping and is susceptible to subjective interpretations. For example, Walker and others (2008) consider the subunit at wells 051556 and 051560 on section C–C′ to extend to well 051597 on sec-tion B–B′, but for this study it is considered to be two separate subunits. Therefore, the geometry of these units is considered a general conceptualization of regional importance and is not assumed to be local ground truth without further testing and data. Similarly, other clay lenses may be present within the Kirkwood-Cohansey aquifer system besides those mapped here, but additional data and higher resolution mapping are required to fully locate their presence.
Two regional subunits are mapped in proximity to a PFAS reconnaissance area. Notably, a subunit based on wells 291265, 291380, 291577, and 292043 spans a large portion of the Lakehurst installation of JBMDL, from section H–H′ through off-site well 292043 on section L–L′. This subunit underlies PFAS reconnaissance areas sites 16, 17, and 18, where the bottom of the Kirkwood-Cohansey aquifer sys-tem is deeper than at the other reconnaissance areas. Many domestic wells in these reconnaissance areas are screened in the Kirkwood-Cohansey aquifer system, so hydrologic heterogeneity caused by this subunit could have an effect on the groundwater flow system around those wells. The presence of a low-permeability subunit at well 291265 is based on the high gamma intensities for that well from about 40 to 20 ft in altitude (pl. 11), which falls into an interval on the drill-ers’ log described as “brown clay and sand” (app. 1). Nearby well 290118 has only a drillers’ log that does not indicate a clay at this location (app. 1). However, that drillers’ log is less detailed, and it is assumed this subunit was missed.
Well 291380 on section I–I′ has high gamma intensity from about 25 to 15 ft in altitude (pl. 11), which correlates into a “clay, brown” interval on a low-resolution drillers’ log (app. 1). On section J–J′, a “brown sand and clay” described on the drillers’ log for well 291577 at Lakehurst (app. 1), cor-related to high gamma intensity from altitudes of 20 to -5 ft, is also assumed to be part of this subunit (pl. 12). The next downdip well, 290429, indicates no subunit at this depth, so this subunit likely pinches out between 291577 and 290429 beneath Site 18 reconnaissance area. Likewise, no subunit is indicated at wells 290132 and 290134 updip from well 291577 on section J–J′, so the updip pinch out of the subunit likely occurs somewhere beneath Site 16 and Site 17 reconnaissance areas. A 10-ft-thick clay was described on the drillers’ log of well 292043 on section L–L′ (app. 1), which is assumed to be near the easternmost extent of this subunit.

8 Regional hydrostratigraphic framework of Joint Base McGuire-Dix-Lakehurst and Vicinity, New Jersey
Another subunit is present near PFAS Site 14 recon-naissance area on the southwestern side of Fort Dix. This subunit may overlap Site 14, based on its identification in wells 051769 on section B–B′ and 050737 on section C–C′. The drillers’ log for well 051769 indicates a “silty grey clay” at a large interval from about the 21- to 76-ft depth (app. 1). The 21-ft depth is assumed to be the top of the subunit at an altitude of 59 ft, and the bottom of this subunit is assumed to extend to near the bottom of the Kirkwood-Cohansey aquifer system. If so, the location near this well would be the thick-est part of the subunit, but there is low likelihood that there is enough aquifer material underlying this subunit at this location from which a domestic well could be pumping groundwater. The subunit is thinner at well 050737 on section C–C′, which has a gamma log indicating elevated gamma intensity from about 62 to 72 ft in altitude (pl. 10), and indicates the subunit pinches out updip from this well before reaching updip wells 050796, 050380, and 050714, which are in Site 14 reconnais-sance area.
The northeastern extent of the subunit may extend to well 051179 on section E–E′, based on elevated gamma intensity from about 53 to 45 ft in altitude (pl. 10) that correlates with a “silty, sandy brown clay” described on the drillers’ log (app. 1). The presence of this subunit near well 051179 is noteworthy because of the detection of high levels of PFAS, predominantly PFOS and perfluorohexanesulphonic acid (PFHxS), in surface water, sediment, and fish tissue in this area (Goodrow and others, 2018) and the presence of domestic wells screened in the Kirkwood-Cohansey aquifer system in the surrounding neighborhood that may be exposed to the con-taminants. If these domestic wells are screened below this sub-unit and above the regional bottom of the Kirkwood-Cohansey aquifer system, then the subunit may semiconfine, or perhaps fully confine, the groundwater that is pumped to these wells and limit flow and transport pathways of PFAS from potential surficial sources. However, more data and a higher density of well logs in this area are needed to fully characterize the hydrogeology of this area.
Piney Point Aquifer
The Piney Point aquifer is within the Shark River Formation and consists of fine-to-very coarse glauco-nitic quartz sand that grades into finer sediments downdip (Sugarman and others, 2013, 2018b). The entirety of the Piney Point aquifer is confined, so nowhere does it crop out at land surface. Plate 5 depicts the altitude of the top of the Piney Point aquifer. The closest proximity of JBMDL to the updip limit of the Piney Point occurs approximately 9,500 ft down-dip from well 292238 along section G–G′.
The Piney Point aquifer is shallowest in the study area near well 290085 on section K–K′, where the altitude of the top of the aquifer is about -150 ft. At this location, the top of the Piney Point aquifer is approximately 75 ft deeper than the
bottom of the Kirkwood-Cohansey aquifer system. The Piney Point is deepest at well 292183 along section I–I′ where the top altitude is -270 ft.
Cauller and others (2016) suggest that groundwater in the Piney Point aquifer near the updip limit might have hydrau-lic connection with the Kirkwood-Cohansey aquifer system. However, groundwater withdrawals from the Piney Point aquifer are primarily east and south of the study area (DePaul and Rosman, 2015), so the likelihood of receptors in the Piney Point aquifer to potential PFAS contamination from JBMDL is small.
Manasquan-Shark River Confining Unit
The Manasquan-Shark River confining unit under-lies the Kirkwood-Cohansey aquifer system and consists of the Eocene-age Manasquan Formation and Shark River Formation. For this report, the lowermost portion of the Kirkwood Formation, which is clayey and silty (Sugarman and others, 2016), is considered to be part of this confining unit rather than the overlying Kirkwood-Cohansey aquifer system, similar to that assumed by Sugarman and others (2018a). The Manasquan Formation is primarily a green, yellow, olive, or gray calcareous clay-silt with glauconite sand in the clayey matrix that coarsens upward into a very fine quartz sand (Sugarman and others, 2016). Some drillers’ logs mention a “blue clay” (U.S. Geological Survey, 2019a) that is assumed to be the Manasquan Formation in this report. The Shark River Formation is a gray, olive, green, or brown calcareous clay-silt that coarsens upward into a quartz sand with minor glauconite (Sugarman and others, 2016).
The Manasquan Formation portion of the Manasquan-Shark River confining unit crops out in JBMDL (pl. 1), but the Shark River Formation portion does not crop out in the study area (Sugarman and others, 2013, 2018a). In some areas, the Kirkwood Formation directly overlies the Vincentown Formation updip from the subcrop of the Manasquan Formation, such as in the updip portions of sections B–B′ through F–F′ (pl. 1). The clay-silt facies of the Kirkwood Formation is the only portion of the confining unit between the Kirkwood-Cohansey aquifer system and Vincentown aquifer in these areas, and is as little as 1 ft thick at some locations. In such cases, the confining unit may be semiconfining or not confining at all, even where the Manasquan Formation is present.
Further downdip, the underlying Vincentown Formation grades into low permeability silts and clays that are hydrau-lically similar to the overlying Manasquan-Shark River confining unit; thus, the Vincentown Formation is no longer considered an aquifer (Zapecza, 1989; Sugarman and others, 2013, 2018a). The Manasquan-Shark River confining unit is therefore considered to be merged with the clays and silts of the Vincentown Formation, the clays and silts of the lower-most Kirkwood Formation overlying the Piney Point aquifer,

Hydrostratigraphic Framework 9
and the Navesink-Hornerstown confining unit. This amalgam of confining sediment is referred to as the “composite confin-ing unit” (table 1; Zapecza, 1989; DePaul and Rosman, 2015; Cauller and others, 2016; Rea, 2017).
No maps were created for the Manasquan-Shark River confining unit. The top of this unit is equivalent to the bot-tom of the Kirkwood-Cohansey aquifer system. The bottom of this unit is equivalent to the top of the confined portion of the Vincentown aquifer, where present, or the bottom of the Navesink-Hornerstown confining unit where the Vincentown aquifer grades into the composite confining unit.
Confined Portion of the Vincentown Aquifer
The Vincentown aquifer is a sparsely fossiliferous and glauconitic quartz sand composed of the Vincentown Formation of Paleocene age that grades into finer-grained silts and clays and becomes a confining unit downdip (Zapecza, 1989; Sugarman and others, 2013, 2018a). Zapecza (1989) describes the Vincentown aquifer as more calcareous than glauconitic in Burlington County and more glauconitic than calcareous in Ocean County. Other than direct infiltration in its outcrop area, the Vincentown aquifer receives recharge from the Kirkwood-Cohansey aquifer system where the overlying confining unit is thin or leaky (DePaul and Rosman, 2015; O. Zapecza, U.S. Geological Survey, written com-mun., 1996). The Vincentown aquifer is unconfined near its outcrop area and becomes confined where overlain by the thick Manasquan-Shark River confining unit. The confined portion of the Vincentown aquifer is discussed in this section; the unconfined portion is described in the section entitled “Unconfined Portion of the Vincentown Aquifer.” The altitude of the top of the confined portion of the Vincentown aquifer is shown in plate 6.
Most groundwater withdrawals from the Vincentown aquifer are made in northern Ocean County where the aqui-fer is more productive than in Burlington County (DePaul and Rosman, 2015) where it is thinner and less extensive (Sugarman and others, 2018a). The confined portion of the Vincentown aquifer is approximately 12,000 ft wide along dip in the southwest portion of the study area, increasing to approximately 57,000 ft wide along dip in the east and northeast extent of the study area. Few groundwater withdraw-als occur from the Vincentown aquifer in Burlington County expect for a few instances of domestic and irrigation well uses (DePaul and Rosman, 2015), so despite the lower water use, there is still potential for Vincentown aquifer wells in Burlington County to be exposed to PFAS.
The highest altitude of the top of the confined Vincentown aquifer is updip from well 290699 on section L–L′, where the altitude is approximately 104 ft. The lowest altitude occurs at the aquifer’s downdip limit either near well 290440, where top of the Vincentown aquifer is approximately -235 ft, or downdip from well 292043 on section L–L′. In JBMDL, the highest altitude of the confined portion of the Vincentown aquifer is near well 050332 at approximately 75 ft
on section C–C′, and the lowest altitude is at the aquifer’s downdip extent in the area updip from well 291577 on section J–J′. The map of the altitude of the top of the confined portion of the Vincentown aquifer depicts a plateau occurring near well 050331 on section C–C′ similar to that described previ-ously in the Kirkwood-Cohansey. Because of this discrepancy, less emphasis was assigned to the 69-ft altitude at well 050331 when contouring compared to other wells.
The thickness of the confined portion of the Vincentown aquifer is depicted on plate 7. The thickness was determined by subtracting the altitude of the top of the Vincentown aquifer at a well from the altitude of the bottom of the Vincentown aquifer at that well. The Vincentown aquifer is thickest in the area spanning well 291316 on section K–K′, where the thickness is about 80 ft, to well 290784 on section L–L′, where the Vincentown aquifer is approximately 105 ft thick. The Vincentown aquifer is thinnest at the downdip limit of the aquifer and the updip limit of the outcrop area. The Vincentown aquifer is generally thicker in the Ocean County portion (eastern) of the study area compared to Burlington County (western).
Sugarman and others (2013) denote the overall thick-ness of the Vincentown aquifer as variable, and this is evident in thickness changes between the eastern McGuire Air Force Base and the western Fort Dix parts of JBMDL. A zone of high thickness is present in the westernmost part of JBMDL around wells 051633 on section A–A′ and 050332 on section C–C′, with thicknesses of about 40 ft and 45 ft, respectively. Another zone of thickness is present around well 051901 on section E–E′ to well 292196 on section G–G′, with thicknesses of about 45 and 42 ft, respectively. Roughly along the strike direction between these two zones, the Vincentown aquifer becomes thinner, decreasing to a thickness of 29 ft and less near well 050333 on section D–D′. Other than the plateau near well 050331, the top of the Vincentown aquifer remains fairly consistent along this strike-parallel band spanning these two areas, which indicates the thickness change is caused by some combination of beveling at the top of the aquifer, variation in the bottom altitude of the aquifer (or top of the underlying Navesink-Hornerstown confining unit), and (or) general facies changes within the Vincentown Formation.
Downdip Limit of the Confined Portion of the Vincentown Aquifer
As stated previously, the Vincentown aquifer grades downdip into a confining unit. Owing to the possibility of PFAS contamination in the Vincentown aquifer and the poten-tial for domestic wells to be screened in the aquifer in or near PFAS reconnaissance areas Site 4 and Site 14, the downdip limit of the Vincentown aquifer is given extra attention and discussion in this report to justify the placement of the aqui-fer’s extent in the study area.
On section A–A′, the downdip limit of the confined portion of the Vincentown aquifer occurs near well 051613 (pls. 6, 7, and 10). At well 052029, the Vincentown aquifer

10 Regional hydrostratigraphic framework of Joint Base McGuire-Dix-Lakehurst and Vicinity, New Jersey
was interpreted to be from the -68 to -103 ft altitude, based on black sand and shells described in the drillers’ log from the 150- to 184-ft depth (app. 1). The presence of the Vincentown aquifer is difficult to determine at the next well to the south-east on section A–A′, 052028, as the drillers’ log describes “clayey sands, sand clay mixtures” from depths of 10–160 ft (app. 1) without providing much detail other than sediment color. A “fine black sand and grey clay” is described on the drillers’ log for well 051613 at the 140-ft depth (app. 1), which equates to an altitude of approximately -91 ft, which is a rea-sonable approximation for the top of the aquifer at this loca-tion. No bottom altitude of the aquifer was estimated for this well. Logs from the next well on section A–A′, 052026, did not indicate the presence of the Vincentown aquifer, indicating that sediments grade to finer-grained and lower permeability sediments updip from well 052026. Because the only sources of information for all wells from 052029 to 052026 on section A–A′ used to determine the Vincentown aquifer structure are drillers’ logs, these estimates are meant to be considered unre-fined approximations.
Section C–C′ also has wells near the downdip limit of the Vincentown aquifer: 050714, 050796, and 050380. Wells 050714 and 050796 are about 200 ft apart. The drillers’ log for well 050714 describes a sand with streaks of clay from the 182- to 197-ft depth and a black medium sand from the 197- to 219-ft depth (app. 1). These sand zones are assumed to be the Vincentown aquifer, which would place the aquifer from -70 to -104 ft in altitude at well 050714. The drillers’ log for well 050796 denotes a “sandy green marl with streaks of sand and gravel” at the 168- to 203-ft depth (app. 1) that may be the Vincentown aquifer, but these depths would cor-respond to altitudes of -51 to -86 ft, about 20 ft shallower than well 050714 despite the proximity. Therefore, the top of the Vincentown aquifer was assumed to be approximately -60 ft at this location. Notably, the thicknesses of the Vincentown aquifer, based on drillers’ logs at these wells, are similar, about 37 ft at well 050714 and 35 ft at well 050796, which allows for more confidence in the approximate thickness of the aqui-fer at this location compared to the altitude. The Vincentown aquifer at well 050380 on section C–C′ was interpreted to be present from -88 to -102 ft altitude, based on a glauconitic sand-clay identified on the lithologic log and green “marl” on the drillers’ log, which was encountered from the 178- to 196-ft depth (app. 1). Many drillers’ logs use the term “marl,” but such a term may not be the most accurate description, and the drillers’ logs are assumed to be referring to glauconitic units in those instances. The Vincentown aquifer is not present on the gamma log of well 050737 (pl. 10), the next well down-dip along section C–C′, so the downdip limit of the confined portion of the Vincentown aquifer is present between wells 050380 and 050737.
Section E–E′ terminates at well 051179. The Vincentown aquifer is not present at this well, an interpretation also posited by O. Zapecza (U.S. Geological Survey, written commun., 1996), or at an adjacent well included in Sugarman and others (2018a). If the Vincentown aquifer continued along section
E–E′ to well 051179, the top of the aquifer would be present at about the -75 ft altitude, or a depth of 165 ft. This depth would fall in the high intensity zone on the gamma log (pl. 10) and a 124-ft-thick clay zone on the drillers’ log (app. 1), which is unlikely to have permeable aquifer material. The Vincentown aquifer is difficult to interpret from a drillers’ log at well 050754 on section F–F′. A “clayish” fine sand from 179- to 228-ft depths identified on the drillers’ log (app. 1) was assumed to be the Vincentown aquifer, corresponding to altitudes of -80 to -129 ft. Clayey fine sand is often consid-ered part of confining units in the New Jersey Coastal Plain aquifers (Sugarman and others, 2018a), but the assumption that the clayey fine sand is part of the aquifer is reasonable given the ambiguity of the drillers’ log, the presence of clay within the sands of the Vincentown aquifer elsewhere in the study area, and the location of well 050754 updip from the downdip limit of the Vincentown aquifer from various studies (fig. 2). Because well 051179 on section E–E′ does not include the Vincentown aquifer, the downdip limit of the aquifer likely occurs between wells 050754 and 051179.
The estimates of the downdip limit of the Vincentown aquifer from various studies in the area are shown in figure 2. The studies include Zapecza (1989), Sugarman and others (2013) in Ocean County, Cauller and others (2016) in Ocean County, Sugarman and others (2018a) in Burlington County, and this study. In Burlington County, the interpreted approxi-mate downdip limits are all fairly close, but the downdip limit in Ocean County is more varied.
Much of this variation of interpretations is caused by well 290134 and well 290132 on section J–J′, which are less than 200 ft apart, and well 290440 east of the study area. Zapecza (1989) does not consider the Vincentown aquifer to be present at well 290134, but Sugarman and others (2013) include the aquifer at adjacent well 290132 (identified as well 29-52272 in that report). Both studies include only 1 of those 2 wells. Gamma intensities on the natural gamma log for well 290132 are intermediate relative to the entire log and lower for the Vincentown portion of the log (pl. 12). The interpreted Vincentown aquifer altitudes, based on the gamma log, are -161 to -200 ft, which equate to depths of 263 to 302 ft. The lithologic log for well 290132 describes a glauconitic and calcareous mixed sand and clay at these depths (app. 1), which is similar to other descriptions of the Vincentown aquifer near the downdip limit. Therefore, for this study the Vincentown aquifer is considered to be present near wells 290132 and 290134. Well 290134 has only a drillers’ log, and depths of 262 to 302 ft on this log are within a described green silty marl (app. 1).
The downdip limit of the confined portion of the Vincentown aquifer also occurs between wells 290440 and 290588 east of the study area. Sugarman and others (2013) consider the Vincentown aquifer to be present at well 290440 (identified as well 29-06549 in that study) and to pinch out between wells 290440 and 290588 (identified as well 29-09259 in that study). Cauller and others (2016) do not mention well 290440, but the downdip limit from that study

Hydrostratigraphic Framework 11
EXPLANATIONKirkwood Formation and Cohansey Formation
Manasquan Formation
Vincentown Formation
Navesink Formation, Red Bank Sand,and Hornerstown Formation
Wenonah Formation and Mount Laurel Formation
Base boundary
Downdip limit of the confined portion of the Vincentown aquifer, this study
Downdip limit of the confined portion of the Vincentown aquifer,Sugarman and others (2013, 2018a)
Downdip limit of the confined portion of the Vincentown aquifer,Cauller and others (2016)
Downdip limit of the confined portion of the Vincentown aquifer,Zapecza (1989)
40°10'
40°08'
40°06'
40°04'
40°02'
40°00'
39°58'
39°56'
39°54'
39°52'
74°10'74°14'74°18'74°22'74°26'74°30'74°34'74°38'74°42'
MERCERCOUNTY
MONMOUTH COUNTY
OCEANCOUNTY
BURLINGTONCOUNTY
Maparea
0 1 2 3 4 5 MILES
0 1 2 3 4 5 KILOMETERS
Base from U.S. Geological Survey digital data, 1:100,000 scaleUniversal Transverse Mercator projection, Zone 18, NAD83
Figure 2. Downdip limit of the confined portion of the Vincentown aquifer in the vicinity of Joint Base McGuire-Dix-Lakehurst, New Jersey, from various publications.

12 Regional hydrostratigraphic framework of Joint Base McGuire-Dix-Lakehurst and Vicinity, New Jersey
extends to the same location as in Sugarman and others (2013), between wells 290440 and 290588. Zapecza (1989) does not include the Vincentown aquifer at well 290440. Based on the gamma log, the Vincentown aquifer at well 290440 is present between altitudes of -235 to -270 ft (table 3; U.S. Geological Survey, 2019a) or from 302 to 337 ft in depth. Similar to well 290132, the gamma log for well 290440 indicates intermediate intensities in a relatively lower intensity zone at this interval compared to the intensities of the zones above and below, and these depths are situated in a green marl, as described on the drillers’ log (app. 1). Well 290588 is entirely clay in this interval, so the well likely does not encounter the Vincentown aquifer at that location.
The downdip limit of the confined portion of the Vincentown aquifer occurs along section L–L′ downdip from well 292043. Zapecza (1989), Sugarman and others (2013), and Cauller and others (2016) do not consider the Vincentown aquifer to be present at this location but did not include well 292043 in their studies. The drillers’ log for well 292043 describes a “dark green marl and black sand” from the 295- to 320-ft depth (app. 1), which is assumed to be Vincentown aquifer. These depths equate to aquifer altitudes of approxi-mately -228 to -253 ft at this location, which is reasonable given that the top of the Vincentown aquifer along the strike direction at well 290440 is at an altitude of -235 ft. The drill-ers’ log mentions a “Vincentown shell” about 50 ft shallower (app. 1), but this interval is likely too shallow and likely falls within the Shark River Formation or Manasquan Formation.
Unconfined Portion of the Vincentown AquiferThe USGS maintains two wells on McGuire Air Force
Base in which groundwater levels are continuously moni-tored: well 051251 (local name 08-MW-102) and well 051250 (local name 08-MW-52) (fig. 3). Well 051251 is screened in the Kirkwood-Cohansey aquifer system, and well 051250 is screened in the Vincentown aquifer (fig. 4; pls. 1 and 7). The wells are approximately 250 ft apart (fig. 3). Hydrographs from these wells indicate a hydraulic connection between the Kirkwood-Cohansey aquifer system and the Vincentown aquifer at this location (O. Zapecza, U.S. Geological Survey, written commun., 1996). A hydraulic connection is also indicated using 2018 groundwater-level data (U.S. Geological Survey, 2019b) because both wells show similar fluctuations of groundwater levels in response to factors such as precipita-tion (fig. 5). The lithologic log for well 051250 describes a silt unit at depths from about 15 to 25 ft below land surface with sands above and below (app. 1). This interval correlates well with the gamma log, which indicates a 14-ft-thick unit is present at that depth (fig. 4). This silt unit is likely either the Manasquan Formation or the basal portion of the Kirkwood Formation, which is included with the Manasquan-Shark River confining unit.
The hydraulic connection between these aquifers indi-cates the 14-ft-thick silt unit is not a confining unit of the Vincentown aquifer at this location; thus, the Vincentown aquifer is presumed to be unconfined at this location and at all locations in the study area where a fine-grained silt or clay layer between the Kirkwood-Cohansey aquifer system and Vincentown aquifer is 14 ft thick or less. This 14-ft thick-ness threshold was arbitrarily doubled to 28 ft to delineate the locations in the study area where the Vincentown aquifer is most likely to have hydraulic connection with the Kirkwood-Cohansey aquifer system. Therefore, where the thickness of the silt unit is 28 ft or less, the Vincentown aquifer is assumed to be more unconfined than confined, and where the thickness is greater than 28 ft, the Vincentown aquifer is assumed to be more confined than unconfined.
Because no additional continuous water levels were measured in other Kirkwood-Cohansey aquifer system and Vincentown aquifer well pairs, it is unknown whether the fine-grained unit is leaky only at this particular location or throughout the study area and at what point the Manasquan-Shark River confining unit thickens enough to minimize leakance and confine the Vincentown aquifer. More monitor-ing of groundwater levels, aquifer tests, and a higher density of well logs are needed to fully delineate the area where the Vincentown aquifer ceases to be unconfined and becomes con-fined, a boundary that is realistically gradational with varying degrees of semiconfined conditions in between rather than a line adequately represented by a single isopach.
In this report, the Kirkwood-Cohansey aquifer system and the unconfined portion of the Vincentown aquifer are considered to be a single, separate unconfined aquifer system, similar to past assumptions (O. Zapecza, U.S. Geological Survey, written commun., 1996). The downdip limit of this unconfined aquifer system is therefore mapped as the downdip limit of the unconfined portion of Vincentown aquifer. This boundary represents the 28-ft isopach for the fine-grained units (Manasquan Formation and (or) basal Kirkwood Formation) between the sands of the Vincentown Formation and sands of the Kirkwood and Cohansey Formations. The downdip limit bisects the outcrop area of the Manasquan Formation and includes the entire Vincentown Formation outcrop. The unconfined portion of the Vincentown aquifer is delineated on the cross sections along with the extrapolated updip correla-tions of the bottom of the Kirkwood-Cohansey aquifer system and the top of the Vincentown aquifer where the interlying silt unit (probably basal Kirkwood Formation) is less than 28 feet thick.
Altitudes of the bottom of the unconfined portion of the Vincentown aquifer are shown in plate 9. Areas where the Cohansey and (or) Kirkwood Formations directly overlie the Hornerstown Formation (pl. 1), such as the area between wells 050442 and 051979, are also included in this aquifer system extent without distinction from the updip limit of the

Hydrostratigraphic Framework 13
Vincentown Formation subcrop. The unconfined portion of the Vincentown aquifer is shallowest around well 251259 on section L–L′, where it is more than 200 ft in altitude, and deepest around well 292049 on section H–H′, where it is less than -5 ft in altitude. At JBMDL, the unconfined portion of the Vincentown aquifer ranges from about 124 ft in altitude at well 051365 on section C–C′ to deeper than about 5 ft in altitude at well 051795 on section F–F′.
The hydraulic connection between the Kirkwood-Cohansey aquifer system and Vincentown aquifer has impor-tant implications for studying PFAS at JBMDL because PFAS contamination originating at the sources in the Kirkwood-Cohansey aquifer system may enter the unconfined portion of the Vincentown aquifer. The hydraulic heads in well 051251
were about 2 ft higher than in well 051250 throughout 2018 (fig. 5), which indicates a downward, vertical hydraulic gradi-ent from the Kirkwood-Cohansey aquifer system into the unconfined portion of the Vincentown aquifer. Well 051251 was sampled in 2016 and found to have high levels of PFAS (2,580 nanograms per liter [ng/L]), which included a combina-tion of PFOA and PFOS at 280 and 2,300 ng/L, respectively (U.S. Air Force, 2016). Because of their hydraulic connection, it is likely that well 051250 also has high levels of PFOA and PFOS. The PFAS may potentially migrate into the confined portion of the aquifer, posing additional challenges for reme-diation, and consequently migrate to off-base domestic wells screened in the Vincentown aquifer. The Site 4 PFAS recon-naissance area is of particular concern because that area is
74°35'10"74°35'15"74°35'20"74°35'25"
40°1'50"
40°1'45"
051250 / 08-MW-52051251 / 08-MW-102
!!
36
30
32
34
38
38
051251 / 08-MW-102
Map area
Base from Orthoimagery from New Jersey Office of Information Technology,Office of Geographic Information Systems, 2016
0 100 200 300 400 500 FEET
0 20 40 60 80 100 METERS
EXPLANATIONAltitude contour—bottom of the unconfined portion
of the Vincentown aquifer. Contour interval 2 feet. Datum is NAVD 88
Joint Base McGuire-Dix-Lakehurst boundary
U.S. Geological Survey network well withUSGS and local identifiers
!
Figure 3. Location of wells 051250 / 08-MW-52 and 051251 / 08-MW-102, Joint Base McGuire-Dix-Lakehurst, New Jersey. (USGS, U.S. Geological Survey; NAVD 88, North American Vertical Datum of 1988)

14 Regional hydrostratigraphic framework of Joint Base McGuire-Dix-Lakehurst and Vicinity, New Jersey
051251/08-MW-102
051250/08-MW-52
0
10
20
30
40
50
60
Dept
h be
low
land
sur
face
, in
feet
Increasingintensity
Silts and clays of the Kirkwoodand (or) Manasquan Formations
Kirkwood-Cohanseyaquifer system
Vincentownaquifer
Screenedintervalof well
Naturalgammalog
Figure 4. Log interpretation of wells 051250 / 08-MW-52 and 051251 / 08-MW-102, Joint Base McGuire-Dix-Lakehurst, New Jersey.
106
105
104
103
102
101
100
Hydr
aulic
hea
d, in
feet
abo
ve N
AVD
88
Jan. Feb. Mar. Apr. May June July Aug. Sept. Oct. Nov. Dec.
051251/08-MW-102 (Kirkwood-Cohansey aquifer system)
051250/08-MW-52 (Vincentown aquifer)
EXPLANATION
Figure 5. Hydrographs of continuous groundwater levels at wells 051250 / 08-MW-52 and 051251 / 08-MW-102, Joint Base McGuire-Dix-Lakehurst, New Jersey, 2018.

Summary 15
most likely to have domestic wells screened in the Vincentown aquifer given that the aquifer is relatively shallow and rela-tively thick compared to other areas.
PFAS migration may also occur in the Site 14 recon-naissance area and the area spanning Site 14 to around well 051179 on section E–E′ where PFOS and PFHxS have been identified at high levels in surface water, sediment, and fish tissue (Goodrow and others, 2018). However, the thinning of the Vincentown aquifer at these locations indicates there is less of a possibility that wells are screened in the Vincentown aquifer in that area. Similarly, Site 16, despite being partially underlain by the Vincentown aquifer, is less likely to have domestic wells screened in the Vincentown aquifer given the greater depth and the smaller thickness of the aquifer at that location.
Navesink-Hornerstown Confining Unit
The Navesink-Hornerstown confining unit consists of the Navesink Formation and Red Bank Sand of Cretaceous age and Hornerstown Formation of lower Paleocene age. The Navesink Formation is a gray, dark green, or brown clayey or silty glauconitic sand that may contain large shells in areas (Sugarman and others, 1991, 2018a). The Red Bank Sand is divided into an upper Shrewsbury Member, primar-ily an orange, brown, gray, or pink medium-to-coarse sand, and a lower Sandy Hook Member, a gray or olive silty sand (Sugarman and others, 1991, 2016). The Hornerstown Formation primarily consists of yellow, green, or black clayey glauconite sand (Sugarman and others, 2016; Sugarman and others, 2018a). The Navesink Formation and Hornerstown Formation are present throughout the study area (Sugarman and others, 2013, 2018a), but the Red Bank Sand does not crop out in Burlington County other than in a small area updip from sections F–F′ and G–G′ (Minard and Owens, 1963; Sugarman and others, 2013). The Shrewsbury Member of the Red Bank Sand is a minor aquifer in Monmouth County but is typically considered part of the confining unit (Zapecza, 1989; Cauller and others, 2016) or is not mapped as an aquifer owing to its negligible thickness in Burlington and Ocean Counties (Sugarman and others, 2013, 2018a).
Plate 8 shows the altitude of the bottom of the Navesink-Hornerstown confining unit. The top of the Navesink-Hornerstown confining unit is equivalent to the bottom of the Vincentown aquifer, where present. The Navesink-Hornerstown confining unit becomes part of the composite confining unit when merged with the confining unit overly-ing the Piney Point aquifer, the Manasquan-Shark River confining unit, and the transition of the Vincentown aquifer into a confining unit (table 3). The bottom of the Navesink-Hornerstown is also the bottom of the composite confining unit and is equivalent to the top of the Wenonah-Mount Laurel aquifer, which is not described in this report. The contact between the bottom of the Navesink-Hornerstown confining
unit and the top of the underlying Wenonah-Mount Laurel aquifer is generally well recognized on geophysical logs as a sharp decrease in gamma intensity and increase in resistivity (pls. 10–12).
In the study area, the altitude of the bottom of the Navesink-Hornerstown confining unit is highest near well 251259 on section L–L′ at about 90 ft and lowest near well 292183 on section I–I′ at about -810 ft, the steepest downdip gradient of all the units described in this report. In JBMDL, the bottom of the Navesink-Hornerstown confining unit is recorded as highest near well 050340 on section F–F′ at an altitude of about 6 ft but may also be higher around well 051365 on section C–C′. The Navesink-Hornerstown con-fining unit is lowest on JBMDL between wells 291577 and 290429 on section J–J′, where the altitudes are approximately -415 and -433 ft, respectively.
SummaryThe hydrostratigraphic framework of the Kirkwood-
Cohansey aquifer system, Piney Point aquifer, the confined portion of the Vincentown aquifer, and the unconfined portion of the Vincentown aquifer was developed from borehole geophysical logs from 131 wells at the Joint Base McGuire-Dix-Lakehurst (JBMDL) and vicinity in a study conducted by the U.S. Geological Survey in cooperation with the U.S. Air Force. The extent and configuration of these hydrostrati-graphic units as well as the interlying confining units are presented in a series of 8 maps and 12 cross sections.
The Kirkwood-Cohansey aquifer system is the larg-est unconfined water-table aquifer in the study area. The Kirkwood-Cohansey aquifer system is highest in the northwest part of the study area and dips about 300 feet (ft) toward the southeast. Despite being primarily composed of sand, the Kirkwood-Cohansey aquifer system also contains subunits of low permeability clay and silt that create high hydrogeologic heterogeneity that include semiconfined conditions, perched water tables, and zones of high potential for sorption of per- and polyfluoroalkyl substances (PFAS) in the aquifer system. Six of these subunits are substantial enough that their extents and configurations are presented in the maps and cross sec-tions. In particular, two subunits are present that may affect groundwater flow complexity to PFAS reconnaissance areas, notably to the Site 14 reconnaissance area and to Sites 16, 17, and 18, as well as provide sites for sorption of PFAS on organic carbon that would impose challenges to remediate.
The Piney Point aquifer subcrops in the southeast portion of the study area and does not underlie any portion of JBMDL. The Piney Point receives recharge from the Kirkwood-Cohansey aquifer system, but owing to the great depths of this aquifer and negligible quantities of water withdrawn from the aquifer in the study area, groundwater in the Piney Point is unlikely to be vulnerable to PFAS contamination.

16 Regional hydrostratigraphic framework of Joint Base McGuire-Dix-Lakehurst and Vicinity, New Jersey
The Vincentown aquifer crops out in JBMDL and contin-ues downdip until it grades into a low permeability confining unit. The Vincentown aquifer is generally thicker in Ocean County than in Burlington County, up to about 100 ft thick, and is more extensive in Ocean County. Continuously moni-tored groundwater levels from a well in the Vincentown aqui-fer indicate a response to precipitation and a 2-ft downward hydraulic head gradient from the Kirkwood-Cohansey aquifer system, indicating the Vincentown aquifer is also unconfined where the overlying Manasquan-Shark River confining unit is thin and leaky. Natural gamma logs from this well indicate a 14-ft-thick silt layer overlies the unconfined portion of the Vincentown aquifer, and a 28-ft isopach is assumed to be the boundary between the unconfined portion of the Vincentown aquifer and the confined portion. The unconfined portion was consolidated with the overlying portions of the Kirkwood-Cohansey aquifer system into a separate unconfined aquifer system. Recharge of the Vincentown aquifer through the Kirkwood-Cohansey aquifer system indicates the possibil-ity of PFAS contamination of the unconfined and confined Vincentown groundwater, which affect potential receptors in Site 4 reconnaissance area and to a lesser extent Site 14 reconnaissance area.
References Cited
AECOM, 2010, Conceptual site model for Joint Base McGuire-Dix-Lakehurst: Philadelphia, Pa., AECOM, 85 p.
Anderson, H.R., and Appel, C.A., 1969, Geology and ground-water resources of Ocean County, New Jersey: New Jersey Department of Conservation and Economic Development Special Report 29, 74 p., 2 maps, accessed March 9, 2018, at https://pubs.er.usgs.gov/ publication/ 70047881.
Cauller, S.J., Voronin, L.M., and Chepiga, M.M., 2016, Simulated effects of groundwater withdrawals from aquifers in Ocean County and vicinity, New Jersey: U.S. Geological Survey Scientific Investigations Report 2016–5035, 77 p. [Also available at https://doi.org/ 10.3133/ sir20165035.]
DePaul, V.T., and Rosman, R., 2015, Water-level conditions in the confined aquifers of the New Jersey Coastal Plain, 2008: U.S. Geological Survey Scientific Investigations Report 2013–5232, 107 p., 9 pl. [Also available at https://doi.org/ 10.3133/ sir20135232.]
Esri, 2018, How topo to raster works: Redlands, Calif., Esri, accessed April 12, 2019, at https://pro.arcgis.com/ en/ pro- app/ tool- reference/ 3d- analyst/ how- topo- to- raster- works.htm.
Fiore, A.R., 2016, Hydrogeologic barriers to the infiltration of treated wastewater at the Joint Base McGuire-Dix-Lakehurst Land Application Site, Burlington County, New Jersey: U.S. Geological Survey Scientific Investigations Report 2016–5065, 83 p. [Also available at https://doi.org/ 10.3133/ sir20165065.]
Fiore, A.R., Voronin, L.M., and Wieben, C.M., 2018, Hydrogeology of, simulation of groundwater flow in, and potential effects of sea-level rise on the Kirkwood-Cohansey aquifer system in the vicinity of Edwin B. Forsythe National Wildlife Refuge, New Jersey: U.S. Geological Survey Scientific Investigations Report 2017–5135, 59 p. [Also available at https://doi.org/ 10.3133/ sir20175135.]
Goodrow, S.M., Ruppel, B., Lippincott, L., and Post, G.B., 2018, Investigation of levels of perfluorinated compounds in New Jersey fish, surface water, and sediment: New Jersey Department of Environmental Protection, Division of Science, Research, and Environmental Health Publication SR15-010, 46 p, accessed April 10, 2019, at https://nj.gov/ dep/ dsr/ publications/ Investigation%20of%20Levels%20of%20Perfluorinated%20Compounds%20in%20New%20Jersey%20Fish, %20Surface%20Water, %20and%20Sediment.pdf.
HGL, 2011, PFC site maps: Joint Base McGuire-Dix-Lakehurst web page, accessed March 15, 2019, at https://www.jbmdl.jb.mil/ Portals/ 47/ documents/ PFC%20figs%20Feb%2023.pdf? ver= 2017- 02- 23- 081812- 310.
Jacobsen, E., 2000, Ground-water quality, water levels, and precipitation at the biosolids study site, Lakehurst Naval Air Engineering Station, New Jersey, 1995-97: U.S Geological Survey Open-File Report 2000-197, 62 p., accessed April 9, 2019, at https://doi.org/ 10.3133/ ofr00197.
Keys, W.S., 1990, Borehole geophysics applied to ground-water investigations: U.S. Geological Survey Techniques of Water-Resources Investigation, book 2, chap. E2, 150 p., accessed March 9, 2018, at https://pubs.er.usgs.gov/ publication/ twri02E2.
Minard, J.P., 1964, Geology of the Roosevelt quadrangle, New Jersey: U.S. Geological Survey Geologic Quadrangle Map GQ-340, scale 1:24,000, accessed April 8, 2019, at https://doi.org/ 10.3133/ gq340.
Minard, J.P., and Owens, J.P., 1962, Geologic map of the New Egypt quadrangle, New Jersey: U.S. Geological Survey Geologic Quadrangle Map GQ-161, scale 1:24,000, accessed April 22, 2019, at https://doi.org/ 10.3133/ gq161.
Minard, J.P., and Owens, J.P., 1963, Pre-Quaternary geol-ogy of the Browns Mills quadrangle, New Jersey: U.S. Geological Survey Geologic Quadrangle Map GQ-264, scale 1:24,000, accessed April 22, 2019, at https://doi.org/ 10.3133/ gq264.

References Cited 17
Mullikin, L., 2011, Expansion of monitoring well network in confined aquifers of the NJ coastal plain, 1996–1997: New Jersey Geological Survey Open-File Report 11–1, 61 p., accessed April 9, 2019, at https://www.state.nj.us/ dep/ njgs/ pricelst/ ofreport/ ofr11- 1.pdf.
New Jersey Department of Environmental Protection (NJDEP), 2019, DEP requests input on proposed ground water quality criteria for chemicals of emerging concern: New Jersey Department of Environmental Protection News Release 19/P006, accessed April 22, 2019, at https://www.nj.gov/ dep/ newsrel/ 2019/ 19_ 0006.htm.
New Jersey Office of Information Technology, Office of Geographic Information Systems, 2012, New Jersey 10 foot resolution lidar derived digital elevation model (DEM), non-hydro-flattened: New Jersey Office of Information Technology, accessed November 8, 2019, at https://njogis- newjersey.opendata.arcgis.com/ datasets/ new- jersey- 10- foot- dem? geometry= - 83.436%2C38.666%2C- 66.023%2C41.605.
New Jersey Office of Information Technology, Office of Geographic Information Systems, 2016, NJ 2015 natu-ral color orthophoto cached tile base map service, 1 foot, accessed November 8, 2019, at https://geodata.state.nj.us/ arcgis/ rest/ services/ Basemap/ Orthos_ Natural_ 2015_ NJ.
Owens, J.P., and Minard, J.P., 1962, Geologic map of the Columbus quadrangle, New Jersey: U.S. Geological Survey Geologic Quadrangle Map GQ-160, scale 1:24,000, accessed April 22, 2019, at https://doi.org/ 10.3133/ gq160.
Owens, J.P., and Minard, J.P., 1964, Pre-Quaternary geology of the Pemberton Quadrangle, New Jersey: U.S. Geological Survey Geologic Quadrangle Map GQ-262, scale 1:24,000, accessed April 22, 2019, at https://doi.org/ 10.3133/ gq262.
Rea, F., 2017, Generalized stratigraphic table for New Jersey: New Jersey Geological and Water Survey Information Circular, 5 p., accessed April 8, 2019, at https://www.state.nj.us/ dep/ njgs/ enviroed/ infocirc/ njstratcol.pdf.
Rush, F.E., 1968, Geology and ground-water resources of Burlington County, New Jersey: New Jersey Department of Conservation and Economic Development Special Report 26, 45 p., accessed April 22, 2019, at https://pubs.er.usgs.gov/ publication/ 70159222.
Stanford, S.D., 2000a, Surficial geology of the Adelphia Quadrangle, Monmouth and Ocean Counties, New Jersey: New Jersey Geological and Water Survey Open-File Map 37, scale 1:24,000, accessed April 22, 2019, at https://www.state.nj.us/ dep/ njgs/ pricelst/ ofmap/ ofm37.pdf.
Stanford, S.D., 2000b, Surficial geology of the Roosevelt Quadrangle, Mercer, Monmouth and Ocean Counties, New Jersey: New Jersey Geological and Water Survey Open-File Map 36, scale 1:24,000, accessed April 22, 2019, at https://www.state.nj.us/ dep/ njgs/ pricelst/ ofmap/ ofm36.pdf.
Stanford, S.D., 2013, Geology of the Keswick Grove quadran-gle, Ocean County, New Jersey: New Jersey Geological and Water Survey Open-File Map 100, scale 1:24,000, accessed April 22, 2019, at https://www.state.nj.us/ dep/ njgs/ pricelst/ ofmap/ ofm100.pdf.
Stanford, S.D., 2016, Geology of the Whiting quad-rangle, Ocean and Burlington Counties, New Jersey: New Jersey Geological and Water Survey Open-File Map 113, scale 1:24,000, accessed April 22, 2019, at https://www.state.nj.us/ dep/ njgs/ pricelst/ ofmap/ ofm113.pdf.
Stanford, S.D., Pristas, R.S., and Witte, R.W., 2007, Surficial geology of New Jersey: New Jersey Geological Survey Digital Geodata Series 07–2, scale 1:100,000, accessed April 22, 2019, at https://www.nj.gov/ dep/ njgs/ geodata/ dgs07- 2.htm.
Stanford, S.D., and Sugarman, P.J., 2017, Geology of the Toms River and Seaside Park quadrangles, Ocean County, New Jersey: New Jersey Geological and Water Survey Open-File Map 116, scale 1:24,000, accessed April 22, 2019, at https://www.state.nj.us/ dep/ njgs/ pricelst/ ofmap/ ofm116.pdf.
Sugarman, P.J., Carone, A.R., Stroiteleva, Yelena, Pristas, R.S., Monteverde, D.H., Domber, S.E., Filo, R.M., Rea, F.A., and Schagrin, Z.C., 2018a, Framework and proper-ties of aquifers in Burlington County, New Jersey: New Jersey Geological and Water Survey Geologic Map Series GMS 18-3, scale 1:100,00, accessed April 9, 2019, at https://www.nj.gov/ dep/ njgs/ pricelst/ gmseries/ gms18- 3.pdf.
Sugarman, P.J., Carone, A., Malerba, N.L., and Lyons, Scott, 2018b, Bedrock geologic map of the Lakewood quadrangle, Ocean County, New Jersey: New Jersey Geological and Water Survey Open-File Map 121, scale 1:24,000, accessed April 22, 2019, at https://www.state.nj.us/ dep/ njgs/ pricelst/ ofmap/ ofm121.pdf.
Sugarman, P.J., Castelli, M.V., Dalton, R.F., and Melerba, N.L., 2016, Bedrock geologic map of the Lakehurst quad-rangle, Ocean County, New Jersey: New Jersey Geological and Water Survey Open-File Map 113, scale 1:24,000, accessed April 22, 2019, at https://www.state.nj.us/ dep/ njgs/ pricelst/ ofmap/ ofm113.pdf.
Sugarman, P.J., Monteverde, D.H., Boyle, J.T., and Domber, S.E., 2013, Aquifer correlation map of Monmouth and Ocean Counties, New Jersey: New Jersey Geological and Water Survey Geologic Map Series 13-1, scale 1:100,000, accessed April 9, 2019, at https://www.state.nj.us/ dep/ njgs/ pricelst/ gmseries/ gms13- 1.pdf.

18 Regional hydrostratigraphic framework of Joint Base McGuire-Dix-Lakehurst and Vicinity, New Jersey
Sugarman, O.J., Owens, J.P., and Bybell, L.M., 1991, Geologic map of the Adelphia and Farmingdale quad-rangles, Monmouth and Ocean Counties, New Jersey: New Jersey Geological and Water Survey Geologic Map Series GMS 91-1, scale 1:24,000, accessed April 22, 2019, at https://www.state.nj.us/ dep/ njgs/ pricelst/ gmseries/ gms91- 1.pdf.
Szabo, Z., Zapecza, O.S., Oden, J.H., and Rice, D.E., 2005, Radiochemical sampling and analysis of shallow ground water and sediment at the BOMARC missile facility, east-central New Jersey, 1999-2000: U.S. Geological Survey Scientific Investigations Report 2005–5062, 87 p., accessed April 9, 2019, at https://pubs.usgs.gov/ sir/ 2005/ 5062/ .
U.S. Air Force, 2016, Site inspection (SI) of fire fighting foam usage at various air force bases in the eastern United States—Validated SI results; Joint Base McGuire-Dix-Lakehurst, New Jersey: U.S. Air Force, accessed April 10, 2019, at https://www.jbmdl.jb.mil/ Portals/ 47/ documents/ JB%20MDL%20Verified%20Results.pdf? ver= 2016- 11- 29- 081655- 927.
U.S. Environmental Protection Agency (EPA), 2019, EPA’s per- and polyfluoroalkyl substances (PFAS) action plan: U.S Environmental Protection Agency 823R18004, 72 p., accessed April 22, 2019, at https://www.epa.gov/ pfas/ epas- pfas- action- plan.
U.S. Geological Survey, 2019a, USGS GeoLog locator data-base: U.S. Geological Survey data release, accessed April 9, 2019, at https://doi.org/ 10.5066/ F7X63KT0.
U.S. Geological Survey, 2019b, USGS water data for the Nation: U.S. Geological Survey National Water Information System database, accessed April 9, 2019, at https://doi.org/ 10.5066/ F7P55KJN.
Walker, R.L., Reilly, P.A., and Watson, K.M., 2008, Hydrogeologic framework in three drainage basins in the New Jersey Pinelands, 2004–2006: U.S. Geological Survey Scientific Investigations Report 2008–5061, 147 p., accessed April 9, 2019, at https://pubs.usgs.gov/ sir/ 2008/ 5061/ .
Zapecza, O.S., 1989, Hydrogeologic framework of the New Jersey Coastal Plain, regional aquifer-system analysis—Northern Atlantic Coastal Plain: U.S. Geological Survey Professional Paper 1404–B, 49 p., 24 pls. [Also available at https://pubs.er.usgs.gov/ publication/ pp1404B.]

Appendix 1 Lithologic Logs and Drillers’ Logs for Selected Wells 19
Appendix 1 Lithologic Logs and Drillers’ Logs for Selected WellsThis appendix contains clipped images of the original
lithologic logs and (or) drillers’ logs (figs. 1.1–1.22), including scans of paper logs, for wells cited in the report. All other well logs are available in U.S. Geological Survey (2019). Clips of the log are provided rather than digitized transcribed versions to preserve the original data without assuming interpretation of the abbreviations, handwriting, or other notations therein. Annotations on original logs such as choices for contacts of geologic formations are not assumed to be consistent with the interpretations in this report.

20 Regional hydrostratigraphic framework of Joint Base McGuire-Dix-Lakehurst and Vicinity, New Jersey
Figure 1.1. Lithologic log of well 050331.

Appendix 1 Lithologic Logs and Drillers’ Logs for Selected Wells 21
Figure 1.2. Lithologic log of well 050380.

22 Regional hydrostratigraphic framework of Joint Base McGuire-Dix-Lakehurst and Vicinity, New Jersey
Figure 1.2. —Continued
Figure 1.3. Drillers’ log of well 050380.
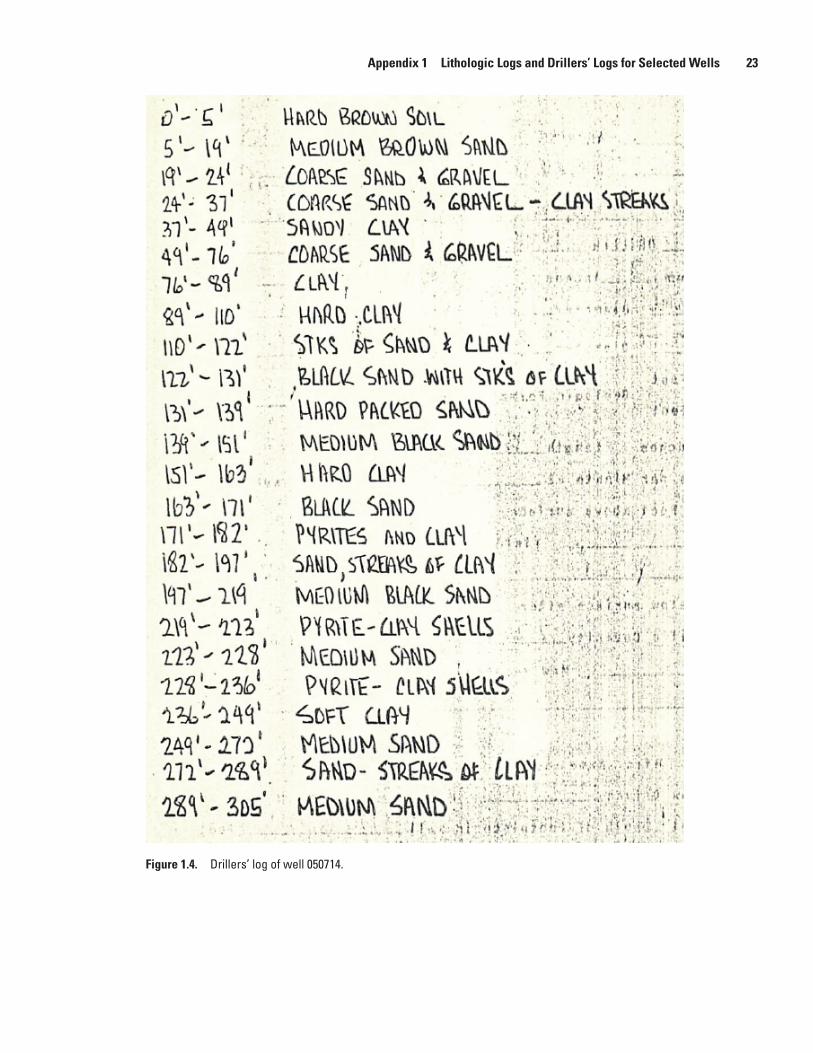
Appendix 1 Lithologic Logs and Drillers’ Logs for Selected Wells 23
Figure 1.4. Drillers’ log of well 050714.

24 Regional hydrostratigraphic framework of Joint Base McGuire-Dix-Lakehurst and Vicinity, New Jersey
Figure 1.5. Drillers’ log of well 050754.

Appendix 1 Lithologic Logs and Drillers’ Logs for Selected Wells 25
Figure 1.6. Drillers’ log of well 050796.

26 Regional hydrostratigraphic framework of Joint Base McGuire-Dix-Lakehurst and Vicinity, New Jersey
Figure 1.7. Drillers’ log of well 051179.

Appendix 1 Lithologic Logs and Drillers’ Logs for Selected Wells 27
Figure 1.8. Lithologic log of well 051250.

28 Regional hydrostratigraphic framework of Joint Base McGuire-Dix-Lakehurst and Vicinity, New Jersey
Figure 1.8. —Continued

Appendix 1 Lithologic Logs and Drillers’ Logs for Selected Wells 29
Figure 1.9. Drillers’ log of well 051613.
Figure 1.10. Drillers’ log of well 051769.
Figure 1.11. Drillers’ log of well 052026.

30 Regional hydrostratigraphic framework of Joint Base McGuire-Dix-Lakehurst and Vicinity, New Jersey
Figure 1.12. Drillers’ log of well 052028.
Figure 1.13. Drillers’ log of well 052029.

Appendix 1 Lithologic Logs and Drillers’ Logs for Selected Wells 31
Figure 1.14. Drillers’ log of well 290118.

32 Regional hydrostratigraphic framework of Joint Base McGuire-Dix-Lakehurst and Vicinity, New Jersey
Figure 1.15. Lithologic log of well 290132.

Appendix 1 Lithologic Logs and Drillers’ Logs for Selected Wells 33
Figure 1.15. —Continued

34 Regional hydrostratigraphic framework of Joint Base McGuire-Dix-Lakehurst and Vicinity, New Jersey
Figure 1.15. —Continued

Appendix 1 Lithologic Logs and Drillers’ Logs for Selected Wells 35
Figure 1.16. Drillers’ log of well 290134.

36 Regional hydrostratigraphic framework of Joint Base McGuire-Dix-Lakehurst and Vicinity, New Jersey
Figure 1.17. Drillers’ log of well 290440.

Appendix 1 Lithologic Logs and Drillers’ Logs for Selected Wells 37
Figure 1.18. Drillers’ log of well 290588.

38 Regional hydrostratigraphic framework of Joint Base McGuire-Dix-Lakehurst and Vicinity, New Jersey
Figure 1.19. Drillers’ log of well 291265.

Appendix 1 Lithologic Logs and Drillers’ Logs for Selected Wells 39
Figure 1.19. —Continued

40 Regional hydrostratigraphic framework of Joint Base McGuire-Dix-Lakehurst and Vicinity, New Jersey
Figure 1.20. Drillers’ log of well 291380.

Appendix 1 Lithologic Logs and Drillers’ Logs for Selected Wells 41
Figure 1.21. Drillers’ log of well 291577.

42 Regional hydrostratigraphic framework of Joint Base McGuire-Dix-Lakehurst and Vicinity, New Jersey
Reference Cited
U.S. Geological Survey, 2019, USGS GeoLog locator data-base: U.S. Geological Survey data release, accessed April 9, 2019, at https://doi.org/ 10.5066/ F7X63KT0.
Figure 1.22. Drillers’ log of well 292043.

For additional information, contact:
Director, New Jersey Water Science Center U.S. Geological Survey 3450 Princeton Pike, Suite 110 Lawrenceville, NJ 08648
Or visit our website at:https://www.usgs.gov/centers/nj-water
Publishing support provided by the West Trenton Publishing Service Center

Fiore—Regional hydrostratigraphic fram
ework of Joint B
ase McG
uire-Dix-Lakehurst and Vicinity, N
ew Jersey—
OFR 2019–1134
ISSN 2331-1258 (online)https://doi.org/ 10.3133/ ofr20191134