
eprints.keele.ac.ukeprints.keele.ac.uk/6108/1/Manuscript REF.docx · Web vieweprints.keele.ac.uk
56
Dietary components and risk of cardiovascular disease and all- cause mortality: A review of evidence from meta-analyses Running title: Dietary components and risk of CVD and mortality Chun Shing Kwok MBBS MSc BSc, 1,2 Martha Gulati MD, 3 Erin D Michos MD, 4 Jessica Potts PhD, 1 Pensee Wu MD, 1,2 Lorraine Watson, 5 Yoon K Loke MD, 6 Christian Mallen BMedSci BMBS MMedSci MPhil PhD, 5 Mamas A Mamas BMBCh DPhil 1,2 1. Keele Cardiovascular Research Group, Research Institute for Primary Care & Health Sciences, Keele University, Stoke-on- Trent, UK. 2. Royal Stoke University Hospital, Stoke-on-Trent, UK. 3. University of Arizona College of Medicine-Phoenix, Phoenix, Arizona, USA. 4. Department of Medicine/Cardiology, The Johns Hopkins Ciccarone Center for the Prevention of Heart Disease, Baltimore, Maryland, USA. 5. Research Institute for Primary Care & Health Sciences, Keele University, Stoke-on-Trent, UK. 6. Norwich Medical School, University of East Anglia, UK. Corresponding author: Dr Chun Shing Kwok Keele Cardiovascular Research Group Centre for Prognosis Research, Institute of Primary Care and Health Sciences David Weatherall Building, Keele University, Newcastle-under- Lyme ST5 5BG Email: [email protected] Tel: +44 (0)1782 671653 Fax: +44 (0)1782 674467
Transcript of eprints.keele.ac.ukeprints.keele.ac.uk/6108/1/Manuscript REF.docx · Web vieweprints.keele.ac.uk

Dietary components and risk of cardiovascular disease and all-cause mortality: A review of evidence from meta-analyses
Running title: Dietary components and risk of CVD and mortality
Chun Shing Kwok MBBS MSc BSc,1,2 Martha Gulati MD,3 Erin D Michos MD,4 Jessica Potts PhD,1 Pensee Wu MD,1,2 Lorraine Watson,5 Yoon K Loke MD,6 Christian Mallen BMedSci BMBS MMedSci MPhil PhD,5 Mamas A Mamas BMBCh DPhil1,2
1. Keele Cardiovascular Research Group, Research Institute for Primary Care & Health Sciences, Keele University, Stoke-on-Trent, UK.
2. Royal Stoke University Hospital, Stoke-on-Trent, UK.
3. University of Arizona College of Medicine-Phoenix, Phoenix, Arizona, USA.
4. Department of Medicine/Cardiology, The Johns Hopkins Ciccarone Center for the Prevention of Heart Disease, Baltimore, Maryland, USA.
5. Research Institute for Primary Care & Health Sciences, Keele University, Stoke-on-Trent, UK.
6. Norwich Medical School, University of East Anglia, UK.
Corresponding author:
Dr Chun Shing Kwok
Keele Cardiovascular Research Group
Centre for Prognosis Research, Institute of Primary Care and Health Sciences
David Weatherall Building, Keele University, Newcastle-under-Lyme ST5 5BG
Email: [email protected]
Tel: +44 (0)1782 671653 Fax: +44 (0)1782 674467
Keyword: diet, epidemiology, systematic review
Word count: 5,000

Abstract
Aims: The optimal diet for cardiovascular health is controversial. The aim of this review is to
summarize the highest level of evidence and rank the risk associated with each individual
component of diet within its food group.
Methods and results: A systematic search of PudMed was performed to identify the highest
level of evidence available from systematic reviews or meta-analyses that evaluated different
dietary components and their associated risk of all-cause mortality and cardiovascular disease
(CVD). A total of 16 reviews were included for dietary food item and all-cause mortality and
17 reviews for CVD. Carbohydrates were associated with reduced risk of all-cause mortality
(whole grain bread RR 0.85(95%CI 0.82-0.89), breakfast cereal RR 0.88(0.83-0.92),
oats/oatmeal RR 0.88(0.83-0.92)). Fish consumption was associated with a small benefit (RR
0.98 (0.97-1.00)) and processed meat appeared to be harmful (RR 1.25(1.07-1.45)). Root
vegetables (RR 0.76(0.66-0.88)), green leafy vegetables/salad (RR 0.78(0.71-0.86)), cooked
vegetables (RR 0.89(0.80-0.99)) and cruciferous vegetables (RR 0.90(0.85-0.95)) were
associated with reductions in all-cause mortality. Increased mortality was associated with
consumption of tinned fruit (RR 1.14(1.07-1.21)). Nuts were associated with a reduced risk
of mortality in a dose response relationship (all nuts RR 0.78(0.72-0.84), tree nuts RR
0.82(0.75-0.90), and peanuts RR 0.77(0.69-0.86)). For CVD, similar associations for benefit
were observed for carbohydrates, nuts and fish, but red meat and processed meat were
associated with harm.
Conclusions: Many dietary components appear to be beneficial for CVD and mortality,
including grains, fish, nuts and vegetables, but processed meat and tinned fruit appear to be
harmful.

Introduction
Cardiovascular disease (CVD) is a major global cause of health loss.1 Dietary habits,
influence cardiovascular risk either through an effect of risk factors such as serum
cholesterol, blood pressure, body weight and diabetes or through an effect independent of
these risk factors.2 However, there is still controversy surrounding the optimal diet for
cardiovascular health3 There has been exponential growth in the nutritional literature
evaluating diet and cardiovascular disease. There have been reviews for specific food groups
and their influence on cardiovascular health4 and further reviews of individual components of
diet such as fish intake,5 cheese intake,6 butter7 and less frequently consumed components
such as soy products.8 One of the advantages of evaluating individual food components, is
that overall diary patterns may mask the potential effects of individual food components.9
Nevertheless, as healthcare professionals it is necessary to give more holistic dietary advice
rather than just focusing on individual food items / categories. There has yet to be a single
review that has collated all available evidence from prior quality meta-analyses evaluating
dietary components and risk of cardiovascular disease and all-cause mortality.
We conducted an up-to-date review of systematic reviews and meta-analyses on
individual components of diet and their risk of cardiovascular disease and mortality. The aim
of this review is to collectively summarize the highest level of evidence from previously
conducted systematic reviews and meta-analyses and rank the risk associated with each
individual component of diet within its food group.
Methods
Search and study identification
We carried out a review of the literature to identify the best evidence evaluating
individual dietary components and risk of cardiovascular disease or mortality.
We began by identifying the broad categories of food after reviewing the “Eatwell
Guide” in the United Kingdom,10 “The Five Food Groups” in the 2015-2020 Dietary
Guidelines for Americans11 and the “Food Guide Pyramid” from the Center for Nutrition
Policy and Promotion in the United States.12 Once the main groups of food were identified
each individual component in a typical Western diet was determined and shown in
Supplementary Table 1.
For each individual component of diet, we searched for and identified the most recent
and highest quality systematic review and meta-analysis evaluating the dietary component
and its associated risk of adverse outcomes. This was a two-step process where first a search
was performed and screened independently by two reviewers (CSK and either PW or JP).

The search was performed on 13 August 2018 and we used each food category in
Supplementary Table 1 as a key word on the Pubmed search. We chose to include the review
with the most studies because the number of studies was part of our evidence grading criteria.
The quality of the evidence for a systematic review of a food item was graded according to a
modified criteria based on Grosso et al.13 The grading method has 4 levels where level 1
represents the highest level of evidence (convincing) and level 4 represents the lowest level
of evidence (limited/contrasting). The exact method of grading the reviews based on
inclusion of prospective cohorts, number of studies and the presence of statistical
heterogeneity (I2≤30% vs I2>30%) is shown in Supplementary Table 2.
Included studies had to have the dietary component of interest and some form of
quantitative association with either cardiovascular disease or mortality. Food item
consumption and its association with outcome can be quantified as dose-response relationship
and highest compared to lowest consumers of food items. We chose studies that considered a
dose-response relationship where available.
The search process as described in this paragraph was conducted in August 2018. We
initially searched PubMed using the Clinical Queries option to identify systematic reviews
using the dietary component as the search term along with the terms related to outcomes.
These outcome terms are: (death OR mortality OR stroke OR cerebrovascular disease OR
cerebrovascular accident OR coronary heart disease OR ischemic heart disease OR ischaemic
heart disease OR coronary artery disease OR acute myocardial infarction OR acute coronary
syndrome OR heart failure OR cardiac failure OR cardiac insufficiency). The results of the
search process are shown in Supplementary Table 1.
Evidence synthesis
Statistical analysis was performed by presenting all the results and ranking them
according to effect within each food group. For each included meta-analysis or review for the
specific foods groups, we extracted the Relative Risks (RR) and 95% confidence intervals
(95% CI) from the most adjusted models presented in the review; the evidence of
heterogeneity (I2) was obtained from the original source meta-analyses and reported in our
Table 1. We also collected information on the quality assessments of the reviews. Results are
presented numerically in Tables and Graphically in Figures. For graphical representation, the
studies which reported associations of increased risk of harm were colored in red, those
which showed beneficial associations were colored in green, and those which showed no
statistical difference were colored in yellow. We performed additional analysis considering
the impact of sex-specific differences in outcomes.

Results
A total of 3,011 studies were reviewed from the search shown in Supplementary
Table 1. After detailed review of relevant studies, a total of 16 reviews7,14-28 were included for
all-cause mortality and 17 reviews7,8,14,17-20,22,24-32 for cardiovascular disease (Supplementary
Figure 1).
Supplementary Table 3 shows the quality assessment conducted in each included
review. The grading of the evidence based on the criteria in Supplementary Table 3 suggested
that many analyses showed the lowest or most limited (level 4) evidence mainly because
there were fewer than 4 studies (Supplementary Table 4). However, for all-cause mortality,
level 2 evidence was present for refined grains, green leafy vegetables/salad and tinned fruit.
For cardiovascular disease, there was only level 2 evidence for fish. None of the meta-
analyses were based on randomized controlled trial data.
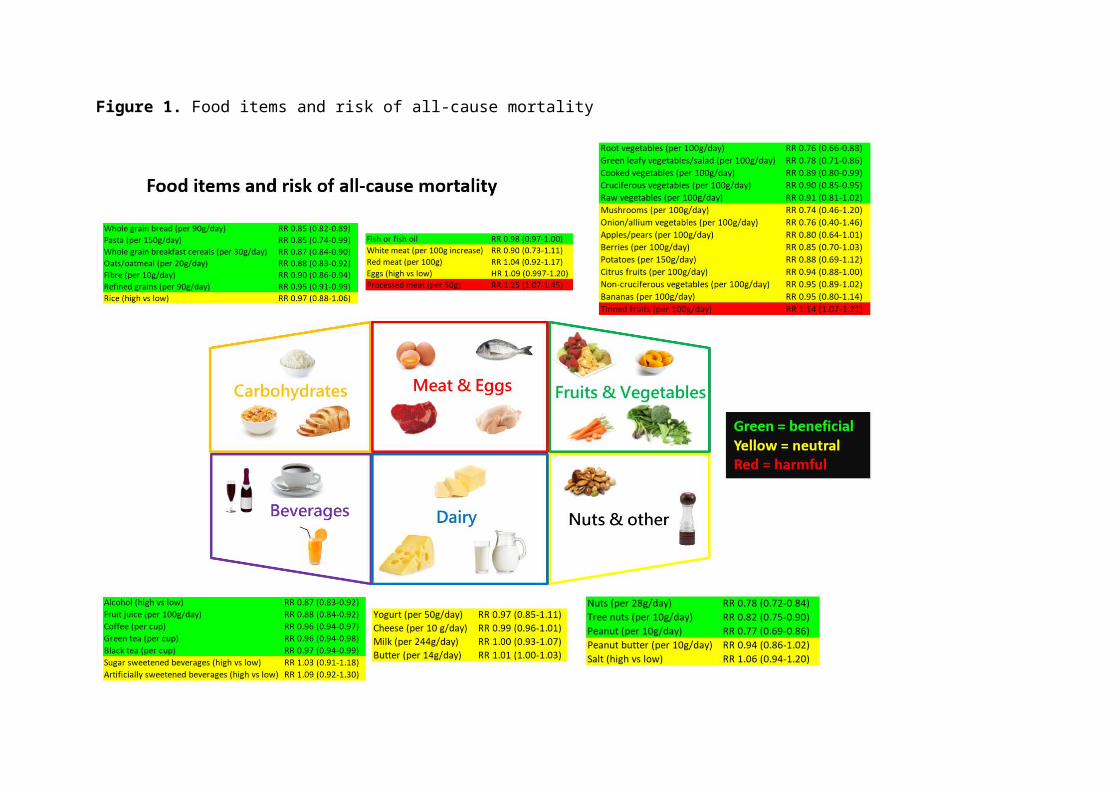
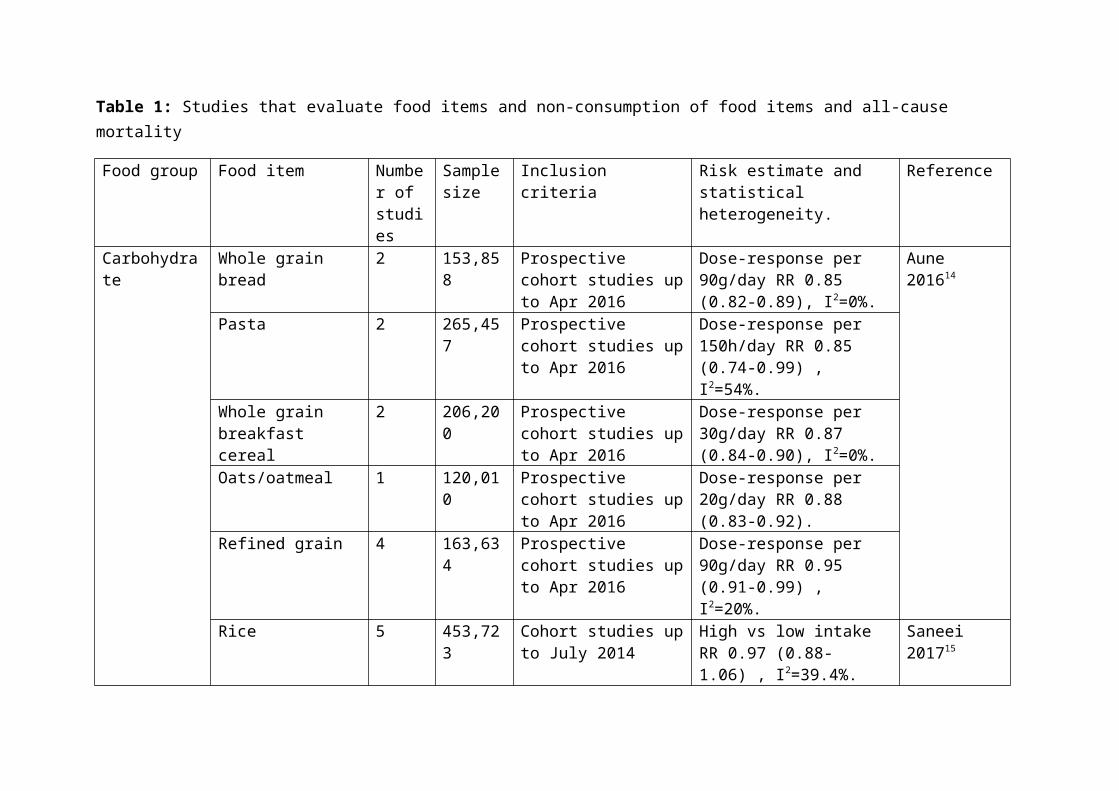
Table 1 and Figure 1 show the food items within different food groups and their risk
of all-cause mortality. For carbohydrates, there were 2 or fewer studies for the assessment of
whole grain bread, pasta, whole grain breakfast cereals, oats/oatmeal. In the dose-response
analysis all of these food items were associated with reduced risk of all-cause mortality
(whole grain bread RR 0.85 (95% CI 0.82-0.89), pasta RR 0.85 (0.74-0.99), whole grain
breakfast cereal RR 0.88 (0.83-0.92), oats/oatmeal RR 0.88 (0.83-0.92). Both intake of
refined grains and fibre were associated with a significant dose response reduction in all-
cause mortality (RR 0.95 (0.91-0.99), 4 studies and RR 0.90 (0.86-0.94), 8 studies,
respectively). Rice was evaluated in 5 studies in the highest consumer compared to the lowest
consumer analysis and no significant difference in mortality was observed.
Among meat, eggs and fish, fish consumption was associated with a small benefit for
mortality (RR 0.98 (0.97-1.00)) and processed meat appeared to be harmful (RR 1.25 (1.07-
1.45)). No significant differences were observed for white meat, red meat and eggs. Among
fruits and vegetables, root vegetables (RR 0.76 (0.66-0.88), 1 study), green leafy
vegetables/salad (RR 0.78 (0.71-0.86), 7 studies), cooked vegetables (RR 0.89 (0.80-0.99), 4
studies) and cruciferous vegetables (RR 0.90 (0.85-0.95), 6 studies) were associated with
reductions in all-cause mortality. There was an association for increased mortality with a
dose-response consumption of tinned fruit (RR 1.14 (1.07-1.21), 4 studies). Comparing the
highest and lowest consumers of alcohol there appeared to be reduction in all-cause mortality
among the highest consumers (RR 0.87 (0.83-0.92), 31 studies). Coffee also showed a dose-
response association for reduced risk of all-cause mortality (RR 0.96 (0.94-0.97), 16 studies).
For dairy products, there was no significant difference in risk of mortality with yogurt,

cheese, milk or butter consumption. The data from nuts appeared to be associated with
reduced risk of mortality in a dose response relationship (all nuts RR 0.78 (0.72-0.84), 16
studies, tree nuts RR 0.82 (0.75-0.90), 4 studies and peanuts RR 0.77 (0.69-0.86), 5 studies).
The associations between cardiovascular disease and food items are shown in Figure 2
and Table 2. Among carbohydrates, there was a dose-response association for benefit for
whole grain bread (RR 0.87 (0.80-0.95), 3 studies), whole grain breakfast cereals (RR 0.84
(0.78-0.90), 2 studies), bran (RR 0.85 (0.79-0.90, 2 studies) and fibre (RR 0.91 (0.88-0.94),
10 studies). Red meat (RR 1.15 (1.05-1.26), 6 studies) and processed meat (RR 1.24 (1.09-
1.40), 6 studies) appeared to be harmful. Out of all the fruits and vegetables only 1 study on
raw vegetables suggested a dose-response association of benefit (RR 0.86 (0.81-0.90)).
Alcohol consumption for the highest compared to the lowest consumers showed an
association of reduced risk of cardiovascular disease (RR 0.75 (0.70-0.80), 21 studies). Black
tea was associated with a dose-response benefit for cardiovascular mortality (RR 0.92 (0.85-
0.99), 7 studies). Dairy products (yogurt, cheese, milk and butter) showed no evidence of a
dose response association for benefit or harm. Intake of nuts were associated with reduced
risk of cardiovascular disease (all nuts RR 0.79 (0.70-0.88), 12 studies, tree nuts RR 0.75
(0.67-0.84), 3 studies, peanuts RR 0.64 (0.50-0.81), 5 studies). In addition, olive oil showed a
dose-response benefit in cardiovascular disease RR 0.82 (0.70-0.96), 9 studies and soy
products as compared by highest and lowest consumers showed lower risk of cardiovascular
disease (RR 0.83 (0.75-0.93)). Finally, an association for a dose response benefit was
observed for chocolate (RR 0.982 (0.972-0.992), 12 studies).
The additional analysis considering differences in results based on sex showed no
major differences between men and women in most studies (Supplementary Table 5).
Discussion
To facilitate clinician-patient communications regarding the impact of diet for
cardiovascular health, we have summarized current evidence from the highest quality
systematic reviews available by various food groups. We have shown that food components
within food groups are associated with different risks for cardiovascular disease and all-cause
mortality. Many fruits and vegetables which are presumed to be beneficial as a group actually
lack strong evidence of cardiovascular benefit. The best evidence appears to support the
intake of green leafy vegetables/salad to reduce all-cause mortality. On the other hand,
processed meat appears to be harmful for both all-cause mortality and cardiovascular disease.
Our results are important as diet is complex and it appears that there may be
dissonance between foods which are for beneficial for all-cause mortality and cardiovascular
disease. We speculate that this may be because the major causes of all-cause mortality are
likely a composite of cardiovascular disease and those of cancer etiology. While oxidative
stress plays an important role in both atherosclerosis33 and oncogenesis34 and both
cardiovascular disease and cancer share risk factors such as obesity,35 physical inactivity,
diabetes36 and smoking.37 Hypertension is common and strongly associated with
cardiovascular disease but the evidence of its link to cancer is less strong. Dietary elements
which affect blood pressure may have greater benefits for cardiovascular disease risk whilst
food items that protect from oxidative stress may have a greater protective effect for cancer.
The consideration of individual foods and food components has been highlighted as a
key approach use by the public when interpreting healthy eating messages.38 We found that
dietary nuts appear to be beneficial for both all-cause mortality and cardiovascular disease.
Tree nuts and peanuts are foods rich in high-quality vegetable protein, fiber, minerals,
tocopherols, phytosterols and phenoic compounds which beneficially impact health
outcomes.39 Consumption of nuts are associated with a favorable fatty acid profile which is
high in unsaturated fatty acids and low in saturated fatty acids which contributes to
cholesterol lowering.40 Also, nuts have a tendency to lower body weight and fat mass and in
the context of calorie-restricted diets, adding nuts promotes weight loss in obese subjects and
improves insulin sensitivity.41 It has been further suggested that the benefits of the
Mediterranean diet may be partly attributed to nuts.42 We believe more studies are need to
examine different types of tree nuts as there was insufficient data on important nuts like
almonds, cashews, macadamia nuts, pistachios and walnuts.
We found evidence that processed meat and tinned fruit may be harmful. The biggest
difference among constituents of processed and unprocessed meat are sodium and nitrate
which are 400% and 50% more per gram of meat.43 Blood pressure and peripheral vascular
resistance increase with dietary sodium, and dietary sodium may also impair arterial
compliance.44 It is further suggested that nitrates and their by-products may promote
endothelial dysfunction, atherosclerosis and insulin resistance.45-47 For tinned fruit, it has been
suggested that the population consuming tinned fruit tended to be male, older, report lower
education level, have higher body mass index and more likely to have diabetes.48 Compared
to fresh fruit, tinned fruit has added sugar which may contribute to cardiovascular mortality.49
There may also be concerns about bisphenol A which is greater in tinned fruit and the acidity
of food cans may dissolve lead solder from food cans.48
There are inherent challenges and limitations in analyzing nutritional data from
observational studies, yet such research has played a vital role over the years in identifying
new links between food and health.50 First, it is possible that some of the food items assessed
showed a non-linear dose-response relationship and estimates at high or very low doses may
not be accurate. Second, multiple repeat measures are required to explore effects of variation
on exposure over time so caution may be needed when interpreting risk of exposures
measured only once at baseline.51 This may apply for items which are not consumed on a
regular basis or food items where there is major variability such as a person who drinks
alcohol regularly at low quantities daily versus a person who drinks less frequently but
heavily. Third, some of the food items which show no association of benefit or harm may
actually have an impact for the individual cardiovascular risk factors such as blood pressure
or cholesterol levels and may be beneficial or harmful for some subgroups of the populations
such as patients with diabetes. Fourth, while our results showed that certain foods appear to
be beneficial or harmful it is important that these results should be taken in consideration of
patients’ overall nutrition status. Fifth, even though lifestyle and socioeconomic factors may
be adjusted for in the cohort studies included in our review, it is likely there is residual
confounding by sociodemographic and lifestyle factors. Patients who eat “healthier” foods
are also more likely to be educated, have greater income, more likely to exercise regularly,
more likely to be of normal weight and body mass index, more likely be a non-smoker and
have better access to healthcare, and the collective effects of these factors may not be
completely accounted for in the adjustments. Sixth, another important consideration is that
the comparison group is not the same across each analysis. An obvious difficulty is that
eating food is essential to health and wellbeing so it would not be possible to conduct a study
comparing individual food items to consuming nothing and there is no obvious single food
reference to compare to. Furthermore, there are other limitations such as self-reporting bias,

recall bias, and heterogeneity in the way food intake was estimated among the studies. While
dietary studies tend to disproportionately attract media attention and often the communicated
result is that a specific food will cause or prevent a certain disease, the conclusions and
results need to be scrutinized as the case of the current review and methodological limitations
of these dietary studies make interpretations of a 'perfect food' very unlikely.
While the current study demonstrates that dietary components have different
associations with adverse outcomes, it is important to recognize that our current study only
considers the dietary component of associations with overall cardiovascular disease. There
has been a study to suggest that the Mediterranean diet and adopting an active lifestyle show
a synergistic effect in their inverse association with cardiovascular disease risk.52 Considering
this finding, the overall cardiovascular disease risk likely incorporates a variety of factors
which would contribute but may or may not further interact to modify the overall risk.
Our study has several limitations. While we were able to cover many different
vegetables there was insufficient evidence for many meat types and nuts and there was no
data on seafood other than fish. More importantly many reviews only had level 4 or limited
evidence because there were fewer than 4 studies. Nevertheless, our review is important as it
summarizes in a concise way the evidence for food items that are associated with all-cause
mortality and cardiovascular disease. A further limitation is that we are unable to assess on
the individual study level the impact of daily calorific content of foods and any clustering
effects in dietary intake.
In conclusion, many food items appear to be beneficial in diet including nuts, whole
grain foods and fiber. Within the fruit and vegetables category many foods presumed to be
beneficial actually have insufficient evidence to suggest benefit in cardiovascular disease but
there is modest evidence for benefit for raw vegetables, root vegetables, green leafy
vegetables, cooked vegetables and cruciferous vegetables and all-cause mortality. Foods that
appear harmful include processed meat and tinned fruit for all-cause mortality and processed
meat and red meat for cardiovascular disease. Our review provides a comprehensive
summary of the evidence of benefit or harm of food items which may help physicians better
counsel their patients about dietary advice.
Acknowledgement: None.
Funding: None.
Conflicts of interest: None.
Authors’ Contribution: CSK designed the study, concept and performed the data analysis. CSK, JP and PW were involved in the data collection. CSK wrote the first draft of the manuscript. All authors critically revised the manuscript and gave final approval and agree to be accountable for all aspects of work ensuring integrity and accuracy.
References
1. Roth GA, Johnson C, Abajobir A, et al. Global, regional and national burden of cardiovascular disease for 10 causes, 1990 to 2015. J Am Coll Cardiol 2017;70:1-25.
2. Verschuren WMM. Diet and cardiovascular disease. Curr Cardiol Rep 2012;14:701-708.
3. Anand SS, Hawkes C, de Souza RJ, et al. Food comsumption and its impact on cardiovascular disease: importance of solutions focused on the globalized food system. J Am Coll Cardiol 2015;66:1590-1614.
4. Bechthold A, Boeing H, Schwedhelm C, et al. Food groups and risk of coronary heart disease, stroke and heart failure: A systematic review and dose-response meta-analysis of prospective studies. Crit Rev Food Sci Nutr. 2017;1-20.
5. Mozaffarian D, Rimm EB. Fish intake, contaminants, and human health: evaluating the risks and benefits. JAMA 2006;296:1885-99.
6. Chen GC, Wang Y, Tong X, et al. Cheese consumption and risk of cardiovascular disease: a meta-analysis of prospective studies. Eur J Nutr 2017;56:2565-2575.
7. Pimpin L, Wu JH, Haskelberg H, et al. Is butter back? A systematic review and meta-analysis of butter consumption and risk of cardiovascular disease, diabetes and total mortality. PLoS One 2016;11:e0158118.
8. Yan Z, Zhang X, Li C, Jiao S, Dong W. Association between consumption of soy and risk of cardiovascular disease: A meta-analysis of observational studies. Eur J Prev Cardiol 2017;24:735-747.
9. Schulze Matthias B, Martínez-González Miguel A, Fung Teresa T, et al. Food based dietary patterns and chronic disease prevention BMJ 2018; 361:k2396.
10. GOV.UK. The Eatwell Guide. Available at: https://www.gov.uk/government/publications/the-eatwell-guide. Last accessed October 22, 2018.
11. Office of Disease Prevention and Health Promotion. 2015-2020 Dietary guidelines for Americans. Available at: https://health.gov/dietaryguidelines/2015/. Last accessed October 22, 2018.
12. United States Department of Agriculture Center for Nutrition Policy and Promotion. Food Guide Pyramid. Available at: https://www.cnpp.usda.gov/FGP. Last accessed October 22, 2018.
13. Grosso G, Godos J, Alvano F, Giovannucci EL. Coffee, caffeine, and health outcome: an umbrella review. Ann Rev Nutr 2017;37:131-156.
14. Aune D, Keum N, Gionvannucci E, et al. Whole grain consumption and risk of cardiovascular disease, cancer and all cause and cause specific mortality: systematic review and dose-response meta-analysis of prospective studies. BMJ 2016;353:i2716.

15. Saneei P, Larijani B, Esmaillzadah A. Rice consumption, incidence of chronic diseases and risk of mortality: meta-analysis of cohort studies. Pub Health Nutr 2017;20:233-244.
16. Yang Y, Zhao LG, Wu Q, Ma X, Xiang XB. Association between dietary fiber and lower risk of all-cause mortality: A meta-analysis of cohort studies. Am J Epidemiol 2015;181:83-91.
17. Jayedi A, Shab-Bidar S, Eimeri S, Djafarian K. Fish consumption and risk of all-cause and cardiovascular mortality: a dose-response meta-analysis of prospective observational studies. Public Health Nutr 2018;21:1297-1306.
18. Abete I, Romaguera D, Vieira AR, de Munain AL, Norat T. Association between total, processed, red and white meat consumption and all-cause, CVD and IHD mortality: a meta-analysis of cohort studies. Br J Nutr 2014;112:762-775.
19. Xu L, Lam TH, Jiang CQ, et al. Egg consumption and the risk of cardiovascular disease and all-cause mortality: Guangzhou Biobank Cohort Study and meta-analysis. Eur J Nutr 2018. doi: 10.1007/s00394-018-1692-3.
20. Aune D, Giovannucci E, Boffetta P, et al. Fruit and vegetable intake and the risk of cardiovascular disease, total cancer and all-cause mortality-a systematic review and dose-response meta-analysis of prospective studies. Int J Epidemiol 2017;1029-1056.
21. Schwingshackl L, Schwedhelm C, Hoffmann G, Boeing H. Potatoes and risk of chronic disease: a systematic review and dose-response meta-analysis. Eur J Nutr 2018. doi: 10.1007/s00394-018-1774-2.
22. Ronksley PE, Brien SE, Turner BJ, et al. Association of alcohol consumption with selected cardiovascular disease outcomes: a systematic review and meta-analysis. BMJ 2011;342:d671.
23. Je Y, Giovannucci E. Coffee consumption and total mortality: a meta-analysis of twenty prospective cohort studies. Br J Nutr 2014;111:1162-1173.
24. Tang J, Zheng JS, Fang L, Jin Y, Cai W, Li D. Tea consumption and mortality of all cancers, CVD and all causes: a meta-analysis of eighteen prospective cohort studies. Br J Nutr 2015;114:673.
25. Narain A, Kwok CS, Mamas MA. Soft drinks and sweetened beverages and the risk of cardiovascular disease and mortality: a systematic review and meta-analysis. Int J Clin Pract 2016;70:791-805.
26. Guo J, Astrup A, Lovegrove JA, et al. Milk and dairy consumption and risk of cardiovascular diseases and all-cause mortality: dose-response meta-analysis of prospective cohort studies. Eur J Epidemiol 2017:32:269-287.
27. Aune D, Keum N, Giovannucci E, et al. Nut consumption and risk of cardiovascular disease, total cancer, all-cause and cause-specific mortality: a systematic review and dose-response meta-analysis of prospective studies. BMC Med 2016;14:207.
28. Alburto NJ, Ziolkovska A, Hooper L, et al. Effect of lower sodium intake on health: systematic review and meta-analyses. BMJ 2013;346:f1326.
29. Treapleton DE, Greenwood DC, Evans CE, et al. Dietary fibre intake and risk of cardiovascular disease: systematic review and meta-analysis. BMJ 2013;347:f6879.
30. Malerba S, Turati F, Galeone C. A meta-analysis of prospective studies and coffee consumption and mortality for all causes, cancers and cardiovascular diseases. Eur J Epidemiol 2013;28:527-539.
31. Martinez-Gonzalez MA, Dominguez LJ, Delgado-Rodriguez M. Olive oil consumption and risk of CHD and/or stroke: a meta-analysis of case-control, cohort and interventional studies. Br J Nutr 2014;112:248-259.
32. Ren Y, Liu Y, Sung XZ, et al. Chocolate consumption and risk of cardiovascular disease: a meta-analysis of prospective studies. Heart 2018; doi: 10.1136/heartjnl-2018-313131.
33. Kattoor AJ, Pothineni NVK, Palagiri D, Mehta JL. Oxidative stress in atherosclerosis. Curr Atheroscler Rep 2017;19:42.
34. Reuter S, Gupta SC, Mhaturvedi MM, Aggarwal BB. Oxidative stress, inflammation, and cancer: How are they linked? Free Radic Biol Med 2010;49:1603-1616.
35. Basen-Engquist K, Chang M. Obesity and cancer risk: recent review and evidence. Curr Oncol Rep 2011;13:71-76.
36. Vigneri P, Fasca F, Sciacca L, Pandini G, Vigneri R. Diabetes and cancer. Endocrine-Related Cancer 2009;16:1103-1123.
37. Carbone D. Smoking and cancer. Am J Med 1992;93:S13-17.38. Bisogni CA, Jastran M, Seligson M, Thompson A. How people interpret healthy
eating: contributions of qualitative research. J Nutr Educ Behav 2012;44:282-301.39. Ros E. Health benefits of nut consumption. Nutrients 2010;2:652-682.40. Kris-Etherton PM, Zhao G, Binkoski AE, Coval SM, Etherton TD. The effect of nuts
on coronary heart disease risk. Nutrition Reviews 2001;59:103-111.41. Rajaram S, Sabete J. Nuts, body weight and insulin resistance. Br J Nutr
2006;96:S79-S86.42. Ros E. The Mediterranean Diet – Chapter 17 – Contribution of Nuts to the
Mediterranean Diet. 2015;175-184.43. Micha R, Michas G, Mozaffarian D. Unprocessed red and processed meats and risk of
coronary artery disease and type 2 diabetes – an updated review of the evidence. Curr Atheroscler Rep 2012;14:515-524.
44. Sacks FM, Campos H. Dietary therapy in hypertension. N Engl J Med. 2010;362:2102-12.
45. Forstermann U. Oxidative stress in vascular disease: causes, defense mechanisms and potential therapies. Nat Clin Pract Cardiovasc Med. 2008;5:338-349
46. McGrowder D, Ragoobirsingh D, Dasgupta T. Effects of S-nitrosoN-acetyl-penicillamine administration on glucose tolerance and plasma levels of insulin and glucagon in the dog. Nitric Oxide. 2001;5:402-412.
47. Portha B, Giroix MH, Cros JC, Picon L. Diabetogenic effect of Nnitrosomethylurea and N-nitrosomethylurethane in the adult rat. Ann Nutr Aliment. 1980;34:1143-51.
48. Aasheim ET, Sharp JS, Appleby PN, et al. Tinned fruit consumption and mortality in three prospective cohorts. PLoS One 2015;10:e0117796.
49. Yang Q, Zhang Z, Gregg EW, et al. Added Sugar Intake and Cardiovascular Diseases Mortality Among US Adults. JAMA Intern Med 2014;30341:1-9.
50. Mozaffarian S, Foroughi N. Dietary guidelines and health- is nutrition science up to the task? BMJ 2018; 360:k822 doi:10.1136/bmj.k822
51. Britton A, Marmot MG, Shipley MJ. How does variability in alcohol consumption over time affect the relationship with mortality and coronary heart disease? Addiction 2010;105:639-645.
52. Alvarez-Alvarez I, de Rojas JP, Fernandez-Montero A, Zazpe I, Ruiz-Canela M, Hidalgo-Santamaria M, Bes-Rastrollo M, Martinez-Gonzalez MA. Strong inverse associations of Mediterranean diet, physical activity and their combination with cardiovascular disease: The Seguimiento Universidad de Navarra (SUN) cohort. Eur J Prev Cardiol 2018;25:1186-1197.

Figure Legends
Figure 1. Food items and risk of all-cause mortality
Figure 2. Food items and risk of cardiovascular disease
Table 1. Studies that evaluate food items and non-consumption of food items and all-cause mortality
Table 2. Studies that evaluate food items and non-consumption of food items and cardiovascular disease
Appendices
Supplementary Figure 1. Study selection process
Supplementary Table 1. Food categories, food components and search results
Supplementary Table 2. Grading of meta-analyses based on Grosso et al.
Supplementary Table 3: Quality assessments in the included systematic reviews and meta-analysesSupplementary Table 4. Grading the quality of the evidence for each food component
Supplementary Table 5: Consideration of sex differences among included studies

Figure 1. Food items and risk of all-cause mortality

Figure 2. Food items and risk of cardiovascular disease


Table 1: Studies that evaluate food items and non-consumption of food items and all-cause mortality
Food group Food item Number of studies
Sample size
Inclusion criteria Risk estimate and statistical heterogeneity.
Reference
Carbohydrate Whole grain bread 2 153,858 Prospective cohort studies up to Apr 2016
Dose-response per 90g/day RR 0.85 (0.82-0.89), I2=0%.
Aune 201614
Pasta 2 265,457 Prospective cohort studies up to Apr 2016
Dose-response per 150h/day RR 0.85 (0.74-0.99) , I2=54%.
Whole grain breakfast cereal
2 206,200 Prospective cohort studies up to Apr 2016
Dose-response per 30g/day RR 0.87 (0.84-0.90), I2=0%.
Oats/oatmeal 1 120,010 Prospective cohort studies up to Apr 2016
Dose-response per 20g/day RR 0.88 (0.83-0.92).
Refined grain 4 163,634 Prospective cohort studies up to Apr 2016
Dose-response per 90g/day RR 0.95 (0.91-0.99) , I2=20%.
Rice 5 453,723 Cohort studies up to July 2014
High vs low intake RR 0.97 (0.88-1.06) , I2=39.4%.
Saneei 201715
Fibre 8 875,390 Prospective cohort studies up to May 2014.
Dose-response per 10g/day RR 0.90 (0.86-0.94), I2=77.2%.
Yang 201516
Meat & eggs Fish 14 911,348 Prospective cohort studies up to Sept 2016
Dose-response per 20g/day RR 0.98 (0.97-1.00), I2=81.9%.
Jayedi 201817
White meat 5 1,156,644
Prospective cohort studies up to Aug 2013
Dose-response per 100g/day RR 0.90 (0.73-1.11), I2=92.1%.
Abete 201418
Red meat 6 1,277986 Prospective cohort studies up to Aug 2013
Dose-response per 100g/day RR 1.04 (0.92-1.17), I2=95%.
Processed meat 5 1,143,696
Prospective cohort studies up to Aug 2013
Dose-response per 50g/day RR 1.25 (1.07-1.45),

I2=95.7%.Eggs 4 853,974 Prospective cohort
studies up to Mar 2016High vs low HR 1.09 (0.997-1.20), I2=59.1%.
Xu 201819
Fruits & vegetables
Root vegetables 1 451,151 Prospective cohort studies up to Sept 2016
Dose-response per 100g/day RR 0.76 (0.66-0.88).
Aune 201720
Green leafy vegetables/salad
7 568,725 Prospective cohort studies up to Sept 2016
Dose-response per 100g/day RR 0.78 (0.71-0.86), I2=11.1%.
Cooked vegetables 4 631,480 Prospective cohort studies up to Sept 2016
Dose-response per 100g/day RR 0.89 (0.80-0.99) , I2=94%.
Cruciferous vegetables
6 531,147 Prospective cohort studies up to Sept 2016
Dose-response per 100g/day RR 0.90 (0.85-0.95), I2=35.2%.
Raw vegetables 2 602,120 Prospective cohort studies up to Sept 2016
Dose-response per 100g/day RR 0.91 (0.80-1.02), I2=90.8%.
Mushrooms 2 495,001 Prospective cohort studies up to Sept 2016
Dose-response per 100g/day RR 0.74 (0.46-1.20), I2=77.7%.
Onion/allium vegetables
2 453,051 Prospective cohort studies up to Sept 2016
Dose-response per 100g/day RR 0.76 (0.40-1.46), I2=50.3%.
Apples/pears 3 462,571 Prospective cohort studies up to Sept 2016
Dose-response per 100g/day RR 0.80 (0.64-1.01), I2=95.3%.
Berries 2 461,115 Prospective cohort studies up to Sept 2016
Dose-response per 100g/day RR 0.85 (0.70-1.03), I2=0%.
Citrus fruits 7 509,708 Prospective cohort studies up to Sept 2016
Dose-response per 100g/day RR 0.94 (0.88-1.00), I2=49.9%.
Fruit juice 1 109,076 Prospective cohort Dose-response per 100g/day
studies up to Sept 2016 RR 0.88 (0.84-0.92).Non-cruciferous vegetables
2 61,436 Prospective cohort studies up to Sept 2016
Dose-response per 100g/day RR 0.95 (0.89-1.02) , I2=83.1%.
Bananas 2 11,420 Prospective cohort studies up to Sept 2016
Dose-response per 100g/day RR 0.95 (0.80-1.14) , I2=70.5%.
Tinned fruits 4 147,712 Prospective cohort studies up to Sept 2016
Dose-response per 100g/day RR 1.14 (1.07-1.21) , I2=0%.
Potatoes 5 486,865 Prospective cohort studies, up to May 2018
Dose-response per 150g/day RR 0.88 (0.69-1.12) , I2=81%.
Schwingshackl 201821
Beverages Alcohol 31 844,414 Prospective cohort studies up to Sept 2009
High vs low intake RR 0.87 (0.83-0.92), I2=68%.
Ronksley 201122
Coffee 16 941,247 Prospective cohort studies up to June 2013
Dose-response per cup/day RR 0.96 (0.94-0.97). I2 not reported.
Je 201423
Green tea 5 205,761 Prospective cohort studies up to Apr 2015
Dose-response per cup/day RR 1.01 (0.99-1.02), I2=0%.
Tang 201524
Black tea 12 349,508 Prospective cohort studies up to Apr 2015
Dose-response per cup/day RR 0.98 (0.86-1.10), I2=84.3%.
Sugar-sweetened beverages
3 187,402 Prospective cohort studies up to July 2015
High vs low intake RR 1.03 (0.91-1.18), I2=75%.
Narain 201625
Artificially sweetened beverages
2 173,778 Prospective cohort studies up to July 2015
High vs low intake RR1.09 (0.92-1.30), I2=73%.
Dairy Yogurt 3 40,460 Prospective cohort studies up to Sept 2016
Dose-response per 50g/day RR 0.97 (0.85-1.11), I2=65.8%.
Guo 201726
Cheese 11 256,091 Prospective cohort studies up to Sept 2016
Dose-response per 10g/day RR 0.99 (0.96-1.01), I2=93.3%.

Milk 10 268,570 Prospective cohort studies up to Sept 2016
Dose-response per 244g/day RR 1.00 (0.93-1.07), I2=97.4%.
Butter 9 379,763 Prospective cohort studies up to May 2015
Dose-response per 14g/day RR 1.01 (1.00-1.03), I2=0%.
Pimpin 20187
Nuts & Other Nuts 16 819,448 Prospective cohort studies up to July 2016
Dose-response per 28g/day RR 0.78 (0.72-0.84), I2=66.0%.
Aune 201627
Tree nuts 4 202,751 Prospective cohort studies up to July 2016
Dose-response per 10g/day RR 0.82 (0.75-0.90) , I2=70.0%.
Peanuts 5 265,252 Prospective cohort studies up to July 2016
Dose-response per 10g/day RR 0.77 (0.69-0.86), I2=64.0%.
Peanut butter 2 83,789 Prospective cohort studies up to July 2016
Dose-response per 10g/day RR 0.94 (0.86-1.02), I2=0%.
Salt 7 21,515 Cohort studies of adults up to August 2011.
Dose-response per increase in sodium intake RR 1.06 (0.94-1.20), I2=61%..
Aburto 201328

Table 2: Studies that evaluate food items and non-consumption of food items and cardiovascular disease
Food group Food item Number of studies
Sample size
Inclusion criteria Risk estimate for cardiovascular disease unless otherwise specified
Reference
Carbohydrate Whole grain bread
3 177,389 Prospective cohort studies up to Apr 2016
Dose-response per 90g/day RR 0.87 (0.80-0.95), I2=0%.
Aune 201614
Whole grain breakfast cereal
2 206,200 Prospective cohort studies up to Apr 2016
Dose-response per 30g/day RR 0.84 (0.78-0.90), I2=0%.
Bran 2 118,085 Prospective cohort studies up to Apr 2016
Dose-response per 10g/day RR 0.85 (0.79-0.90), I2=0%.
Germ 2 118,085 Prospective cohort studies up to Apr 2016
Dose-response per 2g/day RR 1.05 (0.96-1.15), I2=0%.
Refined grain
3 171,842 Prospective cohort studies up to Apr 2016
Dose-response per 90g/day RR 0.98 (0.90,1.06), I2=56%.
Rice 3 133,393 Prospective cohort studies up to Apr 2016
Dose-response per 100g/day RR 0.98 (0.95-1.00), I2=0%.
Fibre 10 1,279,690
Prospective cohort studies up to Aug 2013
Dose-response per 7g/day RR 0.91 (0.88-0.94), I2=45%.
Threapleton 201329
Meat & eggs Fish 8 331,239 Prospective cohort studies up to Sept 2016
Dose-response per 20g/day RR 0.96 (0.94-0.98) for cardiovascular mortality, I2=0%.
Jayedi 201817
White meat 5 1,197,805
Prospective cohort studies up to Aug 2013
Dose-response per 100g/day RR 1.00 (0.87-1.15) for cardiovascular mortality, I2=36.6%.
Abete 201418
Red meat 6 1,319,147
Prospective cohort studies up to Aug 2013
Dose-response per 100g/day RR 1.15 (1.05-1.26) for cardiovascular mortality, I2=76.6%.
Processed meat
6 1,186,761
Prospective cohort studies up to Aug 2013
Dose-response per 50g/day RR 1.24 (1.09-1.40) for cardiovascular mortality, I2=76.4%.

Eggs 9 363,565 Prospective cohort studies up to Mar 2016
High vs low HR 0.97 (0.90-1.05) for ischemic heart disease mortality.
Xu 201819
Fruits & vegetables
Raw vegetables
1 451,151 Prospective cohort studies up to Sept 2016
Dose-response per 100g/day RR 0.86 (0.81-0.90).
Aune 201720
Dried fruit 1 30,458 Prospective cohort studies up to Sept 2016
Dose-response per 100g/day RR 0.66 (0.33-1.26).
Broccoli 2 72,665 Prospective cohort studies up to Sept 2016
Dose-response per 100g/day RR 0.75 (0.49-1.14), I2=0%.
Green leafy vegetables
5 204,508 Prospective cohort studies up to Sept 2016
Dose-response per 100g/day RR 0.83 (0.65-1.08), I2=66.7%.
Grapes 3 74,713 Prospective cohort studies up to Sept 2016
Dose-response per 100g/day RR 0.83 (0.48-1.45), I2=66.7%.
Cruciferous vegetables
9 371,431 Prospective cohort studies up to Sept 2016
Dose-response per 100g/day RR 0.89 (0.77-1.02), I2=65.1%.
Non-cruciferous vegetables
2 134,796 Prospective cohort studies up to Sept 2016
Dose-response per 100g/day RR 0.91 (0.82-1.01), I2=74.5%.
Citrus fruits 8 239,724 Prospective cohort studies up to Sept 2016
Dose-response per 100g/day RR 0.92 (0.84-1.00), I2=65.8%.
Citrus fruit juice
2 102,368 Prospective cohort studies up to Sept 2016
Dose-response per 100g/day RR 0.98 (0.95-1.02), I2=6.9%.
Fruit juice 2 53,989 Prospective cohort studies up to Sept 2016
Dose-response per 100g/day RR 0.99 (0.93-1.06), I2=0%.
Apples/pears
7 124,710 Prospective cohort studies up to Sept 2016
Dose-response per 100g/day RR 0.92 (0.82-1.03), I2=46.9%.
Tomatoes 4 85,225 Prospective cohort studies up to Sept 2016
Dose-response per 100g/day RR 0.92 (0.80-1.07), I2=52.6%.
Carrots 1 9,766 Prospective cohort studies up to Sept 2016
Dose-response per 100g/day RR 0.97 (0.72-1.30).
Strawberries 1 38,176 Prospective cohort studies up to Sept 2016
Dose-response per 100g/day RR 1.06 (0.95-1.17).
Tinned 4 106,017 Prospective cohort Dose-response per 100g/day RR

fruits studies up to Sept 2016 1.30 (0.81-2.08), I2=66.0%.Berries 2 40,224 Prospective cohort
studies up to Sept 2016Dose-response per 100g/day RR 1.13 (0.88-1.46), I2=0%.
Potatoes 4 202,479 Prospective cohort studies up to Sept 2016
Dose-response per 100g/day RR 1.01 (0.97-1.04), I2=13.4%.
Beverages Alcohol 21 1,184,974
Prospective cohort studies up to Sept 2009
High vs low intake RR 0.75 (0.70-0.80) for cardiovascular mortality, I2=72.2%.
Ronksley 201122
Coffee 16 1,029,237
Prospective cohort studies up to Jan 2013
Dose-response per cup/day RR 0.98 (0.95-1.00) for cardiovascular mortality, I2=87.8%.
Malerba 201330
Green tea 5 197,957 Prospective cohort studies up to Apr 2015
Dose-response per cup/day RR 0.95 (0.90-1.00) for cardiovascular mortality, I2=83.8%.
Tang 201524
Black tea 7 162,230 Prospective cohort studies up to Apr 2015
Dose-response per cup/day RR 0.92 (0.85-0.99) for cardiovascular mortality, I2=75.6%.
Sugar-sweetened beverages
1 2,564 Prospective cohort studies up to July 2015
High vs low intake RR 1.00 (0.98-1.02) for vascular event.
Narain 201625
Artificially sweetened beverages
1 2,564 Prospective cohort studies up to July 2015
High vs low intake RR 1.02 (1.00-1.05) for vascular event.
Dairy Yogurt 3 36,624 Prospective cohort studies up to Sept 2016
Dose-response per 50g/day RR 1.03 (0.97-1.09), I2=0%.
Guo 201726
Cheese 9 234,447 Prospective cohort studies up to Sept 2016
Dose-response per 10g/day RR 0.98 (0.95-1.00), I2=82.6%.
Milk 9 249,779 Prospective cohort studies up to Sept 2016
Dose-response per 244g/day RR 1.01 (0.93-1.10), I2=92.4%.
Butter 2 147,297 Prospective cohort studies up to May 2015
Dose-response per 14g/day RR 0.99 (0.96-1.02), I2=0%.
Pimpin 20187
Nuts & Other Nuts 12 376,228 Prospective cohort Dose-response per 28g/day RR 0.79 Aune 201627
studies up to July 2016 (0.70-0.88), I2=59.6%.Tree nuts 3 130,987 Prospective cohort
studies up to July 2016Dose-response per 10g/day RR 0.75(0.67-0.84), I2=0%.
Peanuts 5 265,252 Prospective cohort studies up to July 2016
Dose-response per 10g/day RR 0.64 (0.50-0.81), I2=77.0%.
Salt 9 46,483 Cohort studies of adults up to August 2011.
Dose-response per increase in sodium intake 1.12 (0.93-1.34), I2=61%.
Aburto 201328
Olive oil 9 476,714 Case-control, prospective studies and randomized trials up to Dec 2013
Dose-response per 25g/day RR 0.82 (0.70-0.96), I2=77%.
Martinez-Gonzalez 201431
Soy 20 718,279 Prospective cohort and case control studies up to Feb 2016
High vs low RR 0.83 (0.75-0.93), I2=71.4%.
Yan 20178
Tofu 4 260,607 Prospective cohort and case control studies up to Feb 2016
High vs low RR 0.80 (0.64-1.00), I2=75.1%.
Miso 2 42,371 Prospective cohort and case control studies up to Feb 2016
High vs low RR 0.82 (0.64-1.06), I2=29.8%.
Chocolate 12 369,599 Prospective cohort studies up to Jun 2018
Dose-response per 20g/week 0.982 (0.972-0.992), I2=50.4%.
Ren 201832

Supplementary Figure 1: Study selection process
341 reviews or studies reviewed in detail for potential inclusion.
16 reviews for all-cause mortality. 17 reviews for cardiovascular disease.
3,011 studies retrieved from the search described in the methods and presented in Supplementary Table 1.

Supplementary Table 1: Food categories, food components and search results
Food Category Food component Search resultsFats and Oil Olive oil 35
Palm oil 4Sunflower oil 0Sesame oil 0Peanut oil 0Butter 16Margarine 5
Dairy Milk 140Yogurt 11Ice cream 2Cheese 15
Meat, poultry and beans
Pork or pig 124Beef or cow 84Lamb or sheep 53Chicken 26 (39 with poultry)Turkey 257Duck 4Beans or legumes or pulses 361Tofu or soybean 39
Fish and seafood Salmon 32Tuna 2Cod or bass 64Catfish 0Mackerel 0Anchovy 0Herring 4Shark 1Shrimp or prawn 1Squid or octopus 4Shellfish or oyster or mussel or scallop or clams
6
Crab or lobster 3Mussel 0
Eggs Eggs 37 (51 egg)Nuts Almond 9
Chestnuts 0 (26 chestnut)Hazelnuts 1Walnuts 6Cashews 0Pistachios 2Pine nuts 0Brazil nuts 0Macadamia nuts 1Peanuts 5
Vegetables Broccoli 5Cabbage 2Carrots 4
Celery 0Corn 14Lettuce 0Peas 0Spinach 1Cauliflower 3Chickpea 0Asparagus 1Garlic 23Onion 3Ginger 4Seaweed 1
Fruit Apple 23Bananas 9Blueberry 0Blackberry 2Cherry 22Coconut 2Cranberry 5Grapes 6Figs 2Dates 144Kiwifruit 0Mango 1Lychee 0Olive 55Peach 6Pear 2Plum 1Pineapple 0Raspberry 0Strawberry 0Orange 106Lemon 17Avocado 3Pepper 0Melons 3Cucumber 0Pumpkins 0Squash 0Tomato 6Courgettes or zucchini 1
Carbohydrate and grains
Bread 6Rice 123Cereal 37Pasta 3Fibre or fibre 177Potatoes 6Noodles 0

Drinks and beverages
Coffee 50Tea 54Wine 38Beer 54Spirits or vodka or gin or whisky or rum 35Soft drinks 3
Snacks and sweets Crisps 0Chocolate 19Confectionary or sweets 21Biscuits or cookies 0
Sauces and condiments
Sauces and condiments 1
Salt Salt 495Fungus Mushroom 5Search took place on 13 August 2018.

Supplementary Table 2: Grading of meta-analyses based on Grosso et al.Level of evidence Level DefinitionConvincing 1a (high)
1b (low)Concordance of meta-analysis of RCTs and meta-analysis of observational studies.Meta-analysis of RCTs with contrary results to observational studies.
Probable 2 Meta-analysis of prospective studies with no heterogeneity.Possible 3 Meta-analysis of prospective or retrospective study lacking
information on statistic heterogeneity or with I2>30%.Limited/contrasting 4 Limited studies included in meta-analysis (n≤3).Grosso G, Godos J, Alvano F, Giovannucci EL. Coffee, caffeine, and health outcome: an umbrella review. Ann Rev Nutr 2017;37:131-156.
Supplementary Table 3: Quality assessments in the included systematic reviews and meta-analyses
Review ID Dietary component
Assessment method Quality assessment
Aune 201614 Grain Newcastle-Ottawa scale (0-9).
Average quality assessment score for CVD was 7.7/9 and all-cause death 7.9/9.
Saneei 201715 Rice Hu et al score (out of 15).
Average quality assessment score for mortality was 10.3/15.
Yang 201516 Fibre No quality score used. Not performed.Jayedi 201817 Fish Newcastle-Ottawa
scale (0-9).Average quality assessment score overall was 7.5/9.
Abete 201428 Meat No quality score used. Not performed.Xu 201819 Eggs No quality score used. Not performed.Aune 201720 Fruits and
vegetablesNewcastle-Ottawa scale (0-9).
Quality assessment scores for CVD was 12/13 for fruits/vegetables, 15/17 for fruits and 12/14 for vegetables. For all-cause mortality, it was 14/15 for fruits/vegetables, 20/27 for fruits and 19/22 for vegetables.
Schwingshackl 201821
Potatoes NutriGrade scoring system (out of 10 but graded as very low (0-3), low (4-5), moderate (6-7) and high (≥8).
Average quality for all-cause mortality was low and CHD was low.
Ronksley 201122
Alcohol 2 criteria assessed based on Egger et al and Laupacis et al.
85% of studies had >5 years follow up and 90% of studies adjusted for basic demographic information.
Je 201423 Coffee Adjustments for potential confounders only factor considered.
All studies adjusted for covariates.
Tang 201524 Tea Newcastle-Ottawa scale (0-9).
Average quality assessment score overall was 6.1/9.
Narain 201625 Soft drink 5 areas assessed. Average quality assessment score overall was 3.6/5.
Guo 201726 Milk Newcastle-Ottawa quality assessment scale (0-9).
Average quality assessment score overall was 7.9/9.
Pimpin 20187 Butter Adapted Newcastle-Ottawa quality scale (0-5).
Average quality assessment score overall 4.6/5.
Aune 201627 Nuts Newcastle-Ottawa scale (0-9).
Average quality assessment score for CVD was 7.6/9 and all-cause death 7.3/9.
Aburto 201328 Salt GRADE methodology used to assess quality.
Quality of the evidence was very low to moderate for CVD, very low to low for CHD and very low for all-cause mortality.
Threapleton 201329
Fibre Newcastle-Ottawa scale (0-9).
Average quality assessment score overall 7.2/9.
Malerba 201330 Coffee No quality score used. Not performed.Martinez-Gonzalez 201431
Olive oil Newcastle-Ottawa scale (0-9).
Average quality assessment score overall 7.8/9.
Yan 20178 Soy Newcastle-Ottawa scale (0-9).
Average quality assessment score overall 7.7/9.
Ren 201832 Chocolate Newcastle-Ottawa scale (0-9).
Average quality assessment score overall 8.4/9.

CVD=cardiovascular disease, CHD=coronary heart disease

Supplementary Table 4: Grading the quality of the evidence for each food component
Food group Food item Grade for mortality
Reason Grade for CVD
Reason
Carbohydrate Whole grain bread Level 4 limited
Fewer than 4 studies. Level 4 limited
Fewer than 4 studies.
Pasta Level 4 limited
Fewer than 4 studies. - -
Whole grain breakfast cereal Level 4 limited
Fewer than 4 studies. Level 4 limited
Fewer than 4 studies.
Oats/oatmeal Level 4 limited
Fewer than 4 studies. Level 4 limited
Fewer than 4 studies.
Refined grain Level 2 probable
4 prospective studies with I2=20%.
- -
Bran - - Level 4 limited
Fewer than 4 studies.
Germ - - Level 4 limited
Fewer than 4 studies.
Rice Level 3 possible
5 cohort studies with I2=39.4%. Level 4 limited
Fewer than 4 studies.
Fibre Level 3 possible
5 prospective studies with I2=77.2%.
Level 3 possible
10 prospective studies with I2=45%.
Meat & eggs Fish Level 3 possible
14 prospective studies with I2=81.9%.
Level 2 possible
8 prospective studies with I2=0%.
White meat Level 3 possible
5 prospective studies with I2=92.1%.
Level 3 possible
5 prospective studies with I2=36.6%.
Red meat Level 3 possible
6 prospective studies with I2=95%.
Level 3 possible
6 prospective studies with I2=76.6%.
Processed meat Level 3 possible
5 prospective studies with I2=95.7%.
Level 3 possible
6 prospective studies with I2=76.4%.
Eggs Level 3 possible
4 prospective studies with I2=59.1%.
Level 3 possible
9 prospective studies with I2 not reported.
Fruits & vegetables Root vegetables Level 4 Fewer than 4 studies. - -

limitedGreen leafy vegetables/salad Level 2
probable.7 prospective studies with I2=11.1%.
Level 3 possible
5 prospective studies with I2=66.7%.
Cooked vegetables Level 3 possible
4 prospective studies with I2=94%.
- -
Cruciferous vegetables Level 3 possible
6 prospective studies with I2=35.2%.
Level 3 possible
9 prospective studies with I2=65.1%.
Raw vegetables Level 4 limited
Fewer than 4 studies. Level 4 limited
Fewer than 4 studies.
Mushrooms Level 4 limited
Fewer than 4 studies. - -
Onion/allium vegetables Level 4 limited
Fewer than 4 studies. - -
Apples/pears Level 4 limited
Fewer than 4 studies. Level 3 possible
7 prospective studies with I2=46.9%.
Berries Level 4 limited
Fewer than 4 studies. Level 4 limited
Fewer than 4 studies.
Citrus fruits Level 3 possible
7 prospective studies with I2=49.9%.
Level 3 possible
8 prospective studies with I2=65.8%.
Fruit juice Level 4 limited
Fewer than 4 studies. Level 4 limited
Fewer than 4 studies.
Non-cruciferous vegetables Level 4 limited
Fewer than 4 studies. Level 4 limited
Fewer than 4 studies.
Bananas Level 4 limited
Fewer than 4 studies. - -
Tinned fruits Level 2 probable
4 prospective studies with I2=0%.
Level 3 possible
4 prospective studies with I2=66.0%.
Carrots - - Level 4 limited
Fewer than 4 studies.
Strawberries - - Level 4 limited
Fewer than 4 studies.
Tomatoes - - Level 3 4 prospective studies with I2=52.6%.

possibleCitrus fruit juice - - Level 4
limitedFewer than 4 studies.
Grapes - - Level 4 limited
Fewer than 4 studies.
Broccoli - - Level 4 limited
Fewer than 4 studies.
Dried fruit - - Level 4 limited
Fewer than 4 studies.
Potatoes Level 3 possible
5 prospective studies with I2=81%.
Level 2 probable
4 prospective studies with I2=13.4%.
Beverages Alcohol Level 3 possible
31 prospective studies with I2=68%.
Level 3 possible
21 prospective studies with I2=72.2%.
Coffee Level 3 possible
16 prospective studies with I2 not reported.
Level 3 possible
16 prospective studies with I2=87.8%.
Green tea Level 2 probable
5 prospective studies with I2=0%.
Level 3 possible
5 prospective studies with I2=83.8%.
Black tea Level 3 possible
12 prospective studies with I2=84.3%.
Level 3 possible
7 prospective studies with I2=75.6%.
Sugar-sweetened beverages Level 4 limited
Fewer than 4 studies. Level 4 limited
Fewer than 4 studies.
Artificially sweetened beverages
Level 4 limited
Fewer than 4 studies. Level 4 limited
Fewer than 4 studies.
Dairy Yogurt Level 4 limited
Fewer than 4 studies. Level 4 limited
Fewer than 4 studies.
Cheese Level 3 possible
11 prospective studies with I2=93.3%.
Level 3 possible
9 prospective studies with I2=82.6%.
Milk Level 3 possible
10 prospective studies with I2=97.4%.
Level 3 possible
9 prospective studies with I2=92.4%.
Butter Level 2 possible
9 prospective studies with I2=0%.
Level 4 limited
Fewer than 4 studies.
Nuts & Other Nuts Level 3 16 prospective studies with Level 3 12 prospective studies with

possible I2=66.0%. possible I2=59.6%.Tree nuts Level 3
possible4 prospective studies with I2=70.0%.
Level 4 limited
Fewer than 4 studies.
Peanuts Level 3 possible
5 prospective studies with I2=64.0%.
Level 3 possible
5 prospective studies with I2=77.0-%.
Peanut butter Level 4 limited
Fewer than 4 studies. - -
Salt Level 3 possible
7 prospective studies with I2=61%.
Level 3 possible
9 prospective studies with I2=61%.
Olive oil - - Level 3 possible
9 prospective studies with I2=77%.
Soy - - Level 3 possible
20 prospective studies with I2=71.4%.
Tofu - - Level 3 possible
4 prospective studies with I2=75.1%.
Miso - - Level 4 limited
Fever than 4 studies.
Chocolate - - Level 3 possible
12 prospective studies with I2=61%.

Supplementary Table 5: Consideration of sex differences among included studiesReview ID Dietary
componentConsideration of sex differences among included studies
Aune 201614 Grain The authors state that there was little evidence of heterogeneity between subgroups in subgroup and meta-regression stratified by sex.
Saneei 201715 Rice Risk of mortality in men RR 0.87 (0.81-0.94) and in women RR 1.08 (0.97-1.19).
Yang 201516 Fibre For top vs bottom tertile, risk of mortality in men RR 0.80 (0.76-0.85) and in women RR 0.83 (0.79-0.86).
Jayedi 201817 Fish Risk of mortality in men was RR 0.99 (0.96-1.02) and in women it was RR 0.98 (0.95-1.00)
Abete 201418 Meat Risk of mortality in men for red meat RR 1.21 (1.15-1.26), white meat RR 0.87 (0.65-1.17) and processed meat RR 1.23 (1.10-1.37) and in women for red meat RR 1.14 (1.00-1.30), white meat RR 1.01 (0.89-1.15) and processed meat RR 1.34 (1.09-1.66). Risk of cardiovascular mortality in men for red meat RR 1.20 (1.12-1.30), white meat RR 1.05 (0.74-1.31) and processed meat RR 1.15 (0.96-1.37) and in women for red meat RR 1.26 (1.08-1.47), white meat RR 1.08 (0.94-1.24) and processed meat RR 1.64 (1.25-2.15).
Xu 201819 Eggs The authors state "As no evidence suggested different associations by sex (P values for interaction from 0.45 to 0.92), all analysis was conducted with both sexes combined, adjusted for sex."
Aune 201720 Fruits and vegetables
Risk of CHD in men for fruits/vegetables RR 0.93 (0.89-0.97), fruits RR 0.91 (0.86-0.97) and vegetables RR 0.77 (0.68-0.89) and in women for fruits/vegetables RR 0.88 (0.82-0.94), fruits RR 0.84 (0.76-0.92) and vegetables RR 0.89 (0.81-0.98). Risk of CVD in men for fruits/vegetables RR 0.93 (0.85-1.03), fruits RR 0.85 (0.70-1.05) and vegetables RR 0.89 (0.78-1.00) and in women for fruits/vegetables RR 0.94 (0.89-0.99), fruits RR 0.83 (0.77-0.90) and vegetables RR 0.92 (0.86-0.98). Risk of mortality in men for fruits/vegetables RR 0.95 (0.91-0.99), fruits RR 0.88 (0.78-1.00) and vegetables RR 0.91 (0.84-0.99) and in women for fruits/vegetables RR 0.94 (0.90-0.98), fruits RR 0.96 (0.90-1.02) and vegetables RR 0.93 (0.86-0.99).
Schwingshackl 201821
Potatoes Risk of CHD in men RR 1.05 (0.94-1.17) and women RR 1.00 (0.85-1.17).
Ronksley 201122 Alcohol The authors state that sensitivity analyses confined to only studies of sex revealed generally similar results for all the outcomes.
Je 201423 Coffee For high vs low consumption, risk of mortality in men RR 0.81 (0.79-0.90) and women RR 0.84 (0.79-0.89).
Tang 201524 Tea For high vs low consumption, green tea and risk of CVD in men RR 0.72 (0.42-1.23) and women RR 0.54 (0.34-0.84). Green tea and risk of all-cause mortality in men RR 0.80 (0.68-0.95) and women RR 0.74 (0.60-0.93). Black tea and risk of CVD in men RR 1.56 (0.76-3.20) and women RR 1.01 (0.80-1.26). Black tea and risk of all-cause mortality in men RR 1.45 (0.95-1.21) and women RR 1.0 (0.89-1.14).

Narain 201625 Soft drink Sex differences not explored for myocardial infarction or mortality.Guo 201726 Milk No sex specific subgroup analyses were performed.Pimpin 20187 Butter No sex specific subgroup analyses were performed.
Aune 201627 Nuts Risk of CHD in men was RR 0.70 (0.62-0.80) and in women it was RR 0.71 (0.61-0.82). Risk of CVD in men was RR 0.73 (0.66-0.81) and in women it was RR 0.86 (0.72-1.03). Risk of mortality in men was RR 0.76 (0.70-0.83) and in women was RR 0.76 (0.64-0.88).
Aburto 201328 Salt No sex specific subgroups reported for CVD and mortality.Threapleton 201329
Fibre The authors state that for total fibre and CHD risk there was no differences observed between the sexes.
Malerba 201330 Coffee Risk of mortality with incremental increase in coffee (1 cup/day), for men was RR 0.97 (0.95-0.99) and for women it was RR 0.95 (0.93-0.97). Risk of CVD mortality, for men was RR 0.99 (0.95-1.03) and for women it was RR 0.94 (0.92-0.98).
Martinez-Gonzalez 201431
Olive oil The authors state that no substantial differences were found for the risk of CVD when separating the studies according to women or men.
Yan 20178 Soy Risk of CVD for soy intake in men was RR 0.91 (0.79-1.05) and for women it was RR 0.83 (0.69-0.99).
Ren 201832 Chocolate Risk of CVD for chocolate consumption in men was RR 0.991 (0.964-1.019) and in women it was RR 0.965 (0.931-1.001).
RR=relative risk, CHD=coronary heart disease, CVD=cardiovascular disease
![First Revision No. 6108-NFPA 5000-2015 [ Global Input ] · PDF fileFirst Revision No. 6108-NFPA 5000-2015 [ Global Input ] ... Design and Construction of Post-Tensioned Slabs-on-Ground](https://static.fdocuments.in/doc/165x107/5a70e96d7f8b9ab6538c57d7/first-revision-no-6108-nfpa-5000-2015-global-input-wwwnfpaorgassetsfilesaboutthecodes50005000pdf.jpg)


