Recall MARGINAL Costs, Revenue, Profit & Sales are ALL first derivatives of C(x), R(x), P(x), S(x) ...
66
Graphing & Optimization
-
Upload
jemimah-griffin -
Category
Documents
-
view
219 -
download
4
Transcript of Recall MARGINAL Costs, Revenue, Profit & Sales are ALL first derivatives of C(x), R(x), P(x), S(x) ...

Graphing & Optimization
First Derivatives & Graphs Recall MARGINAL Costs, Revenue, Profit &
Sales are ALL first derivatives of C(x), R(x), P(x), S(x)
For our purposes, marginal functions represent the approximation of producing the next “x” item.◦ Therefore:
marginal cost = the cost of producing (x + 1) item
First Derivatives & Graphs Thus far with derivatives we have inferred
their meanings as it might relate to costs, revenues or profits.
Now, let’s consider how a graph of these inferences can be made.

Use your calculator to graph f(x):
762 xxxf
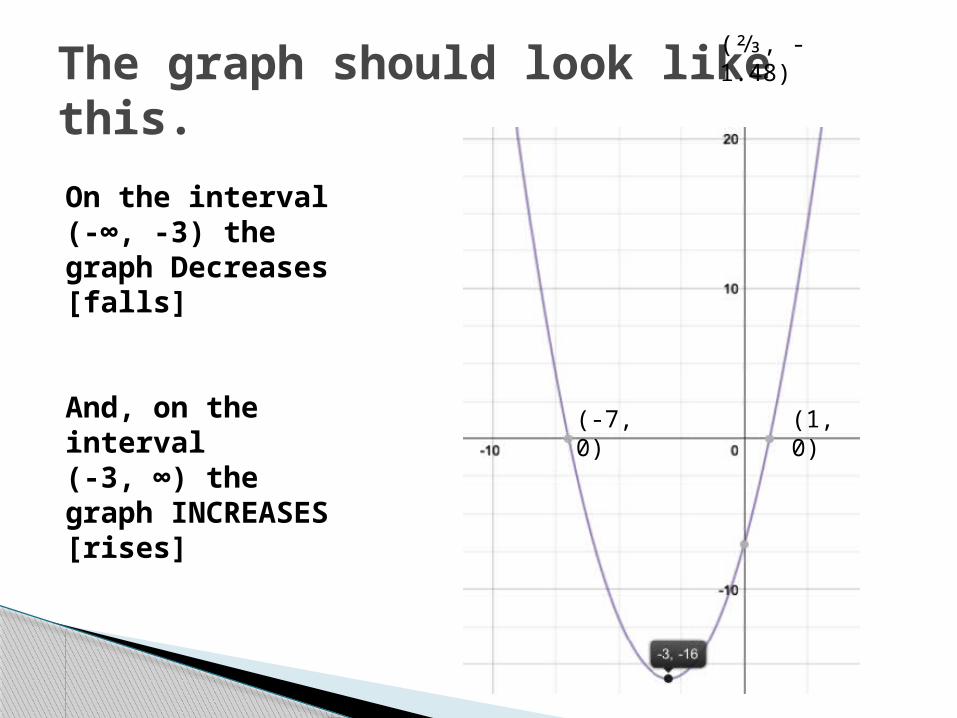
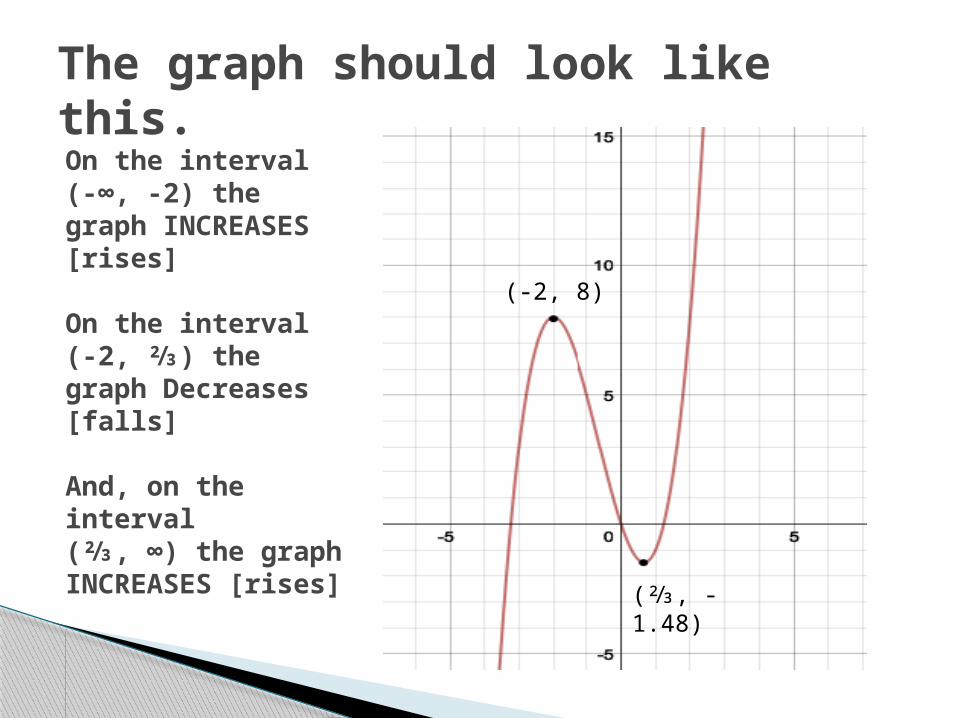
The graph should look like this.
On the interval (-∞, -3) the graph Decreases [falls]
And, on the interval(-3, ∞) the graph INCREASES [rises]
(⅔, -1.48)
(-7, 0) (1, 0)
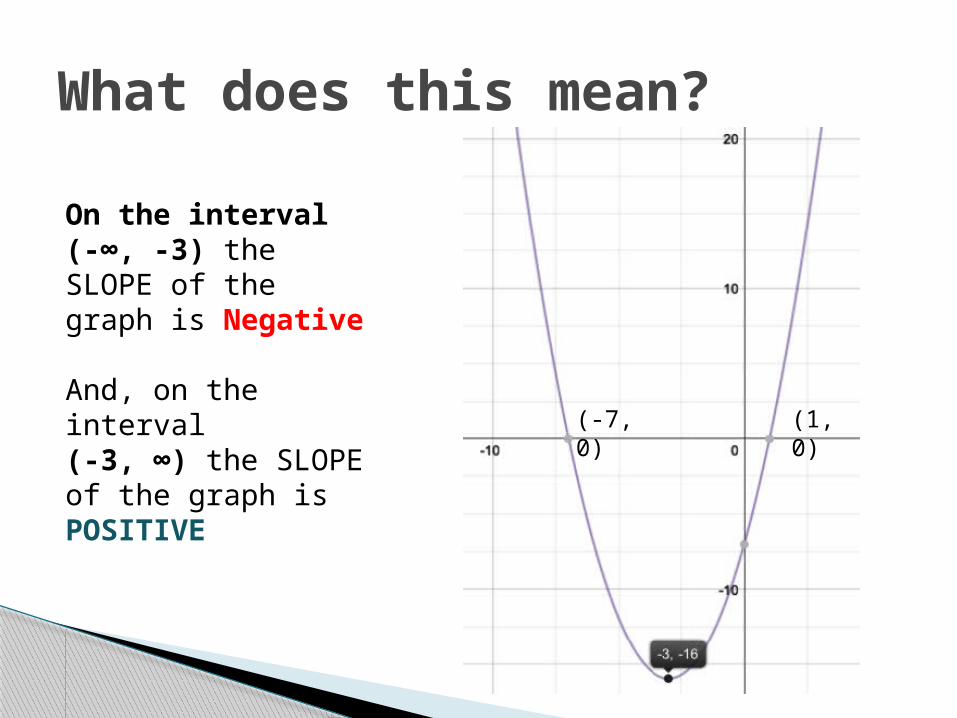
What does this mean?
On the interval (-∞, -3) the SLOPE of the graph is Negative
And, on the interval(-3, ∞) the SLOPE of the graph is POSITIVE
(-7, 0) (1, 0)

TRANSLATIONPOSITIVE slope means f ‘(x) > 0 and f(x) is INCREASING on an interval (a, b) and the graph of f(x) RISES.
Negative slope means f ‘(x) < 0 and f(x) is Decreasing on an interval (a, b) and the graph of f(x) Falls.

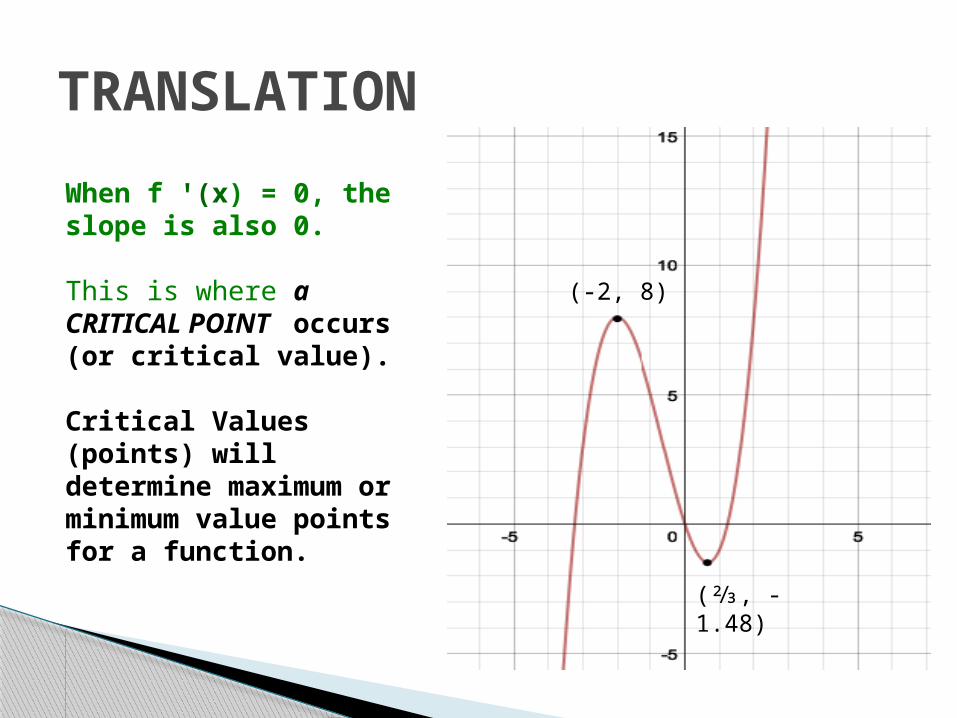
TRANSLATIONWhen f ′(x) = 0, the slope is also 0.
This is where a CRITICAL POINT occurs (or critical value).
Critical Values (points) will determine maximum or minimum value points for a function.

Use your calculator to graph f(x):
The graph should look like this.
On the interval (-∞, -2) the graph INCREASES [rises]
On the interval (-2, ⅔) the graph Decreases [falls]
And, on the interval(⅔, ∞) the graph INCREASES [rises]
(-2, 8)
(⅔, -1.48)

What does this mean?On the interval (-∞, -2) the SLOPE of the graph is POSITIVE
On the interval (-2, ⅔) the SLOPE of the graph is Negative
And, on the interval(⅔, ∞) the SLOPE of the graph is POSITIVE
(-2, 8)
(⅔, -1.48)

TRANSLATIONPOSITIVE slope means f ′(x) > 0 and f(x) is INCREASING on an interval (a, b) and the graph of f(x) RISES.
Negative slope means f ꞌ(x) < 0 and f(x) is Decreasing on an interval (a, b) and the graph of f(x) Falls.
(-2, 8)
(⅔, -1.48)
TRANSLATIONWhen f ꞌ(x) = 0, the slope is also 0.
This is where a CRITICAL POINT occurs (or critical value).
Critical Values (points) will determine maximum or minimum value points for a function.
(-2, 8)
(⅔, -1.48)
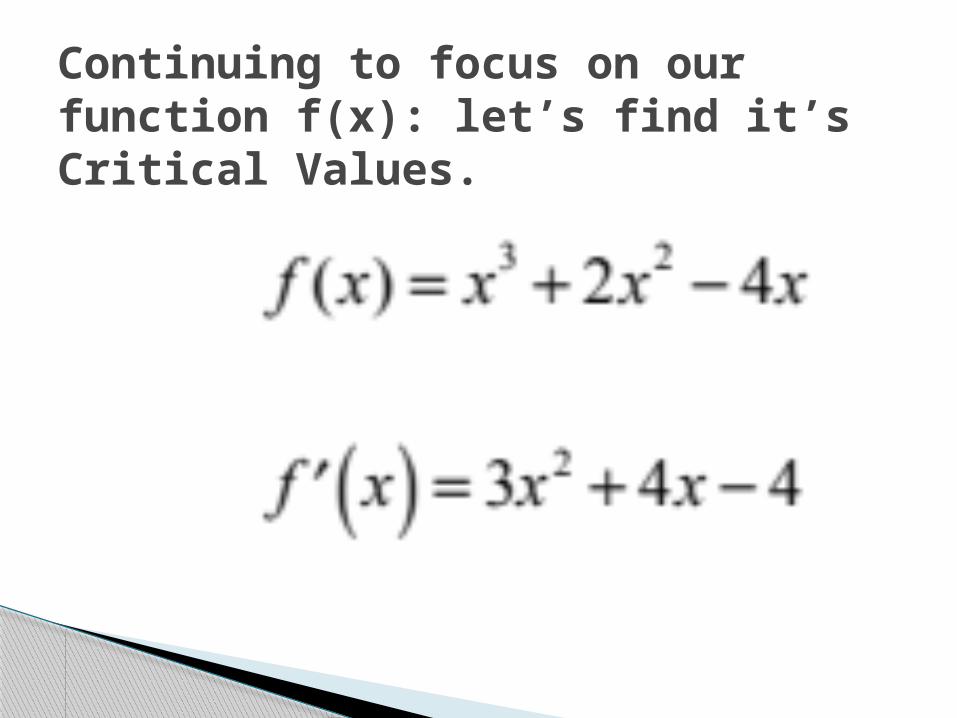
Continuing to focus on our function f(x): let’s find it’s Critical Values.

Critical ValuesDefinition. The values of x in the domain of f where f ‘(x) = 0 or does not exist are called the critical values of f.
Insight: All critical values are also partition numbers, but there may be partition numbers that are not critical values (where f itself is not defined).
If f is a polynomial, critical values and partition numbers are both the same, namely the solutions of f ‘(x) = 0.

Find Critical Values by setting the first derivative equal to 0.
Now, solve for values of x.
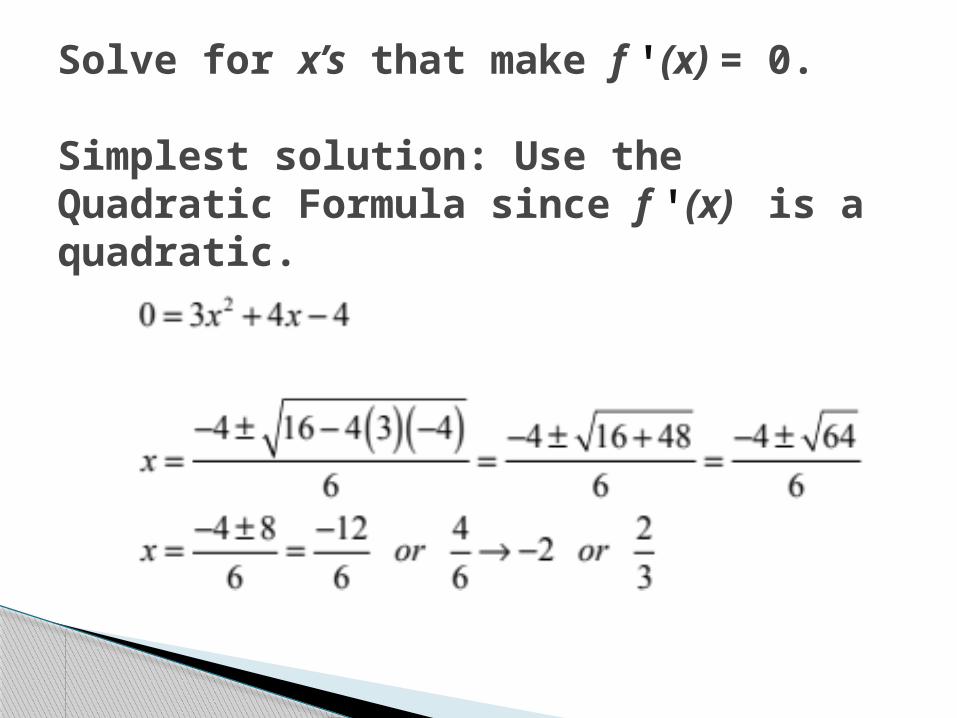
Solve for x’s that make f ꞌ(x) = 0.
Simplest solution: Use the Quadratic Formula since f ꞌ(x) is a quadratic.

Now, construct an interval table:
Using f ’(x) = (3x2 + 4x – 4), substitute values in the interval to determine how the GRAPH of f(x) behaves
++++++++++ 0 -------------- 0 ++++++++++
Use -4 -2 Use -1 ⅔ Use 1
Since our critical points are -2 and ⅔, we construct a number line these two values highlighted.
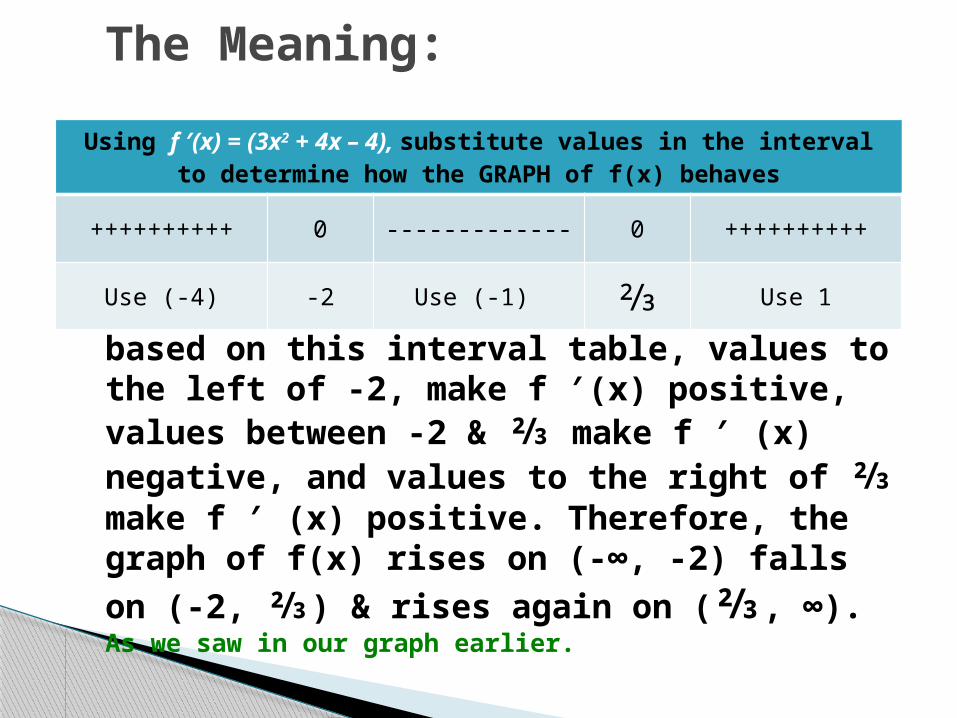
The Meaning:
based on this interval table, values to the left of -2, make f ′(x) positive, values between -2 & ⅔ make f ′ (x) negative, and values to the right of ⅔ make f ′ (x) positive. Therefore, the graph of f(x) rises on (-∞, -2) falls on (-2, ⅔) & rises again on (⅔, ∞). As we saw in our graph earlier.
Using f ′(x) = (3x2 + 4x – 4), substitute values in the interval to determine how the GRAPH of f(x) behaves
++++++++++ 0 ------------- 0 +++++++++
+
Use (-4) -2 Use (-1) ⅔ Use 1

Points of IMPORTANCE:• Critical values will ALWAYS occur in the domain of
the function under consideration• Any value that causes a 0 in the denominator is
considered a Critical Value.• A continuous function can INCREASE or Decrease
on an interval containing a value of x for which f ′(x) does NOT EXIST.
• To be a critical value, the number under consideration MUST be in the domain of the function.
• Values where a function is INCREASING or Decreasing must be written in an Open Interval.
Local Extrema
When the graph of a continuous function changes from rising to falling, a high point or local maximum occurs.
When the graph of a continuous function changes from falling to rising, a low point or local minimum occurs.
Theorem. If f is continuous on the interval (a, b), c is a number in (a, b), and f (c) is a local extremum, then either f ‘(c) = 0 or f ‘(c) does not exist. That is, c is a critical point.

Let c be a critical value of f, ◦ f(c) is a relative minimum if there exists within an
open interval (a, b) value c such that f(c) ≤ f(x) What does this really mean???? In an interval test the values of f ′(x) are as
follows
Since the values go from negative to positive, the graph will appear to decrease before “c” and increase after “c” making a shape. (hence, the minimum)
FIRST DERIVATIVE TEST
This is f '(x)
-------------------- 0 +++++++++++++++
Values to the left of “c” c Values to the right of “c”
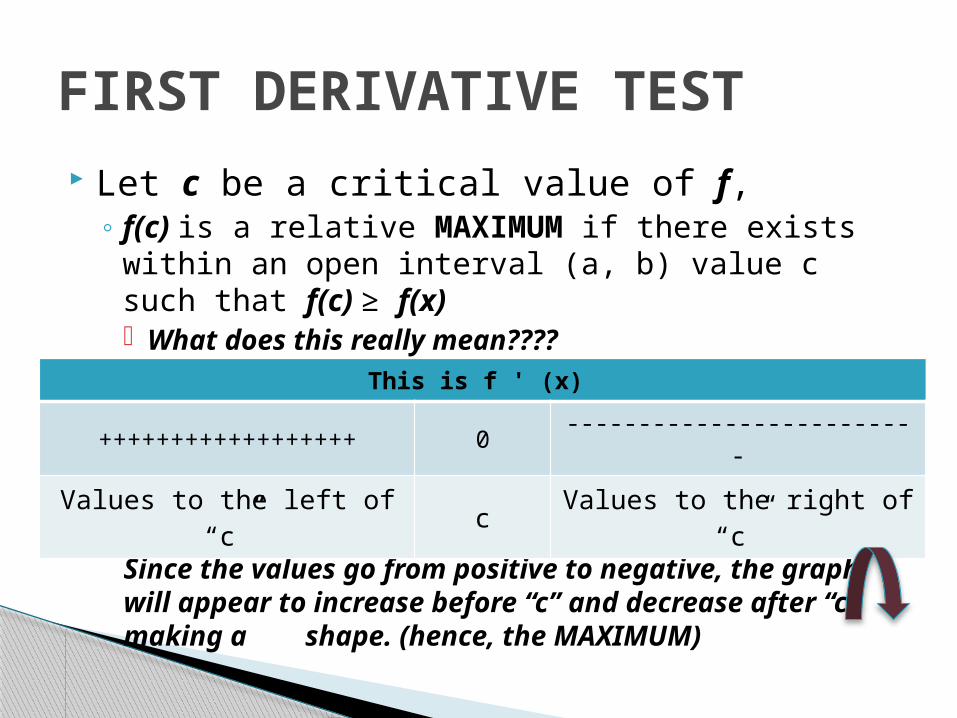
Let c be a critical value of f, ◦ f(c) is a relative MAXIMUM if there exists within
an open interval (a, b) value c such that f(c) ≥ f(x) What does this really mean???? In an interval test the values of f '(x) are as follows
Since the values go from positive to negative, the graph will appear to increase before “c” and decrease after “c” making a shape. (hence, the MAXIMUM)
FIRST DERIVATIVE TEST
This is f ' (x)
++++++++++++++++++ 0 -------------------------
Values to the left of “c” c Values to the right of “c”
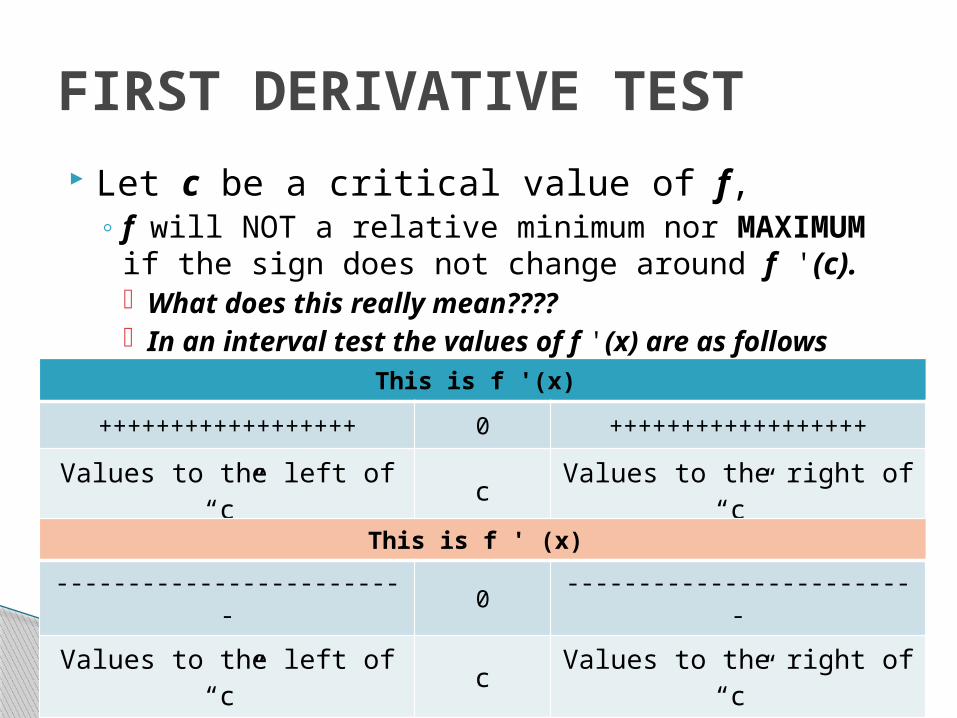
Let c be a critical value of f, ◦ f will NOT a relative minimum nor MAXIMUM if
the sign does not change around f '(c). What does this really mean???? In an interval test the values of f '(x) are as follows
FIRST DERIVATIVE TEST
This is f '(x)
++++++++++++++++++ 0 +++++++++++++++++
+
Values to the left of “c” c Values to the right of “c”
This is f ' (x)
------------------------- 0 -------------------------
Values to the left of “c” c Values to the right of “c”
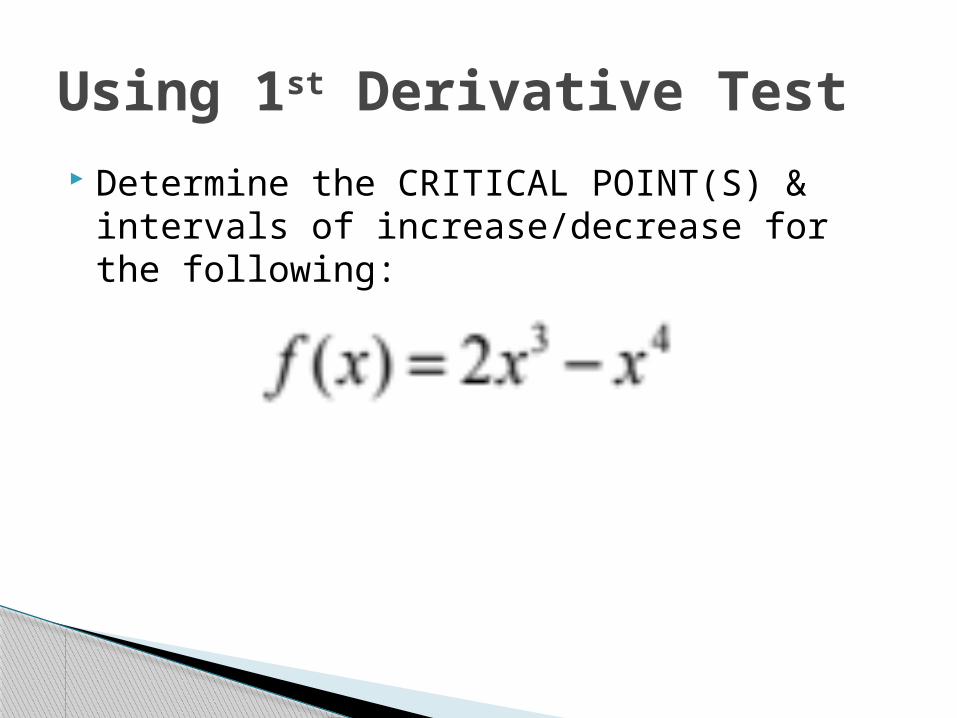
Determine the CRITICAL POINT(S) & intervals of increase/decrease for the following:
Using 1st Derivative Test
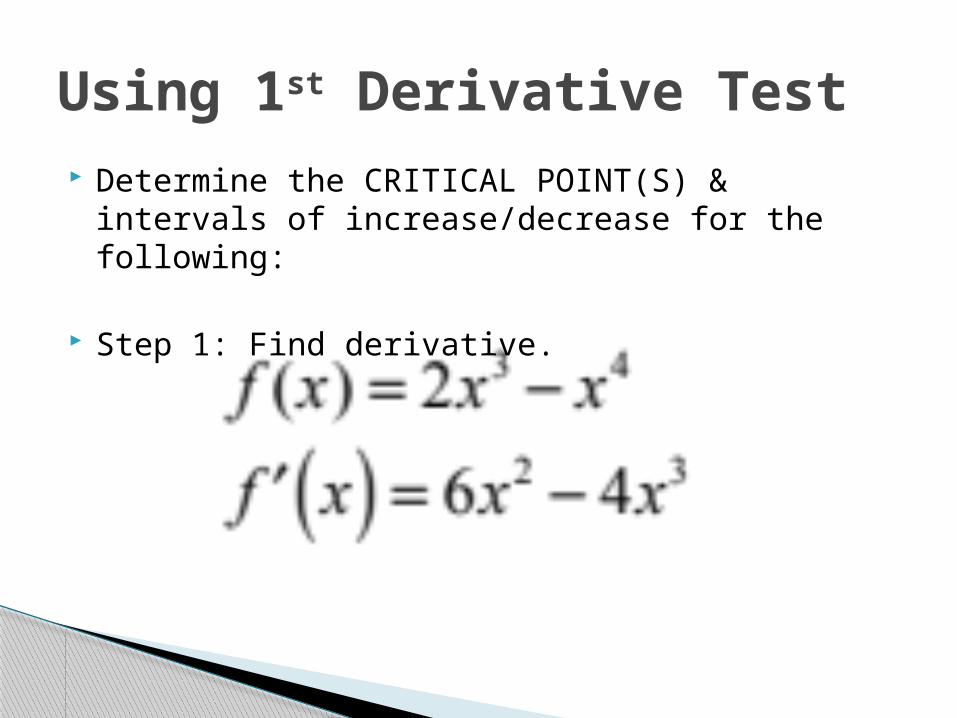
Determine the CRITICAL POINT(S) & intervals of increase/decrease for the following:
Step 1: Find derivative.
Using 1st Derivative Test
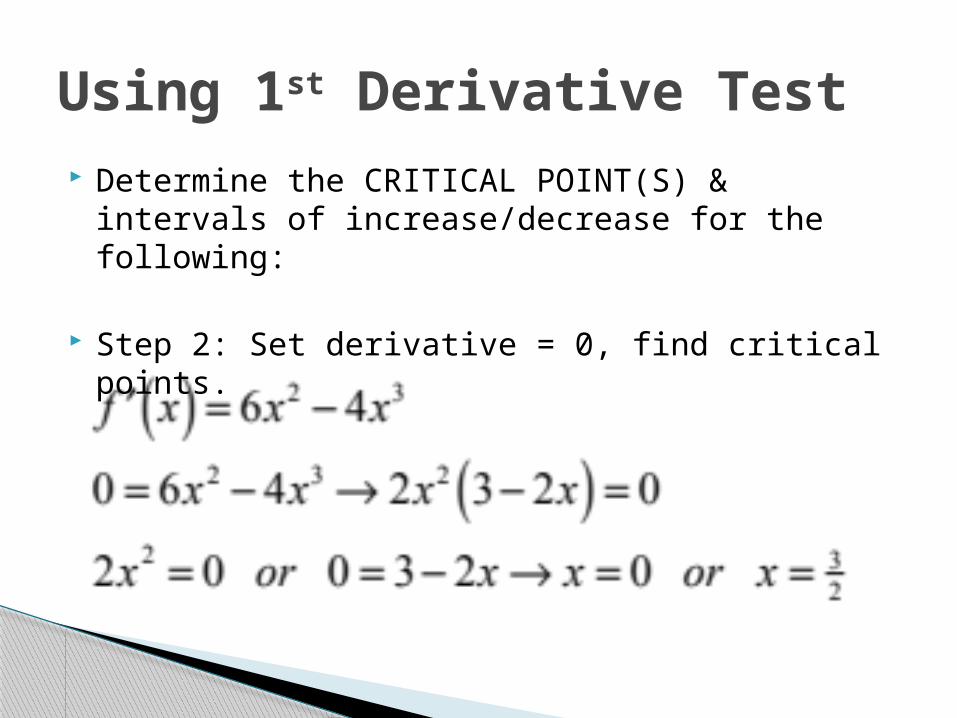
Determine the CRITICAL POINT(S) & intervals of increase/decrease for the following:
Step 2: Set derivative = 0, find critical points.
Using 1st Derivative Test
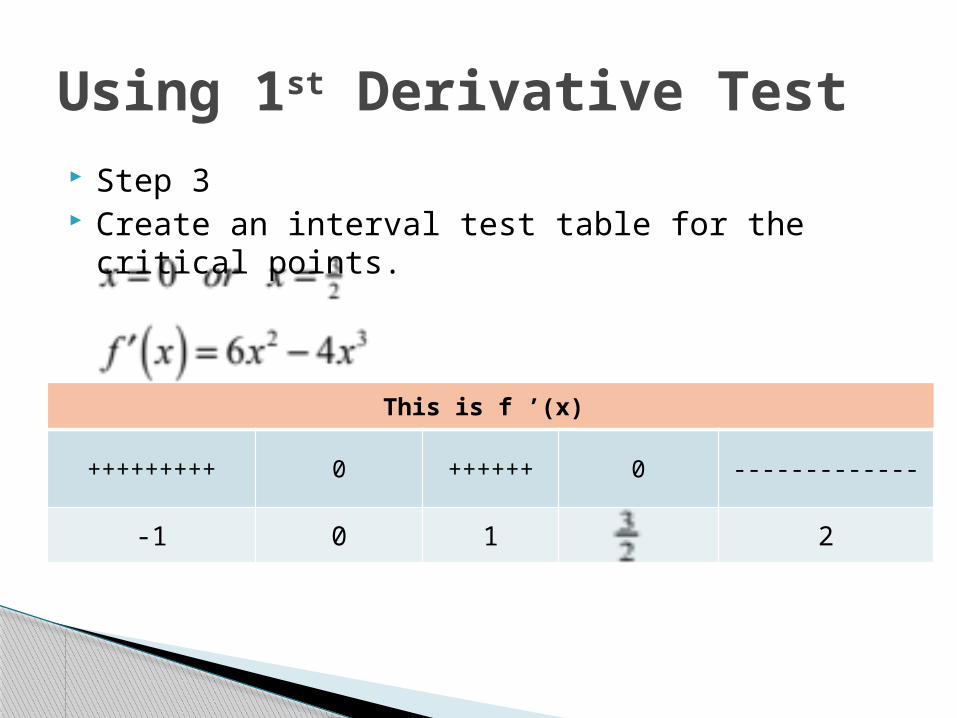
Step 3 Create an interval test table for the critical points.
Using 1st Derivative Test
This is f ’(x)
+++++++++ 0 ++++++ 0 -------------
-1 0 1 2

Step 4 Create intervals using critical values.
NOTICE: at 0 no extrema occurs
Using 1st Derivative Test
+++++++++ 0 ++++++ 0 -------------
-1 0= ND 1 2 = MAX
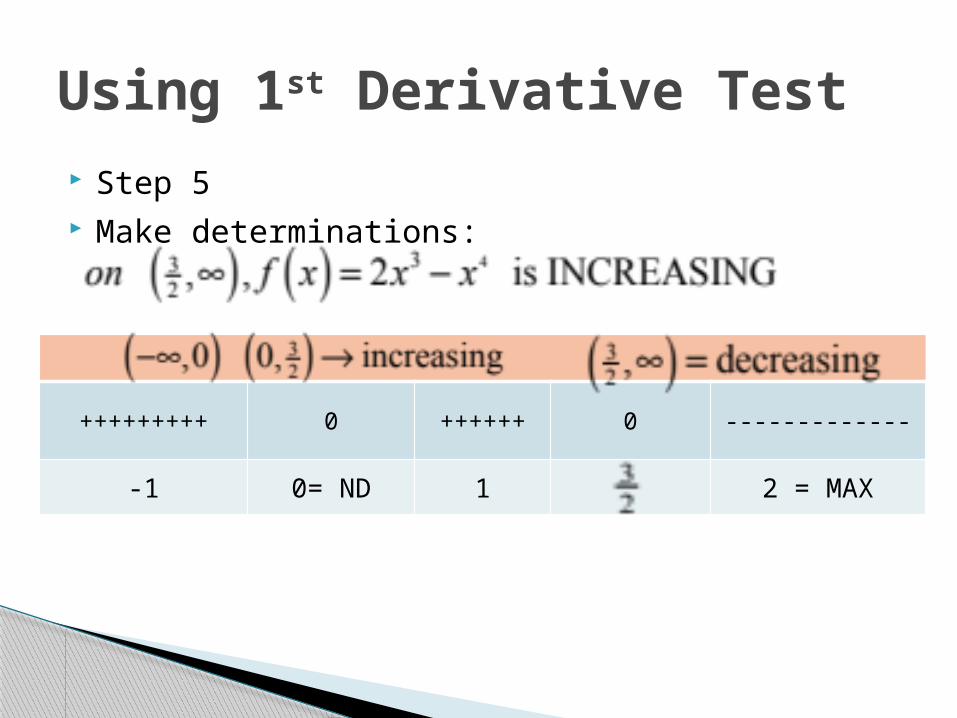
Step 5 Make determinations:
Using 1st Derivative Test
+++++++++ 0 ++++++ 0 -------------
-1 0= ND 1 2 = MAX

Graph:
Using 1st Derivative Test
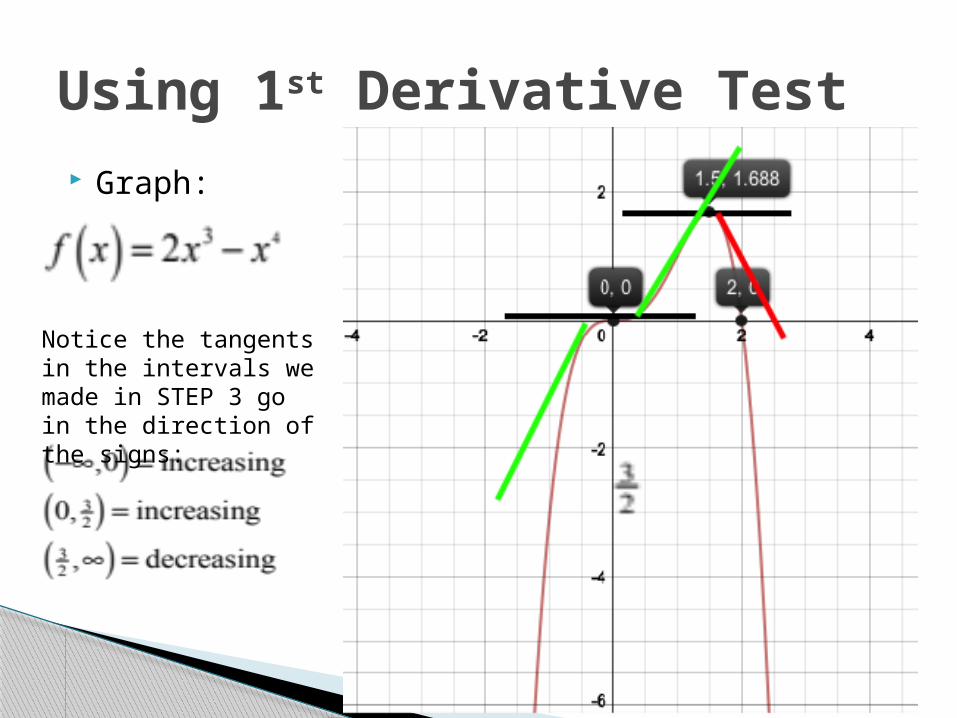
Graph:
Using 1st Derivative Test
Notice the tangents in the intervals we made in STEP 3 go in the direction of the signs:

According to some studies, oil companies are investing less in exploration since they continue to find less oil than they pump out of the ground. The function A(t) = 0.0265t3 – 0.453t2 + 1.796t + 7.47 (0 ≤ t ≤ 10), represents in billions of dollars, the amount invested by large oil companies in exploration for new reserves t years after 1995.
Find the relative extrema and graph the function.
Application of 1st Derivative Test

Find the relative extrema and graph the function.
A(t) = 0.0265t3 – 0.453t2 + 1.796t + 7.47 A ’(t) = 0.0795t2 – 0.906t + 1.796
Application of 1st Derivative Test
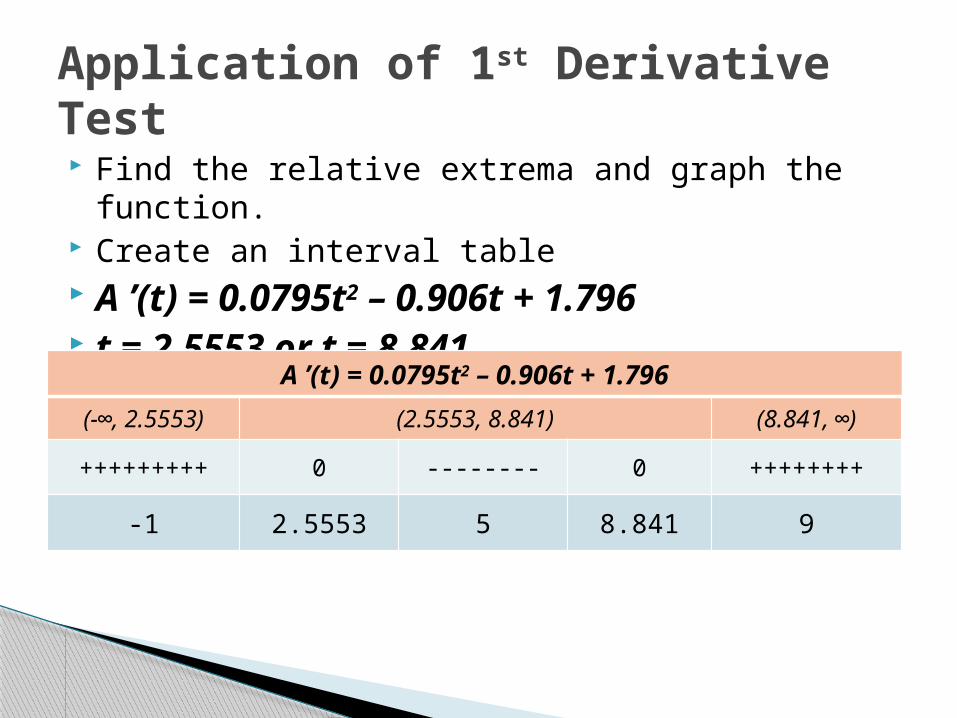
Find the relative extrema and graph the function. Create an interval table A ’(t) = 0.0795t2 – 0.906t + 1.796 t = 2.5553 or t = 8.841
Application of 1st Derivative Test
A ’(t) = 0.0795t2 – 0.906t + 1.796(-∞, 2.5553) (2.5553, 8.841) (8.841, ∞)
+++++++++ 0 -------- 0 ++++++++
-1 2.5553 5 8.841 9

Find the relative extrema and graph the function. Create an interval table A(t) = 0.0265t3 – 0.453t2 + 1.796t + 7.47
Relative MAX at x = 2.553 Relative min at x = 8.841
Application of 1st Derivative Test
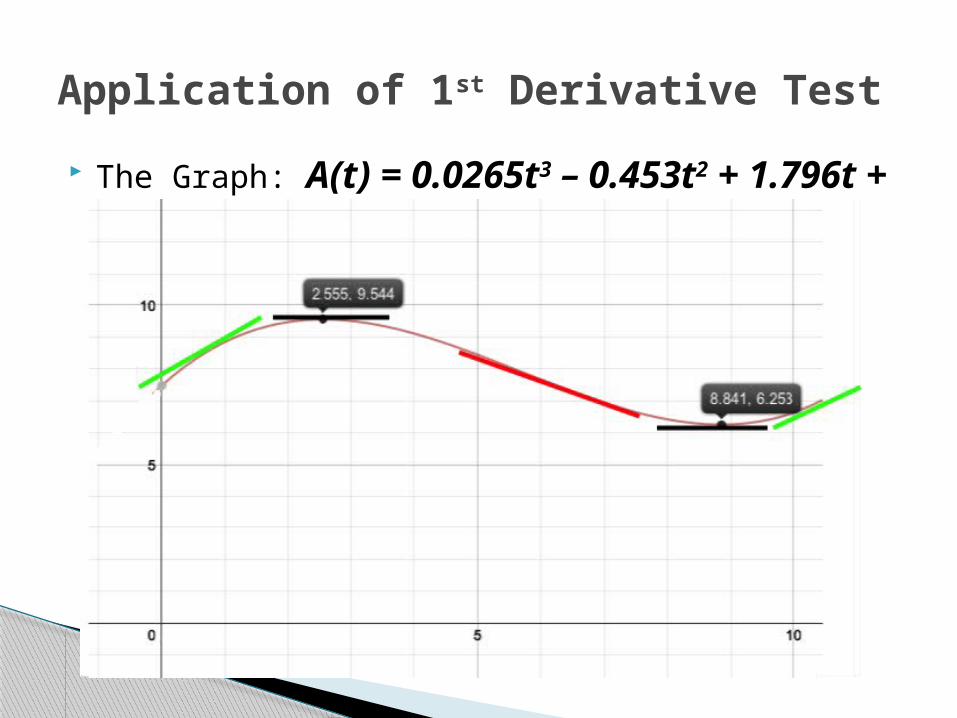
The Graph: A(t) = 0.0265t3 – 0.453t2 + 1.796t + 7.47
Application of 1st Derivative Test
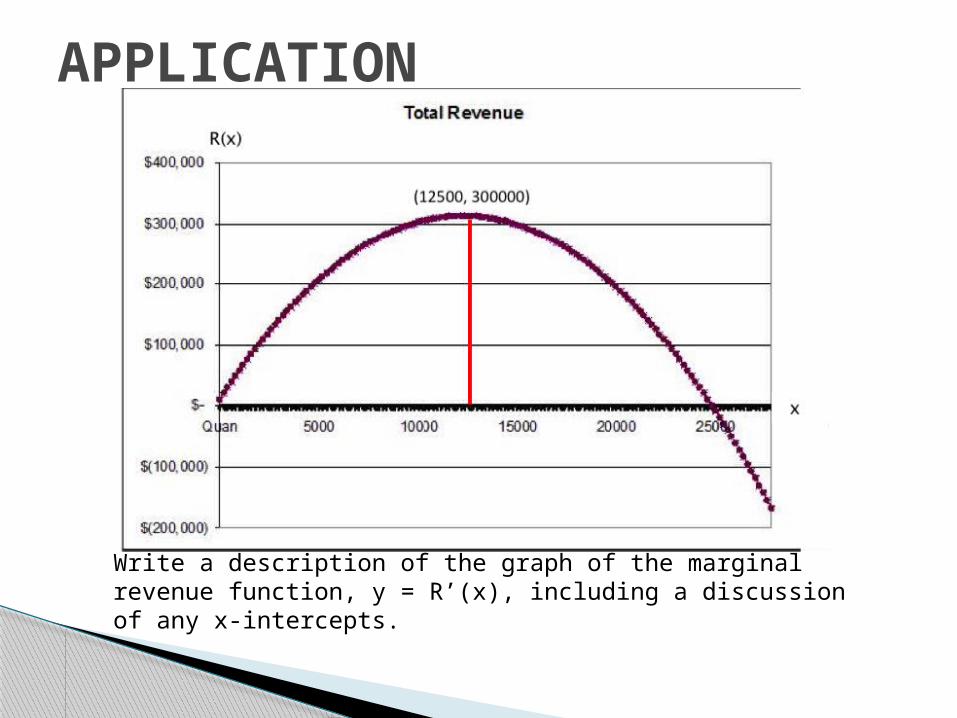
APPLICATION
Write a description of the graph of the marginal revenue function, y = R’(x), including a discussion of any x-intercepts.

APPLICATION
Analyzing the graph, we can see that from (0, 12500) the marginal revenue is positive. At x=12500, the marginal revenue is 0, and on the interval (12500, 25000) the marginal revenue is negative.

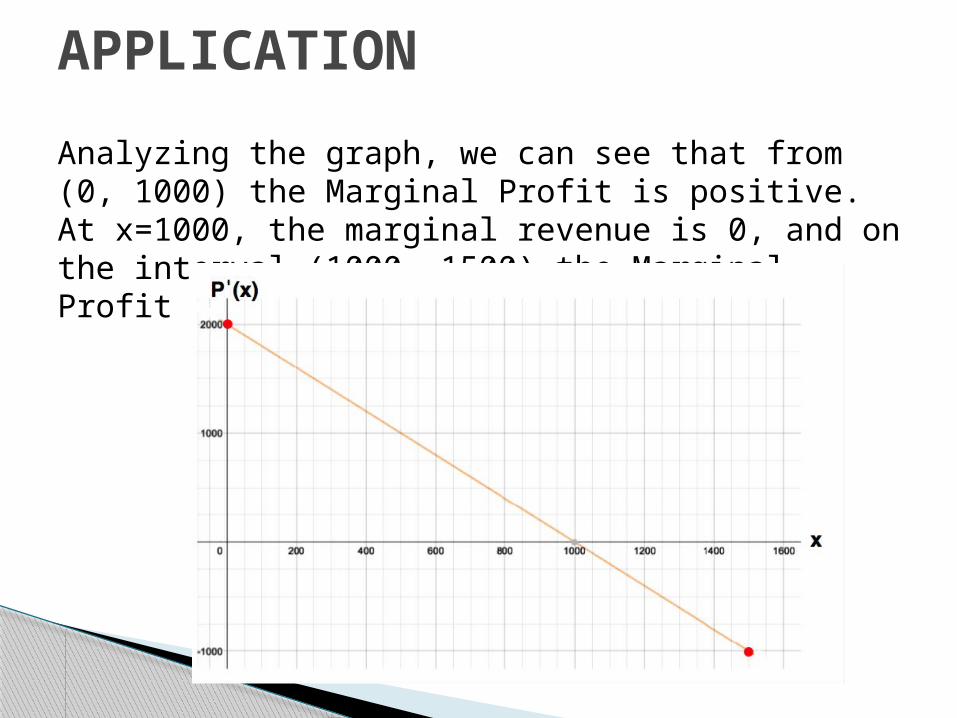
APPLICATION
Write a description of the graph of the marginal profit function, y = P’(x), including a discussion of any x-intercepts.
APPLICATION
Analyzing the graph, we can see that from (0, 1000) the Marginal Profit is positive. At x=1000, the marginal revenue is 0, and on the interval (1000, 1500) the Marginal Profit is negative.

SUMMARY First Derivative Test: determines where a function is increases or
decreases
Critical Values occur where the First Derivative = 0.
Sign charts help to see the change in signs of the First Derivative which allows for locating the local maximum/minimum points.
Local maximum is where f ′(x) changes from positive to negative
Local minimum occurs when f ′(x) changes from negative to positive
If f ′(x) is discontinuous at “c,” then f ′(x) DNE (Does Not Exist)

Second Derivative Test

2nd Derivative Test stated:◦For y = f(x), the second derivative test, if
it exists, is
◦If the 1st Derivative Test determines intervals of increasing/decreasing & critical points; Then the 2nd Derivative Test determines CONCAVITY.
Second Derivatives & Graphs
xfdx
dxf

Understanding: When the 1st Derivative is increasing and
the 2nd Derivative is positive, a graph of f will be concave UP.
However, when the 1st Derivative is decreasing and the 2nd Derivative is negative, a graph of f will be concave Down.
Second Derivatives & Graphs

Like with the 1st Derivative Test, the 2nd Derivative Test has critical points called: Points of inflection
A point of inflection is that point “c” on an open interval (a, b) where f ″(x)= 0 or
f ″(x)= Does Not Exist
Second Derivatives & Graphs

Find the inflection points.

Find the inflection points.
23
2
02023
02230443
4432
2
xorx
xorx
xxxx
xxxf
CRITICAL Points = 23
2or

Find the inflection points.
3
2046
46
443 2
xx
xxf
xxxf
Inflection Point =3
2

Find the inflection points.
f ′(x)=(3x – 2)(x + 2) ++++ 0 --------------- 0 ++++
-5 -2 0 ⅔ 2
f ″(x) = 6x + 4 --------------- 0 +++++++++++++++++++++
-⅔ The graph increases from (-∞, -2) and (2, ∞) and
decreases from (-2, ⅔). The graph is concave Up from (-⅔, ∞) and concave down (-∞, -⅔)

f(x) = x3 + 2x2 – 4x
Critical point x = -2 is a MAXIMUM value
Critical Point x= ⅔ is a local Minimum value
The inflection point x = - ⅔, is where the graph turns from concave Down to concave UP
x = - ⅔

Analyze the graph.On what intervals is this graph concave Up?
On what intervals is this graph concave down?
Where is f ″(x) < 0?
Where is f ″(x) > 0?
Where is f '(x) increasing?
Where is f '(x) decreasing?
Where are the extrema?

Analyze the graph.On what intervals is this graph concave Up? (a, b) (b, c) (d, e)
On what intervals is this graph concave down? (c, d)
Where is f ″(x) < 0? (c, d)
Where is f ″(x) > 0? (a, b) (b, c) (d, e)
Where is f '(x) increasing?(a, b) (d, e)
Where is f '(x) decreasing?(b, c) (c, d)
Where are the extrema? x = b x = d

Second Derivative Test

With FIRST DERIVATIVE TEST: Interval Tables provide information about a function’s intervals of Increase & Decrease
With Second DERIVATIVE TEST: Interval Tables provide information about a function’s CONCAVITY
RECALL
x -3 0 1 2 4 5
f(x) -4 0 2 1 -1 0
++ND +++++0 -------------- 0 ++++++++
0 1 2 4
++ND
--------------0+++++++++++++++++++

In the EXAMPLE below: ◦ the Intervals of increase are (-∞, 0) and (4, ∞)◦ Decrease Interval (1, 4)
◦ The Function is CONCAVED Up on (-∞, 0) & (2, ∞)◦ Concaved down on (-∞, 2)
RECALL
x -3 0 1 2 4 5
f(x) -4 0 2 1 -1 0
++ND +++++0 -------------- 0 ++++++++
0 1 2 4
++ND
--------------0+++++++++++++++++++

The Graph

Derivative Analysis

The Graph

Find the Second Derivative

Find the Second Derivative

Find the Second Derivative

Graphical Analysis

Graphical AnalysisThis graph below is f ’(x).
Create a table based on this graph determine intervals of increase and decrease, any inflection points, intervals of concavity, then graph f(x).

x f ’(x) f(x)-∞ < x < -2 Negative & increasing Decreasing & concave UP
x = -2 Local max Inflection Point
-2 < x < 0 Negative & decreasing Decreasing & concave down
x = 0 Local min Inflection Point
0 < x < 2 Negative & increasing Decreasing & concave UP
x = 2 Local max Inflection Point
-2 < x < ∞ Negative & decreasing Decreasing & concave down
Graphical Analysis
Negative means the value of f ’(x) is negativePositive means the value of f ’(x) is positive.

The Graph


![TOPIC&5&& ZETA&TRANSFORM · RECALL:%ZETATRANSFORM X (z)= X+1 n=1 x[n]zn AAACKHicbVDNSsNAGNz4W ...](https://static.fdocuments.in/doc/165x107/601b113723e4106cc3128baf/topic5-zeta-recallzetatransform-x-z-x1-n1-xnzn-aaackhicbvdnssnagnz4w.jpg)