· PROJECT DESIGN DOCUMENT FORM (CDM PDD) - Version 03.1. CDM – Executive Board page 1 CLEAN...
36
PROJECT DESIGN DOCUMENT FORM (CDM PDD) - Version 03.1. CDM – Executive Board page 1 CLEAN DEVELOPMENT MECHANISM PROJECT DESIGN DOCUMENT FORM (CDM-PDD) Version 03 - in effect as of: 28 July 2006 CONTENTS A. General description of project activity B. Application of a baseline and monitoring methodology C. Duration of the project activity / crediting period D. Environmental impacts E. Stakeholders’ comments Annexes Annex 1: Contact information on participants in the project activity Annex 2: Information regarding public funding Annex 3: Baseline information Annex 4: Monitoring plan
Transcript of · PROJECT DESIGN DOCUMENT FORM (CDM PDD) - Version 03.1. CDM – Executive Board page 1 CLEAN...

PROJECT DESIGN DOCUMENT FORM (CDM PDD) - Version 03.1. CDM – Executive Board page 1
CLEAN DEVELOPMENT MECHANISM PROJECT DESIGN DOCUMENT FORM (CDM-PDD)
Version 03 - in effect as of: 28 July 2006 CONTENTS A. General description of project activity B. Application of a baseline and monitoring methodology C. Duration of the project activity / crediting period D. Environmental impacts E. Stakeholders’ comments Annexes Annex 1: Contact information on participants in the project activity Annex 2: Information regarding public funding Annex 3: Baseline information
Annex 4: Monitoring plan

PROJECT DESIGN DOCUMENT FORM (CDM PDD) - Version 03.1. CDM – Executive Board page 2 SECTION A. General description of project activity A.1 Title of the project activity: Lahendong II-20 MW Geothermal Project (“the project”) Version: 11 Date: 1 July 2007 A.2. Description of the project activity: This project entails the development of the 20 MW Lahendong II geothermal power plant, using Indonesia’s extensive geothermal resources. The plant will supply 158 GWh per annum of electricity to Indonesia’s northern parts of Sulawasi, one of Indonesia’s larger volcanic islands. The project will result in the avoidance of approximately 59,026 tCO2e per annum. The project is owned by PLN (Perusahaan Listrik Negara), the State Electricity Company. The Asia Development Bank has provided a $17.5 million loan to the project. Indonesia has an estimated 27 GW of geothermal potential. However, only about 3% or about 780 MW is being used for power generation due to significant barriers to development. The power generated by Lahendong II, will be connected to the Minahasa Grid. Note: PLN calls the “Grid” a “System”. This will assist to meet the electricity demand in North Sulawesi PLN region. The Minahasa Grid consists of an interconnection system of transmission lines of 70 kV and 150 kV which currently covers Minahasa Sector and Kotamobago Branch as they are called by PLN. Annex 3 provides a map and detailed explanation of the Minahasa Grid including Minahasa Sector and Kotamobogo Branch. Currently, the grid mix is composed of diesel power plants fuelled by High Speed Diesel (HSD) and hydro and geothermal power plants. The total installed capacity of the Minahasa Grid is 186 MW. The project will support the implementation of Indonesia’s National Sustainable Development Objectives for CDM projects. The applicability criteria are, for brevity sake, summarised below. Further, in keeping with Decree of Environmental Minister No. 17, 2001, Environmental Management and Monitoring Measures (UKL-UPL) were produced for the project and approved by Government. Detailed technical aspects of UKL-UPL were according to the UKL-UPL (Forward section) guided by decree of Power and Energy Development General Director No 78. 12/008/600.2/1195, 6 October 1995. The conformity of the project to the relevant National Sustainable Development objectives and indicators is set out below: Environment: The scope of evaluation is the area having direct ecological impacts from the project. Criteria: Environmental sustainability by practicing natural resource conservation or diversification. The project will assist diversify use of energy resources towards renewable energy. It will reduce the consumption of diesel and coal (fossil fuels). The emission of particulate matter will be avoided through

PROJECT DESIGN DOCUMENT FORM (CDM PDD) - Version 03.1. CDM – Executive Board page 3 the use of geothermal power instead of the use of diesel or coal based power generation. This will have local beneficial health impacts. UKL-UPL indicates that the project will not have any significant environmental impact on local ecosystems. The technology is proven to be safe and sound. The project does not alter the overall land use pattern of the area.
Criteria: Local community health and safety. Geothermal development is a safe technology, resulting in reduced emissions of particulates compared to coal or diesel. Emission monitoring will take place to ensure compliance to national standards. The plant will be managed in compliance with all relevant laws of Indonesia.
Economy: The scope of evaluation is the administrative border of the regency. If the impacts are cross boundary, the scope of evaluation includes all impacted regencies. Criteria: Local community welfare. The project will not have any negative impact on the economy. Through meeting the demand for electricity in the economy, economic growth will be supported. Foreign exchange reserves will be saved through reducing reliance on imported oil. Social: The scope of evaluation is the administrative border of the regency. If the impacts are cross boundary, the scope of evaluation includes all impacted regencies. Criteria: Local community participation in the project. Stakeholder consultations about the project took place during planning stages in October 2003. Raised issues were answered and addressed. The project will, by supporting economic growth, enhance job thereby reducing poverty. The project will support electrification thereby enhancing the quality of life of inhabitants in northern Sulawesi. Criteria: Local community social integrity. The project does not trigger land or resource access issues. The UKL-UPL recommended the need to ensure fair selection of workers for the project so that community tensions would not arise (UKL-UPL, pg iv-1). The UKL-UPL is accepted by PLN. Technology:
The scope of evaluation is the national border. Criteria: Technology transfer. The project will make use of the proven and reliable single flash cycle system for geothermal power which PLN is familiar with. The project relies on renewable energy and the reliability of the steam reservoir has been tested for the lifetime of the project.
A.3. Project participants: >>

PROJECT DESIGN DOCUMENT FORM (CDM PDD) - Version 03.1. CDM – Executive Board page 4
Name of Party involved ((host) indicates a host Party
Private and/or public entity(ies) project participants(as applicable)
Kindly indicate if the Party involved wishes to be considered as project participant (Yes/No)
Republic of Indonesia (host) Perusahaan Listrik Negara (PLN) No
Netherlands
International Bank for Reconstruction and Development (IBRD) acting as the Trustee of the Netherlands Carbon Facility
Yes
The Official Contact Person for the Clean Development Mechanism (“CDM”) project activity will be: Joelle Chassard Carbon Fund Manager The Netherlands Carbon Facility The World Bank Washington DC. USA. Contact information is listed in Annex 1.

PROJECT DESIGN DOCUMENT FORM (CDM PDD) - Version 03.1. CDM – Executive Board page 5 A.4. Technical description of the project activity: A.4.1. Location of the project activity: A.4.1.1. Host Party(ies): Republic of Indonesia A.4.1.2. Region/State/Province etc.: Sulawesi Utara (North Sulawesi) A.4.1.3. City/Town/Community etc: Tomohon City, Sub-District Tomohon Selatan. A.4.1.4. Detail of physical location, including information allowing the unique identification of this project activity (maximum one page): The project is located approximately 30 km south of Manado at an altitude of roughly 860 m above sea level. It is 3 km north-north east of Lahendong I geothermal power plant, nearby the currently unused Lahendong I Binary Plant. The area is surrounded by gently sloping hills. See Figure1 for the location of the project.
Figure 1. Location of Lahendong II Project

PROJECT DESIGN DOCUMENT FORM (CDM PDD) - Version 03.1. CDM – Executive Board page 6 A.4.2. Category(ies) of project activity: The project falls into: Sectoral Scope Number: 1 Sectoral Scope: Renewable Energy Project Activity: “Renewable electricity generation for a grid (geothermal)” A.4.3. Technology to be employed by the project activity: The geothermal steam for the Lahendong II project will be released through drilling production wells into the steam reservoir in the earths crust. The high pressure dry saturated steam, will then be collected and sent to scrubbers to be cleaned of all contaminants before it is passed on to the turbine to generate electricity. 150 KV transmission lines will carry the electricity. Exhaust steam from the turbine will be condensed in a direct contact condenser. Cooling towers will provide cooled water to the condenser. The water for the cooling towers will be in closed system and will be drawn from adjacent Lake Pangolombian. Condensed steam and periodic cooling tower waste water will be re-injected into the geothermal reservoir through a specially-constructed re-injection well. Non-condensed gases will be cleaned, ejected and dispersed by the cooling tower. The schematic diagram of the Lahendong II power plant is provided below. Two geothermal plant technology choices were considered: The single flash cycle system and the binary cycle system. The single flash cycle system was selected for four main reasons. Firstly, the geothermal steam survey indicated sufficiently high pressure steam. Secondly, the single flash system produces a larger power output. Thirdly, a binary cycle plant has higher maintenance requirements associated with the heat exchanger system. Fourthly, PLN is familiar with the technology.
Figure 2. Schematic Diagram of Proposed Lahendong II Project Geothermal Power Plant and Steam Reservoir
Turbines Electric
Generator
Condenser Steam
Production Well Injection Well

PROJECT DESIGN DOCUMENT FORM (CDM PDD) - Version 03.1. CDM – Executive Board page 7
A.4.4 Estimated amount of emission reductions over the chosen crediting period: Once implemented, the project is expected to yield annual emission reductions (ERs) of 59,026 tCO2e per annum and a total of 413,184 tCO2e for the duration of the initial 7-year renewable crediting period. The project estimated annual ERs, over the first 7-year crediting period, are as follows: Years Annual Estimation of Emission Reductions
In tonnes of CO2 e Year 2007 28453 Year 2008 63733 Year 2009 62179 Year 2010 53629 Year 2011 68397 Year 2012 68397 Year 2013 68397 Total estimated reductions (tonnes of CO2 e)
413,184
Total number of crediting years 7years Annual average over the crediting period of estimated reductions (tonnes of CO2 e)
59,026
A.4.5. Public funding of the project activity: The project is financed through a loan from the Asia Development Bank (ADB). This does not constitute a diversion of ODA money to CDM projects.

PROJECT DESIGN DOCUMENT FORM (CDM PDD) - Version 03.1. CDM – Executive Board page 8 SECTION B. Application of a baseline and monitoring methodology B.1. Title and reference of the approved baseline and monitoring methodology applied to the project activity: Version 06 of ACM0002: Approved consolidated baseline methodology for grid-connected electricity generation from renewable sources, May 19, 2006 (“the methodology”) and Tool for Demonstration of Additionality, version 3 The methodology will be used in conjunction with the approved monitoring methodology ACM0002-Version 6 (“the monitoring methodology”). B.2 Justification of the choice of the methodology and why it is applicable to the project activity: The project complies with the Applicability Criteria of ACM0002, as follows: • The project includes capacity addition from geothermal sources. • The project does not involve switching from fossil fuels to renewable energy at the site of the project
activity. • The geographic and system boundaries for the relevant electricity grid can be clearly identified for
Lahendong II and the information on grid characteristics is also available. B.3. Description of the sources and gases included in the project boundary Project Boundary Lahendong II project is located in the north of the Sulawesi Island. Annex 3 provides a detailed map and description of the Minahasa Grid using PLN names and terminology. The Minahasa Grid consists of an interconnection grid of transmission lines of 70 kV and 150 kV which currently covers Minahasa Sector and Kotamobago Branch as they are called by PLN. Currently, the grid mix is composed of diesel power plants fuelled by High Speed Diesel (HSD), hydro and geothermal power plants. The total installed capacity of the Minahasa Grid is 186 MW. In keeping with ACM 0002, the baseline emission factor is estimated based on the fuel composition of Minahasa Grid and does not include any non grid connected power plants.
Source Gas Included? Justification/Explanation CO2 Yes Included as per ACM0002
methodology CH4 No Excluded as per ACM0002.
This is conservative Baseline Operating and Build Margin of Minahasa Grid (diesel )
N2O No Excluded as per ACM0002. This is conservative

PROJECT DESIGN DOCUMENT FORM (CDM PDD) - Version 03.1. CDM – Executive Board page 9
CO2 Yes Included as per ACM0002 methodology
CH4 Yes Included as per ACM0002 methodology
Project Activity
Fugitive emissions from Non Condensable Gas (NCG)
N2O No Excluded as per ACM0002 This is conservative
B.4. Description of how the baseline scenario is identified and description of the identified baseline scenario: The project baseline is, as permitted by ACM0002, fixed ex-ante as grid connected electricity that would otherwise have been generated, calculated on the combined margin approach (CM). The CM, consists of the weighted average of the operating margin emission factor calculated with dispatch data (OM) and the build margin emission factor (BM), weights being default values 50% and 50%, respectively All margins are expressed in tCO2/MWh. The project boundary is the Minahasa Grid. The Minahasa Grid is a discrete grid not linked to other grids. Project emissions comprise of fugitive emissions in the form of carbon dioxide and possibly methane which are non-condensable gases in the geothermal steam. The margins calculations are provided under Section B.6.3 and a summary of the emission reductions under Section B.6.4. The estimated ERs per year for the first crediting period average 59,026t CO2/yr1 which is equal to 413,184 tCO2e over a 7 year crediting period. 2 B.5. Description of how the anthropogenic emissions of GHG by sources are reduced below those that would have occurred in the absence of the registered CDM project activity (assessment and demonstration of additionality): A project is considered additional if it passes the demonstration of additionality by applying the tool for the demonstration and assessment of additionality, version 03. This is described as follows: The following steps from the “Tool for the demonstration and assessment of additionality” - Version 3 - will be completed in this section: Step 1: Identification of alternatives to the project activity consistent with current laws and regulations. Step 2: Investment analysis. Step 3: Barriers analysis. Step 4: Common practice analysis. STEP 1. Identification of alternatives to the project activity consistent with current laws and regulations. 1 All margins were rounded to the fifth decimal, but the CERs per year were rounded down to the nearest integer. 2 All margins estimations can be seen in B.6.3

PROJECT DESIGN DOCUMENT FORM (CDM PDD) - Version 03.1. CDM – Executive Board page 10 The following alternatives to the project activity are identified:
1) Continuation of the current situation where no further power would be added to the Minahasa Grid.
2) Build a gas-fired power plant of similar or larger capacity to be connected to the grid 3) Build an oil/diesel-fired power plant of similar or larger capacity 4) Build a coal-fired steam power plant of similar or larger capacity 5) The proposed activity is not undertaken as a CDM project activity
Alternative 1 and alternative 2 are not realistic and credible alternatives to the project activity for the following reasons: Alternative 1: Continuation of the current situation where no further power would be added to the
Minahasa Grid.
The National Electricity Planning Report, 2006, issued by the Directorate General of Energy and Electricity Utilization provides the following information which demonstrates why no further development of additional power supplies, is not plausible:
• The national demand for electricity is forecast to increase at 6,2% per annum for the next 20 years3. As a result, Indonesia has created a 10,000 MW crash power supply program to be implemented by 2010.
• The household electrification level for the, Minahasa Grid is low. It is expected to increase from
49% in 2005 to 57% in 2010 and to 68% by 2015. Alternative 2): Build a gas-fired power plant of similar or larger capacity to be connected to the grid. Although natural gas is available in abundance in Indonesia, the infrastructure to transmit and distribute natural gas is limited. Currently, gas transmission and distribution systems are being constructed in a part of Sumatra and Java Island. However, there is neither gas pipeline in Sulawesi Province nor any plans to construct one. Thus, the realistic and credible alternatives available are: 1) Build a diesel-fired power plant of similar or larger capacity to be connected to the Minahasa Grid 2) Build a coal-fired power plant of similar or larger capacity to be connected to Minahasa Grid 3) The proposed project activity is not undertaken as a CDM project None of these alternatives are contradictory with the applicable Indonesian laws and regulations since there are no laws and regulations which prohibits use of diesel, coal, or renewable resources for energy generation. The main prevailing law related to electricity in Indonesia is The Law of The Republic of Indonesia Number 15/1985 where it is stated that PLN holds the mandate for electricity provision in the country, including areas where there is increasing demand. Alternatives 1, 2 and 3 are options for PLN to comply with this law and to meet the increasing electricity demand in north Sulawesi area. STEP 2: Investment Analysis
3 Rencana Umum Ketenagalistrikan Nasional 2006

PROJECT DESIGN DOCUMENT FORM (CDM PDD) - Version 03.1. CDM – Executive Board page 11 The tool for the demonstration and assessment of additionality gives an option to proceed either with step 2 or directly with step 3. This project selects the barrier analysis (step 3) instead of investment analysis (step 2). STEP 3: Barrier analysis Sub-Step 3.a. Identify barriers that would prevent the implementation of type of the proposed project activities The following barriers that would prevent the implementation of Lahendong II are identified and explained as follows:
a) Investment barriers As described in section A 2, Indonesia has abundant potential geothermal resources of about 27 GW but only about 3% has been utilized. Since the early 1970s, the Government of Indonesia has made efforts to promote geothermal resources. It has done this through the appointment of Pertamina, the National Energy Company to conduct exploration, exploitation, and utilization of steam from geothermal resources to produce energy. This was regulated based on the Presidential Decree No.16/1974, Presidential Decree No.22/1981, Presidential Decree No.23/1981, Presidential Decree No. 45 in 1991 and Presidential Decree No.49/1991. Legal uncertainty hampers investment in the sector: In the early to mid-1990s, private sector contracts committed to provide close to half of the national target of geothermal power. These contracts were made by entering into Joint Operation Contracts (JOCs) with state oil and gas firm Pertamina and Energy Sales Contracts (ESCs) with state power firm PLN. However, the 1997 Financial Crisis caused a number of contracts to be suspended, cancelled or renegotiated.
Since the Financial Crisis, private developers and lenders have hesitated to invest in geothermal business due to a lack of trust in the existing legal framework in protecting business arrangements and contracts and uncertainty on taxation regulations. The law No. 44 of 1960 on Oil and Gas used to regulate the geothermal sector but the new Oil and Gas Law, passed on October 23, 2001, removed geothermal development as an area of oil and gas regulation. In 2003, Parliament passed a Geothermal Law. However, the Law has not been supplemented with national regulations which are needed to provide certainty, on amongst other things, the treatment of taxes. For this reason and others, even though PLN is required by law to purchase power from independent power producers, only 2 out of 10 power purchase agreements have been implemented so far. This has brought further difficulties to PLN in meeting its power supply targets.
Pricing distortions also hamper investment in the sector. Firstly, PLN has according to its long term plan costed out the production of coal based power at US 4,5 c per KWh. In contrast geothermal power costs in the order of 7 c per KWh upwards. PLN is unable to recover the additional cost of power production from the consumer as electricity tariffs are set by Government. Because Government keeps the cost of electricity tariffs below the cost of production, it provides an annual grant/t subsidy to PLN. However, even with this subsidy, PLN still lacks the financial resources to meet electricity demands. Therefore, it is hesitant to invest in power production which is more costly than its least cost plan.
b) Technological Barrier

PROJECT DESIGN DOCUMENT FORM (CDM PDD) - Version 03.1. CDM – Executive Board page 12
The primary technological barrier lies in the risk of finding and maintaining a viable steam reservoir. The capital cost of developing geothermal resources is much higher compared to conventional fossil power systems, such as coal and oil. Costly exploration activities consisting of a series of extensive drilling and well testing is required to understand the geological conditions associated with the hydro-thermal system. During the operation phase of a geothermal power plant, uncertainty regarding the available steam still remains and the projection of steam availability has to be continuously monitored and tested. The capital cost for a typical geothermal power project is about US$ 1,600-US$2,400 per mw while that of conventional power plant may cost less than US$ 1,000/MW4. Currently, PLN uses US 4,5c per KW as broad indicator of its interest in any new power plant.
c) Barriers due to prevailing practices and abundance of fossil fuel reserves in Indonesia Historically, Indonesia has depended greatly on fossil fuel, particularly on oil and diesel, for power generation. Recently, the country has become a net oil importer. The focus on new energy resources is switching to coal due to the abundance of coal in Indonesia5. In 2006, The Government of Indonesia (GOI) issued a guideline to guarantee coal fired power projects6 under the GOI “Crash Program” to develop 10,000 MW of additional power generation capacity by 2010. Thus, the national preference for coal as the primary energy resource is obvious. This impedes the development of renewable energy sources, including geothermal. The pricing approach which shows coal to be the least cost power option supports this position.
Sub-Step 3.b. Show that the identified barriers would not prevent the implementation of at least one of the alternatives (except the proposed project activity).
Barriers Alternatives Investment Technology Prevailing practice
1) Build a diesel -fired power plant of similar or larger capacity to be connected to Minahasa Grid
There is no significant barrier to this type of investment since it has already been implemented without any difficulties Level of Barrier: Low
This technology is the prevailing practice in Indonesia. 20 MW plant is quite feasible. Level of Barrier: Low
Indonesia is currently a net oil importer. Government would prefer to reduce oil consumption. However, it would still take time to phase out dependency on oil. Level of Barrier: medium
2) Build a coal-fired power plant of similar or larger capacity to be connected to the Minahasa Grid
This type of investment has been performed without any difficulties Level of Barrier: Low
This technology is the prevailing practice in Indonesia. Level of Barrier: Medium
There is no barrier in prevailing practice due to the national preference for coal. Level of Barrier: Low
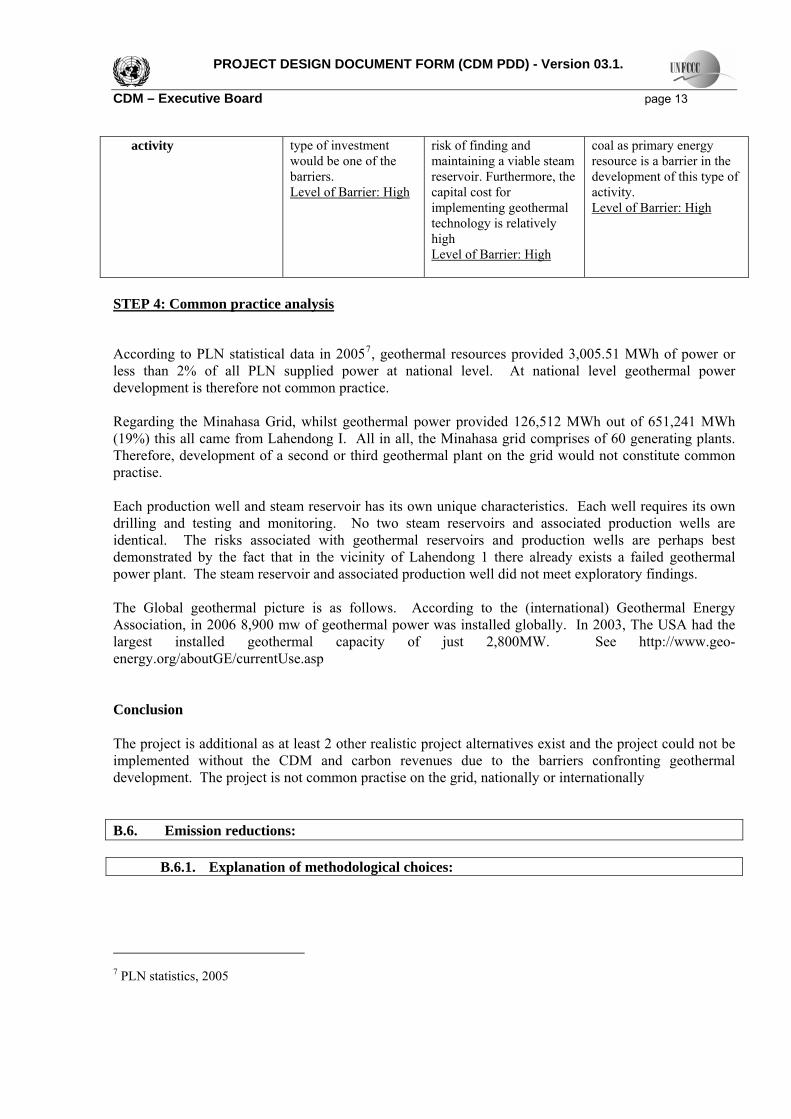
3) The proposed project The high cost of this The primary barrier is the The national preference for 4 Sugiharto, et.al, 2000. The Roles of Indonesian Geothermal Association (INAGA) in the Implementation of Power Restructuring in Indonesia. Proceedings, World Geothermal Congress 2000, Kyushu-Tohoku, Japan May 28-June 10, 2000. 5 Indonesia is the 7th largest coal producer globally (Coal Fact, 2006 Edition, World Coal Institute).
6 Regulation No. 146/PMK.01/2006
PROJECT DESIGN DOCUMENT FORM (CDM PDD) - Version 03.1. CDM – Executive Board page 13
activity type of investment would be one of the barriers. Level of Barrier: High
risk of finding and maintaining a viable steam reservoir. Furthermore, the capital cost for implementing geothermal technology is relatively high Level of Barrier: High
coal as primary energy resource is a barrier in the development of this type of activity. Level of Barrier: High
STEP 4: Common practice analysis
According to PLN statistical data in 20057, geothermal resources provided 3,005.51 MWh of power or less than 2% of all PLN supplied power at national level. At national level geothermal power development is therefore not common practice. Regarding the Minahasa Grid, whilst geothermal power provided 126,512 MWh out of 651,241 MWh (19%) this all came from Lahendong I. All in all, the Minahasa grid comprises of 60 generating plants. Therefore, development of a second or third geothermal plant on the grid would not constitute common practise. Each production well and steam reservoir has its own unique characteristics. Each well requires its own drilling and testing and monitoring. No two steam reservoirs and associated production wells are identical. The risks associated with geothermal reservoirs and production wells are perhaps best demonstrated by the fact that in the vicinity of Lahendong 1 there already exists a failed geothermal power plant. The steam reservoir and associated production well did not meet exploratory findings. The Global geothermal picture is as follows. According to the (international) Geothermal Energy Association, in 2006 8,900 mw of geothermal power was installed globally. In 2003, The USA had the largest installed geothermal capacity of just 2,800MW. See http://www.geo-energy.org/aboutGE/currentUse.asp Conclusion The project is additional as at least 2 other realistic project alternatives exist and the project could not be implemented without the CDM and carbon revenues due to the barriers confronting geothermal development. The project is not common practise on the grid, nationally or internationally B.6. Emission reductions:
B.6.1. Explanation of methodological choices:
7 PLN statistics, 2005

PROJECT DESIGN DOCUMENT FORM (CDM PDD) - Version 03.1. CDM – Executive Board page 14 The estimation of emission reduction follows ACM0002, version 6, the consolidated baseline methodology for grid-connected electricity generation from renewable sources. The emissions reduction will be calculated based on an ex-ante baseline. The baseline emission factor (EFy) is calculated as a combined margin (CM), consisting of the combination of operating margin (OM) and build margin (BM) factors according to the following three steps. Calculations for this combined margin must be based on data from an official source (where available) and made publicly available. As per UNFCCC Guidance Note 6.2, for completing PDDs, the detailed calculations for the three margins are detailed in Section B.6.3, below.
B.6.2. Data and parameters that are available at validation:
Data / Parameter: CO2 emission factor of the Minahasa Grid Data unit: tCO2/MWh Description: CO2 emission factor from the Minahasa Grid Source of data used: Calculated based on the statistics data from PLN Value applied: 0.517 Justification of the choice of data or description of measurement methods and procedures actually applied :
This is estimated ex-ante and is based on PLN data
Any comment: Calculated as a weighted sum of the OM and BM emission
Data / Parameter: CO2 Operating Margin emission factor of the Minahasa Grid Data unit: tCO2/MWh Description: Emission factor that is calculated as indicated in the relevant OM baseline
method Source of data used: Calculated based on the statistics data from PLN Value applied: 0.321 Justification of the choice of data or description of measurement methods and procedures actually applied :
This is estimated ex-ante and is based on PLN data
Any comment: Calculated as indicated in the relevant OM baseline method
Data / Parameter: CO2 Build Margin emission factor of the Minahasa Grid Data unit: tCO2/MWh Description: Emission factor that is calculated over recently built power plants defined in the
baseline methodology Source of data used: Calculated based on the statistics data from PLN Value applied: 0.712

PROJECT DESIGN DOCUMENT FORM (CDM PDD) - Version 03.1. CDM – Executive Board page 15 Justification of the choice of data or description of measurement methods and procedures actually applied :
This is estimated ex-ante and is based on PLN data
Any comment: Calculated as [Σi Fi,y*COEFi] / [Σm GENm,y] over recently built power plants defined in the baseline methodology
Data / Parameter: Amount of fossil fuel consumed per annum by Minahasa Grid Data unit: Mass or Volume Description: Quantity of fossil fuel consumed by each power plant Source of data used: Statistic data from PLN Value applied:
Residuel fuel Marine (MFO)
High Speed Diesel (HSD) Natural Gas
Year Kilo litre
TJ
Tonnes of fuel
Kilo Litre
TJ
Tonnes of fuel
MMBTU TJ
Tonnes of fuel
2005 0 0 0 81717.04 2967.91 0 0 0 2004 0 0 0 61569.57 2236.167 0 0 0 2003 0 0 0 75838.73 2754.413 0 0 0
Justification of the choice of data or description of measurement methods and procedures actually applied :
This data is taken from publicly available data and not by direct measurement
Any comment: Obtained from latest statistics from PLN, 2203-2005
Data / Parameter: CO2 emission coefficient of diesel Data unit: tCO2e/GJ diesel Description: The coefficient for CO2 emissions for combustion of High Speed Diesel in
Indonesia power stations Source of data used: IPCC default value Value applied: 74 Tonnes of CO2/TJ Justification of the choice of data or description of measurement methods and procedures actually applied :
Considering that there is no actual measurement of emission factor, the default value of IPCC guideline 2006 is used.
Any comment: In the absence of actual data, IPCC values are used
Data / Parameter: Electricity generation of each power source/plant Data unit: MWh/year Description: Electricity generation from each power source/plant of low cost must run power
plant

PROJECT DESIGN DOCUMENT FORM (CDM PDD) - Version 03.1. CDM – Executive Board page 16 Source of data used: Statistic data from PLN Value applied: Total Generation Capacity (2003-2005), incl. Must-Run
Parameter Unit 2005 2004 2003
Hydro MWh 221,942.75 234,108.47 153,279.58
Thermal (Diesel) MWh 302,746.69 229,019.12 274,954.12
Geothermal MWh 126,551.89 147,905.58 145,008.60
Total Power Generated MWh 651,241.33 611,033.17 573,242.30
Justification of the choice of data or description of measurement methods and procedures actually applied :
The low-cost/must run in which contributes to Minahasa grid comprises of Hydro, Geothermal and Diesel Power plant.
Any comment: Obtained from the latest statistics from PLN
Data / Parameter: Power source/plant for the OM Data unit: Text Description: Plants used to calculate Operating Margin emission factors Source of data used: Value applied: No Power Plant Fuel Type No Power Plant Fuel Type
Minahasa Sector Kotamobago Branch 1 Tonsea Lama Hydro 9 Kotamobagu Diesel 2 Tanggari I Hydro 10 Poigar Hydro 3 Tanggari II Hydro 11 Genset Sewa Diesel 4 Bitung Diesel 12 Inobonto Diesel 5 Manado Diesel 13 Bintauna Diesel 6 Lahendong Geothermal 14 Molibagu Diesel 7 Genset Sewa Diesel 8 Lopana Diesel
Justification of the choice of data or description of measurement methods and procedures actually applied :
The data is based on power generation mix of Minahasa grid (interconnection transmission line of 70 KV and 150 KV consisting of Minahasa Sector and Kotamobago Branch. This data is taken from publicly available data and not by direct measurement
Any comment:
Data / Parameter: Identification of power source/plant for the BM Data unit: Text Description: Plants used to calculate Build Margin emission factors Source of data used:

PROJECT DESIGN DOCUMENT FORM (CDM PDD) - Version 03.1. CDM – Executive Board page 17 Value Applied
Power plants
Type of Fuel
Installed capacity
(kW)
Year of Commission (by
date)
-- -- --
1 PLTD Kotamobagu Diesel 1,000 2005 2 PLTD Bintauna Diesel 1,000 2004
3 PLTD LOPANA Diesel
5,420 2003 4 PLTD LOPANA Diesel 5,420 2003 5 PLTD Kotamobagu Diesel 1,000 2003 6 PLTD Kotamobagu Diesel 1,000 2003 7 PLTD Bintauna Diesel 250 2003 8 PLTD Bintauna Diesel 700 2003 9 PLTD Molibagu Diesel 700 2003
10 PLTD Sewa/rented Diesel 5,000 2002 11 PLTD Inobonto Diesel 1000 2002 12 PLTD Sewa/rented Diesel 5,000 2002 13 PLTD Molibagu Diesel 500 2002 14 PLTD Sewa/rented Diesel 10,000 2001
Justification of the choice of data or description of measurement methods and procedures actually applied
This data is taken from publicly available data and not by direct measurement
Any comment:
Data / Parameter: Quantity of steam generated Data unit: t Description: The amount of steam that is discharged from the geothermal wells during well
testing Source of data used: PLN Value applied: 2,557,920 t of steam per year Justification of the choice of data or description of measurement methods and procedures actually applied :
This is the data available to estimate the projection of power generation. The actual measurement of steam should be conducted on a continuous basis and should be based on international standard. The measurement results should be summarised transparently in regular production reports.
Any comment: This is the amount of steam which was measured to estimate the projection of steam during operation
Data / Parameter: CO2 project emissions in steam

PROJECT DESIGN DOCUMENT FORM (CDM PDD) - Version 03.1. CDM – Executive Board page 18 Data unit: tCO2/t steam Description: CO2 Non-condensable gases (NCGs) emissions from the wells Source of data used: PLN Value applied: 93% of Non Condensable Gas by mass which is equal to 0.00267 t of CO2/t of
steam Justification of the choice of data or description of measurement methods and procedures actually applied :
Value measured in the existing wells with laboratory screening for exact gas composition
Any comment: NCG sampling is carried out in production wells.
B.6.3 Ex-ante calculation of emission reductions:
The ex-ante emission reductions are calculated as per ACM0002 according to the following steps STEP 1. Calculate the Operating Margin emission factor ex ante The Operating Margin emission factor is calculated ex-ante based on one of the following four 4 methods: (a) Simple OM, or (b) Simple adjusted OM, or (c) Dispatch data analysis OM, or (d) Average OM. Average OM is selected among the four methods above for the following reasons:
1. There is not a half hourly MWh data sheet for individual power plant at PLN Statistics data. 2. The data for the Dispatch Data Analysis Emission Factor is not available to public. 3. In addition it is also difficult to determine λ in simple adjusted OM because of difficulty in
determining total annual generation from low-cost must-run resources. 4. Total annual electricity generation from the low cost must run resources which includes hydro
and geothermal constitutes more than 50% of the total grid generation in Minahasa Grid. 5. The low-cost/must run resources (hydro and geothermal power plants) in average of the five most
recent years is 56.9% (more than 50%) of the total Minahasa system generation.
Table 1. Electricity Generation of Power Plants for Minahasa Grid (MWh)
U N I T TAHUN (Year)

PROJECT DESIGN DOCUMENT FORM (CDM PDD) - Version 03.1. CDM – Executive Board page 19
2001 2002 2003 2004 2005 2001-2005 average 2001-2005
Share of low cost/must run based on the average 5 years
Minahasa Grid - PLTD – Diesel 190,409 258,791 274,954 229,019 302,747 1,255,920 251184.05 43.10% - PLTA - Hydro (low cost/must run) 267,137 170,174 153,280 234,108 221,943 1,046,642 209328.33 35.92% - PLTP - Geothermal (low cost/must run)
68,953 122,827 145,009 147,906 126,552 611,246 122249.15 20.98% Total Minahasa Grid 526,499 551,792 573,242 611,033 651,241 582,762 Total low cost must run 336,090 293,001 298,288 382,014 348,495 56.9% Total gemeration /low cost-must run generation 64% 53% 52% 63% 54%
The Average OM emission factor is calculated using the full generation-weighted average data for the most recent 3 years (2003-2005) at the time of PDD submission. The Average OM emission factor (EFOM,average,y) is calculated as the generation-weighted average emissions per electricity unit (tCO2/MWh) of all generating sources serving the Grid, including low-operating cost and must-run power plants:
∑∑ •
=
jyj
jijiyji
yaverageOM GEN
COEFFEF
,
,,,,
,, (Formula 1)
Where
Fi ,j, y
is the amount of fuel i (in a mass or volume unit) consumed by relevant power sources j in years y (2003-2005), j refers to the power sources delivering electricity to the grid (Minahasa Grid), including low-operating cost and must run power plants, COEF
i,j y is the CO2 emission
coefficient of fuel i (tCO2 / mass or volume unit of the fuel), taking into account the carbon content of the fuels used by relevant power sources j and the percent oxidation of the fuel in year(s) y, and GEN
j,y is the electricity (MWh) delivered to the grid by source j. Description on
fuel type and carbon emission factor is given in 2.
Table 2. Fuel Specification
Fuel Type Density Net Calorific Carbon
Emission Oxidation Value Factor Factor

PROJECT DESIGN DOCUMENT FORM (CDM PDD) - Version 03.1. CDM – Executive Board page 20
(kg/kl) (kJ/kg) (tC/TJ) Data source Pertamina Pertamina IPCC 2006 IPCC 2006
HSD 850 42,728.64 20.20 1
HSD:high speed diesel
The CO2 emission coefficient COEFi is obtained as: COEFi = NCVi ⋅ EFCO2,i ⋅ OXIDi (Formula 2) where:
NCVi is the net calorific value (energy content) per mass or volume unit of a fuel i, OXIDi is the oxidation factor of the fuel (see page 1.29 in the 1996 Revised IPCC Guidelines for default values), EFCO2,i is the CO2 emission factor per unit of energy of the fuel i. Where available, local values of NCVi and EFCO2,i should be used. If no such values are available, country-specific values (see e.g. IPCC Good Practice Guidance) are preferable to IPCC world-wide default values.
The ex-ante operating margins for the Minahasa Grid from 2003 until 2005 are provided in Tables 3-5, below.
Table 3. 2003 Operating Margin for the Minahasa Grid Table 4: 2003 Operating margin for the Minahasa grid
Fuel Type Electricity Fuel Calorific Calorific Carbon Oxidation CO2 Emission CO2 emissiongenerated consumption value value emission factor factor
factor(MWh) (kl) (TJ/kl) (TJ) (tC/TJ) (tCO2) (tCO2/MWh)
Data source PLN PLN Pertamina IPCC 2006 IPCC 2006HSD 274,954 75,839 0.04 2,754.41 20.20 1 204,010 0.74
Table 4. 2004 Operating Margin for the Minahasa Grid Table 5: 2004 Operating margin for the Minahasa grid
Fuel Type Electricity Fuel Calorific Calorific Carbon Oxidation CO2 Emission CO2 emissiongenerated consumption value value emission factor factor
factor(MWh) (kl) (TJ/kl) (TJ) (tC/TJ) (tCO2) (tCO2/MWh)
Data source PLN PLN Pertamina IPCC 2006 IPCC 2006HSD 229,019 61,570 0.04 2,236.17 20.20 1 165,625 0.72
Table 5. 2005 Operating Margin for the Minahasa Grid

PROJECT DESIGN DOCUMENT FORM (CDM PDD) - Version 03.1. CDM – Executive Board page 21 Table 6: 2005 Operating margin for the Minahasa grid
Fuel Type Electricity Fuel Calorific Calorific Carbon Oxidation CO2 Emission CO2 emissiongenerated consumption value value emission factor factor
factor(MWh) (kl) (TJ/kl) (TJ) (tC/TJ) (tCO2) (tCO2/MWh)
Data source PLN PLN Pertamina IPCC 2006 IPCC 2006HSD 302,747 81,717 0.04 2,967.91 20.20 1 219,823 0.73
The total generation capacity for Minahasa Grid from 2003-2005, including “Must Run” power , is provided in MWh, in Table 6, below.
Table 6. Total Generation Capacity (2003-2005), including Must-Run
Parameter Unit 2005 2004 2003 Total
Hydro MWh 221,942.75 234,108.47 153,279.58 609,330.80
Thermal (Diesel Oil) MWh 302,746.69 229,019.12 274,954.12 806,719.93
Geothermal MWh 126,551.89 147,905.58 145,008.60 419,460.07
Total Power Generated MWh 651,241.33 611,033.17 573,242.30 1,835,516.80
The average operating margin emission factor for the Minahahsa Grid (EFOM,average,y ) over the 3 year period from 2003 to 2005, is provided in Table 7, below. The value is 0.321 tCO2/MWh.
Table 7. Operating margin emission factor.
2005 2004 2003 Total
Total Emissions tCO2e 219,823 165,625 204,010
589,458 Total Generation MWh 651,241 611,033 573,242
1,835,516
Operating margin EFOM,average,y tCO2e/MWh 0.338 0.271 0.356
0.321 STEP 2. Calculate the Build Margin emission factor ex- ante The Build Margin emission factor is calculated ex ante based on the generation-weighted average emission factor (tCO2/MWh) of a sample of power plants m, as follows:
∑∑
•=
mym
mimiymi
yBM GEN
COEFFEF
,
,,,,
, (Formula 3)
where
Fim,y, COEFi,m and GENm,,y are analogous to the variables described for the average OM method above for plants m.
Option 1. Calculate the Build Margin emission factor EFBM,y ex-ante based on the most recent information available on plants already built for sample group m at the time of PDD submission. The sample group m consists of either the five power plants that have been built most recently or the power plant capacity

PROJECT DESIGN DOCUMENT FORM (CDM PDD) - Version 03.1. CDM – Executive Board page 22 additions in the electricity system that comprise 20% of the system generation (in MWh) and that have been built most recently. It is required to select from those two options that sample group that comprises the larger annual generation. Option 2. For the first crediting period, the Build Margin emission factor EFBM,y must be updated annually ex-post for the year in which actual project generation and associated emissions reductions occur. For subsequent crediting periods, EFBM,y should be calculated ex-ante, as described in option 1 above. The sample group m consists of either the five power plants that have been built most recently or the power plant capacity additions in the electricity system that comprise 20% of the system generation (in MWh) and that have been built most recently Project participants should use from these two options that sample group that comprises the larger annual generation. Among the two options available for calculating the build margin, the first option is selected ie calculate the build margin emission factor ex-ante based on the most recent information available on plants already built for sample group m at the time of PDD submission. The 20% of the most recent power plant built comprises 14 power plants providing electricity to the Minahasa Grid considered as a subset data points m. This data is shown in Table 8, while the total generation of the 14 plants is shown in Table 9. Since ACM0002, does not state the years from which the data should be included for calculating the build margin, the most recent available data from year 2005 is used. The Build Margin Emission Factor (EFBM,y), in tCO2equ/MWh, is the sum of the carbon dioxide emissions 2005 of the set of mi generators selected for the year i =2005, in tonnes, divided by the sum of all electricity dispatched onto the Minahasa grid for the same year in MWh by this set of generators. The calculation of the build margin is presented in Table 10. The Build Margin Emission factor (EFBM,y) in the Minahasa Grid, calculated from the selected year is, 0.712 tCO2 e/MWh.
Table 8. 14-Last Plants Connected to the Minahasa System
Parasitic load (loss)
2005 Electricity
delivered to the grid
-- -- -- -- -- kl/MWh MWh MWh1 PLTD Kotamobagu 1,000 2005 Diesel HSD 0.28002 24 6702 PLTD Bintauna 1,000 2004 Diesel HSD 0.26680 0 8713 PLTD LOPANA 5,420 2003 Diesel HSD 0.24901 660 16,0124 PLTD LOPANA 5,420 2003 Diesel HSD 0.25175 310 7,5195 PLTD Kotamobagu 1,000 2003 Diesel HSD 0.27911 29 1,0486 PLTD Kotamobagu 1,000 2003 Diesel HSD 0.27672 4 1647 PLTD Bintauna 250 2003 Diesel HSD 0.27090 0 58 PLTD Bintauna 700 2003 Diesel HSD 0.27224 13 355
1684614
10051
368
2324,1521,971301 1,077
7,829
87116,672
Electricity Generation
2005 (Gross)
MWh
693
#Station
Installed capacity
(kW)
Year of Commission
(by date)
Diesel Oil Specific Fuel Consumption
kl/year
194
Fuel Type
Fuel Consumption
2005type
1
9 PLTD Molibagu 700 2003 Diesel HSD 0.28641 0 90310 PLTD Sewa/rented 5,000 2002 Diesel HSD 0.00000 0 011 PLTD Inobonto 1000 2002 Diesel HSD 0.27632 30 75812 PLTD Sewa/rented 5,000 2002 Diesel HSD 0.26852 0 31,82813 PLTD Molibagu 500 2002 Diesel HSD 0.27985 0 71814 PLTD Sewa/rented 10,000 2001 Diesel HSD 0.26372 0 124,744
Total 185,640
9030
259
124,744
0218
8,546201
32,898
78931,828
718

PROJECT DESIGN DOCUMENT FORM (CDM PDD) - Version 03.1. CDM – Executive Board page 23 Table 9. Total Generation of 14-Last Plants Connected to the Minahasa Grid (>20%)
2005 Total Generation GWh 651 14-last power plants GWh 186 Total / 14-last plants % 28.5
Table 10. The Build Margin Emission Factor of the Last-14 Plants Connected to the Grid
Parameter Unit 2005 Total Power Generated GWh 186 Fuel Consumption (HSD) kl 49,132 TJ 1,784 Emissions tCO2e 132,168 EFBM2005 tCO2e/GWh 712.0 EFBM2005 tCO2e/MWh 0.712
STEP 3. Calculate the Combined Margin emission factor The Combined Margin is calculated to provide the baseline emission factor as follows: EFy as the weighted average of the Operating Margin emission factor (EFOM,y) and the Build Margin emission factor (EFBM,y): EFy = wOM EFOM , y + wBM EFBM , y (Formula 4) where
the weights wOM and wBM, by default, are 50% (i.e., wOM = wBM = 0.5), and EFOM,y and EFBM,y are calculated as described in Steps 1 and 2 above and are expressed in tCO2/MWh
The value of EFOM,y and EFBM,y are 0.321 tCO2/MWh and 0.712 tCO2 MWh respectively, the baseline emission factor (EFy) in the Minahasa system is 0.517 tCO2/MWh.
STEP 4. Calculation of the project emissions In this project, the following emission sources are considered: a).Fugitive emissions from Non Condensed Gases Fugitive carbon dioxide and methane emissions due to release of non-condensable gases (NCG) from the produced steam are estimated based on data from the adjacent Lahendong 1 plant (PESy): PESy =wNCG (wMain,CO2 + wMain,CH 4 * GWPCH 4 ) * M S , y (Formula 5) where PESy are the project emissions due to release of carbon dioxide and methane from the produced steam during the year y; wNCG is the average mass fraction of non condensable gas in the produced steam; wMain,CO2 and wMain,CH 4 are the average mass fractions of carbon dioxide and methane in the non condensable gas; GWPCH 4 is the global warming potential of methane and M S , y is the quantity of

PROJECT DESIGN DOCUMENT FORM (CDM PDD) - Version 03.1. CDM – Executive Board page 24 steam produced during the year y. In ex-ante calculation, the CO2 content of non-condensable gas is 93% by mass and the CO2 content of steam is about 0.35% by mass. In the absence of CH4 content data, this is estimated as 0 in ex-ante calculation, but will be measured during the project activity. b) Carbon dioxide emissions resulting from fossil fuels related to the operation of the geothermal power plant (PEFFy) The CO2 emissions resulting from electricity consumption required for the operation of the geothermal power plant will be as follows: b-1) Electricity consumption for producing steam to be supplied to the geothermal power plant. Steam production requires electricity at a facility located outside of the power plant to run the equipments such as pumps and valves, and because of its location, electricity will be supplied from the Minahasa grid. This electricity consumption is estimated to be small because the electricity is used to meet the small-scale demand, such as a pump for reinjection of hot water. As this consumption is estimated to be less than 1 % of the total demand from the experience of the existing Lahendong I unit, it can be considered negligible. b-2) electricity generation of the power plant itself This activity requires internal use of electricity by the project plant such as the running of motors. This activity consumes the power generated from the plant itself. Therefore, the greenhouse gas emissions are considered zero since it is generated from geothermal steam and not by fossil fuel combustion. Carbon dioxide emissions resulting from fossil fuel consumption related to the operation of the geothermal power plant are considered and expected to be 0. STEP 5. Calculate Leakage Leakage emissions are considered and expected to be 0. STEP 6. Calculate Project Emission Reductions: The project emission reductions are to be derived ex-post annually as follows: ERs per annum (tCO2e) = Combined Margin x (Lahendong II electricity dispatched in MWh to the Minahasa grid) – project emissions. ERs per annum (tCO2e) = EFy x annual dispatched electricity in MWh - PESy (Formula 6) The average emission reductions per annum are about 59,026 tCO2e/year and 413,184 tCO2e for the first 7 years.
Table 11. Baseline and Project emissions and Emission reductions
Item Year

PROJECT DESIGN DOCUMENT FORM (CDM PDD) - Version 03.1. CDM – Executive Board page 25 Baseline emissions
Unit 2007 2008 2009 2010 2011 2012 2013
Installed capacity MW 20 20 20 20 20 20 20
Capacity factor % 82% 82% 80% 69% 88% 88% 88%
Expected gross generation
MWh 71832 143,664
140,160
120,888
154,176
154,176
154,176
Auxiliary loss % 5% 5% 5% 5% 5% 5% 5%
Expected net electricity deliver to the grid
MWh 68240.4 136480.8 133152 114843.6 146467.2
146467.2 146467.2
Baseline emission factor
t CO2/MWh 0.517 0.517 0.517 0.517 0.517 0.517 0.517
Baseline emissions t CO2 35,280
70,561
68,840
59,374
75,724
75,724
75,724
Project emissions
Steam flow rate/year
t 2557920 2557920 2557920 2557920 2557920
2557920 2557920
NCG content in steam
% weight 0.35% 0.35% 0.35% 0.35% 0.35% 0.35% 0.35%
CO2 content in steam
% weight 93% 93% 93% 93% 93% 93% 93%
Project emissions 6827 6827 6661 5745 7327 7327 7327
Emission Reductions
t CO2 eq/year 28,453
63,733
62,179
53,629
68,397
68,397
68,397
B.6.4 Summary of the ex-ante estimation of emission reductions:
The summary of the ex-ante estimation of emission reductions is given in Table 12. Table 12. Summary of ex-ante emission reductions
Year
Estimation of project activity
emissions (tonnes of CO2e)
Estimation of baseline emissions (tonnes of CO2e)
Estimation of Leakage
Estimation of emission
reductions (tonnes of CO2e)
2007 6827 35280 0 28453 2008 6827 70561 0 63733 2009 6661 68840 0 62179 2010 5745 59374 0 53629 2011 7327 75724 0 68397 2012 7327 75724 0 68397 2013 7327 75724 0 68397 Total 48041 461227 0 413,184

PROJECT DESIGN DOCUMENT FORM (CDM PDD) - Version 03.1. CDM – Executive Board page 26 B.7 Application of the monitoring methodology and description of the monitoring plan:
B.7.1 Data and parameters monitored: Data / Parameter: Electricity dispatched to the Minahasa Grid by the project Data unit: MWh Description: Electricity dispatched by the project to the Minahasa Grid Source of data to be used:
PLN - The electricity generation which is dispatched to the Minahasa Grid
Value of data applied for the purpose of calculating expected emission reductions in section B.5
Year Electricity
delivered to Minahasa
system (Mwh) 2007 682402008 1364812009 1331522010 1148442011 1464672012 1464672013 146467
Description of measurement methods and procedures to be applied:
The delivered power will be measured by a watthour meter which is connected to a digital control system (DCS) and recorded continuously.
QA/QC procedures to be applied:
The QA/QC will be conducted through cross checking with receipt of electricity sales
Any comment:
Data / Parameter: Quantity of steam produced during the year y Data unit: t Description: The amount of steam that is discharged from the geothermal wells during the
year Source of data to be used:
The project operation records which are recoded daily and reported monthly
Value of data applied for the purpose of calculating expected emission reductions in section B.5
2,557,920 ton of steam/year. This is currently taken based on well testing. Please also refer to data available during validation
Description of measurement methods and procedures to be applied:
Steam should be measured with a venture flow meter (or other equipment with at least the same accuracy). The calculation of steam quantities should be conducted on a continuous basis and should be based on international standard. The measurement results should be summarised transparently in regular production reports.
QA/QC procedures to be applied:

PROJECT DESIGN DOCUMENT FORM (CDM PDD) - Version 03.1. CDM – Executive Board page 27 Any comment:
Data / Parameter: Fraction of CO2 in produced steam Data unit: tCO2/t steam Description: CO2 quantity of Non-condensable gases (NCGs) in geothermal steam Source of data to be used:
The NCG data is taken from sampling as prescribed in the methodology AM0002 version 6, page 21, ID 17
Value of data applied for the purpose of calculating expected emission reductions in section B.5
0.93% by volume. This is currently taken based on well testing. Please also refer to data available during validation
Description of measurement methods and procedures to be applied:
NCGs sampling should be carried out in production wells and at the steam field-power plant interface using ASTM Standard Practice E1675 for Sampling 2-Phase Geothermal Fluid for Purposes of Chemical Analysis. The CO2 and CH4 sampling and analysis procedure consists of collecting NCG samples from the main steam line with glass flasks, filled with sodium hydroxide solution and additional chemicals to prevent oxidation. Hydrogen sulphide (H2S) and carbon dioxide (CO2) dissolve in the solvent while the residual compounds remain in their gaseous phase. The gas portion is then analyzed using a gas chromatography to determine the content of residual including CH4. All alkane concentrations are reported in terms of methane. The NCG sampling and analysis should be performed at least every three months and more frequently, if necessary.
QA/QC procedures to be applied:
Any comment:
Data / Parameter: Fraction of CH4 in produced steam Data unit: tCH4/t steam Description: CH4 quantity of Non-condensable gases (NCGs) in geothermal steam Source of data to be used:
the NCG data is taken from sampling as prescribed in the methodology AM0002 version 6, page 22, ID No 18
Value of data applied for the purpose of calculating expected emission reductions in section B.5
There is no CH4 content in the Non-condensable Gas (NCG). Therefore, this is not taken into account. However, since sampling will be made for CO2, then regular checking will be conducted during the project operation to verify that the NCG does not contain CH4.
Description of measurement methods and procedures to be applied:
QA/QC procedures to be applied:
NCGs sampling should be carried out in production wells and at the steam field-power plant interface using ASTM Standard Practice E1675 for Sampling 2-Phase Geothermal Fluid for Purposes of Chemical Analysis.

PROJECT DESIGN DOCUMENT FORM (CDM PDD) - Version 03.1. CDM – Executive Board page 28
The CO2 and CH4 monitoring will be carried out in production wells and at the steam field-power plant interface using ASTM Standard Practice E1675 for Sampling 2-Phase Geothermal Fluid for Purposes of Chemical Analysis. The NCG sampling and analysis should be performed at least every three months and more frequently, if necessary.
Any comment: B.7.2 Description of the monitoring plan:
This section details the steps taken to monitor on a regular basis the GHG emissions reductions from Lahendong II project.
The main components within the monitoring plan are:
1. Parameter to be monitored, and how the data will be collected. 2. The equipment to be used in order to carry out monitoring. 3. Operational procedures and quality assurance responsibilities.
If necessary, this Monitoring Plan can be updated and adjusted to meet operational requirements, provided that such modifications are approved by a Designated Operational Entity during the process of verification. The Power Plant Manager will be responsible for the activities related to implementation of the procedures. 1. Parameter to be monitored and how the data will be collected
Parameters to be monitored, and how data will be collected are described in Section B.7.1. Continuously readings of all field meters will be registered in either electronic form or on paper worksheets. Data collected will be entered in electronic worksheets and stored. CER quantity calculations will be carried out by a competent manager, most likely the Power Plant Manager using a MS Excel spread sheets. Backup of the data electronically will be conducted on a weekly basis, and hard copy data will be printed weekly. All data will be kept for the full crediting period, plus two years. 2. The equipment to be used in order to carry out monitoring The most important equipment necessary to carry out monitoring is the power supplied to the grid, the volume of steam consumed and measurement of CO2 and Ch4 in the steam. The power generated will be monitored by an integrated electronic system. The steam consumption is recorded continuously by the integrated electronic system. CO2 and Ch4 will be sampled 3 monthly using glass flasks. All meters and sensors will be subject to regular maintenance and testing regime according to the technical specifications from the manufacturers to ensure accuracy and good performance. Periodic controls of the field monitoring records will be carried out to check any deviation. 3. Operational procedures and quality assurance responsibilities.

PROJECT DESIGN DOCUMENT FORM (CDM PDD) - Version 03.1. CDM – Executive Board page 29 The Power Plant Manager is likely to be on a day to day basis responsible for the activities required to calculate the emission reductions. The Power Plant Manager will report the information on monthly basis to Generation Department and to Corporate Department for checking and record keeping. The head of PLN will ultimately be responsible for ensuring that the monitoring system is established and implemented to the satisfaction of a DOE and the IBRD acting as trustee of the NCF. PLN may conduct regular on site training and quality control programs to ensure that good management practices are ensured and implemented by all project operating personnel in terms of recordkeeping, equipment calibration, overall maintenance, and procedures for corrective action. Periodic reports to evaluate performance and assist with performance management will be prepared by the PLN Power Generation Department B.8 Date of completion of the application of the baseline study and monitoring methodology and the name of the responsible person(s)/entity(ies) Organization Architrandi Priambodo, Private consultant - overall support to PDD
development Street / Post Box City Jakarta Postcode / Zip Country Indonesia Telephone 08121050784 Fax - E.mail [email protected]
URL -
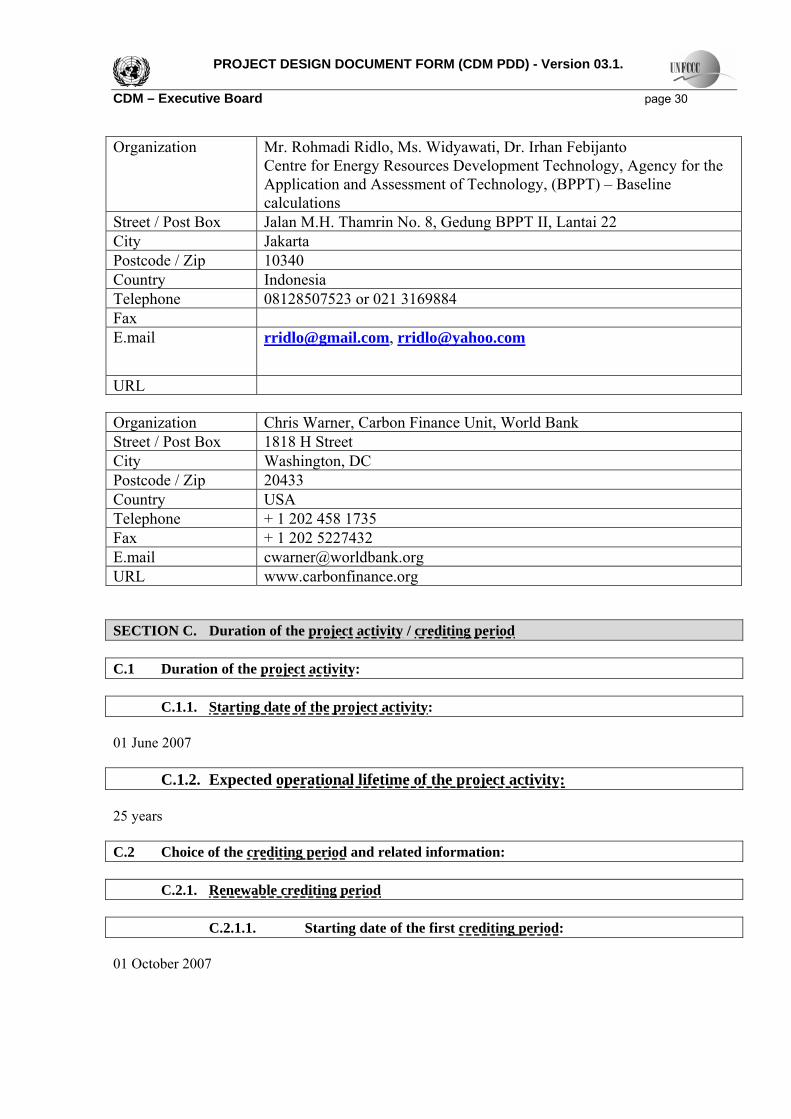
PROJECT DESIGN DOCUMENT FORM (CDM PDD) - Version 03.1. CDM – Executive Board page 30 Organization Mr. Rohmadi Ridlo, Ms. Widyawati, Dr. Irhan Febijanto
Centre for Energy Resources Development Technology, Agency for the Application and Assessment of Technology, (BPPT) – Baseline calculations
Street / Post Box Jalan M.H. Thamrin No. 8, Gedung BPPT II, Lantai 22 City Jakarta Postcode / Zip 10340 Country Indonesia Telephone 08128507523 or 021 3169884 Fax E.mail [email protected], [email protected]
URL Organization Chris Warner, Carbon Finance Unit, World Bank Street / Post Box 1818 H Street City Washington, DC Postcode / Zip 20433 Country USA Telephone + 1 202 458 1735 Fax + 1 202 5227432 E.mail [email protected] URL www.carbonfinance.org SECTION C. Duration of the project activity / crediting period C.1 Duration of the project activity: C.1.1. Starting date of the project activity: 01 June 2007 C.1.2. Expected operational lifetime of the project activity: 25 years C.2 Choice of the crediting period and related information: C.2.1. Renewable crediting period C.2.1.1. Starting date of the first crediting period: 01 October 2007

PROJECT DESIGN DOCUMENT FORM (CDM PDD) - Version 03.1. CDM – Executive Board page 31 C.2.1.2. Length of the first crediting period: 7 years C.2.2. Fixed crediting period: C.2.2.1. Starting date: >> C.2.2.2. Length: >> SECTION D. Environmental impacts D.1. Documentation on the analysis of the environmental impacts, including transboundary impacts: According to the Decree of Environmental Minister No. 17 of 2001, the construction of thermal power plants of up to 100 MW capacity does not require a full Environmental Impact Assessment (AMDAL), but does require the preparation of environmental management and environmental monitoring plan. Accordingly, an Environmental Management and Monitoring Measures Report (UKL-UPL) was completed by PT PLN (PERSERO) and PT Hexamatra, Makassar in November 2003. The Environmental Management and Monitoring Measures Report was prepared in accordance with the Decree of the Power and Energy Development Director No. 78-12/008/600.2/1995 (06 October 1995) which provides technical guidance on the preparation of UKL-UPLs for thermal power stations including steam, geothermal, diesel, etc. The UKL-UPL was approved by the Minahasa Regional Environmental Agency on 3 November 2003. The UKL-UPL has 5 main environment sections. Section 1, identifies the project parties. Section II describes the project. Section III describes the pre-project quality of the receiving environment. Section III, notes that ambient hydrogen sulphide levels in the area were elevated above the national guideline at the time of sampling. This is ascribed to the proximity of the sampling to the existing Lahendong I cooling tower or due to Soputan volcanic explosion. In August 2001, when samples were previously taken, these met national air quality standards. No sensitive natural environments are noted in the report. No significant social issues are identified. Of 30 inhabitants sampled on their opinion of the project, 27 said that they supported it. 3 did not have an opinion on the matter. The predicted environmental impacts during plant construction, operations, maintenance and closure are identified with respect to the impact source, type of impact and magnitude. These are summarised in Table 4.1 of the UKL-UPL. Table 5.1 of the Environmental Monitoring and Management Plan identifies the management measures to be taken, the Agency in charge and the relevant Inspecting Agency. No particularly significant impacts were predicted during plant construction or the plant closure. During plant operation and maintenance, 3 more significant issues were noted:
• Ambient hydrogen sulphide levels could increase to 0,164 ppm. Therefore, measures to reduce these concentrations to 0.02 ppm including dilution facilities are recommended.

PROJECT DESIGN DOCUMENT FORM (CDM PDD) - Version 03.1. CDM – Executive Board page 32
Three monthly monitoring of ambient levels is recommended and 6 monthly monitoring on plant habitats.
• Water will be drawn from Lake Pangolombian for the plant cooling towers. In order to mitigate a potential significant draw down on the lake, water will be withdrawn slowly over a period of time. The water in the cooling system will be a closed loop to conserve water resources. During plant maintenance, every 3 years, the water will be changed. This will be reinjected into the plant injection well to prevent surface and groundwater contamination. The quantity of lake water is recommended for monitoring every 3 months.
• Sludge resulting from the cooling towers, will be provided to a waterproof sludge containment centre.
The abovementioned Management and Monitoring Measures Report has been reviewed to the satisfaction of the World Bank. The UKL-UPL is also, in a Letter of Statement dated October 2003, accepted by the Director of PLN Ir Agus Subiyanto. The proposed rehabilitation and mitigation measures and monitoring plan are agreed to in the Statement. D.2. If environmental impacts are considered significant by the project participants or the host Party, please provide conclusions and all references to support documentation of an environmental impact assessment undertaken in accordance with the procedures as required by the host Party: Not significant SECTION E. Stakeholders’ comments E.1. Brief description how comments by local stakeholders have been invited and compiled: >> The stakeholder meeting for Lahendong II project was conducted on 30 October 2003 in the meeting room of Lahendong Power Plant office. The attendance list in the UKL-UPL shows 25 attendees. The attendees of the stakeholder meeting include:
- The head of South Tomohon District - The head of Remboken Districts - The representative of the environmental agency , Tomohon municipality - The representative of the environmental agency, Minahasa regency - Representatives from Pertamina (steam supplier) - Representatives from related PLN office (PIKITRING SULWESI) - Representatives from Tondagow village During the meeting, a presentation regarding the project and its environmental impact was communicated to the related stakeholders. A questions/answers session was conducted afterwards. In general, the stakeholders supported the proposed development.

PROJECT DESIGN DOCUMENT FORM (CDM PDD) - Version 03.1. CDM – Executive Board page 33 E.2. Summary of the comments received: The key comments received during the meeting were as follows:
- More detailed information was required on the potential health and environment impacts of hydrogen sulphide contained in non-condensable gases.
- The potential impact of drawing water from the Pangolombian Lake for the project and the impact of this on the surrounding local community was raised.
- Project community development benefits were raised. E.3. Report on how due account was taken of any comments received:
- It was explained that the hydrogen sulphide will be diluted and released through the cooling towers. Levels will be controlled and maintained to meet the national standard. Monitoring will take place.
- To avoid drawing significant volumes of water at any one point from the lake, it was explained that water will be gradually pumped from the lake and stored in tanks. It was also explained that the volume of water which will be drawn from the lake will not have a significant impact.
- Whilst the project does not envisage supporting a direct community benefits plan, electrification programs will benefit the community.

PROJECT DESIGN DOCUMENT FORM (CDM PDD) - Version 03.1. CDM – Executive Board page 34 Annex 1 CONTACT INFORMATION ON PARTICIPANTS IN THE PROJECT ACTIVITY Organization: Perusahaan Listrik Negara Street/P.O.Box: Jl. Trunojoyo Blok M I/135 Kebayoran Baru Building: Gedung PLN City: Jakarta State/Region: Postfix/ZIP: 12160 Country: Telephone: +62-21-7251234/7261122 ext.1320 FAX: E-Mail: [email protected] URL: Represented by: Title: Manager of Renewable Energy, Directorate generation and primary energy Salutation: Last Name: Senoaji Middle Name: First Name: Ario Department: Mobile: Direct FAX: Organization: International Bank for Reconstruction and Development (IBRD) acting as the
Trustee of the Netherlands Carbon Facility Street/P.O.Box: Building: 1818H Street City: Washington State/Region: Washington DC Postfix/ZIP: 20433 Country: Unites States of America Telephone: FAX: E-Mail: [email protected]
URL: http://carbonfinance.org/Router.cfm?Page=Funds&ItemID=24670 Represented by: Title: Carbon Fund Manager Salutation: Ms. Last Name: Chassard Middle Name: First Name: Joelle Department: World Bank Carbon Finance Business Unit Mobile: Direct FAX:

PROJECT DESIGN DOCUMENT FORM (CDM PDD) - Version 03.1. CDM – Executive Board page 35

PROJECT DESIGN DOCUMENT FORM (CDM PDD) - Version 03.1. CDM – Executive Board page 36 Annex 2 INFORMATION REGARDING PUBLIC FUNDING The project is part financed through a US$17,5 million loan from the ADB and through PLN financing of US$7,5 million. Annex 3 BASELINE INFORMATION Attached excel spreadsheet. Annex 4 MONITORING INFORMATION No further information required