Northwest Colorado Oil & Gas Forum June 5, 2008 Northwest Colorado Oil & Gas Forum June 5, 2008.
Upload
russell-wadeCategory
view
213download
0
© OECD/IEA - 2008
NATURAL GAS
MARKEREVIEW
2008
Gas and the Sustainability Drive: what will it do the fuel mix?
Ian Cronshaw, Head of Energy Ian Cronshaw, Head of Energy Diversification DivisionDiversification Division
International Energy AgencyInternational Energy Agency
GIE Annual Conference, BucharestGIE Annual Conference, Bucharest23 October 2008 23 October 2008

OECD Europe--Gas Delivered
22,419
32,419
42,419
52,419
62,419
72,419
Jan
Feb Mar Apr
May Ju
nJu
lAug
Sep OctNov
Dec
Mill
ion
Cu
bic
Met
ers
2002 - 2007 Range 2006 2007 2008

Spain’s economy slows—but not gas demand
1,184
1,684
2,184
2,684
3,184
3,684
4,184
Jan
Feb Mar Apr
May Ju
nJu
lAug
Sep OctNov
Dec
Mill
ion
Cu
bic
Met
ers
2002 - 2007 Range 2006 2007 2008

Japan—demand growth surprisesJapan Annual Totals BCM % Change
2002 78.71 2003 86.37 9.7%2004 83.26 -3.6%
2005 84.98 2.1%2006 86.11 1.3%2007 95.96 11.4%
2008 52.48 11.9%
4,799
5,799
6,799
7,799
8,799
9,799
Jan
Feb Mar Apr
May Ju
nJu
lAug
Sep OctNov
Dec
Mill
ion
Cu
bic
Met
ers
2002 - 2007 Range 2006 2007 2008

Increase in Global Natural Gas Demand, 2005-2030
Natural gas demand grows by 2.1% per year through to 2030, from 2 854 bcm in 2005 to 4 779 bcm in 2030.
250
MiddleEast
Trans.economies
OECDN.
America
OECDEurope
China LatinAmerica
Rest of Asia
AfricaPacific
India
20%
13%12% 11%
10% 10% 9%
7%
5% 4%
0
50
100
150
200
300
350
400
OECD
billio
n cu
bic
met
res
% Share of increase in world primary natural gas demand, 2005-2030

OECD Power generation growthIncremental generation 2000-2007
745
315
11984
28
-57-126
1108
-200
0
200
400
600
800
1000
1200
Gas Coal Wind Other renewables
Nuclear Hydro Oil Total
TWh
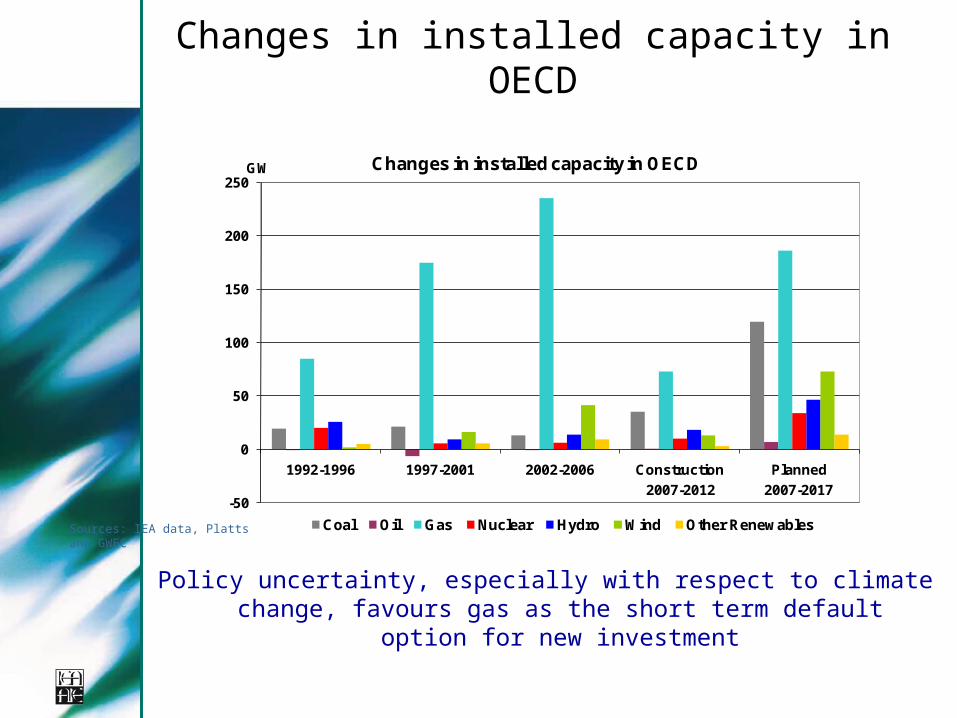
Changes in installed capacity in OECD
-50
0
50
100
150
200
250
1992-1996 1997-2001 2002-2006 Construction Planned
Changes in installed capacity in OECD
Coal Oil Gas Nuclear Hydro Wind Other Renewables
GW
2007-2012 2007-2017
Sources: IEA data, Platts and GWEC
Policy uncertainty, especially with respect to climate change, favours gas as the short term default option for new
investment

Share of gas-fired power in electricity output, and demand of gas for power
188
30
12
52
106
31
22
242
40
16
75
15 13
47
28
0%
10%
20%
30%
40%
50%
60%
70%
US UK Spain* Japan** Canada France Italy Germany
2005 2006 2020
* Spain forecast for 2010. ** Japan forecast for 2030. (Bcm at top of bars). Source: IEA data and forecasts from national government submissions
Gas-fired power in the US increased by 10% last year. All larger OECD countries foresee further increases in gas demand for
power.

Monthly average prices of gas and power in the UK, coal, and CO² in EU ETS

Investment:EPC unit costs in LNG rise sharply

Investment: Pipeline projects in Eurasia
Impact of financial crisis?
There is no major concern about gas consumption growth except timely construction of supply infrastructure
Financial crises may cause better sentiment for tangible projects with (fairly)stable return rate
Raw materials cost drop might be beneficial, but regulatory framework and formal difficulties associated with infrastructure projects that were a concern before the summer remain

Average Annual Power Generation Capacity Additions Average Annual Power Generation Capacity Additions in the “50% COin the “50% CO2 2 Reduction Scenario” Reduction Scenario” 2010 – 20502010 – 2050

Some summary observations
Demand growth still strong; both inside IEA and non member countries
Gas consumption growth strong in 2007-08 despite slowing/zero growth
Electricity and gas markets now strongly linked.
LNG grows fast, but demand grows faster
Europe imports by pipeline and LNG Global Gas Market Interactions Increase

Key message
In all scenarios, gas is a key source of energy for the foreseeable future
Gas meets some interlinked challenges:
security of supply, environment , affordability
Gas power generation seems to be the default option providing needed flexibility and back up to wind and hydro power generation