BRAZIL...NOMINAL INTEREST RATES –10 YEARSSelected emerging markets Source: Bloomberg, Bradesco2008...
28
BRAZIL MACROECONOMIC OUTLOOK January, 2020 Economic Research Department
Transcript of BRAZIL...NOMINAL INTEREST RATES –10 YEARSSelected emerging markets Source: Bloomberg, Bradesco2008...
BRAZIL MACROECONOMIC
OUTLOOKJanuary, 2020
Economic Research Department

Brazil is undergoing animportant change in its
economic policy

-0.60%
6.13%
-0.20%
-7%
-2%
3%
8%
13%
18%
98 99 00 01 02 03 04 05 06 07 08 09 10 11 12 13 14 15 16 17 18 19
Despesa real, %
Source: STN, Bradesco
CENTRAL GOVERNMENT REAL EXPENDITURE% Annual
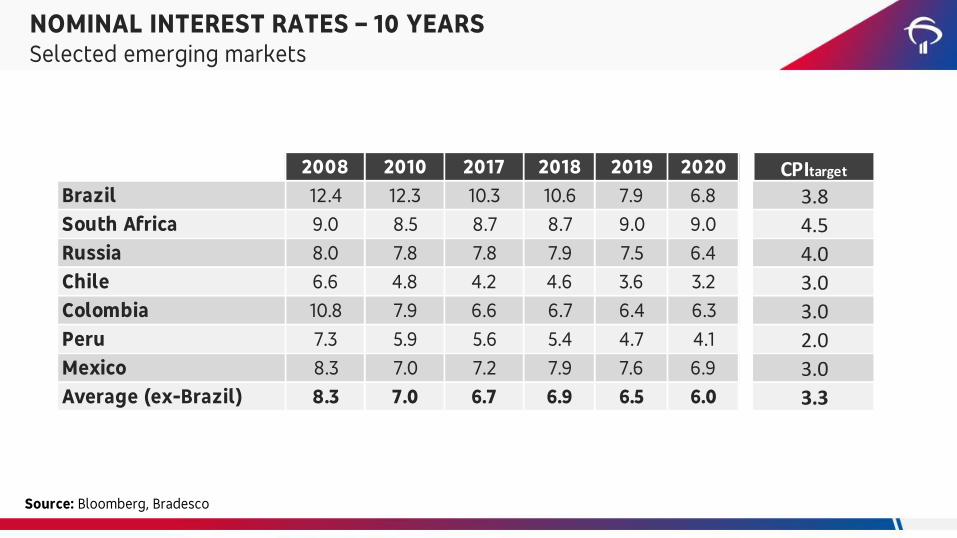
NOMINAL INTEREST RATES – 10 YEARSSelected emerging markets
Source: Bloomberg, Bradesco
2008 2010 2017 2018 2019 2020 CPItarget
Brazil 12.4 12.3 10.3 10.6 7.9 6.8 3.8South Africa 9.0 8.5 8.7 8.7 9.0 9.0 4.5
Russia 8.0 7.8 7.8 7.9 7.5 6.4 4.0Chile 6.6 4.8 4.2 4.6 3.6 3.2 3.0Colombia 10.8 7.9 6.6 6.7 6.4 6.3 3.0
Peru 7.3 5.9 5.6 5.4 4.7 4.1 2.0Mexico 8.3 7.0 7.2 7.9 7.6 6.9 3.0Average (ex-Brazil) 8.3 7.0 6.7 6.9 6.5 6.0 3.3

Source: BIS, BCB, Bradesco
CREDIT – INTERNATIONAL COMPARISONJun-19, % of GDP
143
51.1
100.7
42.3
70.6
87
42.3
28.3
0
20
40
60
80
100
120
140
160
Credit to the privatesector
Credit to the government Credit to non-financialcompanies
Credit to households
Título do Gráfico
Emerging Markets Brazil

However, to significantly accelerategrowth, the private sector will have to
be the protagonist of the economy

POST-PENSION REFORM AGENDASummary
Topics Reforms
Business environmentTax reform, Economic Freedom Bill, Law of Gas and Sanitation, Regulatory Mark of Regulatory Agencies,
BC+ Outlook
Privatization and concessions BRL 204 billion in projects
Openness of economy Mercosul-EU Deal, unilateral reduction of CET, new deals
Demand boost FGTS, Bolsa Família Programme Christmas Bonus, monetary policy
Macro and fiscal reformsTransfer of Rights (Petrobras), Central Bank Independence, aid to states and municipalities,
administrative reform
Implemented reformsSpending cap bill, TLP, labor reform, public credit downsizing, social security and anti-fraud, reduction
of inflation target, home equity credit, positive credit bureau, LIG, eletronic bonds
Source: Bradesco

Aviation (41 airports)
10.3Waterway (12 ports)
4.2
Roads (16 mil km)
131.0
Railroads (15 mil km)
58.9
CONCESSIONS AND PRIVATIZATION PROGRAMSDetails
R$ 204 billion by 2022
R$ 10 billion of investment: + 0,15 p.p. GDP
27.4
26.5
8.0
14.8
12.7
20.3
6.0
0 5 10 15 20 25 30
2021 3ºQ
2020 4ºQ
2020 3ºQ
2020 2ºQ
2020 1ºQ
2019 4ºQ
2019 3ºQ
Source: Min. Infraestrutura, Bradesco

TRADE OPENNESSExport + import % from GDP, 2017
Source: EIU, Bradesco
117.1%
114.9%
65.7%
54.3%
46.6%
40.5%
40.4%
39.0%
37.3%
27.3%
23.1%
0% 50% 100% 150%
Asia
Europe
Canada
South Africa
Russia
Latam
Australia
India
China
USA
Brazil

GDPAnnual rate of change, %
Source: IBGE, Bradesco
4.4
1.4
3.1
1.1
5.8
3.24.0
6.15.1
-0.1
7.5
4.0
1.93.0
0.5
-3.5 -3.3
1.3 1.3 1.2
2.5
-6.0
-4.0
-2.0
0.0
2.0
4.0
6.0
8.0
10.0
00 01 02 03 04 05 06 07 08 09 10 11 12 13 14 15 16 17 18 19 20
Crescimento anual do PIB, em %

4.0
0.81.3
-0.5
3.94.4
5.36.4 6.5
4.5
6.2
4.8
3.5 3.5
2.3
-3.2-3.8
2.0 2.1 1.82.5
-6.0
-4.0
-2.0
0.0
2.0
4.0
6.0
8.0
00 01 02 03 04 05 06 07 08 09 10 11 12 13 14 15 16 17 18 19 20
Renda real
8.5
2.0
6.7
12.0 12.3
-2.1
17.9
6.8
0.8
5.8
-4.2
-13.9-12.1
-2.6
3.9 3.05.0
-20.0
-15.0
-10.0
-5.0
0.0
5.0
10.0
15.0
20.0
04 05 06 07 08 09 10 11 12 13 14 15 16 17 18 19 20
Investment
Government Consumption Household Consumption
-0.2
2.6
3.8
1.6
3.9
2.0
3.64.1
2.0
2.9
3.9
2.2 2.3
1.5
0.8
-1.4
0.2
-0.7
0.4
-0.2
0.4
-2.0
-1.0
0.0
1.0
2.0
3.0
4.0
5.0
00 01 02 03 04 05 06 07 08 09 10 11 12 13 14 15 16 17 18 19 20
Source: IBGE, Bradesco
GDPAnnual rate of change, %

5.0
3.74.3
5.8
4.8
2.1
5.8
3.52.9 2.8
1.0
-2.7-2.2
0.81.5 1.3
2.5
-4.0
-2.0
0.0
2.0
4.0
6.0
8.0
04 05 06 07 08 09 10 11 12 13 14 15 16 17 18 19 20
Serviços
4.9
7.0
13.1
8.2
3.24.5
-2.1
-9.0-10.0
-7.5
-2.5
0.3
3.7
-15.0
-10.0
-5.0
0.0
5.0
10.0
15.0
08 09 10 11 12 13 14 15 16 17 18 19 20
Título do Gráfico
Services
Construction
2.0 1.1
4.63.2
5.8
-3.7
6.75.6
-3.1
8.4
2.8 3.3
-5.2
14.2
1.4 1.6 2.0
-10.0
-5.0
0.0
5.0
10.0
15.0
20.0
04 05 06 07 08 09 10 11 12 13 14 15 16 17 18 19 20
Título
Agricultural
Industrial
8.2
2.0 2.0
6.2
4.1
-4.7
10.2
4.1
-0.7
2.2
-1.5
-5.8-4.6
-0.5
0.5 0.82.0
-10.0
-5.0
0.0
5.0
10.0
15.0
04 05 06 07 08 09 10 11 12 13 14 15 16 17 18 19 20
Renda real
Source: IBGE, Bradesco
GDPAnnual rate of change, %

DOMESTIC AND EXTERNAL DEMANDSeasonally adjusted level
Source: IBGE, Bradesco
174.9
148.1
100.8
80
100
120
140
160
180
200
04 05 06 07 08 09 10 11 12 13 14 15 16 17 18 19 20
Título do Gráfico
Consumption + Investment Government External Demand
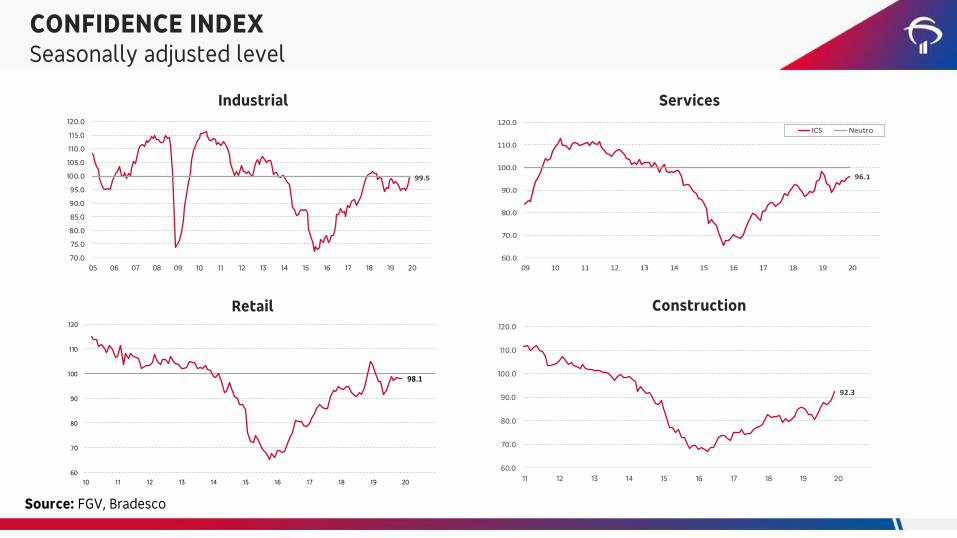
CONFIDENCE INDEXSeasonally adjusted level
Industrial Services
Retail Construction
Source: FGV, Bradesco
99.5
70.0
75.0
80.0
85.0
90.0
95.0
100.0
105.0
110.0
115.0
120.0
05 06 07 08 09 10 11 12 13 14 15 16 17 18 19 20
Índice de Confiança da Indústria - Série com ajuste sazonalFonte: FGV
98.1
60
70
80
90
100
110
120
10 11 12 13 14 15 16 17 18 19 20
96.1
60.0
70.0
80.0
90.0
100.0
110.0
120.0
09 10 11 12 13 14 15 16 17 18 19 20
Título do Gráfico
ICS Neutro
92.3
60.0
70.0
80.0
90.0
100.0
110.0
120.0
11 12 13 14 15 16 17 18 19 20
indice confianca dessaz

EMPLOYMENT AND INCOMESlow recovery of the labor market
Unemployment Real Income
-1.7%
1.1%
4.1%
3.4%3.3%3.4%3.3%2.9%
4.1%
3.3%
2.1%
-0.8%
-2.3%
1.5%1.6%
0.5%
2.0%
-3.0%
-2.0%
-1.0%
0.0%
1.0%
2.0%
3.0%
4.0%
5.0%
04 05 06 07 08 09 10 11 12 13 14 15 16 17 18 19 20
Renda real
9.8%9.3%
9.8%
8.8%
8.0%8.5%
8.2%7.6%
7.3% 7.2%6.8%
8.3%
11.3%
12.8%12.3%
11.9%11.2%
0.0%
2.0%
4.0%
6.0%
8.0%
10.0%
12.0%
14.0%
04 05 06 07 08 09 10 11 12 13 14 15 16 17 18 19 20
Título do Gráfico
Source: IBGE, Bradesco

CREDIT – FREE RESOURCESInventories, % yoy in nominal terms
Source: BCB, Bradesco
13.2%10.9%
15.1%
-15.0%
-10.0%
-5.0%
0.0%
5.0%
10.0%
15.0%
20.0%
25.0%
12 13 14 15 16 17 18 19 20
Total PJ PF

78.0
83.0
88.0
93.0
98.0
14 15 16 17 18 19 20
Manufacturing
Retail
Services
INDUSTRY, RETAIL AND SERVICESSeasonally adjusted level
Source: IBGE, Bradesco

NOMINAL EXCHANGE RATER$/US$
Source: Bloomberg, Bradesco
4.09
2.90
3.10
3.30
3.50
3.70
3.90
4.10
4.30
Apr-17 Jul-17 Oct-17 Jan-18 Apr-18 Jul-18 Oct-18 Jan-19 Apr-19 Jul-19 Oct-19 Jan-20

BRAZILIAN RISK: 5 YEAR CDSb.p.
Source: Bloomberg, Bradesco
109.7
138.5
321.2
234.3
97.7
0
50
100
150
200
250
300
350
One year beforeinvestment-grade
Investment-gradeperiod (excluding
global crisis)
Global crisis One year beforedowngrade to junk
Today
Título do Gráfico
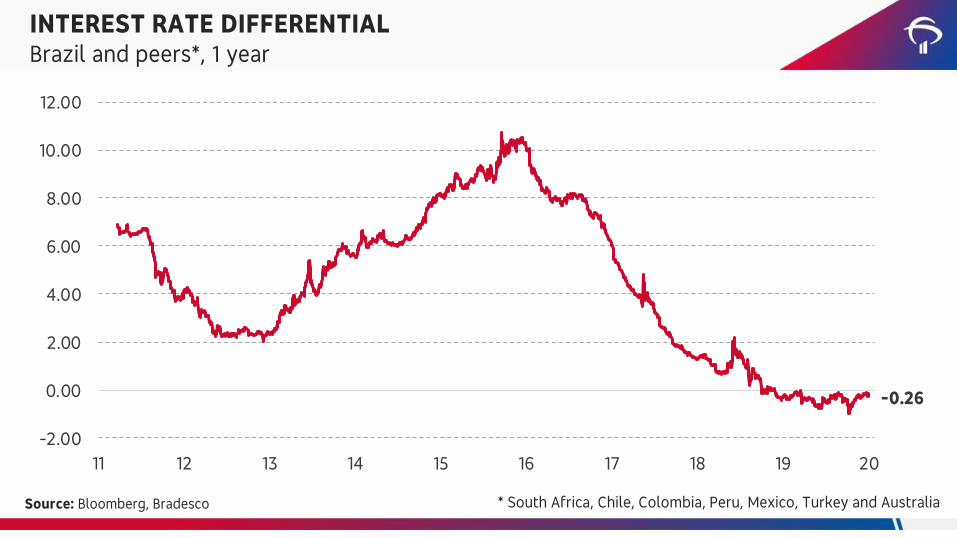
-0.26
-2.00
0.00
2.00
4.00
6.00
8.00
10.00
12.00
11 12 13 14 15 16 17 18 19 20
INTEREST RATE DIFFERENTIALBrazil and peers*, 1 year
Source: Bloomberg, Bradesco * South Africa, Chile, Colombia, Peru, Mexico, Turkey and Australia

NOMINAL EXCHANGE RATER$/US$, end of period
Source: Bloomberg, Bradesco
1.962.32
3.53
2.892.65
2.342.14
1.77
2.34
1.741.671.88
2.042.34
2.66
3.90
3.263.31
3.874.15
4.00
0
0.5
1
1.5
2
2.5
3
3.5
4
4.5
00 01 02 03 04 05 06 07 08 09 10 11 12 13 14 15 16 17 18 19 20
Taxa de câmbio - R$ / US$ - Final
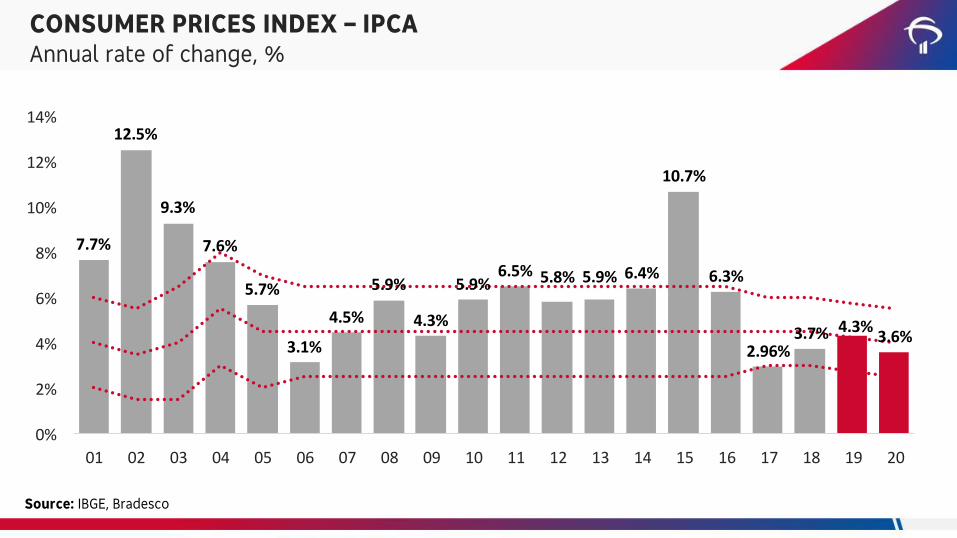
7.7%
12.5%
9.3%
7.6%
5.7%
3.1%
4.5%
5.9%
4.3%
5.9%6.5% 5.8% 5.9% 6.4%
10.7%
6.3%
2.96%3.7% 4.3%
3.6%
0%
2%
4%
6%
8%
10%
12%
14%
01 02 03 04 05 06 07 08 09 10 11 12 13 14 15 16 17 18 19 20
Source: IBGE, Bradesco
CONSUMER PRICES INDEX – IPCA Annual rate of change, %

INFLATION RATE BY GROUPS12m
Source: IBGE, Bradesco
7.6%
8.3%7.7%
5.1%
10.2%
4.0%4.5%
6.7%
1.9%2.4%
3.3% 3.4%
4.5%
1.8%
3.5%
0%
2%
4%
6%
8%
10%
12%
IPCA Services(35.5%)
Regulated prices(26.1%)
Industrial goods(22.3%)
Food (16.0%)
jan13-aug16 sep16-sep19 nov/19
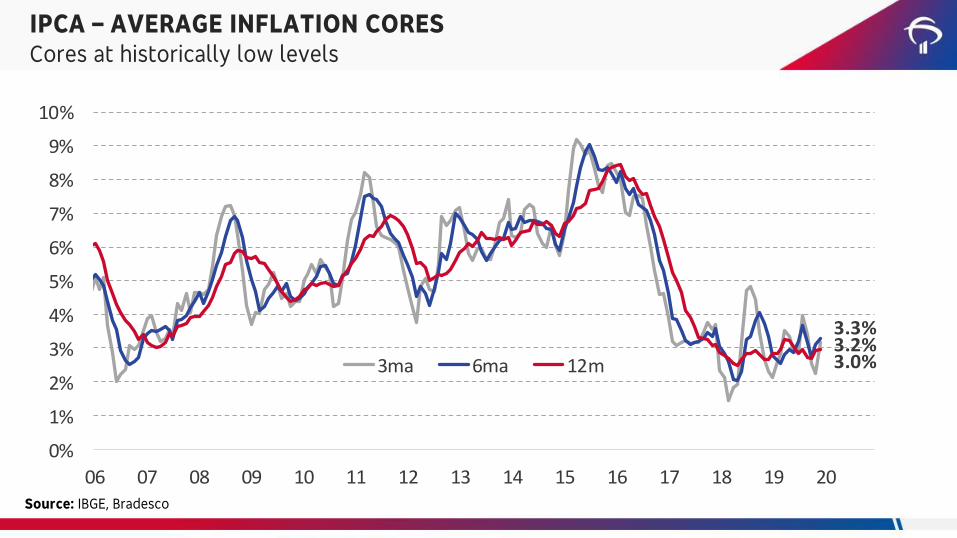
3.2%3.3%
3.0%
0%
1%
2%
3%
4%
5%
6%
7%
8%
9%
10%
06 07 08 09 10 11 12 13 14 15 16 17 18 19 20
Título do Gráfico
3ma 6ma 12m
IPCA – AVERAGE INFLATION CORESCores at historically low levels
Source: IBGE, Bradesco

MARKET EXPECTATIONS – IPCAWell anchored inflation expectations
Source: BCB, Bradesco
3.6
3.7
3.5
3.6
3.7
3.8
3.9
4.0
4.1
4.2
jan-18 mai-18 set-18 jan-19 mai-19 set-19 jan-20
Título do Gráfico
2020 2021

NOMINAL INTEREST RATE Selic rate is expected to fall below 5% this year
Source: BCB, Bradesco
15.75%
19.00%
25.00%
16.50%18.00%
13.25%
11.25%
13.75%
8.75%
10.75%
7.25%
10.00%11.75%
14.25%13.75%
7.00% 6.50%
4.50% 4.25%
0%
5%
10%
15%
20%
25%
30%
00 01 02 03 04 05 06 07 08 09 10 11 12 13 14 15 16 17 18 19 20
Título do Gráfico

Source: Bradesco
OUR FORECASTS...
Bradesco economic forecasts are revised at the beginning of each month. During moments of greater volatility, the level of uncertainty and error margins naturally rise, especially between revisions.Our forecasts are based on the assumption that the adjustments necessary to ensure the sustainability of Brazil’s macroeconomic framework will be implemented over the next few years. If theseadjustments do not materialize or are better than expected, the forecast could be altered significantly. Last revised on December 6, 2019.
2017 2018 2019 2020
GDP growth (%) 1.3 1.3 1.2 2.5
Consumer inflation - IPCA (%) 2.95 3.75 4.3 3.6
Wholesale inflation - IGP-M (%) -0.5 7.5 7.3 4.5
Selic Rate (%, eop) 7.00 6.50 4.50 4.25
Exchange Rate (BRL/USD, eop) 3.31 3.87 4.03 4.00
Industrial Production (%) 2.5 1.1 -1.0 2.0
Retail Sales (%) 4.0 5.0 4.4 4.5
Job Creation (in thousands) 1899 966 1298 1528
Unemployment Rate (% of labor force, avg) 12.7 12.3 11.9 11.2
Outstanding Credit Growth (%) -0.5 5.0 5.9 9.4
Trade Balance (USD bn) 64.0 53.0 39.6 36.1
Current Account (USD bn) -15.0 -41.5 -49.7 -55.3
Primary Balance (BRL bn) -111 -108.3 -81 -91
Gross Debt (% of GDP) 74.1 76.7 77.8 78.4

DEPEC-BRADESCOwww.economiaemdia.com.br
DEPEC - BRADESCO does not accept responsibility for any actions/decisions that may be taken based on the information provided in its publications and
projections. All the data and opinions contained in these information bulletins is carefully checked and drawn up by fully qualified professionals, but it
should not be used, under any hypothesis, as the basis, support, guidance or norm for any document, valuations, judgments or decision taking, whether of
a formal or informal nature. Therefore, we emphasize that all the consequences and responsibility for using any data or analysis contained in this
publication is assumed exclusively by the user, exempting BRADESCO from all responsibility for any actions resulting from the usage of this material. We
all point out that access to this information implies acceptance in full of this term of responsibility and usage.
The reproduction of the content in this report partially or in full is strictly forbidden except if authorized by BRADESCO or if the Sources the name of the
authors, publication and BRADESCO are strictly mentioned.
Updated: January 10th, 2020