· Project Management Salary Survey –Seventh Edition iii Table of Contents Introduction
295
Transcript of · Project Management Salary Survey –Seventh Edition iii Table of Contents Introduction


Project Management Salary Survey
Seventh Edition
Project Management Institute
Newtown Square, Pennsylvania, USA
2011 Project Management Institute, Inc. (PMI). All rights reserved. No part of this work may be reproduced or transmitted in any form or by any means without the prior written permission of PMI.

Project Management Salary Survey –Seventh Edition ii
Project Management Salary Survey
ISBN: 978-1-935589-49-5
Published by: Project Management Institute, Inc. 14 Campus Boulevard Newtown Square, Pennsylvania 19073-3299 USA. Phone: +610-356-4600 Fax: +610-356-4647 Email: [email protected]
Internet: www.PMI.org
©2011 Project Management Institute, Inc. All rights reserved.
"PMI", the PMI logo, "PMP", the PMP logo, "PMBOK", "PgMP”, “Project Management Journal", "PM Network", and the PMI Today logo are registered marks of Project Management Institute, Inc. The Quarter Globe Design is a trademark of the Project Management Institute, Inc. For a comprehensive list of PMI marks, contact the PMI Legal Department.
PMI Publications welcomes corrections and comments on its books. Please feel free to send comments on typographical, formatting, or other errors. Simply make a copy of the relevant page of the book, mark the error, and send it to: Book Editor, PMI Publications, 14 Campus Boulevard, Newtown Square, PA 19073-3299 USA.
To inquire about discounts for resale or educational purposes, please contact the PMI Book Service Center.
PMI Book Service Center P.O. Box 932683, Atlanta, GA 31193-2683 USA Phone: 1-866-276-4764 (within the U.S. or Canada) or +1-770-280-4129 (globally) Fax: +1-770-280-4113 Email: [email protected]
Printed in the United States of America. No part of this work may be reproduced or transmitted in any form or by any means, electronic, manual, photocopying, recording, or by any information storage and retrieval system, without prior written permission of the publisher.
The paper used in this book complies with the Permanent Paper Standard issued by the National Information Standards Organization (Z39.48—1984).
10 9 8 7 6 5 4 3 2 1

Project Management Salary Survey –Seventh Edition iii
Table of Contents
Introduction ...........................................................................................................................................................1 About PMI ........................................................................................................................................................1
About This Report ............................................................................................................................................1
Report Format ...................................................................................................................................................2
Data Considerations ..........................................................................................................................................3
Reporting of Compensation Data .....................................................................................................................3
Summary of Findings ............................................................................................................................................4 General Overview .............................................................................................................................................4
Country of Employment ...................................................................................................................................5
Number of Years Experience in Project Management .....................................................................................6
Position .............................................................................................................................................................7
Project Size .......................................................................................................................................................8
Detailed Findings ................................................................................................................................................10 Australia – All Respondents ...........................................................................................................................10
Belgium – All Respondents ............................................................................................................................18
Brazil – All Respondents ................................................................................................................................26
Canada – All Respondents ..............................................................................................................................34
China – All Respondents ................................................................................................................................42
Colombia – All Respondents ..........................................................................................................................50
France – All Respondents ...............................................................................................................................58
Germany – All Respondents ...........................................................................................................................66
Hong Kong – All Respondents .......................................................................................................................74
India – All Respondents ..................................................................................................................................82
Ireland – All Respondents ...............................................................................................................................90
Italy – All Respondents ...................................................................................................................................98
Japan – All Respondents ...............................................................................................................................106
Korea – All Respondents ..............................................................................................................................114
Mexico – All Respondents ............................................................................................................................130
Malaysia – All Respondents .........................................................................................................................122
Netherlands – All Respondents .....................................................................................................................138
New Zealand – All Respondents ..................................................................................................................146
Nigeria – All Respondents ............................................................................................................................154
Peru – All Respondents .................................................................................................................................162
Saudi Arabia – All Respondents ...................................................................................................................170
Singapore – All Respondents ........................................................................................................................178
Spain – All Respondents ...............................................................................................................................186
Sweden – All Respondents ...........................................................................................................................194
Switzerland – All Respondents .....................................................................................................................202

Project Management Salary Survey –Seventh Edition iv
Taiwan – All Respondents ............................................................................................................................210
United Arab Emirates – All Respondents .....................................................................................................218
United Kingdom – All Respondents .............................................................................................................226
United States – All Respondents ..................................................................................................................234
Appendix A – Demographic Comparisons by Country ....................................................................................242
Appendix B – Survey Instrument .....................................................................................................................276
Appendix C – Sampling Methodology .............................................................................................................390
Appendix D – Exchange Rates .........................................................................................................................392

Project Management Salary Survey –Seventh Edition 1
Introduction
About PMI Vital and forward thinking – focused on the needs of project management professionals worldwide; that’s the Project Management Institute of today. We’ve long been acknowledged as a pioneer in the field and now our membership represents a truly global community, with nearly 370,000 professionals, representing over 185 countries. PMI professionals come from virtually every major industry, including, aerospace, automotive, business management, construction, engineering, financial services, information technology, pharmaceuticals, healthcare and telecommunications.
About This Report The seventh edition of the PMI Project Management Salary Survey builds on features added for the sixth edition. The PMI Research Department continues to evolve this valuable offering in order to best serve the global project management community. The seventh edition report is based on self-reported salary information from over 30,000 project management professionals, bringing accuracy to the salary figures. The stratified random sampling methodology used for this study results in the ability to report meaningful compensation data for 29 countries (more than a 50% increase in the number of countries since the sixth edition).
Comparison of Number of Respondents
Fifth Edition Sixth Edition Seventh Edition
Australia 335 772 734 Belgium 0 0 275 Brazil 255 894 901 Canada 398 3567 3023 China 346 1909 1528 Colombia 0 0 369 France 253 339 456 Germany 266 828 742 Hong Kong 206 154 259 India 319 1553 1689 Ireland 0 0 386 Italy 396 508 678 Japan 262 1154 652 Malaysia 0 0 370 Mexico 0 293 369 Netherlands 0 0 303 New Zealand 215 282 442 Nigeria 0 0 203 Peru 0 0 244 Saudi Arabia 190 258 307 Singapore 186 380 624 South Korea 199 472 221 Spain 0 0 424 Sweden 0 0 397 Switzerland 0 0 304 Taiwan 199 309 230 United Arab Emirates 240 412 474 United Kingdom 242 824 647 United States 1134 19,916 13,572

Project Management Salary Survey –Seventh Edition 2
The report includes eight major position descriptions/levels in reporting the data. PMI worked with a third-party research firm, as well as with a volunteer group of PMI members, in order to make these descriptions as meaningful and “real-world” as possible. The use of these position descriptions to cross-tabulate the data throughout this report makes such information useful to everyone— from entry-level project managers to senior executives in project management.
In addition, the analysis of 15 demographic variables relating to compensation makes this report a must-have for project management employees and employers alike, not to mention compensation committees, human resource departments and executive recruiters interested in the project management profession.
Within each country, annualized salary information is shown across each of the following variables:
Position Description Gender Years Work Experience Department/Function Years Worked in Key Techniques Industry Years Worked in Project Management Type of Project Highest Formal Education Level
Obtained Number of Employees in Entire
Organization Degree in Project Management Average Project Team Size PMP® Status Typical Project Budget Training Per Year
The report also includes reported salary increases over the past 12 months and expected salary increases over the next 12 months, as well as information on the presence of career paths for project managers across the globe and employee benefits such as stock options, pension plans and vacation days.
Lastly, as a member benefit, PMI members can access a customized salary query at no charge by visiting the Members Area of the PMI website (http://www.PMI.org). This query has been enhanced to include the following salary variables:
Country Position Industry* Company size (annual revenues)* State and metropolitan area (U.S. salary queries only) Province (Canadian salary queries only) PMP® Status Option to exclude “self-employed” respondents (because self-employed data can skew results)
*Available for Australia, Brazil, Canada, China, Germany, India, Italy, Japan, Singapore, UK and U.S. salary queries only
Report Format Immediately following this section of the report is the Summary of Findings section, which includes a discussion of the key findings from this year’s survey.
After the Summary of Findings, you will find the Detailed Findings from the survey. This part of the report is organized by country. All compensation information in the Detailed Findings section is shown in the local currency of each country.
Finally, the following appendices are located near the end of the document:
Appendix A – Demographic Comparisons by Country Appendix B – Survey Instrument Appendix C – Sampling Methodology Appendix D – Exchange Rates
Project Management Salary Survey –Seventh Edition 3
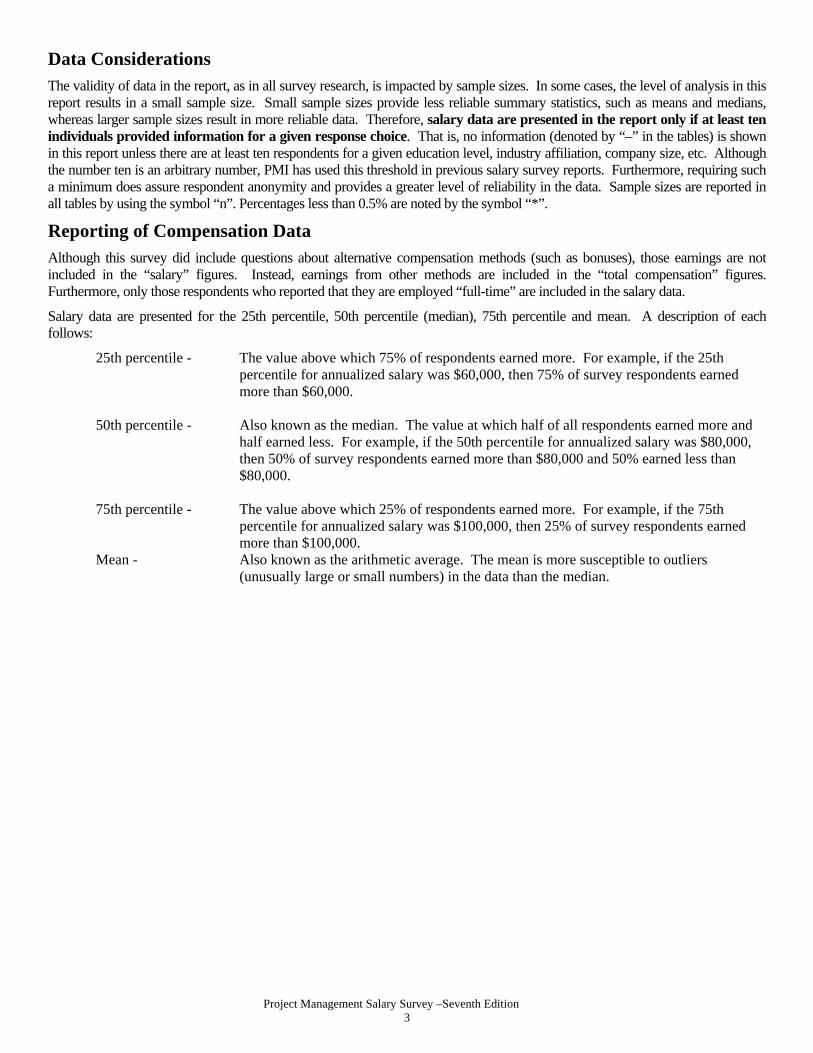
Data Considerations The validity of data in the report, as in all survey research, is impacted by sample sizes. In some cases, the level of analysis in this report results in a small sample size. Small sample sizes provide less reliable summary statistics, such as means and medians, whereas larger sample sizes result in more reliable data. Therefore, salary data are presented in the report only if at least ten individuals provided information for a given response choice. That is, no information (denoted by “–” in the tables) is shown in this report unless there are at least ten respondents for a given education level, industry affiliation, company size, etc. Although the number ten is an arbitrary number, PMI has used this threshold in previous salary survey reports. Furthermore, requiring such a minimum does assure respondent anonymity and provides a greater level of reliability in the data. Sample sizes are reported in all tables by using the symbol “n”. Percentages less than 0.5% are noted by the symbol “*”.
Reporting of Compensation Data Although this survey did include questions about alternative compensation methods (such as bonuses), those earnings are not included in the “salary” figures. Instead, earnings from other methods are included in the “total compensation” figures. Furthermore, only those respondents who reported that they are employed “full-time” are included in the salary data.
Salary data are presented for the 25th percentile, 50th percentile (median), 75th percentile and mean. A description of each follows:
25th percentile - The value above which 75% of respondents earned more. For example, if the 25th percentile for annualized salary was $60,000, then 75% of survey respondents earned more than $60,000.
50th percentile - Also known as the median. The value at which half of all respondents earned more and
half earned less. For example, if the 50th percentile for annualized salary was $80,000, then 50% of survey respondents earned more than $80,000 and 50% earned less than $80,000.
75th percentile - The value above which 25% of respondents earned more. For example, if the 75th
percentile for annualized salary was $100,000, then 25% of survey respondents earned more than $100,000.
Mean - Also known as the arithmetic average. The mean is more susceptible to outliers (unusually large or small numbers) in the data than the median.

Project Management Salary Survey –Seventh Edition 4
Summary of Findings
General Overview Most participants (71%) report that their total compensation (including salary, bonus and other forms of compensation) increased over the 12 months prior to completing the salary survey, with nearly one third of respondents reporting increases of at least 5% over that time period. This is impressive given the impact the sluggish global economy has had on overall employment figures.
The median annualized salary recorded in this survey, across all countries, roles and experience levels is $92,000 (USD). Approximately 75% of respondents earned at least $65,168 (USD), and the upper 25% earned at least $118,000 (USD). However, as one would expect, median salary varied greatly depending on a number of key demographic factors, the greatest of which are:
Country of employment
Number of years experience in project managementPosition/Role
Average size of projects managed, including average project budget and average project team size
A more detailed analysis of these factors follows.

Project Management Salary Survey –Seventh Edition 5
Country of Employment As seen in the table below, the median salary (when converted to U.S. Dollars using normal exchange rates) for someone in the project management profession varies widely from country to country. The country with the highest median salary ($160,409 USD) is Switzerland, whereas the country with the lowest median salary is China ($23,207 USD).
Annualized Salary (in USD) by Country Country n= Median Salary Exchange Rate
Switzerland 304 160,409 Australia 734 139,497 Germany 742 110,347 Netherlands 303 109,775 Belgium 275 108,750 United States 13,572 105,000 Ireland 386 101,635 Canada 3023 98,517 United Kingdom 647 96,384 New Zealand 442 91,109 Sweden 397 90,000 France 456 87,116 Japan 652 86,787 Italy 678 72,597 Spain 424 72,597 United Arab Emirates 474 71,880 Brazil 901 70,491 Singapore 624 68,426 Hong Kong 259 64,257 Saudi Arabia 307 63,997 South Korea 221 56,214 Colombia 369 49,269 Mexico 369 42,657 Malaysia 370 39,761 Peru 244 34,884 India 1689 31,390 Nigeria 203 29,580 Taiwan 230 29,256 China 1528 23,207

Project Management Salary Survey –Seventh Edition 6
Number of Years Experience in Project Management Although the total number of years of work experience does appear to impact salary, the stronger correlation is with the number of years a person has actually worked within the project management profession.
Not surprisingly, the difference in median salary varies by country. The most dramatic increase is seen in China. The median salary ranges from $18,566 (USD) for those just starting out in the project management field to $71,169 (USD) for those who have been in the field over 20 years. This represents an increase of over 280% from low-to-high experience in the field. The difference in median salary is not as striking in Sweden. For those with less than three years experience, the median salary is $71,150 compared with $100,000 (USD) for those practicing project management for 20 years or more.
Annualized Salary (in USD) by Years Experience in Project Management
<3 years 3-<5 years 5-<10 years 10 -< 15 years 15 - < 20 years 20+ years % Increase China $18,566 $18,566 $23,207 $34,037 $30,943 $71,169 283% Nigeria $15,945 $23,332 $33,552 $54,851 – – 244% Colombia $26,125 $30,371 $47,244 $64,117 $78,740 $67,492 158% Peru $20,167 $28,888 $35,974 $45,058 $50,872 – 152% Malaysia $25,514 $30,152 $35,855 $47,946 $59,642 $61,730 142% Brazil $48,382 $53,188 $65,685 $85,550 $92,279 $115,589 139% United Arab Emirates $54,726 $58,811 $70,791 $81,682 $78,414 $125,790 130% Spain $58,803 $55,536 $67,224 $87,116 $88,205 $126,318 115% New Zealand $57,979 $73,569 $86,140 $98,978 $115,957 $124,240 114% Mexico $31,140 $38,391 $40,951 $51,086 $64,317 $64,190 106% Belgium $69,693 $76,226 $100,114 $118,332 $129,585 $138,109 98% Singapore $52,134 $53,763 $68,630 $79,423 $89,605 $97,751 88% Saudi Arabia $31,999 $50,665 $63,997 $72,530 $86,663 $58,664 83% United Kingdom $65,863 $77,108 $86,746 $99,597 $110,842 $120,481 83% Ireland $73,322 $74,048 $94,375 $108,895 $123,414 $130,674 78% Hong Kong $44,980 $44,723 $64,257 $69,243 $77,108 – 71% Japan $65,462 $74,389 $86,787 $91,412 $99,185 $111,584 70% India $23,328 $24,664 $32,511 $43,397 $44,843 $39,238 68% Netherlands $83,268 $98,731 $116,154 $126,318 $137,933 66% Canada $72,591 $77,776 $90,221 $103,702 $115,109 $119,257 64% Germany $79,856 $87,116 $103,813 $116,154 $130,674 $130,674 64% Australia $108,378 $107,305 $131,985 $155,593 $166,323 $171,688 58% France $70,419 $70,419 $81,308 $89,163 $107,588 $108,895 55% Switzerland – $130,703 $154,230 $166,350 $190,114 $201,996 55% South Korea – $48,719 $51,529 $60,898 $65,583 $74,952 54% United States $78,950 $85,000 $97,000 $108,000 $116,000 $120,000 52% Italy – $63,242 $69,693 $79,856 $88,568 $92,924 47% Sweden $71,150 $75,000 $85,325 $95,000 $100,000 $100,000 41% Taiwan $25,251 $24,815 $30,432 $34,062 – – 35%

Project Management Salary Survey –Seventh Edition 7
Position Within the various levels of project managers, salary appears to increase with added responsibility. The rate of increase again varies by country. In Canada, the median salary increases from $79,902 (USD) for a Project Manager I, to $88,458 for a Project Management II, to $98,517 for a Project Manager III. In the Netherlands, Program Managers earn a median salary of $124,721 (USD), and Portfolio Managers earn over $13,000 (USD) more than Program Managers and $26,000 (USD) more than the highest level project managers.
Annualized Salary (in USD) by Position
Director of PM/ PMO
Portfolio Manager
Program Manager
Project Manager
III Project
Manager II Project
Manager I
Project Management
Specialist
Project Management Consultant
Australia $160,958 $171,688 $160,958 $144,862 $128,766 $107,305 $138,960 $139,497 Belgium $136,481 $128,496 $118,332 $110,396 $95,341 $82,512 – $108,895 Brazil $119,834 $96,124 $79,244 $76,899 $64,563 $58,315 $63,442 $64,403 Canada $117,066 $111,479 $105,776 $98,517 $88,458 $79,902 $82,961 $108,887 China $30,943 $36,822 $30,943 $27,849 $23,207 $20,113 $18,566 $18,566 Colombia $58,043 $67,492 $60,742 $51,547 $47,244 $31,060 $43,200 $51,125 France $113,251 $97,860 $94,375 $94,375 $79,856 $79,856 $87,116 $89,294 Germany $133,941 $123,414 $121,962 $116,154 $104,539 $94,375 $104,539 $116,154 Hong Kong – – $77,108 $69,397 $64,257 $53,076 $43,695 $50,316 India $44,843 $42,601 $37,444 $31,390 $26,906 $24,215 $29,148 $29,148 Ireland $117,606 $133,578 $108,169 $101,635 $91,472 $79,130 $101,635 $105,991 Italy $102,216 $94,375 $79,856 $72,597 $70,419 $62,433 $72,597 $65,337 Japan $105,384 $117,535 $99,185 $99,185 $86,787 $81,828 $81,208 $86,787 Malaysia $51,856 $60,504 $47,714 $43,221 $39,761 $29,821 – $30,318 Mexico $61,426 $61,853 $50,613 $45,114 $37,426 $33,273 $39,927 $42,998 Netherlands $109,361 $137,933 $124,721 $111,929 $97,030 $91,472 – $101,635 New Zealand $118,442 $118,028 $103,451 $95,251 $78,685 $65,256 $72,888 $113,473 Nigeria – – $46,664 $38,120 $38,120 $20,703 $27,604 $32,862 Peru – $54,506 $49,055 $43,605 $31,613 $21,802 $34,884 $30,523 Saudi Arabia $112,422 $81,597 $73,997 $79,997 $60,798 $46,531 $51,198 $62,238 Singapore $89,605 $127,077 $81,459 $73,314 $65,168 $57,421 $51,890 $71,725 South Korea $74,952 $71,204 $65,583 $61,367 $53,872 $54,340 $56,214 $47,782 Spain $100,183 $87,116 $85,011 $75,500 $68,023 $60,981 $66,789 $62,433 Sweden $110,000 $107,902 $100,000 $90,000 $82,760 $81,000 $90,000 $90,020 Switzerland $207,937 $178,232 $178,232 $167,538 $146,150 $133,080 $139,021 $157,438 Taiwan $34,829 – $33,087 $36,466 $28,385 $25,077 $26,992 $34,480 United Arab Emirates $123,666 $88,216 $80,048 $84,949 $70,791 $54,454 $65,345 $71,880 United Kingdom $128,513 $99,597 $109,236 $94,778 $83,533 $73,413 $85,140 $108,433 United States $127,000 $125,000 $115,000 $102,500 $92,975 $87,000 $87,000 $108,546

Project Management Salary Survey –Seventh Edition 8
Project Size The size of projects managed, in terms of average number of team members and average project budget, also appears to have a positive correlation with annual salary. For instance, in Taiwan, those managing larger teams (20 or more people) have a median salary that is 54% higher than those managing teams of 1to 4 people. Likewise, in Spain, those managing projects with budgets of $10 million or more earn 54% more than those with projects under $100,000 and 27% more than those with projects with budgets between $100,000 and $499,999.
Annualized Salary (in USD) by Average Number of Team Members
<5 5-<10 10-<15 15-<20 20+ % Increase Low-High
Hong Kong $60,000 $61,686 $64,257 $83,534 $105,381 76% Malaysia $31,809 $39,761 $35,785 $48,111 $49,702 56% Taiwan $27,166 $30,545 $38,207 – $41,794 54% Peru $29,978 $36,337 $33,067 $46,602 $44,695 49% China $21,660 $23,207 $23,207 $24,754 $30,943 43% Belgium $91,036 $111,000 $109,139 $123,414 $127,044 40% Singapore $58,651 $68,426 $71,277 $78,201 $81,459 39% South Korea $51,529 $53,872 $56,652 $65,583 $70,825 37% India $24,529 $26,906 $29,148 $29,372 $33,632 37% Brazil $61,583 $65,364 $73,150 $83,307 $83,756 36% Australia $126,430 $139,497 $142,179 $151,408 $171,688 36% Switzerland $143,655 $154,468 $157,141 $166,350 $187,144 30% Canada $88,146 $96,443 $98,517 $103,702 $114,072 29% Spain $65,337 $72,597 $76,226 $78,041 $83,214 27% United Arab Emirates $65,345 $75,147 $69,470 $56,077 $81,682 25% Japan $80,588 $84,308 $86,787 $99,185 $99,185 23% Ireland $91,472 $94,375 $106,717 $105,991 $111,653 22% Germany $101,635 $104,539 $114,703 $118,859 $123,414 21% Netherlands $101,635 $101,635 $101,635 $132,126 $122,688 21% United Kingdom $85,140 $90,360 $95,983 $108,673 $102,007 20% France $83,123 $81,308 $88,568 $99,094 $97,279 17% United States $98,500 $102,500 $106,000 $106,300 $115,000 17% Italy $72,234 $69,693 $72,597 $79,348 $83,486 16% Colombia $47,119 $49,831 $53,993 $53,993 $53,993 15% Sweden $85,930 $90,000 $90,000 $90,000 $95,000 11% New Zealand $91,938 $91,109 $99,392 $114,301 $100,220 9% Mexico $42,440 $42,742 $40,951 $48,800 $45,114 6% Nigeria $37,792 $29,576 $32,205 $29,576 $38,778 3% Saudi Arabia $63,997 $60,478 $63,997 $66,664 $63,997 0%

Project Management Salary Survey –Seventh Edition 9
Annualized Salary (in USD) by Average Project Budget (in USD)
< $100K $100K - $499K
$500K - $999K
$1 mil - $10 mil > $10 mil
% Increase Low-High
Nigeria $21,952 $33,523 $29,576 $35,163 $47,322 116% Colombia $36,558 $47,244 $50,619 $51,265 $65,523 79% Mexico $35,917 $40,540 $42,998 $48,117 $63,218 76% Brazil $54,470 $63,442 $72,733 $76,899 $89,715 65% Australia $107,305 $123,401 $139,336 $152,910 $172,075 60% Singapore $54,578 $63,620 $70,462 $77,386 $86,754 59% Peru $29,506 $31,613 $33,594 $45,027 $46,294 57% Hong Kong $51,405 $61,686 $64,257 $80,192 – 56% China $20,113 $23,207 $28,003 $29,628 $30,943 54% Spain $56,625 $68,720 $72,597 $79,856 $87,116 54% Malaysia $33,400 $33,718 $44,400 $39,761 $48,111 44% United States $88,000 $98,000 $103,000 $110,000 $126,200 43% Canada $83,843 $89,184 $96,443 $103,702 $119,257 42% New Zealand $74,544 $89,039 $93,594 $96,079 $103,533 39% Germany $94,375 $101,635 $108,895 $116,154 $130,674 38% Netherlands $93,650 $107,806 $101,635 $116,905 $129,222 38% India $26,906 $29,148 $31,390 $33,632 $36,771 37% Ireland $83,486 $94,375 $103,087 $108,895 $113,831 36% United Arab Emirates $55,543 $71,417 $73,513 $80,320 $74,330 34% Sweden $75,050 $90,000 $86,830 $92,550 $100,000 33% United Kingdom $80,320 $85,140 $89,156 $100,400 $104,416 30% South Korea $50,593 $51,529 $56,214 $60,898 $65,583 30% Japan $86,787 $82,882 $86,787 $93,606 $111,584 29% Belgium $104,539 $93,153 $109,948 $111,799 $133,578 28% Switzerland $147,933 $153,279 $157,438 $169,914 $184,173 24% Italy $65,337 $72,234 $72,597 $74,048 $81,308 24% France $78,767 $87,116 $87,116 $87,116 $96,553 23% Taiwan $25,077 $29,430 $31,346 $40,924 $27,863 11% Saudi Arabia $58,198 $65,693 $66,237 $60,801 $63,997 10%

Project Management Salary Survey –Seventh Edition 10
Detailed Findings
Australia – All Respondents
Total Compensation (in Australian Dollars)
Compensation n= 25th Percentile Median 75th Percentile Mean Salary 734 107,000 130,000 160,000 140,148 Total Compensation 734 114,000 142,000 175,000 151,657
Reported/Expected Change in Total Compensation over Past/Next 12 Months
Past 12 months n= Percent Next 12 months n= Percent Decreased 17 2% Decrease 11 1% Remained the same 181 25% Remain the same 134 18% Increased less than 1% 25 3% Increase less than 1% 17 2% Increased 1% to 2.9% 117 16% Increase 1% to 2.9% 134 18% Increased 3% to 3.9% 93 13% Increase 3% to 3.9% 133 18% Increased 4% to 4.9% 67 9% Increase 4% to 4.9% 73 10% Increased 5% to 6.9% 46 6% Increase 5% to 6.9% 92 13% Increased 7% to 9.9% 53 7% Increase 7% to 9.9% 44 6% Increased 10% to 14.9% 60 8% Increase 10% to 14.9% 60 8% Increased 15% to 19.9% 22 3% Increase 15% to 19.9% 12 2% Increased 20% to 24.9% 21 3% Increase 20% to 24.9% 13 2% Increased 25% to 29.9% 6 1% Increase 25% to 29.9% 5 1% Increased 30% or greater 26 4% Increase 30% or greater 6 1%
Annualized Salary by Position Description
Position n= Percent 25th Percentile Median 75th Percentile Mean Director of Project Management Office (PMO) 27 4% 130,000 150,000 200,000 162,494 Portfolio Manager 53 7% 140,000 160,000 180,000 162,784 Program Manager 138 19% 125,000 150,000 180,000 157,296 Project Manager III 204 28% 114,150 135,000 165,000 145,477 Project Manager II 137 19% 98,800 120,000 140,000 123,152 Project Manager I 69 9% 85,000 100,000 120,000 103,053 Project Management Specialist 42 6% 100,000 129,500 160,000 130,857 Project Management Consultant 64 9% 100,000 130,000 166,285 140,480
Annualized Salary by Years Work Experience
Years n= Percent 25th Percentile Median 75th Percentile Mean
Less than 3 years 2 * – – – – 3 to less than 5 years 9 1% – – – – 5 to less than 10 years 77 10% 86,000 102,000 125,000 106,331 10 to less than 15 years 152 21% 97,400 118,000 140,000 125,716 15 to less than 20 years 129 18% 115,000 140,000 160,000 141,531 20 years or more years 365 50% 120,000 147,150 180,000 153,963

Project Management Salary Survey –Seventh Edition 11
Australia – All Respondents
Annualized Salary by Technique Experience
Years n= Percent 25th Percentile Median 75th Percentile Mean Agile Project Management/Scrum
None 154 61% 54,000 73,000 94,500 80,566 1 to 5 years 82 33% 59,000 75,084 91,520 79,450 6 years or more 16 6% 55,500 76,000 92,892 77,917
Extreme Project Management None 193 78% 55,000 74,900 94,000 79,297 1 to 5 years 44 18% 54,000 71,000 90,760 79,232 6 years or more 11 4% 65,000 87,500 95,000 84,375
Process Based Project Management
None 90 35% 54,000 68,952 87,500 77,360 1 to 5 years 88 34% 50,500 65,165 90,000 73,474 6 years or more 79 31% 70,000 85,401 97,434 87,608 Event Chain Project Management
None 195 81% 55,296 73,000 94,500 81,070 1 to 5 years 31 13% 50,000 65,000 80,000 69,319 6 years or more 16 7% 70,000 83,595 90,811 78,677
Interactive Project Management None 141 57% 56,266 75,000 100,000 82,695 1 to 5 years 70 28% 54,000 65,500 87,500 73,634 6 years or more 38 15% 56,000 77,225 90,000 77,693 Incremental Project Management
None 152 61% 57,196 75,750 97,236 81,165 1 to 5 years 60 24% 52,916 65,000 90,000 71,673 6 years or more 36 15% 58,500 80,000 90,811 86,958
Project Portfolio Management None 104 40% 52,500 68,909 88,750 75,235 1 to 5 years 101 39% 57,000 73,000 90,000 78,187 6 years or more 54 21% 70,000 88,250 100,000 92,590

Project Management Salary Survey –Seventh Edition 12
Australia – All Respondents
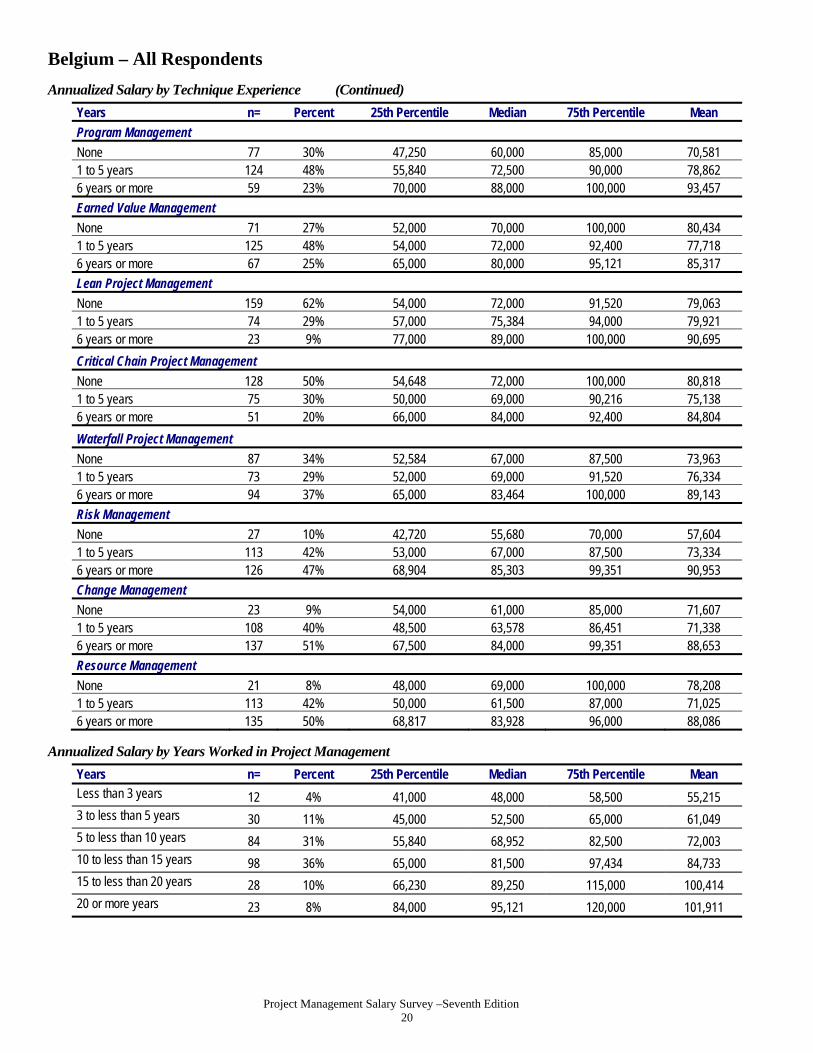
Annualized Salary by Technique Experience (Continued)
Years n= Percent 25th Percentile Median 75th Percentile Mean Program Management
None 77 30% 47,250 60,000 85,000 70,581 1 to 5 years 124 48% 55,840 72,500 90,000 78,862 6 years or more 59 23% 70,000 88,000 100,000 93,457
Earned Value Management None 71 27% 52,000 70,000 100,000 80,434 1 to 5 years 125 48% 54,000 72,000 92,400 77,718 6 years or more 67 25% 65,000 80,000 95,121 85,317
Lean Project Management
None 159 62% 54,000 72,000 91,520 79,063 1 to 5 years 74 29% 57,000 75,384 94,000 79,921 6 years or more 23 9% 77,000 89,000 100,000 90,695 Critical Chain Project Management
None 128 50% 54,648 72,000 100,000 80,818 1 to 5 years 75 30% 50,000 69,000 90,216 75,138 6 years or more 51 20% 66,000 84,000 92,400 84,804
Waterfall Project Management None 87 34% 52,584 67,000 87,500 73,963 1 to 5 years 73 29% 52,000 69,000 91,520 76,334 6 years or more 94 37% 65,000 83,464 100,000 89,143
Risk Management None 27 10% 42,720 55,680 70,000 57,604 1 to 5 years 113 42% 53,000 67,000 87,500 73,334 6 years or more 126 47% 68,904 85,303 99,351 90,953 Change Management
None 23 9% 54,000 61,000 85,000 71,607 1 to 5 years 108 40% 48,500 63,578 86,451 71,338 6 years or more 137 51% 67,500 84,000 99,351 88,653 Resource Management
None 21 8% 48,000 69,000 100,000 78,208 1 to 5 years 113 42% 50,000 61,500 87,000 71,025 6 years or more 135 50% 68,817 83,928 96,000 88,086
Annualized Salary by Years Worked in Project Management
Years n= Percent 25th Percentile Median 75th Percentile Mean Less than 3 years 34 5% 79,005 101,000 120,000 102,055 3 to less than 5 years 83 11% 85,000 100,000 122,000 105,161 5 to less than 10 years 253 34% 100,000 123,000 144,500 128,317 10 to less than 15 years 169 23% 120,000 145,000 170,000 149,473 15 to less than 20 years 119 16% 125,000 155,000 191,000 163,897 20 or more years 76 10% 140,000 160,000 200,000 176,858

Project Management Salary Survey –Seventh Edition 13
Australia – All Respondents
Annualized Salary by Highest Formal Education Level Obtained
Education n= Percent 25th Percentile Median 75th Percentile Mean High school degree 45 6% 118,000 132,000 150,000 137,849 Some college or Associate’s degree 104 14% 108,500 130,500 163,760 137,338 4-year college degree 306 42% 105,000 130,000 165,000 143,537 Master’s degree 230 31% 110,000 135,000 160,000 139,063 Doctoral degree 49 7% 104,983 126,600 150,000 132,152
Annualized Salary by Degree in Project Management
Degree n= Percent 25th Percentile Median 75th Percentile Mean
Have a degree in PM 121 17% 99,600 120,000 150,000 130,906 No degree in PM 611 83% 110,000 135,000 161,600 141,913
Annualized Salary by PMP® Status
Status n= Percent 25th Percentile Median 75th Percentile Mean
Have a PMP® Certification 431 59% 115,000 140,000 165,000 145,392 PMP for less than 1 year 7 2% – – – – PMP for 1 to less than 5 years 272 63% 105,000 130,000 156,000 135,967 PMP for 5 to less than 10 years 114 27% 123,000 146,250 175,000 155,007 PMP for 10 to less than 20 years 37 9% 141,000 175,000 200,000 183,854 PMP for 20 or more years 0 * – – – – Do not have a PMP® Certification 303 41% 100,000 125,000 150,000 132,688
Annualized Salary by Amount of Training Per Year
Employees n= Percent 25th Percentile Median 75th Percentile Mean Less than 5 days 346 47% 110,000 132,000 163,000 143,169 5 to 9 days 226 31% 110,000 136,500 165,000 140,625 10 days or more 158 22% 102,000 125,000 157,000 133,135
Annualized Salary by Gender
Gender n= Percent 25th Percentile Median 75th Percentile Mean Male 559 79% 110,000 135,000 165,000 142,896 Female 150 21% 95,327 120,000 150,000 128,819

Project Management Salary Survey –Seventh Edition 14
Australia – All Respondents
Annualized Salary by Department
Department n= Percent 25th Percentile Median 75th Percentile Mean Administration/ General Management
35 5% 90,000 130,000 155,000 139,491
Consulting 77 11% 120,000 140,000 178,000 148,687 Customer Service/ Public Relations
1 * – – – –
Engineering 31 4% 100,000 130,000 172,077 137,254 Finance 9 1% – – – – Human Resources 7 1% – – – – Information Technology/ Information Systems
211 29% 110,000 140,000 172,000 145,585
Operations/Manufacturing 26 4% 105,000 129,000 160,000 134,042 Project Management Department or PMO
278 38% 110,000 130,000 160,000 138,724
Quality Management 6 1% – – – – Research and Development 10 1% 87,500 92,500 110,000 98,984 Sales/Marketing 8 1% – – – – Supply Chain Management/Logistics 7 1% – – – –
Training/Education 3 * – – – – Other 22 3% 99,000 118,573 147,000 130,625
Annualized Salary by Industry
Industry n= Percent 25th Percentile Median 75th Percentile Mean
Aerospace 3 * – – – – Business services 14 2% 110,000 133,850 167,000 144,393 Construction 31 4% 110,000 130,000 170,000 144,795 Consulting 66 9% 110,000 133,500 154,000 138,230 Engineering 46 6% 102,000 130,000 170,000 136,388 Financial services 79 11% 120,000 140,000 170,000 145,927 Food and beverage 6 1% – – – – Government 43 6% 96,000 125,000 160,000 139,181 Healthcare 12 2% 96,075 112,500 145,500 124,177 Information technology 227 31% 105,000 130,000 160,000 138,894 Insurance 15 2% 110,000 130,000 196,000 145,764 Legal 2 * – – – – Manufacturing 15 2% 100,000 119,000 150,000 124,733 Pharmaceuticals 10 1% 105,000 110,000 143,000 121,350 Real Estate 4 1% – – – – Resources (Agriculture, Mining, etc.)
45 6% 130,000 165,000 200,000 176,990
Telecommunications 66 9% 100,000 130,000 155,000 133,210 Training/Education 10 1% 75,000 111,500 150,000 119,690 Utility 25 3% 125,000 140,000 160,000 147,648 Other 15 2% 90,000 100,000 120,000 105,989
Project Management Salary Survey –Seventh Edition 15
Australia – All Respondents
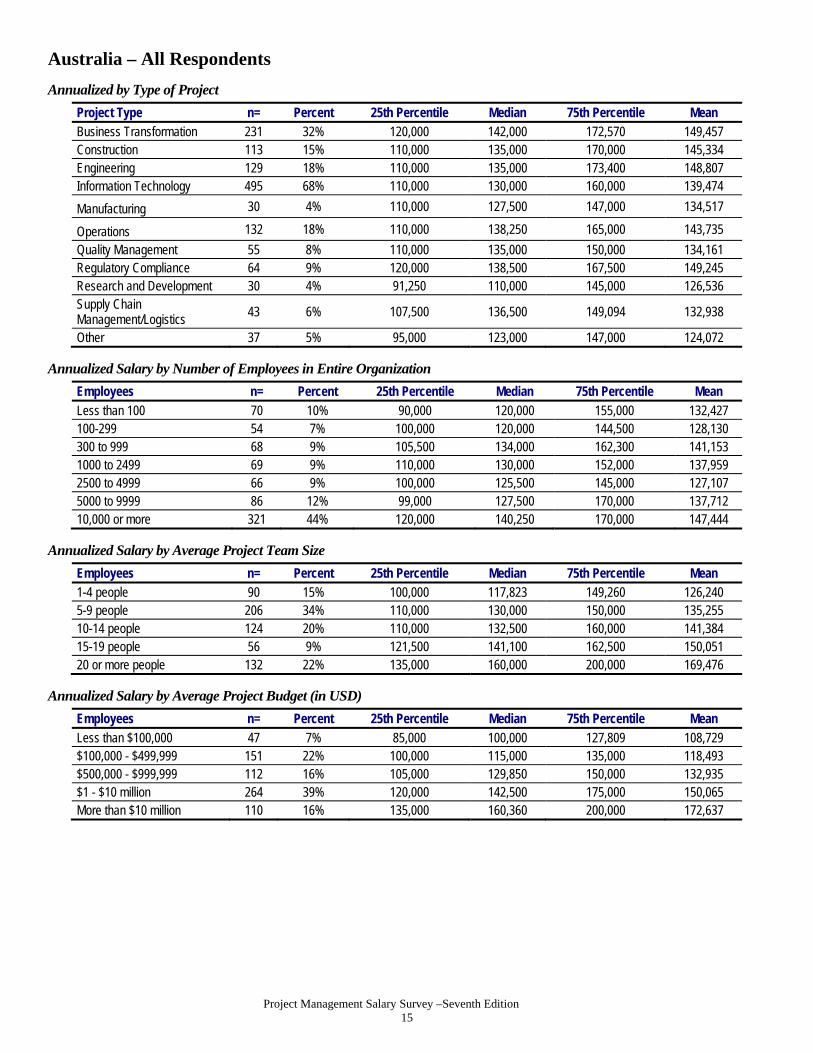
Annualized by Type of Project
Project Type n= Percent 25th Percentile Median 75th Percentile Mean Business Transformation 231 32% 120,000 142,000 172,570 149,457 Construction 113 15% 110,000 135,000 170,000 145,334 Engineering 129 18% 110,000 135,000 173,400 148,807 Information Technology 495 68% 110,000 130,000 160,000 139,474
Manufacturing 30 4% 110,000 127,500 147,000 134,517
Operations 132 18% 110,000 138,250 165,000 143,735
Quality Management 55 8% 110,000 135,000 150,000 134,161 Regulatory Compliance 64 9% 120,000 138,500 167,500 149,245 Research and Development 30 4% 91,250 110,000 145,000 126,536 Supply Chain Management/Logistics
43 6% 107,500 136,500 149,094 132,938
Other 37 5% 95,000 123,000 147,000 124,072
Annualized Salary by Number of Employees in Entire Organization
Employees n= Percent 25th Percentile Median 75th Percentile Mean
Less than 100 70 10% 90,000 120,000 155,000 132,427 100-299 54 7% 100,000 120,000 144,500 128,130 300 to 999 68 9% 105,500 134,000 162,300 141,153 1000 to 2499 69 9% 110,000 130,000 152,000 137,959 2500 to 4999 66 9% 100,000 125,500 145,000 127,107 5000 to 9999 86 12% 99,000 127,500 170,000 137,712 10,000 or more 321 44% 120,000 140,250 170,000 147,444
Annualized Salary by Average Project Team Size
Employees n= Percent 25th Percentile Median 75th Percentile Mean 1-4 people 90 15% 100,000 117,823 149,260 126,240 5-9 people 206 34% 110,000 130,000 150,000 135,255 10-14 people 124 20% 110,000 132,500 160,000 141,384 15-19 people 56 9% 121,500 141,100 162,500 150,051 20 or more people 132 22% 135,000 160,000 200,000 169,476
Annualized Salary by Average Project Budget (in USD)
Employees n= Percent 25th Percentile Median 75th Percentile Mean
Less than $100,000 47 7% 85,000 100,000 127,809 108,729 $100,000 - $499,999 151 22% 100,000 115,000 135,000 118,493 $500,000 - $999,999 112 16% 105,000 129,850 150,000 132,935 $1 - $10 million 264 39% 120,000 142,500 175,000 150,065 More than $10 million 110 16% 135,000 160,360 200,000 172,637

Project Management Salary Survey –Seventh Edition 16
Australia – All Respondents
Project Management Career Path within Organization
n= Percent Yes – Clearly defined/in writing 193 26% Yes – Informal 346 47% No 164 22% Don’t know 29 4%
Project Management Career Path Connected to Roles in Upper Management
n= Percent Yes – Clearly defined/in writing 127 24% Yes – Informal 263 49% No 102 19% Don’t know 46 9%
Defined Set of Performance Skills for Project Managers within Organization
n= Percent Yes – Clearly defined/in writing 362 50% Yes – Informal 210 29% No 128 18% Don’t know 28 4%
Equities Offered in Past Year by Position Description
Stock Options Stock (i.e., Shares) Neither n= Percent n= Percent n= Percent
Total 25 3% 71 10% 637 87% Director of Project Management Office (PMO) 0 * 3 11% 24 89% Portfolio Manager 0 * 10 19% 42 81% Program Manager 13 9% 20 14% 107 78% Project Manager III 3 1% 14 7% 184 92% Project Manager II 4 3% 14 10% 119 87% Project Manager I 1 1% 3 4% 66 96% Project Management Specialist 1 2% 4 10% 36 88% Project Management Consultant 3 5% 3 5% 59 92%
Employee Benefits Offered by Position Description
Company
Car/Allowance Cell Phone Usage Paid Life Insurance n= Percent n= Percent n= Percent
Total 96 13% 431 59% 130 18% Director of Project Management Office (PMO) 4 15% 22 81% 9 33% Portfolio Manager 9 17% 45 87% 11 21% Program Manager 22 16% 89 64% 29 21% Project Manager III 25 12% 111 55% 32 16% Project Manager II 20 15% 76 56% 22 16% Project Manager I 5 7% 34 49% 11 16% Project Management Specialist 2 5% 16 39% 8 20% Project Management Consultant 9 14% 38 59% 8 13%

Project Management Salary Survey –Seventh Edition 17
Australia – All Respondents
Mean Number of Vacation Days by Position Description
After 1 Year After 10 Years n= Mean n= Mean
Total 725 17.6 636 25.0 Director of Project Management Office (PMO) 27 20.3 24 28.8 Portfolio Manager 52 19.0 47 25.1 Program Manager 137 18.0 119 25.9 Project Manager III 202 16.3 176 24.2 Project Manager II 135 17.9 123 25.5 Project Manager I 68 17.3 58 25.9 Project Management Specialist 41 17.0 34 24.5 Project Management Consultant 63 18.4 55 22.6
Pension Plans Offered by Position Description
Defined Benefit
Plans Defined
Contribution Plans Other Pension
Plans n= Percent n= Percent n= Percent
Total 111 15% 404 56% 53 7% Director of Project Management Office (PMO) 10 37% 9 33% 4 15% Portfolio Manager 11 21% 33 62% 1 2% Program Manager 17 12% 80 58% 14 10% Project Manager III 28 14% 107 53% 13 6% Project Manager II 16 12% 85 63% 7 5% Project Manager I 10 14% 33 48% 6 9% Project Management Specialist 9 22% 25 61% 4 10% Project Management Consultant 10 16% 32 52% 4 6%
Mean Hours Worked by Position Description
Hours Expected
Actual Hours Worked
n= Mean n= Mean Total 723 38.9 717 46.7 Director of Project Management Office (PMO) 27 38.8 26 50.5 Portfolio Manager 53 38.6 52 49.2 Program Manager 138 38.8 138 48.2 Project Manager III 198 39.1 196 45.8 Project Manager II 136 38.7 135 44.7 Project Manager I 69 38.9 66 45.5 Project Management Specialist 38 39.9 41 48.1 Project Management Consultant 64 39.2 63 47.5

Project Management Salary Survey –Seventh Edition 18
Belgium – All Respondents Total Compensation (in European Union Euros)
Compensation n= 25th Percentile Median 75th Percentile Mean
Salary 275 56,266 74,900 94,000 80,006
Total Compensation 275 63,000 83,000 106,000 88,913
Reported/Expected Change in Total Compensation over Past/Next 12 Months
Past 12 months n= Percent Next 12 months n= Percent
Decreased 15 5% Decrease 1 *
Remained the same 59 21% Remain the same 60 22%
Increased less than 1% 16 6% Increase less than 1% 17 6%
Increased 1% to 2.9% 85 31% Increase 1% to 2.9% 100 36%
Increased 3% to 3.9% 32 12% Increase 3% to 3.9% 41 15%
Increased 4% to 4.9% 17 6% Increase 4% to 4.9% 13 5%
Increased 5% to 6.9% 13 5% Increase 5% to 6.9% 15 5%
Increased 7% to 9.9% 10 4% Increase 7% to 9.9% 9 3%
Increased 10% to 14.9% 14 5% Increase 10% to 14.9% 13 5%
Increased 15% to 19.9% 4 1% Increase 15% to 19.9% 2 1%
Increased 20% to 24.9% 7 3% Increase 20% to 24.9% 1 *
Increased 25% to 29.9% 1 * Increase 25% to 29.9% 2 1%
Increased 30% or greater 2 1% Increase 30% or greater 1 *
Annualized Salary by Position Description
Position n= Percent 25th Percentile Median 75th Percentile Mean Director of Project Management Office (PMO) 13 5% 74,900 94,000 108,420 92,825
Portfolio Manager 19 7% 65,000 88,500 100,000 90,145
Program Manager 46 17% 67,500 81,500 90,000 84,328
Project Manager III 87 32% 59,800 76,034 98,000 80,446
Project Manager II 58 21% 53,000 65,665 90,000 72,942
Project Manager I 18 7% 48,000 56,829 65,000 59,799 Project Management Specialist 9 3% – – – – Project Management Consultant 25 9% 50,000 75,000 100,000 92,449
Annualized Salary by Years Work Experience
Years n= Percent 25th Percentile Median 75th Percentile Mean
Less than 3 years 1 * – – – –
3 to less than 5 years 9 3% – – – –
5 to less than 10 years 30 11% 41,064 49,100 65,000 57,612
10 to less than 15 years 62 23% 53,000 63,900 79,344 70,539
15 to less than 20 years 74 27% 60,000 79,000 94,000 81,371
20 years or more years 99 36% 70,000 89,000 108,420 94,797

Project Management Salary Survey –Seventh Edition 19
Belgium – All Respondents
Annualized Salary by Technique Experience
Years n= Percent 25th Percentile Median 75th Percentile Mean
Agile Project Management/Scrum
None 154 61% 54,000 73,000 94,500 80,566 1 to 5 years 82 33% 59,000 75,084 91,520 79,450 6 years or more 16 6% 55,500 76,000 92,892 77,917
Extreme Project Management
None 193 78% 55,000 74,900 94,000 79,297 1 to 5 years 44 18% 54,000 71,000 90,760 79,232 6 years or more 11 4% 65,000 87,500 95,000 84,375
Process Based Project Management
None 90 35% 54,000 68,952 87,500 77,360 1 to 5 years 88 34% 50,500 65,165 90,000 73,474 6 years or more 79 31% 70,000 85,401 97,434 87,608
Event Chain Project Management
None 195 81% 55,296 73,000 94,500 81,070 1 to 5 years 31 13% 50,000 65,000 80,000 69,319 6 years or more 16 7% 70,000 83,595 90,811 78,677
Interactive Project Management
None 141 57% 56,266 75,000 100,000 82,695
1 to 5 years 70 28% 54,000 65,500 87,500 73,634
6 years or more 38 15% 56,000 77,225 90,000 77,693
Incremental Project Management
None 152 61% 57,196 75,750 97,236 81,165
1 to 5 years 60 24% 52,916 65,000 90,000 71,673
6 years or more 36 15% 58,500 80,000 90,811 86,958
Project Portfolio Management
None 104 40% 52,500 68,909 88,750 75,235
1 to 5 years 101 39% 57,000 73,000 90,000 78,187
6 years or more 54 21% 70,000 88,250 100,000 92,590
Project Management Salary Survey –Seventh Edition 20
Belgium – All Respondents
Annualized Salary by Technique Experience (Continued)
Years n= Percent 25th Percentile Median 75th Percentile Mean
Program Management
None 77 30% 47,250 60,000 85,000 70,581 1 to 5 years 124 48% 55,840 72,500 90,000 78,862 6 years or more 59 23% 70,000 88,000 100,000 93,457
Earned Value Management
None 71 27% 52,000 70,000 100,000 80,434 1 to 5 years 125 48% 54,000 72,000 92,400 77,718 6 years or more 67 25% 65,000 80,000 95,121 85,317
Lean Project Management
None 159 62% 54,000 72,000 91,520 79,063 1 to 5 years 74 29% 57,000 75,384 94,000 79,921 6 years or more 23 9% 77,000 89,000 100,000 90,695
Critical Chain Project Management
None 128 50% 54,648 72,000 100,000 80,818 1 to 5 years 75 30% 50,000 69,000 90,216 75,138 6 years or more 51 20% 66,000 84,000 92,400 84,804
Waterfall Project Management
None 87 34% 52,584 67,000 87,500 73,963 1 to 5 years 73 29% 52,000 69,000 91,520 76,334 6 years or more 94 37% 65,000 83,464 100,000 89,143
Risk Management
None 27 10% 42,720 55,680 70,000 57,604 1 to 5 years 113 42% 53,000 67,000 87,500 73,334 6 years or more 126 47% 68,904 85,303 99,351 90,953
Change Management
None 23 9% 54,000 61,000 85,000 71,607 1 to 5 years 108 40% 48,500 63,578 86,451 71,338 6 years or more 137 51% 67,500 84,000 99,351 88,653
Resource Management
None 21 8% 48,000 69,000 100,000 78,208 1 to 5 years 113 42% 50,000 61,500 87,000 71,025 6 years or more 135 50% 68,817 83,928 96,000 88,086
Annualized Salary by Years Worked in Project Management
Years n= Percent 25th Percentile Median 75th Percentile Mean Less than 3 years 12 4% 41,000 48,000 58,500 55,215 3 to less than 5 years 30 11% 45,000 52,500 65,000 61,049 5 to less than 10 years 84 31% 55,840 68,952 82,500 72,003 10 to less than 15 years 98 36% 65,000 81,500 97,434 84,733 15 to less than 20 years 28 10% 66,230 89,250 115,000 100,414 20 or more years 23 8% 84,000 95,121 120,000 101,911

Project Management Salary Survey –Seventh Edition 21
Belgium – All Respondents
Annualized Salary by Highest Formal Education Level Obtained
Education n= Percent 25th Percentile Median 75th Percentile Mean
High school degree 12 4% 61,050 69,500 79,500 71,349 Some college or Associate's degree 20 7% 62,500 79,000 93,892 87,443
4-year college degree 33 12% 54,000 67,620 99,351 78,630
Master's degree 169 61% 55,680 72,000 90,000 78,206
Doctoral degree 41 15% 60,000 84,000 100,000 87,443
Annualized Salary by Degree in Project Management
Degree n= Percent 25th Percentile Median 75th Percentile Mean
Have a degree in PM 49 18% 53,000 62,000 90,000 78,609
No degree in PM 225 82% 58,400 75,168 94,500 80,372
Annualized Salary by PMP® Status
Status n= Percent 25th Percentile Median 75th Percentile Mean
Have a PMP® Certification 197 72% 62,000 78,000 94,000 83,134
PMP for less than 1 year 6 3% – – – –
PMP for 1 to less than 5 years
132 67% 60,000 74,000 94,250 81,787
PMP for 5 to less than 10 years 49 25% 67,620 82,000 90,000 84,749
PMP for 10 to less than 20 years 9 5% – – – –
PMP for 20 or more years 0 * – – – –
Do not have a PMP® Certification 78 28% 49,000 60,000 90,000 72,107
Annualized Salary by Amount of Training Per Year
Employees n= Percent 25th Percentile Median 75th Percentile Mean
Less than 5 days 101 37% 54,000 72,000 90,350 78,904
5 to 9 days 86 32% 66,000 79,000 95,000 83,576
10 days or more 86 32% 51,600 67,459 94,500 77,441
Annualized Salary by Gender
Gender n= Percent 25th Percentile Median 75th Percentile Mean
Male 226 85% 57,392 76,725 96,000 81,761
Female 40 15% 54,648 62,000 84,500 73,183

Project Management Salary Survey –Seventh Edition 22
Belgium – All Respondents
Annualized Salary by Department
Department n= Percent 25th Percentile Median 75th Percentile Mean Administration/ General Management
23 8% 53,000 70,000 100,000 81,100
Consulting 27 10% 50,000 66,000 99,351 79,658
Customer Service/ Public Relations
5 2% – – – –
Engineering 6 2% – – – –
Finance 2 1% – – – –
Human Resources 1 * – – – –
Information Technology/ Information Systems
91 33% 58,000 76,450 94,500 81,494
Operations/Manufacturing 4 1% – – – – Project Management Department or PMO
87 32% 55,000 70,000 89,520 77,114
Quality Management 3 1% – – – –
Research and Development 7 3% – – – –
Sales/Marketing 9 3% – – – –
Supply Chain Management/Logistics
2 1% – – – –
Training/Education 2 1% – – – –
Other 4 1% – – – –
Annualized Salary by Industry
Industry n= Percent 25th Percentile Median 75th Percentile Mean Aerospace 6 2% – – – – Business services 6 2% – – – – Construction 3 1% – – – – Consulting 32 12% 50,000 76,125 110,000 86,926 Engineering 14 5% 64,155 80,000 95,355 81,434 Financial Services 23 8% 60,000 75,000 85,000 81,224 Food and Beverage 2 1% – – – – Government 18 7% 48,000 67,400 95,000 75,818 Healthcare 4 1% – – – – Information Technology 83 30% 58,600 72,000 91,520 78,996 Insurance 4 1% – – – – Legal 0 * – – – – Manufacturing 16 6% 66,000 88,250 98,000 83,315 Pharmaceuticals 12 4% 60,900 99,000 126,000 95,342 Real Estate 2 1% – – – – Resources (Agriculture, Mining, etc.) 3 1% – – – –
Telecommunications 36 13% 61,700 70,200 85,208 74,593 Training/Education 2 1% – – – – Utility 2 1% – – – – Other 7 3% – – – –

Project Management Salary Survey –Seventh Edition 23
Belgium – All Respondents
Annualized by Type of Project
Project Type n= Percent 25th Percentile Median 75th Percentile Mean Business Transformation 75 27% 65,000 85,000 95,000 89,587 Construction 21 8% 53,000 65,000 94,500 77,027 Engineering 44 16% 60,500 80,000 100,000 83,260 Information Technology 200 73% 56,000 73,625 94,750 81,360 Manufacturing 15 5% 46,000 87,000 108,420 85,939 Operations 56 20% 63,578 80,000 94,250 85,090 Quality Management 34 12% 65,000 85,500 110,000 91,450 Regulatory Compliance 19 7% 65,000 89,900 100,000 93,977 Research and Development 19 7% 43,000 70,400 90,000 71,087 Supply Chain Management/Logistics 22 8% 62,000 77,500 87,500 76,236
Other 22 8% 62,000 85,000 96,000 91,013
Annualized Salary by Number of Employees in Entire Organization
Employees n= Percent 25th Percentile Median 75th Percentile Mean Less than 100 42 15% 56,266 100,000 120,000 99,423 100 to 299 19 7% 41,000 57,600 72,000 62,224 300 to 999 21 8% 50,000 64,155 80,000 65,647 1,000 to 2,499 27 10% 60,000 68,000 80,000 73,253 2,500 to 4,999 10 4% 56,000 84,500 98,000 88,913 5,000 to 9,999 17 6% 53,000 75,000 95,000 76,209 10,000 or more 139 51% 59,800 76,450 90,000 79,875
Annualized Salary by Average Project Team Size
Employees n= Percent 25th Percentile Median 75th Percentile Mean
1-4 people 14 6% 50,000 62,700 72,000 72,466
5-9 people 81 38% 57,600 76,450 95,000 78,970
10-14 people 53 25% 56,000 75,168 90,350 77,438
15-19 people 23 11% 65,000 85,000 95,121 91,571
20 or more people 45 21% 75,000 87,500 118,000 99,207
Annualized Salary by Average Project Budget (in USD)
Budget n= Percent 25th Percentile Median 75th Percentile Mean
Less than $100,000 15 6% 43,200 72,000 110,000 74,963
$100,000 to $499,999 63 25% 49,000 64,158 83,928 70,247
$500,000 to $999,999 54 22% 59,800 75,725 86,000 76,862
$1 million to $10 million 93 37% 62,460 77,000 99,351 84,696
More than $10 million 26 10% 75,600 92,000 125,000 103,515
Project Management Salary Survey –Seventh Edition 24
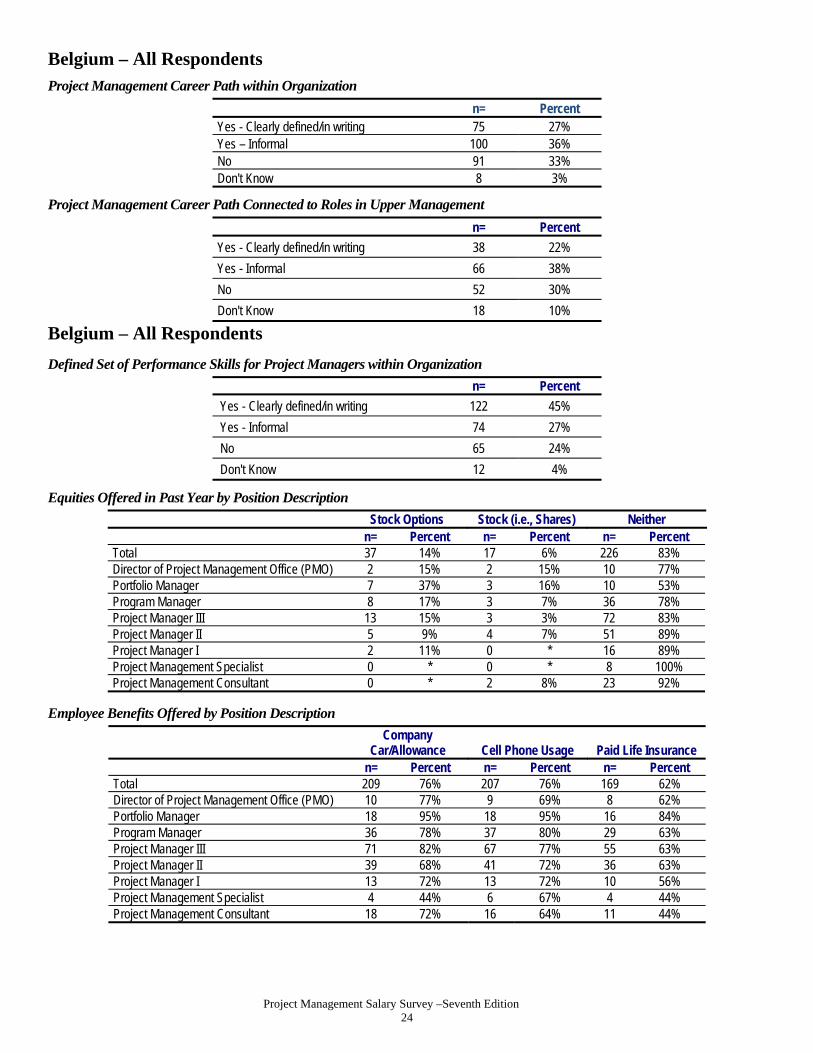
Belgium – All Respondents Project Management Career Path within Organization
n= Percent Yes - Clearly defined/in writing 75 27% Yes – Informal 100 36% No 91 33% Don't Know 8 3%
Project Management Career Path Connected to Roles in Upper Management
n= Percent
Yes - Clearly defined/in writing 38 22%
Yes - Informal 66 38%
No 52 30%
Don't Know 18 10%
Belgium – All Respondents
Defined Set of Performance Skills for Project Managers within Organization
n= Percent
Yes - Clearly defined/in writing 122 45%
Yes - Informal 74 27%
No 65 24%
Don't Know 12 4%
Equities Offered in Past Year by Position Description
Stock Options Stock (i.e., Shares) Neither n= Percent n= Percent n= Percent
Total 37 14% 17 6% 226 83% Director of Project Management Office (PMO) 2 15% 2 15% 10 77% Portfolio Manager 7 37% 3 16% 10 53% Program Manager 8 17% 3 7% 36 78% Project Manager III 13 15% 3 3% 72 83% Project Manager II 5 9% 4 7% 51 89% Project Manager I 2 11% 0 * 16 89% Project Management Specialist 0 * 0 * 8 100% Project Management Consultant 0 * 2 8% 23 92%
Employee Benefits Offered by Position Description
Company
Car/Allowance Cell Phone Usage Paid Life Insurance n= Percent n= Percent n= Percent
Total 209 76% 207 76% 169 62% Director of Project Management Office (PMO) 10 77% 9 69% 8 62% Portfolio Manager 18 95% 18 95% 16 84% Program Manager 36 78% 37 80% 29 63% Project Manager III 71 82% 67 77% 55 63% Project Manager II 39 68% 41 72% 36 63% Project Manager I 13 72% 13 72% 10 56% Project Management Specialist 4 44% 6 67% 4 44% Project Management Consultant 18 72% 16 64% 11 44%

Project Management Salary Survey –Seventh Edition 25
Belgium – All Respondents
Mean Number of Vacation Days by Position Description
After 1 Year After 10 Years
n= Mean n= Mean
Total 263 24.5 258 26.6
Director of Project Management Office (PMO) 13 25.6 13 27.8
Portfolio Manager 18 30.8 18 32.2
Program Manager 45 24.9 45 27.5
Project Manager III 82 23.1 85 25.8
Project Manager II 54 25.1 49 27.0
Project Manager I 18 25.4 16 27.5
Project Management Specialist 9 22.9 7 21.9
Project Management Consultant 24 21.8 25 23.0
Pension Plans Offered by Position Description
Defined Benefit
Plans Defined Contribution
Plans Other Pension Plans n= Percent n= Percent n= Percent
Total 130 48% 103 38% 38 14% Director of Project Management Office (PMO)
4 31% 7 54% 2 15%
Portfolio Manager 12 63% 7 37% 1 5% Program Manager 22 48% 20 43% 0 * Project Manager III 38 44% 36 41% 16 18% Project Manager II 29 51% 16 28% 11 19% Project Manager I 9 50% 8 44% 3 17% Project Management Specialist 6 75% 2 25% 0 * Project Management Consultant 10 40% 7 28% 5 20%
Mean Hours Worked by Position Description
Hours Expected Actual Hours
Worked n= Mean n= Mean Total 274 38.8 272 46.8 Director of Project Management Office (PMO) 13 38.5 13 47.3 Portfolio Manager 19 38.9 19 50.4 Program Manager 46 38.7 46 47.3 Project Manager III 87 38.9 86 47.1 Project Manager II 57 38.8 57 46.1 Project Manager I 18 38.5 18 43.8 Project Management Specialist 9 38.9 9 43.9 Project Management Consultant 25 39.4 24 47.1

Project Management Salary Survey –Seventh Edition 26
Brazil – All Respondents
Total Compensation (in Brazilian Reais)
Compensation n= 25th Percentile Median 75th Percentile Mean Salary 901 80,000 110,000 150,000 124,618 Total Compensation 901 89,000 120,000 171,400 140,284
Reported/Expected Change in Total Compensation over Past/Next 12 Months
Past 12 Months n= Percent Next 12 Months n= Percent Decreased 27 3% Decrease 4 * Remained the same 140 16% Remain the same 91 10% Increased less than 1% 15 2% Increase less than 1% 3 * Increased 1% to 2.9% 47 5% Increase 1% to 2.9% 33 4% Increased 3% to 3.9% 60 7% Increase 3% to 3.9% 44 5% Increased 4% to 4.9% 76 8% Increase 4% to 4.9% 72 8% Increased 5% to 6.9% 175 19% Increase 5% to 6.9% 171 19% Increased 7% to 9.9% 125 14% Increase 7% to 9.9% 136 15% Increased 10% to 14.9% 93 10% Increase 10% to 14.9% 174 19% Increased 15% to 19.9% 38 4% Increase 15% to 19.9% 58 6% Increased 20% to 24.9% 31 3% Increase 20% to 24.9% 45 5% Increased 25% to 29.9% 20 2% Increase 25% to 29.9% 20 2% Increased 30% or greater 54 6% Increase 30% or greater 50 6%
Annualized Salary by Position Description
Position n= Percent 25th Percentile Median 75th Percentile Mean Director of Project Management Office (PMO)
53 6% 136,000 187,000 230,000 191,558
Portfolio Manager 73 8% 100,000 150,001 195,000 160,789 Program Manager 132 15% 98,000 123,660 166,800 135,625 Project Manager III 168 19% 89,340 120,000 156,000 128,098 Project Manager II 166 18% 72,000 100,750 130,000 108,726 Project Manager I 116 13% 72,000 91,000 112,200 96,291 Project Management Specialist
89 10% 65,000 99,000 126,000 108,128
Project Management Consultant
104 12% 75,375 100,500 137,000 116,598
Annualized Salary by Years Work Experience
Years n= Percent 25th Percentile Median 75th Percentile Mean
Less than 3 years 5 1% – – – – 3 to less than 5 years 12 1% 52,450 70,000 79,000 68,775 5 to less than 10 years 133 15% 66,642 84,000 114,800 94,382 10 to less than 15 years 263 29% 80,000 103,600 132,000 111,746 15 to less than 20 years 177 20% 86,400 119,800 166,000 127,939 20 years or more years 311 35% 96,000 130,000 187,000 148,848

Project Management Salary Survey –Seventh Edition 27
Brazil – All Respondents
Annualized Salary by Technique Experience
Years n= Percent 25th Percentile Median 75th Percentile Mean Agile Project Management/Scrum
None 509 60% 81,000 112,000 156,000 126,733 1 to 5 years 262 31% 74,400 102,000 139,999 114,205 6 years or more 73 9% 101,000 125,000 150,000 138,255
Extreme Project Management
None 534 64% 80,000 110,000 150,001 123,816 1 to 5 years 217 26% 78,650 105,000 143,000 117,344 6 years or more 89 11% 99,872 120,000 156,000 135,305 Process Based Project Management
None 177 21% 78,350 110,880 156,001 126,847 1 to 5 years 362 42% 76,800 98,850 130,340 110,920 6 years or more 314 37% 93,600 120,000 166,667 136,997
Event Chain Project Management
None 506 61% 78,480 108,000 150,000 123,208 1 to 5 years 210 25% 79,000 104,000 138,000 114,244 6 years or more 111 13% 99,999 133,388 179,999 144,950
Interactive Project Management None 321 38% 84,000 109,400 156,000 125,136 1 to 5 years 299 36% 71,999 100,000 136,237 112,261 6 years or more 217 26% 90,000 120,000 156,000 133,856 Incremental Project Management
None 384 46% 84,000 112,000 156,000 127,269 1 to 5 years 275 33% 72,800 100,000 130,000 110,432 6 years or more 180 21% 90,325 120,000 159,950 136,696
Project Portfolio Management None 330 39% 71,500 100,000 130,000 111,312 1 to 5 years 356 42% 84,000 110,000 144,750 120,795 6 years or more 162 19% 105,000 141,000 195,000 155,109

Project Management Salary Survey –Seventh Edition 28
Brazil – All Respondents
Annualized Salary by Technique Experience (Continued)
Years n= Percent 25th Percentile Median 75th Percentile Mean Program Management
None 241 28% 72,000 94,600 123,500 107,864 1 to 5 years 389 46% 84,000 110,000 150,000 120,345 6 years or more 221 26% 100,800 133,001 188,000 147,972
Earned Value Management None 220 26% 76,000 97,750 132,500 111,142 1 to 5 years 432 51% 78,825 110,001 150,000 122,276 6 years or more 196 23% 100,000 124,380 180,000 143,802 Lean Project Management
None 446 54% 80,000 110,000 152,500 124,891 1 to 5 years 269 32% 79,000 104,000 143,000 116,676 6 years or more 115 14% 85,000 120,000 160,800 133,731
Critical Chain Project Management None 341 40% 81,250 108,000 156,001 126,149 1 to 5 years 335 40% 75,000 103,600 139,999 114,718 6 years or more 167 20% 93,574 120,000 156,000 136,402
Waterfall Project Management None 440 52% 83,600 115,355 157,236 128,691 1 to 5 years 218 26% 72,800 95,000 123,760 106,481 6 years or more 182 22% 90,000 120,000 165,000 134,854
Risk Management None 103 12% 65,000 95,000 135,000 107,345 1 to 5 years 455 53% 77,000 102,000 140,000 114,446 6 years or more 303 35% 100,000 126,000 180,000 144,087
Change Management None 76 9% 71,000 100,000 145,000 116,238 1 to 5 years 426 50% 75,300 100,000 130,000 111,033 6 years or more 346 41% 96,000 125,494 174,200 141,401
Resource Management None 79 9% 68,000 95,000 130,000 107,785 1 to 5 years 371 44% 75,000 100,000 133,000 110,501 6 years or more 397 47% 96,000 122,400 172,000 140,685
Annualized Salary by Years Worked in Project Management
Years n= Percent 25th Percentile Median 75th Percentile Mean Less than 3 years 37 4% 59,999 75,500 97,500 79,549 3 to less than 5 years 102 11% 62,000 83,000 104,000 89,992 5 to less than 10 years 414 46% 78,000 102,500 130,000 111,399 10 to less than 15 years 226 25% 102,000 133,500 180,000 146,997 15 to less than 20 years 69 8% 100,000 144,000 200,000 154,597 20 or more years 53 6% 120,000 180,376 250,000 191,524

Project Management Salary Survey –Seventh Edition 29
Brazil – All Respondents
Annualized Salary by Highest Formal Education Level Obtained
Education n= Percent 25th Percentile Median 75th Percentile Mean High school degree 24 3% 95,750 108,500 140,000 120,791 Some college or Associate's degree
13 1% 100,000 120,000 150,001 138,588
4-year college degree 195 22% 71,500 91,600 125,987 107,982 Master's degree 520 58% 84,000 114,800 156,000 128,970 Doctoral degree 149 17% 88,400 120,000 165,600 130,600
Annualized Salary by Degree in Project Management
Degree n= Percent 25th Percentile Median 75th Percentile Mean
Have a degree in PM 394 44% 76,999 106,700 150,000 121,334 No degree in PM 505 56% 84,000 113,499 151,540 126,934
Annualized Salary by PMP® Status
Status n= Percent 25th Percentile Median 75th Percentile Mean
Have a PMP® Certification 705 78% 86,500 119,800 160,000 132,090 PMP for less than 1 year 15 2% 70,490 94,600 150,000 119,028 PMP for 1 to less than 5 years 455 65% 80,000 108,000 140,400 119,612
PMP for 5 to less than 10 years
208 30% 103,700 143,000 190,501 153,787
PMP for 10 to less than 20 years
25 4% 145,500 200,000 234,000 190,664
PMP for 20 or more years 0 * – – – – Do not have a PMP® Certification 196 22% 65,000 89,001 120,000 97,743
Annualized Salary by Amount of Training Per Year
Employees n= Percent 25th Percentile Median 75th Percentile Mean Less than 5 days 250 28% 83,200 114,400 144,999 122,023 5 to 9 days 203 23% 84,500 114,000 166,876 131,920 10 days or more 440 49% 78,825 107,300 150,000 122,818
Annualized Salary by Gender
Gender n= Percent 25th Percentile Median 75th Percentile Mean Male 740 83% 80,500 114,800 153,500 126,950 Female 149 17% 76,000 99,999 130,000 112,478

Project Management Salary Survey –Seventh Edition 30
Brazil – All Respondents
Annualized Salary by Department
Department n= Percent 25th Percentile Median 75th Percentile Mean Administration/ General Management
93 10% 84,000 120,000 180,000 140,915
Consulting 73 8% 90,000 120,000 156,000 132,621 Customer Service/ Public Relations
7 1% – – – –
Engineering 91 10% 86,400 115,000 146,000 128,965 Finance 7 1% – – – – Human Resources 4 * – – – – Information Technology/ Information Systems
260 29% 73,250 100,000 131,700 108,619
Operations/Manufacturing 16 2% 89,300 136,500 182,000 133,623 Project Management Department or PMO
274 31% 84,501 112,550 160,000 128,313
Quality Management 15 2% 60,000 80,000 120,000 100,444 Research and Development 15 2% 109,000 150,000 200,000 146,460 Sales/Marketing 19 2% 75,190 110,000 180,000 132,124 Supply Chain Management/Logistics 8 1% – – – –
Training/Education 1 * – – – – Other 15 2% 75,000 130,000 225,000 145,333
Annualized Salary by Industry
Industry n= Percent 25th Percentile Median 75th Percentile Mean
Aerospace 6 1% – – – – Business services 12 1% 59,000 81,600 138,000 100,433 Construction 36 4% 98,000 133,119 210,000 151,470 Consulting 81 9% 86,500 117,000 150,000 129,160 Engineering 85 9% 92,400 120,000 182,000 143,753 Financial Services 45 5% 65,000 92,040 120,000 99,600 Food and Beverage 11 1% 72,000 97,500 170,400 113,127 Government 34 4% 70,000 104,000 190,000 139,102 Healthcare 11 1% 91,000 103,681 166,000 122,780 Information Technology 301 33% 75,000 108,000 143,000 113,459 Insurance 10 1% 85,000 108,432 120,000 115,529 Legal 1 * – – – – Manufacturing 55 6% 84,294 120,000 175,000 127,614 Pharmaceuticals 4 * – – – – Real Estate 2 * – – – – Resources (Agriculture, Mining, etc.)
86 10% 93,000 113,137 170,000 142,356
Telecommunications 90 10% 80,000 110,000 147,000 121,563 Training/Education 4 * – – – – Utility 12 1% 73,570 140,000 181,500 131,382 Other 15 2% 72,000 95,000 156,000 126,006
Project Management Salary Survey –Seventh Edition 31
Brazil – All Respondents
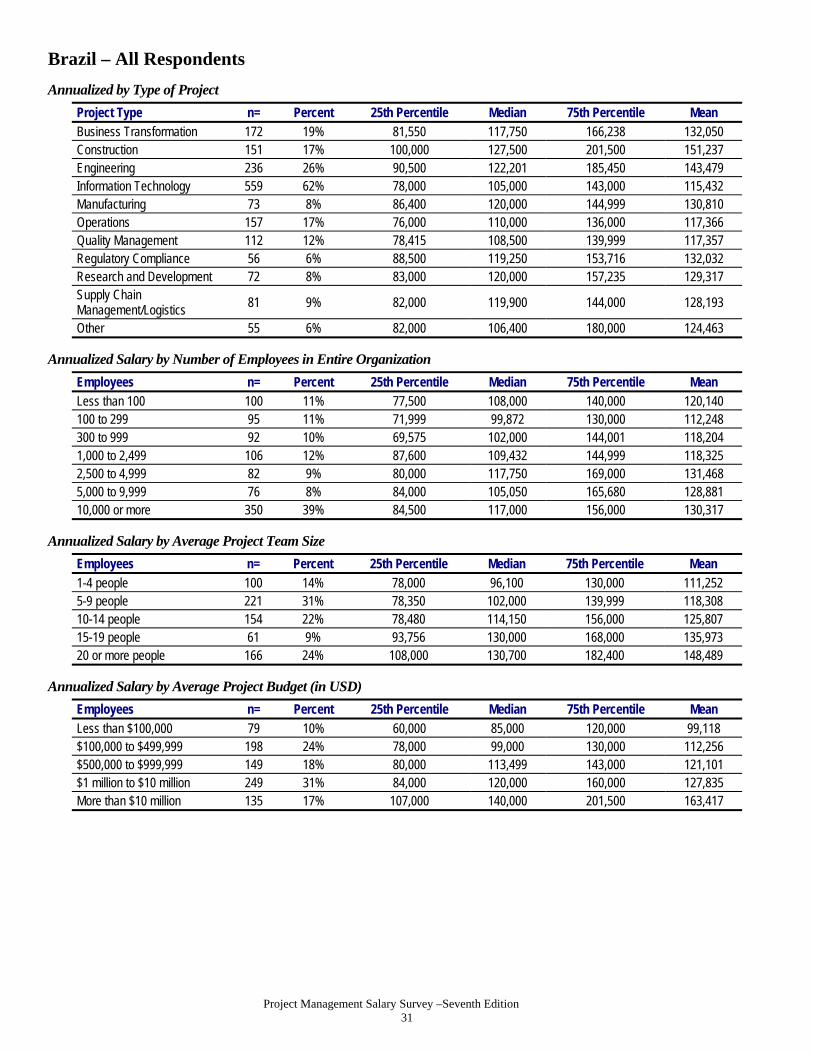
Annualized by Type of Project
Project Type n= Percent 25th Percentile Median 75th Percentile Mean Business Transformation 172 19% 81,550 117,750 166,238 132,050 Construction 151 17% 100,000 127,500 201,500 151,237 Engineering 236 26% 90,500 122,201 185,450 143,479 Information Technology 559 62% 78,000 105,000 143,000 115,432 Manufacturing 73 8% 86,400 120,000 144,999 130,810 Operations 157 17% 76,000 110,000 136,000 117,366 Quality Management 112 12% 78,415 108,500 139,999 117,357 Regulatory Compliance 56 6% 88,500 119,250 153,716 132,032 Research and Development 72 8% 83,000 120,000 157,235 129,317 Supply Chain Management/Logistics 81 9% 82,000 119,900 144,000 128,193
Other 55 6% 82,000 106,400 180,000 124,463
Annualized Salary by Number of Employees in Entire Organization
Employees n= Percent 25th Percentile Median 75th Percentile Mean Less than 100 100 11% 77,500 108,000 140,000 120,140 100 to 299 95 11% 71,999 99,872 130,000 112,248 300 to 999 92 10% 69,575 102,000 144,001 118,204 1,000 to 2,499 106 12% 87,600 109,432 144,999 118,325 2,500 to 4,999 82 9% 80,000 117,750 169,000 131,468 5,000 to 9,999 76 8% 84,000 105,050 165,680 128,881 10,000 or more 350 39% 84,500 117,000 156,000 130,317
Annualized Salary by Average Project Team Size
Employees n= Percent 25th Percentile Median 75th Percentile Mean
1-4 people 100 14% 78,000 96,100 130,000 111,252 5-9 people 221 31% 78,350 102,000 139,999 118,308 10-14 people 154 22% 78,480 114,150 156,000 125,807 15-19 people 61 9% 93,756 130,000 168,000 135,973 20 or more people 166 24% 108,000 130,700 182,400 148,489
Annualized Salary by Average Project Budget (in USD)
Employees n= Percent 25th Percentile Median 75th Percentile Mean
Less than $100,000 79 10% 60,000 85,000 120,000 99,118 $100,000 to $499,999 198 24% 78,000 99,000 130,000 112,256 $500,000 to $999,999 149 18% 80,000 113,499 143,000 121,101 $1 million to $10 million 249 31% 84,000 120,000 160,000 127,835 More than $10 million 135 17% 107,000 140,000 201,500 163,417

Project Management Salary Survey –Seventh Edition 32
Brazil – All Respondents
Project Management Career Path within Organization
n= Percent Yes - Clearly defined/in writing 247 27% Yes – Informal 319 35% No 309 34% Don't Know 24 3%
Project Management Career Path Connected to Roles in Upper Management
n= Percent Yes - Clearly defined/in writing 197 35% Yes – Informal 275 49% No 69 12% Don't Know 16 3%
Defined Set of Performance Skills for Project Managers within Organization
n= Percent Yes - Clearly defined/in writing 315 35% Yes – Informal 306 34% No 242 27% Don't Know 25 3%
Equities Offered in Past Year by Position Description
Stock Options Stock
(i.e., Shares) Neither n= Percent n= Percent n= Percent
Total 63 7% 32 4% 785 90% Director of Project Management Office (PMO) 5 10% 1 2% 43 88% Portfolio Manager 4 6% 6 8% 62 87% Program Manager 15 11% 4 3% 113 86% Project Manager III 13 8% 3 2% 147 90% Project Manager II 12 7% 4 2% 148 90% Project Manager I 5 4% 5 4% 104 93% Project Management Specialist 3 3% 6 7% 79 90% Project Management Consultant 6 6% 3 3% 89 91%
Employee Benefits Offered by Position Description
Company
Car/Allowance Cell Phone Usage Paid Life Insurance n= Percent n= Percent n= Percent
Total 190 21% 484 54% 544 61%
Director of Project Management Office (PMO) 20 38% 39 75% 33 63%
Portfolio Manager 14 19% 53 74% 49 68%
Program Manager 31 24% 86 66% 89 68%
Project Manager III 40 24% 96 58% 102 61%
Project Manager II 32 19% 87 52% 100 60%
Project Manager I 21 18% 49 42% 66 57%
Project Management Specialist 19 22% 34 39% 57 66%
Project Management Consultant 13 13% 40 39% 48 47%

Project Management Salary Survey –Seventh Edition 33
Brazil – All Respondents
Mean Number of Vacation Days by Position Description
After 1 Year After 10 Years n= Mean n= Mean
Total 888 26.7 696 22.8 Director of Project Management Office (PMO) 51 25.2 37 23.1 Portfolio Manager 72 27.1 62 23.6 Program Manager 131 26.7 110 24.1 Project Manager III 166 25.9 126 21.4 Project Manager II 164 27.7 130 23.2 Project Manager I 115 27.3 90 21.6 Project Management Specialist 87 26.6 63 24.3 Project Management Consultant 102 26.3 78 22.1
Pension Plans Offered by Position Description
Defined Benefit Plans
Defined Contribution Plans
Other Pension Plans
n= Percent n= Percent n= Percent Total 207 23% 374 42% 55 6% Director of Project Management Office (PMO) 8 15% 16 31% 3 6% Portfolio Manager 13 18% 33 46% 5 7% Program Manager 37 28% 59 45% 8 6% Project Manager III 38 23% 71 43% 9 5% Project Manager II 37 23% 86 52% 12 7% Project Manager I 26 23% 36 32% 7 6% Project Management Specialist 23 26% 43 49% 7 8% Project Management Consultant 25 25% 30 30% 4 4%
Mean Hours Worked by Position Description
Hours Expected Actual Hours
Worked n= Mean n= Mean
Total 831 41.1 819 47.1 Director of Project Management Office (PMO) 50 40.7 51 49.9 Portfolio Manager 68 40.9 67 47.8 Program Manager 121 41.2 121 48.6 Project Manager III 155 41.1 152 47.5 Project Manager II 151 41.0 148 46.6 Project Manager I 109 41.0 107 46.0 Project Management Specialist 84 41.3 81 46.8 Project Management Consultant 93 41.1 92 44.5

Project Management Salary Survey –Seventh Edition 34
Canada – All Respondents
Total Compensation (in Canadian Dollars)
Compensation n= 25th Percentile Median 75th Percentile Mean Salary 3,023 80,000 95,000 115,000 102,039 Total Compensation 3,023 83,000 100,000 125,000 110,983
Reported/Expected Change in Total Compensation over Past/Next 12 Months
Past 12 months n= Percent Next 12 months n= Percent Decreased 112 4% Decrease 46 2% Remained the same 744 25% Remain the same 665 22% Increased less than 1% 100 3% Increase less than 1% 115 4% Increased 1% to 2.9% 747 25% Increase 1% to 2.9% 835 28% Increased 3% to 3.9% 422 14% Increase 3% to 3.9% 496 16% Increased 4% to 4.9% 189 6% Increase 4% to 4.9% 246 8% Increased 5% to 6.9% 222 7% Increase 5% to 6.9% 292 10% Increased 7% to 9.9% 146 5% Increase 7% to 9.9% 99 3% Increased 10% to 14.9% 174 6% Increase 10% to 14.9% 138 5% Increased 15% to 19.9% 53 2% Increase 15% to 19.9% 42 1% Increased 20% to 24.9% 43 1% Increase 20% to 24.9% 24 1% Increased 25% to 29.9% 23 1% Increase 25% to 29.9% 8 * Increased 30% or greater 48 2% Increase 30% or greater 17 1%
Annualized Salary by Position Description
Position n= Percent 25th Percentile Median 75th Percentile Mean Director of Project Management Office (PMO)
154 5% 93,870 112,888 135,000 121,219
Portfolio Manager 180 6% 90,000 107,500 128,400 111,732 Program Manager 506 17% 89,000 102,000 120,000 112,835 Project Manager III 816 27% 82,999 95,000 115,000 104,195 Project Manager II 609 20% 74,700 85,300 101,000 91,310 Project Manager I 342 11% 65,000 77,050 90,000 80,727 Project Management Specialist
189 6% 65,000 80,000 104,598 89,804
Project Management Consultant
227 8% 90,000 105,000 150,000 120,610
Annualized Salary by Years Work Experience
Years n= Percent 25th Percentile Median 75th Percentile Mean Less than 3 years 13 * 48,850 52,000 60,000 56,181 3 to less than 5 years 57 2% 59,300 67,500 74,870 68,772 5 to less than 10 years 327 11% 65,500 75,000 87,000 79,624 10 to less than 15 years 587 19% 75,000 86,000 103,000 91,770 15 to less than 20 years 564 19% 81,000 95,000 116,500 102,299 20 or more years 1,475 49% 87,125 101,300 125,000 112,686
Project Management Salary Survey –Seventh Edition 35
Canada – All Respondents
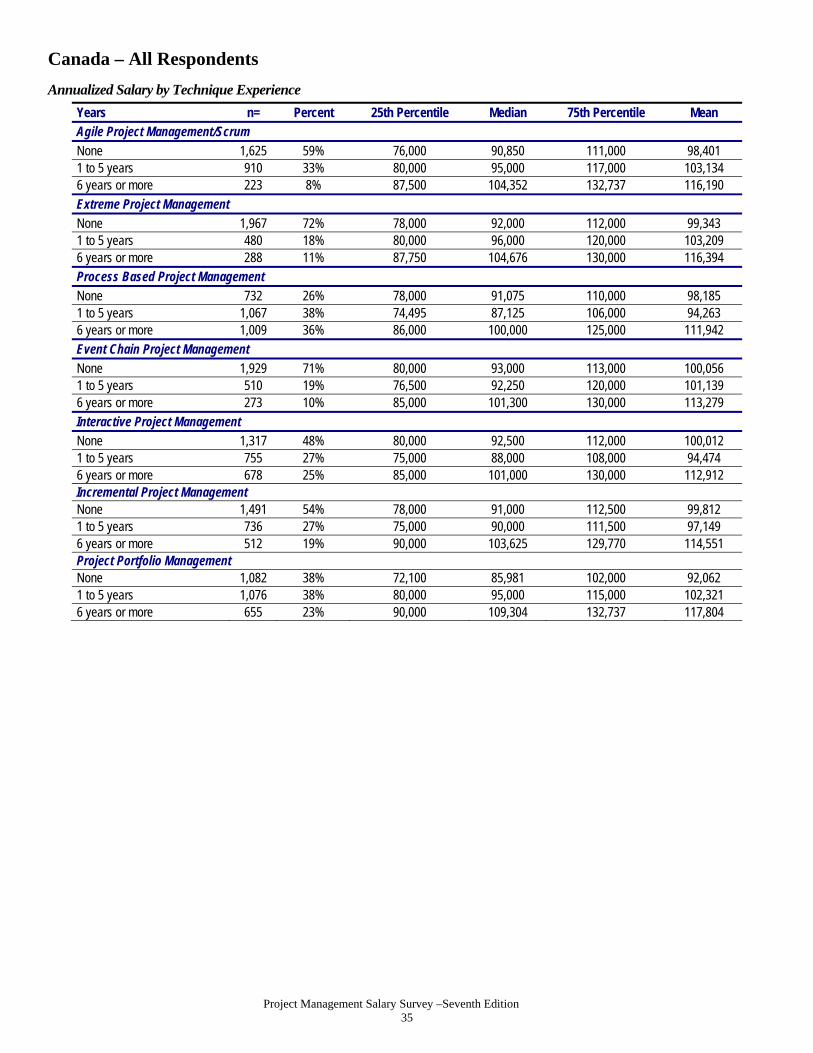
Annualized Salary by Technique Experience
Years n= Percent 25th Percentile Median 75th Percentile Mean Agile Project Management/Scrum
None 1,625 59% 76,000 90,850 111,000 98,401 1 to 5 years 910 33% 80,000 95,000 117,000 103,134 6 years or more 223 8% 87,500 104,352 132,737 116,190
Extreme Project Management
None 1,967 72% 78,000 92,000 112,000 99,343 1 to 5 years 480 18% 80,000 96,000 120,000 103,209 6 years or more 288 11% 87,750 104,676 130,000 116,394 Process Based Project Management
None 732 26% 78,000 91,075 110,000 98,185 1 to 5 years 1,067 38% 74,495 87,125 106,000 94,263 6 years or more 1,009 36% 86,000 100,000 125,000 111,942
Event Chain Project Management
None 1,929 71% 80,000 93,000 113,000 100,056 1 to 5 years 510 19% 76,500 92,250 120,000 101,139 6 years or more 273 10% 85,000 101,300 130,000 113,279
Interactive Project Management None 1,317 48% 80,000 92,500 112,000 100,012 1 to 5 years 755 27% 75,000 88,000 108,000 94,474 6 years or more 678 25% 85,000 101,000 130,000 112,912 Incremental Project Management None 1,491 54% 78,000 91,000 112,500 99,812 1 to 5 years 736 27% 75,000 90,000 111,500 97,149 6 years or more 512 19% 90,000 103,625 129,770 114,551 Project Portfolio Management None 1,082 38% 72,100 85,981 102,000 92,062 1 to 5 years 1,076 38% 80,000 95,000 115,000 102,321 6 years or more 655 23% 90,000 109,304 132,737 117,804
Project Management Salary Survey –Seventh Edition 36
Canada – All Respondents
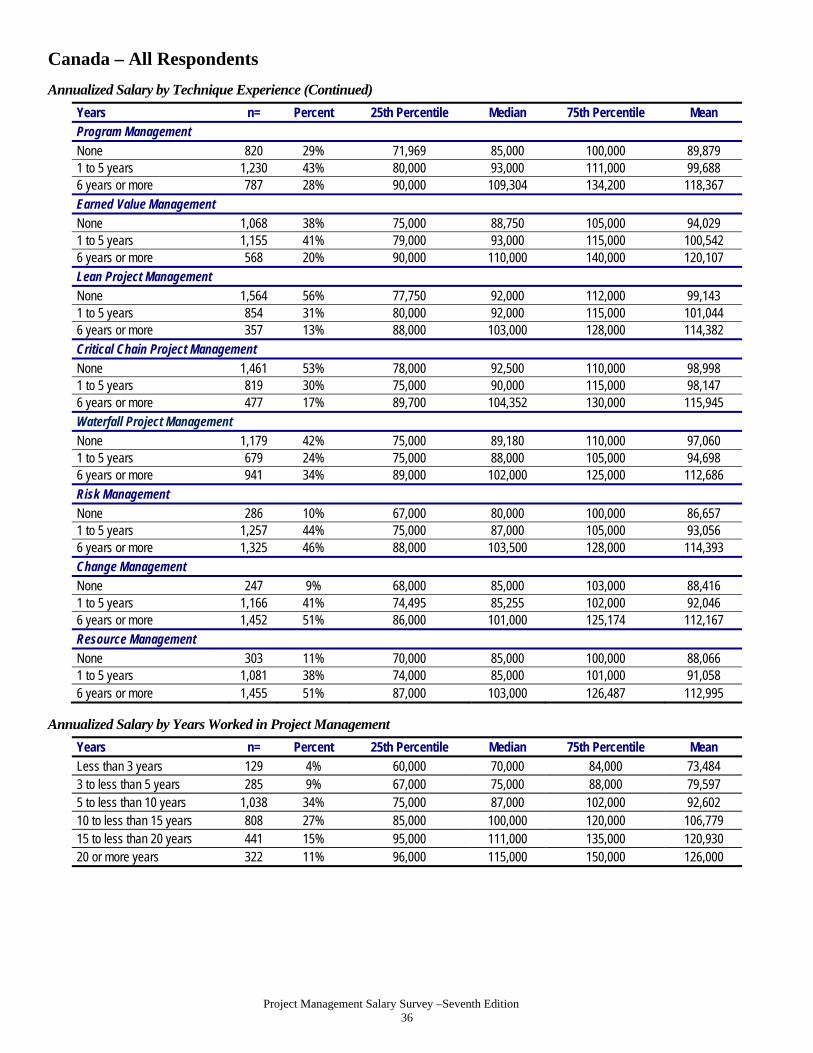
Annualized Salary by Technique Experience (Continued)
Years n= Percent 25th Percentile Median 75th Percentile Mean Program Management
None 820 29% 71,969 85,000 100,000 89,879 1 to 5 years 1,230 43% 80,000 93,000 111,000 99,688 6 years or more 787 28% 90,000 109,304 134,200 118,367
Earned Value Management None 1,068 38% 75,000 88,750 105,000 94,029 1 to 5 years 1,155 41% 79,000 93,000 115,000 100,542 6 years or more 568 20% 90,000 110,000 140,000 120,107 Lean Project Management
None 1,564 56% 77,750 92,000 112,000 99,143 1 to 5 years 854 31% 80,000 92,000 115,000 101,044 6 years or more 357 13% 88,000 103,000 128,000 114,382
Critical Chain Project Management
None 1,461 53% 78,000 92,500 110,000 98,998 1 to 5 years 819 30% 75,000 90,000 115,000 98,147 6 years or more 477 17% 89,700 104,352 130,000 115,945 Waterfall Project Management
None 1,179 42% 75,000 89,180 110,000 97,060 1 to 5 years 679 24% 75,000 88,000 105,000 94,698 6 years or more 941 34% 89,000 102,000 125,000 112,686
Risk Management
None 286 10% 67,000 80,000 100,000 86,657 1 to 5 years 1,257 44% 75,000 87,000 105,000 93,056 6 years or more 1,325 46% 88,000 103,500 128,000 114,393 Change Management
None 247 9% 68,000 85,000 103,000 88,416 1 to 5 years 1,166 41% 74,495 85,255 102,000 92,046 6 years or more 1,452 51% 86,000 101,000 125,174 112,167
Resource Management
None 303 11% 70,000 85,000 100,000 88,066 1 to 5 years 1,081 38% 74,000 85,000 101,000 91,058 6 years or more 1,455 51% 87,000 103,000 126,487 112,995
Annualized Salary by Years Worked in Project Management
Years n= Percent 25th Percentile Median 75th Percentile Mean Less than 3 years 129 4% 60,000 70,000 84,000 73,484 3 to less than 5 years 285 9% 67,000 75,000 88,000 79,597 5 to less than 10 years 1,038 34% 75,000 87,000 102,000 92,602 10 to less than 15 years 808 27% 85,000 100,000 120,000 106,779 15 to less than 20 years 441 15% 95,000 111,000 135,000 120,930 20 or more years 322 11% 96,000 115,000 150,000 126,000
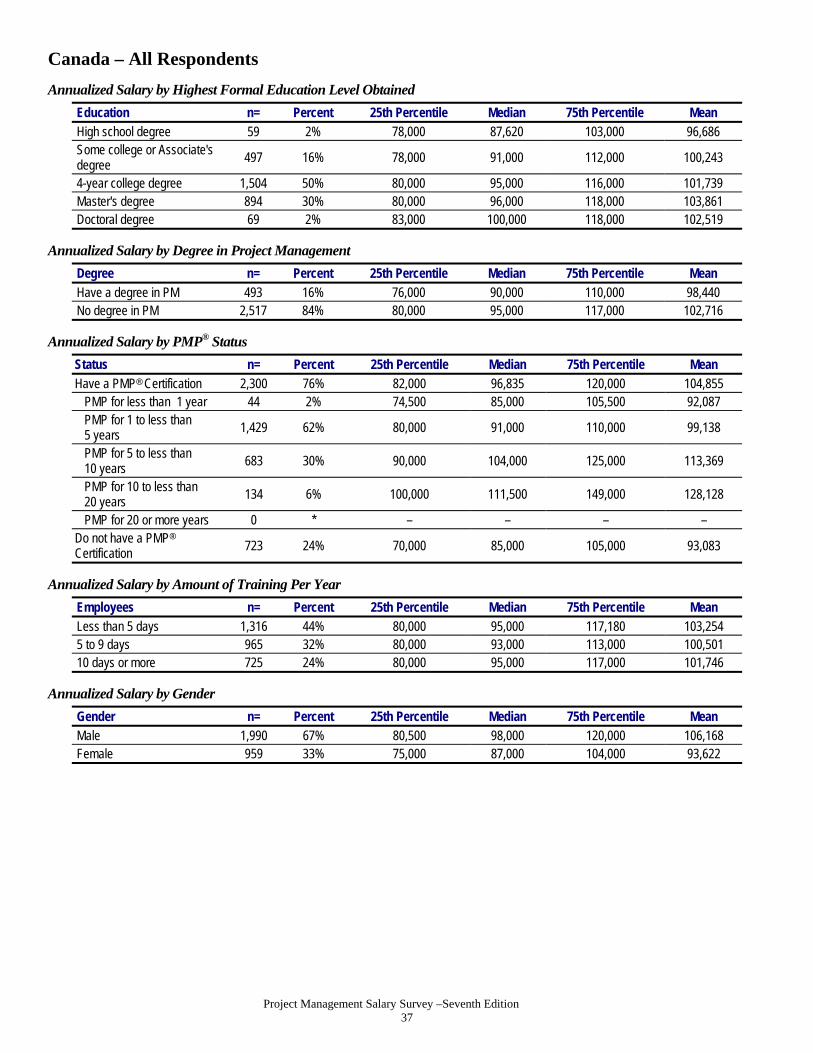
Project Management Salary Survey –Seventh Edition 37
Canada – All Respondents
Annualized Salary by Highest Formal Education Level Obtained
Education n= Percent 25th Percentile Median 75th Percentile Mean High school degree 59 2% 78,000 87,620 103,000 96,686 Some college or Associate's degree
497 16% 78,000 91,000 112,000 100,243
4-year college degree 1,504 50% 80,000 95,000 116,000 101,739 Master's degree 894 30% 80,000 96,000 118,000 103,861 Doctoral degree 69 2% 83,000 100,000 118,000 102,519
Annualized Salary by Degree in Project Management
Degree n= Percent 25th Percentile Median 75th Percentile Mean
Have a degree in PM 493 16% 76,000 90,000 110,000 98,440 No degree in PM 2,517 84% 80,000 95,000 117,000 102,716
Annualized Salary by PMP® Status
Status n= Percent 25th Percentile Median 75th Percentile Mean
Have a PMP® Certification 2,300 76% 82,000 96,835 120,000 104,855 PMP for less than 1 year 44 2% 74,500 85,000 105,500 92,087 PMP for 1 to less than 5 years 1,429 62% 80,000 91,000 110,000 99,138
PMP for 5 to less than 10 years
683 30% 90,000 104,000 125,000 113,369
PMP for 10 to less than 20 years
134 6% 100,000 111,500 149,000 128,128
PMP for 20 or more years 0 * – – – – Do not have a PMP® Certification 723 24% 70,000 85,000 105,000 93,083
Annualized Salary by Amount of Training Per Year
Employees n= Percent 25th Percentile Median 75th Percentile Mean Less than 5 days 1,316 44% 80,000 95,000 117,180 103,254 5 to 9 days 965 32% 80,000 93,000 113,000 100,501 10 days or more 725 24% 80,000 95,000 117,000 101,746
Annualized Salary by Gender
Gender n= Percent 25th Percentile Median 75th Percentile Mean Male 1,990 67% 80,500 98,000 120,000 106,168 Female 959 33% 75,000 87,000 104,000 93,622

Project Management Salary Survey –Seventh Edition 38
Canada – All Respondents
Annualized Salary by Department
Department n= Percent 25th Percentile Median 75th Percentile Mean Administration/ General Management
209 7% 75,200 95,000 125,000 106,305
Consulting 265 9% 85,000 101,000 130,000 114,047 Customer Service/ Public Relations
17 1% 68,000 85,000 97,000 81,941
Engineering 266 9% 80,000 97,250 114,000 101,874 Finance 61 2% 80,000 96,000 110,000 101,495 Human Resources 18 1% 70,000 85,598 108,041 97,358 Information Technology/ Information Systems
795 26% 80,000 93,000 112,000 100,234
Operations/Manufacturing 109 4% 74,000 90,000 120,000 97,758 Project Management Department or PMO
999 33% 80,000 95,000 120,000 102,967
Quality Management 32 1% 75,000 95,000 111,250 96,766 Research and Development 72 2% 71,700 90,000 109,500 92,935 Sales/Marketing 49 2% 75,000 90,000 105,000 91,512 Supply Chain Management/Logistics 35 1% 75,000 86,000 103,000 95,965
Training/Education 19 1% 68,000 78,000 100,940 89,367 Other 67 2% 79,900 87,000 107,000 92,898
Annualized Salary by Industry
Industry n= Percent 25th Percentile Median 75th Percentile Mean
Aerospace 57 2% 78,000 90,000 105,000 94,314 Business services 49 2% 65,000 85,000 92,000 85,639 Construction 162 5% 77,000 94,750 120,000 104,876 Consulting 264 9% 85,000 106,000 134,000 117,671 Engineering 241 8% 80,000 100,000 117,000 103,739 Financial Services 291 10% 80,000 93,000 109,840 97,444 Food and Beverage 16 1% 62,500 70,000 90,500 73,291 Government 311 10% 80,000 90,000 105,000 94,952 Healthcare 146 5% 75,000 85,000 97,000 88,079 Information Technology 601 20% 80,000 96,425 120,000 105,472 Insurance 61 2% 85,000 91,161 105,000 95,407 Legal 6 * – – – – Manufacturing 143 5% 75,000 90,000 111,000 96,959 Pharmaceuticals 38 1% 70,000 85,000 110,000 92,018 Real Estate 18 1% 85,000 95,250 117,000 110,307 Resources (Agriculture, Mining, etc.)
149 5% 100,000 125,000 153,000 134,057
Telecommunications 223 7% 75,000 90,000 103,000 93,481 Training/Education 45 1% 65,000 83,000 94,000 81,741 Utility 124 4% 87,042 102,500 124,200 107,066 Other 78 3% 72,000 87,000 102,000 91,566

Project Management Salary Survey –Seventh Edition 39
Canada – All Respondents
Annualized by Type of Project
Project Type n= Percent 25th Percentile Median 75th Percentile Mean Business Transformation 759 25% 83,500 100,000 120,000 107,602 Construction 578 19% 81,000 99,750 128,000 109,406 Engineering 649 22% 83,500 100,000 122,000 107,823 Information Technology 1,717 57% 80,000 95,000 115,000 102,818 Manufacturing 155 5% 75,000 89,000 112,500 99,672 Operations 645 21% 80,000 95,000 115,000 100,665 Quality Management 276 9% 78,300 94,500 118,500 103,170 Regulatory Compliance 275 9% 80,000 98,000 115,000 104,287 Research and Development 286 9% 75,000 88,000 110,000 94,441 Supply Chain Management/Logistics
170 6% 81,500 100,000 128,000 113,891
Other 215 7% 75,000 90,000 115,000 99,481
Annualized Salary by Number of Employees in Entire Organization
Employees n= Percent 25th Percentile Median 75th Percentile Mean Less than 100 461 15% 75,200 100,000 135,000 113,844 100 to 299 267 9% 75,000 90,000 114,500 97,693 300 to 999 365 12% 80,000 93,000 110,000 96,868 1,000 to 2,499 313 10% 79,800 90,000 110,000 98,621 2,500 to 4,999 273 9% 81,500 94,000 113,000 101,541 5,000 to 9,999 309 10% 80,000 95,000 118,000 103,626 10,000 or more 1,035 34% 81,000 95,000 113,500 100,419
Annualized Salary by Average Project Team Size
Employees n= Percent 25th Percentile Median 75th Percentile Mean
1-4 people 322 13% 73,000 85,000 101,000 91,089 5-9 people 866 36% 80,000 93,000 112,500 99,672 10-14 people 567 23% 80,000 95,000 117,300 103,251 15-19 people 251 10% 86,000 100,000 120,000 109,886 20 or more people 420 17% 90,000 110,000 140,500 123,533
Annualized Salary by Average Project Budget (in USD)
Employees n= Percent 25th Percentile Median 75th Percentile Mean
Less than $100,000 308 11% 67,000 80,850 92,500 81,875 $100,000 to $499,999 622 22% 75,000 86,000 102,000 92,491 $500,000 to $999,999 496 18% 80,000 93,000 110,000 99,224 $1 million to $10 million 988 35% 85,000 100,000 122,808 110,034 More than $10 million 380 14% 94,500 115,000 144,000 124,648
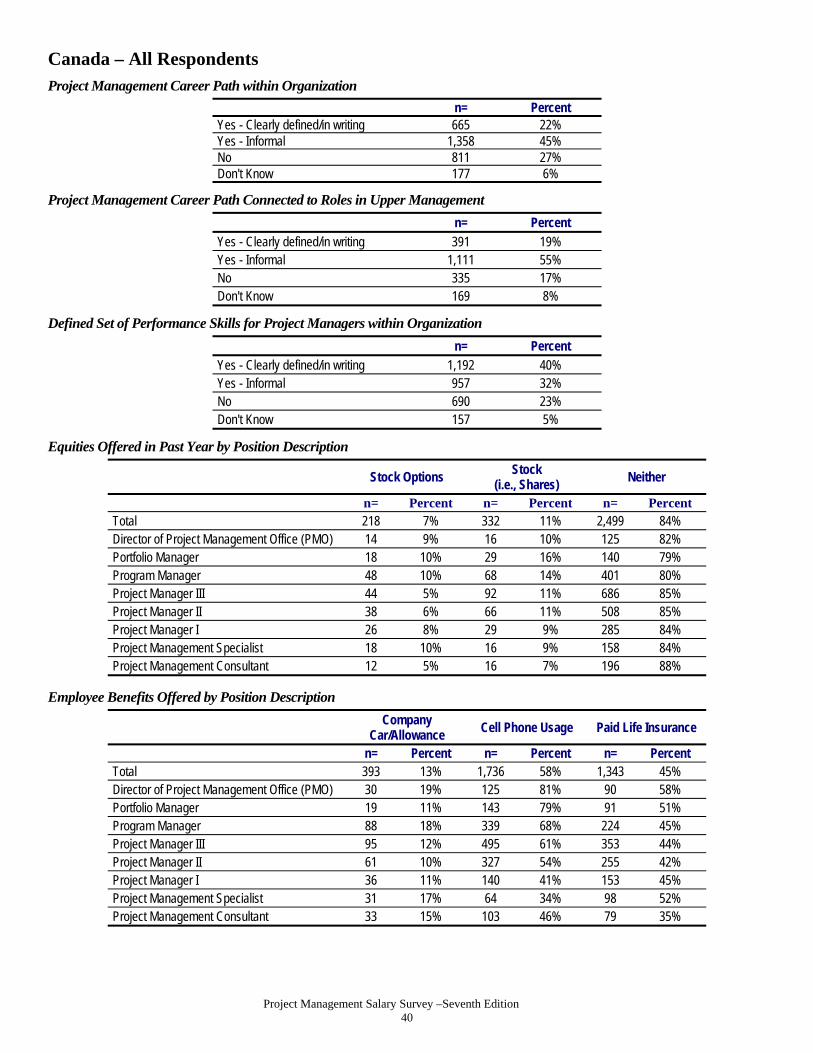
Project Management Salary Survey –Seventh Edition 40
Canada – All Respondents Project Management Career Path within Organization
n= Percent Yes - Clearly defined/in writing 665 22% Yes - Informal 1,358 45% No 811 27% Don't Know 177 6%
Project Management Career Path Connected to Roles in Upper Management
n= Percent
Yes - Clearly defined/in writing 391 19% Yes - Informal 1,111 55% No 335 17% Don't Know 169 8%
Defined Set of Performance Skills for Project Managers within Organization
n= Percent Yes - Clearly defined/in writing 1,192 40% Yes - Informal 957 32% No 690 23% Don't Know 157 5%
Equities Offered in Past Year by Position Description
Stock Options Stock (i.e., Shares)
Neither
n= Percent n= Percent n= Percent Total 218 7% 332 11% 2,499 84% Director of Project Management Office (PMO) 14 9% 16 10% 125 82% Portfolio Manager 18 10% 29 16% 140 79% Program Manager 48 10% 68 14% 401 80% Project Manager III 44 5% 92 11% 686 85% Project Manager II 38 6% 66 11% 508 85% Project Manager I 26 8% 29 9% 285 84% Project Management Specialist 18 10% 16 9% 158 84% Project Management Consultant 12 5% 16 7% 196 88%
Employee Benefits Offered by Position Description
Company
Car/Allowance Cell Phone Usage Paid Life Insurance
n= Percent n= Percent n= Percent Total 393 13% 1,736 58% 1,343 45% Director of Project Management Office (PMO) 30 19% 125 81% 90 58% Portfolio Manager 19 11% 143 79% 91 51% Program Manager 88 18% 339 68% 224 45% Project Manager III 95 12% 495 61% 353 44% Project Manager II 61 10% 327 54% 255 42% Project Manager I 36 11% 140 41% 153 45% Project Management Specialist 31 17% 64 34% 98 52% Project Management Consultant 33 15% 103 46% 79 35%

Project Management Salary Survey –Seventh Edition 41
Canada – All Respondents
Mean Number of Vacation Days by Position Description
After 1 Year After 10 Years n= Mean n= Mean
Total 2,839 12.8 2,791 17.8 Director of Project Management Office (PMO) 144 14.3 145 19.2 Portfolio Manager 163 14.6 162 19.8 Program Manager 467 12.9 465 17.7 Project Manager III 764 12.8 757 17.7 Project Manager II 581 12.8 567 18.0 Project Manager I 328 12.6 310 18.3 Project Management Specialist 179 13.6 176 19.1 Project Management Consultant 213 10.1 209 13.6
Pension Plans Offered by Position Description
Defined Benefit Plans
Defined Contribution Plans
Other Pension Plans
n= Percent n= Percent n= Percent Total 1,005 34% 1,476 49% 194 6% Director of Project Management Office (PMO) 55 36% 82 54% 8 5% Portfolio Manager 80 44% 88 49% 10 6% Program Manager 161 32% 257 51% 30 6% Project Manager III 254 31% 409 51% 48 6% Project Manager II 220 36% 312 52% 37 6% Project Manager I 114 34% 174 51% 28 8% Project Management Specialist 75 40% 97 52% 17 9% Project Management Consultant 46 21% 57 26% 16 7%
Mean Hours Worked by Position Description
Hours Expected Actual Hours
Worked n= Mean n= Mean
Total 2,977 38.6 2,942 44.7 Director of Project Management Office (PMO)
152 38.5 151 48.0
Portfolio Manager 178 38.4 177 46.7 Program Manager 495 38.8 489 46.0 Project Manager III 807 38.5 800 44.5 Project Manager II 604 38.6 596 44.0 Project Manager I 336 38.7 331 43.5 Project Management Specialist 186 38.9 182 43.4 Project Management Consultant 219 38.9 216 43.9

Project Management Salary Survey –Seventh Edition 42
China – All Respondents
Total Compensation (in Chinese Yuan)
Compensation n= 25th Percentile Median 75th Percentile Mean Salary 1,528 100,000 150,000 220,000 181,120 Total Compensation 1,528 130,000 195,000 280,000 233,126
Reported/Expected Change in Total Compensation over Past/Next 12 Months
Past 12 months n= Percent Next 12 months n= Percent Decreased 43 3% Decrease 8 1% Remained the same 308 20% Remain the same 100 7% Increased less than 1% 32 2% Increase less than 1% 13 1% Increased 1% to 2.9% 87 6% Increase 1% to 2.9% 35 2% Increased 3% to 3.9% 84 5% Increase 3% to 3.9% 41 3% Increased 4% to 4.9% 72 5% Increase 4% to 4.9% 45 3% Increased 5% to 6.9% 165 11% Increase 5% to 6.9% 111 7% Increased 7% to 9.9% 202 13% Increase 7% to 9.9% 139 9% Increased 10% to 14.9% 265 17% Increase 10% to 14.9% 399 26% Increased 15% to 19.9% 97 6% Increase 15% to 19.9% 167 11% Increased 20% to 24.9% 73 5% Increase 20% to 24.9% 174 11% Increased 25% to 29.9% 33 2% Increase 25% to 29.9% 55 4% Increased 30% or greater 67 4% Increase 30% or greater 241 16%
Annualized Salary by Position Description
Position n= Percent 25th Percentile Median 75th Percentile Mean Director of Project Management Office (PMO) 135 9% 110,002 200,000 300,000 238,818
Portfolio Manager 61 4% 150,000 237,999 320,000 257,626
Program Manager 258 17% 120,000 200,000 300,000 223,904
Project Manager III 202 13% 120,000 180,000 250,000 201,141
Project Manager II 304 20% 102,900 150,000 210,000 173,996
Project Manager I 359 23% 96,998 130,000 180,000 137,001 Project Management Specialist 145 9% 80,000 120,000 160,000 127,047 Project Management Consultant 64 4% 90,950 120,000 190,000 154,661
Annualized Salary by Years Work Experience
Years n= Percent 25th Percentile Median 75th Percentile Mean
Less than 3 years 4 * – – – – 3 to less than 5 years 103 7% 75,002 100,000 120,000 103,207 5 to less than 10 years 637 42% 100,000 135,000 196,000 152,641 10 to less than 15 years 487 32% 120,000 170,000 240,000 193,920 15 to less than 20 years 192 13% 130,000 219,000 305,000 243,706 20 years or more years 105 7% 130,000 200,000 330,000 260,248

Project Management Salary Survey –Seventh Edition 43
China – All Respondents
Annualized Salary by Technique Experience
Years n= Percent 25th Percentile Median 75th Percentile Mean Agile Project Management/Scrum
None 493 40% 100,000 145,200 204,000 172,215 1 to 5 years 598 48% 102,000 150,000 220,000 183,076 6 years or more 151 12% 120,000 180,000 256,000 208,809
Extreme Project Management None 551 45% 100,000 150,000 207,000 172,245 1 to 5 years 509 42% 102,000 150,000 220,000 183,247 6 years or more 165 13% 120,000 200,000 298,400 223,964 Process Based Project Management
None 163 13% 96,000 150,000 200,000 165,139 1 to 5 years 779 61% 100,000 144,000 200,000 166,976 6 years or more 342 27% 128,400 200,000 300,000 230,785
Event Chain Project Management None 533 43% 108,000 150,000 221,000 180,782 1 to 5 years 507 41% 100,000 150,000 209,999 175,859 6 years or more 186 15% 120,000 180,000 250,002 209,934
Interactive Project Management
None 337 27% 100,000 150,000 204,000 176,435 1 to 5 years 674 54% 100,000 144,000 204,000 171,270 6 years or more 242 19% 130,000 200,000 300,000 227,884
Incremental Project Management None 451 36% 100,000 150,000 204,000 174,381 1 to 5 years 613 49% 100,000 150,000 204,000 174,713 6 years or more 180 14% 130,000 200,000 300,000 232,061
Project Portfolio Management
None 540 43% 100,000 140,000 200,000 157,215 1 to 5 years 542 43% 102,000 150,000 250,000 192,694 6 years or more 175 14% 130,000 200,000 300,000 246,609

Project Management Salary Survey –Seventh Edition 44
China – All Respondents
Annualized Salary by Technique Experience (Continued)
Years n= Percent 25th Percentile Median 75th Percentile Mean Program Management
None 270 21% 100,000 146,299 200,000 156,198 1 to 5 years 739 56% 100,000 150,000 208,000 175,307 6 years or more 306 23% 124,998 200,000 298,400 228,037
Earned Value Management
None 425 34% 100,000 140,000 200,000 169,311 1 to 5 years 645 51% 100,003 150,000 206,000 176,940 6 years or more 190 15% 130,000 202,000 300,000 240,982 Lean Project Management
None 483 39% 100,000 150,000 216,000 170,524 1 to 5 years 597 48% 100,000 150,000 208,000 180,659 6 years or more 157 13% 130,000 200,000 298,400 225,043
Critical Chain Project Management
None 415 33% 100,000 150,000 204,000 172,147 1 to 5 years 600 48% 100,000 150,000 204,000 173,606 6 years or more 224 18% 129,200 200,000 300,000 224,685 Waterfall Project Management
None 475 38% 100,000 132,000 200,000 169,202 1 to 5 years 557 44% 102,000 150,000 204,000 175,089 6 years or more 226 18% 135,000 200,000 300,000 230,151
Risk Management
None 142 11% 84,000 120,000 180,000 149,302 1 to 5 years 846 65% 100,000 144,722 200,000 167,926 6 years or more 322 25% 135,000 200,000 300,000 240,922 Change Management
None 137 11% 85,001 120,000 200,000 164,653 1 to 5 years 791 61% 100,000 140,000 200,000 163,711 6 years or more 368 28% 135,018 200,000 300,000 234,700
Resource Management
None 187 15% 87,600 130,000 200,000 150,752 1 to 5 years 802 62% 100,000 144,000 200,000 167,841 6 years or more 300 23% 149,999 210,000 320,000 250,412
Annualized Salary by Years Worked in Project Management
Years n= Percent 25th Percentile Median 75th Percentile Mean
Less than 3 years 124 8% 84,500 120,000 175,500 130,378 3 to less than 5 years 439 29% 96,998 120,000 190,000 144,036 5 to less than 10 years 727 48% 114,003 150,000 230,000 185,503 10 to less than 15 years 173 11% 150,000 220,000 330,000 258,002 15 to less than 20 years 50 3% 130,000 200,000 300,000 232,724 20 or more years 15 1% 150,000 460,001 600,000 414,741

Project Management Salary Survey –Seventh Edition 45
China – All Respondents
Annualized Salary by Highest Formal Education Level Obtained
Education n= Percent 25th Percentile Median 75th Percentile Mean High school degree 15 1% 89,500 100,000 180,000 124,967 Some college or Associate's degree
70 5% 90,000 127,499 160,000 140,874
4-year college degree 894 59% 100,000 140,000 200,000 167,239 Master's degree 520 34% 120,000 180,000 250,000 210,331 Doctoral degree 29 2% 140,000 180,000 280,000 211,450
Annualized Salary by Degree in Project Management
Degree n= Percent 25th Percentile Median 75th Percentile Mean
Have a degree in PM 373 25% 100,000 150,000 210,000 174,932 No degree in PM 1,142 75% 102,000 150,000 221,000 183,081
Annualized Salary by PMP® Status
Status n= Percent 25th Percentile Median 75th Percentile Mean
Have a PMP® Certification 1,425 93% 106,001 150,000 230,000 184,864 PMP for less than 1 year 29 2% 91,000 110,000 150,000 122,561 PMP for 1 to less than 5 years 1,198 85% 100,000 150,000 210,000 175,103
PMP for 5 to less than 10 years
182 13% 140,000 225,000 330,000 255,256
PMP for 10 to less than 20 years
4 * – – – –
PMP for 20 or more years 0 * – – – – Do not have a PMP® Certification 103 7% 80,000 100,000 150,000 129,323
Annualized Salary by Amount of Training Per Year
Employees n= Percent 25th Percentile Median 75th Percentile Mean Less than 5 days 392 27% 102,000 150,000 214,001 182,716 5 to 9 days 402 28% 110,000 162,900 242,520 197,845 10 days or more 664 46% 100,000 145,499 210,000 171,944
Annualized Salary by Gender
Gender n= Percent 25th Percentile Median 75th Percentile Mean Male 1,189 79% 108,000 150,000 230,000 186,785 Female 325 21% 98,400 131,998 200,000 160,827

Project Management Salary Survey –Seventh Edition 46
China – All Respondents
Annualized Salary by Department
Department n= Percent 25th Percentile Median 75th Percentile Mean Administration/ General Management
105 7% 100,000 144,000 236,800 181,630
Consulting 90 6% 140,000 208,500 320,000 249,828 Customer Service/ Public Relations
27 2% 120,000 190,000 300,000 203,637
Engineering 200 13% 100,000 149,999 200,000 168,033 Finance 17 1% 120,000 150,000 206,000 191,882 Human Resources 3 * – – – – Information Technology/ Information Systems
324 22% 100,000 150,000 200,000 168,902
Operations/Manufacturing 48 3% 86,501 127,500 250,000 215,200 Project Management Department or PMO
435 29% 100,000 150,000 220,000 180,676
Quality Management 38 3% 100,000 120,000 150,000 136,305 Research and Development 126 8% 130,000 180,000 240,000 193,955 Sales/Marketing 44 3% 92,501 150,000 225,000 180,590 Supply Chain Management/Logistics
31 2% 80,000 130,000 170,003 140,845
Training/Education 7 * – – – – Other 5 * – – – –
Annualized Salary by Industry
Industry n= Percent 25th Percentile Median 75th Percentile Mean Aerospace 8 1% – – – – Business Services 33 2% 80,000 102,000 175,500 142,137 Construction 41 3% 100,000 180,000 244,800 204,215 Consulting 83 5% 120,000 200,000 300,000 243,320 Engineering 195 13% 100,000 150,000 230,000 178,770 Financial Services 60 4% 101,900 150,000 200,000 166,672 Food and Beverage 6 * – – – – Government 10 1% 100,000 120,000 144,000 119,900 Healthcare 17 1% 120,000 138,000 191,500 164,090 Information Technology 520 34% 100,000 150,000 213,000 176,648 Insurance 17 1% 120,000 156,000 220,000 214,188 Legal 0 * – – – – Manufacturing 213 14% 100,000 130,000 200,000 158,441 Pharmaceuticals 16 1% 100,000 200,000 350,000 241,125 Real Estate 11 1% 100,000 300,000 350,000 275,909 Resources (Agriculture, Mining, etc.)
41 3% 103,000 150,000 200,000 165,110
Telecommunications 234 15% 120,000 180,000 240,000 195,022 Training/Education 4 * – – – – Utility 9 1% – – – – Other 10 1% 144,000 170,000 300,000 203,000

Project Management Salary Survey –Seventh Edition 47
China – All Respondents
Annualized by Type of Project
Project Type n= Percent 25th Percentile Median 75th Percentile Mean Business Transformation 123 8% 104,000 200,000 300,000 232,700 Construction 136 9% 121,500 189,201 250,000 210,438 Engineering 435 29% 108,000 150,000 240,000 189,920 Information Technology 725 48% 108,000 150,000 220,000 180,504 Manufacturing 194 13% 95,000 130,000 200,000 164,844 Operations 174 12% 100,000 150,000 250,000 189,229 Quality Management 166 11% 114,000 150,000 222,000 178,005 Regulatory Compliance 23 2% 127,500 190,000 300,000 219,540 Research and Development 281 19% 120,000 153,400 240,000 184,510 Supply Chain Management/Logistics
100 7% 100,000 145,000 222,000 188,202
Other 36 2% 100,000 150,000 235,960 211,590
Annualized Salary by Number of Employees in Entire Organization
Employees n= Percent 25th Percentile Median 75th Percentile Mean Less than 100 162 11% 100,000 130,000 200,000 160,837 100 to 299 188 12% 100,000 130,000 202,000 169,416 300 to 999 266 17% 100,000 142,000 200,000 168,132 1,000 to 2,499 194 13% 100,000 142,000 220,000 176,983 2,500 to 4,999 141 9% 100,000 150,000 206,000 167,895 5,000 to 9,999 100 7% 105,000 156,000 250,001 198,408 10,000 or more 477 31% 120,000 180,000 243,000 201,832
Annualized Salary by Average Project Team Size
Employees n= Percent 25th Percentile Median 75th Percentile Mean
1-4 people 140 12% 100,000 140,000 200,000 160,649 5-9 people 367 32% 100,000 150,000 210,000 175,779 10-14 people 248 22% 110,000 150,000 225,000 183,647 15-19 people 82 7% 120,000 159,999 235,000 182,708 20 or more people 304 27% 130,000 200,000 300,000 225,750
Annualized Salary by Average Project Budget (in USD)
Employees n= Percent 25th Percentile Median 75th Percentile Mean Less than $100,000 292 23% 100,000 130,000 192,822 151,128 $100,000 to $499,999 388 31% 100,000 150,000 207,000 169,555 $500,000 to $999,999 182 14% 120,000 181,000 250,000 208,335 $1 million to $10 million 269 21% 127,000 191,500 260,000 214,137 More than $10 million 137 11% 108,000 200,000 300,000 216,321

Project Management Salary Survey –Seventh Edition 48
China – All Respondents
Project Management Career Path within Organization
n= Percent Yes - Clearly defined/in writing 489 33% Yes - Informal 594 41% No 267 18% Don't Know 116 8%
Project Management Career Path Connected to Roles in Upper Management
n= Percent Yes - Clearly defined/in writing 427 40% Yes - Informal 532 50% No 58 5% Don't Know 47 4%
Defined Set of Performance Skills for Project Managers within Organization
n= Percent Yes - Clearly defined/in writing 651 45% Yes - Informal 530 36% No 221 15% Don't Know 51 4%
Equities Offered in Past Year by Position Description
Stock Options Stock
(i.e., Shares) Neither
n= Percent n= Percent n= Percent Total 144 10% 128 9% 1,207 82% Director of Project Management Office (PMO) 21 17% 13 10% 94 74% Portfolio Manager 6 10% 8 13% 48 79% Program Manager 40 16% 22 9% 190 77% Project Manager III 22 11% 21 11% 152 78% Project Manager II 29 10% 27 9% 237 82% Project Manager I 16 5% 25 7% 308 89% Project Management Specialist 5 4% 10 7% 125 89% Project Management Consultant 5 8% 2 3% 53 88%
Employee Benefits Offered by Position Description
Company Car/Allowance
Cell Phone Usage Paid Life Insurance
n= Percent n= Percent n= Percent Total 418 28% 859 58% 774 52% Director of Project Management Office (PMO) 47 36% 89 69% 72 56% Portfolio Manager 20 33% 41 67% 27 44% Program Manager 75 30% 151 60% 126 50% Project Manager III 55 28% 124 63% 102 52% Project Manager II 79 27% 173 59% 161 55% Project Manager I 91 26% 186 53% 189 54% Project Management Specialist 39 28% 67 48% 69 49% Project Management Consultant 12 19% 28 45% 28 45%

Project Management Salary Survey –Seventh Edition 49
China – All Respondents
Mean Number of Vacation Days by Position Description
After 1 Year After 10 Years n= Mean n= Mean
Total 1,399 9.4 1,281 15.0 Director of Project Management Office (PMO) 121 8.5 117 15.6 Portfolio Manager 58 8.3 52 14.2 Program Manager 235 9.8 215 15.9 Project Manager III 183 9.4 178 15.0 Project Manager II 268 9.7 252 15.3 Project Manager I 334 9.5 292 14.3 Project Management Specialist 138 9.8 119 14.9 Project Management Consultant 62 8.9 56 13.5
Pension Plans Offered by Position Description
Defined Benefit Plans
Defined Contribution Plans
Other Pension Plans
n= Percent n= Percent n= Percent Total 524 37% 282 20% 250 17%
Director of Project Management Office (PMO) 53 43% 28 23% 20 16% Portfolio Manager 25 42% 14 23% 11 18% Program Manager 75 31% 47 20% 37 15% Project Manager III 71 38% 36 19% 34 18% Project Manager II 111 39% 51 18% 48 17% Project Manager I 122 36% 66 20% 62 18%
Project Management Specialist 47 34% 31 22% 23 17% Project Management Consultant 20 33% 9 15% 15 25%
Mean Hours Worked by Position Description
Hours Expected Actual Hours
Worked n= Mean n= Mean
Total 1,374 40.1 1,338 46.7 Director of Project Management Office (PMO) 116 40.3 114 49.3 Portfolio Manager 57 40.3 56 49.4 Program Manager 232 40.0 227 48.0 Project Manager III 188 40.1 178 47.3 Project Manager II 265 40.0 260 46.1 Project Manager I 329 40.1 319 45.8 Project Management Specialist 134 40.1 131 43.7 Project Management Consultant 53 39.8 53 45.7

Project Management Salary Survey –Seventh Edition 50
Colombia – All Respondents
Total Compensation (in Colombian Peso)
Compensation n= 25th Percentile Median 75th Percentile Mean Salary 369 63,000,000 87,600,000 120,000,000 97,017,678 Total Compensation 369 69,999,856 96,000,000 132,000,000 108,344,176
Reported/Expected Change in Total Compensation over Past/Next 12 Months
Past 12 Months n= Percent Next 12 Months n= Percent Decreased 10 3% Decrease 1 * Remained the same 43 12% Remain the same 39 11% Increased less than 1% 7 2% Increase less than 1% 3 1% Increased 1% to 2.9% 46 12% Increase 1% to 2.9% 32 9% Increased 3% to 3.9% 83 22% Increase 3% to 3.9% 70 19% Increased 4% to 4.9% 47 13% Increase 4% to 4.9% 51 14% Increased 5% to 6.9% 31 8% Increase 5% to 6.9% 63 17% Increased 7% to 9.9% 16 4% Increase 7% to 9.9% 18 5% Increased 10% to 14.9% 30 8% Increase 10% to 14.9% 32 9% Increased 15% to 19.9% 20 5% Increase 15% to 19.9% 14 4% Increased 20% to 24.9% 18 5% Increase 20% to 24.9% 11 3% Increased 25% to 29.9% 6 2% Increase 25% to 29.9% 12 3% Increased 30% or greater 12 3% Increase 30% or greater 23 6%
Annualized Salary by Position Description
Position n= Percent 25th Percentile Median 75th Percentile Mean Director of Project Management Office (PMO)
37 10% 79,999,328 103,200,000 123,000,000 109,393,337
Portfolio Manager 19 5% 90,000,000 120,000,000 186,840,000 145,783,542 Program Manager 53 14% 84,000,000 108,000,000 144,999,456 113,464,414 Project Manager III 80 22% 80,005,000 91,650,000 126,499,872 106,177,604 Project Manager II 75 20% 60,000,000 83,999,832 106,800,000 86,428,474 Project Manager I 42 11% 45,000,000 55,225,000 79,999,328 60,482,096 Project Management Specialist
33 9% 48,000,000 76,809,000 100,000,000 76,200,525
Project Management Consultant
30 8% 68,028,000 90,900,000 120,000,000 97,908,637
Annualized Salary by Years Work Experience
Years n= Percent 25th Percentile Median 75th Percentile Mean
Less than 3 years 1 * – – – – 3 to less than 5 years 9 2% – – – – 5 to less than 10 years 88 24% 46,899,826 64,000,062 84,000,000 64,836,251 10 to less than 15 years 110 30% 72,000,000 90,000,000 112,727,000 95,708,249 15 to less than 20 years 84 23% 75,000,000 102,600,000 138,270,000 109,650,611 20 years or more years 77 21% 92,000,000 123,000,000 168,000,000 128,528,913

Project Management Salary Survey –Seventh Edition 51
Colombia – All Respondents
Annualized Salary by Technique Experience
Years n= Percent 25th Percentile Median 75th Percentile Mean Agile Project Management/Scrum
None 211 64% 60,000,000 88,800,000 125,000,000 98,471,135 1 to 5 years 84 25% 60,000,000 84,492,000 108,000,000 90,701,541 6 years or more 37 11% 72,000,000 89,600,584 120,000,000 101,387,145
Extreme Project Management None 222 67% 60,000,000 86,899,660 116,998,704 95,951,624 1 to 5 years 78 23% 65,000,000 87,600,000 120,000,000 93,324,084 6 years or more 32 10% 72,000,000 111,000,000 152,500,352 116,178,890
Process Based Project Management
None 58 17% 58,500,000 90,150,000 120,000,000 95,495,584 1 to 5 years 176 51% 54,600,000 81,696,000 108,000,000 85,591,105 6 years or more 110 32% 80,000,000 99,800,000 148,014,944 115,469,503
Event Chain Project Management None 172 52% 68,500,000 94,232,000 132,000,248 103,468,249 1 to 5 years 117 35% 54,000,000 77,000,000 96,000,000 81,844,995 6 years or more 43 13% 70,000,000 103,800,000 150,000,000 112,336,387
Interactive Project Management
None 142 43% 68,028,000 96,000,000 120,000,000 102,037,763 1 to 5 years 136 41% 54,225,000 79,999,664 104,000,000 84,523,890 6 years or more 51 16% 72,000,000 100,000,056 155,000,704 115,433,749
Incremental Project Management None 168 50% 60,000,000 90,000,000 120,000,000 97,302,332 1 to 5 years 122 37% 60,000,000 84,000,000 106,800,000 89,183,208 6 years or more 43 13% 72,000,000 109,200,000 152,000,000 117,956,290
Project Portfolio Management
None 151 45% 54,000,000 83,160,000 109,200,000 87,060,425 1 to 5 years 147 44% 70,000,000 93,000,000 123,999,496 103,235,891 6 years or more 38 11% 80,010,000 111,000,000 148,014,944 115,216,414

Project Management Salary Survey –Seventh Edition 52
Colombia – All Respondents
Annualized Salary by Technique Experience (Continued)
Years n= Percent 25th Percentile Median 75th Percentile Mean Program Management
None 120 35% 54,300,000 83,356,800 105,430,132 83,711,312 1 to 5 years 156 45% 64,300,000 90,300,000 125,499,872 101,592,961 6 years or more 71 20% 72,315,000 106,800,000 150,000,000 114,366,651
Earned Value Management
None 54 15% 53,286,976 83,999,916 110,000,000 95,418,497 1 to 5 years 227 65% 60,000,000 84,000,000 112,000,000 90,643,938 6 years or more 70 20% 83,553,600 118,500,000 156,000,000 121,482,723 Lean Project Management
None 183 56% 65,000,124 90,300,000 120,000,000 98,256,839 1 to 5 years 112 34% 60,000,000 84,000,000 107,000,000 89,967,916 6 years or more 33 10% 67,200,000 95,999,552 150,000,000 111,155,314
Critical Chain Project Management
None 101 29% 60,000,000 90,300,000 112,000,000 95,519,425 1 to 5 years 171 49% 58,800,000 83,200,000 108,000,000 88,352,014 6 years or more 74 21% 80,000,000 117,599,352 156,000,000 120,213,992
Waterfall Project Management None 194 60% 60,000,000 85,800,000 117,000,000 95,401,252 1 to 5 years 86 26% 60,000,000 84,000,000 120,000,000 90,659,199 6 years or more 46 14% 80,000,000 105,900,000 150,000,000 114,780,025 Risk Management
None 35 10% 44,000,000 65,000,124 94,024,000 78,220,728 1 to 5 years 220 62% 60,000,000 84,000,000 108,000,000 91,368,172 6 years or more 98 28% 83,553,600 120,000,000 150,000,000 118,260,900
Change Management None 46 13% 55,900,000 94,512,000 117,000,000 98,999,658 1 to 5 years 187 53% 56,000,000 83,160,000 100,000,000 84,013,503 6 years or more 119 34% 84,000,000 115,000,000 150,000,000 117,929,260 Resource Management
None 32 9% 61,650,000 93,212,000 119,000,000 98,746,382 1 to 5 years 188 53% 54,600,000 82,980,000 100,000,028 83,586,327 6 years or more 132 38% 80,000,000 109,599,764 153,065,504 117,317,806
Annualized Salary by Years Worked in Project Management
Years n= Percent 25th Percentile Median 75th Percentile Mean Less than 3 years 10 3% 30,000,000 46,450,000 70,000,000 51,225,600 3 to less than 5 years 59 16% 38,400,000 54,000,000 82,200,000 61,887,904 5 to less than 10 years 171 46% 63,000,000 84,000,000 106,800,000 88,789,802 10 to less than 15 years 89 24% 91,000,000 114,000,000 150,000,000 122,324,798 15 to less than 20 years 30 8% 100,000,000 140,000,000 176,400,000 144,186,764 20 or more years 10 3% 96,000,000 120,000,000 168,000,000 124,031,461

Project Management Salary Survey –Seventh Edition 53
Colombia – All Respondents
Annualized Salary by Highest Formal Education Level Obtained
Education n= Percent 25th Percentile Median 75th Percentile Mean High school degree 10 3% 44,200,000 100,650,000 139,200,000 112,969,930 Some college or Associate's degree
6 2% – – – –
4-year college degree 117 32% 63,000,000 90,000,000 120,000,000 94,613,654 Master's degree 208 56% 66,917,000 90,000,000 122,300,000 99,238,785 Doctoral degree 28 8% 54,525,000 83,999,916 98,000,028 87,649,533
Annualized Salary by Degree in Project Management
Degree n= Percent 25th Percentile Median 75th Percentile Mean
Have a degree in PM 170 46% 63,600,000 85,092,000 120,000,000 95,838,092 No degree in PM 198 54% 60,000,000 90,000,000 120,000,000 96,752,769
Annualized Salary by PMP® Status
Status n= Percent 25th Percentile Median 75th Percentile Mean
Have a PMP® Certification 268 73% 71,085,584 94,470,000 123,799,748 102,505,259 PMP for less than 1 year 8 3% – – – – PMP for 1 to less than 5 years 219 83% 68,000,000 91,000,000 120,000,000 97,248,341
PMP for 5 to less than 10 years
32 12% 100,400,000 138,000,000 170,200,000 135,532,885
PMP for 10 to less than 20 years
6 2% – – – –
PMP for 20 or more years 0 * – – – – Do not have a PMP® Certification 101 27% 50,400,000 72,000,000 96,000,000 82,456,570
Annualized Salary by Amount of Training Per Year
Employees n= Percent 25th Percentile Median 75th Percentile Mean Less than 5 days 95 26% 56,000,000 83,999,832 108,000,000 86,265,086 5 to 9 days 79 22% 68,000,000 93,699,000 120,000,000 96,168,832 10 days or more 193 53% 66,000,000 93,600,000 123,000,000 102,818,664
Annualized Salary by Gender
Gender n= Percent 25th Percentile Median 75th Percentile Mean
Male 281 77% 66,000,000 92,400,000 120,000,000 99,837,103 Female 85 23% 59,300,000 83,200,000 108,000,000 88,462,202

Project Management Salary Survey –Seventh Edition 54
Colombia – All Respondents
Annualized Salary by Department
Department n= Percent 25th Percentile Median 75th Percentile Mean Administration/ General Management
62 17% 70,000,000 85,499,660 104,000,000 89,682,210
Consulting 35 10% 84,000,000 120,000,000 150,000,000 117,767,256 Customer Service/ Public Relations
0 * – – – –
Engineering 28 8% 48,499,568 79,000,000 104,999,764 76,574,964 Finance 4 1% – – – – Human Resources 0 * – – – – Information Technology/ Information Systems
68 19% 55,000,000 83,999,916 108,000,000 91,706,143
Operations/Manufacturing 9 2% – – – – Project Management Department or PMO
129 35% 68,000,000 93,600,000 120,000,000 101,734,248
Quality Management 5 1% – – – – Research and Development 2 1% – – – – Sales/Marketing 6 2% – – – – Supply Chain Management/Logistics 8 2% – – – –
Training/Education 0 * – – – – Other 11 3% 72,800,000 93,000,000 138,000,000 110,025,909
Annualized Salary by Industry
Industry n= Percent 25th Percentile Median 75th Percentile Mean
Aerospace 4 1% – – – – Business Services 14 4% 54,000,000 82,792,500 87,600,000 76,715,500 Construction 17 5% 53,286,976 72,000,000 100,000,000 76,805,700 Consulting 35 9% 79,999,328 114,000,000 155,000,704 116,977,826 Engineering 30 8% 56,000,000 74,000,000 108,000,000 85,532,805 Financial Services 21 6% 60,000,000 84,000,000 112,727,000 93,173,282 Food and Beverage 8 2% – – – – Government 9 2% – – – – Healthcare 4 1% – – – – Information Technology 89 24% 60,000,000 84,000,000 108,000,000 90,102,132 Insurance 1 * – – – – Legal 0 * – – – – Manufacturing 11 3% 58,800,000 80,000,000 117,000,000 92,800,000 Pharmaceuticals 1 * – – – – Real Estate 0 * – – – – Resources (Agriculture, Mining, etc.)
60 16% 81,999,916 110,000,000 143,000,000 118,029,550
Telecommunications 51 14% 66,634,000 84,000,000 103,200,000 89,725,268 Training/Education 2 1% – – – – Utility 6 2% – – – – Other 6 2% – – – –

Project Management Salary Survey –Seventh Edition 55
Colombia – All Respondents
Annualized by Type of Project
Project Type n= Percent 25th Percentile Median 75th Percentile Mean Business Transformation 66 18% 74,000,360 95,999,776 120,000,000 106,172,816 Construction 74 20% 72,000,000 101,400,000 123,600,000 106,660,036 Engineering 112 30% 57,400,000 84,000,000 115,999,352 91,425,383 Information Technology 215 58% 60,000,000 87,600,000 120,000,000 97,041,539 Manufacturing 13 4% 55,000,000 80,000,000 125,000,000 92,218,421 Operations 59 16% 60,000,000 86,400,000 120,000,000 93,166,485 Quality Management 29 8% 60,000,000 76,809,000 100,000,000 92,717,603 Regulatory Compliance 23 6% 63,000,000 88,800,000 120,000,000 93,271,304 Research and Development 11 3% 59,300,000 72,000,000 108,000,000 89,302,470 Supply Chain Management/Logistics 23 6% 56,000,000 87,600,000 114,000,000 91,387,459
Other 36 10% 71,000,000 103,000,028 162,750,000 118,344,908
Annualized Salary by Number of Employees in Entire Organization
Employees n= Percent 25th Percentile Median 75th Percentile Mean Less than 100 50 14% 50,400,000 72,000,000 100,000,056 81,633,136 100 to 299 45 12% 63,600,000 84,000,000 104,860,264 85,908,549 300 to 999 68 18% 54,300,000 85,000,000 131,500,000 95,262,229 1,000 to 2,499 55 15% 60,000,000 84,000,000 120,000,000 94,448,208 2,500 to 4,999 45 12% 78,000,000 90,000,000 102,000,000 94,578,245 5,000 to 9,999 54 15% 69,000,000 108,000,000 132,000,000 114,336,783 10,000 or more 52 14% 73,400,180 95,250,000 155,500,352 110,563,294
Annualized Salary by Average Project Team Size
Employees n= Percent 25th Percentile Median 75th Percentile Mean
1-4 people 30 10% 60,000,000 83,776,800 90,000,000 84,052,797 5-9 people 112 36% 60,000,000 88,600,292 115,500,136 93,923,449 10-14 people 74 24% 60,000,000 96,000,000 125,999,744 100,048,527 15-19 people 30 10% 72,800,000 95,999,776 120,000,000 105,228,276 20 or more people 61 20% 80,000,000 96,000,000 146,000,000 113,229,932
Annualized Salary by Average Project Budget (in USD)
Employees n= Percent 25th Percentile Median 75th Percentile Mean
Less than $100,000 45 13% 39,000,000 65,000,000 86,999,320 69,927,886 $100,000 to $499,999 90 26% 66,000,000 84,000,000 111,600,000 94,793,539 $500,000 to $999,999 55 16% 60,000,000 90,000,000 120,000,000 92,560,861 $1 million to $10 million 106 31% 67,200,000 91,150,000 120,000,000 97,436,459 More than $10 million 48 14% 90,000,000 116,499,488 167,000,336 135,208,966

Project Management Salary Survey –Seventh Edition 56
Colombia – All Respondents
Project Management Career Path within Organization n= Percent
Yes - Clearly defined/in writing 94 25% Yes - Informal 138 37% No 121 33% Don't Know 16 4%
Project Management Career Path Connected to Roles in Upper Management
n= Percent Yes - Clearly defined/in writing 80 35% Yes - Informal 124 54% No 20 9% Don't Know 5 2%
Defined Set of Performance Skills for Project Managers within Organization
n= Percent
Yes - Clearly defined/in writing 157 43%
Yes - Informal 121 33%
No 76 21%
Don't Know 10 3%
Equities Offered in Past Year by Position Description
Stock Options Stock
(i.e., Shares) Neither
n= Percent n= Percent n= Percent Total 18 5% 10 3% 334 93% Director of Project Management Office (PMO) 0 * 1 3% 35 97% Portfolio Manager 1 5% 0 * 18 95% Program Manager 4 8% 3 6% 45 88% Project Manager III 5 6% 1 1% 73 92% Project Manager II 1 1% 2 3% 68 96% Project Manager I 3 7% 1 2% 38 90% Project Management Specialist 2 6% 1 3% 30 91% Project Management Consultant 2 7% 1 3% 27 90%
Employee Benefits Offered by Position Description
Company
Car/Allowance
Cell Phone Usage Paid Life Insurance
n= Percent n= Percent n= Percent Total 43 12% 223 61% 150 41% Director of Project Management Office (PMO) 2 5% 29 78% 8 22% Portfolio Manager 7 37% 13 68% 12 63% Program Manager 3 6% 34 64% 26 49% Project Manager III 11 14% 59 74% 37 46% Project Manager II 10 14% 44 59% 34 46% Project Manager I 4 10% 22 54% 11 27% Project Management Specialist 1 3% 9 27% 11 33% Project Management Consultant 5 17% 13 43% 11 37%

Project Management Salary Survey –Seventh Edition 57
Colombia – All Respondents
Mean Number of Vacation Days by Position Description
After 1 Year After 10 Years n= Mean n= Mean
Total 365 15.8 287 15.8 Director of Project Management Office (PMO) 37 15.8 26 16.5 Portfolio Manager 19 15.2 14 14.0 Program Manager 53 14.5 44 15.8 Project Manager III 79 16.4 70 16.6 Project Manager II 74 15.6 55 14.6 Project Manager I 40 14.9 31 13.7 Project Management Specialist 33 17.1 23 16.9 Project Management Consultant 30 16.5 24 18.3
Pension Plans Offered by Position Description
Defined Benefit Plans
Defined Contribution Plans
Other Pension Plans
n= Percent n= Percent n= Percent Total 153 42% 143 39% 38 10% Director of Project Management Office (PMO) 17 46% 16 43% 4 11% Portfolio Manager 6 32% 9 47% 0 * Program Manager 24 47% 19 37% 4 8% Project Manager III 34 43% 25 32% 13 16% Project Manager II 32 43% 32 43% 6 8% Project Manager I 16 38% 17 40% 3 7% Project Management Specialist 14 44% 12 38% 5 16% Project Management Consultant 10 33% 13 43% 3 10%
Mean Hours Worked by Position Description
Hours Expected Actual Hours
Worked n= Mean n= Mean
Total 349 43.5 341 49.1 Director of Project Management Office (PMO)
34 44.8 33 48.5
Portfolio Manager 19 42.5 19 50.4 Program Manager 52 42.6 51 48.6 Project Manager III 77 43.8 73 50.7 Project Manager II 71 43.7 71 48.4 Project Manager I 39 43.6 40 48.7 Project Management Specialist 30 44.0 27 50.4 Project Management Consultant 27 42.1 27 46.6

Project Management Salary Survey –Seventh Edition 58
France – All Respondents
Total Compensation (in European Union Euros)
Compensation n= 25th Percentile Median 75th Percentile Mean Salary 456 50,000 60,000 75,000 63,894 Total Compensation 456 54,000 64,850 81,928 69,993
Reported/Expected Change in Total Compensation over Past/Next 12 Months
Past 12 Months n= Percent Next 12 Months n= Percent Decreased 21 5% Decrease 10 2% Remained the same 127 28% Remain the same 99 22% Increased less than 1% 37 8% Increase less than 1% 36 8% Increased 1% to 2.9% 115 25% Increase 1% to 2.9% 136 30% Increased 3% to 3.9% 51 11% Increase 3% to 3.9% 67 15% Increased 4% to 4.9% 29 6% Increase 4% to 4.9% 42 9% Increased 5% to 6.9% 29 6% Increase 5% to 6.9% 25 5% Increased 7% to 9.9% 20 4% Increase 7% to 9.9% 12 3% Increased 10% to 14.9% 14 3% Increase 10% to 14.9% 13 3% Increased 15% to 19.9% 5 1% Increase 15% to 19.9% 6 1% Increased 20% to 24.9% 0 * Increase 20% to 24.9% 4 1% Increased 25% to 29.9% 2 * Increase 25% to 29.9% 0 * Increased 30% or greater 6 1% Increase 30% or greater 6 1%
Annualized Salary by Position Description
Position n= Percent 25th Percentile Median 75th Percentile Mean Director of Project Management Office (PMO)
26 6% 60,000 78,000 93,000 78,731
Portfolio Manager 34 7% 54,500 67,400 80,000 72,121 Program Manager 88 19% 53,500 65,000 75,000 67,617 Project Manager III 91 20% 52,000 65,000 80,000 67,058 Project Manager II 112 25% 47,750 55,000 64,600 57,043 Project Manager I 40 9% 44,750 55,000 65,700 54,908 Project Management Specialist
23 5% 48,265 60,000 77,000 62,594
Project Management Consultant
42 9% 48,000 61,500 72,000 60,932
Annualized Salary by Years Work Experience
Years n= Percent 25th Percentile Median 75th Percentile Mean Less than 3 years 5 1% – – – – 3 to less than 5 years 8 2% – – – – 5 to less than 10 years 50 11% 42,000 48,000 55,000 48,884 10 to less than 15 years 116 25% 48,000 55,000 65,000 57,973 15 to less than 20 years 92 20% 53,250 63,500 75,000 66,161 20 years or more years 185 41% 60,000 70,000 82,000 72,263

Project Management Salary Survey –Seventh Edition 59
France – All Respondents
Annualized Salary by Technique Experience
Years n= Percent 25th Percentile Median 75th Percentile Mean Agile Project Management/Scrum
None 296 73% 50,000 60,000 74,066 63,982 1 to 5 years 87 21% 48,000 59,500 75,000 62,305 6 years or more 25 6% 55,500 65,000 78,000 66,309
Extreme Project Management None 310 76% 50,000 60,000 74,132 63,588 1 to 5 years 68 17% 48,500 61,500 75,000 63,336 6 years or more 30 7% 59,500 62,500 75,000 67,077
Process Based Project Management
None 94 23% 50,000 60,500 74,000 63,559 1 to 5 years 152 37% 47,750 55,000 67,550 58,315 6 years or more 165 40% 53,500 65,000 78,000 68,323 Event Chain Project Management
None 285 72% 50,000 60,000 73,200 63,074 1 to 5 years 76 19% 50,000 59,190 75,000 63,367 6 years or more 36 9% 58,119 65,500 76,500 67,880
Interactive Project Management None 219 54% 50,000 60,000 75,000 63,360 1 to 5 years 103 25% 45,500 55,000 68,600 60,305 6 years or more 84 21% 53,820 66,200 79,500 67,643 Incremental Project Management
None 229 57% 49,000 57,600 73,700 63,103 1 to 5 years 105 26% 49,000 60,000 70,300 61,229 6 years or more 71 18% 55,500 66,000 75,000 68,080
Project Portfolio Management None 185 45% 47,500 55,380 66,000 57,782 1 to 5 years 148 36% 52,134 63,500 77,500 66,708 6 years or more 79 19% 60,000 69,000 85,000 72,988

Project Management Salary Survey –Seventh Edition 60
France – All Respondents
Annualized Salary by Years Work Experience (Continued)
Years n= Percent 25th Percentile Median 75th Percentile Mean Program Management
None 145 34% 46,600 55,000 65,400 57,511 1 to 5 years 179 42% 51,000 60,000 75,000 64,300 6 years or more 102 24% 58,000 67,625 83,000 72,344
Earned Value Management None 128 31% 48,000 56,360 70,000 60,399 1 to 5 years 205 49% 50,000 60,000 75,000 63,113 6 years or more 82 20% 60,000 66,750 78,000 71,412 Lean Project Management
None 256 63% 50,000 60,000 74,066 63,563 1 to 5 years 118 29% 51,000 60,000 77,000 64,668 6 years or more 33 8% 51,480 63,000 70,000 61,927
Critical Chain Project Management None 193 48% 50,000 60,000 76,000 64,183 1 to 5 years 133 33% 48,000 56,000 68,698 61,307 6 years or more 80 20% 54,500 66,000 75,000 66,721
Waterfall Project Management
None 248 61% 48,750 57,300 74,000 62,175 1 to 5 years 74 18% 49,000 59,750 70,000 61,855 6 years or more 84 21% 59,119 65,113 79,000 70,526
Risk Management None 36 8% 46,500 56,350 70,000 59,565 1 to 5 years 215 50% 48,000 56,220 69,000 60,837 6 years or more 175 41% 55,000 66,000 78,000 68,105 Change Management
None 55 13% 43,500 52,000 62,200 54,756 1 to 5 years 186 44% 50,000 60,000 74,235 63,158 6 years or more 185 43% 52,000 65,000 77,000 67,345
Resource Management
None 46 11% 45,000 51,000 62,200 54,833 1 to 5 years 175 42% 48,500 56,000 70,000 61,300 6 years or more 198 47% 55,000 66,450 79,000 68,902
Annualized Salary by Years Worked in Project Management
Years n= Percent 25th Percentile Median 75th Percentile Mean
Less than 3 years 13 3% 40,000 48,500 57,000 49,306 3 to less than 5 years 47 10% 42,000 48,500 56,000 51,992 5 to less than 10 years 173 38% 48,000 56,000 65,400 58,582 10 to less than 15 years 114 25% 52,000 61,410 75,000 65,432 15 to less than 20 years 60 13% 66,200 74,100 84,000 78,293 20 or more years 49 11% 65,000 75,000 87,381 76,726

Project Management Salary Survey –Seventh Edition 61
France – All Respondents
Annualized Salary by Highest Formal Education Level Obtained
Education n= Percent 25th Percentile Median 75th Percentile Mean High school degree 34 7% 45,500 52,000 70,000 57,735 Some college or Associate's degree
27 6% 60,000 68,000 80,000 68,428
4-year college degree 34 7% 50,300 58,000 82,000 66,302 Master's degree 314 69% 50,000 60,000 72,000 63,084 Doctoral degree 47 10% 51,600 70,000 83,000 69,412
Annualized Salary by Degree in Project Management
Degree n= Percent 25th Percentile Median 75th Percentile Mean
Have a degree in PM 96 21% 49,000 59,440 69,349 62,543 No degree in PM 355 79% 50,300 60,000 75,000 64,145
Annualized Salary by PMP® Status
Status n= Percent 25th Percentile Median 75th Percentile Mean
Have a PMP® Certification 338 74% 52,000 61,820 76,000 65,695 PMP for less than 1 year 30 9% 45,000 55,171 70,000 58,110 PMP for 1 to less than 5 years 231 68% 52,000 60,000 75,000 65,343
PMP for 5 to less than 10 years
55 16% 55,000 70,000 80,000 68,440
PMP for 10 to less than 20 years
22 7% 63,000 68,250 82,000 72,871
PMP for 20 or more years 0 * – – – – Do not have a PMP® Certification 118 26% 45,900 55,000 70,000 58,734
Annualized Salary by Amount of Training Per Year
Employees n= Percent 25th Percentile Median 75th Percentile Mean Less than 5 days 155 34% 52,000 60,000 75,000 62,989 5 to 9 days 181 40% 51,000 60,000 72,000 64,314 10 days or more 118 26% 46,500 60,000 78,000 63,885
Annualized Salary by Gender
Gender n= Percent 25th Percentile Median 75th Percentile Mean Male 366 81% 50,000 60,000 75,000 64,766 Female 84 19% 48,000 56,110 68,474 60,284
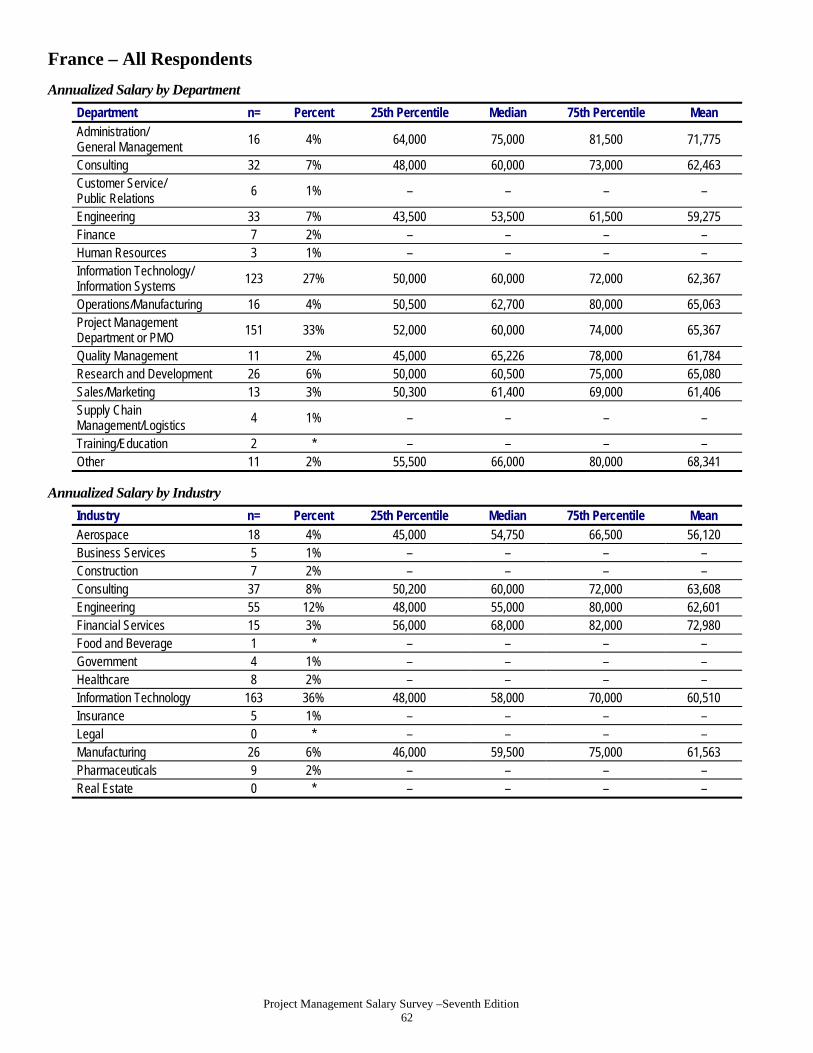
Project Management Salary Survey –Seventh Edition 62
France – All Respondents
Annualized Salary by Department
Department n= Percent 25th Percentile Median 75th Percentile Mean Administration/ General Management
16 4% 64,000 75,000 81,500 71,775
Consulting 32 7% 48,000 60,000 73,000 62,463 Customer Service/ Public Relations
6 1% – – – –
Engineering 33 7% 43,500 53,500 61,500 59,275 Finance 7 2% – – – – Human Resources 3 1% – – – – Information Technology/ Information Systems
123 27% 50,000 60,000 72,000 62,367
Operations/Manufacturing 16 4% 50,500 62,700 80,000 65,063 Project Management Department or PMO
151 33% 52,000 60,000 74,000 65,367
Quality Management 11 2% 45,000 65,226 78,000 61,784 Research and Development 26 6% 50,000 60,500 75,000 65,080 Sales/Marketing 13 3% 50,300 61,400 69,000 61,406 Supply Chain Management/Logistics 4 1% – – – –
Training/Education 2 * – – – – Other 11 2% 55,500 66,000 80,000 68,341
Annualized Salary by Industry
Industry n= Percent 25th Percentile Median 75th Percentile Mean
Aerospace 18 4% 45,000 54,750 66,500 56,120 Business Services 5 1% – – – – Construction 7 2% – – – – Consulting 37 8% 50,200 60,000 72,000 63,608 Engineering 55 12% 48,000 55,000 80,000 62,601 Financial Services 15 3% 56,000 68,000 82,000 72,980 Food and Beverage 1 * – – – – Government 4 1% – – – – Healthcare 8 2% – – – – Information Technology 163 36% 48,000 58,000 70,000 60,510 Insurance 5 1% – – – – Legal 0 * – – – – Manufacturing 26 6% 46,000 59,500 75,000 61,563 Pharmaceuticals 9 2% – – – – Real Estate 0 * – – – –

Project Management Salary Survey –Seventh Edition 63
France – All Respondents
Annualized by Type of Project
Project Type n= Percent 25th Percentile Median 75th Percentile Mean Business Transformation 84 19% 51,300 60,660 75,000 64,350 Construction 35 8% 50,000 65,580 80,000 68,749 Engineering 120 26% 48,133 58,000 71,000 62,423 Information Technology 259 57% 50,000 60,000 75,000 63,958 Manufacturing 43 9% 49,000 61,500 75,000 63,729 Operations 75 17% 52,800 68,250 80,000 67,610 Quality Management 43 9% 50,000 65,000 80,000 68,722 Regulatory Compliance 8 2% – – – – Research and Development 56 12% 49,000 61,500 75,000 65,242 Supply Chain Management/Logistics 30 7% 50,000 70,000 81,000 66,986
Other 17 4% 55,500 60,000 70,000 62,803
Annualized Salary by Number of Employees in Entire Organization
Employees Percent 25th Percentile Median 75th Percentile Mean Less than 100 32 7% 46,500 53,000 71,000 57,691 100 to 299 12 3% 52,000 59,000 76,000 62,917 300 to 999 33 7% 56,000 68,250 76,000 69,880 1,000 to 2,499 39 9% 48,000 56,500 75,000 60,172 2,500 to 4,999 37 8% 50,200 56,000 66,500 60,801 5,000 to 9,999 46 10% 46,000 55,750 70,000 61,651 10,000 or more 257 56% 52,000 61,640 75,420 65,355
Annualized Salary by Average Project Team Size
Employees n= Percent 25th Percentile Median 75th Percentile Mean
1-4 people 44 14% 49,500 57,250 76,500 63,565 5-9 people 87 27% 48,000 56,000 70,000 59,457 10-14 people 74 23% 53,000 61,000 75,000 65,775 15-19 people 45 14% 52,000 68,250 83,000 68,334 20 or more people 75 23% 55,380 67,000 82,000 71,316
Annualized Salary by Average Project Budget (in USD)
Employees n= Percent 25th Percentile Median 75th Percentile Mean
Less than $100,000 38 9% 49,000 54,250 63,000 57,763 $100,000 to $499,999 87 22% 49,000 60,000 75,000 63,747 $500,000 to $999,999 78 19% 50,200 60,000 74,000 62,904 $1 million to $10 million 143 36% 51,000 60,000 72,000 63,409 More than $10 million 56 14% 55,590 66,500 89,622 73,005

Project Management Salary Survey –Seventh Edition 64
France – All Respondents
Project Management Career Path within Organization
n= Percent Yes - Clearly defined/in writing 124 27% Yes – Informal 162 36% No 134 30% Don't Know 34 7%
Project Management Career Path Connected to Roles in Upper Management
n= Percent Yes - Clearly defined/in writing 64 23% Yes - Informal 145 51% No 50 18% Don't Know 25 9%
Defined Set of Performance Skills for Project Managers within Organization
n= Percent Yes - Clearly defined/in writing 219 49% Yes - Informal 120 27% No 91 20% Don't Know 19 4%
Equities Offered in Past Year by Position Description
Stock Options Stock
(i.e., Shares) Neither
n= Percent n= Percent n= Percent Total 36 8% 50 11% 374 82% Director of Project Management Office (PMO) 2 8% 2 8% 22 85% Portfolio Manager 3 9% 6 18% 27 79% Program Manager 8 9% 13 15% 68 77% Project Manager III 12 13% 9 10% 71 78% Project Manager II 8 7% 11 10% 94 85% Project Manager I 2 5% 4 10% 34 85% Project Management Specialist 0 * 1 5% 21 95% Project Management Consultant 1 2% 4 10% 37 88%
Employee Benefits Offered by Position Description
Company
Car/Allowance Cell Phone Usage Paid Life Insurance
n= Percent n= Percent n= Percent Total 113 25% 315 70% 120 27% Director of Project Management Office (PMO) 8 31% 21 81% 6 23% Portfolio Manager 13 38% 27 79% 10 29% Program Manager 19 22% 68 79% 23 27% Project Manager III 22 24% 66 73% 23 25% Project Manager II 22 20% 74 68% 26 24% Project Manager I 10 26% 20 51% 11 28% Project Management Specialist 3 14% 15 68% 8 36% Project Management Consultant 16 38% 24 57% 13 31%

Project Management Salary Survey –Seventh Edition 65
France – All Respondents
Mean Number of Vacation Days by Position Description
After 1 Year After 10 Years n= Mean n= Mean
Total 424 30.3 423 32.7 Director of Project Management Office (PMO) 24 29.4 25 32.4 Portfolio Manager 32 26.5 31 28.1 Program Manager 82 32.2 82 35.1 Project Manager III 82 28.9 86 32.1 Project Manager II 106 32.4 109 35.1 Project Manager I 37 28.8 35 27.4 Project Management Specialist 21 26.5 20 28.2 Project Management Consultant 40 30.3 35 33.1
Pension Plans Offered by Position Description
Defined Benefit Plans
Defined Contribution Plans
Other Pension Plans
n= Percent n= Percent n= Percent Total 179 40% 115 26% 57 13% Director of Project Management Office (PMO) 10 40% 4 16% 0 * Portfolio Manager 12 36% 10 30% 7 21% Program Manager 40 47% 16 19% 14 16% Project Manager III 27 30% 31 34% 7 8% Project Manager II 53 48% 24 22% 17 15% Project Manager I 14 36% 16 41% 3 8% Project Management Specialist 7 30% 6 26% 1 4% Project Management Consultant 16 38% 8 19% 8 19%
Mean Hours Worked by Position Description
Hours Expected Actual Hours
Worked n= Mean n= Mean
Total 448 37.9 441 46.3 Director of Project Management Office (PMO) 24 37.1 24 48.6 Portfolio Manager 34 38.0 34 48.4 Program Manager 87 37.8 88 47.1 Project Manager III 89 37.8 87 47.1 Project Manager II 111 38.2 107 45.5 Project Manager I 40 37.8 39 43.9 Project Management Specialist 21 38.0 21 45.6 Project Management Consultant 42 38.1 41 44.9

Project Management Salary Survey –Seventh Edition 66
Germany – All Respondents
Total Compensation (in European Union Euros)
Compensation n= 25th Percentile Median 75th Percentile Mean Salary 742 65,000 76,000 90,000 81,281 Total Compensation 742 70,000 85,000 102,800 91,310
Reported/Expected Change in Total Compensation over Past/Next 12 Months
Past 12 Months n= Percent Next 12 Months n= Percent Decreased 23 3% Decrease 8 1% Remained the same 174 23% Remain the same 179 24% Increased less than 1% 54 7% Increase less than 1% 50 7% Increased 1% to 2.9% 239 32% Increase 1% to 2.9% 253 34% Increased 3% to 3.9% 73 10% Increase 3% to 3.9% 93 13% Increased 4% to 4.9% 46 6% Increase 4% to 4.9% 40 5% Increased 5% to 6.9% 34 5% Increase 5% to 6.9% 51 7% Increased 7% to 9.9% 34 5% Increase 7% to 9.9% 14 2% Increased 10% to 14.9% 27 4% Increase 10% to 14.9% 32 4% Increased 15% to 19.9% 10 1% Increase 15% to 19.9% 10 1% Increased 20% to 24.9% 11 1% Increase 20% to 24.9% 7 1% Increased 25% to 29.9% 5 1% Increase 25% to 29.9% 0 * Increased 30% or greater 12 2% Increase 30% or greater 5 1%
Annualized Salary by Position Description
Position n= Percent 25th Percentile Median 75th Percentile Mean Director of Project Management Office (PMO)
26 4% 83,000 92,250 103,039 95,143
Portfolio Manager 21 3% 72,000 85,000 105,000 90,319 Program Manager 125 17% 71,000 84,000 100,000 88,645 Project Manager III 203 27% 68,400 80,000 90,000 83,633 Project Manager II 199 27% 60,000 72,000 85,000 74,316 Project Manager I 73 10% 56,000 65,000 75,000 66,923 Project Management Specialist
19 3% 60,000 72,000 90,000 75,631
Project Management Consultant
76 10% 67,300 80,000 100,000 89,087
Annualized Salary by Years Work Experience
Years n= Percent 25th Percentile Median 75th Percentile Mean
Less than 3 years 0 * – – – – 3 to less than 5 years 11 1% 47,000 52,000 57,000 58,909 5 to less than 10 years 105 14% 55,000 62,000 74,400 65,904 10 to less than 15 years 178 24% 60,000 72,000 85,000 76,915 15 to less than 20 years 157 21% 68,600 77,000 92,000 85,000 20 years or more years 291 39% 72,000 85,000 100,000 88,339

Project Management Salary Survey –Seventh Edition 67
Germany – All Respondents
Annualized Salary by Technique Experience
Years n= Percent 25th Percentile Median 75th Percentile Mean Agile Project Management/Scrum None 406 59% 63,000 75,300 90,000 80,765 1 to 5 years 226 33% 65,000 76,500 90,000 81,626 6 years or more 59 9% 70,000 80,000 92,000 83,165 Extreme Project Management None 476 70% 62,750 75,000 90,000 80,405 1 to 5 years 144 21% 66,000 78,500 92,000 81,817 6 years or more 59 9% 75,000 85,000 100,000 88,143 Process Based Project Management None 169 24% 60,477 72,800 91,000 80,531 1 to 5 years 250 36% 60,000 70,000 83,000 74,437 6 years or more 277 40% 72,000 84,000 97,000 88,336 Event Chain Project Management None 492 73% 63,000 75,000 90,000 79,023 1 to 5 years 104 15% 64,500 78,500 95,000 87,178 6 years or more 75 11% 71,500 85,000 96,000 88,308 Interactive Project Management None 333 49% 63,000 75,000 87,000 79,938 1 to 5 years 184 27% 60,000 72,000 85,000 77,385 6 years or more 161 24% 71,000 85,000 98,000 89,074 Incremental Project Management None 345 51% 63,000 75,000 90,000 81,476 1 to 5 years 193 28% 62,000 74,000 86,000 78,336 6 years or more 143 21% 69,000 84,000 96,000 84,932 Project Portfolio Management None 290 42% 60,000 72,000 85,000 75,851 1 to 5 years 289 42% 65,000 78,000 93,000 83,574 6 years or more 109 16% 75,000 85,000 100,000 91,202

Project Management Salary Survey –Seventh Edition 68
Germany – All Respondents
Annualized Salary by Technique Experience (Continued)
Years n= Percent 25th Percentile Median 75th Percentile Mean Program Management
None 239 34% 60,000 71,000 83,000 73,649 1 to 5 years 313 45% 65,000 76,000 90,000 82,064 6 years or more 142 20% 76,000 87,000 101,370 93,325
Earned Value Management
None 167 24% 60,000 75,000 85,000 75,941 1 to 5 years 354 51% 62,500 75,000 90,000 79,742 6 years or more 173 25% 70,000 83,500 100,000 90,654 Lean Project Management
None 362 53% 62,000 75,000 87,000 79,773 1 to 5 years 218 32% 65,000 75,800 90,000 81,001 6 years or more 99 15% 72,000 85,000 100,000 87,967
Critical Chain Project Management
None 258 37% 61,992 75,000 90,000 79,555 1 to 5 years 239 35% 61,000 73,000 85,000 77,833 6 years or more 192 28% 71,310 84,000 99,000 88,110
Waterfall Project Management None 272 39% 60,750 75,000 90,000 78,709 1 to 5 years 152 22% 60,000 70,000 85,000 75,907 6 years or more 267 39% 70,000 81,725 95,000 87,155 Risk Management
None 58 8% 55,000 65,500 80,000 72,182 1 to 5 years 284 40% 60,000 72,000 85,000 75,290 6 years or more 365 52% 70,000 83,000 97,600 87,784
Change Management None 51 7% 58,000 68,400 85,000 76,766 1 to 5 years 275 39% 60,000 70,000 85,000 75,809 6 years or more 388 54% 70,000 82,000 95,000 85,923 Resource Management
None 47 7% 55,000 64,000 80,000 70,556 1 to 5 years 274 39% 60,000 70,000 84,000 72,941 6 years or more 377 54% 71,000 83,000 100,000 88,955
Annualized Salary by Years Worked in Project Management
Years n= Percent 25th Percentile Median 75th Percentile Mean Less than 3 years 17 2% 50,000 55,000 70,000 65,000 3 to less than 5 years 60 8% 53,500 60,000 70,000 63,810 5 to less than 10 years 264 36% 60,000 71,500 85,000 75,167 10 to less than 15 years 250 34% 70,000 80,000 92,000 85,677 15 to less than 20 years 107 14% 75,000 90,000 100,000 93,458 20 or more years 44 6% 75,000 90,000 102,500 93,490

Project Management Salary Survey –Seventh Edition 69
Germany – All Respondents
Annualized Salary by Highest Formal Education Level Obtained
Education n= Percent 25th Percentile Median 75th Percentile Mean High school degree 54 7% 65,000 79,000 95,000 92,283 Some college or Associate's degree
46 6% 56,500 70,000 86,000 79,613
4-year college degree 100 13% 63,150 75,000 86,500 78,395 Master's degree 467 63% 65,000 76,000 90,000 80,192 Doctoral degree 75 10% 70,000 83,500 95,000 85,012
Annualized Salary by Degree in Project Management
Degree n= Percent 25th Percentile Median 75th Percentile Mean
Have a degree in PM 69 9% 65,000 80,000 98,000 81,563 No degree in PM 671 91% 65,000 76,000 90,000 81,213
Annualized Salary by PMP® Status
Status n= Percent 25th Percentile Median 75th Percentile Mean
Have a PMP® Certification 602 81% 65,000 78,000 92,000 82,591 PMP for less than 1 year 20 3% 68,000 78,500 90,000 80,955 PMP for 1 to less than 5 years 430 72% 64,000 76,000 90,000 81,143
PMP for 5 to less than 10 years
138 23% 68,600 80,000 96,000 85,932
PMP for 10 to less than 20 years
12 2% 79,500 91,000 105,000 90,833
PMP for 20 or more years 0 * – – – – Do not have a PMP® Certification 140 19% 60,000 70,538 85,000 75,648
Annualized Salary by Amount of Training Per Year
Employees n= Percent 25th Percentile Median 75th Percentile Mean Less than 5 days 234 32% 64,000 75,000 90,000 79,130 5 to 9 days 303 41% 65,000 76,000 90,000 81,170 10 days or more 202 27% 65,000 79,500 92,000 82,745
Annualized Salary by Gender
Gender n= Percent 25th Percentile Median 75th Percentile Mean Male 647 89% 65,000 77,000 91,000 82,302 Female 77 11% 60,000 72,000 82,000 71,921
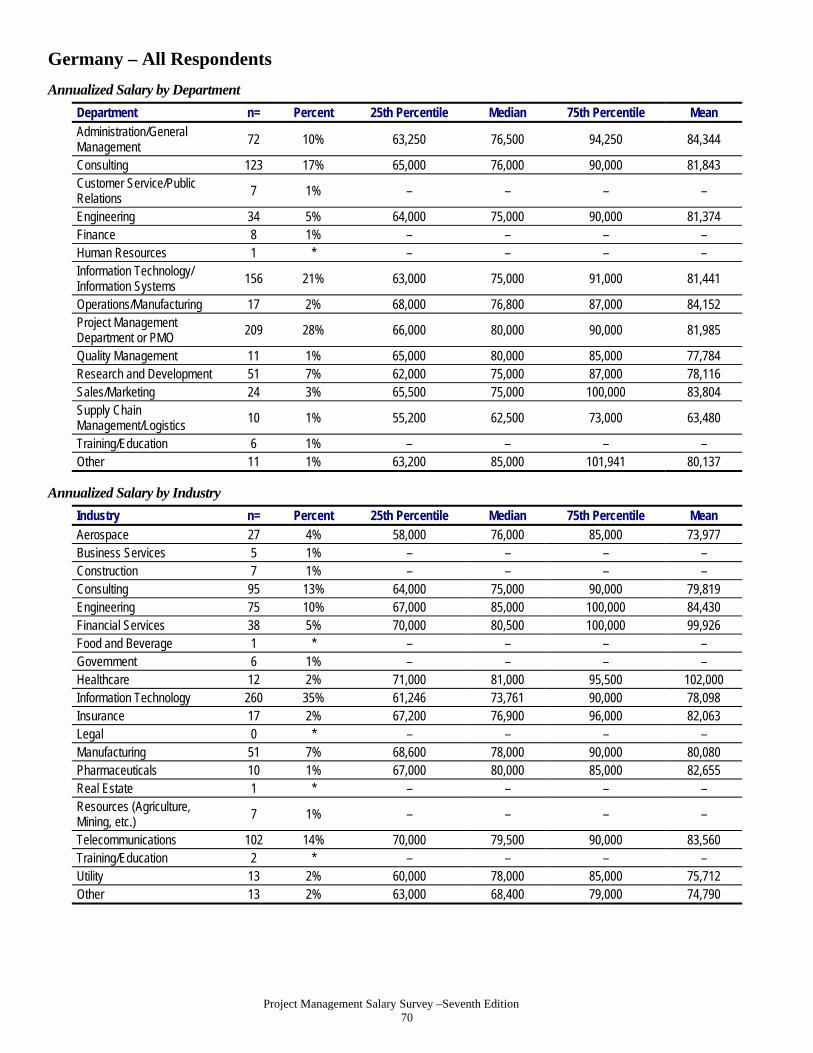
Project Management Salary Survey –Seventh Edition 70
Germany – All Respondents
Annualized Salary by Department
Department n= Percent 25th Percentile Median 75th Percentile Mean Administration/General Management
72 10% 63,250 76,500 94,250 84,344
Consulting 123 17% 65,000 76,000 90,000 81,843 Customer Service/Public Relations
7 1% – – – –
Engineering 34 5% 64,000 75,000 90,000 81,374 Finance 8 1% – – – – Human Resources 1 * – – – – Information Technology/ Information Systems
156 21% 63,000 75,000 91,000 81,441
Operations/Manufacturing 17 2% 68,000 76,800 87,000 84,152 Project Management Department or PMO
209 28% 66,000 80,000 90,000 81,985
Quality Management 11 1% 65,000 80,000 85,000 77,784 Research and Development 51 7% 62,000 75,000 87,000 78,116 Sales/Marketing 24 3% 65,500 75,000 100,000 83,804 Supply Chain Management/Logistics 10 1% 55,200 62,500 73,000 63,480
Training/Education 6 1% – – – – Other 11 1% 63,200 85,000 101,941 80,137
Annualized Salary by Industry
Industry n= Percent 25th Percentile Median 75th Percentile Mean
Aerospace 27 4% 58,000 76,000 85,000 73,977 Business Services 5 1% – – – – Construction 7 1% – – – – Consulting 95 13% 64,000 75,000 90,000 79,819 Engineering 75 10% 67,000 85,000 100,000 84,430 Financial Services 38 5% 70,000 80,500 100,000 99,926 Food and Beverage 1 * – – – – Government 6 1% – – – – Healthcare 12 2% 71,000 81,000 95,500 102,000 Information Technology 260 35% 61,246 73,761 90,000 78,098 Insurance 17 2% 67,200 76,900 96,000 82,063 Legal 0 * – – – – Manufacturing 51 7% 68,600 78,000 90,000 80,080 Pharmaceuticals 10 1% 67,000 80,000 85,000 82,655 Real Estate 1 * – – – – Resources (Agriculture, Mining, etc.)
7 1% – – – –
Telecommunications 102 14% 70,000 79,500 90,000 83,560 Training/Education 2 * – – – – Utility 13 2% 60,000 78,000 85,000 75,712 Other 13 2% 63,000 68,400 79,000 74,790

Project Management Salary Survey –Seventh Edition 71
Germany – All Respondents
Annualized by Type of Project
Project Type n= Percent 25th Percentile Median 75th Percentile Mean Business Transformation 179 24% 65,000 79,000 98,000 84,605 Construction 36 5% 63,500 80,000 101,520 85,012 Engineering 132 18% 65,000 79,000 94,000 83,137 Information Technology 485 65% 65,000 75,000 90,000 81,431 Manufacturing 43 6% 70,000 75,000 85,000 80,516 Operations 101 14% 65,000 76,900 92,000 81,073 Quality Management 83 11% 65,000 77,000 90,000 80,372 Regulatory Compliance 29 4% 70,000 77,000 87,000 80,470 Research and Development 110 15% 65,130 80,000 87,000 80,429 Supply Chain Management/Logistics 52 7% 66,500 79,000 92,500 84,881
Other 41 6% 63,000 81,725 94,000 79,315
Annualized Salary by Number of Employees in Entire Organization
Employees n= Percent 25th Percentile Median 75th Percentile Mean Less than 100 80 11% 60,000 80,000 100,000 91,404 100 to 299 40 5% 57,325 70,000 85,000 74,138 300 to 999 43 6% 61,200 75,000 91,000 83,909 1,000 to 2,499 69 9% 63,000 75,000 90,000 80,431 2,500 to 4,999 52 7% 64,750 74,000 92,000 77,930 5,000 to 9,999 50 7% 61,992 74,000 92,000 78,631 10,000 or more 408 55% 65,500 77,500 90,000 80,615
Annualized Salary by Average Project Team Size
Employees n= Percent 25th Percentile Median 75th Percentile Mean
1-4 people 77 12% 59,150 70,000 81,600 72,597 5-9 people 180 28% 60,000 72,000 85,000 78,338 10-14 people 155 24% 66,000 79,000 95,000 82,908 15-19 people 70 11% 70,000 81,863 93,000 85,288 20 or more people 169 26% 70,075 85,000 96,000 88,570
Annualized Salary by Average Project Budget (in USD)
Employees n= Percent 25th Percentile Median 75th Percentile Mean Less than $100,000 54 8% 56,650 65,000 76,800 68,273 $100,000 to $499,999 157 23% 60,000 70,000 80,000 73,594 $500,000 to $999,999 125 18% 66,300 75,000 90,000 79,419 $1 million to $10 million 275 40% 69,000 80,000 96,000 85,162 More than $10 million 73 11% 83,000 90,000 104,677 98,723

Project Management Salary Survey –Seventh Edition 72
Germany – All Respondents
Project Management Career Path within Organization
n= Percent Yes - Clearly defined/in writing 302 41% Yes - Informal 237 32% No 172 23% Don't Know 30 4%
Project Management Career Path Connected to Roles in Upper Management
n= Percent Yes - Clearly defined/in writing 145 27% Yes - Informal 189 35% No 153 28% Don't Know 51 9%
Defined Set of Performance Skills for Project Managers within Organization
n= Percent Yes - Clearly defined/in writing 397 54% Yes - Informal 183 25% No 128 17% Don't Know 31 4%
Equities Offered in Past Year by Position Description
Stock Options Stock
(i.e., Shares) Neither
n= Percent n= Percent n= Percent Total 46 6% 58 8% 637 87% Director of Project Management Office (PMO) 4 15% 3 12% 19 73% Portfolio Manager 2 10% 2 10% 17 85% Program Manager 12 10% 12 10% 102 82% Project Manager III 10 5% 14 7% 178 89% Project Manager II 10 5% 16 8% 172 88% Project Manager I 2 3% 5 7% 65 90% Project Management Specialist 1 5% 2 11% 16 84% Project Management Consultant 5 7% 4 5% 68 89%
Employee Benefits Offered by Position Description
Company
Car/Allowance
Cell Phone Usage Paid Life Insurance
n= Percent n= Percent n= Percent Total 246 34% 426 59% 122 17% Director of Project Management Office (PMO) 16 62% 19 73% 9 35% Portfolio Manager 9 43% 16 76% 4 19% Program Manager 61 49% 84 67% 21 17% Project Manager III 53 27% 122 61% 36 18% Project Manager II 50 26% 92 48% 28 15% Project Manager I 19 26% 36 50% 12 17% Project Management Specialist 4 21% 4 21% 1 5% Project Management Consultant 34 46% 53 72% 11 15%

Project Management Salary Survey –Seventh Edition 73
Germany – All Respondents
Mean Number of Vacation Days by Position Description
After 1 Year After 10 Years n= Mean n= Mean
Total 709 28.3 718 28.7 Director of Project Management Office (PMO) 26 29.4 26 30.0 Portfolio Manager 19 29.4 21 29.9 Program Manager 118 28.7 123 28.8 Project Manager III 191 28.4 192 28.8 Project Manager II 192 28.4 194 28.9 Project Manager I 70 28.7 70 29.6 Project Management Specialist 19 26.5 19 26.8 Project Management Consultant 74 26.4 73 26.8
Pension Plans Offered by Position Description
Defined Benefit Plans
Defined Contribution Plans
Other Pension Plans
n= Percent n= Percent n= Percent Total 298 41% 191 26% 136 19% Director of Project Management Office (PMO) 10 38% 6 23% 8 31% Portfolio Manager 9 43% 9 43% 4 19% Program Manager 48 39% 35 28% 25 20% Project Manager III 85 43% 50 25% 29 15% Project Manager II 87 44% 49 25% 37 19% Project Manager I 30 41% 23 32% 17 23% Project Management Specialist 7 37% 5 26% 3 16% Project Management Consultant 22 30% 14 19% 13 18%
Mean Hours Worked by Position Description
Hours Expected Actual Hours
Worked n= Mean n= Mean
Total 734 39.6 734 47.2 Director of Project Management Office (PMO) 25 39.6 25 52.1 Portfolio Manager 21 39.7 21 51.9 Program Manager 124 39.5 125 49.3 Project Manager III 200 39.8 200 47.7 Project Manager II 198 39.4 197 45.2 Project Manager I 73 39.5 72 45.0 Project Management Specialist 19 39.8 19 45.4 Project Management Consultant 74 40.0 75 47.0

Project Management Salary Survey –Seventh Edition 74
Hong Kong – All Respondents
Total Compensation (in Hong Kong Dollars)
Compensation n= 25th Percentile Median 75th Percentile Mean Salary 259 366,300 500,000 630,000 523,124 Total Compensation 259 400,000 520,000 700,000 582,216
Reported/Expected Change in Total Compensation over Past/Next 12 Months
Past 12 Months n= Percent Next 12 Months n= Percent Decreased 9 3% Decrease 3 1% Remained the same 75 29% Remain the same 53 20% Increased less than 1% 3 1% Increase less than 1% 5 2% Increased 1% to 2.9% 28 11% Increase 1% to 2.9% 19 7% Increased 3% to 3.9% 22 8% Increase 3% to 3.9% 28 11% Increased 4% to 4.9% 33 13% Increase 4% to 4.9% 30 12% Increased 5% to 6.9% 29 11% Increase 5% to 6.9% 61 24% Increased 7% to 9.9% 16 6% Increase 7% to 9.9% 16 6% Increased 10% to 14.9% 14 5% Increase 10% to 14.9% 26 10% Increased 15% to 19.9% 5 2% Increase 15% to 19.9% 8 3% Increased 20% to 24.9% 8 3% Increase 20% to 24.9% 2 1% Increased 25% to 29.9% 3 1% Increase 25% to 29.9% 3 1% Increased 30% or greater 14 5% Increase 30% or greater 5 2%
Annualized Salary by Position Description
Position n= Percent 25th Percentile Median 75th Percentile Mean Director of Project Management Office (PMO)
4 2% – – – –
Portfolio Manager 8 3% – – – – Program Manager 51 20% 440,000 600,000 800,000 640,199 Project Manager III 49 19% 425,000 540,000 660,000 576,520 Project Manager II 58 22% 390,000 500,000 600,000 507,746 Project Manager I 50 19% 319,998 413,000 500,000 430,876 Project Management Specialist
19 7% 300,000 340,000 423,372 350,626
Project Management Consultant
20 8% 330,000 391,520 585,000 444,674
Annualized Salary by Years Work Experience
Years n= Percent 25th Percentile Median 75th Percentile Mean
Less than 3 years 0 * – – – – 3 to less than 5 years 1 * – – – – 5 to less than 10 years 47 18% 300,000 348,000 420,000 366,340 10 to less than 15 years 95 37% 380,000 457,000 600,000 520,883 15 to less than 20 years 63 24% 420,000 510,000 629,997 540,891 20 years or more years 53 20% 500,730 630,000 760,000 652,473

Project Management Salary Survey –Seventh Edition 75
Hong Kong – All Respondents
Annualized Salary by Technique Experience
Years n= Percent 25th Percentile Median 75th Percentile Mean Agile Project Management/Scrum
None 145 64% 388,800 500,000 624,000 522,821 1 to 5 years 58 26% 372,000 515,000 660,000 536,881 6 years or more 23 10% 360,000 450,000 700,000 557,998
Extreme Project Management None 143 63% 383,040 500,000 650,000 534,067 1 to 5 years 59 26% 372,000 468,000 560,000 514,037 6 years or more 26 11% 410,000 524,400 699,100 530,975
Process Based Project Management
None 50 22% 342,240 497,200 700,000 566,085 1 to 5 years 118 52% 372,000 484,800 590,000 499,027 6 years or more 61 27% 425,000 510,000 665,443 554,635
Event Chain Project Management None 144 63% 381,520 500,000 636,816 534,314 1 to 5 years 55 24% 400,000 500,000 642,000 518,449 6 years or more 28 12% 354,720 475,000 660,002 525,223
Interactive Project Management
None 93 41% 400,000 500,000 618,000 528,399 1 to 5 years 87 38% 360,000 480,000 600,000 501,818 6 years or more 48 21% 435,000 545,000 662,722 578,349
Incremental Project Management None 90 40% 360,000 497,200 643,632 528,599 1 to 5 years 90 40% 390,000 500,000 642,000 514,006 6 years or more 45 20% 400,000 500,000 629,997 544,614 Project Portfolio Management
None 97 43% 346,800 468,000 600,000 480,443 1 to 5 years 90 40% 420,000 500,000 699,100 568,583 6 years or more 39 17% 416,000 504,000 665,443 562,452

Project Management Salary Survey –Seventh Edition 76
Hong Kong – All Respondents
Annualized Salary by Technique Experience (Continued)
Years n= Percent 25th Percentile Median 75th Percentile Mean Program Management
None 72 32% 347,250 450,000 600,000 477,650 1 to 5 years 108 48% 407,600 500,000 655,000 549,818 6 years or more 45 20% 416,000 538,800 670,000 564,777
Earned Value Management
None 112 49% 354,000 497,200 609,000 510,665 1 to 5 years 91 40% 402,000 500,000 642,000 540,630 6 years or more 25 11% 416,000 500,000 700,000 557,930 Lean Project Management
None 122 55% 383,040 500,000 660,000 541,670 1 to 5 years 76 34% 400,000 500,000 641,816 523,927 6 years or more 25 11% 360,000 455,000 570,000 499,518
Critical Chain Project Management
None 106 46% 400,000 500,000 630,000 534,190 1 to 5 years 82 36% 360,000 480,000 600,000 498,180 6 years or more 40 18% 423,000 516,976 685,000 563,030
Waterfall Project Management None 98 43% 360,000 478,374 600,000 503,585 1 to 5 years 61 27% 360,000 450,000 600,000 491,744 6 years or more 67 30% 480,000 590,000 750,000 610,872 Risk Management
None 45 19% 336,000 420,000 500,000 457,527 1 to 5 years 116 50% 385,920 500,000 609,000 512,041 6 years or more 72 31% 448,500 560,000 700,000 604,884 Change Management
None 23 10% 340,000 420,000 600,000 458,668 1 to 5 years 119 52% 360,000 480,000 600,000 506,162 6 years or more 89 39% 447,000 533,952 670,000 580,917
Resource Management
None 22 9% 340,000 500,000 728,000 610,864 1 to 5 years 119 51% 350,000 450,000 550,000 473,194 6 years or more 91 39% 450,000 540,000 700,000 585,648
Annualized Salary by Years Worked in Project Management
Years n= Percent 25th Percentile Median 75th Percentile Mean Less than 3 years 13 5% 315,000 350,000 372,000 348,508 3 to less than 5 years 37 14% 300,000 348,000 500,000 388,003 5 to less than 10 years 121 47% 400,000 500,000 625,000 530,021 10 to less than 15 years 65 25% 420,000 538,800 665,443 571,306 15 to less than 20 years 17 7% 480,000 600,000 800,000 634,408 20 or more years 6 2% – – – –
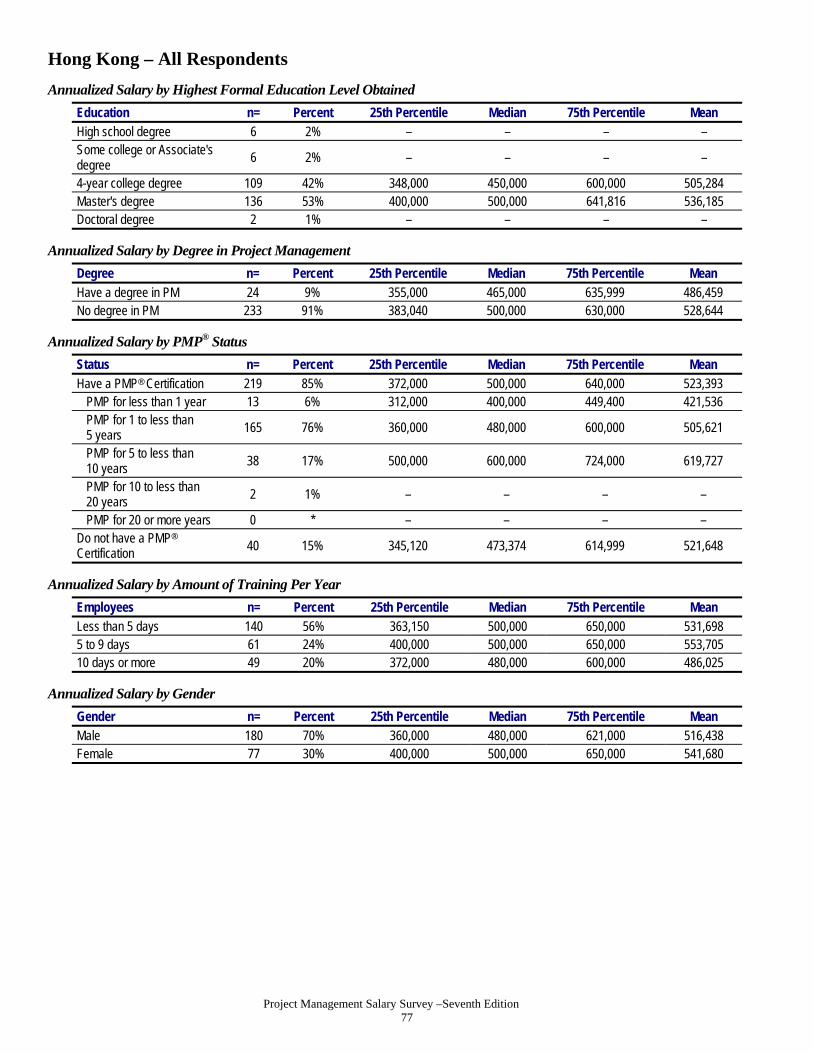
Project Management Salary Survey –Seventh Edition 77
Hong Kong – All Respondents
Annualized Salary by Highest Formal Education Level Obtained
Education n= Percent 25th Percentile Median 75th Percentile Mean High school degree 6 2% – – – – Some college or Associate's degree
6 2% – – – –
4-year college degree 109 42% 348,000 450,000 600,000 505,284 Master's degree 136 53% 400,000 500,000 641,816 536,185 Doctoral degree 2 1% – – – –
Annualized Salary by Degree in Project Management
Degree n= Percent 25th Percentile Median 75th Percentile Mean
Have a degree in PM 24 9% 355,000 465,000 635,999 486,459 No degree in PM 233 91% 383,040 500,000 630,000 528,644
Annualized Salary by PMP® Status
Status n= Percent 25th Percentile Median 75th Percentile Mean
Have a PMP® Certification 219 85% 372,000 500,000 640,000 523,393 PMP for less than 1 year 13 6% 312,000 400,000 449,400 421,536 PMP for 1 to less than 5 years 165 76% 360,000 480,000 600,000 505,621
PMP for 5 to less than 10 years
38 17% 500,000 600,000 724,000 619,727
PMP for 10 to less than 20 years
2 1% – – – –
PMP for 20 or more years 0 * – – – – Do not have a PMP® Certification 40 15% 345,120 473,374 614,999 521,648
Annualized Salary by Amount of Training Per Year
Employees n= Percent 25th Percentile Median 75th Percentile Mean Less than 5 days 140 56% 363,150 500,000 650,000 531,698 5 to 9 days 61 24% 400,000 500,000 650,000 553,705 10 days or more 49 20% 372,000 480,000 600,000 486,025
Annualized Salary by Gender
Gender n= Percent 25th Percentile Median 75th Percentile Mean Male 180 70% 360,000 480,000 621,000 516,438 Female 77 30% 400,000 500,000 650,000 541,680

Project Management Salary Survey –Seventh Edition 78
Hong Kong – All Respondents
Annualized Salary by Department
Department n= Percent 25th Percentile Median 75th Percentile Mean Administration/ General Management
10 4% 450,000 575,000 660,000 596,000
Consulting 18 7% 320,000 500,000 625,000 497,891 Customer Service/ Public Relations
4 2% – – – –
Engineering 20 8% 413,000 480,000 505,001 496,600 Finance 6 2% – – – – Human Resources 2 1% – – – – Information Technology/ Information Systems
111 43% 360,000 480,000 650,003 535,490
Operations/Manufacturing 6 2% – – – – Project Management Department or PMO
60 23% 360,000 500,000 600,000 503,504
Quality Management 3 1% – – – – Research and Development 8 3% – – – – Sales/Marketing 5 2% – – – – Supply Chain Management/Logistics 1 * – – – –
Training/Education 1 * – – – – Other 3 1% – – – –
Annualized Salary by Industry
Industry n= Percent 25th Percentile Median 75th Percentile Mean
Aerospace 4 2% – – – – Business Services 3 1% – – – – Construction 7 3% – – – – Consulting 11 4% 340,000 520,000 600,000 525,636 Engineering 12 5% 420,000 490,000 620,000 523,000 Financial Services 58 22% 423,372 600,000 750,000 623,236 Food and Beverage 2 1% – – – – Government 13 5% 396,000 480,000 500,000 457,474 Healthcare 5 2% – – – – Information Technology 67 26% 348,000 450,000 550,000 480,765 Insurance 9 3% – – – – Legal 1 * – – – – Manufacturing 20 8% 407,500 462,500 577,000 506,743 Pharmaceuticals 0 * – – – – Real Estate 2 1% – – – – Resources (Agriculture, Mining, etc.)
2 1% – – – –
Telecommunications 28 11% 348,720 422,500 505,366 430,113 Training/Education 2 1% – – – – Utility 1 * – – – – Other 12 5% 326,000 445,000 594,400 473,610

Project Management Salary Survey –Seventh Edition 79
Hong Kong – All Respondents
Annualized Salary by Type of Project
Project Type n= Percent 25th Percentile Median 75th Percentile Mean Business Transformation 48 19% 417,600 548,000 726,000 604,755 Construction 12 5% 420,000 506,976 625,000 548,663 Engineering 37 15% 372,000 470,000 540,000 465,183 Information Technology 186 73% 372,000 500,000 629,997 522,453 Manufacturing 10 4% 315,000 425,000 510,000 434,090 Operations 48 19% 363,150 472,374 675,002 538,401 Quality Management 20 8% 441,000 500,000 612,000 545,448 Regulatory Compliance 12 5% 475,000 597,000 712,000 594,818 Research and Development 23 9% 322,500 420,000 510,000 451,569 Supply Chain Management/Logistics 16 6% 436,000 524,400 634,000 564,956
Other 10 4% 480,000 615,000 700,000 602,000
Annualized Salary by Number of Employees in Entire Organization
Employees n= Percent 25th Percentile Median 75th Percentile Mean Less than 100 26 10% 305,520 354,720 430,000 363,733 100 to 299 29 11% 348,000 420,000 510,000 429,250 300 to 999 37 14% 380,000 480,000 600,000 490,054 1,000 to 2,499 37 14% 400,000 520,000 650,003 537,992 2,500 to 4,999 15 6% 340,000 420,000 500,000 421,629 5,000 to 9,999 11 4% 447,000 480,000 600,000 590,723 10,000 or more 104 40% 427,500 540,000 704,000 603,112
Annualized Salary by Average Project Team Size
Employees n= Percent 25th Percentile Median 75th Percentile Mean
1-4 people 40 22% 342,720 466,874 636,980 486,012 5-9 people 73 40% 390,000 480,000 580,000 491,379 10-14 people 35 19% 400,000 500,000 720,000 562,143 15-19 people 12 7% 519,400 650,000 728,000 655,092 20 or more people 22 12% 533,952 820,000 1,000,000 807,516
Annualized Salary by Average Project Budget (in USD)
Employees n= Percent 25th Percentile Median 75th Percentile Mean
Less than $100,000 49 22% 320,000 400,000 540,000 448,764 $100,000 to $499,999 84 38% 415,100 480,000 585,000 507,385 $500,000 to $999,999 35 16% 360,000 500,000 600,000 507,259 $1 million to $10 million 45 20% 500,000 624,000 760,000 646,364 More than $10 million 7 3% – – – –

Project Management Salary Survey –Seventh Edition 80
Hong Kong – All Respondents
Project Management Career Path within Organization
n= Percent Yes - Clearly defined/in writing 42 17% Yes - Informal 117 46% No 75 30% Don't Know 19 8%
Project Management Career Path Connected to Roles in Upper Management
n= Percent Yes - Clearly defined/in writing 34 22% Yes - Informal 88 56% No 25 16% Don't Know 11 7%
Defined Set of Performance Skills for Project Managers within Organization
n= Percent Yes - Clearly defined/in writing 68 27% Yes - Informal 83 33% No 79 31% Don't Know 21 8%
Equities Offered in Past Year by Position Description
Stock Options Stock
(i.e., Shares) Neither
n= Percent n= Percent n= Percent Total 12 5% 10 4% 227 91% Director of Project Management Office (PMO) 0 * 1 25% 3 75% Portfolio Manager 0 * 1 13% 7 88% Program Manager 7 14% 1 2% 43 84% Project Manager III 1 2% 4 8% 43 90% Project Manager II 2 4% 2 4% 51 93% Project Manager I 1 2% 0 * 47 98% Project Management Specialist 0 * 1 6% 17 94% Project Management Consultant 1 6% 0 * 16 94%
Employee Benefits Offered by Position Description
Company
Car/Allowance Cell Phone Usage Paid Life Insurance
n= Percent n= Percent n= Percent Total 24 10% 98 39% 79 32% Director of Project Management Office (PMO) 0 * 2 50% 3 75% Portfolio Manager 1 13% 5 63% 5 63% Program Manager 5 10% 25 49% 15 29% Project Manager III 7 15% 14 29% 16 33% Project Manager II 4 7% 26 46% 19 34% Project Manager I 3 6% 13 27% 11 23% Project Management Specialist 1 6% 4 22% 5 28% Project Management Consultant 3 18% 9 53% 5 29%

Project Management Salary Survey –Seventh Edition 81
Hong Kong – All Respondents
Mean Number of Vacation Days by Position Description
After 1 Year After 10 Years n= Mean n= Mean
Total 244 15.0 214 18.4 Director of Project Management Office (PMO) 3 16.7 4 20.3 Portfolio Manager 8 14.0 8 19.8 Program Manager 50 15.3 47 18.8 Project Manager III 47 15.3 38 18.4 Project Manager II 54 15.4 51 18.0 Project Manager I 48 14.4 40 18.3 Project Management Specialist 16 14.1 12 17.5 Project Management Consultant 18 14.4 14 17.8
Pension Plans Offered by Position Description
Defined Benefit Plans
Defined Contribution Plans
Other Pension Plans
n= Percent n= Percent n= Percent Total 51 21% 141 57% 33 13% Director of Project Management Office (PMO) 1 25% 3 75% 0 * Portfolio Manager 2 25% 3 38% 3 38% Program Manager 10 20% 28 55% 7 14% Project Manager III 10 20% 30 61% 8 16% Project Manager II 11 20% 35 63% 3 5% Project Manager I 9 20% 26 57% 10 22% Project Management Specialist 4 25% 8 50% 1 6% Project Management Consultant 4 22% 8 44% 1 6%
Mean Hours Worked by Position Description
Hours Expected Actual Hours
Worked n= Mean n= Mean
Total 245 40.9 238 49.5 Director of Project Management Office (PMO) 4 40.3 4 43.8 Portfolio Manager 8 39.9 8 48.3 Program Manager 51 41.2 48 51.1 Project Manager III 47 40.4 46 49.7 Project Manager II 54 41.3 54 50.1 Project Manager I 48 41.1 45 47.8 Project Management Specialist 16 40.6 16 48.4 Project Management Consultant 17 41.0 17 49.7

Project Management Salary Survey –Seventh Edition 82
India – All Respondents
Total Compensation (in Indian Rupees)
Compensation n= 25th Percentile Median 75th Percentile Mean Salary 1,689 1,016,750 1,400,000 1,800,000 1,461,482 Total Compensation 1,689 1,140,000 1,500,000 1,970,000 1,625,608
Reported/Expected Change in Total Compensation over Past/Next 12 Months
Past 12 Months n= Percent Next 12 Months n= Percent Decreased 10 1% Decrease 3 * Remained the same 224 13% Remain the same 55 3% Increased less than 1% 12 1% Increase less than 1% 8 * Increased 1% to 2.9% 50 3% Increase 1% to 2.9% 34 2% Increased 3% to 3.9% 50 3% Increase 3% to 3.9% 38 2% Increased 4% to 4.9% 70 4% Increase 4% to 4.9% 49 3% Increased 5% to 6.9% 145 9% Increase 5% to 6.9% 137 8% Increased 7% to 9.9% 342 20% Increase 7% to 9.9% 276 16% Increased 10% to 14.9% 428 25% Increase 10% to 14.9% 505 30% Increased 15% to 19.9% 153 9% Increase 15% to 19.9% 238 14% Increased 20% to 24.9% 82 5% Increase 20% to 24.9% 137 8% Increased 25% to 29.9% 38 2% Increase 25% to 29.9% 62 4% Increased 30% or greater 85 5% Increase 30% or greater 147 9%
Annualized Salary by Position Description
Position n= Percent 25th Percentile Median 75th Percentile Mean Director of Project Management Office (PMO)
40 2% 1,587,490 2,000,000 2,915,002 2,447,749
Portfolio Manager 81 5% 1,600,000 1,900,000 2,350,000 2,126,401 Program Manager 413 24% 1,350,000 1,670,000 2,000,000 1,741,894 Project Manager III 269 16% 1,177,000 1,400,000 1,800,000 1,481,482 Project Manager II 438 26% 1,000,000 1,200,000 1,550,000 1,282,088 Project Manager I 321 19% 836,000 1,080,000 1,300,000 1,097,134 Project Management Specialist
67 4% 850,000 1,300,000 1,800,000 1,272,367
Project Management Consultant
60 4% 900,000 1,300,000 1,511,148 1,356,514
Annualized Salary by Years Work Experience
Years n= Percent 25th Percentile Median 75th Percentile Mean Less than 3 years 4 * – – – – 3 to less than 5 years 17 1% 480,000 600,000 720,000 651,520 5 to less than 10 years 303 18% 800,000 1,000,000 1,200,000 1,012,663 10 to less than 15 years 894 53% 1,100,000 1,400,000 1,700,000 1,431,345 15 to less than 20 years 327 19% 1,350,000 1,700,000 2,000,000 1,761,791 20 years or more years 144 9% 1,350,009 1,800,000 2,400,000 2,018,073

Project Management Salary Survey –Seventh Edition 83
India – All Respondents
Annualized Salary by Technique Experience
Years n= Percent 25th Percentile Median 75th Percentile Mean Agile Project Management/Scrum
None 717 50% 1,000,000 1,300,000 1,700,000 1,392,550 1 to 5 years 635 45% 1,100,014 1,500,000 1,800,000 1,526,945 6 years or more 68 5% 1,200,000 1,564,500 2,000,000 1,673,925
Extreme Project Management None 794 59% 1,000,000 1,350,000 1,750,000 1,430,493 1 to 5 years 448 33% 1,094,990 1,400,000 1,700,009 1,479,040 6 years or more 110 8% 1,150,000 1,600,000 2,000,000 1,709,349
Process Based Project Management
None 204 14% 1,000,000 1,319,000 1,800,000 1,403,473 1 to 5 years 850 58% 1,000,000 1,300,000 1,634,000 1,361,999 6 years or more 406 28% 1,200,000 1,554,900 2,000,000 1,723,741 Event Chain Project Management
None 933 70% 1,000,000 1,350,000 1,700,000 1,419,145 1 to 5 years 320 24% 1,064,876 1,416,500 1,800,000 1,496,479 6 years or more 89 7% 1,300,000 1,700,000 2,200,000 1,818,224
Interactive Project Management None 447 32% 1,000,000 1,300,000 1,700,000 1,401,168 1 to 5 years 677 49% 1,020,000 1,300,000 1,700,000 1,407,305 6 years or more 254 18% 1,200,000 1,600,000 2,100,000 1,727,920 Incremental Project Management
None 541 39% 1,000,000 1,293,000 1,650,000 1,359,625 1 to 5 years 638 46% 1,059,058 1,400,000 1,700,000 1,456,661 6 years or more 197 14% 1,300,000 1,650,000 2,100,000 1,771,918
Project Portfolio Management None 636 45% 950,000 1,200,000 1,600,000 1,276,100 1 to 5 years 604 43% 1,154,213 1,500,000 1,900,000 1,545,186 6 years or more 160 11% 1,399,997 1,800,000 2,375,000 1,962,781

Project Management Salary Survey –Seventh Edition 84
India – All Respondents
Annualized Salary by Technique Experience (Continued)
Years n= Percent 25th Percentile Median 75th Percentile Mean Program Management
None 450 31% 918,000 1,200,000 1,500,000 1,209,647 1 to 5 years 785 54% 1,100,000 1,499,987 1,800,000 1,503,989 6 years or more 224 15% 1,318,750 1,800,000 2,300,000 1,900,971
Earned Value Management None 462 32% 1,000,000 1,300,000 1,650,022 1,375,222 1 to 5 years 780 55% 1,021,500 1,357,800 1,700,000 1,447,353 6 years or more 187 13% 1,300,000 1,700,000 2,160,000 1,779,182
Lean Project Management
None 705 51% 1,000,000 1,300,000 1,650,000 1,383,944 1 to 5 years 569 41% 1,080,000 1,400,000 1,900,000 1,528,882 6 years or more 115 8% 1,200,000 1,600,000 2,100,000 1,747,284 Critical Chain Project Management
None 690 50% 1,000,000 1,318,919 1,700,000 1,411,442 1 to 5 years 535 39% 1,050,000 1,370,000 1,750,000 1,437,505 6 years or more 150 11% 1,200,000 1,600,000 2,100,000 1,764,601
Waterfall Project Management None 298 20% 855,000 1,200,000 1,600,000 1,299,433 1 to 5 years 681 46% 1,000,000 1,300,000 1,600,000 1,357,423 6 years or more 495 34% 1,280,000 1,599,980 2,000,000 1,692,274
Risk Management None 109 7% 800,000 1,100,000 1,450,000 1,137,426 1 to 5 years 961 63% 1,000,000 1,300,000 1,650,000 1,366,642 6 years or more 449 30% 1,300,000 1,600,000 2,000,000 1,760,045 Change Management
None 103 7% 800,000 1,105,000 1,549,984 1,196,365 1 to 5 years 909 60% 1,000,000 1,300,000 1,650,000 1,372,225 6 years or more 496 33% 1,200,000 1,550,000 2,000,000 1,693,147 Resource Management
None 77 5% 800,000 1,180,000 1,549,984 1,194,257 1 to 5 years 845 56% 1,000,000 1,250,000 1,600,000 1,323,136 6 years or more 579 39% 1,250,000 1,600,000 2,000,000 1,712,348
Annualized Salary by Years Worked in Project Management
Years n= Percent 25th Percentile Median 75th Percentile Mean Less than 3 years 68 4% 700,000 1,040,408 1,262,500 1,015,040 3 to less than 5 years 417 25% 853,000 1,100,000 1,400,000 1,159,605 5 to less than 10 years 967 57% 1,130,000 1,450,000 1,800,000 1,483,637 10 to less than 15 years 174 10% 1,500,000 1,935,500 2,300,000 1,992,325 15 to less than 20 years 50 3% 1,200,000 2,000,000 3,000,000 2,137,562 20 or more years 13 1% 1,696,000 1,750,000 2,500,000 2,126,615

Project Management Salary Survey –Seventh Edition 85
India – All Respondents
Annualized Salary by Highest Formal Education Level Obtained
Education n= Percent 25th Percentile Median 75th Percentile Mean High school degree 9 1% – – – – Some college or Associate’s degree
81 5% 1,070,000 1,400,000 1,700,000 1,397,636
4-year college degree 747 44% 1,000,000 1,300,000 1,700,000 1,378,915 Master’s degree 746 44% 1,100,000 1,400,000 1,800,000 1,524,231 Doctoral degree 106 6% 1,250,000 1,600,000 2,000,000 1,680,840
Annualized Salary by Degree in Project Management
Degree n= Percent 25th Percentile Median 75th Percentile Mean
Have a degree in PM 315 19% 1,050,000 1,400,000 1,800,000 1,488,005 No degree in PM 1,362 81% 1,008,000 1,380,000 1,780,000 1,455,903
Annualized Salary by PMP® Status
Status n= Percent 25th Percentile Median 75th Percentile Mean
Have a PMP® Certification 1,244 74% 1,125,000 1,482,500 1,800,000 1,544,136 PMP for less than 1 year 56 5% 874,000 1,089,995 1,325,000 1,153,459 PMP for 1 to less than 5 years 966 78% 1,100,000 1,400,000 1,716,832 1,458,940
PMP for 5 to less than 10 years
206 17% 1,500,000 1,900,000 2,300,022 2,027,284
PMP for 10 to less than 20 years
6 * – – – –
PMP for 20 or more years 0 * – – – – Do not have a PMP® Certification 445 26% 860,000 1,198,000 1,500,000 1,230,421
Annualized Salary by Amount of Training Per Year
Employees n= Percent 25th Percentile Median 75th Percentile Mean Less than 5 days 444 27% 1,025,150 1,400,000 1,764,993 1,455,624 5 to 9 days 523 31% 1,074,000 1,400,000 1,800,000 1,496,494 10 days or more 697 42% 1,000,000 1,330,000 1,742,580 1,442,182
Annualized Salary by Gender
Gender n= Percent 25th Percentile Median 75th Percentile Mean Male 1,500 91% 1,050,000 1,400,000 1,800,000 1,479,934 Female 153 9% 1,000,000 1,180,000 1,600,000 1,307,515

Project Management Salary Survey –Seventh Edition 86
India – All Respondents
Annualized Salary by Department
Department n= Percent 25th Percentile Median 75th Percentile Mean Administration/ General Management
30 2% 1,110,808 1,725,000 2,100,000 1,690,882
Consulting 108 6% 1,200,000 1,575,000 2,000,000 1,727,045 Customer Service/ Public Relations
10 1% 644,000 1,300,000 2,000,000 1,516,399
Engineering 82 5% 960,000 1,337,500 1,800,000 1,483,663 Finance 30 2% 1,200,000 1,400,000 1,800,000 1,587,926 Human Resources 8 * – – – – Information Technology/ Information Systems
777 46% 1,089,979 1,400,000 1,700,000 1,430,576
Operations/Manufacturing 28 2% 783,742 975,000 1,600,000 1,293,078 Project Management Department or PMO
446 27% 1,000,000 1,300,000 1,700,000 1,403,059
Quality Management 63 4% 1,000,000 1,400,000 1,700,000 1,419,932 Research and Development 43 3% 1,250,004 1,600,000 2,000,000 1,724,531 Sales/Marketing 16 1% 1,275,000 1,810,000 2,500,000 2,060,624 Supply Chain Management/Logistics 17 1% 960,000 1,350,000 1,800,000 1,338,633
Training/Education 4 * – – – – Other 19 1% 800,000 1,380,000 1,650,000 1,264,200
Annualized Salary by Industry
Industry n= Percent 25th Percentile Median 75th Percentile Mean
Aerospace 18 1% 850,000 1,200,000 1,550,000 1,321,107 Business Services 19 1% 650,000 1,100,000 1,399,994 1,163,109 Construction 19 1% 840,000 1,200,000 1,800,000 1,410,417 Consulting 92 5% 1,000,000 1,350,000 2,000,000 1,609,799 Engineering 82 5% 1,000,000 1,200,000 1,800,011 1,470,311 Financial Services 55 3% 1,200,000 1,550,000 1,850,000 1,575,353 Food and Beverage 0 * – – – – Government 4 * – – – – Healthcare 18 1% 1,000,000 1,425,000 1,900,000 1,491,667 Information Technology 1,192 71% 1,050,000 1,399,997 1,700,000 1,436,282 Insurance 10 1% 1,180,000 1,220,004 1,700,000 1,429,002 Legal 0 * – – – – Manufacturing 47 3% 1,200,000 1,500,000 2,000,000 1,605,271 Pharmaceuticals 8 * – – – – Real Estate 4 * – – – – Resources (Agriculture, Mining, etc.)
7 * – – – –
Telecommunications 96 6% 1,100,000 1,548,000 2,000,000 1,636,268 Training/Education 2 * – – – – Utility 8 * – – – – Other 8 * – – – –

Project Management Salary Survey –Seventh Edition 87
India – All Respondents
Annualized by Type of Project
Project Type n= Percent 25th Percentile Median 75th Percentile Mean Business Transformation 310 18% 1,200,000 1,500,000 2,000,000 1,608,042 Construction 54 3% 978,999 1,300,000 2,000,000 1,582,480 Engineering 195 12% 1,000,000 1,350,000 1,800,000 1,439,144 Information Technology 1,372 81% 1,080,000 1,400,000 1,800,000 1,464,559 Manufacturing 76 5% 1,000,000 1,265,000 1,625,000 1,345,509 Operations 261 15% 1,000,000 1,400,000 1,800,000 1,515,128 Quality Management 233 14% 1,032,000 1,400,000 1,800,000 1,472,700 Regulatory Compliance 61 4% 1,150,000 1,600,000 1,900,005 1,575,212 Research and Development 136 8% 1,041,000 1,437,500 1,909,839 1,586,969 Supply Chain Management/Logistics 103 6% 1,150,000 1,500,000 1,850,000 1,502,923
Other 58 3% 1,000,000 1,500,000 1,850,000 1,575,223
Annualized Salary by Number of Employees in Entire Organization
Employees n= Percent 25th Percentile Median 75th Percentile Mean Less than 100 67 4% 990,000 1,250,004 1,800,000 1,421,949 100-299 89 5% 1,084,000 1,400,000 1,785,000 1,446,816 300 to 999 114 7% 1,000,000 1,350,000 1,800,000 1,455,490 1000 to 2499 122 7% 1,000,000 1,517,500 1,900,000 1,538,169 2500 to 4999 140 8% 1,000,000 1,374,260 1,757,210 1,460,336 5000 to 9999 123 7% 1,025,000 1,330,000 1,700,000 1,410,562 10,000 or more 1,034 61% 1,050,000 1,400,000 1,779,986 1,463,131
Annualized Salary by Average Project Team Size
Employees n= Percent 25th Percentile Median 75th Percentile Mean
1-4 people 68 5% 860,000 1,094,000 1,337,500 1,164,221 5-9 people 258 17% 950,000 1,200,000 1,600,000 1,326,355 10-14 people 323 22% 1,000,000 1,300,000 1,629,996 1,361,219 15-19 people 180 12% 1,021,000 1,310,000 1,700,000 1,424,973 20 or more people 661 44% 1,200,000 1,500,000 1,900,000 1,600,567
Annualized Salary by Average Project Budget (in USD)
Employees n= Percent 25th Percentile Median 75th Percentile Mean
Less than $100,000 210 14% 900,000 1,200,000 1,600,000 1,257,001 $100,000 to $499,999 460 31% 1,000,000 1,300,000 1,600,000 1,361,831 $500,000 to $999,999 254 17% 1,100,000 1,400,000 1,800,000 1,485,325 $1 million to $10 million 456 31% 1,200,000 1,500,000 1,900,000 1,584,966 More than $10 million 111 7% 1,130,000 1,640,000 2,300,000 1,763,876

Project Management Salary Survey –Seventh Edition 88
India – All Respondents
Project Management Career Path within Organization
n= Percent Yes - Clearly defined/in writing 598 36% Yes - Informal 829 50% No 196 12% Don't Know 51 3%
Project Management Career Path Connected to Roles in Upper Management
n= Percent Yes - Clearly defined/in writing 490 35% Yes - Informal 731 52% No 112 8% Don't Know 79 6%
Defined Set of Performance Skills for Project Managers within Organization
n= Percent Yes - Clearly defined/in writing 849 51% Yes - Informal 578 35% No 188 11% Don't Know 41 2%
Equities Offered in Past Year by Position Description
Stock Options Stock
(i.e., Shares) Neither n= Percent n= Percent n= Percent
Total 152 9% 106 6% 1,426 85% Director of Project Management Office (PMO) 7 18% 2 5% 31 79% Portfolio Manager 14 17% 8 10% 59 73% Program Manager 46 11% 33 8% 332 81% Project Manager III 28 11% 15 6% 227 85% Project Manager II 29 7% 28 6% 379 87% Project Manager I 21 7% 12 4% 284 90% Project Management Specialist 6 9% 6 9% 58 88% Project Management Consultant 1 2% 2 3% 56 95%
Employee Benefits Offered by Position Description
Company
Car/Allowance Cell Phone Usage Paid Life Insurance
n= Percent n= Percent n= Percent Total 522 31% 912 55% 689 41% Director of Project Management Office (PMO) 12 30% 33 83% 22 55% Portfolio Manager 23 29% 68 86% 38 48% Program Manager 152 37% 280 68% 180 44% Project Manager III 83 31% 141 53% 112 42% Project Manager II 126 29% 216 50% 180 42% Project Manager I 91 29% 120 38% 107 34% Project Management Specialist 18 28% 30 46% 26 40% Project Management Consultant 17 29% 24 41% 24 41%
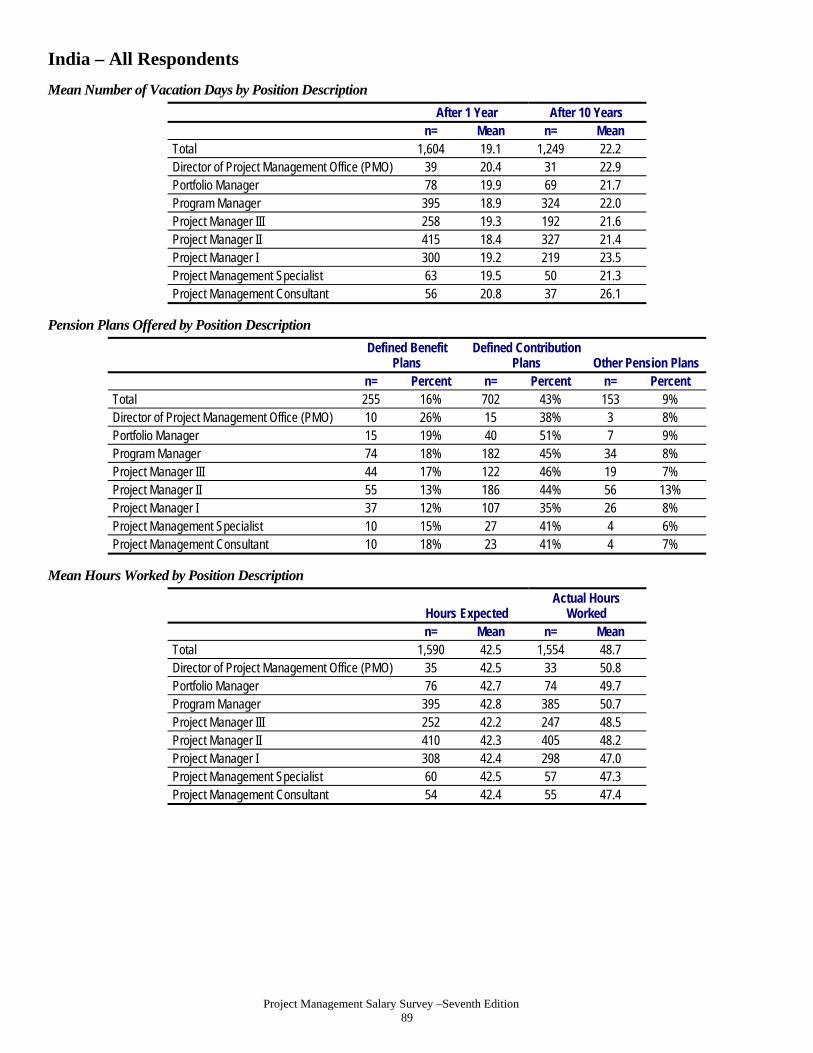
Project Management Salary Survey –Seventh Edition 89
India – All Respondents
Mean Number of Vacation Days by Position Description
After 1 Year After 10 Years n= Mean n= Mean
Total 1,604 19.1 1,249 22.2 Director of Project Management Office (PMO) 39 20.4 31 22.9 Portfolio Manager 78 19.9 69 21.7 Program Manager 395 18.9 324 22.0 Project Manager III 258 19.3 192 21.6 Project Manager II 415 18.4 327 21.4 Project Manager I 300 19.2 219 23.5 Project Management Specialist 63 19.5 50 21.3 Project Management Consultant 56 20.8 37 26.1
Pension Plans Offered by Position Description
Defined Benefit Plans
Defined Contribution Plans Other Pension Plans
n= Percent n= Percent n= Percent Total 255 16% 702 43% 153 9% Director of Project Management Office (PMO) 10 26% 15 38% 3 8% Portfolio Manager 15 19% 40 51% 7 9% Program Manager 74 18% 182 45% 34 8% Project Manager III 44 17% 122 46% 19 7% Project Manager II 55 13% 186 44% 56 13% Project Manager I 37 12% 107 35% 26 8% Project Management Specialist 10 15% 27 41% 4 6% Project Management Consultant 10 18% 23 41% 4 7%
Mean Hours Worked by Position Description
Hours Expected Actual Hours
Worked n= Mean n= Mean
Total 1,590 42.5 1,554 48.7 Director of Project Management Office (PMO) 35 42.5 33 50.8 Portfolio Manager 76 42.7 74 49.7 Program Manager 395 42.8 385 50.7 Project Manager III 252 42.2 247 48.5 Project Manager II 410 42.3 405 48.2 Project Manager I 308 42.4 298 47.0 Project Management Specialist 60 42.5 57 47.3 Project Management Consultant 54 42.4 55 47.4

Project Management Salary Survey –Seventh Edition 90
Ireland – All Respondents
Total Compensation (in European Union Euros)
Compensation n= 25th Percentile Median 75th Percentile Mean Salary 386 56,000 70,000 82,000 70,959 Total Compensation 386 60,000 75,000 94,000 79,194
Reported/Expected Change in Total Compensation over Past/Next 12 Months
Past 12 Months n= Percent Next 12 Months n= Percent Decreased 69 18% Decrease 37 10% Remained the same 149 39% Remain the same 156 40% Increased less than 1% 10 3% Increase less than 1% 20 5% Increased 1% to 2.9% 75 19% Increase 1% to 2.9% 73 19% Increased 3% to 3.9% 19 5% Increase 3% to 3.9% 30 8% Increased 4% to 4.9% 10 3% Increase 4% to 4.9% 12 3% Increased 5% to 6.9% 13 3% Increase 5% to 6.9% 21 5% Increased 7% to 9.9% 9 2% Increase 7% to 9.9% 10 3% Increased 10% to 14.9% 17 4% Increase 10% to 14.9% 16 4% Increased 15% to 19.9% 7 2% Increase 15% to 19.9% 6 2% Increased 20% to 24.9% 5 1% Increase 20% to 24.9% 3 1% Increased 25% to 29.9% 0 * Increase 25% to 29.9% 0 * Increased 30% or greater 3 1% Increase 30% or greater 2 1%
Annualized Salary by Position Description
Position n= Percent 25th Percentile Median 75th Percentile Mean Director of Project Management Office (PMO)
24 6% 70,000 81,000 96,500 81,808
Portfolio Manager 27 7% 71,000 92,000 110,000 93,562 Program Manager 82 21% 62,000 74,500 88,000 75,716 Project Manager III 93 24% 60,000 70,000 80,000 70,078 Project Manager II 77 20% 55,000 63,000 75,000 64,032 Project Manager I 50 13% 48,600 54,500 65,000 56,152 Project Management Specialist
16 4% 52,000 70,000 84,217 66,965
Project Management Consultant
17 4% 64,000 73,000 94,000 80,294
Annualized Salary by Years Work Experience
Years n= Percent 25th Percentile Median 75th Percentile Mean
Less than 3 years 2 1% – – – – 3 to less than 5 years 4 1% – – – – 5 to less than 10 years 41 11% 42,800 46,000 58,000 50,033 10 to less than 15 years 115 30% 53,000 63,000 71,111 65,499 15 to less than 20 years 88 23% 63,250 71,250 84,217 74,239 20 years or more years 136 35% 70,000 80,000 95,000 81,039
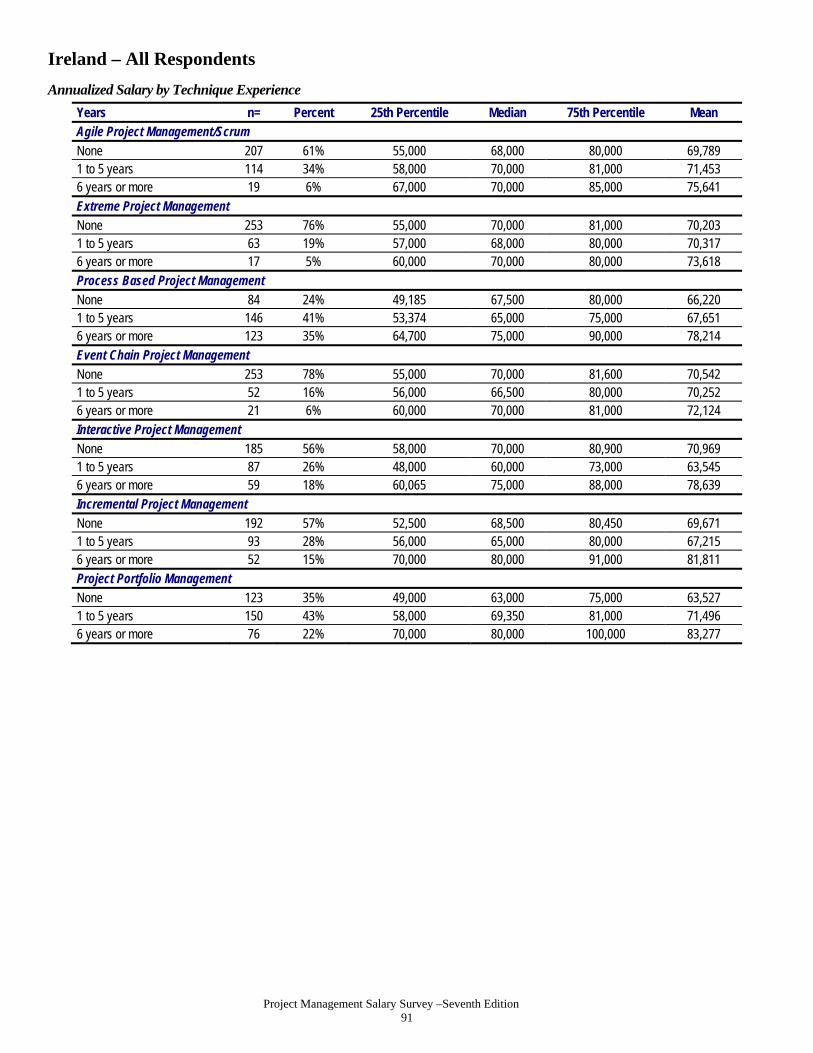
Project Management Salary Survey –Seventh Edition 91
Ireland – All Respondents
Annualized Salary by Technique Experience
Years n= Percent 25th Percentile Median 75th Percentile Mean Agile Project Management/Scrum
None 207 61% 55,000 68,000 80,000 69,789 1 to 5 years 114 34% 58,000 70,000 81,000 71,453 6 years or more 19 6% 67,000 70,000 85,000 75,641
Extreme Project Management None 253 76% 55,000 70,000 81,000 70,203 1 to 5 years 63 19% 57,000 68,000 80,000 70,317 6 years or more 17 5% 60,000 70,000 80,000 73,618
Process Based Project Management
None 84 24% 49,185 67,500 80,000 66,220 1 to 5 years 146 41% 53,374 65,000 75,000 67,651 6 years or more 123 35% 64,700 75,000 90,000 78,214 Event Chain Project Management
None 253 78% 55,000 70,000 81,600 70,542 1 to 5 years 52 16% 56,000 66,500 80,000 70,252 6 years or more 21 6% 60,000 70,000 81,000 72,124
Interactive Project Management None 185 56% 58,000 70,000 80,900 70,969 1 to 5 years 87 26% 48,000 60,000 73,000 63,545 6 years or more 59 18% 60,065 75,000 88,000 78,639 Incremental Project Management
None 192 57% 52,500 68,500 80,450 69,671 1 to 5 years 93 28% 56,000 65,000 80,000 67,215 6 years or more 52 15% 70,000 80,000 91,000 81,811
Project Portfolio Management None 123 35% 49,000 63,000 75,000 63,527 1 to 5 years 150 43% 58,000 69,350 81,000 71,496 6 years or more 76 22% 70,000 80,000 100,000 83,277

Project Management Salary Survey –Seventh Edition 92
Ireland – All Respondents
Annualized Salary by Technique Experience (Continued)
Years n= Percent 25th Percentile Median 75th Percentile Mean Program Management
None 91 26% 48,000 60,000 75,000 61,849 1 to 5 years 164 46% 58,000 68,500 80,000 70,444 6 years or more 100 28% 67,500 80,000 95,000 81,340
Earned Value Management None 150 44% 52,000 68,500 78,000 66,332 1 to 5 years 129 38% 56,000 67,500 83,000 72,233 6 years or more 60 18% 64,500 75,000 91,000 78,521
Lean Project Management
None 202 59% 56,000 70,000 80,900 70,145 1 to 5 years 116 34% 55,500 67,250 80,500 69,809 6 years or more 25 7% 70,000 71,111 90,000 81,072 Critical Chain Project Management
None 192 58% 55,500 68,000 80,450 69,517 1 to 5 years 93 28% 53,374 66,000 78,000 68,258 6 years or more 46 14% 65,000 78,500 90,000 80,210
Waterfall Project Management None 152 44% 53,187 65,000 80,000 68,132 1 to 5 years 75 22% 50,000 62,500 70,000 62,712 6 years or more 119 34% 69,000 78,800 87,000 79,252
Risk Management None 42 12% 50,000 65,500 75,000 63,584 1 to 5 years 175 49% 50,000 63,000 75,000 64,475 6 years or more 140 39% 65,000 79,400 93,000 80,489 Change Management
None 45 13% 48,000 64,000 75,800 62,083 1 to 5 years 158 44% 50,000 62,101 75,000 66,189 6 years or more 154 43% 65,000 75,000 88,000 78,700 Resource Management
None 41 12% 50,000 62,000 70,000 62,778 1 to 5 years 153 43% 49,200 62,175 75,000 64,249 6 years or more 159 45% 65,000 78,400 91,440 79,564
Annualized Salary by Years Worked in Project Management
Years n= Percent 25th Percentile Median 75th Percentile Mean Less than 3 years 14 4% 40,000 50,500 60,000 49,643 3 to less than 5 years 54 14% 43,500 51,000 65,000 57,733 5 to less than 10 years 162 42% 55,000 65,000 74,000 66,099 10 to less than 15 years 100 26% 65,000 75,000 88,000 77,760 15 to less than 20 years 37 10% 80,000 85,000 100,000 88,477 20 or more years 19 5% 83,200 90,000 100,000 95,774

Project Management Salary Survey –Seventh Edition 93
Ireland – All Respondents
Annualized Salary by Highest Formal Education Level Obtained
Education n= Percent 25th Percentile Median 75th Percentile Mean High school degree 11 3% 55,000 86,400 95,000 78,506 Some college or Associate's degree
39 10% 57,000 70,000 83,434 71,027
4-year college degree 172 45% 56,000 69,350 80,000 69,129 Master's degree 145 38% 58,000 70,000 84,000 73,497 Doctoral degree 19 5% 50,000 62,000 75,000 63,637
Annualized Salary by Degree in Project Management
Degree n= Percent 25th Percentile Median 75th Percentile Mean
Have a degree in PM 86 22% 55,000 65,500 85,000 70,975 No degree in PM 299 78% 56,000 70,000 81,600 70,900
Annualized Salary by PMP® Status
Status n= Percent 25th Percentile Median 75th Percentile Mean
Have a PMP® Certification 271 70% 58,000 70,000 82,000 71,961 PMP for less than 1 year 7 3% – – – – PMP for 1 to less than 5 years 203 75% 56,000 67,000 80,000 69,742
PMP for 5 to less than 10 years
48 18% 67,000 80,000 87,500 79,034
PMP for 10 to less than 20 years
13 5% 77,000 80,000 95,000 89,569
PMP for 20 or more years 0 * – – – – Do not have a PMP® Certification 115 30% 50,000 66,000 80,900 68,597
Annualized Salary by Amount of Training Per Year
Employees n= Percent 25th Percentile Median 75th Percentile Mean Less than 5 days 164 43% 58,000 70,000 82,500 72,122 5 to 9 days 131 34% 58,000 70,000 84,000 71,236 10 days or more 88 23% 52,687 65,000 80,000 68,217
Annualized Salary by Gender
Gender n= Percent 25th Percentile Median 75th Percentile Mean Male 285 77% 59,000 70,000 83,434 73,027 Female 85 23% 48,000 63,000 75,000 64,303

Project Management Salary Survey –Seventh Edition 94
Ireland – All Respondents
Annualized Salary by Department
Department n= Percent 25th Percentile Median 75th Percentile Mean Administration/ General Management
23 6% 50,000 65,000 100,000 75,930
Consulting 28 7% 53,000 65,000 80,000 67,950 Customer Service/ Public Relations
5 1% – – – –
Engineering 36 9% 53,500 65,000 76,000 65,658 Finance 8 2% – – – – Human Resources 2 1% – – – – Information Technology/ Information Systems
102 26% 60,000 70,000 80,000 70,509
Operations/Manufacturing 15 4% 58,000 70,000 90,000 71,509 Project Management Department or PMO
112 29% 54,500 70,000 86,000 72,558
Quality Management 8 2% – – – – Research and Development 19 5% 53,000 61,500 75,000 62,589 Sales/Marketing 9 2% – – – – Supply Chain Management/Logistics 6 2% – – – –
Training/Education 3 1% – – – – Other 9 2% – – – –
Annualized Salary by Industry
Industry n= Percent 25th Percentile Median 75th Percentile Mean
Aerospace 0 * – – – – Business Services 7 2% – – – – Construction 18 5% 53,000 67,500 86,400 72,389 Consulting 19 5% 65,000 74,000 82,000 74,553 Engineering 29 8% 45,000 64,000 75,390 63,417 Financial Services 51 13% 64,375 80,000 90,000 78,888 Food and Beverage 4 1% – – – – Government 4 1% – – – – Healthcare 3 1% – – – – Information Technology 121 31% 58,000 70,000 80,000 70,534 Insurance 13 3% 60,000 67,000 75,000 66,315 Legal 0 * – – – – Manufacturing 25 6% 55,000 70,000 82,000 70,854 Pharmaceuticals 16 4% 60,000 73,000 80,500 72,234 Real Estate 0 * – – – – Resources (Agriculture, Mining, etc.)
1 * – – – –
Telecommunications 49 13% 50,000 60,000 70,000 61,847 Training/Education 6 2% – – – – Utility 12 3% 65,000 82,500 121,000 88,958 Other 8 2% – – – –
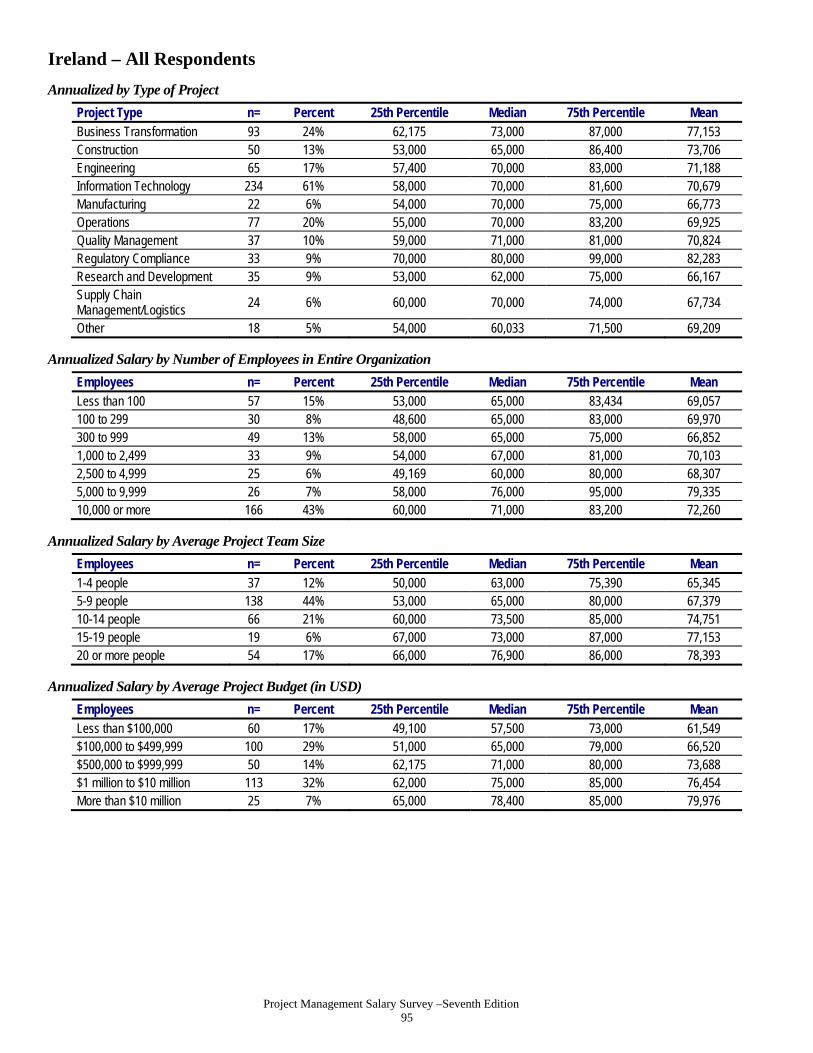
Project Management Salary Survey –Seventh Edition 95
Ireland – All Respondents
Annualized by Type of Project
Project Type n= Percent 25th Percentile Median 75th Percentile Mean Business Transformation 93 24% 62,175 73,000 87,000 77,153 Construction 50 13% 53,000 65,000 86,400 73,706 Engineering 65 17% 57,400 70,000 83,000 71,188 Information Technology 234 61% 58,000 70,000 81,600 70,679 Manufacturing 22 6% 54,000 70,000 75,000 66,773 Operations 77 20% 55,000 70,000 83,200 69,925 Quality Management 37 10% 59,000 71,000 81,000 70,824 Regulatory Compliance 33 9% 70,000 80,000 99,000 82,283 Research and Development 35 9% 53,000 62,000 75,000 66,167 Supply Chain Management/Logistics 24 6% 60,000 70,000 74,000 67,734
Other 18 5% 54,000 60,033 71,500 69,209
Annualized Salary by Number of Employees in Entire Organization
Employees n= Percent 25th Percentile Median 75th Percentile Mean Less than 100 57 15% 53,000 65,000 83,434 69,057 100 to 299 30 8% 48,600 65,000 83,000 69,970 300 to 999 49 13% 58,000 65,000 75,000 66,852 1,000 to 2,499 33 9% 54,000 67,000 81,000 70,103 2,500 to 4,999 25 6% 49,169 60,000 80,000 68,307 5,000 to 9,999 26 7% 58,000 76,000 95,000 79,335 10,000 or more 166 43% 60,000 71,000 83,200 72,260
Annualized Salary by Average Project Team Size
Employees n= Percent 25th Percentile Median 75th Percentile Mean
1-4 people 37 12% 50,000 63,000 75,390 65,345 5-9 people 138 44% 53,000 65,000 80,000 67,379 10-14 people 66 21% 60,000 73,500 85,000 74,751 15-19 people 19 6% 67,000 73,000 87,000 77,153 20 or more people 54 17% 66,000 76,900 86,000 78,393
Annualized Salary by Average Project Budget (in USD)
Employees n= Percent 25th Percentile Median 75th Percentile Mean
Less than $100,000 60 17% 49,100 57,500 73,000 61,549 $100,000 to $499,999 100 29% 51,000 65,000 79,000 66,520 $500,000 to $999,999 50 14% 62,175 71,000 80,000 73,688 $1 million to $10 million 113 32% 62,000 75,000 85,000 76,454 More than $10 million 25 7% 65,000 78,400 85,000 79,976

Project Management Salary Survey –Seventh Edition 96
Ireland – All Respondents
Project Management Career Path within Organization
n= Percent Yes - Clearly defined/in writing 80 21% Yes - Informal 171 44% No 127 33% Don't Know 7 2%
Project Management Career Path Connected to Roles in Upper Management
n= Percent Yes - Clearly defined/in writing 54 22% Yes - Informal 145 58% No 32 13% Don't Know 19 8%
Defined Set of Performance Skills for Project Managers within Organization
n= Percent Yes - Clearly defined/in writing 149 39% Yes - Informal 111 29% No 112 29% Don't Know 13 3%
Equities Offered in Past Year by Position Description
Stock Options Stock
(i.e., Shares) Neither n= Percent n= Percent n= Percent
Total 51 13% 58 15% 282 74% Director of Project Management Office (PMO) 5 21% 2 8% 17 71% Portfolio Manager 3 11% 5 19% 20 74% Program Manager 11 14% 14 17% 60 74% Project Manager III 9 10% 20 22% 64 70% Project Manager II 14 18% 8 10% 57 74% Project Manager I 8 17% 7 15% 34 71% Project Management Specialist 0 * 1 6% 15 94% Project Management Consultant 1 6% 1 6% 15 88%
Employee Benefits Offered by Position Description
Company
Car/Allowance
Cell Phone Usage Paid Life Insurance
n= Percent n= Percent n= Percent Total 131 34% 231 60% 160 42% Director of Project Management Office (PMO) 9 38% 18 75% 13 54% Portfolio Manager 14 52% 21 78% 15 56% Program Manager 38 46% 50 61% 44 54% Project Manager III 32 35% 59 64% 34 37% Project Manager II 15 19% 47 61% 28 36% Project Manager I 11 23% 22 46% 18 38% Project Management Specialist 5 31% 5 31% 3 19% Project Management Consultant 7 41% 9 53% 5 29%

Project Management Salary Survey –Seventh Edition 97
Ireland – All Respondents
Mean Number of Vacation Days by Position Description
After 1 Year After 10 Years n= Mean n= Mean
Total 359 21.9 362 24.3 Director of Project Management Office (PMO) 23 23.2 23 25.6 Portfolio Manager 24 22.1 27 24.4 Program Manager 76 22.2 78 25.0 Project Manager III 89 21.6 85 24.1 Project Manager II 72 22.1 72 24.3 Project Manager I 48 21.8 49 23.6 Project Management Specialist 12 21.3 13 23.3 Project Management Consultant 15 20.1 15 21.8
Pension Plans Offered by Position Description
Defined Benefit
Plans Defined Contribution
Plans Other Pension Plans
n= Percent n= Percent n= Percent Total 93 24% 251 65% 22 6% Director of Project Management Office (PMO) 2 8% 20 83% 1 4% Portfolio Manager 3 11% 23 85% 1 4% Program Manager 29 35% 54 66% 6 7% Project Manager III 24 26% 55 59% 4 4% Project Manager II 19 25% 49 64% 5 6% Project Manager I 10 20% 35 70% 3 6% Project Management Specialist 2 13% 7 47% 1 7% Project Management Consultant 4 24% 8 47% 1 6%
Mean Hours Worked by Position Description
Hours Expected Actual Hours
Worked n= Mean n= Mean
Total 383 38.5 376 46.3 Director of Project Management Office (PMO) 24 37.9 23 47.6 Portfolio Manager 27 39.1 26 47.6 Program Manager 82 38.1 82 47.2 Project Manager III 92 38.6 89 45.7 Project Manager II 76 38.6 75 45.9 Project Manager I 50 38.8 49 45.3 Project Management Specialist 15 38.5 15 43.9 Project Management Consultant 17 37.8 17 46.8
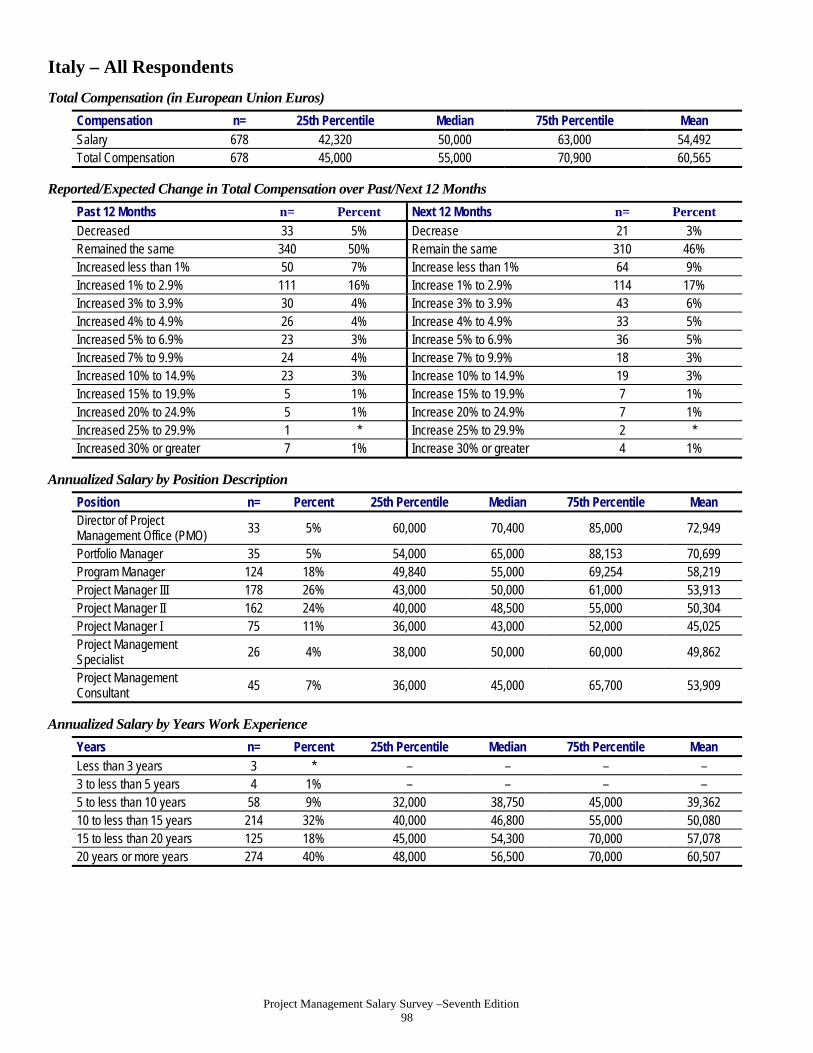
Project Management Salary Survey –Seventh Edition 98
Italy – All Respondents
Total Compensation (in European Union Euros)
Compensation n= 25th Percentile Median 75th Percentile Mean Salary 678 42,320 50,000 63,000 54,492 Total Compensation 678 45,000 55,000 70,900 60,565
Reported/Expected Change in Total Compensation over Past/Next 12 Months
Past 12 Months n= Percent Next 12 Months n= Percent
Decreased 33 5% Decrease 21 3% Remained the same 340 50% Remain the same 310 46% Increased less than 1% 50 7% Increase less than 1% 64 9% Increased 1% to 2.9% 111 16% Increase 1% to 2.9% 114 17% Increased 3% to 3.9% 30 4% Increase 3% to 3.9% 43 6% Increased 4% to 4.9% 26 4% Increase 4% to 4.9% 33 5% Increased 5% to 6.9% 23 3% Increase 5% to 6.9% 36 5% Increased 7% to 9.9% 24 4% Increase 7% to 9.9% 18 3% Increased 10% to 14.9% 23 3% Increase 10% to 14.9% 19 3% Increased 15% to 19.9% 5 1% Increase 15% to 19.9% 7 1% Increased 20% to 24.9% 5 1% Increase 20% to 24.9% 7 1% Increased 25% to 29.9% 1 * Increase 25% to 29.9% 2 * Increased 30% or greater 7 1% Increase 30% or greater 4 1%
Annualized Salary by Position Description
Position n= Percent 25th Percentile Median 75th Percentile Mean Director of Project Management Office (PMO) 33 5% 60,000 70,400 85,000 72,949
Portfolio Manager 35 5% 54,000 65,000 88,153 70,699 Program Manager 124 18% 49,840 55,000 69,254 58,219 Project Manager III 178 26% 43,000 50,000 61,000 53,913 Project Manager II 162 24% 40,000 48,500 55,000 50,304 Project Manager I 75 11% 36,000 43,000 52,000 45,025 Project Management Specialist
26 4% 38,000 50,000 60,000 49,862
Project Management Consultant 45 7% 36,000 45,000 65,700 53,909
Annualized Salary by Years Work Experience
Years n= Percent 25th Percentile Median 75th Percentile Mean Less than 3 years 3 * – – – – 3 to less than 5 years 4 1% – – – – 5 to less than 10 years 58 9% 32,000 38,750 45,000 39,362 10 to less than 15 years 214 32% 40,000 46,800 55,000 50,080 15 to less than 20 years 125 18% 45,000 54,300 70,000 57,078 20 years or more years 274 40% 48,000 56,500 70,000 60,507

Project Management Salary Survey –Seventh Edition 99
Italy – All Respondents
Annualized Salary by Technique Experience
Years n= Percent 25th Percentile Median 75th Percentile Mean Agile Project Management/Scrum
None 430 73% 42,000 50,000 61,693 53,621 1 to 5 years 135 23% 44,000 51,000 70,000 56,625 6 years or more 22 4% 50,000 55,000 70,000 60,477
Extreme Project Management None 431 75% 41,604 50,000 63,000 53,537 1 to 5 years 104 18% 45,000 50,000 62,500 55,693 6 years or more 39 7% 50,000 55,000 74,000 61,145
Process Based Project Management
None 153 26% 44,000 51,732 65,000 56,916 1 to 5 years 229 39% 40,000 46,400 57,600 50,083 6 years or more 212 36% 45,190 55,000 65,350 57,874 Event Chain Project Management
None 395 69% 42,000 50,000 63,000 54,678 1 to 5 years 131 23% 40,000 50,000 60,000 52,404 6 years or more 50 9% 47,000 54,800 65,000 57,541
Interactive Project Management None 338 59% 42,000 50,000 64,000 54,450 1 to 5 years 141 24% 40,000 49,500 60,000 50,663 6 years or more 97 17% 48,000 55,000 70,869 61,287 Incremental Project Management
None 366 63% 41,000 50,000 62,000 53,357 1 to 5 years 137 24% 44,000 50,000 60,000 53,824 6 years or more 75 13% 47,000 58,500 70,000 60,967
Project Portfolio Management None 292 49% 40,000 47,000 55,000 49,414 1 to 5 years 220 37% 45,000 50,000 65,350 56,425 6 years or more 81 14% 54,600 65,000 76,000 68,551

Project Management Salary Survey –Seventh Edition 100
Italy – All Respondents
Annualized Salary by Technique Experience (Continued)
Years n= Percent 25th Percentile Median 75th Percentile Mean Program Management
None 194 32% 36,996 45,000 55,000 48,437 1 to 5 years 262 43% 43,500 50,000 62,000 53,528 6 years or more 147 24% 50,000 60,000 75,000 64,776
Earned Value Management None 146 24% 40,000 50,000 63,000 53,042 1 to 5 years 294 48% 42,000 50,000 60,000 52,337 6 years or more 174 28% 46,000 55,000 70,000 59,391
Lean Project Management
None 375 65% 42,000 50,000 62,500 53,837 1 to 5 years 155 27% 42,000 50,000 60,190 53,849 6 years or more 43 8% 47,000 55,000 67,000 60,403 Critical Chain Project Management
None 247 42% 43,000 50,000 64,000 54,129 1 to 5 years 226 39% 40,000 48,750 60,000 52,263 6 years or more 113 19% 45,380 55,000 70,000 59,391
Waterfall Project Management None 344 59% 40,708 49,000 60,000 53,004 1 to 5 years 114 19% 40,000 50,000 60,000 52,098 6 years or more 128 22% 49,000 55,000 70,000 59,903
Risk Management None 73 12% 40,000 47,000 57,600 50,410 1 to 5 years 331 54% 40,416 49,000 58,000 50,803 6 years or more 206 34% 47,000 59,250 73,000 61,520 Change Management
None 93 15% 38,000 45,000 55,000 49,129 1 to 5 years 268 45% 40,000 48,000 57,685 50,740 6 years or more 241 40% 48,000 58,000 70,000 60,833 Resource Management
None 67 11% 40,000 45,000 55,000 48,626 1 to 5 years 222 37% 38,500 45,000 54,000 48,134 6 years or more 313 52% 47,500 55,000 70,000 60,379
Annualized Salary by Years Worked in Project Management
Years n= Percent 25th Percentile Median 75th Percentile Mean Less than 3 years 9 1% – – – – 3 to less than 5 years 48 7% 37,000 43,557 49,500 43,968 5 to less than 10 years 303 45% 40,000 48,000 57,600 50,044 10 to less than 15 years 215 32% 45,600 55,000 65,700 58,287 15 to less than 20 years 77 11% 50,000 61,000 75,000 64,671 20 or more years 26 4% 46,000 64,000 88,153 70,819

Project Management Salary Survey –Seventh Edition 101
Italy – All Respondents \
Annualized Salary by Highest Formal Education Level Obtained
Education n= Percent 25th Percentile Median 75th Percentile Mean High school degree 129 19% 45,000 50,000 60,000 53,943 Some college or Associate's degree
17 3% 40,000 50,000 64,000 55,282
4-year college degree 111 16% 42,000 50,000 63,000 54,695 Master's degree 344 51% 41,500 50,000 63,750 54,368 Doctoral degree 77 11% 43,000 52,000 64,000 55,501
Annualized Salary by Degree in Project Management
Degree n= Percent 25th Percentile Median 75th Percentile Mean
Have a degree in PM 83 12% 43,000 50,000 62,000 54,347 No degree in PM 586 88% 42,000 50,000 63,000 54,481
Annualized Salary by PMP® Status
Status n= Percent 25th Percentile Median 75th Percentile Mean
Have a PMP® Certification 558 82% 43,000 50,000 64,000 55,291 PMP for less than 1 year 7 1% – – – – PMP for 1 to less than 5 years 418 75% 42,000 50,000 60,190 52,896
PMP for 5 to less than 10 years
113 20% 46,000 56,000 70,000 61,102
PMP for 10 to less than 20 years
17 3% 58,000 70,000 80,000 76,420
PMP for 20 or more years 0 * – – – – Do not have a PMP® Certification 120 18% 39,750 47,500 58,500 50,778
Annualized Salary by Amount of Training Per Year
Employees n= Percent 25th Percentile Median 75th Percentile Mean Less than 5 days 195 29% 42,320 50,600 65,000 55,141 5 to 9 days 259 39% 43,000 50,000 62,000 53,949 10 days or more 211 32% 40,000 50,000 63,500 54,500
Annualized Salary by Gender
Gender n= Percent 25th Percentile Median 75th Percentile Mean Male 559 84% 43,000 50,000 64,848 55,266 Female 104 16% 38,563 48,782 54,300 49,819
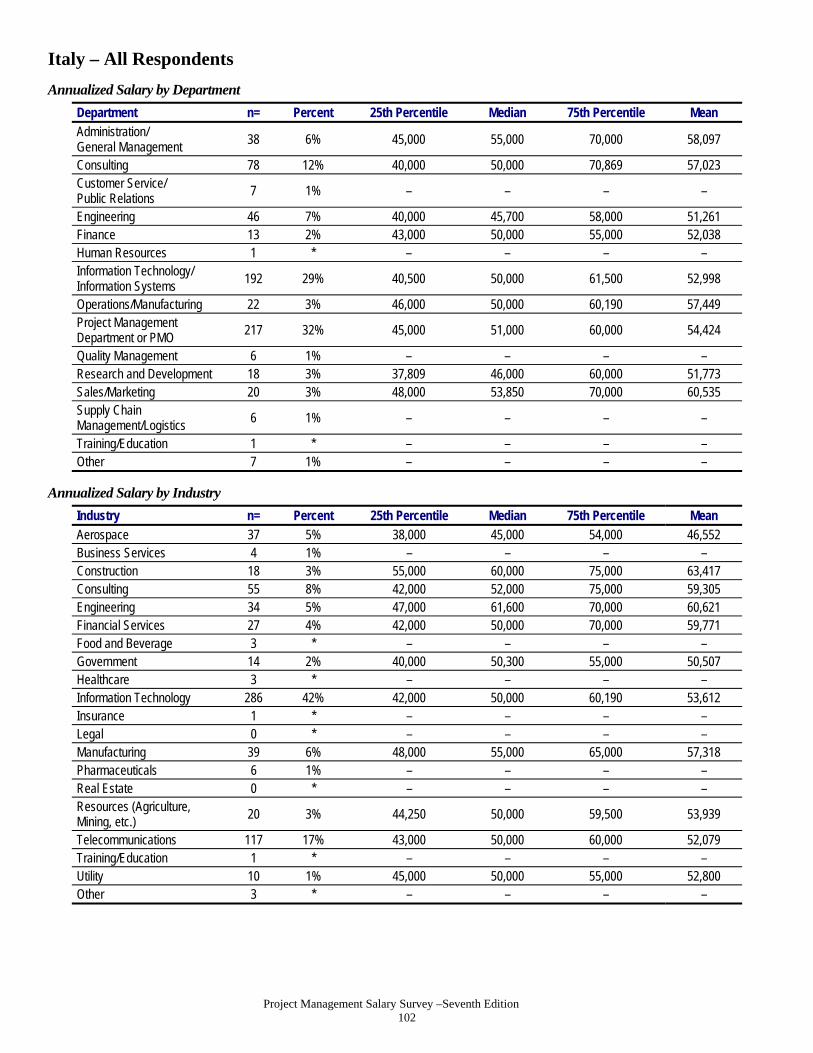
Project Management Salary Survey –Seventh Edition 102
Italy – All Respondents
Annualized Salary by Department
Department n= Percent 25th Percentile Median 75th Percentile Mean Administration/ General Management
38 6% 45,000 55,000 70,000 58,097
Consulting 78 12% 40,000 50,000 70,869 57,023 Customer Service/ Public Relations
7 1% – – – –
Engineering 46 7% 40,000 45,700 58,000 51,261 Finance 13 2% 43,000 50,000 55,000 52,038 Human Resources 1 * – – – – Information Technology/ Information Systems
192 29% 40,500 50,000 61,500 52,998
Operations/Manufacturing 22 3% 46,000 50,000 60,190 57,449 Project Management Department or PMO
217 32% 45,000 51,000 60,000 54,424
Quality Management 6 1% – – – – Research and Development 18 3% 37,809 46,000 60,000 51,773 Sales/Marketing 20 3% 48,000 53,850 70,000 60,535 Supply Chain Management/Logistics 6 1% – – – –
Training/Education 1 * – – – – Other 7 1% – – – –
Annualized Salary by Industry
Industry n= Percent 25th Percentile Median 75th Percentile Mean
Aerospace 37 5% 38,000 45,000 54,000 46,552 Business Services 4 1% – – – – Construction 18 3% 55,000 60,000 75,000 63,417 Consulting 55 8% 42,000 52,000 75,000 59,305 Engineering 34 5% 47,000 61,600 70,000 60,621 Financial Services 27 4% 42,000 50,000 70,000 59,771 Food and Beverage 3 * – – – – Government 14 2% 40,000 50,300 55,000 50,507 Healthcare 3 * – – – – Information Technology 286 42% 42,000 50,000 60,190 53,612 Insurance 1 * – – – – Legal 0 * – – – – Manufacturing 39 6% 48,000 55,000 65,000 57,318 Pharmaceuticals 6 1% – – – – Real Estate 0 * – – – – Resources (Agriculture, Mining, etc.)
20 3% 44,250 50,000 59,500 53,939
Telecommunications 117 17% 43,000 50,000 60,000 52,079 Training/Education 1 * – – – – Utility 10 1% 45,000 50,000 55,000 52,800 Other 3 * – – – –

Project Management Salary Survey –Seventh Edition 103
Italy – All Respondents
Annualized by Type of Project
Project Type n= Percent 25th Percentile Median 75th Percentile Mean Business Transformation 90 13% 45,000 52,500 72,500 58,982 Construction 48 7% 49,000 60,000 70,000 59,808 Engineering 126 19% 44,000 50,000 63,000 53,061 Information Technology 454 67% 42,000 50,000 63,000 54,178 Manufacturing 55 8% 45,000 51,000 63,000 53,194 Operations 89 13% 43,000 50,000 63,000 54,867 Quality Management 47 7% 42,500 50,000 62,000 54,494 Regulatory Compliance 21 3% 45,000 52,000 70,000 59,905 Research and Development 67 10% 41,000 51,000 70,000 55,966 Supply Chain Management/Logistics 41 6% 44,000 50,000 60,000 57,346
Other 48 7% 44,900 50,500 70,050 58,821
Annualized Salary by Number of Employees in Entire Organization
Employees n= Percent 25th Percentile Median 75th Percentile Mean Less than 100 67 10% 45,000 51,000 73,000 60,563 100 to 299 47 7% 39,000 48,000 55,000 49,489 300 to 999 88 13% 42,250 49,840 60,000 52,094 1,000 to 2,499 78 12% 41,604 50,000 59,000 51,934 2,500 to 4,999 60 9% 40,000 49,500 65,000 52,684 5,000 to 9,999 78 12% 40,000 47,500 60,000 50,720 10,000 or more 260 38% 44,000 52,150 65,910 56,961
Annualized Salary by Average Project Team Size
Employees n= Percent 25th Percentile Median 75th Percentile Mean
1-4 people 82 14% 39,500 49,750 60,000 52,153 5-9 people 190 33% 42,000 48,000 57,000 51,421 10-14 people 144 25% 42,250 50,000 66,000 55,641 15-19 people 44 8% 44,500 54,650 67,500 57,462 20 or more people 112 20% 47,782 57,500 70,000 61,141
Annualized Salary by Average Project Budget (in USD)
Employees n= Percent 25th Percentile Median 75th Percentile Mean
Less than $100,000 62 10% 36,000 45,000 51,000 46,260 $100,000 to $499,999 160 26% 41,802 49,750 60,000 51,593 $500,000 to $999,999 130 21% 42,000 50,000 60,000 54,791 $1 million to $10 million 197 31% 45,000 51,000 70,000 57,164 More than $10 million 78 12% 46,000 56,000 65,000 59,527

Project Management Salary Survey –Seventh Edition 104
Italy – All Respondents
Project Management Career Path within Organization
n= Percent Yes - Clearly defined/in writing 153 23% Yes - Informal 205 31% No 269 40% Don't Know 39 6%
Project Management Career Path Connected to Roles in Upper Management
n= Percent Yes - Clearly defined/in writing 81 23% Yes - Informal 165 47% No 76 22% Don't Know 29 8%
Defined Set of Performance Skills for Project Managers within Organization
n= Percent Yes - Clearly defined/in writing 276 42% Yes - Informal 194 29% No 163 25% Don't Know 31 5%
Equities Offered in Past Year by Position Description
Stock Options Stock
(i.e., Shares) Neither
n= Percent n= Percent n= Percent Total 45 7% 24 4% 598 90% Director of Project Management Office (PMO) 3 9% 2 6% 28 88% Portfolio Manager 7 21% 2 6% 24 73% Program Manager 8 7% 5 4% 111 91% Project Manager III 11 6% 9 5% 154 89% Project Manager II 10 6% 4 3% 145 91% Project Manager I 2 3% 1 1% 72 96% Project Management Specialist 0 * 0 * 24 100% Project Management Consultant 4 9% 1 2% 40 89%
Employee Benefits Offered by Position Description
Company
Car/Allowance
Cell Phone Usage Paid Life Insurance
n= Percent n= Percent n= Percent Total 263 39% 523 78% 237 35% Director of Project Management Office (PMO) 22 67% 30 91% 15 45% Portfolio Manager 29 85% 33 97% 12 35% Program Manager 65 53% 99 81% 55 45% Project Manager III 70 40% 142 80% 64 36% Project Manager II 48 30% 125 78% 48 30% Project Manager I 11 15% 49 66% 21 28% Project Management Specialist 4 17% 16 67% 9 38% Project Management Consultant 14 31% 29 64% 13 29%

Project Management Salary Survey –Seventh Edition 105
Italy – All Respondents
Mean Number of Vacation Days by Position Description
After 1 Year After 10 Years n= Mean n= Mean
Total 584 25.0 608 27.4 Director of Project Management Office (PMO) 28 23.6 28 28.7 Portfolio Manager 28 27.5 33 29.0 Program Manager 105 24.6 113 26.1 Project Manager III 158 25.4 165 28.4 Project Manager II 138 26.0 141 28.2 Project Manager I 66 24.3 69 27.6 Project Management Specialist 25 24.4 21 27.7 Project Management Consultant 36 21.4 38 21.7
Pension Plans Offered by Position Description
Defined Benefit
Plans Defined Contribution
Plans Other Pension Plans
n= Percent n= Percent n= Percent Total 162 25% 381 59% 88 14% Director of Project Management Office (PMO) 11 33% 22 67% 6 18% Portfolio Manager 11 32% 18 53% 5 15% Program Manager 24 20% 77 64% 15 13% Project Manager III 55 32% 95 55% 21 12% Project Manager II 33 22% 89 58% 26 17% Project Manager I 15 21% 43 61% 7 10% Project Management Specialist 5 23% 14 64% 5 23% Project Management Consultant 8 19% 23 55% 3 7%
Mean Hours Worked by Position Description
Hours Expected Actual Hours
Worked n= Mean n= Mean
Total 657 39.5 645 47.8 Director of Project Management Office (PMO) 33 39.7 32 50.6 Portfolio Manager 32 40.2 29 51.8 Program Manager 121 39.7 120 48.9 Project Manager III 173 39.5 171 48.0 Project Manager II 156 39.6 152 46.7 Project Manager I 74 39.1 73 46.0 Project Management Specialist 25 39.2 25 46.7 Project Management Consultant 43 39.6 43 47.4

Project Management Salary Survey –Seventh Edition 106
Japan – All Respondents
Total Compensation (in Japanese Yen)
Compensation n= 25th Percentile Median 75th Percentile Mean Salary 652 6,000,000 7,000,000 9,000,000 7,599,554 Total Compensation 652 7,500,000 9,000,000 11,000,000 9,594,188
Reported/Expected Change in Total Compensation over Past/Next 12 Months
Past 12 Months n= Percent Next 12 Months n= Percent Decreased 67 10% Decrease 60 9% Remained the same 302 46% Remain the same 247 38% Increased less than 1% 52 8% Increase less than 1% 39 6% Increased 1% to 2.9% 112 17% Increase 1% to 2.9% 110 17% Increased 3% to 3.9% 31 5% Increase 3% to 3.9% 57 9% Increased 4% to 4.9% 18 3% Increase 4% to 4.9% 16 2% Increased 5% to 6.9% 23 4% Increase 5% to 6.9% 56 9% Increased 7% to 9.9% 23 4% Increase 7% to 9.9% 24 4% Increased 10% to 14.9% 15 2% Increase 10% to 14.9% 32 5% Increased 15% to 19.9% 6 1% Increase 15% to 19.9% 3 * Increased 20% to 24.9% 0 * Increase 20% to 24.9% 3 * Increased 25% to 29.9% 0 * Increase 25% to 29.9% 1 * Increased 30% or greater 3 * Increase 30% or greater 4 1%
Annualized Salary by Position Description
Position n= Percent 25th Percentile Median 75th Percentile Mean Director of Project Management Office (PMO)
46 7% 6,500,000 8,500,000 10,600,000 9,266,622
Portfolio Manager 19 3% 8,000,000 9,480,000 12,999,984 10,341,054 Program Manager 67 10% 6,800,000 8,000,000 10,000,000 8,776,866 Project Manager III 85 13% 6,000,000 8,000,000 10,000,000 8,410,101 Project Manager II 128 20% 6,000,000 7,000,000 8,500,000 7,344,450 Project Manager I 200 31% 5,400,000 6,600,000 8,000,000 6,684,765 Project Management Specialist
66 10% 6,000,000 6,550,000 7,550,000 6,839,641
Project Management Consultant
41 6% 5,400,000 7,000,000 8,000,000 7,336,507
Annualized Salary by Years Work Experience
Years n= Percent 25th Percentile Median 75th Percentile Mean
Less than 3 years 2 * – – – – 3 to less than 5 years 2 * – – – – 5 to less than 10 years 53 8% 4,500,000 6,000,000 7,000,000 5,879,746 10 to less than 15 years 172 26% 5,400,000 6,274,000 8,000,000 6,846,644 15 to less than 20 years 111 17% 6,000,000 7,300,000 9,000,000 7,887,695 20 years or more years 312 48% 6,500,000 7,999,986 9,950,000 8,207,774

Project Management Salary Survey –Seventh Edition 107
Japan – All Respondents
Annualized Salary by Technique Experience
Years n= Percent 25th Percentile Median 75th Percentile Mean Agile Project Management/Scrum
None 344 63% 6,000,000 7,000,000 8,600,000 7,557,722 1 to 5 years 136 25% 6,000,000 7,050,000 9,000,020 7,815,651 6 years or more 69 13% 6,348,000 7,500,000 9,360,000 8,127,028
Extreme Project Management None 336 62% 5,900,000 7,000,000 8,700,000 7,533,346 1 to 5 years 129 24% 6,000,000 7,000,000 9,000,000 7,788,230 6 years or more 80 15% 6,500,000 7,900,000 9,530,000 8,230,799
Process Based Project Management
None 161 29% 5,508,000 7,000,000 8,500,000 7,297,152 1 to 5 years 205 37% 5,500,000 7,000,000 8,500,000 7,352,572 6 years or more 190 34% 6,500,000 7,750,000 9,720,000 8,301,848 Event Chain Project Management
None 347 64% 6,000,000 7,200,000 9,000,000 7,702,498 1 to 5 years 114 21% 5,440,000 7,000,000 8,000,000 7,228,991 6 years or more 85 16% 6,500,000 7,500,000 9,700,000 8,200,920
Interactive Project Management None 271 49% 6,000,000 7,000,000 8,900,024 7,617,331 1 to 5 years 163 29% 5,800,000 7,000,000 8,600,000 7,474,577 6 years or more 123 22% 6,200,000 7,800,000 9,000,000 7,999,164 Incremental Project Management
None 276 50% 5,675,000 7,000,000 8,449,983 7,437,584 1 to 5 years 173 31% 6,000,000 7,000,000 9,000,000 7,812,889 6 years or more 101 18% 6,900,000 8,000,000 9,720,000 8,129,713
Project Portfolio Management None 292 53% 5,500,000 7,000,000 8,050,000 7,101,153 1 to 5 years 164 30% 6,000,000 7,500,000 10,000,000 8,325,325 6 years or more 91 17% 6,500,000 8,000,000 10,000,000 8,598,680

Project Management Salary Survey –Seventh Edition 108
Japan – All Respondents
Annualized Salary by Technique Experience (Continued)
Years n= Percent 25th Percentile Median 75th Percentile Mean Program Management
None 210 38% 5,500,000 6,832,500 8,000,000 6,913,076 1 to 5 years 193 34% 6,000,000 7,300,000 9,000,000 7,921,292 6 years or more 157 28% 6,500,000 8,000,000 9,900,000 8,368,755
Earned Value Management None 183 33% 5,508,000 7,000,000 8,900,024 7,516,149 1 to 5 years 229 41% 5,999,999 7,000,000 8,500,000 7,426,143 6 years or more 143 26% 6,500,000 8,000,000 10,000,000 8,325,930
Lean Project Management
None 297 54% 5,999,999 7,000,000 8,800,000 7,578,827 1 to 5 years 141 26% 5,800,000 7,000,000 8,830,000 7,577,039 6 years or more 108 20% 6,000,000 7,450,000 9,710,000 8,031,628 Critical Chain Project Management
None 270 49% 5,999,999 7,000,000 8,600,000 7,487,239 1 to 5 years 162 30% 5,800,000 7,000,000 8,000,000 7,309,187 6 years or more 117 21% 6,900,000 8,000,000 10,000,000 8,643,651
Waterfall Project Management None 104 18% 6,000,000 7,000,000 9,000,000 7,880,980 1 to 5 years 162 29% 5,500,000 7,000,000 8,400,000 7,156,261 6 years or more 297 53% 6,000,000 7,500,000 9,000,000 7,792,134
Risk Management None 56 10% 5,500,000 6,600,000 8,000,000 6,904,038 1 to 5 years 264 46% 5,500,000 7,000,000 8,049,993 7,125,680 6 years or more 248 44% 6,500,000 8,000,000 10,000,000 8,469,937 Change Management
None 102 18% 5,750,000 7,000,000 8,500,000 7,161,956 1 to 5 years 229 41% 5,500,000 7,000,000 8,300,000 7,146,682 6 years or more 228 41% 6,214,000 8,000,000 10,000,000 8,418,597 Resource Management
None 87 16% 5,300,000 7,000,000 8,499,965 7,140,474 1 to 5 years 222 40% 5,800,000 7,000,000 8,000,000 7,078,160 6 years or more 243 44% 6,000,000 8,000,000 10,000,000 8,356,696
Annualized Salary by Years Worked in Project Management
Years n= Percent 25th Percentile Median 75th Percentile Mean Less than 3 years 17 3% 4,000,000 5,280,000 7,000,000 5,483,529 3 to less than 5 years 36 6% 5,000,000 6,000,000 7,100,000 6,162,156 5 to less than 10 years 261 40% 5,500,000 7,000,000 8,499,965 7,236,702 10 to less than 15 years 216 33% 6,000,000 7,373,000 9,000,000 7,865,707 15 to less than 20 years 74 11% 6,900,000 8,000,000 10,000,000 8,391,560 20 or more years 48 7% 7,100,000 9,000,000 10,000,013 8,981,334

Project Management Salary Survey –Seventh Edition 109
Japan – All Respondents
Annualized Salary by Highest Formal Education Level Obtained
Education n= Percent 25th Percentile Median 75th Percentile Mean High school degree 29 4% 5,999,999 6,400,000 7,200,000 7,051,585 Some college or Associate's degree
41 6% 6,000,000 7,000,000 8,600,000 7,392,146
4-year college degree 420 64% 6,000,000 7,000,000 9,000,000 7,588,159 Master's degree 154 24% 6,000,000 7,000,000 9,000,000 7,657,522 Doctoral degree 8 1% – – – –
Annualized Salary by Degree in Project Management
Degree n= Percent 25th Percentile Median 75th Percentile Mean
Have a degree in PM 35 5% 6,000,000 7,690,000 9,000,000 7,770,525 No degree in PM 610 95% 6,000,000 7,000,000 9,000,000 7,588,837
Annualized Salary by PMP® Status
Status n= Percent 25th Percentile Median 75th Percentile Mean
Have a PMP® Certification 614 94% 6,000,000 7,000,000 9,000,000 7,645,861 PMP for less than 1 year 11 2% 5,440,000 6,500,000 7,500,000 6,567,273 PMP for 1 to less than 5 years 382 63% 5,508,000 7,000,000 8,436,000 7,312,162
PMP for 5 to less than 10 years
196 32% 6,500,000 8,000,000 9,000,020 8,120,447
PMP for 10 to less than 20 years
19 3% 8,300,000 10,000,000 11,000,000 9,915,789
PMP for 20 or more years 0 * – – – – Do not have a PMP® Certification 38 6% 5,000,000 6,450,000 8,400,000 6,851,316
Annualized Salary by Amount of Training Per Year
Employees n= Percent 25th Percentile Median 75th Percentile Mean Less than 5 days 203 33% 6,000,000 7,200,000 8,900,024 7,609,727 5 to 9 days 196 32% 6,000,000 7,323,000 9,000,000 7,807,273 10 days or more 214 35% 5,728,332 7,000,000 9,000,000 7,415,475
Annualized Salary by Gender
Gender n= Percent 25th Percentile Median 75th Percentile Mean Male 599 93% 6,000,000 7,000,000 9,000,000 7,632,761 Female 46 7% 5,400,000 6,400,000 8,000,000 7,188,801

Project Management Salary Survey –Seventh Edition 110
Japan – All Respondents
Annualized Salary by Department
Department n= Percent 25th Percentile Median 75th Percentile Mean Administration/ General Management
26 4% 6,177,606 8,000,000 9,600,000 8,522,785
Consulting 29 4% 6,000,000 8,000,000 10,000,025 8,256,415 Customer Service/ Public Relations
8 1% – – – –
Engineering 89 14% 6,000,000 7,000,000 7,770,000 6,980,313 Finance 15 2% 7,999,972 8,400,000 11,000,000 8,833,330 Human Resources 5 1% – – – – Information Technology/ Information Systems
323 50% 5,800,000 7,000,000 8,600,000 7,371,590
Operations/Manufacturing 7 1% – – – – Project Management Department or PMO
92 14% 6,000,000 7,600,000 10,000,000 8,529,105
Quality Management 10 2% 6,000,000 6,250,000 7,000,000 7,090,000 Research and Development 19 3% 5,000,000 6,500,000 7,680,000 6,832,652 Sales/Marketing 19 3% 6,000,000 7,550,000 9,200,000 8,155,261 Supply Chain Management/Logistics 1 * – – – –
Training/Education 1 * – – – – Other 1 * – – – –
Annualized Salary by Industry
Industry n= Percent 25th Percentile Median 75th Percentile Mean
Aerospace 3 * – – – – Business Services 9 1% – – – – Construction 9 1% – – – – Consulting 25 4% 6,000,000 8,000,000 9,200,000 8,026,000 Engineering 78 12% 6,000,000 7,000,000 7,770,000 7,302,743 Financial Services 37 6% 7,000,000 8,500,000 10,800,000 9,439,241 Food and Beverage 1 * – – – – Government 12 2% 5,650,000 6,000,000 7,500,000 6,458,333 Healthcare 7 1% – – – – Information Technology 374 57% 5,999,999 7,000,000 9,000,000 7,494,019 Insurance 11 2% 6,000,000 7,000,000 9,000,000 7,409,091 Legal 1 * – – – – Manufacturing 26 4% 5,440,000 7,000,000 7,999,972 6,918,436 Pharmaceuticals 6 1% – – – – Real Estate 0 * – – – – Resources (Agriculture, Mining, etc.)
1 * – – – –
Telecommunications 51 8% 6,000,000 7,300,000 9,000,000 7,822,131 Training/Education 1 * – – – – Utility 0 * – – – – Other 0 * – – – –

Project Management Salary Survey –Seventh Edition 111
Japan – All Respondents
Annualized by Type of Project
Project Type n= Percent 25th Percentile Median 75th Percentile Mean Business Transformation 53 8% 6,000,000 8,300,000 10,000,000 8,656,305 Construction 36 6% 5,900,000 7,000,000 10,000,000 8,118,612 Engineering 125 19% 6,000,000 7,000,000 8,499,965 7,529,231 Information Technology 485 75% 6,000,000 7,000,000 9,000,000 7,606,003 Manufacturing 35 5% 5,800,000 7,500,000 9,000,000 7,855,582 Operations 42 7% 6,500,000 7,650,000 9,900,000 8,634,715 Quality Management 58 9% 5,500,000 6,719,981 8,300,000 7,355,803 Regulatory Compliance 7 1% – – – – Research and Development 44 7% 5,500,000 7,000,000 9,850,000 7,921,826 Supply Chain Management/Logistics 21 3% 6,000,000 7,000,000 9,000,000 7,604,924
Other 12 2% 6,000,000 7,500,000 11,400,000 9,411,667
Annualized Salary by Number of Employees in Entire Organization
Employees n= Percent 25th Percentile Median 75th Percentile Mean Less than 100 25 4% 5,756,400 8,000,000 9,300,000 7,769,293 100 to 299 30 5% 5,400,000 6,700,000 8,600,000 7,498,600 300 to 999 89 14% 6,000,000 7,000,000 9,000,000 7,396,910 1,000 to 2,499 93 14% 5,750,000 7,000,000 8,000,000 7,389,631 2,500 to 4,999 70 11% 6,000,000 6,999,993 8,000,000 7,135,542 5,000 to 9,999 100 15% 6,000,000 7,000,000 9,000,000 7,627,227 10,000 or more 245 38% 6,000,000 7,500,000 9,500,000 7,869,173
Annualized Salary by Average Project Team Size
Employees n= Percent 25th Percentile Median 75th Percentile Mean
1-4 people 43 9% 5,800,000 6,500,000 8,000,000 6,843,952 5-9 people 107 22% 5,500,000 6,800,000 8,000,000 7,121,489 10-14 people 116 24% 6,000,000 7,000,000 9,000,000 7,653,388 15-19 people 47 10% 6,000,000 8,000,000 9,000,039 7,963,823 20 or more people 170 35% 7,000,000 8,000,000 10,000,000 8,478,801
Annualized Salary by Average Project Budget (in USD)
Employees n= Percent 25th Percentile Median 75th Percentile Mean
Less than $100,000 49 9% 5,600,000 7,000,000 8,000,000 7,279,320 $100,000 to $499,999 142 27% 5,500,000 6,685,000 8,000,000 7,067,608 $500,000 to $999,999 100 19% 5,550,000 7,000,000 8,499,983 7,225,225 $1 million to $10 million 179 34% 6,300,000 7,550,000 9,500,000 8,102,844 More than $10 million 52 10% 7,250,000 9,000,000 11,499,999 9,532,078
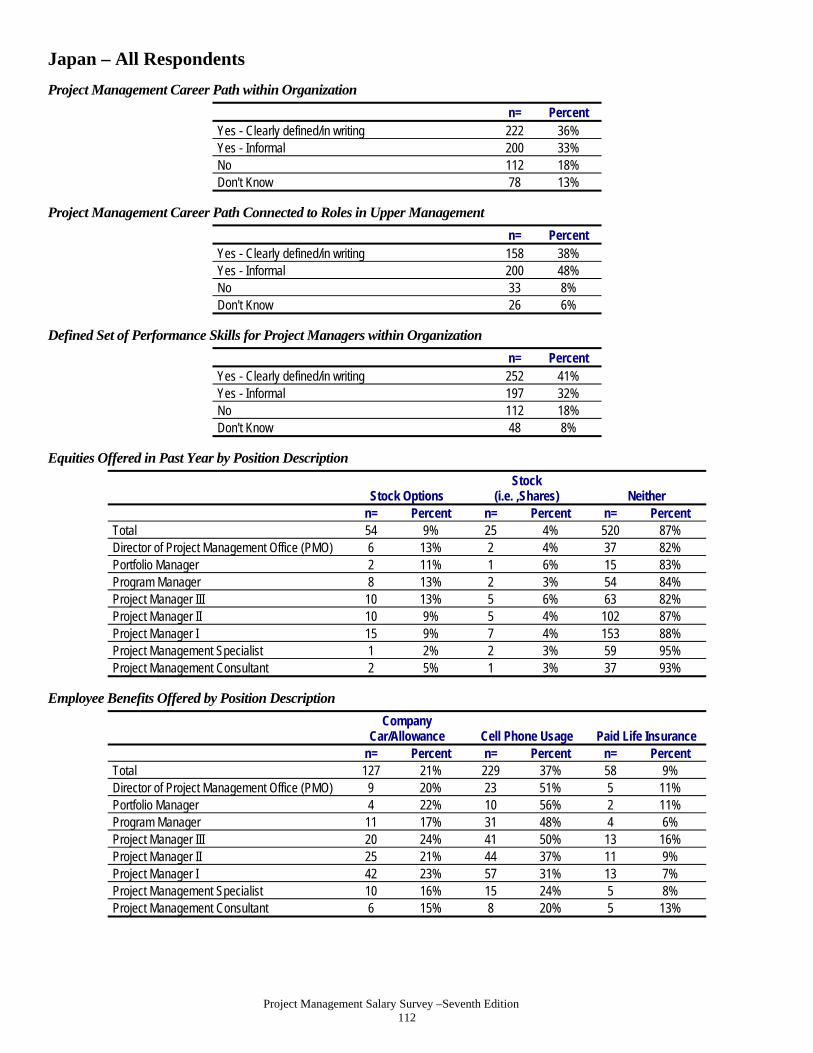
Project Management Salary Survey –Seventh Edition 112
Japan – All Respondents
Project Management Career Path within Organization
n= Percent Yes - Clearly defined/in writing 222 36% Yes - Informal 200 33% No 112 18% Don't Know 78 13%
Project Management Career Path Connected to Roles in Upper Management
n= Percent Yes - Clearly defined/in writing 158 38% Yes - Informal 200 48% No 33 8% Don't Know 26 6%
Defined Set of Performance Skills for Project Managers within Organization
n= Percent Yes - Clearly defined/in writing 252 41% Yes - Informal 197 32% No 112 18% Don't Know 48 8%
Equities Offered in Past Year by Position Description
Stock Options Stock
(i.e. ,Shares) Neither n= Percent n= Percent n= Percent
Total 54 9% 25 4% 520 87% Director of Project Management Office (PMO) 6 13% 2 4% 37 82% Portfolio Manager 2 11% 1 6% 15 83% Program Manager 8 13% 2 3% 54 84% Project Manager III 10 13% 5 6% 63 82% Project Manager II 10 9% 5 4% 102 87% Project Manager I 15 9% 7 4% 153 88% Project Management Specialist 1 2% 2 3% 59 95% Project Management Consultant 2 5% 1 3% 37 93%
Employee Benefits Offered by Position Description
Company
Car/Allowance Cell Phone Usage Paid Life Insurance n= Percent n= Percent n= Percent
Total 127 21% 229 37% 58 9% Director of Project Management Office (PMO) 9 20% 23 51% 5 11% Portfolio Manager 4 22% 10 56% 2 11% Program Manager 11 17% 31 48% 4 6% Project Manager III 20 24% 41 50% 13 16% Project Manager II 25 21% 44 37% 11 9% Project Manager I 42 23% 57 31% 13 7% Project Management Specialist 10 16% 15 24% 5 8% Project Management Consultant 6 15% 8 20% 5 13%

Project Management Salary Survey –Seventh Edition 113
Japan – All Respondents
Mean Number of Vacation Days by Position Description
After 1 Year After 10 Years n= Mean n= Mean
Total 588 18.2 542 20.5 Director of Project Management Office (PMO) 44 17.1 40 22.1 Portfolio Manager 16 16.8 16 21.6 Program Manager 58 17.2 56 24.2 Project Manager III 79 18.0 73 20.3 Project Manager II 113 18.9 105 18.3 Project Manager I 179 18.6 163 19.4 Project Management Specialist 60 18.8 55 23.3 Project Management Consultant 39 17.5 34 20.1
Pension Plans Offered by Position Description
Defined Benefit
Plans Defined Contribution
Plans Other Pension Plans
n= Percent n= Percent n= Percent Total 285 48% 218 37% 49 8% Director of Project Management Office (PMO) 20 45% 17 39% 5 11% Portfolio Manager 6 38% 7 44% 2 13% Program Manager 30 49% 21 34% 5 8% Project Manager III 37 47% 32 41% 2 3% Project Manager II 50 44% 46 41% 10 9% Project Manager I 100 55% 60 33% 16 9% Project Management Specialist 18 30% 18 30% 8 13% Project Management Consultant 24 62% 17 44% 1 3%
Mean Hours Worked by Position Description
Hours Expected Actual Hours
Worked n= Mean n= Mean
Total 573 39.7 559 49.6 Director of Project Management Office (PMO) 43 39.5 41 45.9 Portfolio Manager 18 38.2 18 50.0 Program Manager 62 39.4 58 49.1 Project Manager III 75 39.6 72 51.3 Project Manager II 111 39.9 112 50.2 Project Manager I 170 39.9 170 49.8 Project Management Specialist 56 40.4 53 49.7 Project Management Consultant 38 39.2 35 48.1

Project Management Salary Survey –Seventh Edition 114
Korea – All Respondents
Total Compensation (in South Korean Won)
Compensation n= 25th Percentile Median 75th Percentile Mean Salary 221 50,000,000 60,000,000 75,000,000 64,488,493 Total Compensation 221 58,500,000 72,000,256 92,000,000 78,460,023
Reported/Expected Change in Total Compensation over Past/Next 12 Months
Past 12 Months n= Percent Next 12 Months n= Percent Decreased 4 2% Decrease 7 3% Remained the same 43 19% Remain the same 26 12% Increased less than 1% 5 2% Increase less than 1% 3 1% Increased 1% to 2.9% 30 14% Increase 1% to 2.9% 24 11% Increased 3% to 3.9% 22 10% Increase 3% to 3.9% 30 14% Increased 4% to 4.9% 38 17% Increase 4% to 4.9% 32 14% Increased 5% to 6.9% 37 17% Increase 5% to 6.9% 48 22% Increased 7% to 9.9% 18 8% Increase 7% to 9.9% 19 9% Increased 10% to 14.9% 16 7% Increase 10% to 14.9% 21 10% Increased 15% to 19.9% 3 1% Increase 15% to 19.9% 6 3% Increased 20% to 24.9% 1 * Increase 20% to 24.9% 1 * Increased 25% to 29.9% 0 * Increase 25% to 29.9% 1 * Increased 30% or greater 4 2% Increase 30% or greater 3 1%
Annualized Salary by Position Description
Position n= Percent 25th Percentile Median 75th Percentile Mean Director of Project Management Office (PMO)
21 10% 60,000,000 80,000,000 95,000,000 86,523,801
Portfolio Manager 11 5% 60,000,000 76,000,000 80,000,000 69,281,000 Program Manager 14 6% 55,000,000 70,000,000 88,000,000 69,299,324 Project Manager III 20 9% 50,500,000 65,500,000 82,500,000 68,953,595 Project Manager II 36 16% 50,000,000 57,500,000 70,000,024 60,487,225 Project Manager I 58 26% 50,000,000 58,000,000 66,000,000 58,147,556 Project Management Specialist 47 21% 43,000,000 60,000,040 80,000,000 63,846,924
Project Management Consultant
14 6% 46,999,712 51,000,000 60,000,000 55,192,856
Annualized Salary by Years Work Experience
Years n= Percent 25th Percentile Median 75th Percentile Mean
Less than 3 years 1 * – – – – 3 to less than 5 years 6 3% – – – – 5 to less than 10 years 39 18% 42,000,000 50,000,000 62,000,000 53,023,152 10 to less than 15 years 67 30% 45,000,000 52,000,000 60,000,000 55,314,690 15 to less than 20 years 51 23% 60,000,000 70,000,000 80,000,000 72,633,034 20 years or more years 57 26% 63,240,000 75,000,000 85,000,000 77,171,068

Project Management Salary Survey –Seventh Edition 115
Korea – All Respondents
Annualized Salary by Technique Experience
Years n= Percent 25th Percentile Median 75th Percentile Mean Agile Project Management/Scrum
None 78 53% 50,000,000 60,000,000 72,000,000 61,822,050 1 to 5 years 42 29% 47,999,816 53,000,000 70,000,000 57,862,429 6 years or more 27 18% 56,000,000 65,000,000 80,000,000 67,925,943
Extreme Project Management None 78 51% 48,000,000 55,000,000 70,000,000 60,244,614 1 to 5 years 44 29% 48,605,954 60,000,000 71,000,000 62,253,699 6 years or more 30 20% 60,000,000 70,000,000 80,000,000 72,173,023 Process Based Project Management
None 36 21% 50,000,000 57,500,000 73,500,000 62,247,111 1 to 5 years 71 42% 46,999,712 55,000,000 70,000,000 58,742,196 6 years or more 64 37% 50,500,000 67,500,000 80,000,000 66,941,034
Event Chain Project Management
None 79 54% 50,000,000 60,000,000 72,000,000 62,074,456 1 to 5 years 39 27% 42,000,000 50,000,000 70,000,000 53,630,766 6 years or more 27 19% 60,000,000 70,000,000 80,000,000 71,587,424 Interactive Project Management
None 58 36% 50,000,000 55,000,000 70,000,000 58,322,964 1 to 5 years 55 34% 43,000,000 55,000,000 70,000,000 59,498,554 6 years or more 49 30% 60,000,000 70,000,000 80,000,000 72,316,766
Incremental Project Management None 73 49% 49,000,000 60,000,000 75,000,000 62,510,845 1 to 5 years 46 31% 50,000,000 55,500,000 70,000,000 59,414,135 6 years or more 31 21% 50,000,000 62,000,000 80,000,000 66,129,047 Project Portfolio Management
None 71 45% 48,000,000 55,000,000 70,000,000 59,783,122 1 to 5 years 54 34% 50,000,000 60,000,000 75,000,000 62,193,143 6 years or more 32 20% 56,000,000 65,000,000 80,000,000 73,531,280

Project Management Salary Survey –Seventh Edition 116
Korea – All Respondents
Annualized Salary by Technique Experience (Continued)
Years n= Percent 25th Percentile Median 75th Percentile Mean Program Management
None 57 34% 46,999,712 55,000,000 70,000,000 59,756,870 1 to 5 years 61 37% 49,000,000 60,000,000 72,000,000 61,621,313 6 years or more 49 29% 51,550,000 65,000,000 80,000,000 71,626,363
Earned Value Management
None 51 31% 49,000,000 55,000,000 66,000,000 57,811,875 1 to 5 years 66 40% 50,000,000 60,000,000 75,000,000 63,290,421 6 years or more 49 30% 60,000,000 70,000,000 88,000,000 74,119,598 Lean Project Management
None 63 42% 49,000,000 60,000,000 72,000,000 62,311,680 1 to 5 years 59 39% 47,999,816 55,000,000 70,000,000 57,275,632 6 years or more 28 19% 58,000,000 70,000,000 80,000,000 70,194,445
Critical Chain Project Management
None 57 38% 50,000,000 55,000,000 70,000,000 61,075,292 1 to 5 years 58 38% 43,000,000 53,000,000 70,000,000 56,775,872 6 years or more 37 24% 60,000,000 70,000,000 80,000,000 70,217,574
Waterfall Project Management None 68 45% 50,000,000 60,000,000 75,000,000 63,166,060 1 to 5 years 42 28% 43,000,000 54,000,000 70,000,000 55,071,424 6 years or more 40 27% 51,500,000 60,500,000 79,000,000 66,146,503 Risk Management
None 30 17% 50,000,000 54,500,000 70,000,000 58,742,335 1 to 5 years 84 49% 48,000,000 60,000,000 70,000,000 60,754,769 6 years or more 59 34% 56,000,000 70,000,000 80,000,000 71,649,204
Change Management None 43 27% 50,000,000 65,000,000 75,000,000 63,076,047 1 to 5 years 63 39% 46,999,712 55,000,000 70,000,000 57,682,550 6 years or more 56 35% 51,500,000 63,000,000 80,000,000 67,592,189 Resource Management
None 35 21% 48,000,000 53,000,000 66,000,000 56,676,000 1 to 5 years 72 43% 49,105,954 60,000,000 74,000,000 63,296,361 6 years or more 61 36% 56,000,000 70,000,000 80,000,000 72,335,008
Annualized Salary by Years Worked in Project Management
Years n= Percent 25th Percentile Median 75th Percentile Mean Less than 3 years 6 3% – – – – 3 to less than 5 years 22 10% 42,000,000 52,000,124 60,000,000 51,315,203 5 to less than 10 years 84 38% 48,105,954 55,000,000 70,000,000 59,323,144 10 to less than 15 years 61 28% 55,000,000 65,000,000 78,000,000 67,990,727 15 to less than 20 years 31 14% 55,000,000 70,000,000 85,000,000 74,129,030 20 or more years 17 8% 72,000,000 80,000,000 90,000,000 80,382,951

Project Management Salary Survey –Seventh Edition 117
Korea – All Respondents
Annualized Salary by Highest Formal Education Level Obtained
Education n= Percent 25th Percentile Median 75th Percentile Mean High school degree 0 * – – – – Some college or Associate's degree
4 2% – – – –
4-year college degree 156 71% 50,000,000 60,000,000 75,000,000 63,332,401 Master's degree 56 25% 55,500,000 70,000,000 76,095,124 68,733,960 Doctoral degree 5 2% – – – –
Annualized Salary by Degree in Project Management
Degree n= Percent 25th Percentile Median 75th Percentile Mean
Have a degree in PM 49 22% 50,000,000 60,000,000 72,000,000 62,314,896 No degree in PM 171 78% 50,000,000 60,000,000 76,000,000 64,669,749
Annualized Salary by PMP® Status
Status n= Percent 25th Percentile Median 75th Percentile Mean
Have a PMP® Certification 202 91% 50,000,000 60,000,000 75,000,000 65,474,617 PMP for less than 1 year 4 2% – – – – PMP for 1 to less than 5 years 116 58% 49,500,000 56,000,000 70,000,000 60,407,181
PMP for 5 to less than 10 years
64 32% 57,430,000 70,000,000 80,000,000 69,188,149
PMP for 10 to less than 20 years
16 8% 65,000,000 85,000,024 96,500,000 88,062,492
PMP for 20 or more years 1 * – – – – Do not have a PMP® Certification 19 9% 40,000,000 50,000,000 70,000,000 54,004,445
Annualized Salary by Amount of Training Per Year
Employees n= Percent 25th Percentile Median 75th Percentile Mean Less than 5 days 34 16% 50,000,000 59,430,000 80,000,000 64,231,185 5 to 9 days 49 23% 51,960,000 70,000,000 78,000,000 68,037,880 10 days or more 132 61% 50,000,000 60,000,000 75,000,000 63,865,459
Annualized Salary by Gender
Gender n= Percent 25th Percentile Median 75th Percentile Mean Male 208 94% 50,000,000 60,000,020 75,000,000 65,326,314 Female 13 6% 45,000,000 50,000,000 60,000,000 51,083,366

Project Management Salary Survey –Seventh Edition 118
Korea – All Respondents
Annualized Salary by Department
Department n= Percent 25th Percentile Median 75th Percentile Mean Administration/General Management
20 9% 57,500,000 72,500,000 84,000,024 74,550,028
Consulting 10 5% 45,000,000 49,000,000 60,000,000 53,499,971 Customer Service/ Public Relations
1 * – – – –
Engineering 44 20% 49,500,000 63,500,000 75,000,000 63,147,683 Finance 4 2% – – – – Human Resources 3 1% – – – – Information Technology/ Information Systems
28 13% 50,000,000 58,000,000 60,967,000 56,075,866
Operations/Manufacturing 5 2% – – – – Project Management Department or PMO
81 37% 50,000,000 60,000,000 80,000,000 66,618,487
Quality Management 9 4% – – – – Research and Development 7 3% – – – – Sales/Marketing 6 3% – – – – Supply Chain Management/Logistics 1 * – – – –
Training/Education 0 * – – – – Other 2 1% – – – –
Annualized Salary by Industry
Industry n= Percent 25th Percentile Median 75th Percentile Mean
Aerospace 1 * – – – – Business Services 2 1% – – – – Construction 53 24% 60,000,000 70,000,000 80,000,048 73,010,124 Consulting 7 3% – – – – Engineering 56 25% 48,000,000 61,000,000 78,545,500 63,058,746 Financial Services 9 4% – – – – Food and Beverage 0 * – – – – Government 9 4% – – – – Healthcare 2 1% – – – – Information Technology 38 17% 45,000,000 55,000,000 66,000,000 57,657,899 Insurance 4 2% – – – – Legal 0 * – – – – Manufacturing 19 9% 51,000,000 60,000,000 70,000,000 66,553,066 Pharmaceuticals 1 * – – – – Real Estate 2 1% – – – – Resources (Agriculture, Mining, etc.)
2 1% – – – –
Telecommunications 9 4% – – – – Training/Education 0 * – – – – Utility 5 2% – – – – Other 2 1% – – – –

Project Management Salary Survey –Seventh Edition 119
Korea – All Respondents
Annualized by Type of Project
Project Type n= Percent 25th Percentile Median 75th Percentile Mean Business Transformation 14 6% 50,000,000 55,500,000 78,000,000 64,135,018 Construction 79 36% 51,960,000 70,000,000 80,000,000 70,558,067 Engineering 73 33% 50,000,000 60,000,000 76,000,000 63,461,510 Information Technology 58 26% 47,000,000 58,000,000 70,000,000 58,414,419 Manufacturing 17 8% 55,000,000 60,000,000 70,000,000 69,007,309 Operations 18 8% 50,000,000 55,000,000 65,000,000 61,727,899 Quality Management 24 11% 47,999,908 58,000,000 74,095,252 67,732,253 Regulatory Compliance 1 * – – – – Research and Development 19 9% 55,000,000 65,000,000 70,000,048 64,738,163 Supply Chain Management/Logistics 7 3% – – – –
Other 5 2% – – – –
Annualized Salary by Number of Employees in Entire Organization
Employees n= Percent 25th Percentile Median 75th Percentile Mean Less than 100 24 11% 45,350,000 50,500,000 67,500,000 63,579,661 100 to 299 18 8% 45,000,000 53,500,000 70,000,000 62,727,283 300 to 999 38 17% 45,000,000 56,000,000 70,000,000 57,794,654 1,000 to 2,499 34 15% 50,000,000 60,000,000 75,000,000 62,592,596 2,500 to 4,999 36 16% 60,000,000 70,000,000 79,000,000 69,755,570 5,000 to 9,999 44 20% 58,000,000 70,000,000 80,000,000 68,632,595 10,000 or more 27 12% 50,000,000 60,000,000 75,000,000 64,502,750
Annualized Salary by Average Project Team Size
Employees n= Percent 25th Percentile Median 75th Percentile Mean
1-4 people 21 15% 48,000,000 55,000,000 70,000,000 61,238,087 5-9 people 46 32% 47,000,000 57,500,000 70,000,000 59,287,510 10-14 people 28 19% 50,000,000 60,467,000 70,000,000 63,540,931 15-19 people 11 8% 60,000,000 70,000,000 85,000,000 69,054,545 20 or more people 38 26% 55,000,000 75,595,124 80,000,048 77,362,882
Annualized Salary by Average Project Budget (in USD)
Employees n= Percent 25th Percentile Median 75th Percentile Mean
Less than $100,000 14 8% 50,000,000 54,000,000 70,000,000 57,857,130 $100,000 to $499,999 29 16% 48,000,000 55,000,000 60,000,000 55,719,892 $500,000 to $999,999 17 9% 48,000,000 60,000,000 70,000,000 60,231,412 $1 million to $10 million 54 30% 52,000,248 65,000,000 80,000,000 66,740,748 More than $10 million 66 37% 51,000,000 70,000,000 80,000,000 70,190,106

Project Management Salary Survey –Seventh Edition 120
Korea – All Respondents
Project Management Career Path within Organization
n= Percent Yes - Clearly defined/in writing 91 42% Yes - Informal 73 34% No 36 17% Don't Know 16 7%
Project Management Career Path Connected to Roles in Upper Management
n= Percent Yes - Clearly defined/in writing 81 51% Yes - Informal 58 37% No 11 7% Don't Know 8 5%
Defined Set of Performance Skills for Project Managers within Organization
n= Percent Yes - Clearly defined/in writing 102 49% Yes - Informal 74 35% No 22 10% Don't Know 12 6%
Equities Offered in Past Year by Position Description
Stock Options Stock
(i.e., Shares) Neither n= Percent n= Percent n= Percent
Total 6 3% 12 6% 197 92% Director of Project Management Office (PMO) 1 5% 1 5% 18 90% Portfolio Manager 1 9% 3 27% 8 73% Program Manager 0 * 2 14% 12 86% Project Manager III 0 * 0 * 19 100% Project Manager II 2 6% 2 6% 29 88% Project Manager I 0 * 1 2% 56 98% Project Management Specialist 0 * 1 2% 44 98% Project Management Consultant 2 14% 2 14% 11 79%
Employee Benefits Offered by Position Description
Company
Car/Allowance Cell Phone Usage Paid Life Insurance
n= Percent n= Percent n= Percent Total 46 22% 87 41% 80 38% Director of Project Management Office (PMO) 7 33% 14 67% 7 33% Portfolio Manager 5 45% 6 55% 4 36% Program Manager 5 36% 5 36% 7 50% Project Manager III 5 25% 11 55% 9 45% Project Manager II 7 23% 15 48% 8 26% Project Manager I 6 11% 14 25% 19 34% Project Management Specialist 7 15% 17 37% 23 50% Project Management Consultant 4 29% 5 36% 3 21%

Project Management Salary Survey –Seventh Edition 121
Korea – All Respondents
Mean Number of Vacation Days by Position Description
After 1 Year After 10 Years n= Mean n= Mean
Total 204 13.2 187 19.7 Director of Project Management Office (PMO) 21 13.2 19 17.8 Portfolio Manager 10 16.3 9 22.3 Program Manager 14 10.6 13 17.3 Project Manager III 20 11.5 19 17.9 Project Manager II 30 14.4 27 20.6 Project Manager I 53 13.6 48 18.0 Project Management Specialist 43 12.5 39 20.7 Project Management Consultant 13 14.2 13 26.8
Pension Plans Offered by Position Description
Defined Benefit Plans
Defined Contribution Plans
Other Pension Plans
n= Percent n= Percent n= Percent Total 80 38% 43 20% 38 18% Director of Project Management Office (PMO) 11 52% 2 10% 4 19% Portfolio Manager 4 40% 3 30% 0 * Program Manager 5 36% 3 21% 4 29% Project Manager III 6 30% 6 30% 2 10% Project Manager II 13 42% 7 23% 8 26% Project Manager I 19 35% 14 25% 9 16% Project Management Specialist 19 42% 5 11% 10 22% Project Management Consultant 3 21% 3 21% 1 7%
Mean Hours Worked by Position Description
Hours Expected Actual Hours Worked n= Mean n= Mean
Total 196 40.5 187 50.2 Director of Project Management Office (PMO) 20 40.7 19 49.9 Portfolio Manager 11 40.0 11 51.6 Program Manager 13 40.0 10 48.2 Project Manager III 19 40.7 19 48.8 Project Manager II 27 40.7 26 50.9 Project Manager I 53 40.2 50 49.7 Project Management Specialist 39 40.9 39 51.7 Project Management Consultant 14 40.1 13 48.8
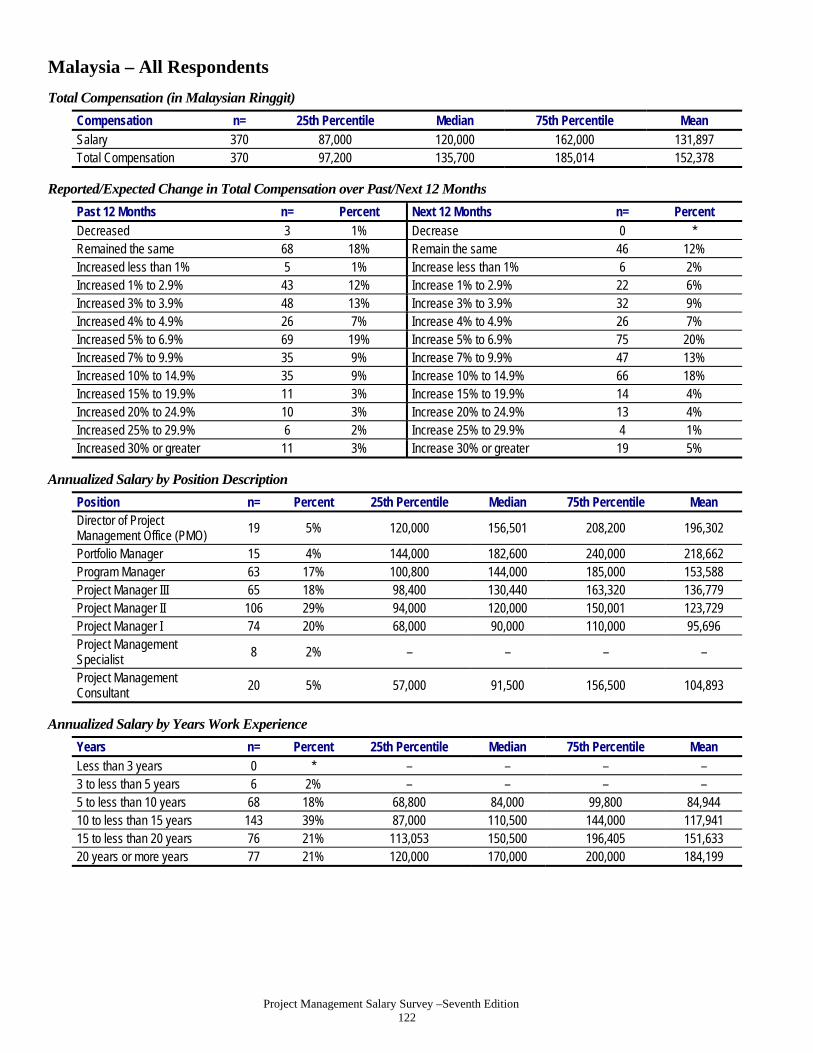
Project Management Salary Survey –Seventh Edition 122
Malaysia – All Respondents
Total Compensation (in Malaysian Ringgit)
Compensation n= 25th Percentile Median 75th Percentile Mean Salary 370 87,000 120,000 162,000 131,897 Total Compensation 370 97,200 135,700 185,014 152,378
Reported/Expected Change in Total Compensation over Past/Next 12 Months
Past 12 Months n= Percent Next 12 Months n= Percent Decreased 3 1% Decrease 0 * Remained the same 68 18% Remain the same 46 12% Increased less than 1% 5 1% Increase less than 1% 6 2% Increased 1% to 2.9% 43 12% Increase 1% to 2.9% 22 6% Increased 3% to 3.9% 48 13% Increase 3% to 3.9% 32 9% Increased 4% to 4.9% 26 7% Increase 4% to 4.9% 26 7% Increased 5% to 6.9% 69 19% Increase 5% to 6.9% 75 20% Increased 7% to 9.9% 35 9% Increase 7% to 9.9% 47 13% Increased 10% to 14.9% 35 9% Increase 10% to 14.9% 66 18% Increased 15% to 19.9% 11 3% Increase 15% to 19.9% 14 4% Increased 20% to 24.9% 10 3% Increase 20% to 24.9% 13 4% Increased 25% to 29.9% 6 2% Increase 25% to 29.9% 4 1% Increased 30% or greater 11 3% Increase 30% or greater 19 5%
Annualized Salary by Position Description
Position n= Percent 25th Percentile Median 75th Percentile Mean Director of Project Management Office (PMO)
19 5% 120,000 156,501 208,200 196,302
Portfolio Manager 15 4% 144,000 182,600 240,000 218,662 Program Manager 63 17% 100,800 144,000 185,000 153,588 Project Manager III 65 18% 98,400 130,440 163,320 136,779 Project Manager II 106 29% 94,000 120,000 150,001 123,729 Project Manager I 74 20% 68,000 90,000 110,000 95,696 Project Management Specialist
8 2% – – – –
Project Management Consultant
20 5% 57,000 91,500 156,500 104,893
Annualized Salary by Years Work Experience
Years n= Percent 25th Percentile Median 75th Percentile Mean
Less than 3 years 0 * – – – – 3 to less than 5 years 6 2% – – – – 5 to less than 10 years 68 18% 68,800 84,000 99,800 84,944 10 to less than 15 years 143 39% 87,000 110,500 144,000 117,941 15 to less than 20 years 76 21% 113,053 150,500 196,405 151,633 20 years or more years 77 21% 120,000 170,000 200,000 184,199

Project Management Salary Survey –Seventh Edition 123
Malaysia – All Respondents
Annualized Salary by Technique Experience
Years n= Percent 25th Percentile Median 75th Percentile Mean Agile Project Management/Scrum
None 212 65% 83,254 110,000 144,000 119,401 1 to 5 years 91 28% 96,000 120,000 180,000 141,960 6 years or more 24 7% 105,250 145,500 174,480 148,482
Extreme Project Management None 216 66% 84,000 115,600 150,000 122,732 1 to 5 years 90 27% 85,600 116,000 174,000 135,581 6 years or more 23 7% 120,000 156,000 200,000 178,804
Process Based Project Management
None 60 18% 92,100 120,000 150,000 127,169 1 to 5 years 164 49% 78,000 104,250 140,000 116,116 6 years or more 113 34% 100,000 144,000 180,000 151,333 Event Chain Project Management
None 209 65% 81,600 119,064 150,000 123,018 1 to 5 years 83 26% 85,000 110,000 158,400 122,903 6 years or more 28 9% 108,000 148,501 199,000 175,697
Interactive Project Management None 137 42% 84,000 115,200 150,000 124,489 1 to 5 years 116 35% 80,000 108,210 155,000 119,350 6 years or more 77 23% 93,888 132,819 180,000 145,339 Incremental Project Management
None 170 52% 80,000 120,000 150,000 124,853 1 to 5 years 117 36% 84,000 110,000 151,000 122,293 6 years or more 38 12% 100,000 150,001 198,000 165,129
Project Portfolio Management None 152 46% 78,000 102,500 140,000 113,803 1 to 5 years 132 40% 92,100 123,175 172,000 139,161 6 years or more 50 15% 105,000 150,501 190,000 155,705

Project Management Salary Survey –Seventh Edition 124
Malaysia – All Respondents
Annualized Salary by Technique Experience (Continued)
Years n= Percent 25th Percentile Median 75th Percentile Mean Program Management
None 108 32% 80,000 100,000 129,220 109,800 1 to 5 years 167 50% 89,000 120,000 165,600 131,324 6 years or more 62 18% 104,400 150,000 182,600 164,224
Earned Value Management None 141 43% 79,000 115,200 144,000 119,100 1 to 5 years 152 46% 87,000 113,238 162,396 129,076 6 years or more 35 11% 111,105 150,000 200,000 173,536
Lean Project Management
None 168 51% 80,000 110,750 150,000 121,729 1 to 5 years 135 41% 93,888 120,000 169,651 134,209 6 years or more 26 8% 120,000 148,500 190,000 161,882 Critical Chain Project Management
None 159 49% 80,000 120,000 150,000 124,729 1 to 5 years 122 38% 84,000 110,000 156,000 121,276 6 years or more 44 14% 100,000 145,500 191,000 162,672
Waterfall Project Management None 132 40% 80,800 110,000 144,000 118,016 1 to 5 years 112 34% 81,520 105,000 150,500 118,484 6 years or more 86 26% 115,000 145,500 180,000 156,325
Risk Management None 39 12% 72,000 108,420 144,000 112,561 1 to 5 years 206 61% 80,532 110,000 144,000 119,512 6 years or more 94 28% 110,000 150,000 198,000 160,819 Change Management
None 36 10% 75,000 110,250 149,000 122,269 1 to 5 years 187 54% 80,000 110,000 150,000 122,436 6 years or more 121 35% 100,000 132,819 180,000 149,573 Resource Management
None 28 8% 72,000 98,000 120,000 103,227 1 to 5 years 178 52% 80,000 108,210 139,999 113,230 6 years or more 137 40% 103,499 147,000 190,000 158,867
Annualized Salary by Years Worked in Project Management
Years n= Percent 25th Percentile Median 75th Percentile Mean Less than 3 years 18 5% 66,780 77,000 93,600 77,671 3 to less than 5 years 41 11% 72,000 90,999 126,600 98,286 5 to less than 10 years 180 49% 86,000 108,210 144,300 118,895 10 to less than 15 years 84 23% 115,332 144,702 180,000 156,956 15 to less than 20 years 35 9% 104,000 180,000 202,000 176,406 20 or more years 12 3% 154,000 186,300 254,000 217,850

Project Management Salary Survey –Seventh Edition 125
Malaysia – All Respondents
Annualized Salary by Highest Formal Education Level Obtained
Education n= Percent 25th Percentile Median 75th Percentile Mean High school degree 6 2% – – – – Some college or Associate's degree
23 6% 72,000 108,000 124,800 106,849
4-year college degree 225 61% 84,000 110,500 159,000 126,732 Master's degree 105 28% 100,000 132,000 176,160 146,158 Doctoral degree 11 3% 72,000 132,000 230,000 158,891
Annualized Salary by Degree in Project Management
Degree n= Percent 25th Percentile Median 75th Percentile Mean
Have a degree in PM 39 11% 90,000 120,000 176,160 136,947 No degree in PM 327 89% 87,000 120,000 160,000 131,711
Annualized Salary by PMP® Status
Status n= Percent 25th Percentile Median 75th Percentile Mean
Have a PMP® Certification 251 68% 100,000 132,000 176,160 142,775 PMP for less than 1 year 6 2% – – – – PMP for 1 to less than 5 years
204 81% 96,000 120,000 164,700 133,414
PMP for 5 to less than 10 years
38 15% 135,000 173,400 230,000 188,876
PMP for 10 to less than 20 years
3 1% – – – –
PMP for 20 or more years 0 * – – – – Do not have a PMP® Certification
119 32% 72,000 95,000 128,000 108,951
Annualized Salary by Amount of Training Per Year
Employees n= Percent 25th Percentile Median 75th Percentile Mean
Less than 5 days 114 31% 87,000 113,238 163,200 130,247 5 to 9 days 131 36% 91,200 130,000 176,160 135,926 10 days or more 123 33% 84,000 116,000 150,000 129,588
Annualized Salary by Gender
Gender n= Percent 25th Percentile Median 75th Percentile Mean
Male 243 67% 87,999 120,000 170,000 137,843 Female 121 33% 86,400 110,000 150,000 121,223

Project Management Salary Survey –Seventh Edition 126
Malaysia – All Respondents
Annualized Salary by Department
Department n= Percent 25th Percentile Median 75th Percentile Mean Administration/ General Management
16 4% 77,200 113,000 158,460 140,520
Consulting 32 9% 82,000 98,400 172,000 132,739 Customer Service/ Public Relations
0 * – – – –
Engineering 14 4% 74,200 87,800 116,000 99,200 Finance 4 1% – – – – Human Resources 2 1% – – – – Information Technology/ Information Systems
96 26% 90,000 122,900 155,000 126,865
Operations/Manufacturing 4 1% – – – – Project Management Department or PMO
173 47% 96,000 120,000 170,000 138,206
Quality Management 4 1% – – – – Research and Development 8 2% – – – – Sales/Marketing 7 2% – – – – Supply Chain Management/Logistics 1 * – – – –
Training/Education 5 1% – – – – Other 3 1% – – – –
Annualized Salary by Industry
Industry n= Percent 25th Percentile Median 75th Percentile Mean
Aerospace 1 * – – – – Business Services 3 1% – – – – Construction 20 5% 70,526 104,500 201,000 143,763 Consulting 23 6% 87,000 119,999 170,000 126,217 Engineering 29 8% 84,000 108,000 139,999 117,433 Financial Services 27 7% 98,400 138,000 163,320 134,017 Food and Beverage 0 * – – – – Government 6 2% – – – – Healthcare 1 * – – – – Information Technology 143 39% 82,507 120,000 156,000 132,183 Insurance 6 2% – – – – Legal 0 * – – – – Manufacturing 20 5% 86,000 107,750 155,796 135,479 Pharmaceuticals 1 * – – – – Real Estate 2 1% – – – – Resources (Agriculture, Mining, etc.)
31 8% 110,000 140,000 200,000 163,134
Telecommunications 42 11% 90,000 118,000 158,400 125,543 Training/Education 5 1% – – – – Utility 6 2% – – – – Other 4 1% – – – –

Project Management Salary Survey –Seventh Edition 127
Malaysia – All Respondents
Annualized by Type of Project
Project Type n= Percent 25th Percentile Median 75th Percentile Mean Business Transformation 72 19% 90,600 130,000 164,700 142,634 Construction 56 15% 90,600 115,800 190,000 143,085 Engineering 72 19% 92,100 120,000 178,080 143,744 Information Technology 239 65% 87,999 120,000 161,592 133,259 Manufacturing 20 5% 96,000 120,775 177,000 150,189 Operations 58 16% 98,400 141,000 180,000 150,804 Quality Management 33 9% 97,635 150,000 174,000 157,286 Regulatory Compliance 26 7% 133,200 159,200 180,000 155,358 Research and Development 33 9% 84,000 135,000 172,800 141,689 Supply Chain Management/Logistics 25 7% 87,600 120,000 161,592 134,776
Other 18 5% 72,360 93,600 114,475 121,009
Annualized Salary by Number of Employees in Entire Organization
Employees n= Percent 25th Percentile Median 75th Percentile Mean Less than 100 45 12% 66,000 91,200 108,000 101,025 100 to 299 40 11% 78,000 100,000 125,000 116,614 300 to 999 79 21% 85,000 119,999 150,000 124,727 1,000 to 2,499 49 13% 80,000 110,500 156,000 136,151 2,500 to 4,999 33 9% 96,000 140,000 180,000 150,954 5,000 to 9,999 17 5% 100,000 132,000 170,000 140,849 10,000 or more 107 29% 101,400 144,000 180,000 146,638
Annualized Salary by Average Project Team Size
Employees n= Percent 25th Percentile Median 75th Percentile Mean
1-4 people 37 12% 84,000 96,000 110,000 104,622 5-9 people 136 43% 84,000 120,000 161,000 130,377 10-14 people 57 18% 82,507 108,000 156,000 121,407 15-19 people 26 8% 116,000 145,200 180,000 157,113 20 or more people 63 20% 110,000 150,000 200,000 165,008
Annualized Salary by Average Project Budget (in USD)
Employees n= Percent 25th Percentile Median 75th Percentile Mean
Less than $100,000 41 12% 80,000 100,800 144,000 118,993 $100,000 to $499,999 103 30% 81,600 101,760 144,000 117,854 $500,000 to $999,999 63 18% 96,000 134,000 180,000 140,685 $1 million to $10 million 95 28% 87,600 120,000 170,000 132,225 More than $10 million 42 12% 105,000 145,200 210,000 172,023

Project Management Salary Survey –Seventh Edition 128
Malaysia – All Respondents
Project Management Career Path within Organization
n= Percent Yes - Clearly defined/in writing 93 25% Yes – Informal 207 56% No 50 14% Don't Know 20 5%
Project Management Career Path Connected to Roles in Upper Management
n= Percent Yes - Clearly defined/in writing 61 20% Yes – Informal 178 60% No 36 12% Don't Know 24 8%
Defined Set of Performance Skills for Project Managers within Organization
n= Percent Yes - Clearly defined/in writing 156 42% Yes – Informal 139 38% No 59 16% Don't Know 16 4%
Equities Offered in Past Year by Position Description
Stock Options Stock
(i.e., Shares) Neither n= Percent n= Percent n= Percent
Total 46 13% 33 9% 297 81% Director of Project Management Office (PMO) 2 11% 0 * 17 89% Portfolio Manager 2 13% 2 13% 12 80% Program Manager 8 13% 7 11% 50 79% Project Manager III 12 19% 6 9% 47 73% Project Manager II 9 8% 8 8% 92 87% Project Manager I 9 13% 8 11% 57 79% Project Management Specialist 2 25% 1 13% 5 63% Project Management Consultant 2 10% 1 5% 17 85%
Employee Benefits Offered by Position Description
Company
Car/Allowance Cell Phone Usage Paid Life Insurance n= Percent n= Percent n= Percent
Total 168 46% 247 67% 141 38% Director of Project Management Office (PMO) 13 68% 16 84% 6 32% Portfolio Manager 11 79% 12 86% 5 36% Program Manager 31 49% 49 78% 27 43% Project Manager III 21 32% 38 58% 24 37% Project Manager II 49 46% 72 68% 40 38% Project Manager I 32 44% 43 60% 29 40% Project Management Specialist 3 38% 5 63% 4 50% Project Management Consultant 8 40% 12 60% 6 30%
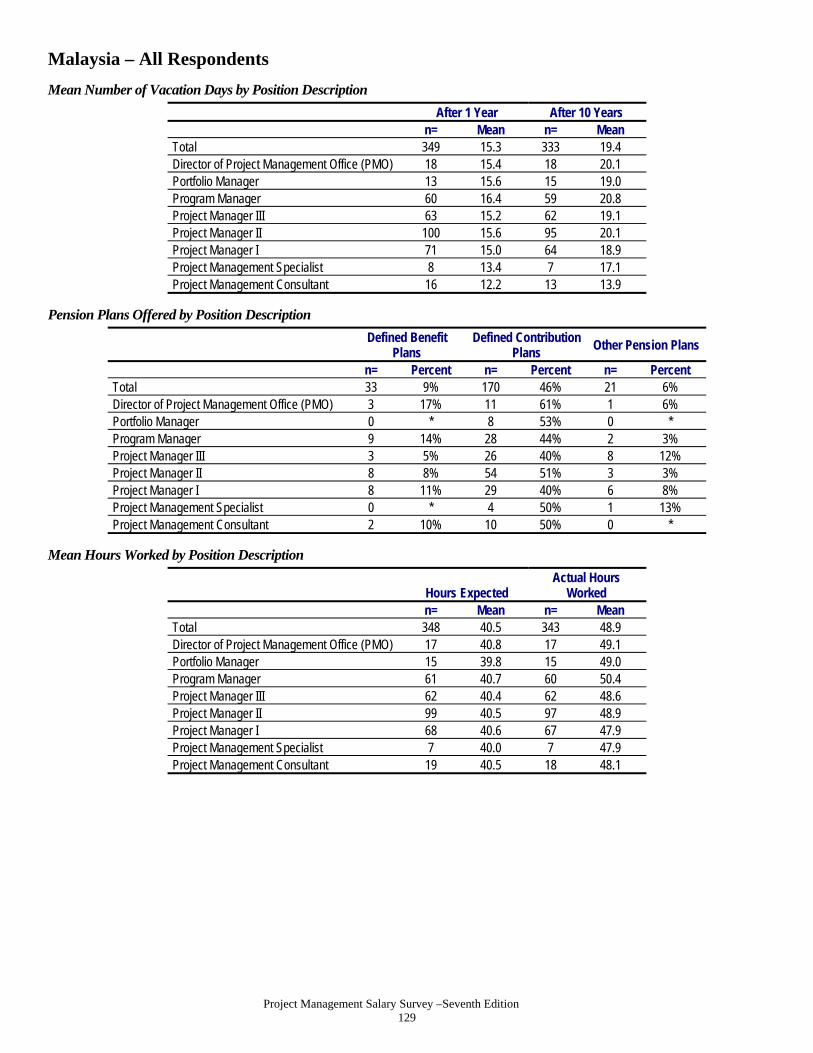
Project Management Salary Survey –Seventh Edition 129
Malaysia – All Respondents
Mean Number of Vacation Days by Position Description
After 1 Year After 10 Years n= Mean n= Mean
Total 349 15.3 333 19.4 Director of Project Management Office (PMO) 18 15.4 18 20.1 Portfolio Manager 13 15.6 15 19.0 Program Manager 60 16.4 59 20.8 Project Manager III 63 15.2 62 19.1 Project Manager II 100 15.6 95 20.1 Project Manager I 71 15.0 64 18.9 Project Management Specialist 8 13.4 7 17.1 Project Management Consultant 16 12.2 13 13.9
Pension Plans Offered by Position Description
Defined Benefit
Plans Defined Contribution
Plans Other Pension Plans
n= Percent n= Percent n= Percent Total 33 9% 170 46% 21 6% Director of Project Management Office (PMO) 3 17% 11 61% 1 6% Portfolio Manager 0 * 8 53% 0 * Program Manager 9 14% 28 44% 2 3% Project Manager III 3 5% 26 40% 8 12% Project Manager II 8 8% 54 51% 3 3% Project Manager I 8 11% 29 40% 6 8% Project Management Specialist 0 * 4 50% 1 13% Project Management Consultant 2 10% 10 50% 0 *
Mean Hours Worked by Position Description
Hours Expected Actual Hours
Worked n= Mean n= Mean
Total 348 40.5 343 48.9 Director of Project Management Office (PMO) 17 40.8 17 49.1 Portfolio Manager 15 39.8 15 49.0 Program Manager 61 40.7 60 50.4 Project Manager III 62 40.4 62 48.6 Project Manager II 99 40.5 97 48.9 Project Manager I 68 40.6 67 47.9 Project Management Specialist 7 40.0 7 47.9 Project Management Consultant 19 40.5 18 48.1

Project Management Salary Survey –Seventh Edition 130
Mexico – All Respondents
Total Compensation (in Mexican Pesos)
Compensation n= 25th Percentile Median 75th Percentile Mean Salary 369 390,000 500,000 700,000 569,521 Total Compensation 369 424,400 549,804 794,000 646,999
Reported/Expected Change in Total Compensation over Past/Next 12 Months
Past 12 Months n= Percent Next 12 Months n= Percent Decreased 15 4% Decrease 1 * Remained the same 93 25% Remain the same 51 14% Increased less than 1% 11 3% Increase less than 1% 1 * Increased 1% to 2.9% 24 7% Increase 1% to 2.9% 25 7% Increased 3% to 3.9% 40 11% Increase 3% to 3.9% 31 8% Increased 4% to 4.9% 27 7% Increase 4% to 4.9% 36 10% Increased 5% to 6.9% 35 9% Increase 5% to 6.9% 61 17% Increased 7% to 9.9% 12 3% Increase 7% to 9.9% 21 6% Increased 10% to 14.9% 44 12% Increase 10% to 14.9% 68 18% Increased 15% to 19.9% 17 5% Increase 15% to 19.9% 27 7% Increased 20% to 24.9% 14 4% Increase 20% to 24.9% 15 4% Increased 25% to 29.9% 11 3% Increase 25% to 29.9% 7 2% Increased 30% or greater 26 7% Increase 30% or greater 25 7%
Annualized Salary by Position Description
Position n= Percent 25th Percentile Median 75th Percentile Mean Director of Project Management Office (PMO)
31 8% 499,999 720,000 1,100,000 863,223
Portfolio Manager 25 7% 528,000 725,000 947,500 761,353 Program Manager 68 18% 455,641 593,250 790,000 645,864 Project Manager III 81 22% 432,000 528,804 720,000 571,037 Project Manager II 61 17% 312,000 438,685 500,000 438,484 Project Manager I 51 14% 315,000 390,000 480,000 403,928 Project Management Specialist
15 4% 299,997 467,999 504,000 480,746
Project Management Consultant
37 10% 365,000 504,000 700,000 530,476
Annualized Salary by Years Work Experience
Years n= Percent 25th Percentile Median 75th Percentile Mean Less than 3 years 5 1% – – – – 3 to less than 5 years 9 2% – – – – 5 to less than 10 years 77 21% 300,000 400,000 500,000 435,423 10 to less than 15 years 139 38% 411,000 498,147 600,006 535,104 15 to less than 20 years 64 17% 429,500 657,000 890,500 667,717 20 years or more years 75 20% 504,000 604,747 800,190 734,511

Project Management Salary Survey –Seventh Edition 131
Mexico – All Respondents
Annualized Salary by Technique Experience
Years n= Percent 25th Percentile Median 75th Percentile Mean Agile Project Management/Scrum
None 218 62% 387,400 480,000 720,000 574,284 1 to 5 years 111 32% 384,000 494,916 603,600 530,298 6 years or more 22 6% 574,800 614,872 844,994 713,624
Extreme Project Management None 238 68% 378,659 480,000 677,784 561,121 1 to 5 years 81 23% 429,000 500,000 640,000 553,759 6 years or more 30 9% 579,997 705,000 840,000 719,764
Process Based Project Management
None 70 20% 390,000 471,600 580,000 503,460 1 to 5 years 174 50% 338,000 455,100 603,600 516,722 6 years or more 107 30% 480,000 600,000 850,000 701,204 Event Chain Project Management
None 220 63% 384,000 482,942 693,998 567,198 1 to 5 years 89 26% 400,000 494,916 649,997 549,321 6 years or more 38 11% 421,000 600,000 800,190 669,138
Interactive Project Management None 160 46% 362,500 467,280 640,500 555,558 1 to 5 years 133 38% 400,000 500,000 612,000 539,392 6 years or more 57 16% 455,000 615,000 831,995 672,348 Incremental Project Management
None 182 52% 372,000 480,000 693,000 563,643 1 to 5 years 115 33% 380,000 470,000 600,000 524,624 6 years or more 52 15% 502,000 619,500 847,497 696,751
Project Portfolio Management None 133 38% 350,000 450,000 540,000 472,545 1 to 5 years 171 48% 400,000 528,000 720,000 586,008 6 years or more 49 14% 500,000 710,000 950,000 762,334

Project Management Salary Survey –Seventh Edition 132
Mexico – All Respondents
Annualized Salary by Technique Experience (Continued)
Years n= Percent 25th Percentile Median 75th Percentile Mean Program Management
None 94 27% 336,000 431,739 520,000 470,407 1 to 5 years 179 51% 400,000 500,000 655,999 556,260 6 years or more 77 22% 480,000 665,000 868,000 738,109
Earned Value Management None 107 30% 336,000 445,440 550,000 519,165 1 to 5 years 185 52% 415,000 516,000 709,999 578,362 6 years or more 61 17% 481,300 600,006 770,000 664,483
Lean Project Management
None 201 57% 400,000 500,000 715,000 581,231 1 to 5 years 109 31% 372,000 468,000 603,600 523,718 6 years or more 40 11% 480,000 600,000 791,895 669,887 Critical Chain Project Management
None 136 39% 376,000 455,641 600,000 542,731 1 to 5 years 145 42% 380,000 500,000 624,000 526,077 6 years or more 68 19% 464,003 705,000 923,750 739,208
Waterfall Project Management
None 173 51% 360,000 456,000 693,000 542,910 1 to 5 years 98 29% 400,000 487,998 649,997 561,047 6 years or more 70 21% 480,000 562,000 762,000 630,135 Risk Management
None 51 14% 350,000 456,000 612,000 498,002 1 to 5 years 213 60% 384,000 480,000 600,000 529,830 6 years or more 91 26% 480,000 624,996 844,994 696,070
Change Management None 58 16% 350,000 449,998 599,999 491,302 1 to 5 years 192 54% 372,000 476,600 600,000 524,486 6 years or more 105 30% 467,999 600,000 800,000 683,162
Resource Management
None 44 12% 343,000 460,181 550,000 487,662 1 to 5 years 189 53% 370,000 455,282 597,600 506,507 6 years or more 122 34% 468,000 600,000 840,000 689,131
Annualized Salary by Years Worked in Project Management
Years n= Percent 25th Percentile Median 75th Percentile Mean
Less than 3 years 15 4% 200,000 365,000 450,000 350,680 3 to less than 5 years 61 17% 300,000 450,000 504,000 423,976 5 to less than 10 years 168 46% 388,700 480,000 622,001 537,060 10 to less than 15 years 90 24% 444,000 598,800 780,000 643,376 15 to less than 20 years 24 7% 589,999 753,880 1,077,220 899,204 20 or more years 11 3% 500,000 752,400 1,134,000 847,235
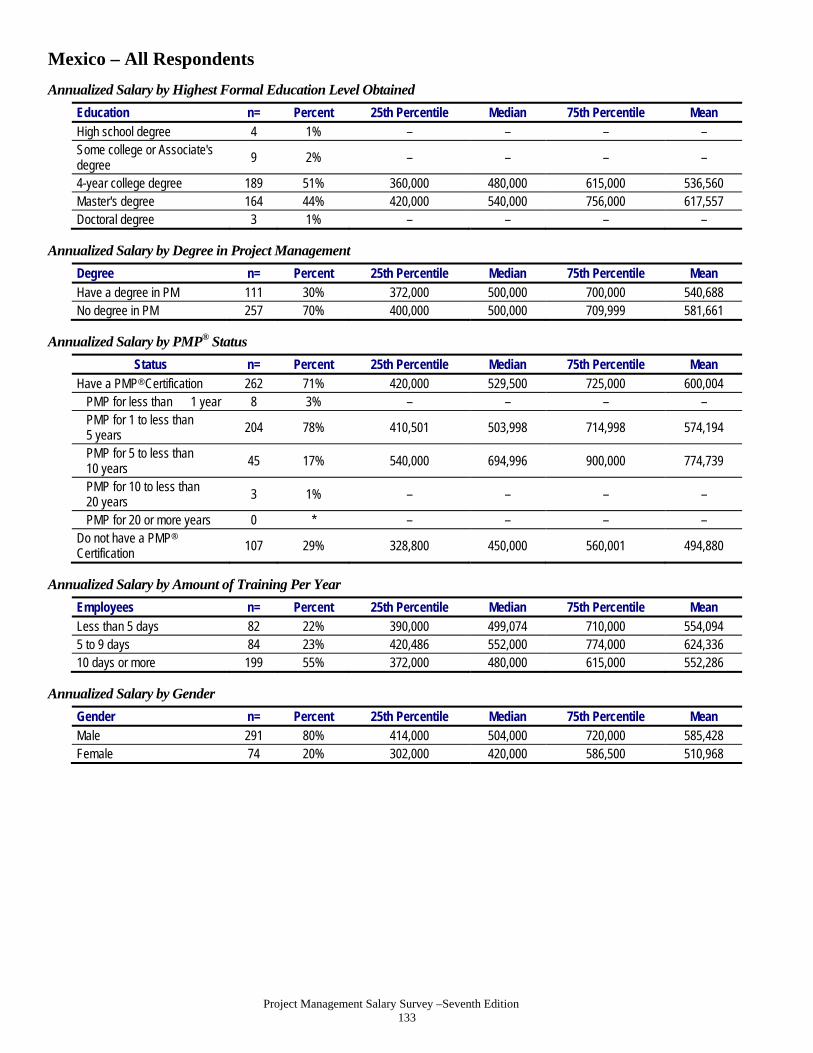
Project Management Salary Survey –Seventh Edition 133
Mexico – All Respondents
Annualized Salary by Highest Formal Education Level Obtained
Education n= Percent 25th Percentile Median 75th Percentile Mean High school degree 4 1% – – – – Some college or Associate's degree
9 2% – – – –
4-year college degree 189 51% 360,000 480,000 615,000 536,560 Master's degree 164 44% 420,000 540,000 756,000 617,557 Doctoral degree 3 1% – – – –
Annualized Salary by Degree in Project Management
Degree n= Percent 25th Percentile Median 75th Percentile Mean
Have a degree in PM 111 30% 372,000 500,000 700,000 540,688 No degree in PM 257 70% 400,000 500,000 709,999 581,661
Annualized Salary by PMP® Status
Status n= Percent 25th Percentile Median 75th Percentile Mean
Have a PMP® Certification 262 71% 420,000 529,500 725,000 600,004 PMP for less than 1 year 8 3% – – – – PMP for 1 to less than 5 years 204 78% 410,501 503,998 714,998 574,194
PMP for 5 to less than 10 years
45 17% 540,000 694,996 900,000 774,739
PMP for 10 to less than 20 years
3 1% – – – –
PMP for 20 or more years 0 * – – – – Do not have a PMP®
Certification 107 29% 328,800 450,000 560,001 494,880
Annualized Salary by Amount of Training Per Year
Employees n= Percent 25th Percentile Median 75th Percentile Mean Less than 5 days 82 22% 390,000 499,074 710,000 554,094 5 to 9 days 84 23% 420,486 552,000 774,000 624,336 10 days or more 199 55% 372,000 480,000 615,000 552,286
Annualized Salary by Gender
Gender n= Percent 25th Percentile Median 75th Percentile Mean Male 291 80% 414,000 504,000 720,000 585,428 Female 74 20% 302,000 420,000 586,500 510,968

Project Management Salary Survey –Seventh Edition 134
Mexico – All Respondents
Annualized Salary by Department
Department n= Percent 25th Percentile Median 75th Percentile Mean Administration/ General Management
46 13% 440,000 577,999 770,000 616,913
Consulting 55 15% 391,960 501,000 677,784 589,417 Customer Service/ Public Relations
2 1% – – – –
Engineering 14 4% 449,995 640,498 720,000 579,585 Finance 10 3% 260,000 401,845 530,000 391,277 Human Resources 1 * – – – – Information Technology/ Information Systems
104 28% 390,000 480,650 600,000 553,749
Operations/Manufacturing 8 2% – – – – Project Management Department or PMO
97 26% 400,000 500,000 720,000 574,568
Quality Management 4 1% – – – – Research and Development 5 1% – – – – Sales/Marketing 4 1% – – – – Supply Chain Management/Logistics 6 2% – – – –
Training/Education 1 * – – – – Other 10 3% 264,000 507,000 831,995 603,440
Annualized Salary by Industry
Industry n= Percent 25th Percentile Median 75th Percentile Mean
Aerospace 2 1% – – – – Business Services 6 2% – – – – Construction 10 3% 450,000 742,440 852,000 675,208 Consulting 72 20% 395,980 500,000 637,497 571,326 Engineering 13 4% 365,000 586,000 750,000 588,616 Financial Services 26 7% 372,000 453,000 504,000 498,715 Food and Beverage 11 3% 420,000 600,000 727,130 584,193 Government 10 3% 396,000 492,000 780,000 661,780 Healthcare 2 1% – – – – Information Technology 132 36% 388,700 499,073 638,750 543,628 Insurance 9 2% – – – – Legal 0 * – – – – Manufacturing 17 5% 400,000 540,000 726,000 669,193 Pharmaceuticals 4 1% – – – – Real Estate 0 * – – – – Resources (Agriculture, Mining, etc.)
10 3% 264,000 374,001 700,000 537,400
Telecommunications 36 10% 407,761 535,000 790,000 597,301 Training/Education 2 1% – – – – Utility 2 1% – – – – Other 5 1% – – – –

Project Management Salary Survey –Seventh Edition 135
Mexico – All Respondents Annualized by Type of Project
Project Type n= Percent 25th Percentile Median 75th Percentile Mean Business Transformation 91 25% 408,000 528,000 750,000 655,931 Construction 28 8% 434,998 600,000 786,998 609,177 Engineering 47 13% 338,000 500,000 715,000 571,259 Information Technology 269 73% 396,000 500,000 700,000 569,751 Manufacturing 17 5% 372,000 540,000 726,000 650,059 Operations 62 17% 400,000 545,000 715,000 584,557 Quality Management 47 13% 396,000 504,000 600,000 548,099 Regulatory Compliance 31 8% 420,000 478,000 700,000 583,501 Research and Development 15 4% 480,000 600,000 670,000 592,600 Supply Chain Management/Logistics
29 8% 378,659 456,000 600,000 586,745
Other 31 8% 328,800 449,995 725,000 572,495
Annualized Salary by Number of Employees in Entire Organization
Employees n= Percent 25th Percentile Median 75th Percentile Mean Less than 100 56 15% 332,400 467,600 651,390 551,824 100 to 299 38 10% 372,000 490,000 720,000 543,207 300 to 999 57 15% 331,248 456,000 625,000 529,238 1,000 to 2,499 39 11% 404,521 501,000 600,000 612,873 2,500 to 4,999 28 8% 468,000 522,000 867,500 674,146 5,000 to 9,999 32 9% 405,500 506,400 651,000 545,286 10,000 or more 119 32% 400,000 507,000 715,000 573,238
Annualized Salary by Average Project Team Size
Employees n= Percent 25th Percentile Median 75th Percentile Mean 1-4 people 46 15% 408,000 497,458 700,000 615,938 5-9 people 113 36% 372,000 501,000 677,784 548,139 10-14 people 67 21% 404,521 480,000 750,000 598,124 15-19 people 30 10% 449,995 572,000 780,000 638,771 20 or more people 59 19% 432,000 528,804 762,000 595,892
Annualized Salary by Average Project Budget (in USD)
Employees n= Percent 25th Percentile Median 75th Percentile Mean
Less than $100,000 55 17% 336,000 421,000 550,000 466,237 $100,000 to $499,999 98 30% 372,000 475,181 690,000 552,627 $500,000 to $999,999 75 23% 381,367 504,000 740,000 588,680 $1 million to $10 million 83 25% 444,000 564,000 800,190 662,422 More than $10 million 20 6% 465,000 741,000 896,500 695,050

Project Management Salary Survey –Seventh Edition 136
Mexico – All Respondents
Project Management Career Path within Organization
n= Percent Yes - Clearly defined/in writing 124 34% Yes - Informal 135 37% No 93 25% Don't Know 15 4%
Project Management Career Path Connected to Roles in Upper Management
n= Percent Yes - Clearly defined/in writing 96 37% Yes - Informal 120 47% No 30 12% Don't Know 11 4%
Defined Set of Performance Skills for Project Managers within Organization
n= Percent Yes - Clearly defined/in writing 149 40% Yes - Informal 127 35% No 80 22% Don't Know 12 3%
Equities Offered in Past Year by Position Description
Stock Options Stock
(i.e., Shares) Neither n= Percent n= Percent n= Percent
Total 36 10% 17 5% 313 86% Director of Project Management Office (PMO) 2 6% 2 6% 28 90% Portfolio Manager 4 16% 0 * 21 84% Program Manager 5 7% 1 1% 61 91% Project Manager III 10 13% 3 4% 67 84% Project Manager II 6 10% 7 11% 49 80% Project Manager I 4 8% 1 2% 43 90% Project Management Specialist 2 14% 2 14% 10 71% Project Management Consultant 3 8% 1 3% 34 92%
Employee Benefits Offered by Position Description
Company
Car/Allowance Cell Phone Usage Paid Life Insurance n= Percent n= Percent n= Percent
Total 95 26% 192 53% 235 65% Director of Project Management Office (PMO) 12 39% 18 58% 18 58% Portfolio Manager 11 44% 14 56% 18 72% Program Manager 24 36% 49 73% 52 78% Project Manager III 22 27% 45 56% 47 58% Project Manager II 13 21% 23 38% 36 59% Project Manager I 7 15% 20 43% 31 66% Project Management Specialist 3 20% 6 40% 9 60% Project Management Consultant 3 8% 17 46% 24 65%

Project Management Salary Survey –Seventh Edition 137
Mexico – All Respondents
Mean Number of Vacation Days by Position Description
After 1 Year After 10 Years n= Mean n= Mean
Total 363 10.3 344 18.1
Director of Project Management Office (PMO) 31 12.2 30 17.8
Portfolio Manager 25 10.7 25 17.0
Program Manager 67 9.9 65 17.1
Project Manager III 80 9.8 77 17.8
Project Manager II 60 10.0 56 17.2
Project Manager I 49 10.6 44 21.0
Project Management Specialist 15 13.0 15 21.8
Project Management Consultant 36 9.3 32 17.5
Pension Plans Offered by Position Description
Defined Benefit Plans
Defined Contribution Plans
Other Pension Plans
n= Percent n= Percent n= Percent
Total 148 40% 95 26% 33 9%
Director of Project Management Office (PMO) 13 42% 5 16% 2 6%
Portfolio Manager 10 40% 7 28% 3 12%
Program Manager 26 38% 13 19% 8 12%
Project Manager III 35 43% 26 32% 4 5%
Project Manager II 23 38% 15 25% 8 13%
Project Manager I 18 37% 17 35% 4 8%
Project Management Specialist 7 47% 4 27% 1 7%
Project Management Consultant 16 43% 8 22% 3 8%
Mean Hours Worked by Position Description
Hours Expected Actual Hours Worked
n= Mean n= Mean
Total 339 41.3 337 48.5
Director of Project Management Office (PMO) 27 40.7 26 47.7
Portfolio Manager 23 41.3 23 46.8
Program Manager 66 41.5 66 50.6
Project Manager III 74 41.4 74 49.5
Project Manager II 53 40.6 52 48.2
Project Manager I 48 42.2 48 46.3
Project Management Specialist 13 41.2 13 47.8
Project Management Consultant 35 41.0 35 47.4

Project Management Salary Survey –Seventh Edition 138
Netherlands – All Respondents
Total Compensation (in European Union Euros)
Compensation n= 25th Percentile Median 75th Percentile Mean Salary 303 65,000 75,606 95,000 84,741 Total Compensation 303 70,000 83,600 107,000 95,278
Reported/Expected Change in Total Compensation over Past/Next 12 Months
Past 12 months n= Percent Next 12 months n= Percent Decreased 8 3% Decrease 9 3% Remained the same 86 28% Remain the same 82 27% Increased less than 1% 25 8% Increase less than 1% 24 8% Increased 1% to 2.9% 91 30% Increase 1% to 2.9% 94 31% Increased 3% to 3.9% 29 10% Increase 3% to 3.9% 45 15% Increased 4% to 4.9% 16 5% Increase 4% to 4.9% 16 5% Increased 5% to 6.9% 14 5% Increase 5% to 6.9% 16 5% Increased 7% to 9.9% 12 4% Increase 7% to 9.9% 8 3% Increased 10% to 14.9% 12 4% Increase 10% to 14.9% 7 2% Increased 15% to 19.9% 0 * Increase 15% to 19.9% 0 * Increased 20% to 24.9% 6 2% Increase 20% to 24.9% 0 * Increased 25% to 29.9% 0 * Increase 25% to 29.9% 0 * Increased 30% or greater 4 1% Increase 30% or greater 2 1%
Annualized Salary by Position Description
Position n= Percent 25th Percentile Median 75th Percentile Mean Director of Project Management Office (PMO)
11 4% 69,000 75,321 100,000 85,320
Portfolio Manager 20 7% 80,075 95,000 130,000 107,235 Program Manager 76 25% 72,472 85,900 107,000 95,585 Project Manager III 85 28% 67,000 77,090 87,000 82,080 Project Manager II 75 25% 60,000 66,828 82,000 74,551 Project Manager I 14 5% 57,000 63,000 79,000 68,429 Project Management Specialist
4 1% – – – –
Project Management Consultant
18 6% 64,000 70,000 90,000 78,355
Annualized Salary by Years Work Experience
Years n= Percent 25th Percentile Median 75th Percentile Mean
Less than 3 years 0 * – – – – 3 to less than 5 years 3 1% – – – – 5 to less than 10 years 19 6% 53,000 58,500 64,000 60,626 10 to less than 15 years 62 20% 60,000 65,000 78,000 75,231 15 to less than 20 years 53 17% 65,000 75,000 90,000 83,362 20 years or more years 166 55% 70,000 84,000 100,000 92,193

Project Management Salary Survey –Seventh Edition 139
Netherlands – All Respondents
Annualized Salary by Technique Experience
Years n= Percent 25th Percentile Median 75th Percentile Mean Agile Project Management/Scrum
None 183 64% 65,000 75,321 93,600 83,855 1 to 5 years 84 29% 63,000 75,000 95,000 85,370 6 years or more 21 7% 70,000 82,850 100,000 93,249
Extreme Project Management
None 194 69% 64,000 75,000 91,000 82,657 1 to 5 years 62 22% 63,000 75,000 100,000 85,402 6 years or more 24 9% 75,000 87,542 110,000 102,563 Process Based Project Management
None 92 32% 62,096 75,271 94,300 83,680 1 to 5 years 80 28% 57,600 70,000 85,000 79,125 6 years or more 113 40% 69,000 80,000 100,000 89,494
Event Chain Project Management
None 202 73% 65,000 77,000 93,600 85,675 1 to 5 years 49 18% 62,000 75,000 90,000 81,929 6 years or more 24 9% 67,800 85,000 108,500 88,326
Interactive Project Management None 145 52% 62,500 74,000 91,000 83,466 1 to 5 years 62 22% 63,000 74,021 100,000 84,376 6 years or more 72 26% 70,000 81,634 100,000 88,021 Incremental Project Management
None 143 51% 65,000 77,000 95,000 84,168 1 to 5 years 73 26% 58,500 70,000 84,000 76,774 6 years or more 63 23% 75,000 85,000 105,000 94,419
Project Portfolio Management None 111 38% 59,000 68,900 87,000 78,633 1 to 5 years 111 38% 66,000 77,000 90,000 84,597 6 years or more 67 23% 75,000 90,000 110,000 96,303

Project Management Salary Survey –Seventh Edition 140
Netherlands – All Respondents
Annualized Salary by Technique Experience (Continued)
Years n= Percent 25th Percentile Median 75th Percentile Mean Program Management
None 67 23% 57,500 65,000 79,000 70,694 1 to 5 years 142 48% 66,000 75,411 93,000 84,077 6 years or more 86 29% 75,223 90,000 115,000 98,882
Earned Value Management None 74 26% 60,000 72,536 95,000 82,445 1 to 5 years 138 49% 62,192 72,000 90,000 80,874 6 years or more 72 25% 75,000 85,000 103,500 95,576 Lean Project Management
None 140 48% 62,000 72,307 90,000 80,963 1 to 5 years 107 37% 68,900 80,000 100,000 90,411 6 years or more 42 15% 65,000 81,959 100,000 83,790
Critical Chain Project Management None 133 46% 62,304 75,606 95,000 84,621 1 to 5 years 85 29% 61,000 71,000 89,000 77,560 6 years or more 71 25% 70,000 83,268 105,000 93,349
Waterfall Project Management
None 113 39% 64,000 75,000 95,000 85,375 1 to 5 years 58 20% 57,000 67,500 85,000 75,649 6 years or more 120 41% 68,932 79,945 100,000 88,613
Risk Management None 12 4% 55,000 66,250 86,000 79,301 1 to 5 years 108 37% 58,000 67,300 84,075 76,270 6 years or more 174 59% 70,000 80,259 100,000 90,165 Change Management
None 22 8% 54,180 71,000 84,000 69,547 1 to 5 years 110 38% 60,000 70,000 90,000 81,520 6 years or more 158 54% 70,000 80,921 100,000 89,402
Resource Management
None 28 10% 58,000 68,000 79,945 73,261 1 to 5 years 98 34% 59,000 67,100 80,000 74,819 6 years or more 165 57% 70,000 84,000 100,000 93,050
Annualized Salary by Years Worked in Project Management
Years n= Percent 25th Percentile Median 75th Percentile Mean
Less than 3 years 3 1% – – – – 3 to less than 5 years 26 9% 50,000 57,350 63,000 63,439 5 to less than 10 years 89 29% 60,000 68,000 79,000 73,034 10 to less than 15 years 97 32% 70,000 80,000 100,000 90,177 15 to less than 20 years 53 17% 73,385 87,000 110,000 97,092 20 or more years 35 12% 80,000 95,000 113,336 99,070

Project Management Salary Survey –Seventh Edition 141
Netherlands – All Respondents
Annualized Salary by Highest Formal Education Level Obtained
Education n= Percent 25th Percentile Median 75th Percentile Mean High school degree 18 6% 67,000 72,000 86,883 78,931 Some college or Associate's degree
19 6% 62,000 71,071 85,000 73,808
4-year college degree 80 26% 65,000 75,411 97,500 85,152 Master's degree 162 53% 63,000 75,000 95,000 84,485 Doctoral degree 24 8% 75,500 88,900 105,000 98,112
Annualized Salary by Degree in Project Management
Degree n= Percent 25th Percentile Median 75th Percentile Mean
Have a degree in PM 29 10% 62,000 70,000 85,000 86,121 No degree in PM 273 90% 65,000 77,090 95,000 84,685
Annualized Salary by PMP® Status
Status n= Percent 25th Percentile Median 75th Percentile Mean
Have a PMP® Certification 249 82% 65,000 77,090 95,000 85,403 PMP for less than 1 year 4 2% – – – – PMP for 1 to less than 5 years 148 60% 64,500 72,778 90,000 79,679
PMP for 5 to less than 10 years
80 32% 70,000 84,424 107,500 94,224
PMP for 10 to less than 20 years
15 6% 70,000 80,517 110,000 96,347
PMP for 20 or more years 0 * – – – – Do not have a PMP® Certification 54 18% 57,500 71,000 90,000 81,686
Annualized Salary by Amount of Training Per Year
Employees n= Percent 25th Percentile Median 75th Percentile Mean Less than 5 days 116 38% 65,000 77,045 91,500 82,635 5 to 9 days 120 40% 66,414 76,303 93,950 86,145 10 days or more 67 22% 60,000 73,500 103,000 85,873
Annualized Salary by Gender
Gender n= Percent 25th Percentile Median 75th Percentile Mean Male 271 92% 65,000 77,000 95,000 84,670 Female 25 8% 59,998 71,071 95,000 84,222
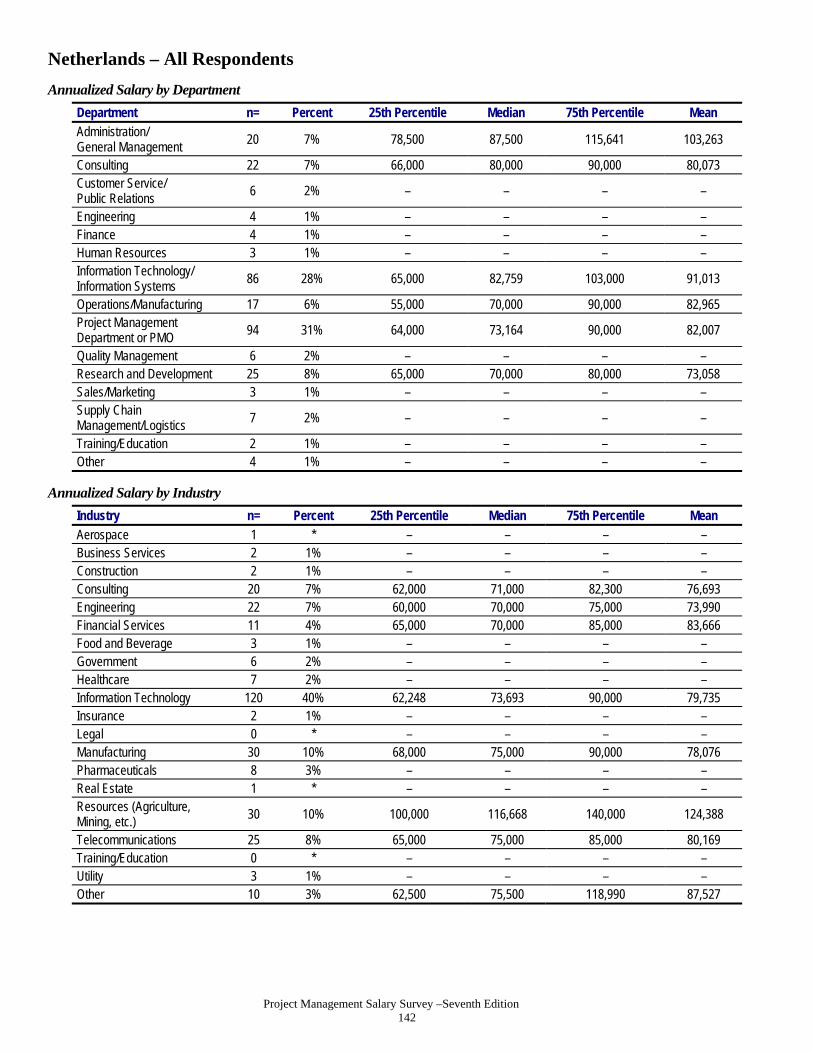
Project Management Salary Survey –Seventh Edition 142
Netherlands – All Respondents
Annualized Salary by Department
Department n= Percent 25th Percentile Median 75th Percentile Mean Administration/ General Management
20 7% 78,500 87,500 115,641 103,263
Consulting 22 7% 66,000 80,000 90,000 80,073 Customer Service/ Public Relations
6 2% – – – –
Engineering 4 1% – – – – Finance 4 1% – – – – Human Resources 3 1% – – – – Information Technology/ Information Systems
86 28% 65,000 82,759 103,000 91,013
Operations/Manufacturing 17 6% 55,000 70,000 90,000 82,965 Project Management Department or PMO
94 31% 64,000 73,164 90,000 82,007
Quality Management 6 2% – – – – Research and Development 25 8% 65,000 70,000 80,000 73,058 Sales/Marketing 3 1% – – – – Supply Chain Management/Logistics 7 2% – – – –
Training/Education 2 1% – – – – Other 4 1% – – – –
Annualized Salary by Industry
Industry n= Percent 25th Percentile Median 75th Percentile Mean
Aerospace 1 * – – – – Business Services 2 1% – – – – Construction 2 1% – – – – Consulting 20 7% 62,000 71,000 82,300 76,693 Engineering 22 7% 60,000 70,000 75,000 73,990 Financial Services 11 4% 65,000 70,000 85,000 83,666 Food and Beverage 3 1% – – – – Government 6 2% – – – – Healthcare 7 2% – – – – Information Technology 120 40% 62,248 73,693 90,000 79,735 Insurance 2 1% – – – – Legal 0 * – – – – Manufacturing 30 10% 68,000 75,000 90,000 78,076 Pharmaceuticals 8 3% – – – – Real Estate 1 * – – – – Resources (Agriculture, Mining, etc.)
30 10% 100,000 116,668 140,000 124,388
Telecommunications 25 8% 65,000 75,000 85,000 80,169 Training/Education 0 * – – – – Utility 3 1% – – – – Other 10 3% 62,500 75,500 118,990 87,527

Project Management Salary Survey –Seventh Edition 143
Netherlands – All Respondents
Annualized by Type of Project
Project Type n= Percent 25th Percentile Median 75th Percentile Mean Business Transformation 93 31% 65,000 81,324 100,000 90,675 Construction 15 5% 70,000 75,223 126,100 98,560 Engineering 43 14% 60,000 71,000 90,000 83,591 Information Technology 207 68% 65,000 78,000 100,000 85,997 Manufacturing 24 8% 60,000 78,500 90,500 87,942 Operations 60 20% 65,000 78,250 90,500 88,085 Quality Management 24 8% 57,850 71,661 85,142 76,645 Regulatory Compliance 18 6% 65,000 76,303 100,000 88,261 Research and Development 49 16% 68,964 79,000 100,000 86,210 Supply Chain Management/Logistics
35 12% 68,000 80,000 115,000 93,943
Other 21 7% 65,000 73,500 83,400 76,563
Annualized Salary by Number of Employees in Entire Organization
Employees n= Percent 25th Percentile Median 75th Percentile Mean Less than 100 25 8% 64,000 80,000 140,000 101,878 100 to 299 7 2% – – – – 300 to 999 15 5% 64,000 67,000 85,000 80,107 1,000 to 2,499 12 4% 65,000 81,000 91,000 84,000 2,500 to 4,999 16 5% 63,750 77,412 106,000 86,298 5,000 to 9,999 14 5% 69,000 75,500 100,000 88,131 10,000 or more 214 71% 65,000 76,303 94,300 83,241
Annualized Salary by Average Project Team Size
Employees n= Percent 25th Percentile Median 75th Percentile Mean
1-4 people 21 8% 60,000 70,000 88,200 75,545 5-9 people 82 32% 60,000 70,000 87,000 77,637 10-14 people 64 25% 62,096 70,000 87,500 78,098 15-19 people 20 8% 71,972 91,000 125,000 98,181 20 or more people 66 26% 74,000 84,500 100,000 93,297
Annualized Salary by Average Project Budget (in USD)
Employees n= Percent 25th Percentile Median 75th Percentile Mean
Less than $100,000 20 7% 57,480 64,500 80,193 72,637 $100,000 to $499,999 64 22% 61,500 74,250 90,000 79,879 $500,000 to $999,999 56 20% 63,500 70,000 81,000 73,854 $1 million to $10 million 119 42% 69,000 80,517 100,000 89,453 More than $10 million 27 9% 70,000 89,000 140,000 104,849

Project Management Salary Survey –Seventh Edition 144
Netherlands – All Respondents
Project Management Career Path within Organization
n= Percent Yes - Clearly defined/in writing 131 43% Yes - Informal 95 31% No 69 23% Don't Know 7 2%
Project Management Career Path Connected to Roles in Upper Management
n= Percent Yes - Clearly defined/in writing 57 25% Yes - Informal 79 35% No 66 29% Don't Know 22 10%
Defined Set of Performance Skills for Project Managers within Organization
n= Percent Yes - Clearly defined/in writing 210 70% Yes - Informal 57 19% No 29 10% Don't Know 3 1%
Equities Offered in Past Year by Position Description
Stock Options Stock
(i.e., Shares) Neither n= Percent n= Percent n= Percent
Total 30 10% 37 12% 243 80% Director of Project Management Office (PMO) 1 9% 2 18% 8 73% Portfolio Manager 3 15% 4 20% 15 75% Program Manager 12 16% 23 30% 46 61% Project Manager III 5 6% 1 1% 79 93% Project Manager II 8 11% 5 7% 62 84% Project Manager I 1 7% 1 7% 12 86% Project Management Specialist 0 * 1 25% 3 75% Project Management Consultant 0 * 0 * 18 100%
Employee Benefits Offered by Position Description
Company
Car/Allowance Cell Phone Usage Paid Life Insurance n= Percent n= Percent n= Percent
Total 187 62% 248 82% 49 16% Director of Project Management Office (PMO) 8 73% 10 91% 2 18% Portfolio Manager 13 65% 18 90% 4 20% Program Manager 46 61% 67 88% 15 20% Project Manager III 59 69% 71 84% 15 18% Project Manager II 40 54% 56 76% 9 12% Project Manager I 11 79% 11 79% 1 7% Project Management Specialist 2 50% 3 75% 2 50% Project Management Consultant 8 44% 12 67% 1 6%

Project Management Salary Survey –Seventh Edition 145
Netherlands – All Respondents
Mean Number of Vacation Days by Position Description
After 1 Year After 10 Years n= Mean n= Mean
Total 293 27.4 287 28.7 Director of Project Management Office (PMO) 11 30.7 11 33.4 Portfolio Manager 18 26.2 20 27.9 Program Manager 75 26.2 71 28.5 Project Manager III 82 27.7 84 28.4 Project Manager II 73 29.0 70 30.1 Project Manager I 13 26.5 13 27.4 Project Management Specialist 4 31.3 3 33.7 Project Management Consultant 17 23.1 15 22.7
Pension Plans Offered by Position Description
Defined Benefit
Plans Defined Contribution
Plans Other Pension Plans n= Percent n= Percent n= Percent
Total 119 40% 149 50% 44 15% Director of Project Management Office (PMO) 4 36% 7 64% 0 * Portfolio Manager 9 45% 11 55% 1 5% Program Manager 29 38% 31 41% 19 25% Project Manager III 35 42% 44 53% 9 11% Project Manager II 29 39% 39 52% 11 15% Project Manager I 7 50% 8 57% 1 7% Project Management Specialist 0 * 4 100% 0 * Project Management Consultant 6 35% 5 29% 3 18%
Mean Hours Worked by Position Description
Hours Expected Actual Hours
Worked n= Mean n= Mean
Total 302 39.6 301 46.2 Director of Project Management Office (PMO) 11 39.4 11 46.1 Portfolio Manager 20 39.7 20 48.3 Program Manager 76 39.5 75 47.0 Project Manager III 85 39.8 85 46.6 Project Manager II 74 39.5 74 45.0 Project Manager I 14 38.7 14 45.2 Project Management Specialist 4 38.8 4 41.0 Project Management Consultant 18 40.1 18 45.1

Project Management Salary Survey –Seventh Edition 146
New Zealand – All Respondents
Total Compensation (in New Zealand Dollars)
Compensation n= 25th Percentile Median 75th Percentile Mean Salary 442 90,000 110,000 138,000 119,112 Total Compensation 442 94,999 117,750 150,000 126,227
Reported/Expected Change in Total Compensation over Past/Next 12 Months
Past 12 Months n= Percent Next 12 Months n= Percent Decreased 14 3% Decrease 6 1% Remained the same 137 31% Remain the same 129 29% Increased less than 1% 11 2% Increase less than 1% 13 3% Increased 1% to 2.9% 97 22% Increase 1% to 2.9% 114 26% Increased 3% to 3.9% 50 11% Increase 3% to 3.9% 61 14% Increased 4% to 4.9% 34 8% Increase 4% to 4.9% 35 8% Increased 5% to 6.9% 24 5% Increase 5% to 6.9% 40 9% Increased 7% to 9.9% 20 5% Increase 7% to 9.9% 12 3% Increased 10% to 14.9% 21 5% Increase 10% to 14.9% 21 5% Increased 15% to 19.9% 8 2% Increase 15% to 19.9% 5 1% Increased 20% to 24.9% 10 2% Increase 20% to 24.9% 3 1% Increased 25% to 29.9% 6 1% Increase 25% to 29.9% 0 * Increased 30% or greater 10 2% Increase 30% or greater 3 1%
Annualized Salary by Position Description
Position n= Percent 25th Percentile Median 75th Percentile Mean Director of Project Management Office (PMO)
24 5% 130,000 143,000 162,500 151,129
Portfolio Manager 34 8% 115,000 142,500 157,690 141,123 Program Manager 80 18% 100,000 124,900 145,000 132,916 Project Manager III 135 31% 98,500 115,000 135,000 122,026 Project Manager II 87 20% 83,000 95,000 120,000 101,884 Project Manager I 37 8% 62,000 78,786 90,222 79,139 Project Management Specialist
20 5% 79,250 88,000 100,000 90,160
Project Management Consultant
25 6% 104,500 137,000 165,000 140,808
Annualized Salary by Years Work Experience
Years n= Percent 25th Percentile Median 75th Percentile Mean
Less than 3 years 2 * – – – – 3 to less than 5 years 9 2% – – – – 5 to less than 10 years 29 7% 75,000 83,000 97,000 85,939 10 to less than 15 years 62 14% 82,000 98,000 115,000 103,721 15 to less than 20 years 77 17% 95,000 110,000 130,000 117,674 20 years or more years 263 60% 100,000 120,000 150,000 128,952

Project Management Salary Survey –Seventh Edition 147
New Zealand – All Respondents
Annualized Salary by Technique Experience
Years n= Percent 25th Percentile Median 75th Percentile Mean Agile Project Management/Scrum
None 249 64% 88,000 105,000 130,000 113,581 1 to 5 years 121 31% 99,200 120,000 145,000 128,092 6 years or more 22 6% 116,000 130,000 175,000 140,314
Extreme Project Management
None 286 75% 90,000 107,750 130,000 115,572 1 to 5 years 69 18% 98,000 116,000 140,000 123,992 6 years or more 26 7% 108,000 134,575 175,000 145,667 Process Based Project Management
None 115 29% 90,000 110,000 142,000 116,668 1 to 5 years 148 37% 83,250 100,000 125,000 106,378 6 years or more 137 34% 105,000 120,000 150,000 134,403
Event Chain Project Management
None 303 79% 90,000 110,000 135,000 117,588 1 to 5 years 48 13% 83,400 108,000 130,000 109,426 6 years or more 31 8% 102,000 120,000 147,000 136,044 Interactive Project Management
None 212 54% 90,000 110,000 142,000 119,346 1 to 5 years 95 24% 88,000 105,000 125,000 109,349 6 years or more 82 21% 100,000 120,000 145,000 129,506
Incremental Project Management None 242 63% 90,000 110,000 139,999 117,502 1 to 5 years 73 19% 86,000 100,000 125,000 108,566 6 years or more 70 18% 105,000 120,000 150,000 135,527
Project Portfolio Management
None 170 42% 85,000 98,500 120,000 105,521 1 to 5 years 162 40% 98,000 118,495 145,000 124,922 6 years or more 69 17% 109,999 139,999 160,000 143,261
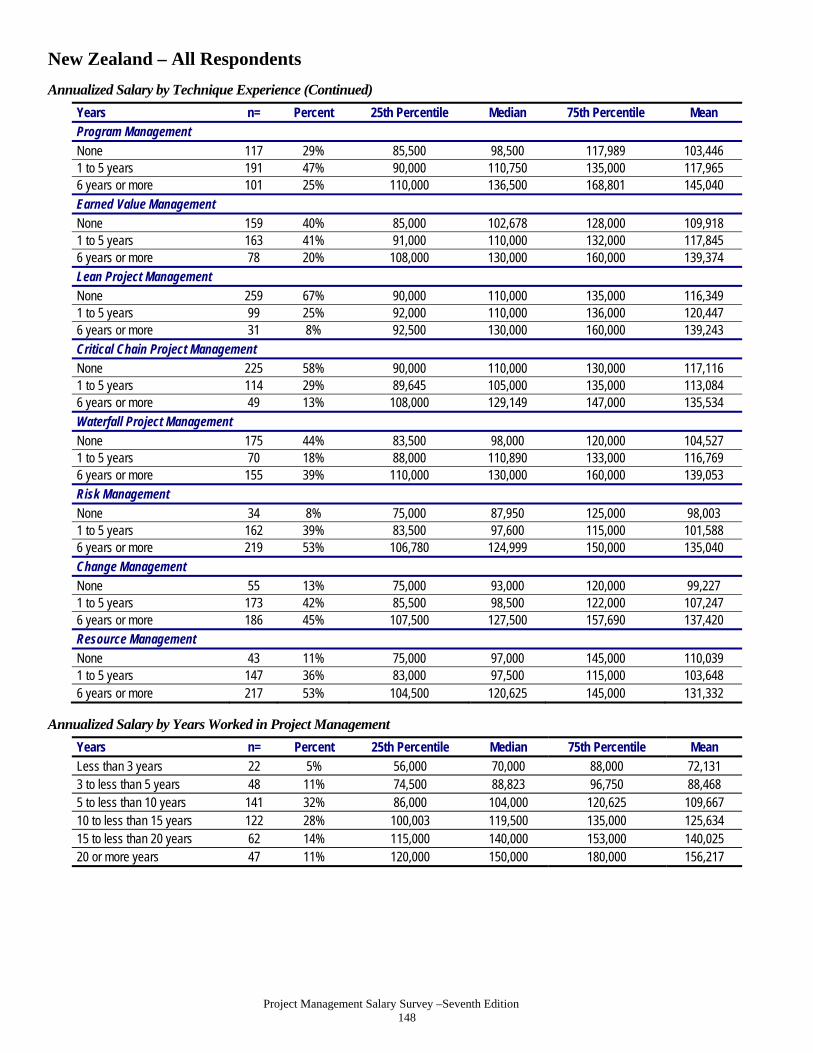
Project Management Salary Survey –Seventh Edition 148
New Zealand – All Respondents
Annualized Salary by Technique Experience (Continued)
Years n= Percent 25th Percentile Median 75th Percentile Mean Program Management
None 117 29% 85,500 98,500 117,989 103,446 1 to 5 years 191 47% 90,000 110,750 135,000 117,965 6 years or more 101 25% 110,000 136,500 168,801 145,040
Earned Value Management None 159 40% 85,000 102,678 128,000 109,918 1 to 5 years 163 41% 91,000 110,000 132,000 117,845 6 years or more 78 20% 108,000 130,000 160,000 139,374 Lean Project Management
None 259 67% 90,000 110,000 135,000 116,349 1 to 5 years 99 25% 92,000 110,000 136,000 120,447 6 years or more 31 8% 92,500 130,000 160,000 139,243
Critical Chain Project Management None 225 58% 90,000 110,000 130,000 117,116 1 to 5 years 114 29% 89,645 105,000 135,000 113,084 6 years or more 49 13% 108,000 129,149 147,000 135,534
Waterfall Project Management
None 175 44% 83,500 98,000 120,000 104,527 1 to 5 years 70 18% 88,000 110,890 133,000 116,769 6 years or more 155 39% 110,000 130,000 160,000 139,053 Risk Management
None 34 8% 75,000 87,950 125,000 98,003 1 to 5 years 162 39% 83,500 97,600 115,000 101,588 6 years or more 219 53% 106,780 124,999 150,000 135,040
Change Management
None 55 13% 75,000 93,000 120,000 99,227 1 to 5 years 173 42% 85,500 98,500 122,000 107,247 6 years or more 186 45% 107,500 127,500 157,690 137,420 Resource Management
None 43 11% 75,000 97,000 145,000 110,039 1 to 5 years 147 36% 83,000 97,500 115,000 103,648 6 years or more 217 53% 104,500 120,625 145,000 131,332
Annualized Salary by Years Worked in Project Management
Years n= Percent 25th Percentile Median 75th Percentile Mean
Less than 3 years 22 5% 56,000 70,000 88,000 72,131 3 to less than 5 years 48 11% 74,500 88,823 96,750 88,468 5 to less than 10 years 141 32% 86,000 104,000 120,625 109,667 10 to less than 15 years 122 28% 100,003 119,500 135,000 125,634 15 to less than 20 years 62 14% 115,000 140,000 153,000 140,025 20 or more years 47 11% 120,000 150,000 180,000 156,217

Project Management Salary Survey –Seventh Edition 149
New Zealand – All Respondents
Annualized Salary by Highest Formal Education Level Obtained
Education n= Percent 25th Percentile Median 75th Percentile Mean High school degree 55 12% 85,500 115,000 144,000 119,248 Some college or Associate's degree
85 19% 89,670 107,500 120,000 112,539
4-year college degree 187 42% 90,000 110,000 136,500 116,587 Master's degree 103 23% 98,000 115,000 145,000 126,969 Doctoral degree 12 3% 113,000 127,500 160,000 136,947
Annualized Salary by Degree in Project Management
Degree n= Percent 25th Percentile Median 75th Percentile Mean
Have a degree in PM 61 14% 88,000 97,000 117,989 106,675 No degree in PM 381 86% 92,000 114,000 139,999 121,103
Annualized Salary by PMP® Status
Status n= Percent 25th Percentile Median 75th Percentile Mean
Have a PMP® Certification 240 54% 100,000 120,000 145,000 128,240 PMP for less than 1 year 2 1% – – – – PMP for 1 to less than 5 years 135 56% 92,500 114,000 129,149 116,144
PMP for 5 to less than 10 years
73 31% 115,000 130,000 160,000 143,233
PMP for 10 to less than 20 years
29 12% 130,000 142,000 165,000 147,008
PMP for 20 or more years 0 * – – – – Do not have a PMP® Certification 202 46% 83,800 99,150 120,000 108,267
Annualized Salary by Amount of Training Per Year
Employees n= Percent 25th Percentile Median 75th Percentile Mean Less than 5 days 241 55% 92,000 115,000 142,866 122,370 5 to 9 days 141 32% 91,000 109,999 135,000 118,529 10 days or more 55 13% 82,000 99,800 122,500 104,322
Annualized Salary by Gender
Gender n= Percent 25th Percentile Median 75th Percentile Mean Male 311 72% 93,000 114,000 142,000 122,371 Female 118 28% 82,000 104,250 130,000 110,523

Project Management Salary Survey –Seventh Edition 150
New Zealand – All Respondents
Annualized Salary by Department
Department n= Percent 25th Percentile Median 75th Percentile Mean Administration/ General Management
43 10% 85,000 110,000 139,999 117,566
Consulting 34 8% 100,000 120,000 160,000 130,338 Customer Service/ Public Relations
3 1% – – – –
Engineering 51 12% 79,500 100,000 116,000 104,754 Finance 6 1% – – – – Human Resources 0 * – – – – Information Technology/ Information Systems
90 20% 95,000 120,000 150,000 129,740
Operations/Manufacturing 10 2% 90,000 108,850 130,000 114,720 Project Management Department or PMO
176 40% 91,750 110,000 135,000 116,315
Quality Management 3 1% – – – – Research and Development 7 2% – – – – Sales/Marketing 3 1% – – – – Supply Chain Management/Logistics 1 * – – – –
Training/Education 1 * – – – – Other 12 3% 86,450 117,499 157,500 129,658
Annualized Salary by Industry
Industry n= Percent 25th Percentile Median 75th Percentile Mean
Aerospace 1 * – – – – Business Services 3 1% – – – – Construction 28 6% 81,500 93,250 110,000 95,564 Consulting 42 10% 110,000 137,500 168,801 142,914 Engineering 54 12% 84,000 98,250 111,000 100,056 Financial Services 18 4% 116,000 129,000 144,000 141,183 Food and Beverage 7 2% – – – – Government 46 10% 89,000 103,313 118,000 111,984 Healthcare 19 4% 88,001 105,000 134,000 109,632 Information Technology 103 23% 100,000 130,000 150,000 132,442 Insurance 5 1% – – – – Legal 0 * – – – – Manufacturing 15 3% 75,000 91,494 120,000 105,927 Pharmaceuticals 0 * – – – – Real Estate 0 * – – – – Resources (Agriculture, Mining, etc.)
6 1% – – – –
Telecommunications 47 11% 92,500 116,000 130,000 123,879 Training/Education 6 1% – – – – Utility 36 8% 81,500 105,000 120,313 109,666 Other 6 1% – – – –

Project Management Salary Survey –Seventh Edition 151
New Zealand – All Respondents
Annualized by Type of Project
Project Type n= Percent 25th Percentile Median 75th Percentile Mean Business Transformation 98 22% 104,000 130,000 160,000 136,035 Construction 108 24% 85,000 100,000 122,750 107,985 Engineering 115 26% 85,000 105,000 125,000 109,175 Information Technology 218 49% 98,000 120,000 150,000 128,775 Manufacturing 19 4% 79,000 110,000 125,000 105,687 Operations 57 13% 97,500 111,000 139,999 122,457 Quality Management 32 7% 87,250 107,500 142,000 117,378 Regulatory Compliance 42 10% 91,000 118,000 165,000 130,743 Research and Development 32 7% 89,500 103,500 125,000 110,780 Supply Chain Management/Logistics
18 4% 98,000 121,000 150,000 131,666
Other 36 8% 89,000 109,000 147,500 123,773
Annualized Salary by Number of Employees in Entire Organization
Employees n= Percent 25th Percentile Median 75th Percentile Mean Less than 100 80 18% 98,750 127,500 160,000 134,418 100 to 299 39 9% 81,000 98,000 115,000 97,906 300 to 999 95 21% 83,500 103,000 120,000 108,239 1,000 to 2,499 68 15% 90,000 115,500 147,500 126,105 2,500 to 4,999 52 12% 95,000 110,000 139,000 119,238 5,000 to 9,999 49 11% 94,159 110,000 126,500 113,429 10,000 or more 59 13% 97,000 120,000 140,000 126,432
Annualized Salary by Average Project Team Size
Employees n= Percent 25th Percentile Median 75th Percentile Mean
1-4 people 45 13% 90,222 111,000 124,800 113,289 5-9 people 146 41% 91,000 110,000 130,000 115,348 10-14 people 101 28% 98,000 120,000 145,000 126,875 15-19 people 19 5% 116,000 138,000 179,230 147,286 20 or more people 49 14% 102,678 121,000 150,000 138,425
Annualized Salary by Average Project Budget (in USD)
Employees n= Percent 25th Percentile Median 75th Percentile Mean
Less than $100,000 43 10% 77,000 90,000 110,000 95,590 $100,000 to $499,999 101 24% 86,000 107,500 125,000 107,979 $500,000 to $999,999 87 21% 92,500 113,000 139,999 118,807 $1 million to $10 million 153 36% 97,000 116,000 145,000 126,677 More than $10 million 39 9% 105,000 124,999 185,000 146,650

Project Management Salary Survey –Seventh Edition 152
New Zealand – All Respondents
Project Management Career Path within Organization
n= Percent Yes - Clearly defined/in writing 75 17% Yes - Informal 208 47% No 139 31% Don't Know 20 5%
Project Management Career Path Connected to Roles in Upper Management
n= Percent Yes - Clearly defined/in writing 39 14% Yes - Informal 147 52% No 73 26% Don't Know 22 8%
Defined Set of Performance Skills for Project Managers within Organization
n= Percent Yes - Clearly defined/in writing 180 41% Yes - Informal 139 32% No 99 23% Don't Know 18 4%
Equities Offered in Past Year by Position Description
Stock Options Stock
(i.e., Shares) Neither n= Percent n= Percent n= Percent
Total 8 2% 23 5% 407 93% Director of Project Management Office (PMO) 1 4% 2 9% 20 87% Portfolio Manager 1 3% 2 6% 31 91% Program Manager 2 3% 3 4% 74 94% Project Manager III 3 2% 10 8% 120 90% Project Manager II 0 * 4 5% 83 95% Project Manager I 0 * 2 5% 35 95% Project Management Specialist 0 * 0 * 20 100% Project Management Consultant 1 4% 0 * 24 96%
Employee Benefits Offered by Position Description
Company
Car/Allowance Cell Phone Usage Paid Life Insurance
n= Percent n= Percent n= Percent Total 90 20% 284 65% 106 24% Director of Project Management Office (PMO) 6 25% 18 75% 5 21% Portfolio Manager 6 18% 24 71% 11 32% Program Manager 16 20% 50 63% 12 15% Project Manager III 28 21% 86 65% 39 29% Project Manager II 19 22% 60 69% 19 22% Project Manager I 6 16% 25 68% 10 27% Project Management Specialist 3 15% 9 45% 6 30% Project Management Consultant 6 24% 12 48% 4 16%

Project Management Salary Survey –Seventh Edition 153
New Zealand – All Respondents
Mean Number of Vacation Days by Position Description
After 1 Year After 10 Years n= Mean n= Mean
Total 435 17.2 395 18.2 Director of Project Management Office (PMO) 23 20.0 23 21.3 Portfolio Manager 34 18.3 31 19.0 Program Manager 79 17.3 68 17.0 Project Manager III 133 16.3 128 17.1 Project Manager II 86 16.9 79 18.8 Project Manager I 37 17.9 27 19.0 Project Management Specialist 19 20.5 18 23.4 Project Management Consultant 24 15.2 21 15.2
Pension Plans Offered by Position Description
Defined Benefit
Plans Defined Contribution
Plans Other Pension Plans n= Percent n= Percent n= Percent
Total 12 3% 189 43% 43 10% Director of Project Management Office (PMO) 1 4% 11 48% 1 4% Portfolio Manager 2 6% 13 38% 2 6% Program Manager 0 * 31 39% 8 10% Project Manager III 1 1% 56 41% 14 10% Project Manager II 6 7% 46 53% 11 13% Project Manager I 0 * 18 50% 4 11% Project Management Specialist 2 10% 8 40% 1 5% Project Management Consultant 0 * 6 24% 2 8%
Mean Hours Worked by Position Description
Hours Expected Actual Hours
Worked n= Mean n= Mean
Total 437 39.7 434 45.7 Director of Project Management Office (PMO) 24 39.9 24 48.9 Portfolio Manager 34 39.1 34 46.5 Program Manager 79 39.7 80 46.9 Project Manager III 132 39.5 130 45.4 Project Manager II 86 39.7 85 44.9 Project Manager I 37 39.9 36 43.8 Project Management Specialist 20 40.1 20 43.9 Project Management Consultant 25 40.0 25 45.7
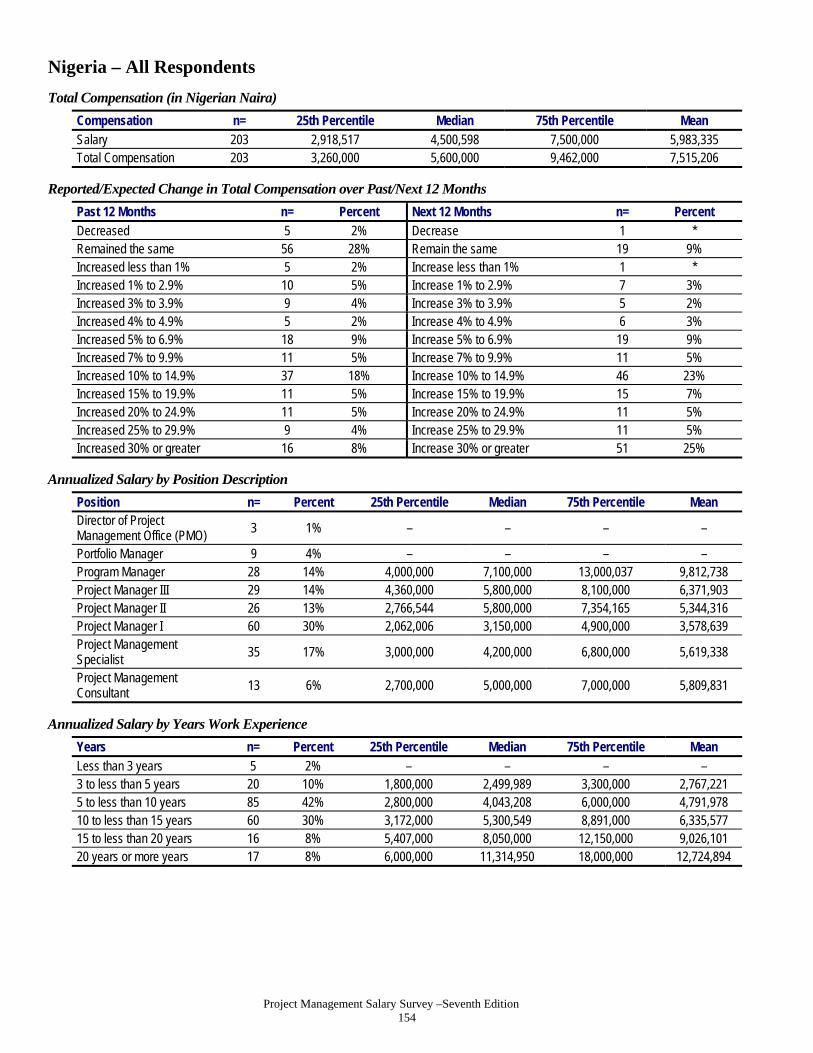
Project Management Salary Survey –Seventh Edition 154
Nigeria – All Respondents
Total Compensation (in Nigerian Naira)
Compensation n= 25th Percentile Median 75th Percentile Mean Salary 203 2,918,517 4,500,598 7,500,000 5,983,335 Total Compensation 203 3,260,000 5,600,000 9,462,000 7,515,206
Reported/Expected Change in Total Compensation over Past/Next 12 Months
Past 12 Months n= Percent Next 12 Months n= Percent Decreased 5 2% Decrease 1 * Remained the same 56 28% Remain the same 19 9% Increased less than 1% 5 2% Increase less than 1% 1 * Increased 1% to 2.9% 10 5% Increase 1% to 2.9% 7 3% Increased 3% to 3.9% 9 4% Increase 3% to 3.9% 5 2% Increased 4% to 4.9% 5 2% Increase 4% to 4.9% 6 3% Increased 5% to 6.9% 18 9% Increase 5% to 6.9% 19 9% Increased 7% to 9.9% 11 5% Increase 7% to 9.9% 11 5% Increased 10% to 14.9% 37 18% Increase 10% to 14.9% 46 23% Increased 15% to 19.9% 11 5% Increase 15% to 19.9% 15 7% Increased 20% to 24.9% 11 5% Increase 20% to 24.9% 11 5% Increased 25% to 29.9% 9 4% Increase 25% to 29.9% 11 5% Increased 30% or greater 16 8% Increase 30% or greater 51 25%
Annualized Salary by Position Description
Position n= Percent 25th Percentile Median 75th Percentile Mean Director of Project Management Office (PMO)
3 1% – – – –
Portfolio Manager 9 4% – – – – Program Manager 28 14% 4,000,000 7,100,000 13,000,037 9,812,738 Project Manager III 29 14% 4,360,000 5,800,000 8,100,000 6,371,903 Project Manager II 26 13% 2,766,544 5,800,000 7,354,165 5,344,316 Project Manager I 60 30% 2,062,006 3,150,000 4,900,000 3,578,639 Project Management Specialist
35 17% 3,000,000 4,200,000 6,800,000 5,619,338
Project Management Consultant
13 6% 2,700,000 5,000,000 7,000,000 5,809,831
Annualized Salary by Years Work Experience
Years n= Percent 25th Percentile Median 75th Percentile Mean
Less than 3 years 5 2% – – – – 3 to less than 5 years 20 10% 1,800,000 2,499,989 3,300,000 2,767,221 5 to less than 10 years 85 42% 2,800,000 4,043,208 6,000,000 4,791,978 10 to less than 15 years 60 30% 3,172,000 5,300,549 8,891,000 6,335,577 15 to less than 20 years 16 8% 5,407,000 8,050,000 12,150,000 9,026,101 20 years or more years 17 8% 6,000,000 11,314,950 18,000,000 12,724,894

Project Management Salary Survey –Seventh Edition 155
Nigeria – All Respondents
Annualized Salary by Technique Experience
Years n= Percent 25th Percentile Median 75th Percentile Mean Agile Project Management/Scrum
None 112 76% 3,000,000 5,000,000 7,900,000 6,014,611 1 to 5 years 32 22% 2,880,000 4,900,000 7,100,000 5,649,103 6 years or more 4 3% – – – –
Extreme Project Management None 90 59% 3,000,000 4,520,299 7,450,000 5,698,049 1 to 5 years 53 35% 2,940,000 5,000,000 7,200,000 5,937,634 6 years or more 9 6% – – – – Process Based Project Management
None 42 25% 2,450,072 3,669,036 6,000,000 4,910,761 1 to 5 years 102 61% 3,000,000 5,000,000 7,200,000 5,740,033 6 years or more 23 14% 3,336,000 7,200,000 15,000,000 9,387,651
Event Chain Project Management
None 89 56% 2,918,517 4,540,000 8,000,000 5,781,899 1 to 5 years 58 37% 2,800,000 4,303,000 7,200,000 5,608,672 6 years or more 11 7% 3,600,000 5,614,000 12,600,000 7,375,545 Interactive Project Management
None 43 27% 3,000,000 4,500,000 6,000,000 5,117,116 1 to 5 years 96 61% 2,780,000 4,303,000 7,200,000 5,276,497 6 years or more 18 11% 3,850,000 6,997,500 15,000,000 8,985,343
Incremental Project Management
None 77 50% 2,700,000 4,200,000 6,000,000 5,093,281 1 to 5 years 64 41% 3,000,000 5,300,549 7,900,000 6,157,779 6 years or more 14 9% 3,336,000 7,097,500 12,600,000 8,113,803 Project Portfolio Management
None 73 46% 2,800,000 4,200,000 7,200,000 5,054,463 1 to 5 years 70 44% 2,999,942 5,000,000 7,200,000 5,779,089 6 years or more 16 10% 6,311,000 11,450,000 17,000,014 11,374,223

Project Management Salary Survey –Seventh Edition 156
Nigeria – All Respondents
Annualized Salary by Technique Experience (Continued)
Years n= Percent 25th Percentile Median 75th Percentile Mean Program Management
None 58 35% 2,508,000 4,200,000 7,354,165 5,086,682 1 to 5 years 89 53% 3,000,000 5,201,097 8,064,000 6,277,303 6 years or more 20 12% 3,750,000 6,308,500 12,300,000 8,888,160
Earned Value Management None 58 35% 2,500,200 3,769,036 5,600,000 5,083,843 1 to 5 years 90 55% 3,000,000 5,400,000 7,450,000 5,851,584 6 years or more 16 10% 4,670,000 7,800,023 14,500,000 10,022,128 Lean Project Management
None 87 54% 2,766,544 4,500,598 7,200,000 5,365,165 1 to 5 years 62 39% 3,060,000 4,900,000 7,600,046 6,021,846 6 years or more 11 7% 3,600,000 7,500,000 18,000,000 9,304,545
Critical Chain Project Management
None 67 44% 3,000,000 4,500,000 6,800,000 5,323,378 1 to 5 years 71 47% 2,940,000 5,000,000 8,280,000 6,207,967 6 years or more 13 9% 5,614,000 7,200,000 11,314,950 8,326,612 Waterfall Project Management
None 105 70% 2,600,000 4,043,208 6,800,000 5,146,652 1 to 5 years 37 25% 4,200,000 5,800,000 7,200,000 6,527,246 6 years or more 8 5% – – – –
Risk Management
None 24 13% 2,425,036 3,192,000 4,750,000 3,750,187 1 to 5 years 128 72% 3,000,000 4,800,000 7,277,083 5,717,983 6 years or more 27 15% 5,000,000 8,200,000 14,205,763 10,111,455 Change Management
None 24 14% 1,811,600 3,192,000 5,750,000 3,689,982 1 to 5 years 119 68% 3,000,000 5,000,000 7,200,000 5,674,178 6 years or more 31 18% 4,406,000 8,491,200 14,205,763 9,982,398
Resource Management
None 17 10% 1,950,000 3,300,000 4,500,000 3,576,895 1 to 5 years 119 68% 2,800,000 4,800,000 7,200,000 5,559,080 6 years or more 38 22% 4,000,000 7,200,000 12,600,000 8,770,206
Annualized Salary by Years Worked in Project Management
Years n= Percent 25th Percentile Median 75th Percentile Mean Less than 3 years 20 10% 1,811,600 2,426,100 3,700,000 3,250,517 3 to less than 5 years 60 30% 2,604,000 3,550,000 5,400,000 4,427,172 5 to less than 10 years 94 46% 3,144,000 5,105,000 7,354,165 5,775,460 10 to less than 15 years 22 11% 6,000,000 8,345,600 15,000,000 10,440,810 15 to less than 20 years 4 2% – – – – 20 or more years 3 1% – – – –
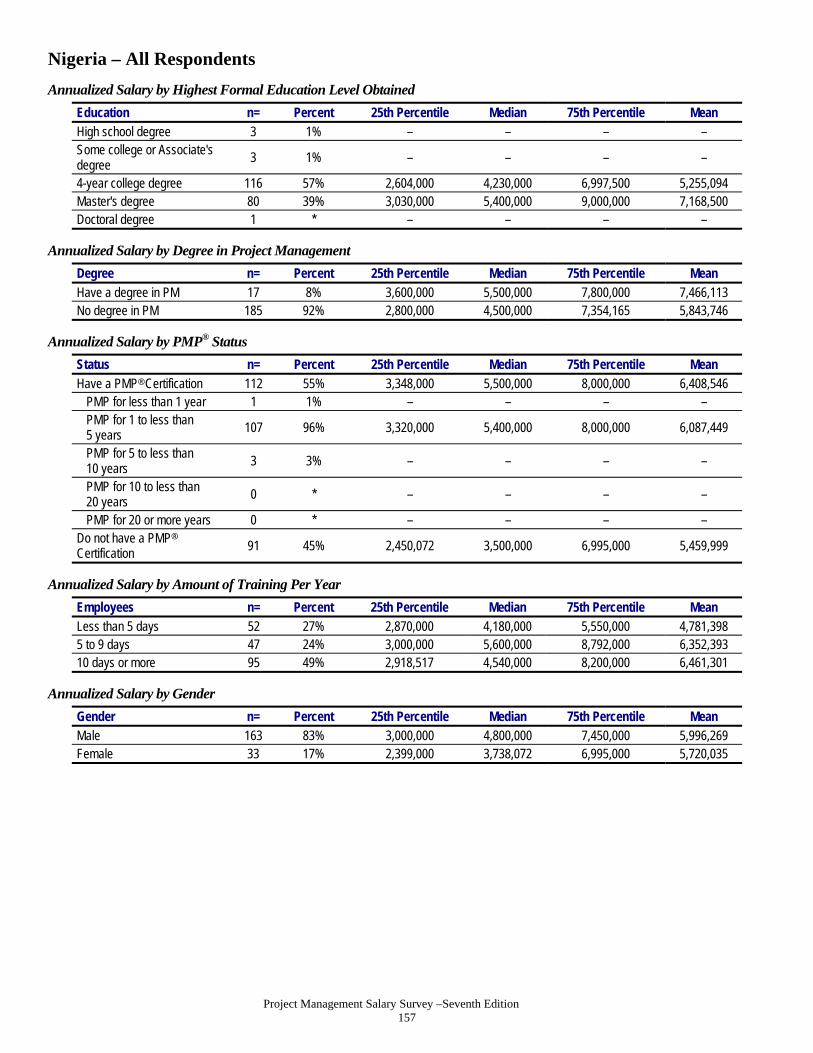
Project Management Salary Survey –Seventh Edition 157
Nigeria – All Respondents
Annualized Salary by Highest Formal Education Level Obtained
Education n= Percent 25th Percentile Median 75th Percentile Mean High school degree 3 1% – – – – Some college or Associate's degree
3 1% – – – –
4-year college degree 116 57% 2,604,000 4,230,000 6,997,500 5,255,094 Master's degree 80 39% 3,030,000 5,400,000 9,000,000 7,168,500 Doctoral degree 1 * – – – –
Annualized Salary by Degree in Project Management
Degree n= Percent 25th Percentile Median 75th Percentile Mean
Have a degree in PM 17 8% 3,600,000 5,500,000 7,800,000 7,466,113 No degree in PM 185 92% 2,800,000 4,500,000 7,354,165 5,843,746
Annualized Salary by PMP® Status
Status n= Percent 25th Percentile Median 75th Percentile Mean
Have a PMP® Certification 112 55% 3,348,000 5,500,000 8,000,000 6,408,546 PMP for less than 1 year 1 1% – – – – PMP for 1 to less than 5 years 107 96% 3,320,000 5,400,000 8,000,000 6,087,449
PMP for 5 to less than 10 years
3 3% – – – –
PMP for 10 to less than 20 years
0 * – – – –
PMP for 20 or more years 0 * – – – – Do not have a PMP® Certification 91 45% 2,450,072 3,500,000 6,995,000 5,459,999
Annualized Salary by Amount of Training Per Year
Employees n= Percent 25th Percentile Median 75th Percentile Mean Less than 5 days 52 27% 2,870,000 4,180,000 5,550,000 4,781,398 5 to 9 days 47 24% 3,000,000 5,600,000 8,792,000 6,352,393 10 days or more 95 49% 2,918,517 4,540,000 8,200,000 6,461,301
Annualized Salary by Gender
Gender n= Percent 25th Percentile Median 75th Percentile Mean Male 163 83% 3,000,000 4,800,000 7,450,000 5,996,269 Female 33 17% 2,399,000 3,738,072 6,995,000 5,720,035

Project Management Salary Survey –Seventh Edition 158
Nigeria – All Respondents
Annualized Salary by Department
Department n= Percent 25th Percentile Median 75th Percentile Mean Administration/ General Management
13 7% 4,200,000 6,400,000 12,600,000 9,275,985
Consulting 9 5% – – – – Customer Service/ Public Relations
7 4% – – – –
Engineering 32 16% 2,600,000 5,500,000 8,496,000 7,270,402 Finance 8 4% – – – – Human Resources 1 1% – – – – Information Technology/ Information Systems
28 14% 3,000,000 5,255,000 8,939,901 6,085,081
Operations/Manufacturing 9 5% – – – – Project Management Department or PMO
70 35% 3,000,000 4,900,000 7,450,000 5,789,572
Quality Management 4 2% – – – – Research and Development 4 2% – – – – Sales/Marketing 6 3% – – – – Supply Chain Management/Logistics 5 3% – – – –
Training/Education 1 1% – – – – Other 3 2% – – – –
Annualized Salary by Industry
Industry n= Percent 25th Percentile Median 75th Percentile Mean
Aerospace 5 2% – – – – Business Services 2 1% – – – – Construction 17 8% 2,499,977 3,600,000 7,354,165 5,515,177 Consulting 11 5% 2,999,942 5,000,000 6,000,000 5,061,267 Engineering 16 8% 2,820,000 5,211,000 8,745,600 6,698,678 Financial Services 34 17% 2,766,544 5,200,549 7,000,000 5,500,959 Food and Beverage 10 5% 2,500,000 4,525,000 8,879,802 5,474,306 Government 7 3% – – – – Healthcare 5 2% – – – – Information Technology 10 5% 2,940,000 3,400,000 4,200,000 3,654,200 Insurance 1 * – – – – Legal 0 * – – – – Manufacturing 8 4% – – – – Pharmaceuticals 1 * – – – – Real Estate 3 1% – – – – Resources (Agriculture, Mining, etc.)
26 13% 3,300,000 8,896,000 14,205,763 9,469,226
Telecommunications 40 20% 3,050,000 4,680,000 6,600,000 4,950,586 Training/Education 0 * – – – – Utility 2 1% – – – – Other 5 2% – – – –

Project Management Salary Survey –Seventh Edition 159
Nigeria – All Respondents
Annualized by Type of Project
Project Type n= Percent 25th Percentile Median 75th Percentile Mean Business Transformation 43 22% 2,918,517 5,400,000 9,000,000 6,400,980 Construction 55 28% 3,000,000 5,600,000 9,000,000 6,943,251 Engineering 66 33% 2,800,000 4,800,000 8,200,000 6,473,497 Information Technology 64 32% 3,000,000 5,105,000 7,200,000 6,110,289 Manufacturing 8 4% – – – – Operations 53 27% 2,800,000 4,260,000 7,200,000 5,594,036 Quality Management 29 15% 2,800,000 4,500,000 6,000,000 4,908,401 Regulatory Compliance 13 7% 4,500,000 6,995,000 9,000,000 7,253,552 Research and Development 8 4% – – – – Supply Chain Management/Logistics 15 8% 3,060,000 4,540,000 6,699,927 5,483,599
Other 17 9% 2,918,517 6,000,000 8,100,000 7,774,147
Annualized Salary by Number of Employees in Entire Organization
Employees n= Percent 25th Percentile Median 75th Percentile Mean Less than 100 39 19% 2,400,000 3,144,000 4,540,000 4,880,131 100 to 299 25 12% 3,100,000 4,800,000 6,000,000 5,284,708 300 to 999 37 18% 2,800,000 4,000,000 6,080,000 5,233,379 1,000 to 2,499 32 16% 3,485,000 6,000,000 8,995,000 7,040,691 2,500 to 4,999 30 15% 3,000,000 5,300,549 8,200,000 7,503,239 5,000 to 9,999 20 10% 2,174,500 4,303,000 6,847,464 4,624,920 10,000 or more 20 10% 5,505,000 7,427,083 10,000,000 7,782,076
Annualized Salary by Average Project Team Size
Employees n= Percent 25th Percentile Median 75th Percentile Mean
1-4 people 18 12% 3,200,000 5,750,000 8,990,000 5,800,389 5-9 people 45 30% 2,508,000 4,500,000 8,100,000 5,986,026 10-14 people 34 23% 3,360,000 4,900,000 6,900,004 6,467,872 15-19 people 13 9% 2,400,000 4,500,000 7,200,000 4,696,190 20 or more people 38 26% 3,600,000 5,900,000 8,491,200 7,044,342
Annualized Salary by Average Project Budget (in USD)
Employees n= Percent 25th Percentile Median 75th Percentile Mean
Less than $100,000 20 12% 2,376,000 3,340,000 5,950,000 4,668,969 $100,000 to $499,999 50 29% 3,500,000 5,100,549 8,000,000 6,172,618 $500,000 to $999,999 21 12% 3,000,000 4,500,000 6,900,004 4,778,810 $1 million to $10 million 54 32% 3,000,000 5,350,000 8,000,000 6,312,414 More than $10 million 25 15% 4,200,000 7,200,000 10,000,000 8,820,227

Project Management Salary Survey –Seventh Edition 160
Nigeria – All Respondents
Project Management Career Path within Organization
n= Percent Yes - Clearly defined/in writing 46 23% Yes - Informal 101 51% No 41 21% Don't Know 12 6%
Project Management Career Path Connected to Roles in Upper Management
n= Percent Yes - Clearly defined/in writing 41 28% Yes - Informal 75 52% No 22 15% Don't Know 6 4%
Defined Set of Performance Skills for Project Managers within Organization
n= Percent Yes - Clearly defined/in writing 83 43% Yes - Informal 69 36% No 35 18% Don't Know 7 4%
Equities Offered in Past Year by Position Description
Stock Options Stock
(i.e., Shares) Neither n= Percent n= Percent n= Percent
Total 4 2% 13 7% 179 92% Director of Project Management Office (PMO) 0 * 1 33% 2 67% Portfolio Manager 1 11% 0 * 8 89% Program Manager 1 4% 2 8% 24 92% Project Manager III 0 * 3 10% 26 90% Project Manager II 1 4% 0 * 25 96% Project Manager I 0 * 4 7% 53 93% Project Management Specialist 0 * 2 6% 30 94% Project Management Consultant 1 8% 1 8% 11 85%
Employee Benefits Offered by Position Description
Company
Car/Allowance Cell Phone
Usage Paid Life Insurance
n= Percent n= Percent n= Percent Total 120 61% 119 60% 51 26% Director of Project Management Office (PMO) 3 100% 2 67% 2 67% Portfolio Manager 7 78% 6 67% 2 22% Program Manager 20 80% 19 76% 5 20% Project Manager III 19 66% 22 76% 5 17% Project Manager II 19 73% 17 65% 8 31% Project Manager I 28 48% 27 47% 13 22% Project Management Specialist 15 43% 22 63% 15 43% Project Management Consultant 9 69% 4 31% 1 8%

Project Management Salary Survey –Seventh Edition 161
Nigeria – All Respondents
Mean Number of Vacation Days by Position Description
After 1 Year After 10 Years n= Mean n= Mean
Total 181 21.8 87 22.4 Director of Project Management Office (PMO) 3 25.0 3 26.3 Portfolio Manager 9 20.6 5 25.8 Program Manager 24 23.8 15 25.9 Project Manager III 28 22.8 16 26.1 Project Manager II 23 19.3 14 14.9 Project Manager I 49 21.3 13 17.9 Project Management Specialist 32 22.2 13 20.4 Project Management Consultant 13 21.0 8 28.6
Pension Plans Offered by Position Description
Defined Benefit
Plans
Defined Contribution
Plans Other Pension
Plans n= Percent n= Percent n= Percent
Total 38 20% 151 78% 14 7% Director of Project Management Office (PMO) 1 33% 2 67% 0 * Portfolio Manager 0 * 6 67% 0 * Program Manager 5 20% 18 72% 1 4% Project Manager III 9 31% 26 90% 0 * Project Manager II 6 23% 17 65% 3 12% Project Manager I 9 16% 47 85% 2 4% Project Management Specialist 7 21% 24 71% 8 24% Project Management Consultant 1 8% 11 85% 0 *
Mean Hours Worked by Position Description
Hours Expected Actual Hours
Worked n= Mean n= Mean
Total 162 41.2 160 49.8 Director of Project Management Office (PMO) 3 40.0 3 50.0 Portfolio Manager 8 40.0 9 57.4 Program Manager 23 41.1 22 51.8 Project Manager III 24 40.6 24 50.2 Project Manager II 19 41.3 19 48.8 Project Manager I 45 42.1 43 49.2 Project Management Specialist 28 41.3 28 49.8 Project Management Consultant 12 39.7 12 43.7

Project Management Salary Survey –Seventh Edition 162
Peru – All Respondents
Total Compensation (in Peruvian Nuevo Sol)
Compensation n= 25th Percentile Median 75th Percentile Mean Salary 244 68,000 96,000 135,751 107,990 Total Compensation 244 76,250 108,000 157,142 123,703
Reported/Expected Change in Total Compensation over Past/Next 12 Months
Past 12 Months n= Percent Next 12 Months n= Percent Decreased 1 * Decrease 1 * Remained the same 69 28% Remain the same 47 19% Increased less than 1% 5 2% Increase less than 1% 1 * Increased 1% to 2.9% 17 7% Increase 1% to 2.9% 11 5% Increased 3% to 3.9% 9 4% Increase 3% to 3.9% 3 1% Increased 4% to 4.9% 12 5% Increase 4% to 4.9% 11 5% Increased 5% to 6.9% 24 10% Increase 5% to 6.9% 21 9% Increased 7% to 9.9% 17 7% Increase 7% to 9.9% 15 6% Increased 10% to 14.9% 26 11% Increase 10% to 14.9% 59 24% Increased 15% to 19.9% 13 5% Increase 15% to 19.9% 18 7% Increased 20% to 24.9% 15 6% Increase 20% to 24.9% 23 9% Increased 25% to 29.9% 11 5% Increase 25% to 29.9% 10 4% Increased 30% or greater 25 10% Increase 30% or greater 24 10%
Annualized Salary by Position Description
Position n= Percent 25th Percentile Median 75th Percentile Mean Director of Project Management Office (PMO)
7 3% – – – –
Portfolio Manager 17 7% 116,200 150,000 210,000 165,232 Program Manager 31 13% 112,000 134,999 196,000 151,019 Project Manager III 39 16% 82,500 120,000 140,000 119,015 Project Manager II 44 18% 67,000 87,000 141,100 102,028 Project Manager I 52 21% 47,800 60,000 90,500 68,092 Project Management Specialist
31 13% 74,400 96,000 134,999 105,175
Project Management Consultant
23 9% 63,000 84,000 100,000 81,914
Annualized Salary by Years Work Experience
Years n= Percent 25th Percentile Median 75th Percentile Mean
Less than 3 years 3 1% – – – – 3 to less than 5 years 14 6% 45,000 49,200 70,000 57,657 5 to less than 10 years 74 30% 70,000 84,000 111,500 90,912 10 to less than 15 years 67 27% 72,000 102,900 135,000 110,365 15 to less than 20 years 40 16% 61,500 108,501 159,750 116,027 20 years or more years 46 19% 98,000 136,750 165,000 144,924

Project Management Salary Survey –Seventh Edition 163
Peru – All Respondents
Annualized Salary by Technique Experience
Years n= Percent 25th Percentile Median 75th Percentile Mean Agile Project Management/Scrum
None 137 64% 63,000 89,999 128,000 103,095 1 to 5 years 72 33% 63,500 99,999 146,500 111,865 6 years or more 6 3% – – – –
Extreme Project Management None 146 68% 60,000 90,000 135,000 105,414 1 to 5 years 59 27% 70,000 96,000 126,000 105,133 6 years or more 11 5% 82,500 107,400 159,000 135,907
Process Based Project Management
None 46 21% 63,000 91,601 140,000 111,245 1 to 5 years 135 61% 63,000 86,400 126,000 99,685 6 years or more 41 18% 94,000 127,500 168,000 135,296
Event Chain Project Management None 119 56% 70,000 98,000 142,000 114,935 1 to 5 years 77 36% 60,000 84,000 126,000 94,918 6 years or more 15 7% 82,500 107,400 140,000 112,927
Interactive Project Management
None 103 48% 63,000 90,000 135,000 108,409 1 to 5 years 83 39% 63,000 91,600 126,000 99,948 6 years or more 28 13% 79,050 117,000 164,000 126,471
Incremental Project Management None 114 53% 60,000 91,401 142,000 109,655 1 to 5 years 81 38% 64,400 84,000 112,001 99,589 6 years or more 20 9% 88,250 126,401 167,000 131,835 Project Portfolio Management
None 109 51% 60,000 84,000 120,000 93,456 1 to 5 years 84 39% 74,100 112,001 150,550 118,660 6 years or more 22 10% 107,400 137,750 220,000 152,533

Project Management Salary Survey –Seventh Edition 164
Peru – All Respondents
Annualized Salary by Technique Experience (Continued)
Years n= Percent 25th Percentile Median 75th Percentile Mean Program Management
None 82 37% 60,000 84,000 127,500 94,449 1 to 5 years 112 50% 71,850 99,250 127,000 107,879 6 years or more 30 13% 107,400 143,500 220,000 156,216
Earned Value Management
None 47 21% 56,000 75,000 126,000 93,754 1 to 5 years 143 64% 64,000 91,201 134,999 104,759 6 years or more 35 16% 96,001 133,000 180,000 144,038 Lean Project Management
None 115 52% 60,000 84,000 129,000 101,368 1 to 5 years 91 41% 74,200 102,900 146,000 113,740 6 years or more 16 7% 73,250 126,700 153,000 124,373
Critical Chain Project Management
None 76 35% 70,000 94,000 135,050 112,196 1 to 5 years 107 49% 60,000 91,000 140,000 103,053 6 years or more 35 16% 85,500 110,400 145,200 123,347 Waterfall Project Management
None 133 64% 64,000 98,000 140,000 112,130 1 to 5 years 61 29% 61,600 84,000 112,000 96,126 6 years or more 14 7% 75,600 106,200 147,000 114,779
Risk Management None 38 17% 55,500 81,750 128,000 94,296 1 to 5 years 136 60% 63,000 86,700 123,357 96,979 6 years or more 53 23% 102,900 134,999 187,500 145,705 Change Management
None 38 17% 55,500 81,750 119,000 92,188 1 to 5 years 129 58% 63,000 87,000 126,000 98,089 6 years or more 55 25% 98,000 132,800 187,500 144,944
Resource Management
None 29 13% 60,000 84,000 119,000 88,650 1 to 5 years 129 58% 59,999 84,000 122,800 92,555 6 years or more 63 29% 102,900 140,000 190,000 148,958
Annualized Salary by Years Worked in Project Management
Years n= Percent 25th Percentile Median 75th Percentile Mean
Less than 3 years 17 7% 47,400 55,500 64,400 64,612 3 to less than 5 years 63 26% 61,600 79,500 98,500 83,198 5 to less than 10 years 90 37% 75,000 99,000 140,000 110,531 10 to less than 15 years 47 19% 71,700 124,000 165,000 123,497 15 to less than 20 years 23 9% 119,000 140,000 225,000 164,941 20 or more years 4 2% – – – –

Project Management Salary Survey –Seventh Edition 165
Peru – All Respondents
Annualized Salary by Highest Formal Education Level Obtained
Education n= Percent 25th Percentile Median 75th Percentile Mean High school degree 12 5% 57,250 72,500 93,000 83,750 Some college or Associate's degree
12 5% 59,500 72,950 111,450 84,100
4-year college degree 86 35% 56,000 83,250 120,000 93,822 Master's degree 124 51% 82,600 120,000 148,500 124,228 Doctoral degree 10 4% 30,000 102,950 120,000 86,250
Annualized Salary by Degree in Project Management
Degree n= Percent 25th Percentile Median 75th Percentile Mean
Have a degree in PM 120 49% 66,500 95,000 135,000 104,807 No degree in PM 124 51% 68,000 96,000 140,000 111,071
Annualized Salary by PMP® Status
Status n= Percent 25th Percentile Median 75th Percentile Mean
Have a PMP® Certification 157 64% 77,499 105,000 140,700 115,349 PMP for less than 1 year 8 5% – – – – PMP for 1 to less than 5 years 123 79% 77,499 102,900 140,000 111,917
PMP for 5 to less than 10 years
25 16% 99,999 138,000 196,000 147,055
PMP for 10 to less than 20 years
0 * – – – –
PMP for 20 or more years 0 * – – – – Do not have a PMP®
Certification 87 36% 53,000 75,000 123,914 94,710
Annualized Salary by Amount of Training Per Year
Employees n= Percent 25th Percentile Median 75th Percentile Mean Less than 5 days 44 18% 68,500 96,000 126,700 103,512 5 to 9 days 46 19% 70,000 103,950 158,970 120,321 10 days or more 150 63% 66,000 95,000 140,000 106,188
Annualized Salary by Gender
Gender n= Percent 25th Percentile Median 75th Percentile Mean Male 203 84% 70,000 96,001 138,000 110,582 Female 40 16% 60,800 90,000 131,500 96,410

Project Management Salary Survey –Seventh Edition 166
Peru – All Respondents
Annualized Salary by Department
Department n= Percent 25th Percentile Median 75th Percentile Mean Administration/ General Management
27 11% 74,400 120,000 135,000 114,678
Consulting 20 8% 66,563 99,451 138,801 110,262 Customer Service/ Public Relations
1 * – – – –
Engineering 24 10% 72,000 84,000 123,000 99,274 Finance 4 2% – – – – Human Resources 0 * – – – – Information Technology/ Information Systems
71 29% 63,000 91,600 140,000 104,576
Operations/Manufacturing 9 4% – – – – Project Management Department or PMO
61 25% 70,000 93,700 136,001 110,413
Quality Management 6 2% – – – – Research and Development 1 * – – – – Sales/Marketing 3 1% – – – – Supply Chain Management/Logistics 5 2% – – – –
Training/Education 0 * – – – – Other 12 5% 72,074 84,450 173,356 118,565
Annualized Salary by Industry
Industry n= Percent 25th Percentile Median 75th Percentile Mean
Aerospace 1 * – – – – Business Services 3 1% – – – – Construction 35 14% 80,000 98,500 145,200 115,295 Consulting 24 10% 52,500 93,500 123,751 98,340 Engineering 16 7% 45,301 74,700 92,850 85,494 Financial Services 29 12% 64,400 98,000 140,000 109,565 Food and Beverage 3 1% – – – – Government 12 5% 93,000 115,501 128,400 115,572 Healthcare 2 1% – – – – Information Technology 50 20% 58,800 81,250 120,000 97,856 Insurance 1 * – – – – Legal 0 * – – – – Manufacturing 6 2% – – – – Pharmaceuticals 0 * – – – – Real Estate 0 * – – – – Resources (Agriculture, Mining, etc.)
22 9% 111,500 130,500 165,000 132,595
Telecommunications 26 11% 75,880 95,600 136,001 107,778 Training/Education 4 2% – – – – Utility 5 2% – – – – Other 5 2% – – – –
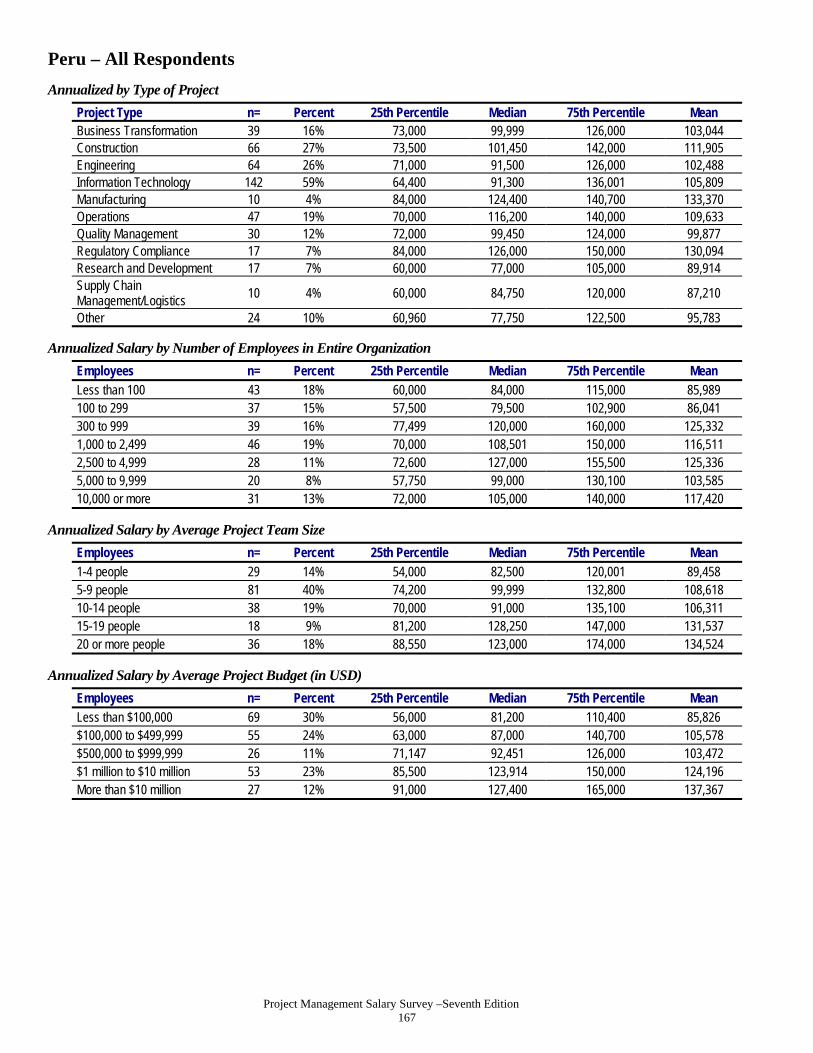
Project Management Salary Survey –Seventh Edition 167
Peru – All Respondents
Annualized by Type of Project
Project Type n= Percent 25th Percentile Median 75th Percentile Mean Business Transformation 39 16% 73,000 99,999 126,000 103,044 Construction 66 27% 73,500 101,450 142,000 111,905 Engineering 64 26% 71,000 91,500 126,000 102,488 Information Technology 142 59% 64,400 91,300 136,001 105,809 Manufacturing 10 4% 84,000 124,400 140,700 133,370 Operations 47 19% 70,000 116,200 140,000 109,633 Quality Management 30 12% 72,000 99,450 124,000 99,877 Regulatory Compliance 17 7% 84,000 126,000 150,000 130,094 Research and Development 17 7% 60,000 77,000 105,000 89,914 Supply Chain Management/Logistics
10 4% 60,000 84,750 120,000 87,210
Other 24 10% 60,960 77,750 122,500 95,783
Annualized Salary by Number of Employees in Entire Organization
Employees n= Percent 25th Percentile Median 75th Percentile Mean Less than 100 43 18% 60,000 84,000 115,000 85,989 100 to 299 37 15% 57,500 79,500 102,900 86,041 300 to 999 39 16% 77,499 120,000 160,000 125,332 1,000 to 2,499 46 19% 70,000 108,501 150,000 116,511 2,500 to 4,999 28 11% 72,600 127,000 155,500 125,336 5,000 to 9,999 20 8% 57,750 99,000 130,100 103,585 10,000 or more 31 13% 72,000 105,000 140,000 117,420
Annualized Salary by Average Project Team Size
Employees n= Percent 25th Percentile Median 75th Percentile Mean
1-4 people 29 14% 54,000 82,500 120,001 89,458 5-9 people 81 40% 74,200 99,999 132,800 108,618 10-14 people 38 19% 70,000 91,000 135,100 106,311 15-19 people 18 9% 81,200 128,250 147,000 131,537 20 or more people 36 18% 88,550 123,000 174,000 134,524
Annualized Salary by Average Project Budget (in USD)
Employees n= Percent 25th Percentile Median 75th Percentile Mean
Less than $100,000 69 30% 56,000 81,200 110,400 85,826 $100,000 to $499,999 55 24% 63,000 87,000 140,700 105,578 $500,000 to $999,999 26 11% 71,147 92,451 126,000 103,472 $1 million to $10 million 53 23% 85,500 123,914 150,000 124,196 More than $10 million 27 12% 91,000 127,400 165,000 137,367

Project Management Salary Survey –Seventh Edition 168
Peru – All Respondents
Project Management Career Path within Organization
n= Percent Yes - Clearly defined/in writing 69 28% Yes - Informal 113 47% No 53 22% Don't Know 8 3%
Project Management Career Path Connected to Roles in Upper Management
n= Percent Yes - Clearly defined/in writing 55 31% Yes - Informal 101 57% No 12 7% Don't Know 9 5%
Defined Set of Performance Skills for Project Managers within Organization
n= Percent Yes - Clearly defined/in writing 86 36% Yes - Informal 99 42% No 46 19% Don't Know 7 3%
Equities Offered in Past Year by Position Description
Stock Options Stock
(i.e., Shares) Neither n= Percent n= Percent n= Percent
Total 19 8% 13 5% 208 87% Director of Project Management Office (PMO) 0 * 0 * 5 100% Portfolio Manager 2 13% 1 6% 13 81% Program Manager 4 13% 2 6% 25 81% Project Manager III 2 5% 1 3% 35 92% Project Manager II 3 7% 1 2% 39 91% Project Manager I 4 8% 5 10% 44 85% Project Management Specialist 2 6% 3 10% 26 84% Project Management Consultant 2 9% 0 * 21 91%
Employee Benefits Offered by Position Description
Company
Car/Allowance Cell Phone Usage Paid Life Insurance
n= Percent n= Percent n= Percent Total 42 17% 171 71% 96 40% Director of Project Management Office (PMO) 2 29% 7 100% 1 14% Portfolio Manager 4 24% 13 76% 4 24% Program Manager 5 16% 24 77% 13 42% Project Manager III 8 21% 30 79% 13 34% Project Manager II 7 16% 33 77% 26 60% Project Manager I 9 17% 33 63% 18 35% Project Management Specialist 6 19% 22 71% 13 42% Project Management Consultant 1 4% 9 39% 8 35%

Project Management Salary Survey –Seventh Edition 169
Peru – All Respondents
Mean Number of Vacation Days by Position Description
After 1 Year After 10 Years n= Mean n= Mean
Total 241 27.4 160 26.1 Director of Project Management Office (PMO) 7 30.0 6 30.0 Portfolio Manager 17 27.3 11 25.1 Program Manager 31 27.1 25 22.2 Project Manager III 38 28.0 29 25.6 Project Manager II 42 26.6 30 25.4 Project Manager I 52 26.1 28 26.2 Project Management Specialist 31 29.0 16 29.1 Project Management Consultant 23 28.9 15 30.5
Pension Plans Offered by Position Description
Defined Benefit
Plans
Defined Contribution
Plans Other Pension
Plans n= Percent n= Percent n= Percent
Total 96 40% 113 47% 22 9% Director of Project Management Office (PMO) 4 57% 2 29% 1 14% Portfolio Manager 5 29% 12 71% 0 * Program Manager 11 35% 14 45% 4 13% Project Manager III 11 30% 18 49% 4 11% Project Manager II 24 56% 16 37% 4 9% Project Manager I 24 46% 22 42% 5 10% Project Management Specialist 12 39% 16 52% 3 10% Project Management Consultant 5 22% 13 57% 1 4%
Mean Hours Worked by Position Description
Hours Expected Actual Hours
Worked n= Mean n= Mean
Total 222 43.5 217 49.3 Director of Project Management Office (PMO) 7 44.1 6 51.3 Portfolio Manager 17 43.1 17 51.3 Program Manager 29 43.4 29 50.9 Project Manager III 36 42.7 36 48.1 Project Manager II 43 43.2 43 47.8 Project Manager I 41 43.9 40 50.2 Project Management Specialist 27 45.3 28 50.5 Project Management Consultant 22 42.5 18 46.6
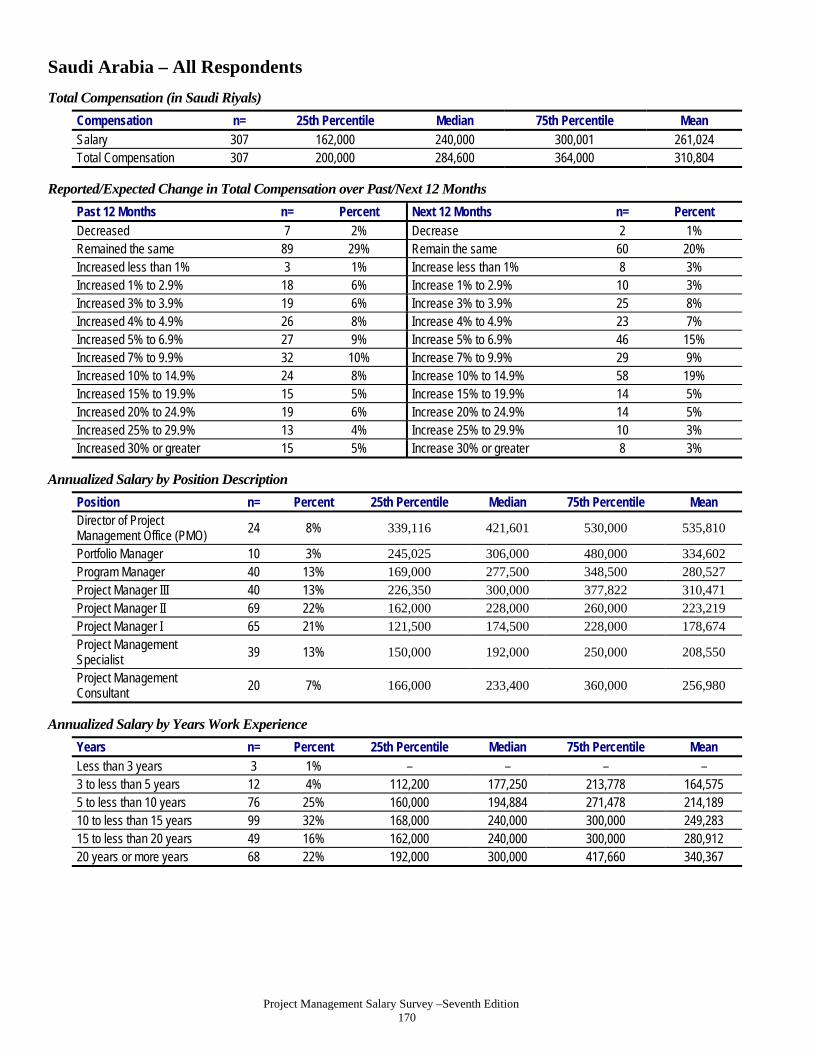
Project Management Salary Survey –Seventh Edition 170
Saudi Arabia – All Respondents
Total Compensation (in Saudi Riyals)
Compensation n= 25th Percentile Median 75th Percentile Mean Salary 307 162,000 240,000 300,001 261,024 Total Compensation 307 200,000 284,600 364,000 310,804
Reported/Expected Change in Total Compensation over Past/Next 12 Months
Past 12 Months n= Percent Next 12 Months n= Percent Decreased 7 2% Decrease 2 1% Remained the same 89 29% Remain the same 60 20% Increased less than 1% 3 1% Increase less than 1% 8 3% Increased 1% to 2.9% 18 6% Increase 1% to 2.9% 10 3% Increased 3% to 3.9% 19 6% Increase 3% to 3.9% 25 8% Increased 4% to 4.9% 26 8% Increase 4% to 4.9% 23 7% Increased 5% to 6.9% 27 9% Increase 5% to 6.9% 46 15% Increased 7% to 9.9% 32 10% Increase 7% to 9.9% 29 9% Increased 10% to 14.9% 24 8% Increase 10% to 14.9% 58 19% Increased 15% to 19.9% 15 5% Increase 15% to 19.9% 14 5% Increased 20% to 24.9% 19 6% Increase 20% to 24.9% 14 5% Increased 25% to 29.9% 13 4% Increase 25% to 29.9% 10 3% Increased 30% or greater 15 5% Increase 30% or greater 8 3%
Annualized Salary by Position Description
Position n= Percent 25th Percentile Median 75th Percentile Mean Director of Project Management Office (PMO)
24 8% 339,116 421,601 530,000 535,810
Portfolio Manager 10 3% 245,025 306,000 480,000 334,602 Program Manager 40 13% 169,000 277,500 348,500 280,527 Project Manager III 40 13% 226,350 300,000 377,822 310,471 Project Manager II 69 22% 162,000 228,000 260,000 223,219 Project Manager I 65 21% 121,500 174,500 228,000 178,674 Project Management Specialist
39 13% 150,000 192,000 250,000 208,550
Project Management Consultant
20 7% 166,000 233,400 360,000 256,980
Annualized Salary by Years Work Experience
Years n= Percent 25th Percentile Median 75th Percentile Mean
Less than 3 years 3 1% – – – – 3 to less than 5 years 12 4% 112,200 177,250 213,778 164,575 5 to less than 10 years 76 25% 160,000 194,884 271,478 214,189 10 to less than 15 years 99 32% 168,000 240,000 300,000 249,283 15 to less than 20 years 49 16% 162,000 240,000 300,000 280,912 20 years or more years 68 22% 192,000 300,000 417,660 340,367

Project Management Salary Survey –Seventh Edition 171
Saudi Arabia – All Respondents
Annualized Salary by Technique Experience
Years n= Percent 25th Percentile Median 75th Percentile Mean Agile Project Management/Scrum
None 170 68% 160,000 228,000 300,000 255,763 1 to 5 years 64 25% 180,000 240,000 300,000 265,804 6 years or more 17 7% 220,000 252,240 400,000 302,355
Extreme Project Management None 137 54% 159,000 228,024 300,000 253,087 1 to 5 years 80 31% 176,001 240,000 300,000 252,591 6 years or more 37 15% 200,000 360,000 450,000 360,635 Process Based Project Management
None 76 29% 153,100 210,165 296,572 241,156 1 to 5 years 122 46% 172,001 240,000 301,999 260,107 6 years or more 67 25% 192,000 271,200 385,643 306,205
Event Chain Project Management None 163 66% 160,000 228,024 300,000 257,684 1 to 5 years 65 26% 190,800 240,000 300,000 267,357 6 years or more 19 8% 150,000 289,000 411,000 303,975
Interactive Project Management
None 95 37% 162,000 234,000 300,000 256,603 1 to 5 years 112 44% 160,000 235,000 300,000 251,506 6 years or more 48 19% 199,000 286,180 414,000 333,656
Incremental Project Management None 131 54% 158,520 220,000 300,000 233,570 1 to 5 years 80 33% 169,501 240,000 300,000 267,783 6 years or more 32 13% 206,000 300,000 405,500 320,141 Project Portfolio Management
None 128 50% 160,000 221,390 300,000 233,939 1 to 5 years 90 35% 180,000 244,200 300,000 292,932 6 years or more 39 15% 162,000 300,000 420,000 309,157

Project Management Salary Survey –Seventh Edition 172
Saudi Arabia – All Respondents
Annualized Salary by Technique Experience (Continued)
Years n= Percent 25th Percentile Median 75th Percentile Mean Program Management
None 100 38% 160,000 218,966 290,780 228,886 1 to 5 years 106 40% 180,000 240,000 324,000 260,773 6 years or more 56 21% 175,800 286,180 406,500 336,854
Earned Value Management
None 76 29% 161,000 234,012 300,000 230,631 1 to 5 years 141 54% 162,000 240,000 300,000 264,114 6 years or more 46 17% 180,000 245,000 385,643 320,581 Lean Project Management
None 129 52% 157,200 228,000 300,000 234,234 1 to 5 years 86 35% 180,000 245,000 301,999 291,198 6 years or more 34 14% 192,000 274,500 385,643 320,537
Critical Chain Project Management
None 124 48% 161,000 235,000 300,000 245,404 1 to 5 years 96 38% 162,000 240,000 305,031 267,505 6 years or more 36 14% 186,000 240,000 383,001 336,687
Waterfall Project Management None 167 67% 162,000 230,000 312,000 262,978 1 to 5 years 57 23% 172,001 240,000 300,000 270,086 6 years or more 24 10% 202,165 247,380 378,000 288,060 Risk Management
None 51 19% 144,000 217,932 300,000 232,239 1 to 5 years 160 59% 167,000 228,000 300,000 252,006 6 years or more 59 22% 170,000 250,000 400,000 308,485
Change Management None 53 20% 160,000 240,000 312,000 253,228 1 to 5 years 141 53% 162,000 240,000 300,000 261,397 6 years or more 71 27% 192,000 250,000 353,000 292,503 Resource Management
None 38 14% 162,000 222,978 300,000 242,425 1 to 5 years 143 52% 160,000 228,000 300,000 241,917 6 years or more 92 34% 192,000 268,932 396,000 315,486
Annualized Salary by Years Worked in Project Management
Years n= Percent 25th Percentile Median 75th Percentile Mean Less than 3 years 17 6% 104,400 120,000 180,000 140,859 3 to less than 5 years 57 19% 158,520 190,000 245,025 200,511 5 to less than 10 years 143 47% 180,000 240,000 300,001 254,339 10 to less than 15 years 53 17% 216,000 272,000 400,000 320,910 15 to less than 20 years 21 7% 250,000 325,000 415,320 379,491 20 or more years 16 5% 159,500 220,000 402,822 310,165

Project Management Salary Survey –Seventh Edition 173
Saudi Arabia – All Respondents
Annualized Salary by Highest Formal Education Level Obtained
Education n= Percent 25th Percentile Median 75th Percentile Mean High school degree 2 1% – – – – Some college or Associate's degree
6 2% – – – –
4-year college degree 201 65% 162,000 227,556 300,000 251,588 Master's degree 92 30% 174,000 250,000 360,000 284,790 Doctoral degree 6 2% – – – –
Annualized Salary by Degree in Project Management
Degree n= Percent 25th Percentile Median 75th Percentile Mean
Have a degree in PM 56 18% 164,500 228,012 312,500 247,907 No degree in PM 249 82% 162,000 240,000 300,000 264,545
Annualized Salary by PMP® Status
Status n= Percent 25th Percentile Median 75th Percentile Mean
Have a PMP® Certification 185 60% 174,500 240,000 324,000 262,754 PMP for less than 1 year 13 7% 120,000 180,000 240,000 173,051 PMP for 1 to less than 5 years 146 79% 174,500 240,000 300,001 253,174
PMP for 5 to less than 10 years
23 13% 250,000 380,000 422,400 393,110
PMP for 10 to less than 20 years
2 1% – – – –
PMP for 20 or more years 0 * – – – – Do not have a PMP® Certification 122 40% 160,000 214,466 300,000 258,400
Annualized Salary by Amount of Training Per Year
Employees n= Percent 25th Percentile Median 75th Percentile Mean Less than 5 days 112 37% 158,760 240,000 324,500 257,410 5 to 9 days 65 22% 172,001 226,800 301,999 263,595 10 days or more 125 41% 180,000 240,000 300,000 265,374
Annualized Salary by Gender
Gender n= Percent 25th Percentile Median 75th Percentile Mean Male 293 99% 162,000 234,000 300,001 261,099 Female 3 1% – – – –

Project Management Salary Survey –Seventh Edition 174
Saudi Arabia – All Respondents
Annualized Salary by Department
Department n= Percent 25th Percentile Median 75th Percentile Mean Administration/ General Management
26 9% 192,000 300,000 450,000 343,792
Consulting 18 6% 199,500 268,800 350,000 285,637 Customer Service/ Public Relations
2 1% – – – –
Engineering 35 12% 168,000 192,000 300,000 229,577 Finance 2 1% – – – – Human Resources 0 * – – – – Information Technology/ Information Systems
47 15% 190,000 220,500 288,000 229,653
Operations/Manufacturing 12 4% 86,750 167,001 228,013 168,846 Project Management Department or PMO
144 47% 159,000 228,012 300,000 265,021
Quality Management 4 1% – – – – Research and Development 2 1% – – – – Sales/Marketing 4 1% – – – – Supply Chain Management/Logistics 1 * – – – –
Training/Education 1 * – – – – Other 6 2% – – – –
Annualized Salary by Industry
Industry n= Percent 25th Percentile Median 75th Percentile Mean
Aerospace 2 1% – – – – Business Services 2 1% – – – – Construction 68 22% 154,260 192,000 318,000 257,861 Consulting 20 7% 166,000 261,300 330,000 275,423 Engineering 26 8% 160,000 214,000 324,000 239,357 Financial Services 16 5% 194,000 234,000 294,000 334,250 Food and Beverage 1 * – – – – Government 11 4% 220,500 270,000 300,000 258,477 Healthcare 4 1% – – – – Information Technology 44 14% 132,000 210,000 260,600 221,799 Insurance 3 1% – – – – Legal 0 * – – – – Manufacturing 22 7% 180,000 233,778 300,000 239,926 Pharmaceuticals 2 1% – – – – Real Estate 1 * – – – – Resources (Agriculture, Mining, etc.)
31 10% 168,000 222,780 300,000 273,763
Telecommunications 40 13% 219,500 300,000 339,116 289,453 Training/Education 4 1% – – – – Utility 8 3% – – – – Other 2 1% – – – –

Project Management Salary Survey –Seventh Edition 175
Saudi Arabia – All Respondents
Annualized Salary by Type of Project
Project Type n= Percent 25th Percentile Median 75th Percentile Mean Business Transformation 42 14% 192,000 254,300 307,062 295,419 Construction 129 42% 160,000 222,780 325,000 264,381 Engineering 97 32% 174,500 240,000 324,000 282,970 Information Technology 114 37% 180,000 240,000 300,000 263,635 Manufacturing 23 8% 160,000 240,000 276,000 227,509 Operations 48 16% 155,000 240,000 300,000 262,333 Quality Management 33 11% 180,000 270,000 370,001 303,011 Regulatory Compliance 15 5% 211,000 300,000 403,200 365,377 Research and Development 14 5% 160,000 245,000 300,000 249,058 Supply Chain Management/Logistics 13 4% 162,000 192,000 240,000 210,768
Other 26 8% 144,000 262,500 342,192 271,667
Annualized Salary by Number of Employees in Entire Organization
Employees n= Percent 25th Percentile Median 75th Percentile Mean Less than 100 27 9% 190,800 300,000 400,000 297,200 100 to 299 36 12% 169,000 214,000 254,800 227,531 300 to 999 50 16% 159,000 242,513 300,001 248,431 1,000 to 2,499 43 14% 157,200 198,000 300,000 261,696 2,500 to 4,999 41 13% 167,000 228,000 300,000 250,860 5,000 to 9,999 18 6% 161,611 241,500 440,001 298,482 10,000 or more 92 30% 175,000 232,000 302,500 267,244
Annualized Salary by Average Project Team Size
Employees n= Percent 25th Percentile Median 75th Percentile Mean
1-4 people 39 15% 180,000 240,000 300,000 241,847 5-9 people 61 24% 168,000 226,800 300,000 245,508 10-14 people 50 20% 192,000 240,000 325,000 288,357 15-19 people 19 8% 200,000 250,000 324,000 262,547 20 or more people 83 33% 149,000 240,000 360,000 281,387
Annualized Salary by Average Project Budget (in USD)
Employees n= Percent 25th Percentile Median 75th Percentile Mean
Less than $100,000 14 5% 162,000 218,250 300,000 223,857 $100,000 to $499,999 41 15% 192,000 246,360 300,000 284,317 $500,000 to $999,999 29 11% 180,000 248,400 300,000 255,310 $1 million to $10 million 80 29% 161,806 228,012 300,000 259,180 More than $10 million 112 41% 162,000 240,000 345,000 275,542

Project Management Salary Survey –Seventh Edition 176
Saudi Arabia – All Respondents
Project Management Career Path within Organization
n= Percent Yes - Clearly defined/in writing 59 19% Yes - Informal 140 46% No 85 28% Don't Know 20 7%
Project Management Career Path Connected to Roles in Upper Management
n= Percent Yes - Clearly defined/in writing 53 27% Yes - Informal 114 58% No 20 10% Don't Know 10 5%
Defined Set of Performance Skills for Project Managers within Organization
n= Percent Yes - Clearly defined/in writing 96 32% Yes - Informal 113 38% No 73 24% Don't Know 17 6%
Equities Offered in Past Year by Position Description
Stock Options Stock (i.e., Shares)
Neither
n= Percent n= Percent n= Percent Total 9 3% 12 4% 277 93% Director of Project Management Office (PMO) 0 * 1 4% 22 96% Portfolio Manager 0 * 0 * 10 100% Program Manager 1 3% 0 * 39 98% Project Manager III 1 3% 2 5% 37 93% Project Manager II 2 3% 1 1% 64 96% Project Manager I 2 3% 3 5% 57 92% Project Management Specialist 2 6% 4 11% 30 83% Project Management Consultant 1 5% 1 5% 18 90%
Employee Benefits Offered by Position Description
Company
Car/Allowance Cell Phone Usage Paid Life Insurance
n= Percent n= Percent n= Percent Total 228 75% 147 49% 80 26% Director of Project Management Office (PMO) 16 70% 12 52% 3 13% Portfolio Manager 9 90% 6 60% 4 40% Program Manager 29 73% 21 53% 10 25% Project Manager III 31 78% 23 58% 9 23% Project Manager II 59 86% 37 54% 21 30% Project Manager I 45 70% 25 39% 17 27% Project Management Specialist 27 73% 16 43% 11 30% Project Management Consultant 12 60% 7 35% 5 25%

Project Management Salary Survey –Seventh Edition 177
Saudi Arabia – All Respondents
Mean Number of Vacation Days by Position Description
After 1 Year After 10 Years n= Mean n= Mean
Total 302 29.2 229 30.2 Director of Project Management Office (PMO) 24 28.8 17 32.5 Portfolio Manager 10 29.9 8 29.9 Program Manager 38 28.1 35 29.4 Project Manager III 40 30.5 31 32.0 Project Manager II 69 30.8 49 32.2 Project Manager I 64 29.8 48 31.8 Project Management Specialist 37 26.8 28 23.1 Project Management Consultant 20 25.4 13 26.5
Pension Plans Offered by Position Description
Defined Benefit
Plans
Defined Contribution
Plans Other Pension
Plans n= Percent n= Percent n= Percent
Total 100 34% 38 13% 28 10% Director of Project Management Office (PMO) 5 22% 3 13% 2 9% Portfolio Manager 3 33% 1 11% 1 11% Program Manager 13 33% 8 21% 4 10% Project Manager III 15 38% 5 13% 3 8% Project Manager II 25 37% 10 15% 6 9% Project Manager I 23 39% 6 10% 9 15% Project Management Specialist 14 39% 5 14% 0 * Project Management Consultant 2 10% 0 * 3 15%
Mean Hours Worked by Position Description
Hours Expected Actual Hours
Worked n= Mean n= Mean
Total 280 43.4 270 49.9 Director of Project Management Office (PMO) 21 43.1 21 51.0 Portfolio Manager 10 44.0 9 51.8 Program Manager 37 43.6 36 49.1 Project Manager III 39 42.7 38 52.0 Project Manager II 62 43.1 58 49.6 Project Manager I 62 43.8 58 49.2 Project Management Specialist 29 43.7 31 50.3 Project Management Consultant 20 43.8 19 47.4

Project Management Salary Survey –Seventh Edition 178
Singapore – All Respondents
Total Compensation (in Singapore Dollars)
Compensation n= 25th Percentile Median 75th Percentile Mean Salary 624 63,000 84,000 107,500 92,077 Total Compensation 624 72,000 95,958 123,200 107,104
Reported/Expected Change in Total Compensation over Past/Next 12 Months
Past 12 Months n= Percent Next 12 Months n= Percent Decreased 13 2% Decrease 5 1% Remained the same 145 23% Remain the same 82 13% Increased less than 1% 16 3% Increase less than 1% 17 3% Increased 1% to 2.9% 83 13% Increase 1% to 2.9% 71 11% Increased 3% to 3.9% 72 12% Increase 3% to 3.9% 70 11% Increased 4% to 4.9% 59 9% Increase 4% to 4.9% 72 12% Increased 5% to 6.9% 80 13% Increase 5% to 6.9% 98 16% Increased 7% to 9.9% 47 8% Increase 7% to 9.9% 53 8% Increased 10% to 14.9% 48 8% Increase 10% to 14.9% 76 12% Increased 15% to 19.9% 21 3% Increase 15% to 19.9% 32 5% Increased 20% to 24.9% 21 3% Increase 20% to 24.9% 20 3% Increased 25% to 29.9% 5 1% Increase 25% to 29.9% 8 1% Increased 30% or greater 14 2% Increase 30% or greater 20 3%
Annualized Salary by Position Description
Position n= Percent 25th Percentile Median 75th Percentile Mean Director of Project Management Office (PMO)
16 3% 95,400 110,000 139,750 121,058
Portfolio Manager 37 6% 120,000 156,000 192,000 160,970 Program Manager 89 14% 70,000 100,000 123,000 103,478 Project Manager III 115 18% 72,000 90,000 118,000 101,041 Project Manager II 123 20% 65,000 80,000 100,000 85,423 Project Manager I 160 26% 56,600 70,490 85,000 72,684 Project Management Specialist
52 8% 55,000 63,700 78,500 72,535
Project Management Consultant
32 5% 62,498 88,050 100,000 88,299
Annualized Salary by Years Work Experience
Years n= Percent 25th Percentile Median 75th Percentile Mean
Less than 3 years 2 * – – – – 3 to less than 5 years 15 2% 42,000 50,000 70,000 52,803 5 to less than 10 years 142 23% 52,000 63,650 80,000 67,117 10 to less than 15 years 236 38% 66,000 84,000 105,000 92,288 15 to less than 20 years 132 21% 80,000 95,500 120,000 103,240 20 years or more years 97 16% 85,000 104,999 155,000 120,108

Project Management Salary Survey –Seventh Edition 179
Singapore – All Respondents
Annualized Salary by Technique Experience
Years n= Percent 25th Percentile Median 75th Percentile Mean Agile Project Management/Scrum
None 342 62% 61,200 80,000 104,000 89,905 1 to 5 years 171 31% 66,000 85,000 108,000 92,946 6 years or more 36 7% 74,500 90,700 120,000 104,627
Extreme Project Management None 378 71% 62,220 80,001 105,000 91,775 1 to 5 years 120 23% 60,000 78,000 96,000 81,259 6 years or more 35 7% 85,000 120,000 180,000 128,214
Process Based Project Management
None 139 25% 63,700 80,000 113,450 90,764 1 to 5 years 287 51% 59,600 74,400 96,000 81,594 6 years or more 140 25% 80,000 98,035 140,000 113,343
Event Chain Project Management None 365 68% 63,000 82,080 105,000 92,547 1 to 5 years 140 26% 60,600 79,620 98,750 86,645 6 years or more 32 6% 70,235 92,500 117,500 99,764
Interactive Project Management
None 254 47% 62,220 80,000 104,000 90,757 1 to 5 years 193 36% 60,000 76,000 97,500 82,527 6 years or more 90 17% 77,000 98,000 140,000 111,063 Incremental Project Management
None 270 50% 62,000 80,001 102,000 89,793 1 to 5 years 208 38% 60,000 78,000 100,000 87,770 6 years or more 66 12% 78,200 97,750 136,000 112,627
Project Portfolio Management None 253 46% 60,000 73,000 91,272 80,207 1 to 5 years 235 43% 66,000 86,200 120,000 96,521 6 years or more 62 11% 86,000 106,910 159,788 128,095

Project Management Salary Survey –Seventh Edition 180
Singapore – All Respondents
Annualized Salary by Technique Experience (Continued)
Years n= Percent 25th Percentile Median 75th Percentile Mean Program Management
None 220 39% 57,400 72,000 91,122 79,949 1 to 5 years 259 46% 65,000 85,000 110,000 91,802 6 years or more 86 15% 84,000 106,897 155,000 123,659
Earned Value Management None 236 43% 57,631 75,000 97,500 83,264 1 to 5 years 247 45% 63,700 80,000 104,000 90,717 6 years or more 66 12% 85,400 105,397 155,000 124,589 Lean Project Management
None 281 52% 62,000 80,000 105,000 90,132 1 to 5 years 209 38% 62,220 80,000 100,000 87,831 6 years or more 54 10% 80,000 99,035 150,000 114,850
Critical Chain Project Management None 275 51% 61,000 80,000 101,250 89,229 1 to 5 years 203 38% 62,400 80,000 102,000 88,754 6 years or more 62 11% 78,240 98,035 132,000 110,909
Waterfall Project Management
None 211 38% 60,000 78,240 100,000 87,134 1 to 5 years 220 39% 63,000 80,000 100,000 88,183 6 years or more 130 23% 75,000 99,692 120,000 108,003 Risk Management
None 94 16% 60,000 78,800 97,000 85,049 1 to 5 years 336 59% 60,000 75,000 96,500 82,315 6 years or more 141 25% 85,200 104,000 150,000 119,670
Change Management None 62 11% 50,000 70,000 84,500 73,072 1 to 5 years 348 60% 60,000 76,178 97,100 83,793 6 years or more 174 30% 80,000 100,000 140,000 113,579
Resource Management
None 57 10% 57,600 75,600 90,000 81,662 1 to 5 years 325 57% 59,600 72,000 93,000 79,309 6 years or more 190 33% 80,000 102,000 144,000 116,746
Annualized Salary by Years Worked in Project Management
Years n= Percent 25th Percentile Median 75th Percentile Mean Less than 3 years 34 5% 48,000 64,000 82,680 68,369 3 to less than 5 years 122 20% 54,600 66,000 84,000 70,081 5 to less than 10 years 310 50% 65,800 84,250 110,000 92,940 10 to less than 15 years 117 19% 72,000 97,500 120,000 105,903 15 to less than 20 years 30 5% 96,000 110,000 160,000 131,093 20 or more years 11 2% 100,000 120,000 160,000 131,527
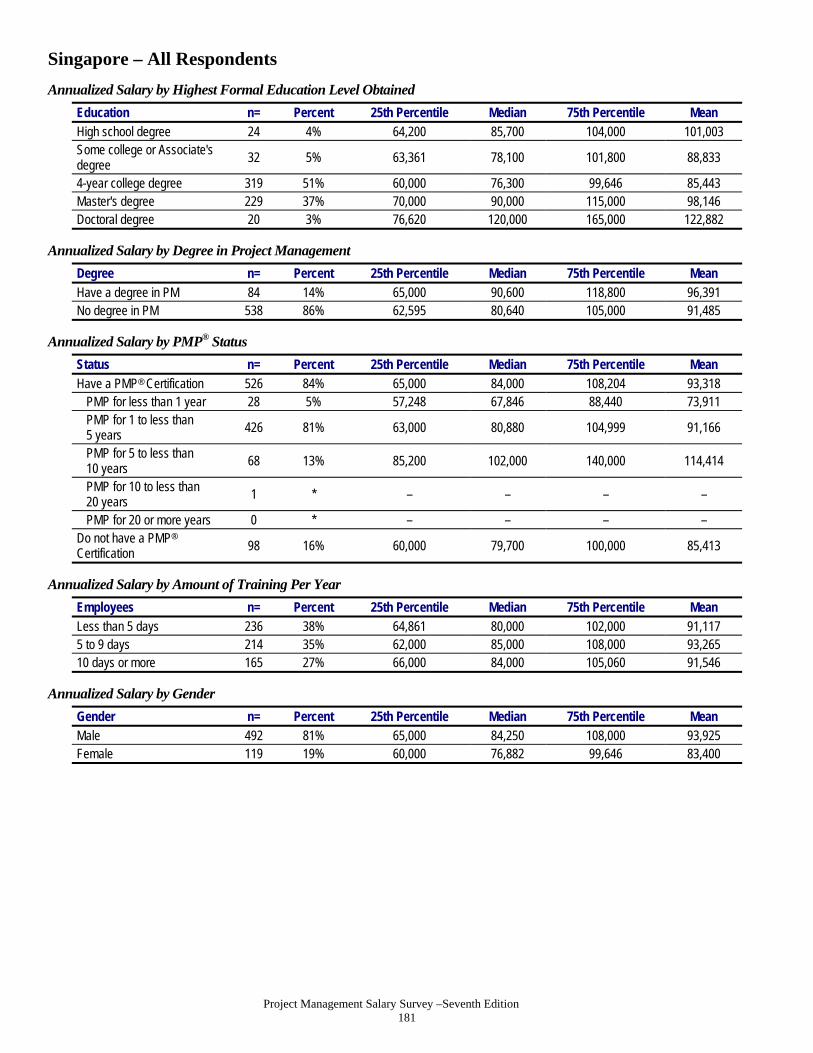
Project Management Salary Survey –Seventh Edition 181
Singapore – All Respondents
Annualized Salary by Highest Formal Education Level Obtained
Education n= Percent 25th Percentile Median 75th Percentile Mean High school degree 24 4% 64,200 85,700 104,000 101,003 Some college or Associate's degree
32 5% 63,361 78,100 101,800 88,833
4-year college degree 319 51% 60,000 76,300 99,646 85,443 Master's degree 229 37% 70,000 90,000 115,000 98,146 Doctoral degree 20 3% 76,620 120,000 165,000 122,882
Annualized Salary by Degree in Project Management
Degree n= Percent 25th Percentile Median 75th Percentile Mean
Have a degree in PM 84 14% 65,000 90,600 118,800 96,391 No degree in PM 538 86% 62,595 80,640 105,000 91,485
Annualized Salary by PMP® Status
Status n= Percent 25th Percentile Median 75th Percentile Mean
Have a PMP® Certification 526 84% 65,000 84,000 108,204 93,318 PMP for less than 1 year 28 5% 57,248 67,846 88,440 73,911 PMP for 1 to less than 5 years 426 81% 63,000 80,880 104,999 91,166
PMP for 5 to less than 10 years
68 13% 85,200 102,000 140,000 114,414
PMP for 10 to less than 20 years
1 * – – – –
PMP for 20 or more years 0 * – – – – Do not have a PMP® Certification 98 16% 60,000 79,700 100,000 85,413
Annualized Salary by Amount of Training Per Year
Employees n= Percent 25th Percentile Median 75th Percentile Mean Less than 5 days 236 38% 64,861 80,000 102,000 91,117 5 to 9 days 214 35% 62,000 85,000 108,000 93,265 10 days or more 165 27% 66,000 84,000 105,060 91,546
Annualized Salary by Gender
Gender n= Percent 25th Percentile Median 75th Percentile Mean Male 492 81% 65,000 84,250 108,000 93,925 Female 119 19% 60,000 76,882 99,646 83,400

Project Management Salary Survey –Seventh Edition 182
Singapore – All Respondents
Annualized Salary by Department
Department n= Percent 25th Percentile Median 75th Percentile Mean Administration/General Management
14 2% 60,000 73,161 160,550 111,342
Consulting 44 7% 64,000 95,600 142,000 107,825 Customer Service/Public Relations
3 * – – – –
Engineering 43 7% 54,000 76,000 90,000 79,729 Finance 26 4% 70,000 95,600 107,000 98,144 Human Resources 3 * – – – – Information Technology/ Information Systems
243 39% 63,700 80,000 100,000 89,547
Operations/Manufacturing 24 4% 72,000 84,800 120,000 99,359 Project Management Department or PMO
156 25% 62,310 85,000 108,102 92,343
Quality Management 8 1% – – – – Research and Development 22 4% 66,794 84,000 105,000 86,365 Sales/Marketing 18 3% 65,325 85,000 110,500 91,583 Supply Chain Management/Logistics 10 2% 63,000 78,500 96,000 80,770
Training/Education 1 * – – – – Other 8 1% – – – –
Annualized Salary by Industry
Industry n= Percent 25th Percentile Median 75th Percentile Mean
Aerospace 4 1% – – – – Business Services 9 1% – – – – Construction 21 3% 48,000 65,000 84,000 76,476 Consulting 22 4% 80,000 99,000 190,000 131,236 Engineering 59 9% 50,000 70,000 90,000 76,494 Financial Services 93 15% 79,400 110,000 150,000 119,168 Food and Beverage 5 1% – – – – Government 15 2% 50,000 66,000 70,000 64,752 Healthcare 12 2% 56,298 76,500 91,500 75,707 Information Technology 223 36% 62,000 78,000 100,000 87,054 Insurance 6 1% – – – – Legal 0 * – – – – Manufacturing 60 10% 62,200 80,441 100,000 83,931 Pharmaceuticals 11 2% 87,000 97,000 105,000 99,491 Real Estate 2 * – – – – Resources (Agriculture, Mining, etc.)
14 2% 79,650 93,000 117,600 91,945
Telecommunications 39 6% 73,000 85,000 105,000 91,779 Training/Education 4 1% – – – – Utility 7 1% – – – – Other 18 3% 63,700 79,620 115,700 91,579

Project Management Salary Survey –Seventh Edition 183
Singapore – All Respondents
Annualized by Type of Project
Project Type n= Percent 25th Percentile Median 75th Percentile Mean Business Transformation 107 17% 80,000 100,000 140,000 112,803 Construction 28 4% 55,000 82,000 105,000 85,952 Engineering 113 18% 60,000 80,000 97,000 83,016 Information Technology 442 71% 65,000 84,000 108,000 94,246 Manufacturing 43 7% 60,000 79,650 100,000 87,294 Operations 110 18% 62,400 88,250 120,000 98,154 Quality Management 42 7% 63,700 93,650 100,000 95,854 Regulatory Compliance 39 6% 85,000 100,000 140,000 114,516 Research and Development 48 8% 61,787 84,000 104,500 88,491 Supply Chain Management/Logistics 44 7% 66,000 80,000 99,000 90,572
Other 32 5% 69,625 90,000 111,220 103,447
Annualized Salary by Number of Employees in Entire Organization
Employees n= Percent 25th Percentile Median 75th Percentile Mean Less than 100 61 10% 57,600 66,000 85,000 79,156 100 to 299 58 9% 60,000 80,000 97,500 84,060 300 to 999 72 12% 57,600 75,300 91,200 80,711 1,000 to 2,499 59 9% 60,000 70,000 100,000 79,671 2,500 to 4,999 63 10% 62,000 82,680 113,450 91,463 5,000 to 9,999 67 11% 62,400 78,000 100,000 86,713 10,000 or more 244 39% 72,000 95,000 123,500 105,198
Annualized Salary by Average Project Team Size
Employees n= Percent 25th Percentile Median 75th Percentile Mean
1-4 people 88 18% 58,700 72,000 90,550 79,713 5-9 people 189 40% 65,325 84,000 105,820 90,345 10-14 people 96 20% 63,300 87,500 105,000 94,482 15-19 people 32 7% 79,000 96,000 124,000 108,588 20 or more people 71 15% 72,000 100,000 148,320 115,856
Annualized Salary by Average Project Budget (in USD)
Employees n= Percent 25th Percentile Median 75th Percentile Mean
Less than $100,000 78 14% 57,600 67,000 82,788 73,142 $100,000 to $499,999 166 29% 62,000 78,100 98,000 84,367 $500,000 to $999,999 94 17% 60,000 86,500 105,000 87,985 $1 million to $10 million 182 32% 72,000 95,000 125,000 105,768 More than $10 million 44 8% 80,500 106,500 149,160 120,081
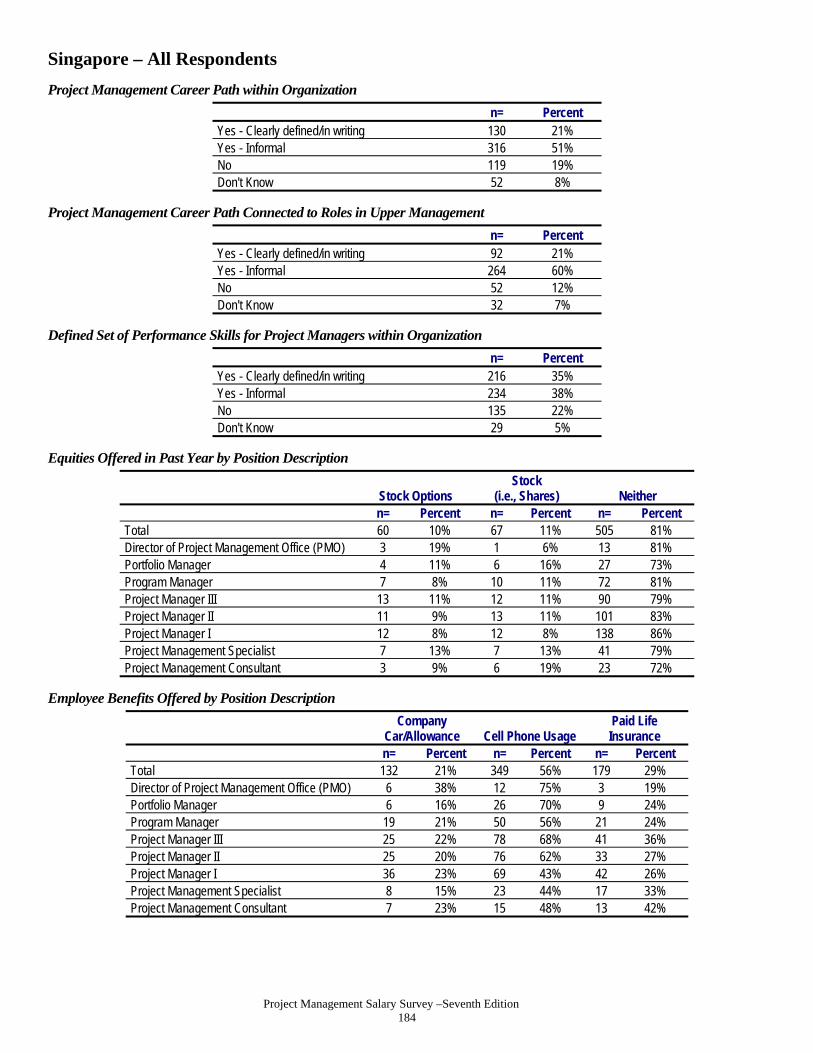
Project Management Salary Survey –Seventh Edition 184
Singapore – All Respondents
Project Management Career Path within Organization
n= Percent Yes - Clearly defined/in writing 130 21% Yes - Informal 316 51% No 119 19% Don't Know 52 8%
Project Management Career Path Connected to Roles in Upper Management
n= Percent Yes - Clearly defined/in writing 92 21% Yes - Informal 264 60% No 52 12% Don't Know 32 7%
Defined Set of Performance Skills for Project Managers within Organization
n= Percent Yes - Clearly defined/in writing 216 35% Yes - Informal 234 38% No 135 22% Don't Know 29 5%
Equities Offered in Past Year by Position Description
Stock Options Stock
(i.e., Shares) Neither n= Percent n= Percent n= Percent
Total 60 10% 67 11% 505 81% Director of Project Management Office (PMO) 3 19% 1 6% 13 81% Portfolio Manager 4 11% 6 16% 27 73% Program Manager 7 8% 10 11% 72 81% Project Manager III 13 11% 12 11% 90 79% Project Manager II 11 9% 13 11% 101 83% Project Manager I 12 8% 12 8% 138 86% Project Management Specialist 7 13% 7 13% 41 79% Project Management Consultant 3 9% 6 19% 23 72%
Employee Benefits Offered by Position Description
Company
Car/Allowance Cell Phone Usage Paid Life Insurance
n= Percent n= Percent n= Percent Total 132 21% 349 56% 179 29% Director of Project Management Office (PMO) 6 38% 12 75% 3 19% Portfolio Manager 6 16% 26 70% 9 24% Program Manager 19 21% 50 56% 21 24% Project Manager III 25 22% 78 68% 41 36% Project Manager II 25 20% 76 62% 33 27% Project Manager I 36 23% 69 43% 42 26% Project Management Specialist 8 15% 23 44% 17 33% Project Management Consultant 7 23% 15 48% 13 42%

Project Management Salary Survey –Seventh Edition 185
Singapore – All Respondents
Mean Number of Vacation Days by Position Description
After 1 Year After 10 Years n= Mean n= Mean
Total 602 16.7 531 20.6 Director of Project Management Office (PMO) 16 16.4 15 19.6 Portfolio Manager 36 19.4 34 22.1 Program Manager 84 16.2 76 19.7 Project Manager III 112 17.3 100 20.6 Project Manager II 121 16.5 103 21.0 Project Manager I 153 16.5 129 20.7 Project Management Specialist 50 16.0 47 20.4 Project Management Consultant 30 15.8 27 20.1
Pension Plans Offered by Position Description
Defined Benefit
Plans Defined
Contribution Plans Other Pension
Plans n= Percent n= Percent n= Percent
Total 53 9% 165 27% 33 5% Director of Project Management Office (PMO) 0 * 4 25% 1 6% Portfolio Manager 4 11% 20 54% 0 * Program Manager 3 3% 22 25% 5 6% Project Manager III 10 9% 36 32% 4 4% Project Manager II 8 7% 30 25% 6 5% Project Manager I 15 9% 35 22% 13 8% Project Management Specialist 9 17% 8 15% 3 6% Project Management Consultant 4 13% 10 32% 1 3%
Mean Hours Worked by Position Description
Hours Expected Actual Hours
Worked n= Mean n= Mean
Total 587 41.4 573 49.2 Director of Project Management Office (PMO) 16 41.4 16 51.9 Portfolio Manager 36 40.9 35 51.3 Program Manager 80 41.3 77 49.5 Project Manager III 112 41.5 111 49.7 Project Manager II 114 41.2 111 49.1 Project Manager I 150 41.6 145 48.2 Project Management Specialist 47 41.0 47 47.7 Project Management Consultant 32 41.6 31 50.5

Project Management Salary Survey –Seventh Edition 186
Spain – All Respondents
Total Compensation (in European Union Euros)
Compensation n= 25th Percentile Median 75th Percentile Mean Salary 424 41,423 50,000 60,700 52,888 Total Compensation 424 44,000 56,000 69,500 58,550
Reported/Expected Change in Total Compensation over Past/Next 12 Months
Past 12 Months n= Percent Next 12 Months n= Percent Decreased 31 7% Decrease 14 3% Remained the same 160 38% Remain the same 155 37% Increased less than 1% 31 7% Increase less than 1% 21 5% Increased 1% to 2.9% 99 23% Increase 1% to 2.9% 105 25% Increased 3% to 3.9% 28 7% Increase 3% to 3.9% 43 10% Increased 4% to 4.9% 10 2% Increase 4% to 4.9% 15 4% Increased 5% to 6.9% 20 5% Increase 5% to 6.9% 21 5% Increased 7% to 9.9% 19 4% Increase 7% to 9.9% 21 5% Increased 10% to 14.9% 12 3% Increase 10% to 14.9% 13 3% Increased 15% to 19.9% 7 2% Increase 15% to 19.9% 9 2% Increased 20% to 24.9% 1 * Increase 20% to 24.9% 5 1% Increased 25% to 29.9% 2 * Increase 25% to 29.9% 0 * Increased 30% or greater 4 1% Increase 30% or greater 2 *
Annualized Salary by Position Description
Position n= Percent 25th Percentile Median 75th Percentile Mean Director of Project Management Office (PMO)
25 6% 50,000 69,000 89,000 70,158
Portfolio Manager 23 5% 55,000 60,000 69,000 62,579 Program Manager 77 18% 48,000 58,550 66,000 58,700 Project Manager III 100 24% 42,500 52,000 64,000 54,126 Project Manager II 112 26% 39,000 46,850 55,500 48,128 Project Manager I 47 11% 36,000 42,000 49,000 43,444 Project Management Specialist
13 3% 41,000 46,000 56,000 49,654
Project Management Consultant
27 6% 35,000 43,000 50,000 45,219
Annualized Salary by Years Work Experience
Years n= Percent 25th Percentile Median 75th Percentile Mean Less than 3 years 0 * – – – – 3 to less than 5 years 4 1% – – – – 5 to less than 10 years 69 16% 35,000 39,000 44,100 40,231 10 to less than 15 years 164 39% 40,000 48,500 57,986 49,657 15 to less than 20 years 96 23% 46,150 56,250 64,000 57,330 20 years or more years 91 21% 50,000 62,500 75,000 64,527

Project Management Salary Survey –Seventh Edition 187
Spain – All Respondents
Annualized Salary by Technique Experience
Years n= Percent 25th Percentile Median 75th Percentile Mean Agile Project Management/Scrum
None 231 59% 41,000 50,900 62,500 53,304 1 to 5 years 124 32% 40,000 47,300 58,000 49,006 6 years or more 35 9% 45,000 54,000 70,000 58,871
Extreme Project Management None 259 67% 40,000 49,000 60,000 51,823 1 to 5 years 99 26% 42,000 50,000 60,000 52,307 6 years or more 29 7% 47,000 55,000 62,000 60,897
Process Based Project Management
None 90 23% 39,000 49,000 60,000 50,999 1 to 5 years 175 44% 40,000 48,000 56,000 49,499 6 years or more 129 33% 45,000 58,500 66,000 58,603
Event Chain Project Management None 223 58% 40,000 50,000 60,000 51,761 1 to 5 years 107 28% 41,000 50,000 60,000 50,551 6 years or more 54 14% 47,000 56,500 70,000 59,420
Interactive Project Management
None 185 47% 42,000 50,000 60,000 51,731 1 to 5 years 124 32% 40,000 50,000 60,000 50,694 6 years or more 83 21% 43,000 50,300 66,000 56,860 Incremental Project Management
None 197 51% 40,000 50,000 60,000 51,923 1 to 5 years 118 30% 39,000 47,150 57,000 49,778 6 years or more 75 19% 45,000 52,500 66,000 57,768
Project Portfolio Management None 162 42% 39,000 46,018 60,000 49,311 1 to 5 years 159 41% 42,000 50,000 60,000 52,280 6 years or more 69 18% 49,000 60,000 72,000 62,994

Project Management Salary Survey –Seventh Edition 188
Spain – All Respondents
Annualized Salary by Technique Experience (Continued)
Years n= Percent 25th Percentile Median 75th Percentile Mean Program Management
None 115 29% 38,000 45,835 55,000 47,438 1 to 5 years 198 49% 41,000 50,000 60,000 51,075 6 years or more 90 22% 46,000 61,750 75,000 63,950
Earned Value Management
None 91 23% 39,000 46,000 60,000 49,367 1 to 5 years 210 53% 40,000 49,400 60,000 50,891 6 years or more 96 24% 48,000 59,950 68,081 60,721 Lean Project Management
None 220 57% 41,000 50,000 60,200 52,745 1 to 5 years 121 31% 40,000 47,600 60,000 49,912 6 years or more 48 12% 45,500 55,500 65,000 58,040
Critical Chain Project Management None 131 33% 39,000 46,036 60,000 49,719 1 to 5 years 170 43% 40,000 50,000 60,000 51,499 6 years or more 95 24% 47,660 57,971 66,000 59,301
Waterfall Project Management
None 188 49% 40,000 50,000 61,200 51,729 1 to 5 years 102 26% 40,000 47,350 57,000 48,771 6 years or more 96 25% 45,500 54,500 62,855 58,276
Risk Management None 25 6% 37,000 42,000 50,000 45,795 1 to 5 years 211 53% 39,000 47,660 56,625 49,068 6 years or more 162 41% 45,000 57,500 66,000 58,866 Change Management
None 44 11% 39,500 45,000 56,250 48,497 1 to 5 years 186 47% 39,000 47,150 58,550 49,385 6 years or more 170 43% 45,000 55,000 66,000 57,790
Resource Management
None 38 10% 37,000 44,500 53,000 46,447 1 to 5 years 171 43% 38,500 46,300 56,500 48,711 6 years or more 189 47% 45,000 56,000 66,000 57,670
Annualized Salary by Years Worked in Project Management
Years n= Percent 25th Percentile Median 75th Percentile Mean
Less than 3 years 10 2% 36,000 40,500 43,000 41,450 3 to less than 5 years 48 11% 34,500 38,250 44,250 39,139 5 to less than 10 years 193 46% 40,000 46,300 55,000 48,072 10 to less than 15 years 132 31% 50,000 60,000 69,500 60,823 15 to less than 20 years 30 7% 51,000 60,750 72,000 62,707 20 or more years 11 3% 75,000 87,000 100,000 85,773
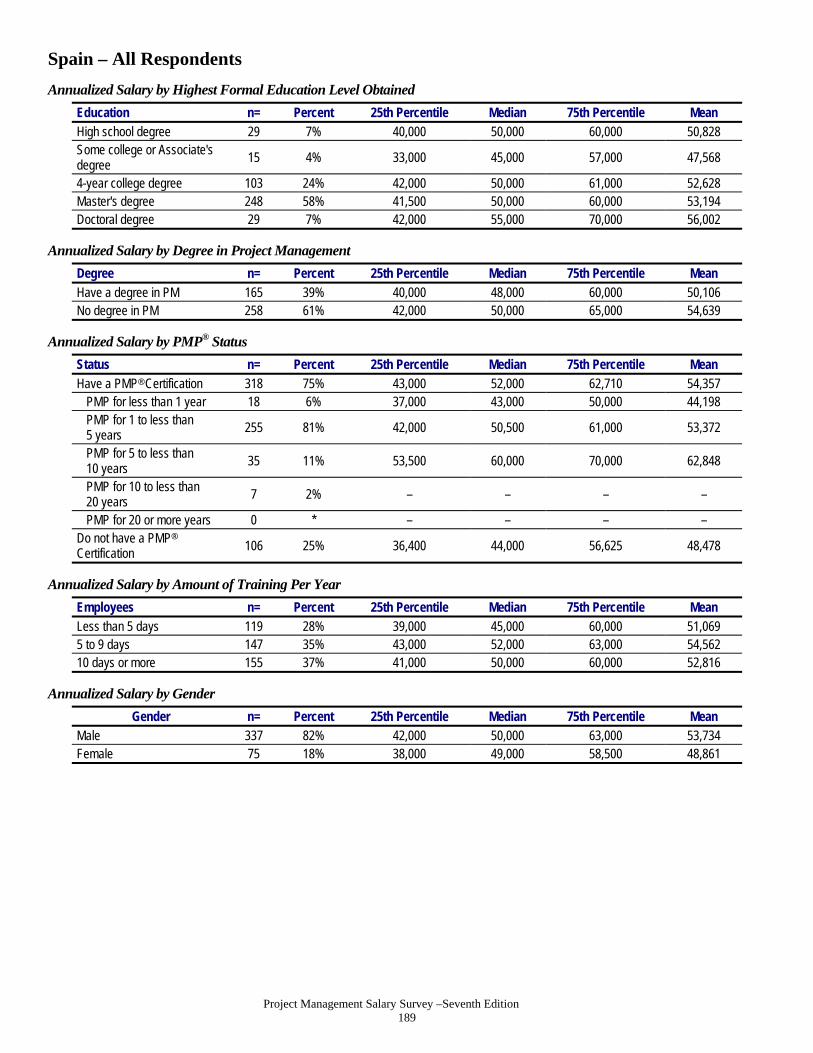
Project Management Salary Survey –Seventh Edition 189
Spain – All Respondents
Annualized Salary by Highest Formal Education Level Obtained
Education n= Percent 25th Percentile Median 75th Percentile Mean High school degree 29 7% 40,000 50,000 60,000 50,828 Some college or Associate's degree
15 4% 33,000 45,000 57,000 47,568
4-year college degree 103 24% 42,000 50,000 61,000 52,628 Master's degree 248 58% 41,500 50,000 60,000 53,194 Doctoral degree 29 7% 42,000 55,000 70,000 56,002
Annualized Salary by Degree in Project Management
Degree n= Percent 25th Percentile Median 75th Percentile Mean
Have a degree in PM 165 39% 40,000 48,000 60,000 50,106 No degree in PM 258 61% 42,000 50,000 65,000 54,639
Annualized Salary by PMP® Status
Status n= Percent 25th Percentile Median 75th Percentile Mean
Have a PMP® Certification 318 75% 43,000 52,000 62,710 54,357 PMP for less than 1 year 18 6% 37,000 43,000 50,000 44,198 PMP for 1 to less than 5 years 255 81% 42,000 50,500 61,000 53,372
PMP for 5 to less than 10 years
35 11% 53,500 60,000 70,000 62,848
PMP for 10 to less than 20 years
7 2% – – – –
PMP for 20 or more years 0 * – – – – Do not have a PMP® Certification 106 25% 36,400 44,000 56,625 48,478
Annualized Salary by Amount of Training Per Year
Employees n= Percent 25th Percentile Median 75th Percentile Mean Less than 5 days 119 28% 39,000 45,000 60,000 51,069 5 to 9 days 147 35% 43,000 52,000 63,000 54,562 10 days or more 155 37% 41,000 50,000 60,000 52,816
Annualized Salary by Gender
Gender n= Percent 25th Percentile Median 75th Percentile Mean Male 337 82% 42,000 50,000 63,000 53,734 Female 75 18% 38,000 49,000 58,500 48,861

Project Management Salary Survey –Seventh Edition 190
Spain – All Respondents
Annualized Salary by Department
Department n= Percent 25th
Percentile Median 75th Percentile Mean
Administration/ General Management
29 7% 40,000 56,000 63,000 55,672
Consulting 61 14% 42,000 47,000 60,000 52,107 Customer Service/ Public Relations
2 * – – – –
Engineering 35 8% 40,000 50,000 60,000 51,577 Finance 1 * – – – – Human Resources 1 * – – – – Information Technology/ Information Systems
132 31% 41,923 49,000 58,000 50,427
Operations/Manufacturing 11 3% 40,000 45,000 57,000 48,182 Project Management Department or PMO
127 30% 42,000 55,000 65,000 55,625
Quality Management 3 1% – – – – Research and Development 9 2% – – – – Sales/Marketing 4 1% – – – – Supply Chain Management/Logistics
3 1% – – – –
Training/Education 1 * – – – – Other 4 1% – – – –
Annualized Salary by Industry
Industry n= Percent 25th Percentile Median 75th Percentile Mean
Aerospace 8 2% – – – – Business Services 6 1% – – – – Construction 12 3% 46,500 61,250 69,000 60,497 Consulting 50 12% 41,000 49,500 65,000 54,156 Engineering 33 8% 41,000 47,600 60,000 52,068 Financial Services 17 4% 45,000 55,000 60,000 53,206 Food and Beverage 7 2% – – – – Government 7 2% – – – – Healthcare 5 1% – – – – Information Technology 163 38% 40,000 48,000 58,500 50,950 Insurance 3 1% – – – – Legal 1 * – – – – Manufacturing 12 3% 46,000 55,000 67,000 57,833 Pharmaceuticals 10 2% 46,000 51,500 62,000 55,295 Real Estate 2 * – – – – Resources (Agriculture, Mining, etc.)
3 1% – – – –
Telecommunications 70 17% 43,000 52,000 62,710 53,090 Training/Education 2 * – – – – Utility 3 1% – – – – Other 10 2% 40,000 51,000 60,000 51,949

Project Management Salary Survey –Seventh Edition 191
Spain – All Respondents
Annualized by Type of Project
Project Type n= Percent 25th Percentile Median 75th Percentile Mean Business Transformation 77 18% 44,500 58,000 68,000 58,136 Construction 41 10% 40,000 57,000 65,417 56,426 Engineering 86 20% 38,200 49,900 60,000 51,963 Information Technology 297 70% 42,000 50,000 60,000 52,208 Manufacturing 16 4% 40,000 54,250 62,500 54,249 Operations 63 15% 43,000 55,000 65,417 55,443 Quality Management 29 7% 40,000 47,000 63,000 53,604 Regulatory Compliance 18 4% 41,000 49,000 62,000 53,278 Research and Development 41 10% 39,000 45,000 60,000 48,247 Supply Chain Management/Logistics 23 5% 42,000 52,000 68,162 54,187
Other 24 6% 43,000 53,000 60,750 52,368
Annualized Salary by Number of Employees in Entire Organization
Employees n= Percent 25th Percentile Median 75th Percentile Mean Less than 100 37 9% 35,000 45,000 60,000 48,018 100 to 299 41 10% 36,000 43,000 54,000 48,695 300 to 999 46 11% 39,000 45,000 55,000 48,637 1,000 to 2,499 47 11% 36,000 46,000 57,000 49,711 2,500 to 4,999 43 10% 44,000 49,800 62,000 52,744 5,000 to 9,999 27 6% 42,000 50,000 65,000 53,283 10,000 or more 183 43% 45,000 56,000 65,101 56,671
Annualized Salary by Average Project Team Size
Employees n= Percent 25th Percentile Median 75th Percentile Mean
1-4 people 59 15% 35,000 45,000 54,000 47,042 5-9 people 136 36% 40,000 50,000 60,000 51,738 10-14 people 76 20% 43,550 52,500 64,500 56,182 15-19 people 32 8% 45,650 53,750 65,709 56,754 20 or more people 78 20% 44,000 57,313 64,000 56,079
Annualized Salary by Average Project Budget (in USD)
Employees n= Percent 25th Percentile Median 75th Percentile Mean
Less than $100,000 48 12% 35,140 39,000 46,500 42,318 $100,000 to $499,999 121 30% 40,000 47,330 58,500 49,669 $500,000 to $999,999 77 19% 42,000 50,000 60,000 53,058 $1 million to $10 million 128 31% 45,000 55,000 65,000 57,326 More than $10 million 33 8% 50,000 60,000 69,000 61,642

Project Management Salary Survey –Seventh Edition 192
Spain – All Respondents Project Management Career Path within Organization
n= Percent Yes - Clearly defined/in writing 134 32% Yes - Informal 130 31% No 133 32% Don't Know 24 6%
Project Management Career Path Connected to Roles in Upper Management
n= Percent Yes - Clearly defined/in writing 77 30% Yes - Informal 117 45% No 51 20% Don't Know 15 6%
Defined Set of Performance Skills for Project Managers within Organization
n= Percent Yes - Clearly defined/in writing 186 44% Yes - Informal 124 30% No 96 23% Don't Know 14 3%
Equities Offered in Past Year by Position Description
Stock Options Stock
(i.e., Shares) Neither n= Percent n= Percent n= Percent
Total 28 7% 37 9% 362 86% Director of Project Management Office (PMO)
1 4% 4 17% 20 83%
Portfolio Manager 1 4% 4 17% 18 78% Program Manager 7 9% 9 12% 64 84% Project Manager III 9 9% 7 7% 84 85% Project Manager II 7 6% 6 5% 99 89% Project Manager I 1 2% 3 7% 42 91% Project Management Specialist 1 8% 0 * 12 92% Project Management Consultant 1 4% 4 15% 23 85%
Employee Benefits Offered by Position Description
Company
Car/Allowance Cell Phone Usage Paid Life Insurance n= Percent n= Percent n= Percent
Total 65 15% 319 75% 207 49% Director of Project Management Office (PMO)
9 36% 23 92% 14 56%
Portfolio Manager 3 13% 21 91% 15 65% Program Manager 13 17% 64 84% 35 46% Project Manager III 19 19% 83 83% 54 54% Project Manager II 15 13% 83 74% 58 52% Project Manager I 1 2% 25 53% 18 38% Project Management Specialist 2 15% 6 46% 6 46% Project Management Consultant 3 11% 14 52% 7 26%

Project Management Salary Survey –Seventh Edition 193
Spain – All Respondents
Mean Number of Vacation Days by Position Description
After 1 Year After 10 Years n= Mean n= Mean
Total 402 23.7 371 24.0 Director of Project Management Office (PMO) 24 24.7 19 26.3 Portfolio Manager 21 24.5 21 25.3 Program Manager 70 24.0 72 24.2 Project Manager III 95 22.7 89 23.0 Project Manager II 107 24.2 98 24.1 Project Manager I 47 23.5 37 24.1 Project Management Specialist 13 23.4 11 24.5 Project Management Consultant 25 22.4 24 22.9
Pension Plans Offered by Position Description
Defined Benefit Plans
Defined Contribution Plans
Other Pension Plans
n= Percent n= Percent n= Percent Total 58 14% 65 16% 30 7% Director of Project Management Office (PMO) 5 22% 2 9% 2 9% Portfolio Manager 3 14% 6 29% 1 5% Program Manager 14 19% 8 11% 3 4% Project Manager III 8 8% 16 16% 13 13% Project Manager II 16 15% 22 20% 4 4% Project Manager I 5 11% 6 13% 3 7% Project Management Specialist 3 23% 3 23% 2 15% Project Management Consultant 4 15% 2 7% 2 7%
Mean Hours Worked by Position Description
Hours Expected Actual Hours Worked n= Mean n= Mean
Total 418 40.1 417 46.7 Director of Project Management Office (PMO) 24 40.3 24 48.5 Portfolio Manager 23 40.7 22 49.1 Program Manager 76 40.0 76 47.8 Project Manager III 99 40.2 99 47.3 Project Manager II 110 40.0 110 46.0 Project Manager I 47 40.0 47 44.8 Project Management Specialist 12 40.2 12 47.3 Project Management Consultant 27 39.6 27 44.5

Project Management Salary Survey –Seventh Edition 194
Sweden – All Respondents
Total Compensation (in Swedish Kronas)
Compensation n= 25th Percentile Median 75th Percentile Mean Salary 397 500,956 567,312 654,490 595,288 Total Compensation 397 516,885 597,569 708,510 636,538
Reported/Expected Change in Total Compensation over Past/Next 12 Months
Past 12 Months n= Percent Next 12 Months n= Percent Decreased 5 1% Decrease 4 1% Remained the same 52 13% Remain the same 56 14% Increased less than 1% 15 4% Increase less than 1% 18 5% Increased 1% to 2.9% 149 38% Increase 1% to 2.9% 148 37% Increased 3% to 3.9% 57 14% Increase 3% to 3.9% 81 20% Increased 4% to 4.9% 24 6% Increase 4% to 4.9% 34 9% Increased 5% to 6.9% 26 7% Increase 5% to 6.9% 26 7% Increased 7% to 9.9% 25 6% Increase 7% to 9.9% 6 2% Increased 10% to 14.9% 21 5% Increase 10% to 14.9% 15 4% Increased 15% to 19.9% 12 3% Increase 15% to 19.9% 5 1% Increased 20% to 24.9% 5 1% Increase 20% to 24.9% 0 * Increased 25% to 29.9% 1 * Increase 25% to 29.9% 0 * Increased 30% or greater 5 1% Increase 30% or greater 4 1%
Annualized Salary by Position Description
Position n= Percent 25th Percentile Median 75th Percentile Mean Director of Project Management Office (PMO)
23 6% 567,312 693,382 781,631 677,426
Portfolio Manager 9 2% – – – – Program Manager 52 13% 556,495 630,347 693,382 645,811 Project Manager III 145 37% 516,885 567,312 661,865 606,572 Project Manager II 93 23% 449,696 521,676 605,133 543,107 Project Manager I 19 5% 457,430 510,581 573,616 516,171 Project Management Specialist
13 3% 523,976 567,312 596,939 545,148
Project Management Consultant
43 11% 495,049 567,437 663,945 606,633
Annualized Salary by Years Work Experience
Years n= Percent 25th Percentile Median 75th Percentile Mean Less than 3 years 0 * – – – – 3 to less than 5 years 3 1% – – – – 5 to less than 10 years 43 11% 441,243 475,471 539,294 491,120 10 to less than 15 years 83 21% 497,029 542,099 636,651 576,902 15 to less than 20 years 80 20% 504,278 567,312 635,472 584,884 20 years or more years 188 47% 542,099 611,437 693,382 635,038

Project Management Salary Survey –Seventh Edition 195
Sweden – All Respondents
Annualized Salary by Technique Experience
Years n= Percent 25th Percentile Median 75th Percentile Mean Agile Project Management/Scrum
None 197 54% 491,671 567,312 661,865 594,321 1 to 5 years 148 40% 511,940 579,072 645,863 596,487 6 years or more 23 6% 554,706 630,347 756,417 639,529
Extreme Project Management None 275 76% 498,605 567,312 654,490 592,441 1 to 5 years 69 19% 520,036 629,856 680,775 618,363 6 years or more 20 5% 509,182 583,071 666,261 610,354
Process Based Project Management
None 104 28% 497,117 567,312 646,106 579,232 1 to 5 years 112 30% 472,918 546,479 630,347 575,850 6 years or more 157 42% 517,679 617,740 693,382 625,514 Event Chain Project Management
None 267 74% 504,278 567,312 661,865 600,492 1 to 5 years 56 16% 484,422 549,132 650,956 586,866 6 years or more 37 10% 516,885 605,133 680,775 614,602
Interactive Project Management None 193 54% 500,956 567,312 649,258 594,112 1 to 5 years 97 27% 497,029 567,312 642,954 593,519 6 years or more 67 19% 504,278 624,044 686,415 610,373 Incremental Project Management
None 177 50% 491,362 567,312 647,562 584,817 1 to 5 years 106 30% 521,676 576,768 655,265 598,858 6 years or more 74 21% 523,188 630,347 693,382 636,169
Project Portfolio Management None 169 46% 493,940 554,706 624,044 571,834 1 to 5 years 150 41% 504,278 601,982 693,382 615,542 6 years or more 51 14% 539,728 630,347 705,989 644,697

Project Management Salary Survey –Seventh Edition 196
Sweden – All Respondents
Annualized Salary by Technique Experience (Continued)
Years n= Percent 25th Percentile Median 75th Percentile Mean Program Management
None 138 37% 492,301 551,919 629,856 576,255 1 to 5 years 167 45% 504,278 592,526 661,865 602,613 6 years or more 66 18% 549,132 630,347 712,292 642,650
Earned Value Management None 118 32% 483,476 555,717 630,347 579,120 1 to 5 years 168 45% 504,278 567,312 654,877 597,966 6 years or more 87 23% 535,795 617,740 693,382 622,378
Lean Project Management
None 216 59% 504,278 567,312 649,258 594,589 1 to 5 years 120 33% 491,264 578,731 674,140 598,653 6 years or more 31 8% 503,371 611,437 678,077 626,703 Critical Chain Project Management
None 146 40% 504,278 567,312 654,490 597,818 1 to 5 years 134 37% 492,301 566,997 642,954 581,761 6 years or more 86 23% 520,036 620,892 693,382 628,419
Waterfall Project Management None 137 37% 475,250 561,009 630,347 563,656 1 to 5 years 81 22% 509,346 565,976 693,382 628,374 6 years or more 153 41% 526,617 605,133 686,415 613,578
Risk Management None 16 4% 449,337 509,733 568,573 546,140 1 to 5 years 141 38% 472,760 542,099 617,740 565,697 6 years or more 219 58% 526,617 611,437 693,382 623,127 Change Management
None 31 8% 460,153 533,904 630,347 574,247 1 to 5 years 148 39% 474,163 546,038 623,798 560,790 6 years or more 200 53% 527,393 616,480 693,382 629,058 Resource Management
None 27 7% 441,243 492,301 579,919 541,893 1 to 5 years 119 31% 475,250 540,208 617,740 560,459 6 years or more 235 62% 521,171 605,133 687,078 620,939
Annualized Salary by Years Worked in Project Management
Years n= Percent 25th Percentile Median 75th Percentile Mean Less than 3 years 10 3% 389,302 448,492 539,294 457,010 3 to less than 5 years 33 8% 441,243 472,760 544,620 519,330 5 to less than 10 years 118 30% 492,301 537,844 630,347 572,388 10 to less than 15 years 137 35% 509,346 598,830 680,157 602,638 15 to less than 20 years 70 18% 567,312 630,347 677,800 653,363 20 or more years 29 7% 549,133 630,347 731,203 647,683

Project Management Salary Survey –Seventh Edition 197
Sweden – All Respondents
Annualized Salary by Highest Formal Education Level Obtained
Education n= Percent 25th Percentile Median 75th Percentile Mean High school degree 21 5% 516,885 561,009 598,830 544,304 Some college or Associate’s degree
49 12% 485,367 542,099 693,382 597,269
4-year college degree 66 17% 528,168 578,254 642,954 591,583 Master’s degree 246 62% 492,301 573,720 674,472 599,346 Doctoral degree 15 4% 517,679 563,335 630,347 609,957
Annualized Salary by Degree in Project Management
Degree n= Percent 25th Percentile Median 75th Percentile Mean
Have a degree in PM 35 9% 464,654 554,706 630,347 560,880 No degree in PM 359 91% 504,278 567,312 658,082 598,948
Annualized Salary by PMP® Status
Status n= Percent 25th Percentile Median 75th Percentile Mean
Have a PMP® Certification 295 74% 515,466 583,702 661,865 605,858 PMP for less than 1 year 13 4% 466,457 508,886 567,312 535,205 PMP for 1 to less than 5 years 178 60% 494,219 559,647 636,651 582,026
PMP for 5 to less than 10 years
82 28% 567,437 633,499 712,292 659,958
PMP for 10 to less than 20 years
22 7% 554,706 630,347 663,945 638,790
PMP for 20 or more years 0 * – – – – Do not have a PMP®
Certification 102 26% 457,610 537,544 630,347 564,718
Annualized Salary by Amount of Training Per Year
Employees n= Percent 25th Percentile Median 75th Percentile Mean Less than 5 days 146 37% 497,974 567,312 649,258 591,526 5 to 9 days 150 38% 497,029 567,312 654,490 587,072 10 days or more 100 25% 504,278 578,254 671,011 613,700
Annualized Salary by Gender
Gender n= Percent 25th Percentile Median 75th Percentile Mean Male 301 76% 509,346 583,071 674,472 606,849 Female 93 24% 472,254 523,188 598,830 556,867

Project Management Salary Survey –Seventh Edition 198
Sweden – All Respondents
Annualized Salary by Department
Department n= Percent 25th Percentile Median 75th Percentile Mean Administration/ General Management
38 10% 549,132 616,164 680,775 634,030
Consulting 57 14% 479,064 535,795 696,370 602,866 Customer Service/ Public Relations
2 1% – – – –
Engineering 17 4% 497,029 567,312 630,347 577,791 Finance 5 1% – – – – Human Resources 2 1% – – – – Information Technology/ Information Systems
70 18% 521,676 575,102 640,653 603,625
Operations/Manufacturing 10 3% 447,547 532,959 680,775 571,664 Project Management Department or PMO
152 38% 494,753 567,312 652,261 591,538
Quality Management 1 * – – – – Research and Development 21 5% 442,939 563,530 630,347 554,439 Sales/Marketing 6 2% – – – – Supply Chain Management/Logistics 8 2% – – – –
Training/Education 2 1% – – – – Other 6 2% – – – –
Annualized Salary by Industry
Industry n= Percent 25th Percentile Median 75th Percentile Mean
Aerospace 8 2% – – – – Business Services 2 1% – – – – Construction 8 2% – – – – Consulting 63 16% 485,367 567,312 658,082 609,538 Engineering 47 12% 497,974 549,132 636,651 583,314 Financial Services 12 3% 533,008 571,282 756,417 649,026 Food and Beverage 8 2% – – – – Government 12 3% 497,974 551,554 567,375 545,914 Healthcare 5 1% – – – – Information Technology 94 24% 504,278 567,312 640,653 588,098 Insurance 3 1% – – – – Legal 0 * – – – – Manufacturing 44 11% 455,054 537,762 630,347 557,881 Pharmaceuticals 13 3% 572,368 617,740 630,347 600,052 Real Estate 0 * – – – – Resources (Agriculture, Mining, etc.)
0 * – – – –
Telecommunications 66 17% 509,346 589,134 680,775 594,766 Training/Education 0 * – – – – Utility 7 2% – – – – Other 5 1% – – – –

Project Management Salary Survey –Seventh Edition 199
Sweden – All Respondents
Annualized by Type of Project
Project Type n= Percent 25th Percentile Median 75th Percentile Mean Business Transformation 85 21% 535,795 630,347 756,417 654,939 Construction 30 8% 504,278 567,312 630,347 589,367 Engineering 98 25% 503,371 567,312 642,954 585,620 Information Technology 214 54% 504,278 579,919 661,865 604,032 Manufacturing 34 9% 492,301 601,982 642,954 593,377 Operations 69 17% 516,885 605,133 712,292 620,393 Quality Management 27 7% 512,661 630,347 712,292 648,528 Regulatory Compliance 13 3% 535,795 572,368 712,292 652,717 Research and Development 74 19% 497,205 567,312 678,077 600,227 Supply Chain Management/Logistics 38 10% 518,145 605,133 696,370 614,709
Other 28 7% 479,064 567,312 661,865 581,339
Annualized Salary by Number of Employees in Entire Organization
Employees n= Percent 25th Percentile Median 75th Percentile Mean Less than 100 53 13% 485,367 554,706 642,954 616,054 100-299 20 5% 526,340 584,332 672,360 611,192 300 to 999 45 11% 517,679 576,589 693,382 606,754 1000 to 2499 41 10% 479,064 539,294 630,347 554,565 2500 to 4999 37 9% 457,610 535,795 630,347 547,023 5000 to 9999 25 6% 497,029 563,530 598,830 569,594 10,000 or more 176 44% 519,658 583,295 677,938 607,579
Annualized Salary by Average Project Team Size
Employees n= Percent 25th Percentile Median 75th Percentile Mean
1-4 people 20 6% 445,904 541,657 578,003 541,125 5-9 people 101 29% 485,367 567,312 654,490 593,491 10-14 people 89 26% 497,974 567,312 642,954 589,077 15-19 people 41 12% 509,220 567,312 677,800 614,433 20 or more people 98 28% 523,819 598,830 680,157 614,883
Annualized Salary by Average Project Budget (in USD)
Employees n= Percent 25th Percentile Median 75th Percentile Mean
<$100,000 25 7% 441,243 473,076 575,072 536,968 $100,000 - $499,999 77 21% 466,457 567,312 642,954 574,244 $500,000 - $999,999 60 16% 491,832 547,330 630,347 560,989 $1 - $10 million 150 41% 517,679 583,386 677,800 615,788 $10 million + 54 15% 554,706 630,347 693,382 643,116

Project Management Salary Survey –Seventh Edition 200
Sweden – All Respondents
Project Management Career Path within Organization
n= Percent Yes - Clearly defined/in writing 141 36% Yes - Informal 123 31% No 120 30% Don't Know 11 3%
Project Management Career Path Connected to Roles in Upper Management
n= Percent Yes - Clearly defined/in writing 57 22% Yes - Informal 83 31% No 92 35% Don't Know 32 12%
Defined Set of Performance Skills for Project Managers within Organization
n= Percent Yes - Clearly defined/in writing 187 47% Yes - Informal 93 23% No 99 25% Don't Know 17 4%
Equities Offered in Past Year by Position Description
Stock Options Stock
(i.e., Shares) Neither n= Percent n= Percent n= Percent
Total 21 5% 42 11% 331 84% Director of Project Management Office (PMO) 0 * 3 13% 20 87% Portfolio Manager 2 22% 1 11% 7 78% Program Manager 2 4% 10 20% 39 76% Project Manager III 6 4% 14 10% 121 86% Project Manager II 7 8% 7 8% 80 86% Project Manager I 0 * 2 11% 17 89% Project Management Specialist 2 15% 1 8% 10 77% Project Management Consultant 2 5% 4 9% 37 86%
Employee Benefits Offered by Position Description
Company
Car/Allowance Cell Phone Usage Paid Life Insurance n= Percent n= Percent n= Percent
Total 77 20% 306 78% 86 22% Director of Project Management Office (PMO) 12 55% 20 91% 8 36% Portfolio Manager 1 11% 8 89% 3 33% Program Manager 11 22% 40 78% 15 29% Project Manager III 31 22% 114 79% 32 22% Project Manager II 9 10% 66 72% 11 12% Project Manager I 6 32% 11 58% 6 32% Project Management Specialist 1 8% 9 69% 2 15% Project Management Consultant 6 14% 38 90% 9 21%

Project Management Salary Survey –Seventh Edition 201
Sweden – All Respondents
Mean Number of Vacation Days by Position Description
After 1 Year After 10 Years n= Mean n= Mean
Total 387 27.2 377 28.8 Director of Project Management Office (PMO) 22 29.4 21 31.2 Portfolio Manager 9 27.8 9 30.8 Program Manager 48 28.0 51 30.1 Project Manager III 140 26.9 138 28.6 Project Manager II 93 26.5 89 28.1 Project Manager I 19 28.3 18 28.5 Project Management Specialist 13 26.0 11 27.4 Project Management Consultant 43 26.9 40 28.3
Pension Plans Offered by Position Description
Defined Benefit
Plans Defined
Contribution Plans Other Pension Plans n= Percent n= Percent n= Percent
Total 211 54% 107 27% 96 24% Director of Project Management Office (PMO) 14 61% 7 30% 4 17% Portfolio Manager 6 67% 3 33% 1 11% Program Manager 27 52% 15 29% 12 23% Project Manager III 83 58% 42 29% 33 23% Project Manager II 45 50% 17 19% 29 32% Project Manager I 10 53% 6 32% 3 16% Project Management Specialist 10 77% 6 46% 3 23% Project Management Consultant 16 37% 11 26% 11 26%
Mean Hours Worked by Position Description
ours Expected Actual Hours Worked n= Mean n= Mean
Total 393 39.6 391 43.9 Director of Project Management Office (PMO) 23 39.9 23 46.6 Portfolio Manager 9 39.6 9 44.8 Program Manager 51 39.6 51 44.8 Project Manager III 143 39.6 142 43.5 Project Manager II 92 39.6 91 42.6 Project Manager I 19 39.5 19 43.1 Project Management Specialist 13 39.8 13 43.6 Project Management Consultant 43 39.8 43 45.6
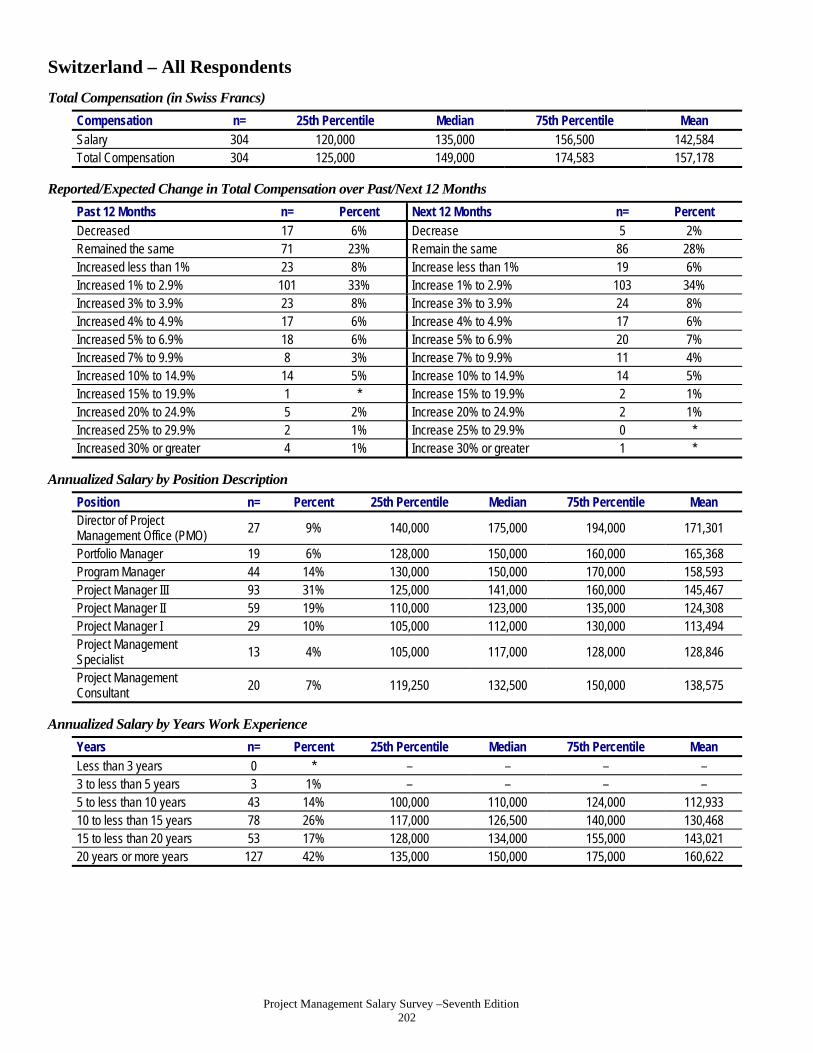
Project Management Salary Survey –Seventh Edition 202
Switzerland – All Respondents
Total Compensation (in Swiss Francs)
Compensation n= 25th Percentile Median 75th Percentile Mean Salary 304 120,000 135,000 156,500 142,584 Total Compensation 304 125,000 149,000 174,583 157,178
Reported/Expected Change in Total Compensation over Past/Next 12 Months
Past 12 Months n= Percent Next 12 Months n= Percent Decreased 17 6% Decrease 5 2% Remained the same 71 23% Remain the same 86 28% Increased less than 1% 23 8% Increase less than 1% 19 6% Increased 1% to 2.9% 101 33% Increase 1% to 2.9% 103 34% Increased 3% to 3.9% 23 8% Increase 3% to 3.9% 24 8% Increased 4% to 4.9% 17 6% Increase 4% to 4.9% 17 6% Increased 5% to 6.9% 18 6% Increase 5% to 6.9% 20 7% Increased 7% to 9.9% 8 3% Increase 7% to 9.9% 11 4% Increased 10% to 14.9% 14 5% Increase 10% to 14.9% 14 5% Increased 15% to 19.9% 1 * Increase 15% to 19.9% 2 1% Increased 20% to 24.9% 5 2% Increase 20% to 24.9% 2 1% Increased 25% to 29.9% 2 1% Increase 25% to 29.9% 0 * Increased 30% or greater 4 1% Increase 30% or greater 1 *
Annualized Salary by Position Description
Position n= Percent 25th Percentile Median 75th Percentile Mean Director of Project Management Office (PMO)
27 9% 140,000 175,000 194,000 171,301
Portfolio Manager 19 6% 128,000 150,000 160,000 165,368 Program Manager 44 14% 130,000 150,000 170,000 158,593 Project Manager III 93 31% 125,000 141,000 160,000 145,467 Project Manager II 59 19% 110,000 123,000 135,000 124,308 Project Manager I 29 10% 105,000 112,000 130,000 113,494 Project Management Specialist
13 4% 105,000 117,000 128,000 128,846
Project Management Consultant
20 7% 119,250 132,500 150,000 138,575
Annualized Salary by Years Work Experience
Years n= Percent 25th Percentile Median 75th Percentile Mean
Less than 3 years 0 * – – – – 3 to less than 5 years 3 1% – – – – 5 to less than 10 years 43 14% 100,000 110,000 124,000 112,933 10 to less than 15 years 78 26% 117,000 126,500 140,000 130,468 15 to less than 20 years 53 17% 128,000 134,000 155,000 143,021 20 years or more years 127 42% 135,000 150,000 175,000 160,622

Project Management Salary Survey –Seventh Edition 203
Switzerland – All Respondents
Annualized Salary by Technique Experience
Years n= Percent 25th Percentile Median 75th Percentile Mean Agile Project Management/Scrum
None 163 60% 118,000 134,772 155,000 140,740 1 to 5 years 92 34% 120,000 135,000 155,000 142,916 6 years or more 16 6% 141,000 158,500 180,000 170,813
Extreme Project Management None 199 75% 120,000 134,000 152,000 140,489 1 to 5 years 41 15% 128,000 138,000 155,000 142,512 6 years or more 25 9% 140,000 160,000 180,000 168,960
Process Based Project Management
None 69 25% 120,000 135,000 150,000 137,589 1 to 5 years 101 37% 110,000 130,000 150,000 138,079 6 years or more 105 38% 130,000 150,000 168,000 154,984 Event Chain Project Management
None 192 73% 120,000 135,000 155,000 143,691 1 to 5 years 43 16% 116,000 134,000 156,000 142,614 6 years or more 29 11% 130,000 155,000 170,000 151,310
Interactive Project Management None 137 51% 123,500 136,000 158,890 144,656 1 to 5 years 75 28% 110,000 125,000 145,000 129,857 6 years or more 57 21% 130,000 150,000 175,000 160,965 Incremental Project Management
None 158 59% 120,000 135,000 157,000 141,960 1 to 5 years 53 20% 110,000 129,800 150,000 135,939 6 years or more 57 21% 130,000 150,000 163,000 151,987
Project Portfolio Management None 93 34% 110,000 120,000 140,000 127,604 1 to 5 years 129 47% 125,000 136,000 158,890 145,306 6 years or more 53 19% 140,000 157,000 190,000 169,660
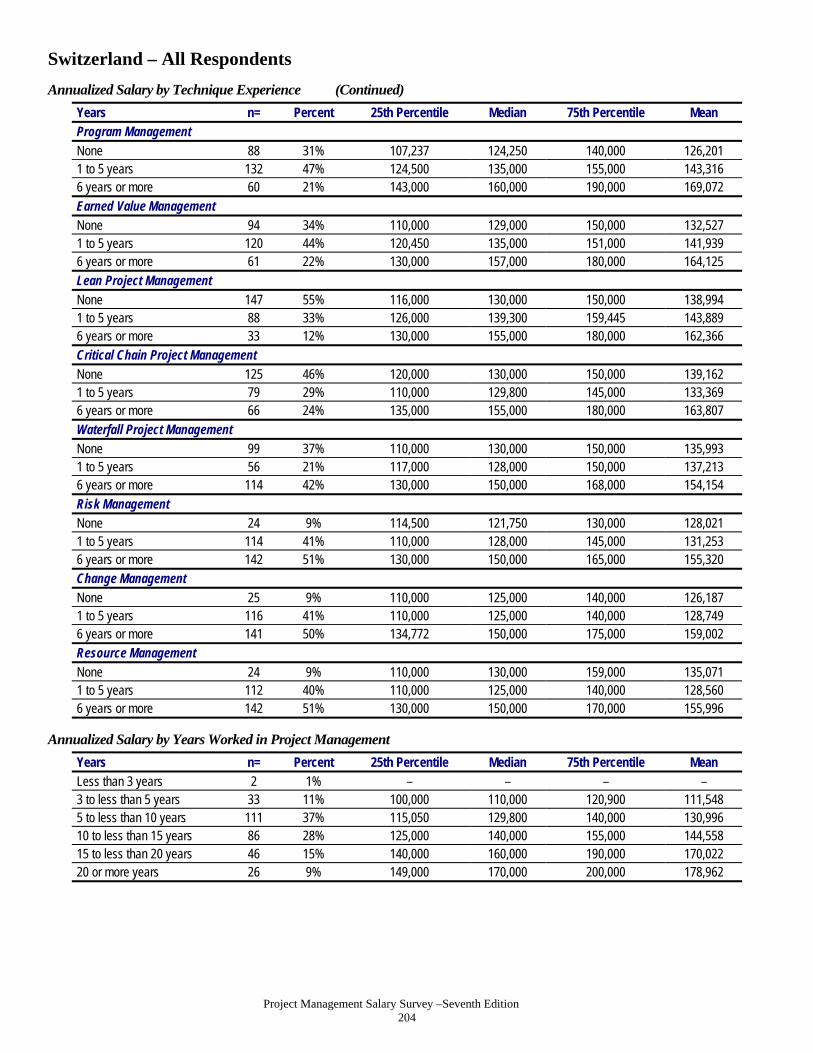
Project Management Salary Survey –Seventh Edition 204
Switzerland – All Respondents
Annualized Salary by Technique Experience (Continued)
Years n= Percent 25th Percentile Median 75th Percentile Mean Program Management
None 88 31% 107,237 124,250 140,000 126,201 1 to 5 years 132 47% 124,500 135,000 155,000 143,316 6 years or more 60 21% 143,000 160,000 190,000 169,072
Earned Value Management None 94 34% 110,000 129,000 150,000 132,527 1 to 5 years 120 44% 120,450 135,000 151,000 141,939 6 years or more 61 22% 130,000 157,000 180,000 164,125
Lean Project Management
None 147 55% 116,000 130,000 150,000 138,994 1 to 5 years 88 33% 126,000 139,300 159,445 143,889 6 years or more 33 12% 130,000 155,000 180,000 162,366 Critical Chain Project Management
None 125 46% 120,000 130,000 150,000 139,162 1 to 5 years 79 29% 110,000 129,800 145,000 133,369 6 years or more 66 24% 135,000 155,000 180,000 163,807
Waterfall Project Management None 99 37% 110,000 130,000 150,000 135,993 1 to 5 years 56 21% 117,000 128,000 150,000 137,213 6 years or more 114 42% 130,000 150,000 168,000 154,154
Risk Management None 24 9% 114,500 121,750 130,000 128,021 1 to 5 years 114 41% 110,000 128,000 145,000 131,253 6 years or more 142 51% 130,000 150,000 165,000 155,320 Change Management
None 25 9% 110,000 125,000 140,000 126,187 1 to 5 years 116 41% 110,000 125,000 140,000 128,749 6 years or more 141 50% 134,772 150,000 175,000 159,002 Resource Management
None 24 9% 110,000 130,000 159,000 135,071 1 to 5 years 112 40% 110,000 125,000 140,000 128,560 6 years or more 142 51% 130,000 150,000 170,000 155,996
Annualized Salary by Years Worked in Project Management
Years n= Percent 25th Percentile Median 75th Percentile Mean Less than 3 years 2 1% – – – – 3 to less than 5 years 33 11% 100,000 110,000 120,900 111,548 5 to less than 10 years 111 37% 115,050 129,800 140,000 130,996 10 to less than 15 years 86 28% 125,000 140,000 155,000 144,558 15 to less than 20 years 46 15% 140,000 160,000 190,000 170,022 20 or more years 26 9% 149,000 170,000 200,000 178,962

Project Management Salary Survey –Seventh Edition 205
Switzerland – All Respondents
Annualized Salary by Highest Formal Education Level Obtained
Education n= Percent 25th Percentile Median 75th Percentile Mean High school degree 8 3% – – – – Some college or Associate’s degree
11 4% 118,000 135,000 150,000 149,364
4-year college degree 65 21% 120,000 130,000 150,000 138,868 Master’s degree 190 63% 118,500 134,886 157,000 141,955 Doctoral degree 30 10% 128,000 140,000 160,000 144,829
Annualized Salary by Degree in Project Management
Degree n= Percent 25th Percentile Median 75th Percentile Mean
Have a degree in PM 45 15% 125,000 142,000 158,890 146,976 No degree in PM 258 85% 120,000 135,000 155,000 141,879
Annualized Salary by PMP® Status
Status n= Percent 25th Percentile Median 75th Percentile Mean
Have a PMP® Certification 240 79% 122,500 135,068 157,500 143,600 PMP for less than 1 year 8 3% – – – – PMP for 1 to less than 5 years 181 76% 120,000 135,000 150,000 140,784
PMP for 5 to less than 10 years
43 18% 127,000 145,000 170,000 154,737
PMP for 10 to less than 20 years
7 3% – – – –
PMP for 20 or more years 0 * – – – – Do not have a PMP® Certification 64 21% 110,000 125,000 152,500 138,776
Annualized Salary by Amount of Training Per Year
Employees n= Percent 25th Percentile Median 75th Percentile Mean Less than 5 days 111 37% 120,000 140,000 160,000 146,840 5 to 9 days 101 33% 120,000 135,000 155,000 139,656 10 days or more 92 30% 117,500 132,000 150,000 140,665
Annualized Salary by Gender
Gender n= Percent 25th Percentile Median 75th Percentile Mean Male 250 84% 120,000 135,568 157,000 142,582 Female 48 16% 119,000 130,000 165,000 144,501

Project Management Salary Survey –Seventh Edition 206
Switzerland – All Respondents
Annualized Salary by Department
Department n= Percent 25th Percentile Median 75th Percentile Mean
Administration/General Management
22 7% 120,000 138,500 160,000 146,955
Consulting 20 7% 127,000 140,000 155,000 151,875 Customer Service/Public Relations 2 1% – – – –
Engineering 18 6% 105,000 120,500 135,000 132,817 Finance 6 2% – – – – Human Resources 2 1% – – – – Information Technology/ Information Systems
94 31% 120,000 135,000 150,000 143,235
Operations/Manufacturing 4 1% – – – – Project Management Department or PMO 83 27% 117,000 140,000 161,000 142,400
Quality Management 3 1% – – – – Research and Development 27 9% 110,000 125,000 150,000 132,975 Sales/Marketing 8 3% – – – – Supply Chain Management/Logistics
7 2% – – – –
Training/Education 0 * – – – – Other 7 2% – – – –
Annualized Salary by Industry
Industry n= Percent 25th Percentile Median 75th Percentile Mean
Aerospace 2 1% – – – – Business Services 4 1% – – – – Construction 6 2% – – – – Consulting 20 7% 125,000 132,500 164,000 142,900 Engineering 30 10% 110,000 120,050 130,000 119,462 Financial Services 43 14% 130,000 145,000 165,000 150,093 Food and Beverage 12 4% 122,500 140,000 159,000 155,833 Government 7 2% – – – – Healthcare 5 2% – – – – Information Technology 72 24% 120,000 140,000 160,000 143,947 Insurance 14 5% 125,000 148,500 157,000 157,375 Legal 0 * – – – – Manufacturing 22 7% 120,000 134,000 150,000 139,555 Pharmaceuticals 22 7% 130,000 140,000 150,000 140,234 Real Estate 0 * – – – – Resources (Agriculture, Mining, etc.) 4 1% – – – –
Telecommunications 26 9% 120,000 135,000 161,000 152,372 Training/Education 1 * – – – – Utility 9 3% – – – – Other 5 2% – – – –

Project Management Salary Survey –Seventh Edition 207
Switzerland – All Respondents
Annualized by Type of Project
Project Type n= Percent 25th Percentile Median 75th Percentile Mean Business Transformation 91 30% 130,000 150,000 180,000 158,799 Construction 26 9% 105,000 123,450 157,000 143,542 Engineering 56 18% 110,000 123,750 148,500 132,857 Information Technology 201 66% 125,000 140,000 158,890 144,921 Manufacturing 22 7% 110,000 128,000 160,000 141,700 Operations 57 19% 128,000 145,000 170,000 157,854 Quality Management 41 13% 122,000 137,000 160,000 143,198 Regulatory Compliance 23 8% 125,000 135,000 160,000 145,087 Research and Development 51 17% 110,000 127,000 150,000 137,169 Supply Chain Management/Logistics 32 11% 128,000 145,000 177,500 154,266
Other 11 4% 122,000 130,000 155,000 136,636
Annualized Salary by Number of Employees in Entire Organization
Employees n= Percent 25th Percentile Median 75th Percentile Mean Less than 100 29 10% 120,000 130,000 175,000 154,483 100-299 17 6% 115,000 125,000 140,000 124,235 300 to 999 24 8% 116,025 128,500 147,000 132,148 1000 to 2499 37 12% 120,000 132,000 145,000 138,658 2500 to 4999 15 5% 117,000 135,000 160,000 145,347 5000 to 9999 16 5% 129,000 147,500 165,000 150,500 10,000 or more 166 55% 120,900 137,000 158,890 143,757
Annualized Salary by Average Project Team Size
Employees n= Percent 25th Percentile Median 75th Percentile Mean
1-4 people 33 13% 110,000 120,900 135,135 130,004 5-9 people 88 35% 120,000 130,000 150,000 136,639 10-14 people 60 24% 120,000 132,250 152,500 144,344 15-19 people 26 10% 130,000 140,000 155,000 142,719 20 or more people 46 18% 136,000 157,500 193,000 167,678
Annualized Salary by Average Project Budget (in USD)
Employees n= Percent 25th Percentile Median 75th Percentile Mean
Less than $100,000 20 7% 105,000 124,500 132,500 124,175 $100,000 - $499,999 72 25% 111,000 129,000 145,000 129,349 $500,000 - $999,999 50 18% 120,000 132,500 150,000 137,520 $1 - $10 million 109 38% 128,000 143,000 166,900 152,210 $10 million + 34 12% 120,000 155,000 180,000 159,153
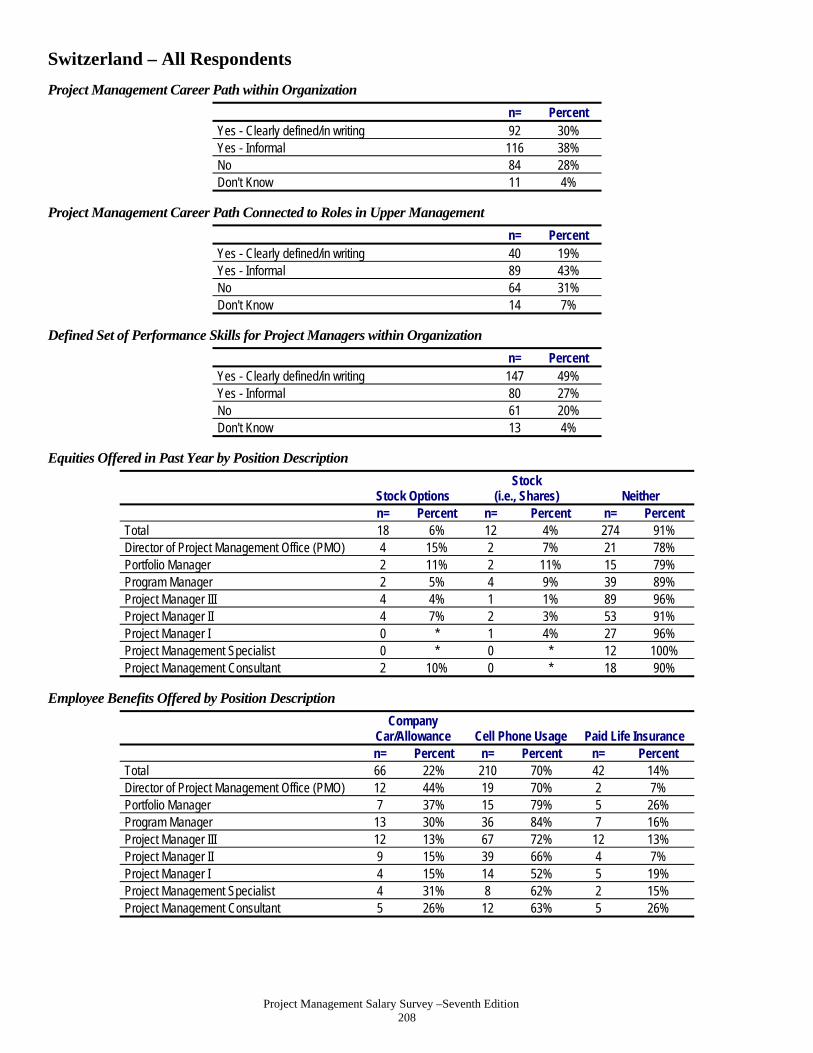
Project Management Salary Survey –Seventh Edition 208
Switzerland – All Respondents
Project Management Career Path within Organization n= Percent
Yes - Clearly defined/in writing 92 30% Yes - Informal 116 38% No 84 28% Don't Know 11 4%
Project Management Career Path Connected to Roles in Upper Management
n= Percent Yes - Clearly defined/in writing 40 19% Yes - Informal 89 43% No 64 31% Don't Know 14 7%
Defined Set of Performance Skills for Project Managers within Organization
n= Percent Yes - Clearly defined/in writing 147 49% Yes - Informal 80 27% No 61 20% Don't Know 13 4%
Equities Offered in Past Year by Position Description
Stock Options Stock
(i.e., Shares) Neither n= Percent n= Percent n= Percent
Total 18 6% 12 4% 274 91% Director of Project Management Office (PMO) 4 15% 2 7% 21 78% Portfolio Manager 2 11% 2 11% 15 79% Program Manager 2 5% 4 9% 39 89% Project Manager III 4 4% 1 1% 89 96% Project Manager II 4 7% 2 3% 53 91% Project Manager I 0 * 1 4% 27 96% Project Management Specialist 0 * 0 * 12 100% Project Management Consultant 2 10% 0 * 18 90%
Employee Benefits Offered by Position Description
Company
Car/Allowance Cell Phone Usage Paid Life Insurance n= Percent n= Percent n= Percent
Total 66 22% 210 70% 42 14% Director of Project Management Office (PMO) 12 44% 19 70% 2 7% Portfolio Manager 7 37% 15 79% 5 26% Program Manager 13 30% 36 84% 7 16% Project Manager III 12 13% 67 72% 12 13% Project Manager II 9 15% 39 66% 4 7% Project Manager I 4 15% 14 52% 5 19% Project Management Specialist 4 31% 8 62% 2 15% Project Management Consultant 5 26% 12 63% 5 26%

Project Management Salary Survey –Seventh Edition 209
Switzerland – All Respondents
Mean Number of Vacation Days by Position Description
After 1 Year After 10 Years n= Mean n= Mean
Total 292 23.5 283 25.7 Director of Project Management Office (PMO) 27 24.7 27 26.1 Portfolio Manager 19 24.6 19 27.1 Program Manager 42 23.2 39 26.5 Project Manager III 87 23.2 87 25.1 Project Manager II 56 24.1 57 26.3 Project Manager I 28 22.8 25 24.0 Project Management Specialist 13 23.8 9 27.0 Project Management Consultant 20 22.2 20 24.6
Pension Plans Offered by Position Description
Defined Benefit
Plans Defined
Contribution Plans Other Pension
Plans n= Percent n= Percent n= Percent
Total 97 32% 188 62% 41 14% Director of Project Management Office (PMO) 8 31% 19 73% 1 4% Portfolio Manager 4 21% 16 84% 1 5% Program Manager 13 30% 22 50% 9 20% Project Manager III 27 29% 54 59% 13 14% Project Manager II 21 36% 38 66% 7 12% Project Manager I 9 31% 17 59% 4 14% Project Management Specialist 6 46% 8 62% 3 23% Project Management Consultant 9 45% 14 70% 3 15%
Mean Hours Worked by Position Description
Hours Expected Actual Hours Worked n= Mean n= Mean
Total 304 40.7 303 47.4 Director of Project Management Office (PMO) 27 40.5 27 50.9 Portfolio Manager 19 41.0 19 50.6 Program Manager 44 40.8 44 49.9 Project Manager III 93 40.6 92 46.6 Project Manager II 59 40.9 59 45.5 Project Manager I 29 40.9 29 46.4 Project Management Specialist 13 40.8 13 44.8 Project Management Consultant 20 40.7 20 46.0

Project Management Salary Survey –Seventh Edition 210
Taiwan – All Respondents
Total Compensation (in Taiwan Dollars)
Compensation n= 25th Percentile Median 75th Percentile Mean Salary 230 680,000 840,000 1,180,000 957,915 Total Compensation 230 800,000 1,030,000 1,445,400 1,188,343
Reported/Expected Change in Total Compensation over Past/Next 12 Months
Past 12 Months n= Percent Next 12 Months n= Percent Decreased 11 5% Decrease 2 1% Remained the same 74 32% Remain the same 38 17% Increased less than 1% 17 7% Increase less than 1% 11 5% Increased 1% to 2.9% 34 15% Increase 1% to 2.9% 24 10% Increased 3% to 3.9% 28 12% Increase 3% to 3.9% 38 17% Increased 4% to 4.9% 10 4% Increase 4% to 4.9% 17 7% Increased 5% to 6.9% 25 11% Increase 5% to 6.9% 37 16% Increased 7% to 9.9% 12 5% Increase 7% to 9.9% 14 6% Increased 10% to 14.9% 8 3% Increase 10% to 14.9% 27 12% Increased 15% to 19.9% 1 * Increase 15% to 19.9% 8 3% Increased 20% to 24.9% 5 2% Increase 20% to 24.9% 7 3% Increased 25% to 29.9% 2 1% Increase 25% to 29.9% 2 1% Increased 30% or greater 3 1% Increase 30% or greater 5 2%
Annualized Salary by Position Description
Position n= Percent 25th Percentile Median 75th Percentile Mean Director of Project Management Office (PMO)
11 5% 650,000 1,000,000 1,500,000 1,141,818
Portfolio Manager 9 4% – – – – Program Manager 40 17% 750,000 950,004 1,280,000 1,033,488 Project Manager III 26 11% 780,000 1,047,000 1,200,000 1,069,769 Project Manager II 46 20% 691,000 815,000 1,200,000 972,870 Project Manager I 40 17% 650,000 720,000 935,000 786,720 Project Management Specialist
42 18% 640,000 775,000 940,000 809,349
Project Management Consultant
16 7% 617,000 990,000 1,117,284 1,090,223
Annualized Salary by Years Work Experience
Years n= Percent 25th Percentile Median 75th Percentile Mean
Less than 3 years 1 * – – – – 3 to less than 5 years 17 7% 516,000 599,995 680,000 591,096 5 to less than 10 years 50 22% 650,000 735,000 900,000 809,630 10 to less than 15 years 88 38% 720,000 840,000 1,150,000 943,416 15 to less than 20 years 46 20% 720,000 1,013,000 1,440,000 1,081,192 20 years or more years 28 12% 915,000 1,022,000 1,410,000 1,313,714

Project Management Salary Survey –Seventh Edition 211
Taiwan – All Respondents
Annualized Salary by Technique Experience
Years n= Percent 25th Percentile Median 75th Percentile Mean Agile Project Management/Scrum
None 111 59% 650,000 840,000 1,100,000 946,163 1 to 5 years 60 32% 671,000 840,000 1,200,000 975,681 6 years or more 18 10% 699,999 875,000 1,200,000 993,143
Extreme Project Management None 114 59% 660,000 802,000 1,100,000 927,047 1 to 5 years 58 30% 650,000 840,000 1,080,000 925,105 6 years or more 22 11% 750,000 1,030,000 1,500,002 1,173,909
Process Based Project Management
None 41 21% 680,000 826,000 1,044,000 922,317 1 to 5 years 107 54% 610,000 792,000 1,000,000 883,028 6 years or more 49 25% 800,000 1,034,568 1,343,680 1,149,273 Event Chain Project Management
None 100 52% 695,500 900,000 1,150,000 991,588 1 to 5 years 74 38% 650,000 800,000 1,100,000 894,246 6 years or more 20 10% 735,000 852,000 1,350,001 1,037,620
Interactive Project Management None 62 31% 650,000 786,000 999,999 889,913 1 to 5 years 93 47% 650,000 826,000 1,100,000 910,983 6 years or more 44 22% 790,000 960,000 1,360,000 1,124,955 Incremental Project Management
None 84 44% 650,000 800,000 1,090,000 923,621 1 to 5 years 81 42% 670,000 840,000 1,200,000 961,448 6 years or more 28 15% 765,000 900,000 1,200,000 1,087,571
Project Portfolio Management None 89 46% 672,000 845,000 1,034,568 916,694 1 to 5 years 83 43% 650,000 800,000 1,200,000 951,442 6 years or more 23 12% 800,000 960,000 1,460,000 1,169,304
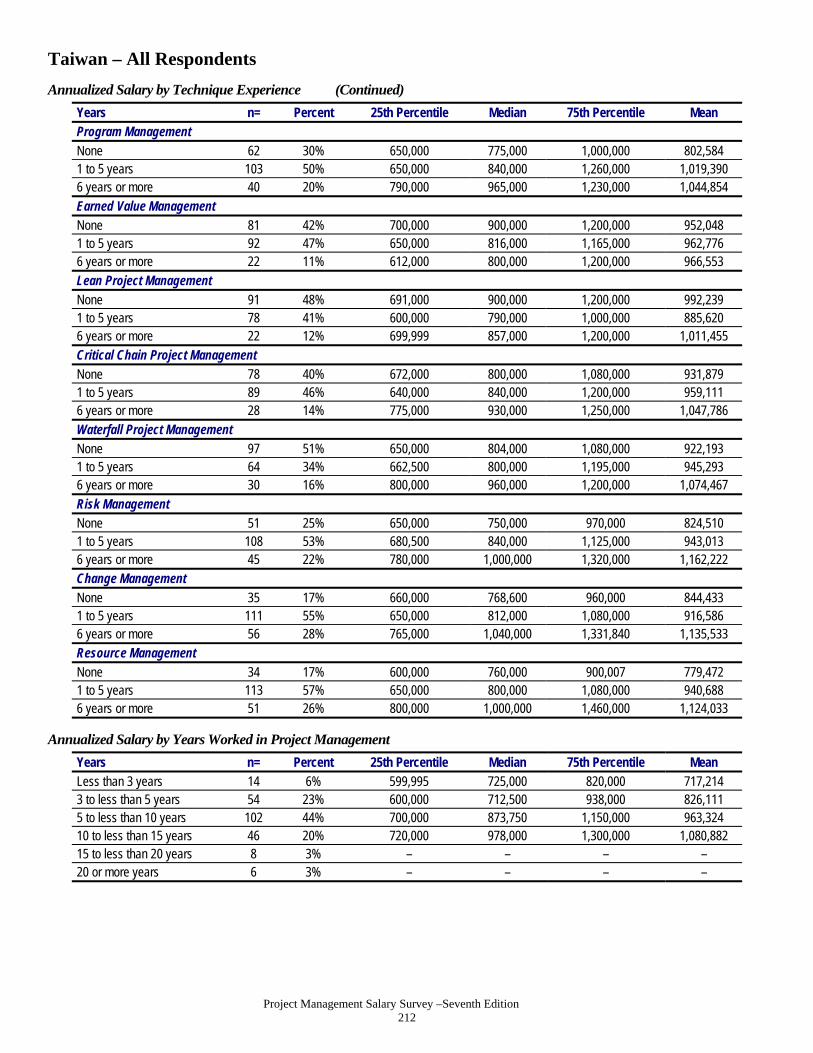
Project Management Salary Survey –Seventh Edition 212
Taiwan – All Respondents
Annualized Salary by Technique Experience (Continued)
Years n= Percent 25th Percentile Median 75th Percentile Mean Program Management
None 62 30% 650,000 775,000 1,000,000 802,584 1 to 5 years 103 50% 650,000 840,000 1,260,000 1,019,390 6 years or more 40 20% 790,000 965,000 1,230,000 1,044,854
Earned Value Management None 81 42% 700,000 900,000 1,200,000 952,048 1 to 5 years 92 47% 650,000 816,000 1,165,000 962,776 6 years or more 22 11% 612,000 800,000 1,200,000 966,553
Lean Project Management
None 91 48% 691,000 900,000 1,200,000 992,239 1 to 5 years 78 41% 600,000 790,000 1,000,000 885,620 6 years or more 22 12% 699,999 857,000 1,200,000 1,011,455 Critical Chain Project Management
None 78 40% 672,000 800,000 1,080,000 931,879 1 to 5 years 89 46% 640,000 840,000 1,200,000 959,111 6 years or more 28 14% 775,000 930,000 1,250,000 1,047,786
Waterfall Project Management None 97 51% 650,000 804,000 1,080,000 922,193 1 to 5 years 64 34% 662,500 800,000 1,195,000 945,293 6 years or more 30 16% 800,000 960,000 1,200,000 1,074,467
Risk Management None 51 25% 650,000 750,000 970,000 824,510 1 to 5 years 108 53% 680,500 840,000 1,125,000 943,013 6 years or more 45 22% 780,000 1,000,000 1,320,000 1,162,222 Change Management
None 35 17% 660,000 768,600 960,000 844,433 1 to 5 years 111 55% 650,000 812,000 1,080,000 916,586 6 years or more 56 28% 765,000 1,040,000 1,331,840 1,135,533 Resource Management
None 34 17% 600,000 760,000 900,007 779,472 1 to 5 years 113 57% 650,000 800,000 1,080,000 940,688 6 years or more 51 26% 800,000 1,000,000 1,460,000 1,124,033
Annualized Salary by Years Worked in Project Management
Years n= Percent 25th Percentile Median 75th Percentile Mean Less than 3 years 14 6% 599,995 725,000 820,000 717,214 3 to less than 5 years 54 23% 600,000 712,500 938,000 826,111 5 to less than 10 years 102 44% 700,000 873,750 1,150,000 963,324 10 to less than 15 years 46 20% 720,000 978,000 1,300,000 1,080,882 15 to less than 20 years 8 3% – – – – 20 or more years 6 3% – – – –

Project Management Salary Survey –Seventh Edition 213
Taiwan – All Respondents
Annualized Salary by Highest Formal Education Level Obtained
Education n= Percent 25th Percentile Median 75th Percentile Mean High school degree 0 * – – – – Some college or Associate's degree
14 6% 650,000 720,000 960,000 870,001
4-year college degree 78 34% 612,000 759,300 940,000 833,351 Master's degree 133 58% 700,000 960,000 1,242,000 1,025,125 Doctoral degree 5 2% – – – –
Annualized Salary by Degree in Project Management
Degree n= Percent 25th Percentile Median 75th Percentile Mean
Have a degree in PM 54 24% 636,000 808,000 1,000,000 907,077 No degree in PM 174 76% 696,000 852,500 1,200,000 976,370
Annualized Salary by PMP® Status
Status n= Percent 25th Percentile Median 75th Percentile Mean
Have a PMP® Certification 207 90% 696,000 840,000 1,150,000 953,771 PMP for less than 1 year 4 2% – – – – PMP for 1 to less than 5 years 171 83% 670,000 800,000 1,050,000 891,594
PMP for 5 to less than 10 years
30 15% 960,000 1,250,000 1,500,000 1,309,267
PMP for 10 to less than 20 years
0 * – – – –
PMP for 20 or more years 0 * – – – – Do not have a PMP®
Certification 23 10% 600,000 800,000 1,260,000 995,217
Annualized Salary by Amount of Training Per Year
Employees n= Percent 25th Percentile Median 75th Percentile Mean Less than 5 days 82 37% 650,000 800,000 999,999 860,820 5 to 9 days 53 24% 700,000 938,000 1,200,000 1,036,465 10 days or more 85 39% 696,000 870,000 1,200,000 1,001,890
Annualized Salary by Gender
Gender n= Percent 25th Percentile Median 75th Percentile Mean Male 176 78% 700,000 873,750 1,200,000 1,001,304 Female 51 22% 599,995 720,000 1,030,000 815,904

Project Management Salary Survey –Seventh Edition 214
Taiwan – All Respondents
Annualized Salary by Department
Department n= Percent 25th Percentile Median 75th Percentile Mean Administration/ General Management
18 8% 705,000 845,000 1,200,000 998,167
Consulting 7 3% – – – – Customer Service/ Public Relations
1 * – – – –
Engineering 21 9% 600,000 696,000 960,000 880,095 Finance 2 1% – – – – Human Resources 3 1% – – – – Information Technology/ Information Systems
45 20% 720,000 840,000 1,034,568 957,241
Operations/Manufacturing 10 4% 600,000 991,000 1,200,000 894,200 Project Management Department or PMO
64 28% 710,000 950,000 1,200,000 1,021,643
Quality Management 6 3% – – – – Research and Development 20 9% 700,000 919,000 1,125,000 977,708 Sales/Marketing 19 8% 691,000 820,000 1,200,000 928,705 Supply Chain Management/Logistics 6 3% – – – –
Training/Education 1 * – – – – Other 3 1% – – – –
Annualized Salary by Industry
Industry n= Percent 25th Percentile Median 75th Percentile Mean
Aerospace 3 1% – – – – Business Services 10 4% 419,999 592,500 800,000 625,200 Construction 11 5% 612,000 900,000 970,000 870,364 Consulting 9 4% – – – – Engineering 34 15% 660,000 1,054,000 1,400,000 1,067,725 Financial Services 17 7% 720,000 800,000 1,080,000 918,153 Food and Beverage 3 1% – – – – Government 7 3% – – – – Healthcare 5 2% – – – – Information Technology 61 27% 700,000 960,000 1,200,000 1,026,873 Insurance 6 3% – – – – Legal 0 * – – – – Manufacturing 38 17% 650,000 760,000 1,050,000 915,132 Pharmaceuticals 4 2% – – – – Real Estate 0 * – – – – Resources (Agriculture, Mining, etc.)
0 * – – – –
Telecommunications 19 8% 670,000 900,000 1,460,000 1,070,211 Training/Education 1 * – – – – Utility 0 * – – – – Other 2 1% – – – –

Project Management Salary Survey –Seventh Edition 215
Taiwan – All Respondents
Annualized by Type of Project
Project Type n= Percent 25th Percentile Median 75th Percentile Mean Business Transformation 30 13% 650,000 800,000 1,100,000 898,634 Construction 23 10% 612,000 900,000 1,150,000 902,877 Engineering 58 26% 650,000 796,000 1,200,000 1,004,324 Information Technology 89 40% 720,000 860,000 1,180,000 1,001,133 Manufacturing 44 20% 676,000 813,000 1,125,000 919,355 Operations 31 14% 665,000 900,000 1,200,000 987,502 Quality Management 27 12% 600,000 840,000 1,150,000 915,852 Regulatory Compliance 9 4% – – – – Research and Development 45 20% 610,000 800,000 1,000,000 874,615 Supply Chain Management/Logistics 17 8% 500,000 650,000 900,000 747,177
Other 8 4% – – – –
Annualized Salary by Number of Employees in Entire Organization
Employees n= Percent 25th Percentile Median 75th Percentile Mean Less than 100 32 14% 650,000 800,000 900,000 760,739 100 to 299 46 20% 600,000 800,000 1,150,000 964,511 300 to 999 35 15% 650,000 820,000 1,200,000 982,176 1,000 to 2,499 20 9% 675,000 827,000 1,075,000 992,100 2,500 to 4,999 27 12% 700,000 1,000,000 1,300,000 1,024,074 5,000 to 9,999 19 8% 670,000 770,000 1,000,000 881,368 10,000 or more 51 22% 700,000 910,000 1,300,000 1,039,122
Annualized Salary by Average Project Team Size
Employees n= Percent 25th Percentile Median 75th Percentile Mean
1-4 people 31 25% 600,000 780,000 900,000 838,081 5-9 people 36 29% 697,200 877,000 1,058,000 984,750 10-14 people 26 21% 750,000 1,097,000 1,300,000 1,086,769 15-19 people 6 5% – – – – 20 or more people 25 20% 800,000 1,200,000 1,670,000 1,271,587
Annualized Salary by Average Project Budget (in USD)
Employees n= Percent 25th Percentile Median 75th Percentile Mean
Less than $100,000 48 26% 600,000 720,000 900,004 781,583 $100,000 to $499,999 50 27% 650,000 845,000 1,000,000 896,648 $500,000 to $999,999 39 21% 750,000 900,000 1,500,000 1,070,513 $1 million to $10 million 28 15% 978,000 1,175,000 1,500,000 1,233,715 More than $10 million 20 11% 586,080 800,002 1,122,000 948,408

Project Management Salary Survey –Seventh Edition 216
Taiwan – All Respondents
Project Management Career Path within Organization
n= Percent Yes - Clearly defined/in writing 39 17% Yes - Informal 84 38% No 83 37% Don't Know 18 8%
Project Management Career Path Connected to Roles in Upper Management
n= Percent Yes - Clearly defined/in writing 35 29% Yes - Informal 67 56% No 14 12% Don't Know 4 3%
Defined Set of Performance Skills for Project Managers within Organization
n= Percent Yes - Clearly defined/in writing 56 25% Yes - Informal 88 40% No 68 31% Don't Know 8 4%
Equities Offered in Past Year by Position Description
Stock Options Stock
(i.e., Shares) Neither n= Percent n= Percent n= Percent
Total 20 9% 20 9% 180 83% Director of Project Management Office (PMO) 1 10% 0 * 9 90% Portfolio Manager 1 11% 1 11% 7 78% Program Manager 2 5% 5 13% 32 82% Project Manager III 1 4% 1 4% 21 91% Project Manager II 9 20% 7 16% 31 69% Project Manager I 3 8% 2 5% 32 86% Project Management Specialist 3 8% 3 8% 34 85% Project Management Consultant 0 * 1 7% 14 93%
Employee Benefits Offered by Position Description
Company
Car/Allowance Cell Phone Usage Paid Life Insurance n= Percent n= Percent n= Percent
Total 40 18% 73 33% 59 27% Director of Project Management Office (PMO) 4 40% 3 30% 3 30% Portfolio Manager 5 56% 5 56% 2 22% Program Manager 4 10% 11 28% 7 18% Project Manager III 4 17% 9 39% 7 30% Project Manager II 7 16% 17 39% 12 27% Project Manager I 5 13% 12 31% 12 31% Project Management Specialist 9 23% 12 30% 11 28% Project Management Consultant 2 13% 4 27% 5 33%

Project Management Salary Survey –Seventh Edition 217
Taiwan – All Respondents
Mean Number of Vacation Days by Position Description
After 1 Year After 10 Years n= Mean n= Mean
Total 214 8.6 188 18.5 Director of Project Management Office (PMO) 8 7.8 10 19.2 Portfolio Manager 9 10.9 7 19.6 Program Manager 39 9.2 33 20.0 Project Manager III 22 8.4 17 19.0 Project Manager II 45 8.7 37 19.8 Project Manager I 38 7.7 33 16.2 Project Management Specialist 38 9.2 36 17.9 Project Management Consultant 15 7.4 15 17.1
Pension Plans Offered by Position Description
Defined Benefit
Plans Defined Contribution
Plans Other Pension
Plans n= Percent n= Percent n= Percent
Total 91 42% 51 24% 34 16% Director of Project Management Office (PMO) 2 20% 2 20% 5 50% Portfolio Manager 4 44% 2 22% 1 11% Program Manager 16 40% 7 18% 4 10% Project Manager III 8 35% 5 22% 7 30% Project Manager II 20 47% 18 42% 4 9% Project Manager I 19 51% 7 19% 6 16% Project Management Specialist 14 35% 7 18% 6 15% Project Management Consultant 8 53% 3 20% 1 7%
Mean Hours Worked by Position Description
Hours Expected Actual Hours
Worked n= Mean n= Mean
Total 205 40.6 197 49.5 Director of Project Management Office (PMO) 10 40.0 10 51.9 Portfolio Manager 8 41.3 7 54.6 Program Manager 38 40.5 36 47.5 Project Manager III 21 40.5 21 52.5 Project Manager II 40 40.8 38 49.8 Project Manager I 37 40.0 36 48.6 Project Management Specialist 37 41.1 36 49.2 Project Management Consultant 14 41.1 13 48.4
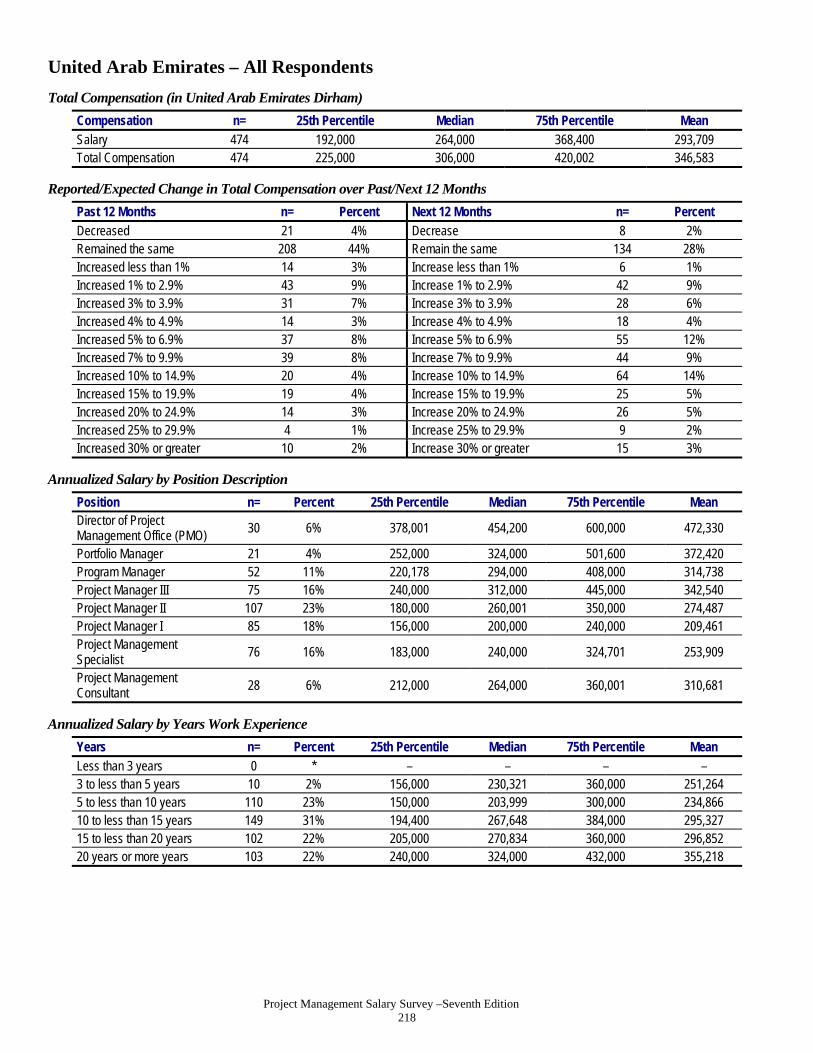
Project Management Salary Survey –Seventh Edition 218
United Arab Emirates – All Respondents
Total Compensation (in United Arab Emirates Dirham)
Compensation n= 25th Percentile Median 75th Percentile Mean Salary 474 192,000 264,000 368,400 293,709 Total Compensation 474 225,000 306,000 420,002 346,583
Reported/Expected Change in Total Compensation over Past/Next 12 Months
Past 12 Months n= Percent Next 12 Months n= Percent Decreased 21 4% Decrease 8 2% Remained the same 208 44% Remain the same 134 28% Increased less than 1% 14 3% Increase less than 1% 6 1% Increased 1% to 2.9% 43 9% Increase 1% to 2.9% 42 9% Increased 3% to 3.9% 31 7% Increase 3% to 3.9% 28 6% Increased 4% to 4.9% 14 3% Increase 4% to 4.9% 18 4% Increased 5% to 6.9% 37 8% Increase 5% to 6.9% 55 12% Increased 7% to 9.9% 39 8% Increase 7% to 9.9% 44 9% Increased 10% to 14.9% 20 4% Increase 10% to 14.9% 64 14% Increased 15% to 19.9% 19 4% Increase 15% to 19.9% 25 5% Increased 20% to 24.9% 14 3% Increase 20% to 24.9% 26 5% Increased 25% to 29.9% 4 1% Increase 25% to 29.9% 9 2% Increased 30% or greater 10 2% Increase 30% or greater 15 3%
Annualized Salary by Position Description
Position n= Percent 25th Percentile Median 75th Percentile Mean Director of Project Management Office (PMO)
30 6% 378,001 454,200 600,000 472,330
Portfolio Manager 21 4% 252,000 324,000 501,600 372,420 Program Manager 52 11% 220,178 294,000 408,000 314,738 Project Manager III 75 16% 240,000 312,000 445,000 342,540 Project Manager II 107 23% 180,000 260,001 350,000 274,487 Project Manager I 85 18% 156,000 200,000 240,000 209,461 Project Management Specialist
76 16% 183,000 240,000 324,701 253,909
Project Management Consultant
28 6% 212,000 264,000 360,001 310,681
Annualized Salary by Years Work Experience
Years n= Percent 25th Percentile Median 75th Percentile Mean
Less than 3 years 0 * – – – – 3 to less than 5 years 10 2% 156,000 230,321 360,000 251,264 5 to less than 10 years 110 23% 150,000 203,999 300,000 234,866 10 to less than 15 years 149 31% 194,400 267,648 384,000 295,327 15 to less than 20 years 102 22% 205,000 270,834 360,000 296,852 20 years or more years 103 22% 240,000 324,000 432,000 355,218

Project Management Salary Survey –Seventh Edition 219
United Arab Emirates – All Respondents
Annualized Salary by Technique Experience
Years n= Percent 25th Percentile Median 75th Percentile Mean Agile Project Management/Scrum
None 256 71% 199,000 275,500 360,000 297,269 1 to 5 years 88 24% 191,000 259,000 390,456 299,610 6 years or more 18 5% 240,000 294,000 448,000 323,356
Extreme Project Management None 197 53% 194,400 264,000 336,000 283,242 1 to 5 years 121 32% 200,000 264,500 370,000 299,087 6 years or more 57 15% 216,000 330,000 480,000 346,932
Process Based Project Management
None 84 21% 183,000 250,000 333,001 271,235 1 to 5 years 198 50% 192,000 264,250 357,000 285,643 6 years or more 112 28% 212,378 307,000 454,200 343,281 Event Chain Project Management
None 244 69% 192,000 254,450 360,000 288,070 1 to 5 years 83 23% 210,000 300,000 396,000 322,716 6 years or more 29 8% 225,000 312,000 452,400 337,391
Interactive Project Management None 135 36% 194,400 264,000 350,000 285,169 1 to 5 years 159 42% 180,000 250,000 360,000 281,516 6 years or more 84 22% 240,000 294,426 454,200 341,563 Incremental Project Management
None 213 58% 186,000 255,150 357,000 284,699 1 to 5 years 104 28% 200,000 264,000 365,000 293,500 6 years or more 51 14% 240,000 354,000 480,000 360,375
Project Portfolio Management None 171 45% 180,000 240,000 330,000 263,963 1 to 5 years 152 40% 204,000 283,500 398,000 316,212 6 years or more 53 14% 240,000 324,000 445,000 337,269

Project Management Salary Survey –Seventh Edition 220
United Arab Emirates – All Respondents
Annualized Salary by Technique Experience (Continued)
Years n= Percent 25th Percentile Median 75th Percentile Mean Program Management
None 130 33% 186,000 240,000 325,000 268,694 1 to 5 years 190 48% 199,999 270,834 372,000 294,424 6 years or more 78 20% 240,000 360,000 480,000 374,828
Earned Value Management None 100 27% 183,000 252,875 360,000 278,123 1 to 5 years 193 51% 198,000 264,000 360,000 292,114 6 years or more 82 22% 240,000 316,001 452,400 341,019
Lean Project Management
None 194 51% 186,000 262,001 360,000 285,754 1 to 5 years 134 35% 199,999 260,000 360,000 289,676 6 years or more 53 14% 238,800 360,000 480,000 359,342 Critical Chain Project Management
None 153 41% 200,000 264,000 350,000 290,948 1 to 5 years 155 42% 180,000 252,000 360,000 280,232 6 years or more 61 17% 225,000 360,000 456,000 364,792
Waterfall Project Management None 236 65% 198,000 268,824 360,000 291,971 1 to 5 years 75 21% 186,000 240,000 370,002 287,692 6 years or more 50 14% 225,000 300,000 480,000 354,527
Risk Management None 72 17% 186,000 240,000 321,700 260,201 1 to 5 years 242 59% 180,000 240,000 360,000 283,955 6 years or more 98 24% 252,000 333,000 448,000 357,572 Change Management
None 69 17% 164,002 250,000 384,000 285,043 1 to 5 years 218 55% 186,000 250,000 360,000 288,360 6 years or more 110 28% 240,000 300,000 426,144 335,031 Resource Management
None 44 11% 192,000 240,000 344,400 278,743 1 to 5 years 196 49% 185,100 252,000 352,000 279,229 6 years or more 160 40% 216,000 300,000 420,000 330,906
Annualized Salary by Years Worked in Project Management
Years n= Percent 25th Percentile Median 75th Percentile Mean Less than 3 years 16 3% 176,664 200,999 283,121 231,157 3 to less than 5 years 91 19% 164,100 216,000 300,000 233,821 5 to less than 10 years 223 47% 192,000 260,000 360,000 287,525 10 to less than 15 years 94 20% 240,000 300,000 445,000 338,170 15 to less than 20 years 36 8% 233,400 288,000 411,000 318,547 20 or more years 14 3% 360,000 462,000 600,000 490,571
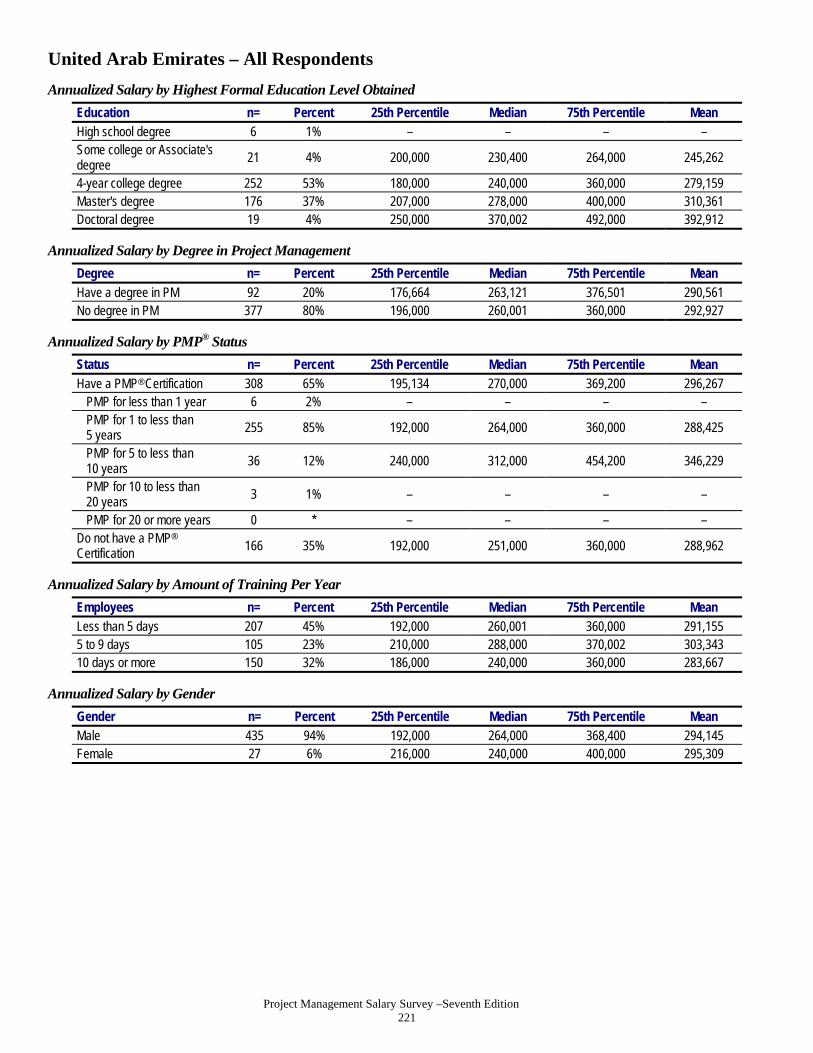
Project Management Salary Survey –Seventh Edition 221
United Arab Emirates – All Respondents
Annualized Salary by Highest Formal Education Level Obtained
Education n= Percent 25th Percentile Median 75th Percentile Mean High school degree 6 1% – – – – Some college or Associate's degree
21 4% 200,000 230,400 264,000 245,262
4-year college degree 252 53% 180,000 240,000 360,000 279,159 Master's degree 176 37% 207,000 278,000 400,000 310,361 Doctoral degree 19 4% 250,000 370,002 492,000 392,912
Annualized Salary by Degree in Project Management
Degree n= Percent 25th Percentile Median 75th Percentile Mean
Have a degree in PM 92 20% 176,664 263,121 376,501 290,561 No degree in PM 377 80% 196,000 260,001 360,000 292,927
Annualized Salary by PMP® Status
Status n= Percent 25th Percentile Median 75th Percentile Mean
Have a PMP® Certification 308 65% 195,134 270,000 369,200 296,267 PMP for less than 1 year 6 2% – – – – PMP for 1 to less than 5 years 255 85% 192,000 264,000 360,000 288,425
PMP for 5 to less than 10 years
36 12% 240,000 312,000 454,200 346,229
PMP for 10 to less than 20 years
3 1% – – – –
PMP for 20 or more years 0 * – – – – Do not have a PMP®
Certification 166 35% 192,000 251,000 360,000 288,962
Annualized Salary by Amount of Training Per Year
Employees n= Percent 25th Percentile Median 75th Percentile Mean Less than 5 days 207 45% 192,000 260,001 360,000 291,155 5 to 9 days 105 23% 210,000 288,000 370,002 303,343 10 days or more 150 32% 186,000 240,000 360,000 283,667
Annualized Salary by Gender
Gender n= Percent 25th Percentile Median 75th Percentile Mean Male 435 94% 192,000 264,000 368,400 294,145 Female 27 6% 216,000 240,000 400,000 295,309
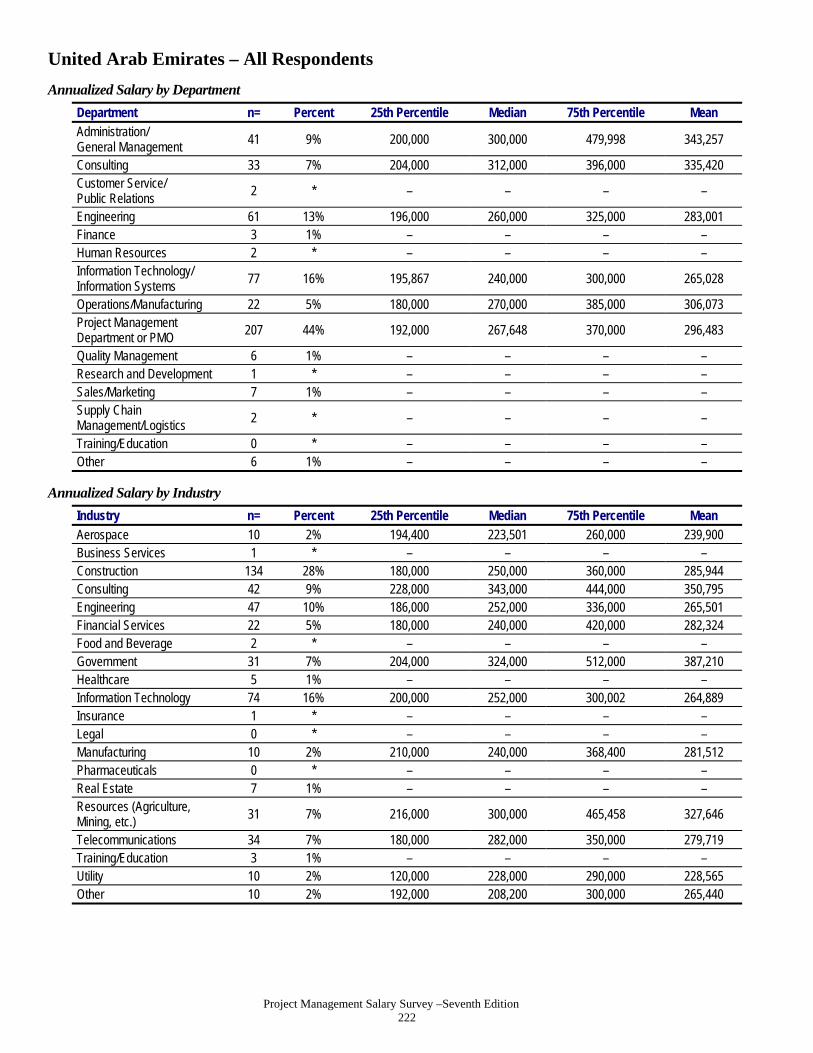
Project Management Salary Survey –Seventh Edition 222
United Arab Emirates – All Respondents
Annualized Salary by Department
Department n= Percent 25th Percentile Median 75th Percentile Mean Administration/ General Management
41 9% 200,000 300,000 479,998 343,257
Consulting 33 7% 204,000 312,000 396,000 335,420 Customer Service/ Public Relations
2 * – – – –
Engineering 61 13% 196,000 260,000 325,000 283,001 Finance 3 1% – – – – Human Resources 2 * – – – – Information Technology/ Information Systems
77 16% 195,867 240,000 300,000 265,028
Operations/Manufacturing 22 5% 180,000 270,000 385,000 306,073 Project Management Department or PMO
207 44% 192,000 267,648 370,000 296,483
Quality Management 6 1% – – – – Research and Development 1 * – – – – Sales/Marketing 7 1% – – – – Supply Chain Management/Logistics 2 * – – – –
Training/Education 0 * – – – – Other 6 1% – – – –
Annualized Salary by Industry
Industry n= Percent 25th Percentile Median 75th Percentile Mean
Aerospace 10 2% 194,400 223,501 260,000 239,900 Business Services 1 * – – – – Construction 134 28% 180,000 250,000 360,000 285,944 Consulting 42 9% 228,000 343,000 444,000 350,795 Engineering 47 10% 186,000 252,000 336,000 265,501 Financial Services 22 5% 180,000 240,000 420,000 282,324 Food and Beverage 2 * – – – – Government 31 7% 204,000 324,000 512,000 387,210 Healthcare 5 1% – – – – Information Technology 74 16% 200,000 252,000 300,002 264,889 Insurance 1 * – – – – Legal 0 * – – – – Manufacturing 10 2% 210,000 240,000 368,400 281,512 Pharmaceuticals 0 * – – – – Real Estate 7 1% – – – – Resources (Agriculture, Mining, etc.)
31 7% 216,000 300,000 465,458 327,646
Telecommunications 34 7% 180,000 282,000 350,000 279,719 Training/Education 3 1% – – – – Utility 10 2% 120,000 228,000 290,000 228,565 Other 10 2% 192,000 208,200 300,000 265,440
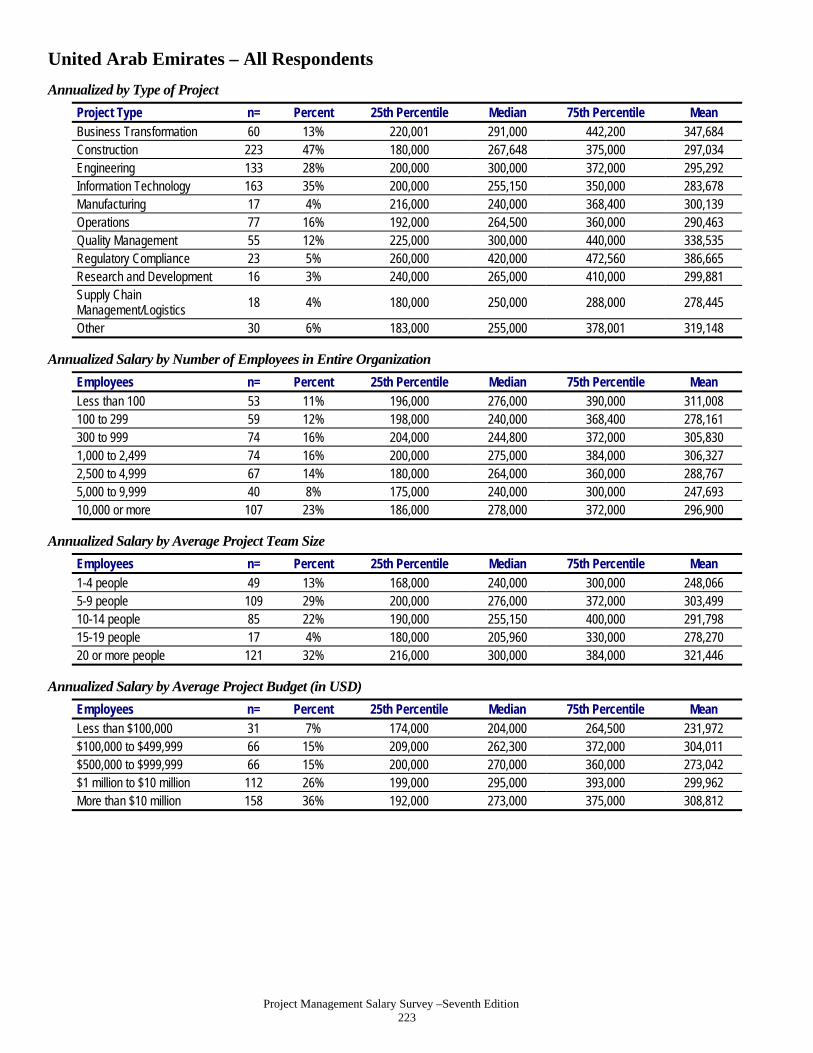
Project Management Salary Survey –Seventh Edition 223
United Arab Emirates – All Respondents
Annualized by Type of Project
Project Type n= Percent 25th Percentile Median 75th Percentile Mean Business Transformation 60 13% 220,001 291,000 442,200 347,684 Construction 223 47% 180,000 267,648 375,000 297,034 Engineering 133 28% 200,000 300,000 372,000 295,292 Information Technology 163 35% 200,000 255,150 350,000 283,678 Manufacturing 17 4% 216,000 240,000 368,400 300,139 Operations 77 16% 192,000 264,500 360,000 290,463 Quality Management 55 12% 225,000 300,000 440,000 338,535 Regulatory Compliance 23 5% 260,000 420,000 472,560 386,665 Research and Development 16 3% 240,000 265,000 410,000 299,881 Supply Chain Management/Logistics 18 4% 180,000 250,000 288,000 278,445
Other 30 6% 183,000 255,000 378,001 319,148
Annualized Salary by Number of Employees in Entire Organization
Employees n= Percent 25th Percentile Median 75th Percentile Mean Less than 100 53 11% 196,000 276,000 390,000 311,008 100 to 299 59 12% 198,000 240,000 368,400 278,161 300 to 999 74 16% 204,000 244,800 372,000 305,830 1,000 to 2,499 74 16% 200,000 275,000 384,000 306,327 2,500 to 4,999 67 14% 180,000 264,000 360,000 288,767 5,000 to 9,999 40 8% 175,000 240,000 300,000 247,693 10,000 or more 107 23% 186,000 278,000 372,000 296,900
Annualized Salary by Average Project Team Size
Employees n= Percent 25th Percentile Median 75th Percentile Mean
1-4 people 49 13% 168,000 240,000 300,000 248,066 5-9 people 109 29% 200,000 276,000 372,000 303,499 10-14 people 85 22% 190,000 255,150 400,000 291,798 15-19 people 17 4% 180,000 205,960 330,000 278,270 20 or more people 121 32% 216,000 300,000 384,000 321,446
Annualized Salary by Average Project Budget (in USD)
Employees n= Percent 25th Percentile Median 75th Percentile Mean
Less than $100,000 31 7% 174,000 204,000 264,500 231,972 $100,000 to $499,999 66 15% 209,000 262,300 372,000 304,011 $500,000 to $999,999 66 15% 200,000 270,000 360,000 273,042 $1 million to $10 million 112 26% 199,000 295,000 393,000 299,962 More than $10 million 158 36% 192,000 273,000 375,000 308,812
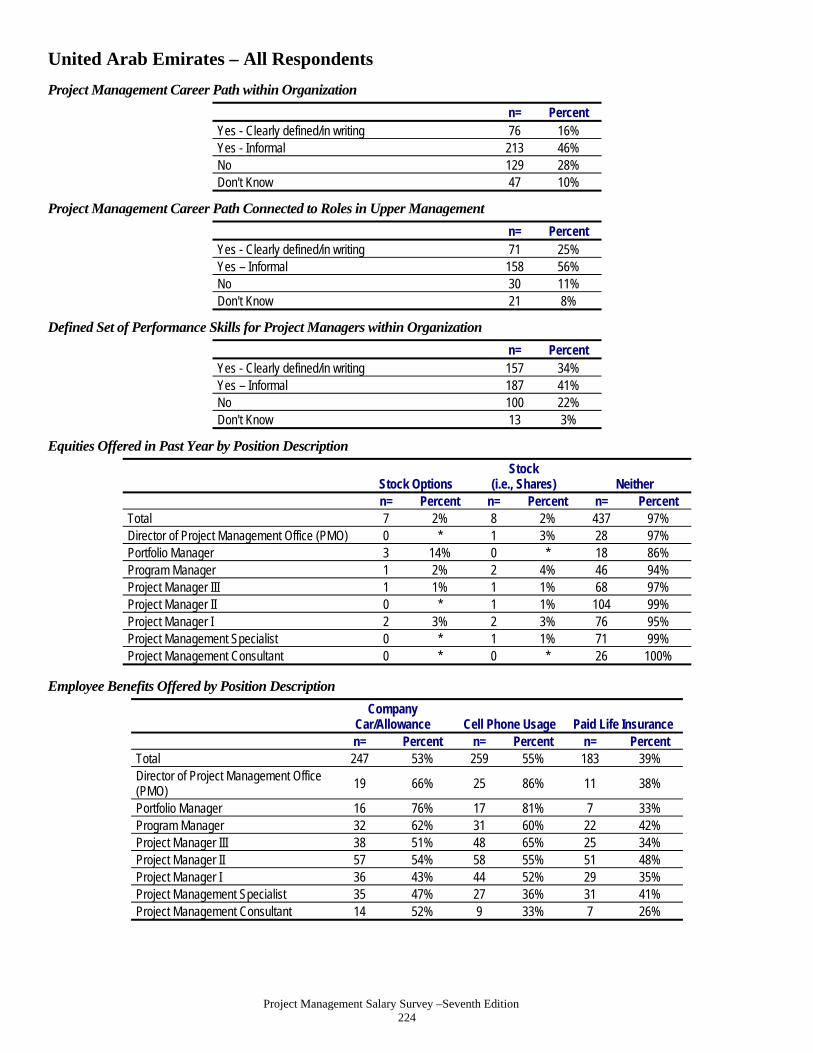
Project Management Salary Survey –Seventh Edition 224
United Arab Emirates – All Respondents
Project Management Career Path within Organization
n= Percent Yes - Clearly defined/in writing 76 16% Yes - Informal 213 46% No 129 28% Don't Know 47 10%
Project Management Career Path Connected to Roles in Upper Management
n= Percent Yes - Clearly defined/in writing 71 25% Yes – Informal 158 56% No 30 11% Don't Know 21 8%
Defined Set of Performance Skills for Project Managers within Organization
n= Percent Yes - Clearly defined/in writing 157 34% Yes – Informal 187 41% No 100 22% Don't Know 13 3%
Equities Offered in Past Year by Position Description
Stock Options Stock
(i.e., Shares) Neither n= Percent n= Percent n= Percent
Total 7 2% 8 2% 437 97% Director of Project Management Office (PMO) 0 * 1 3% 28 97% Portfolio Manager 3 14% 0 * 18 86% Program Manager 1 2% 2 4% 46 94% Project Manager III 1 1% 1 1% 68 97% Project Manager II 0 * 1 1% 104 99% Project Manager I 2 3% 2 3% 76 95% Project Management Specialist 0 * 1 1% 71 99% Project Management Consultant 0 * 0 * 26 100%
Employee Benefits Offered by Position Description
Company
Car/Allowance Cell Phone Usage Paid Life Insurance n= Percent n= Percent n= Percent
Total 247 53% 259 55% 183 39% Director of Project Management Office (PMO)
19 66% 25 86% 11 38%
Portfolio Manager 16 76% 17 81% 7 33% Program Manager 32 62% 31 60% 22 42% Project Manager III 38 51% 48 65% 25 34% Project Manager II 57 54% 58 55% 51 48% Project Manager I 36 43% 44 52% 29 35% Project Management Specialist 35 47% 27 36% 31 41% Project Management Consultant 14 52% 9 33% 7 26%

Project Management Salary Survey –Seventh Edition 225
United Arab Emirates – All Respondents
Mean Number of Vacation Days by Position Description
After 1 Year After 10 Years n= Mean n= Mean
Total 467 28.6 309 30.0 Director of Project Management Office (PMO) 28 26.9 27 28.5 Portfolio Manager 20 28.3 17 30.1 Program Manager 51 29.6 34 31.2 Project Manager III 73 28.5 49 30.2 Project Manager II 107 29.1 73 30.5 Project Manager I 85 28.4 55 29.9 Project Management Specialist 75 28.6 35 29.0 Project Management Consultant 28 28.3 19 29.3
Pension Plans Offered by Position Description
Defined Benefit
Plans Defined
Contribution Plans Other Pension
Plans n= Percent n= Percent n= Percent
Total 88 19% 32 7% 28 6% Director of Project Management Office (PMO) 7 24% 3 10% 1 3% Portfolio Manager 3 16% 0 * 2 11% Program Manager 6 12% 1 2% 3 6% Project Manager III 17 24% 8 11% 10 14% Project Manager II 23 22% 11 11% 2 2% Project Manager I 14 17% 4 5% 5 6% Project Management Specialist 15 21% 2 3% 3 4% Project Management Consultant 3 11% 3 11% 2 7%
Mean Hours Worked by Position Description
Hours Expected Actual Hours
Worked n= Mean n= Mean
Total 428 43.6 423 50.4 Director of Project Management Office (PMO) 26 42.6 25 51.4 Portfolio Manager 21 42.9 21 50.2 Program Manager 47 42.8 48 50.8 Project Manager III 67 43.2 68 51.4 Project Manager II 93 43.6 93 50.3 Project Manager I 77 44.1 74 50.7 Project Management Specialist 69 44.3 67 48.5 Project Management Consultant 28 44.4 27 50.4
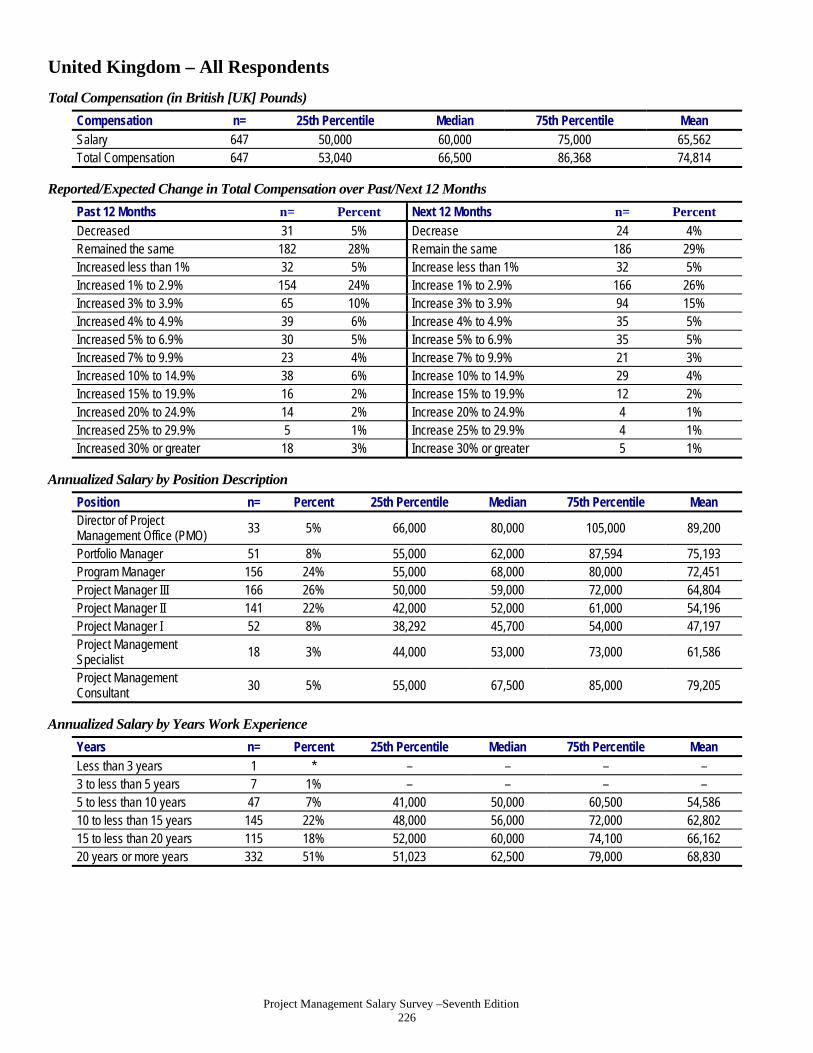
Project Management Salary Survey –Seventh Edition 226
United Kingdom – All Respondents
Total Compensation (in British [UK] Pounds)
Compensation n= 25th Percentile Median 75th Percentile Mean Salary 647 50,000 60,000 75,000 65,562 Total Compensation 647 53,040 66,500 86,368 74,814
Reported/Expected Change in Total Compensation over Past/Next 12 Months
Past 12 Months n= Percent Next 12 Months n= Percent
Decreased 31 5% Decrease 24 4% Remained the same 182 28% Remain the same 186 29% Increased less than 1% 32 5% Increase less than 1% 32 5% Increased 1% to 2.9% 154 24% Increase 1% to 2.9% 166 26% Increased 3% to 3.9% 65 10% Increase 3% to 3.9% 94 15% Increased 4% to 4.9% 39 6% Increase 4% to 4.9% 35 5% Increased 5% to 6.9% 30 5% Increase 5% to 6.9% 35 5% Increased 7% to 9.9% 23 4% Increase 7% to 9.9% 21 3% Increased 10% to 14.9% 38 6% Increase 10% to 14.9% 29 4% Increased 15% to 19.9% 16 2% Increase 15% to 19.9% 12 2% Increased 20% to 24.9% 14 2% Increase 20% to 24.9% 4 1% Increased 25% to 29.9% 5 1% Increase 25% to 29.9% 4 1% Increased 30% or greater 18 3% Increase 30% or greater 5 1%
Annualized Salary by Position Description
Position n= Percent 25th Percentile Median 75th Percentile Mean Director of Project Management Office (PMO) 33 5% 66,000 80,000 105,000 89,200
Portfolio Manager 51 8% 55,000 62,000 87,594 75,193 Program Manager 156 24% 55,000 68,000 80,000 72,451 Project Manager III 166 26% 50,000 59,000 72,000 64,804 Project Manager II 141 22% 42,000 52,000 61,000 54,196 Project Manager I 52 8% 38,292 45,700 54,000 47,197 Project Management Specialist
18 3% 44,000 53,000 73,000 61,586
Project Management Consultant 30 5% 55,000 67,500 85,000 79,205
Annualized Salary by Years Work Experience
Years n= Percent 25th Percentile Median 75th Percentile Mean Less than 3 years 1 * – – – – 3 to less than 5 years 7 1% – – – – 5 to less than 10 years 47 7% 41,000 50,000 60,500 54,586 10 to less than 15 years 145 22% 48,000 56,000 72,000 62,802 15 to less than 20 years 115 18% 52,000 60,000 74,100 66,162 20 years or more years 332 51% 51,023 62,500 79,000 68,830

Project Management Salary Survey –Seventh Edition 227
United Kingdom – All Respondents
Annualized Salary by Technique Experience
Years n= Percent 25th Percentile Median 75th Percentile Mean Agile Project Management/Scrum
None 355 60% 45,667 56,000 71,000 60,921 1 to 5 years 205 35% 52,000 64,500 80,000 70,625 6 years or more 33 6% 55,000 73,000 95,000 81,812
Extreme Project Management None 453 77% 48,800 59,000 73,000 63,344 1 to 5 years 90 15% 51,000 65,000 82,950 74,583 6 years or more 44 7% 52,000 59,000 79,500 68,012
Process Based Project Management
None 143 24% 50,000 60,000 75,000 65,180 1 to 5 years 204 34% 45,000 55,000 70,000 60,206 6 years or more 251 42% 52,000 62,466 79,000 69,903 Event Chain Project Management
None 438 76% 49,674 59,100 73,000 63,306 1 to 5 years 87 15% 50,000 60,000 78,000 70,347 6 years or more 52 9% 51,675 69,500 88,000 77,321
Interactive Project Management None 336 58% 49,690 60,000 75,000 64,295 1 to 5 years 129 22% 45,000 57,400 70,000 63,046 6 years or more 119 20% 52,400 62,500 80,000 71,574 Incremental Project Management
None 350 60% 48,000 57,625 72,000 62,408 1 to 5 years 127 22% 46,000 60,000 76,000 67,058 6 years or more 103 18% 55,000 67,500 84,000 73,959
Project Portfolio Management None 201 34% 42,500 52,000 63,000 56,160 1 to 5 years 236 40% 51,875 60,000 75,000 64,711 6 years or more 156 26% 58,500 74,000 94,237 80,242

Project Management Salary Survey –Seventh Edition 228
United Kingdom – All Respondents
Annualized Salary by Technique Experience (Continued)
Years n= Percent 25th Percentile Median 75th Percentile Mean Program Management
None 126 21% 40,056 49,850 60,000 51,393 1 to 5 years 285 46% 50,000 58,000 70,000 61,913 6 years or more 202 33% 58,000 75,000 93,000 80,089
Earned Value Management None 175 29% 45,000 55,000 70,000 58,922 1 to 5 years 283 47% 50,000 60,000 76,000 66,180 6 years or more 140 23% 53,000 64,445 84,500 72,912
Lean Project Management
None 341 59% 47,000 57,065 72,000 61,721 1 to 5 years 177 31% 52,000 62,000 76,000 67,310 6 years or more 61 11% 50,000 62,466 90,000 79,575 Critical Chain Project Management
None 331 56% 50,000 59,200 72,500 63,063 1 to 5 years 159 27% 46,000 57,500 76,000 65,483 6 years or more 96 16% 53,225 62,500 80,416 73,765
Waterfall Project Management None 200 33% 44,000 55,000 65,000 57,023 1 to 5 years 125 21% 45,000 55,000 71,700 64,078 6 years or more 279 46% 54,790 67,500 82,500 72,556
Risk Management None 46 7% 43,800 49,575 60,000 52,769 1 to 5 years 222 36% 44,000 55,000 69,500 60,259 6 years or more 356 57% 53,000 63,695 80,000 70,418 Change Management
None 54 9% 47,000 55,000 71,500 58,523 1 to 5 years 217 35% 44,000 55,000 70,000 61,310 6 years or more 344 56% 52,751 63,000 80,000 70,102 Resource Management
None 48 8% 45,250 58,600 71,000 59,101 1 to 5 years 209 34% 42,000 53,500 63,000 57,345 6 years or more 350 58% 53,000 65,000 80,000 71,780
Annualized Salary by Years Worked in Project Management
Years n= Percent 25th Percentile Median 75th Percentile Mean Less than 3 years 13 2% 35,000 41,000 45,100 42,358 3 to less than 5 years 51 8% 41,000 48,000 57,500 51,571 5 to less than 10 years 225 35% 45,000 54,000 67,000 58,897 10 to less than 15 years 176 27% 52,200 62,000 76,295 69,672 15 to less than 20 years 97 15% 55,790 69,000 85,000 71,154 20 or more years 85 13% 60,000 75,000 90,000 80,260

Project Management Salary Survey –Seventh Edition 229
United Kingdom – All Respondents
Annualized Salary by Highest Formal Education Level Obtained
Education n= Percent 25th Percentile Median 75th Percentile Mean High school degree 52 8% 50,500 58,021 69,000 59,859 Some college or Associate's degree
79 12% 47,500 60,000 78,000 66,796
4-year college degree 263 41% 49,000 60,000 75,000 64,475 Master's degree 211 33% 50,000 60,000 76,000 67,664 Doctoral degree 42 6% 52,500 61,000 73,000 66,558
Annualized Salary by Degree in Project Management
Degree n= Percent 25th Percentile Median 75th Percentile Mean
Have a degree in PM 72 11% 50,000 58,875 72,500 67,338 No degree in PM 573 89% 50,000 60,000 75,000 65,385
Annualized Salary by PMP® Status
Status n= Percent 25th Percentile Median 75th Percentile Mean
Have a PMP® Certification 477 74% 51,000 60,000 76,000 66,626 PMP for less than 1 year 8 2% – – – – PMP for 1 to less than 5 years 333 70% 49,674 59,000 73,000 64,288
PMP for 5 to less than 10 years
109 23% 55,000 68,500 80,000 73,952
PMP for 10 to less than 20 years
24 5% 58,133 65,250 80,000 69,792
PMP for 20 or more years 0 * – – – – Do not have a PMP®
Certification 170 26% 42,000 55,000 70,000 62,578
Annualized Salary by Amount of Training Per Year
Employees n= Percent 25th Percentile Median 75th Percentile Mean Less than 5 days 277 43% 49,674 60,000 75,000 65,124 5 to 9 days 228 35% 51,000 60,000 75,000 65,703 10 days or more 140 22% 45,425 59,000 77,000 66,245
Annualized Salary by Gender
Gender n= Percent 25th Percentile Median 75th Percentile Mean Male 510 81% 50,000 60,000 75,000 66,265 Female 121 19% 45,450 55,000 72,000 62,186

Project Management Salary Survey –Seventh Edition 230
United Kingdom – All Respondents
Annualized Salary by Department
Department n= Percent 25th Percentile Median 75th Percentile Mean Administration/ General Management
19 3% 50,000 57,000 72,000 63,714
Consulting 58 9% 52,915 71,000 98,000 77,908 Customer Service/ Public Relations
4 1% – – – –
Engineering 31 5% 41,000 48,000 62,000 54,534 Finance 15 2% 60,000 67,000 99,000 79,443 Human Resources 1 * – – – – Information Technology/ Information Systems
208 32% 50,250 59,980 76,500 65,781
Operations/Manufacturing 17 3% 53,500 62,000 86,000 73,095 Project Management Department or PMO
233 36% 47,904 59,200 72,000 63,320
Quality Management 2 * – – – – Research and Development 32 5% 45,700 57,500 74,000 60,537 Sales/Marketing 3 * – – – – Supply Chain Management/Logistics 9 1% – – – –
Training/Education 3 * – – – – Other 9 1% – – – –
Annualized Salary by Industry
Industry n= Percent 25th Percentile Median 75th Percentile Mean
Aerospace 6 1% – – – – Business Services 7 1% – – – – Construction 12 2% 41,390 58,500 68,000 63,565 Consulting 37 6% 59,000 75,300 90,000 78,430 Engineering 26 4% 45,000 51,000 71,000 56,702 Financial Services 86 13% 55,000 70,000 92,000 77,765 Food and Beverage 1 * – – – – Government 8 1% – – – – Healthcare 12 2% 45,000 52,340 70,000 59,790 Information Technology 235 36% 49,000 55,790 70,000 61,139 Insurance 12 2% 42,500 53,500 88,250 63,667 Legal 2 * – – – – Manufacturing 34 5% 43,500 59,500 74,000 59,464 Pharmaceuticals 21 3% 52,500 56,000 63,000 57,899 Real Estate 2 * – – – – Resources (Agriculture, Mining, etc.)
43 7% 60,000 73,000 90,000 80,092
Telecommunications 69 11% 52,000 62,000 75,000 66,232 Training/Education 6 1% – – – – Utility 11 2% 47,500 63,000 65,000 61,727 Other 17 3% 45,100 55,000 60,000 59,894

Project Management Salary Survey –Seventh Edition 231
United Kingdom – All Respondents
Annualized by Type of Project
Project Type n= Percent 25th Percentile Median 75th Percentile Mean Business Transformation 208 32% 54,000 68,000 84,500 74,643 Construction 40 6% 43,250 56,000 68,000 63,927 Engineering 75 12% 45,000 55,000 72,000 61,142 Information Technology 468 72% 50,000 60,000 75,250 67,076 Manufacturing 28 4% 43,000 55,460 62,500 55,120 Operations 125 19% 51,000 60,000 76,000 68,675 Quality Management 42 7% 51,000 68,500 90,000 77,122 Regulatory Compliance 53 8% 57,065 78,000 110,000 86,567 Research and Development 67 10% 49,000 61,000 73,000 63,293 Supply Chain Management/Logistics 52 8% 52,200 62,625 71,850 66,936
Other 34 5% 48,000 59,000 70,000 67,660
Annualized Salary by Number of Employees in Entire Organization
Employees n= Percent 25th Percentile Median 75th Percentile Mean Less than 100 36 6% 46,700 62,500 95,000 75,222 100 to 299 22 3% 52,000 69,750 95,000 75,356 300 to 999 45 7% 46,000 55,000 67,300 60,066 1,000 to 2,499 43 7% 51,000 60,000 78,500 65,760 2,500 to 4,999 45 7% 45,000 53,500 70,000 60,886 5,000 to 9,999 41 6% 57,000 65,000 80,130 70,082 10,000 or more 415 64% 50,000 60,000 74,000 64,841
Annualized Salary by Average Project Team Size
Employees n= Percent 25th Percentile Median 75th Percentile Mean
1-4 people 48 9% 45,550 53,000 65,000 58,660 5-9 people 166 30% 45,000 56,250 72,000 61,340 10-14 people 122 22% 49,674 59,750 75,000 64,048 15-19 people 42 8% 51,046 67,650 90,000 73,807 20 or more people 177 32% 54,000 63,500 79,000 72,190
Annualized Salary by Average Project Budget (in USD)
Employees n= Percent 25th Percentile Median 75th Percentile Mean
Less than $100,000 31 5% 45,000 50,000 62,250 53,465 $100,000 to $499,999 124 21% 43,650 53,000 64,250 55,578 $500,000 to $999,999 94 16% 45,000 55,500 70,955 63,622 $1 million to $10 million 263 44% 53,000 62,500 80,000 69,435 More than $10 million 83 14% 55,000 65,000 89,000 77,307

Project Management Salary Survey –Seventh Edition 232
United Kingdom – All Respondents
Project Management Career Path within Organization
n= Percent Yes - Clearly defined/in writing 236 36% Yes - Informal 249 38% No 142 22% Don't Know 20 3%
Project Management Career Path Connected to Roles in Upper Management
n= Percent Yes - Clearly defined/in writing 143 30% Yes - Informal 216 45% No 94 19% Don't Know 30 6%
Defined Set of Performance Skills for Project Managers within Organization
n= Percent Yes - Clearly defined/in writing 387 60% Yes - Informal 149 23% No 90 14% Don't Know 20 3%
Equities Offered in Past Year by Position Description
Stock Options Stock
(i.e., Shares) Neither n= Percent n= Percent n= Percent
Total 84 13% 81 13% 497 78% Director of Project Management Office (PMO) 3 9% 6 18% 25 76% Portfolio Manager 11 22% 6 12% 35 69% Program Manager 26 17% 28 18% 109 72% Project Manager III 20 12% 15 9% 134 81% Project Manager II 15 11% 15 11% 113 81% Project Manager I 3 6% 7 14% 42 82% Project Management Specialist 2 11% 1 6% 15 83% Project Management Consultant 4 13% 3 10% 24 80%
Employee Benefits Offered by Position Description
Company
Car/Allowance Cell Phone Usage Paid Life Insurance
n= Percent n= Percent n= Percent Total 317 50% 391 61% 316 50% Director of Project Management Office (PMO) 18 56% 25 78% 17 53% Portfolio Manager 31 62% 33 66% 28 56% Program Manager 95 61% 106 68% 83 54% Project Manager III 79 48% 92 56% 80 49% Project Manager II 54 39% 85 61% 67 48% Project Manager I 17 34% 23 46% 21 42% Project Management Specialist 8 44% 11 61% 10 56% Project Management Consultant 15 50% 16 53% 10 33%
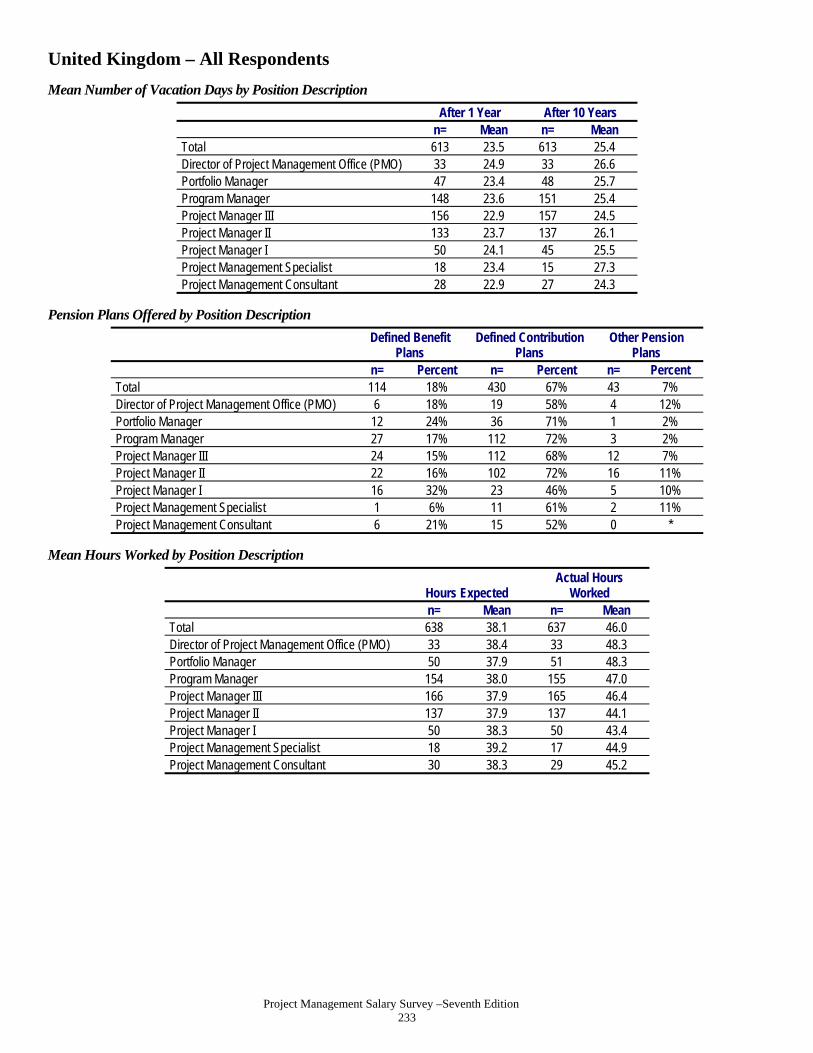
Project Management Salary Survey –Seventh Edition 233
United Kingdom – All Respondents
Mean Number of Vacation Days by Position Description
After 1 Year After 10 Years n= Mean n= Mean
Total 613 23.5 613 25.4 Director of Project Management Office (PMO) 33 24.9 33 26.6 Portfolio Manager 47 23.4 48 25.7 Program Manager 148 23.6 151 25.4 Project Manager III 156 22.9 157 24.5 Project Manager II 133 23.7 137 26.1 Project Manager I 50 24.1 45 25.5 Project Management Specialist 18 23.4 15 27.3 Project Management Consultant 28 22.9 27 24.3
Pension Plans Offered by Position Description
Defined Benefit
Plans Defined Contribution
Plans Other Pension
Plans n= Percent n= Percent n= Percent
Total 114 18% 430 67% 43 7% Director of Project Management Office (PMO) 6 18% 19 58% 4 12% Portfolio Manager 12 24% 36 71% 1 2% Program Manager 27 17% 112 72% 3 2% Project Manager III 24 15% 112 68% 12 7% Project Manager II 22 16% 102 72% 16 11% Project Manager I 16 32% 23 46% 5 10% Project Management Specialist 1 6% 11 61% 2 11% Project Management Consultant 6 21% 15 52% 0 *
Mean Hours Worked by Position Description
Hours Expected Actual Hours
Worked n= Mean n= Mean
Total 638 38.1 637 46.0 Director of Project Management Office (PMO) 33 38.4 33 48.3 Portfolio Manager 50 37.9 51 48.3 Program Manager 154 38.0 155 47.0 Project Manager III 166 37.9 165 46.4 Project Manager II 137 37.9 137 44.1 Project Manager I 50 38.3 50 43.4 Project Management Specialist 18 39.2 17 44.9 Project Management Consultant 30 38.3 29 45.2

Project Management Salary Survey –Seventh Edition 234
United States – All Respondents
Total Compensation (in United States Dollars)
Compensation n= 25th Percentile Median 75th Percentile Mean Salary 13,572 87,000 105,000 125,000 108,830 Total Compensation 13,572 91,500 112,000 139,000 120,023
Reported/Expected Change in Total Compensation over Past/Next 12 Months
Past 12 Months n= Percent Next 12 Months n= Percent Decreased 631 5% Decrease 321 2% Remained the same 3,012 22% Remain the same 3,003 22% Increased less than 1% 349 3% Increase less than 1% 393 3% Increased 1% to 2.9% 3,146 23% Increase 1% to 2.9% 3,271 24% Increased 3% to 3.9% 2,394 18% Increase 3% to 3.9% 3,014 22% Increased 4% to 4.9% 956 7% Increase 4% to 4.9% 1,065 8% Increased 5% to 6.9% 944 7% Increase 5% to 6.9% 1,141 8% Increased 7% to 9.9% 615 5% Increase 7% to 9.9% 425 3% Increased 10% to 14.9% 730 5% Increase 10% to 14.9% 564 4% Increased 15% to 19.9% 251 2% Increase 15% to 19.9% 142 1% Increased 20% to 24.9% 170 1% Increase 20% to 24.9% 91 1% Increased 25% to 29.9% 88 1% Increase 25% to 29.9% 38 * Increased 30% or greater 286 2% Increase 30% or greater 104 1%
Annualized Salary by Position Description
Position n= Percent 25th Percentile Median 75th Percentile Mean Director of Project Management Office (PMO)
776 6% 105,000 127,000 151,000 132,772
Portfolio Manager 847 6% 101,000 125,000 151,000 130,752 Program Manager 3,325 24% 97,000 115,000 135,000 118,319 Project Manager III 3,806 28% 89,000 102,500 120,000 105,929 Project Manager II 2,224 16% 78,000 92,975 110,000 95,210 Project Manager I 1,177 9% 70,050 87,000 105,000 88,616 Project Management Specialist
529 4% 68,775 87,000 105,000 89,525
Project Management Consultant
888 7% 88,000 108,546 135,000 116,302
Annualized Salary by Years Work Experience
Years n= Percent 25th Percentile Median 75th Percentile Mean Less than 3 years 80 1% 57,250 67,950 98,500 76,767 3 to less than 5 years 150 1% 59,000 70,000 85,000 74,959 5 to less than 10 years 1,093 8% 70,000 83,000 96,500 85,268 10 to less than 15 years 2,313 17% 80,000 96,000 115,000 99,475 15 to less than 20 years 2,248 17% 88,200 105,000 125,000 108,660 20 years or more years 7,688 57% 94,000 110,000 133,000 116,038

Project Management Salary Survey –Seventh Edition 235
United States – All Respondents
Annualized Salary by Technique Experience
Years n= Percent 25th Percentile Median 75th Percentile Mean Agile Project Management/Scrum
None 7,154 57% 85,000 101,000 123,000 106,329 1 to 5 years 4,409 35% 90,000 106,000 126,000 110,544 6 years or more 964 8% 97,000 113,000 140,000 119,812
Extreme Project Management None 8,931 72% 85,000 102,500 124,000 107,100 1 to 5 years 2,204 18% 87,000 105,000 125,000 109,160 6 years or more 1,214 10% 96,000 115,000 138,000 119,919
Process Based Project Management
None 2,936 23% 85,000 103,000 125,000 106,924 1 to 5 years 4,424 35% 80,000 98,000 120,000 101,715 6 years or more 5,259 42% 94,000 110,000 131,466 115,691 Event Chain Project Management
None 8,661 70% 86,000 103,764 125,000 107,788 1 to 5 years 2,234 18% 84,000 101,000 124,000 106,778 6 years or more 1,404 11% 95,000 110,000 135,000 117,237
Interactive Project Management None 5,717 46% 86,000 103,408 125,000 107,694 1 to 5 years 3,341 27% 80,000 99,000 120,000 102,492 6 years or more 3,340 27% 93,905 110,000 135,000 116,775 Incremental Project Management
None 6,298 51% 85,000 102,000 123,000 106,591 1 to 5 years 3,229 26% 83,000 100,000 120,000 103,745 6 years or more 2,836 23% 95,710 113,328 137,000 119,085
Project Portfolio Management None 4,334 34% 80,000 95,000 112,014 98,312 1 to 5 years 4,790 38% 87,000 105,000 125,000 107,895 6 years or more 3,464 28% 100,000 120,000 140,598 123,968

Project Management Salary Survey –Seventh Edition 236
United States – All Respondents
Annualized Salary by Technique Experience (Continued)
Years n= Percent 25th Percentile Median 75th Percentile Mean Program Management
None 2,678 21% 75,000 91,000 107,000 93,247 1 to 5 years 5,190 41% 85,000 100,359 120,000 104,114 6 years or more 4,923 38% 100,000 119,000 140,000 122,980
Earned Value Management None 4,608 37% 81,000 98,000 117,000 101,233 1 to 5 years 5,154 41% 87,000 104,500 125,000 108,321 6 years or more 2,842 23% 100,000 117,743 140,000 122,778
Lean Project Management
None 6,656 53% 85,000 102,000 123,642 106,705 1 to 5 years 4,057 33% 87,000 104,500 125,000 108,428 6 years or more 1,744 14% 95,000 111,000 135,000 117,472 Critical Chain Project Management
None 6,564 53% 85,205 103,000 124,050 107,346 1 to 5 years 3,501 28% 83,710 100,300 121,350 105,338 6 years or more 2,309 19% 95,000 111,000 135,000 117,969
Waterfall Project Management None 4,707 37% 81,000 99,750 120,000 103,273 1 to 5 years 3,000 24% 82,000 99,993 120,000 103,368 6 years or more 4,910 39% 96,000 112,000 133,000 117,658
Risk Management None 1,324 10% 75,000 90,250 110,000 95,334 1 to 5 years 5,052 40% 80,000 97,000 115,596 100,180 6 years or more 6,409 50% 96,000 113,000 135,000 118,589 Change Management
None 1,309 10% 77,250 94,000 115,000 98,400 1 to 5 years 4,536 35% 80,000 95,267 115,000 99,532 6 years or more 6,947 54% 95,000 111,000 133,000 117,056 Resource Management
None 1,334 10% 76,000 92,000 110,000 95,205 1 to 5 years 4,506 35% 80,000 95,000 113,250 98,592 6 years or more 6,875 54% 95,000 113,000 135,000 118,213
Annualized Salary by Years Worked in Project Management
Years n= Percent 25th Percentile Median 75th Percentile Mean Less than 3 years 470 3% 62,000 78,950 93,000 79,944 3 to less than 5 years 1,146 8% 70,000 85,000 101,000 87,662 5 to less than 10 years 4,129 30% 81,000 97,000 115,000 100,005 10 to less than 15 years 3,699 27% 92,000 108,000 127,120 111,690 15 to less than 20 years 2,206 16% 98,000 116,000 138,000 121,165 20 or more years 1,922 14% 102,000 120,000 145,000 127,809

Project Management Salary Survey –Seventh Edition 237
United States – All Respondents
Annualized Salary by Highest Formal Education Level Obtained
Education n= Percent 25th Percentile Median 75th Percentile Mean High school degree 135 1% 82,000 98,000 116,000 101,458 Some college or Associate's degree
1,222 9% 80,000 97,000 116,000 100,740
4-year college degree 5,778 43% 85,000 101,000 120,706 105,454 Master's degree 6,120 45% 90,000 108,528 130,000 112,912 Doctoral degree 317 2% 100,000 120,000 145,000 125,870
Annualized Salary by Degree in Project Management
Degree n= Percent 25th Percentile Median 75th Percentile Mean
Have a degree in PM 1,425 11% 85,000 104,600 125,548 107,908 No degree in PM 12,077 89% 87,000 105,000 125,000 108,971
Annualized Salary by PMP® Status
Status n= Percent 25th Percentile Median 75th Percentile Mean Have a PMP® Certification 10,668 79% 90,000 107,000 128,232 111,824 PMP for less than 1 year
205 2% 80,000 95,400 113,000 99,237
PMP for 1 to less than 5 years
6,394 60% 86,000 102,500 123,000 107,304
PMP for 5 to less than 10 years 3,307 31% 97,000 113,000 135,000 118,625
PMP for 10 to less than 20 years
717 7% 100,000 120,000 140,000 124,610
PMP for 20 or more years 11 * 100,000 102,000 135,000 117,205 Do not have a PMP®
Certification 2,904 21% 74,500 92,465 115,000 97,829
Annualized Salary by Amount of Training Per Year
Employees n= Percent 25th Percentile Median 75th Percentile Mean
Less than 5 days 5,433 40% 87,000 103,441 125,000 108,455 5 to 9 days 4,484 33% 90,000 107,000 129,000 110,991 10 days or more 3,522 26% 84,560 102,000 124,000 106,750
Annualized Salary by Gender
Gender n= Percent 25th Percentile Median 75th Percentile Mean Male 8,382 63% 90,000 108,000 130,000 112,486 Female 4,885 37% 82,000 100,000 119,219 102,566

Project Management Salary Survey –Seventh Edition 238
United States – All Respondents
Annualized Salary by Department
Department n= Percent 25th Percentile Median 75th Percentile Mean Administration/ General Management
731 5% 80,000 105,000 133,000 110,350
Consulting 1,208 9% 97,380 120,000 145,000 124,208 Customer Service/ Public Relations
123 1% 71,000 89,000 110,000 93,719
Engineering 954 7% 88,400 106,000 125,000 109,204 Finance 244 2% 80,000 102,000 120,000 105,367 Human Resources 84 1% 85,500 102,000 125,000 104,352 Information Technology/ Information Systems
4,071 30% 88,000 104,000 124,000 107,795
Operations/Manufacturing 539 4% 80,000 96,000 120,000 101,072 Project Management Department or PMO
4,066 30% 87,000 104,000 125,000 107,896
Quality Management 170 1% 81,250 99,000 121,700 103,127 Research and Development 389 3% 89,000 109,000 128,000 110,308 Sales/Marketing 347 3% 80,000 100,000 124,000 104,104 Supply Chain Management/Logistics 187 1% 87,000 99,500 120,000 103,732
Training/Education 89 1% 79,000 96,000 115,000 99,573 Other 311 2% 82,500 100,966 119,400 104,412
Annualized Salary by Industry
Industry n= Percent 25th Percentile Median 75th Percentile Mean
Aerospace 448 3% 93,000 110,000 130,000 113,593 Business Services 212 2% 75,000 92,900 115,000 97,696 Construction 325 2% 80,000 97,000 123,000 103,076 Consulting 1,182 9% 98,000 120,000 148,000 126,420 Engineering 787 6% 90,000 110,000 130,000 112,771 Financial Services 1,144 8% 86,000 102,000 121,000 106,403 Food and Beverage 111 1% 88,000 103,000 130,000 109,297 Government 1,409 10% 87,636 108,000 130,000 110,939 Healthcare 995 7% 84,000 99,500 115,039 102,335 Information Technology 3,046 22% 87,000 104,000 125,000 108,047 Insurance 450 3% 83,000 97,075 113,000 99,128 Legal 42 * 84,000 96,500 115,000 103,404 Manufacturing 952 7% 85,000 100,000 120,000 103,991 Pharmaceuticals 415 3% 97,000 113,909 135,000 118,715 Real Estate 50 * 81,200 98,468 107,000 95,244 Resources (Agriculture, Mining, etc.)
215 2% 92,000 116,000 145,000 120,607
Telecommunications 744 5% 85,000 100,000 120,000 104,730 Training/Education 213 2% 70,000 90,000 103,000 91,023 Utility 445 3% 90,000 105,000 120,000 108,544 Other 387 3% 81,000 100,000 115,000 101,121

Project Management Salary Survey –Seventh Edition 239
United States – All Respondents
Annualized by Type of Project
Project Type n= Percent 25th Percentile Median 75th Percentile Mean Business Transformation 3,065 23% 90,000 110,000 130,000 113,787 Construction 1,381 10% 86,000 105,000 127,000 110,003 Engineering 2,468 18% 91,000 110,000 130,000 113,846 Information Technology 8,518 63% 88,000 105,000 126,000 109,800 Manufacturing 889 7% 86,068 104,000 125,000 108,037 Operations 3,378 25% 85,000 102,147 125,000 107,476 Quality Management 1,514 11% 84,500 103,000 127,000 107,750 Regulatory Compliance 1,527 11% 89,000 105,000 128,000 110,674 Research and Development 1,480 11% 89,950 109,506 130,000 112,402 Supply Chain Management/Logistics 999 7% 89,000 106,000 130,000 113,258
Other 1,039 8% 84,000 100,000 123,300 106,030
Annualized Salary by Number of Employees in Entire Organization
Employees n= Percent 25th Percentile Median 75th Percentile Mean Less than 100 1,273 9% 85,000 108,500 135,000 116,091 100 to 299 1,091 8% 80,000 102,000 125,000 106,732 300 to 999 1,535 11% 84,000 101,000 125,000 106,007 1,000 to 2,499 1,242 9% 84,500 100,000 123,000 105,361 2,500 to 4,999 1,188 9% 85,952 102,000 120,000 104,582 5,000 to 9,999 1,332 10% 87,000 103,000 122,946 106,421 10,000 or more 5,911 44% 90,000 106,000 127,000 110,511
Annualized Salary by Average Project Team Size
Employees n= Percent 25th Percentile Median 75th Percentile Mean
1-4 people 1,422 13% 80,000 98,413 119,000 101,955 5-9 people 4,005 36% 87,000 102,500 122,000 106,328 10-14 people 2,382 22% 90,000 106,000 127,000 110,831 15-19 people 1,048 10% 90,500 106,300 127,000 112,682 20 or more people 2,166 20% 97,000 115,000 140,000 123,008
Annualized Salary by Average Project Budget (in USD)
Employees n= Percent 25th Percentile Median 75th Percentile Mean
Less than $100,000 1,247 10% 72,000 88,000 105,000 90,527 $100,000 to $499,999 2,925 24% 82,500 98,000 115,000 100,694 $500,000 to $999,999 2,196 18% 88,500 103,000 121,000 106,943 $1 million to $10 million 4,572 37% 94,000 110,000 132,000 115,750 More than $10 million 1,282 10% 105,000 126,200 153,000 132,383

Project Management Salary Survey –Seventh Edition 240
United States – All Respondents
Project Management Career Path within Organization
n= Percent Yes - Clearly defined/in writing 3,493 26% Yes - Informal 5,941 44% No 3,480 26% Don't Know 592 4%
Project Management Career Path Connected to Roles in Upper Management
n= Percent Yes - Clearly defined/in writing 2,030 22% Yes - Informal 4,885 52% No 1,628 17% Don't Know 833 9%
Defined Set of Performance Skills for Project Managers within Organization
n= Percent Yes - Clearly defined/in writing 5,693 42% Yes - Informal 4,095 31% No 2,914 22% Don't Know 699 5%
Equities Offered in Past Year by Position Description
Stock Options Stock
(i.e., Shares) Neither n= Percent n= Percent n= Percent
Total 1,386 10% 1,481 11% 10,916 81% Director of Project Management Office (PMO) 134 17% 124 16% 558 73% Portfolio Manager 147 18% 144 17% 598 71% Program Manager 445 14% 465 14% 2,513 76% Project Manager III 313 8% 363 10% 3,160 84% Project Manager II 187 9% 194 9% 1,852 84% Project Manager I 86 7% 94 8% 991 86% Project Management Specialist 31 6% 46 9% 455 87% Project Management Consultant 43 5% 51 6% 789 90%
Employee Benefits Offered by Position Description
Company
Car/Allowance Cell Phone Usage Paid Life Insurance n= Percent n= Percent n= Percent
Total 909 7% 7,050 53% 7,050 53% Director of Project Management Office (PMO)
82 11% 577 75% 458 59%
Portfolio Manager 81 10% 567 68% 473 57% Program Manager 216 7% 1,957 60% 1,794 55% Project Manager III 224 6% 1,922 51% 2,017 54% Project Manager II 130 6% 1,027 47% 1,117 51% Project Manager I 74 6% 437 38% 518 45% Project Management Specialist 31 6% 186 36% 272 52% Project Management Consultant 71 8% 377 43% 401 46%

Project Management Salary Survey –Seventh Edition 241
United States – All Respondents
Mean Number of Vacation Days by Position Description
After 1 Year After 10 Years n= Mean n= Mean
Total 12,916 12.7 12,639 19.2 Director of Project Management Office (PMO) 736 13.5 732 20.5 Portfolio Manager 814 13.4 806 19.8 Program Manager 3,176 12.8 3,145 19.5 Project Manager III 3,600 12.3 3,594 18.9 Project Manager II 2,125 12.7 2,061 19.3 Project Manager I 1,115 12.8 1,036 19.1 Project Management Specialist 507 12.8 475 19.5 Project Management Consultant 843 12.1 790 17.4
Pension Plans Offered by Position Description
Defined Benefit
Plans Defined
Contribution Plans Other Pension Plans
n= Percent n= Percent n= Percent Total 4,624 35% 9,843 74% 804 6% Director of Project Management Office (PMO) 272 35% 578 75% 44 6% Portfolio Manager 309 37% 661 78% 56 7% Program Manager 1,158 35% 2,479 75% 204 6% Project Manager III 1,288 34% 2,805 75% 217 6% Project Manager II 795 36% 1,597 73% 128 6% Project Manager I 389 34% 782 68% 68 6% Project Management Specialist 204 39% 380 73% 34 7% Project Management Consultant 209 24% 561 64% 53 6%
Mean Hours Worked by Position Description
Hours Expected Actual Hours Worked n= Mean n= Mean
Total 13,392 40.1 13,272 47.8 Director of Project Management Office (PMO) 768 40.0 760 50.4 Portfolio Manager 840 40.0 832 50.3 Program Manager 3,282 40.1 3,246 49.2 Project Manager III 3,770 40.1 3,740 47.5 Project Manager II 2,190 40.1 2,174 46.7 Project Manager I 1,153 40.0 1,140 45.8 Project Management Specialist 524 40.0 519 45.0 Project Management Consultant 865 40.3 861 46.5

Project Management Salary Survey –Seventh Edition 242
Appendix A – Demographic Comparisons by Country
Years of Work Experience
Country n= <3 3-<5 5-<10 10-<15 15-<20 20+
Australia 734 0% 1% 10% 21% 18% 50% Belgium 275 0% 3% 11% 23% 27% 36% Brazil 901 1% 1% 15% 29% 20% 35% Canada 3,023 0% 2% 11% 19% 19% 49% China 1,528 0% 7% 42% 32% 13% 7% Colombia 369 0% 2% 24% 30% 23% 21% France 456 1% 2% 11% 25% 20% 41% Germany 742 0% 1% 14% 24% 21% 39% Hong Kong 259 0% 0% 18% 37% 24% 20% India 1,689 0% 1% 18% 53% 19% 9% Ireland 386 1% 1% 11% 30% 23% 35% Italy 678 0% 1% 9% 32% 18% 40% Japan 652 0% 0% 8% 26% 17% 48% Malaysia 370 0% 2% 18% 39% 21% 21% Mexico 369 1% 2% 21% 38% 17% 20% Netherlands 303 0% 1% 6% 20% 17% 55% New Zealand 442 0% 2% 7% 14% 17% 60% Nigeria 203 2% 10% 42% 30% 8% 8% Peru 244 1% 6% 30% 27% 16% 19% Saudi Arabia 307 1% 4% 25% 32% 16% 22% Singapore 624 0% 2% 23% 38% 21% 16% South Korea 221 0% 3% 18% 30% 23% 26% Spain 424 0% 1% 16% 39% 23% 21% Sweden 397 0% 1% 11% 21% 20% 47% Switzerland 304 0% 1% 14% 26% 17% 42% Taiwan 230 0% 7% 22% 38% 20% 12% United Arab Emirates 474 0% 2% 23% 31% 22% 22% United Kingdom 647 0% 1% 7% 22% 18% 51% United States 13,572 1% 1% 8% 17% 17% 57%

Project Management Salary Survey –Seventh Edition 243
Years of Project Management Experience
Country n= <3 3-<5 5-<10 10-<15 15-<20 20+
Australia 734 5% 11% 34% 23% 16% 10% Belgium 275 4% 11% 31% 36% 10% 8% Brazil 901 4% 11% 46% 25% 8% 6% Canada 3,023 4% 9% 34% 27% 15% 11% China 1,528 8% 29% 48% 11% 3% 1% Colombia 369 3% 16% 46% 24% 8% 3% France 456 3% 10% 38% 25% 13% 11% Germany 742 2% 8% 36% 34% 14% 6% Hong Kong 259 5% 14% 47% 25% 7% 2% India 1,689 4% 25% 57% 10% 3% 1% Ireland 386 4% 14% 42% 26% 10% 5% Italy 678 1% 7% 45% 32% 11% 4% Japan 652 3% 6% 40% 33% 11% 7% Malaysia 370 5% 11% 49% 23% 9% 3% Mexico 369 4% 17% 46% 24% 7% 3% Netherlands 303 1% 9% 29% 32% 17% 12% New Zealand 442 5% 11% 32% 28% 14% 11% Nigeria 203 10% 30% 46% 11% 2% 1% Peru 244 7% 26% 37% 19% 9% 2% Saudi Arabia 307 6% 19% 47% 17% 7% 5% Singapore 624 5% 20% 50% 19% 5% 2% South Korea 221 3% 10% 38% 28% 14% 8% Spain 424 2% 11% 46% 31% 7% 3% Sweden 397 3% 8% 30% 35% 18% 7% Switzerland 304 1% 11% 37% 28% 15% 9% Taiwan 230 6% 23% 44% 20% 3% 3% United Arab Emirates 474 3% 19% 47% 20% 8% 3% United Kingdom 647 2% 8% 35% 27% 15% 13% United States 13,572 3% 8% 30% 27% 16% 14%

Project Management Salary Survey –Seventh Edition 244
Years of Technique Experience
Agile Project Management/Scrum Extreme Project Management
Country n= None 1-5 6+ n= None 1-5 6+
Australia 667 62% 33% 5% 654 73% 17% 9% Belgium 252 61% 33% 6% 248 78% 18% 4% Brazil 844 60% 31% 9% 840 64% 26% 11% Canada 2,758 59% 33% 8% 2,735 72% 18% 11% China 1,242 40% 48% 12% 1,225 45% 42% 13% Colombia 332 64% 25% 11% 332 67% 23% 10% France 408 73% 21% 6% 408 76% 17% 7% Germany 691 59% 33% 9% 679 70% 21% 9% Hong Kong 226 64% 26% 10% 228 63% 26% 11% India 1,420 50% 45% 5% 1,352 59% 33% 8% Ireland 340 61% 34% 6% 333 76% 19% 5% Italy 587 73% 23% 4% 574 75% 18% 7% Japan 549 63% 25% 13% 545 62% 24% 15% Malaysia 327 65% 28% 7% 329 66% 27% 7% Mexico 351 62% 32% 6% 349 68% 23% 9% Netherlands 288 64% 29% 7% 280 69% 22% 9% New Zealand 392 64% 31% 6% 381 75% 18% 7% Nigeria 148 76% 22% 3% 152 59% 35% 6% Peru 215 64% 33% 3% 216 68% 27% 5% Saudi Arabia 251 68% 25% 7% 254 54% 31% 15% Singapore 549 62% 31% 7% 533 71% 23% 7% South Korea 147 53% 29% 18% 152 51% 29% 20% Spain 390 59% 32% 9% 387 67% 26% 7% Sweden 368 54% 40% 6% 364 76% 19% 5% Switzerland 271 60% 34% 6% 265 75% 15% 9% Taiwan 189 59% 32% 10% 194 59% 30% 11% United Arab Emirates 362 71% 24% 5% 375 53% 32% 15% United Kingdom 593 60% 35% 6% 587 77% 15% 7% United States 12,527 57% 35% 8% 12,349 72% 18% 10%

Project Management Salary Survey –Seventh Edition 245
Years of Technique Experience (Continued)
Processed Based Project Management Event Chain Project Management
Country n= None 1-5 6+ n= None 1-5 6+
Australia 669 26% 39% 35% 651 74% 18% 9% Belgium 257 35% 34% 31% 242 81% 13% 7% Brazil 853 21% 42% 37% 827 61% 25% 13% Canada 2,808 26% 38% 36% 2,712 71% 19% 10% China 1,284 13% 61% 27% 1,226 43% 41% 15% Colombia 344 17% 51% 32% 332 52% 35% 13% France 411 23% 37% 40% 397 72% 19% 9% Germany 696 24% 36% 40% 671 73% 15% 11% Hong Kong 229 22% 52% 27% 227 63% 24% 12% India 1,460 14% 58% 28% 1,342 70% 24% 7% Ireland 353 24% 41% 35% 326 78% 16% 6% Italy 594 26% 39% 36% 576 69% 23% 9% Japan 556 29% 37% 34% 546 64% 21% 16% Malaysia 337 18% 49% 34% 320 65% 26% 9% Mexico 351 20% 50% 30% 347 63% 26% 11% Netherlands 285 32% 28% 40% 275 73% 18% 9% New Zealand 400 29% 37% 34% 382 79% 13% 8% Nigeria 167 25% 61% 14% 158 56% 37% 7% Peru 222 21% 61% 18% 211 56% 36% 7% Saudi Arabia 265 29% 46% 25% 247 66% 26% 8% Singapore 566 25% 51% 25% 537 68% 26% 6% South Korea 171 21% 42% 37% 145 54% 27% 19% Spain 394 23% 44% 33% 384 58% 28% 14% Sweden 373 28% 30% 42% 360 74% 16% 10% Switzerland 275 25% 37% 38% 264 73% 16% 11% Taiwan 197 21% 54% 25% 194 52% 38% 10% United Arab Emirates 394 21% 50% 28% 356 69% 23% 8% United Kingdom 598 24% 34% 42% 577 76% 15% 9% United States 12,619 23% 35% 42% 12,299 70% 18% 11%

Project Management Salary Survey –Seventh Edition 246
Years of Technique Experience (Continued)
Interactive Project Management Incremental Project Management
Country n= None 1-5 6+ n= None 1-5 6+
Australia 653 51% 26% 23% 647 55% 26% 19% Belgium 249 57% 28% 15% 248 61% 24% 15% Brazil 837 38% 36% 26% 839 46% 33% 21% Canada 2,750 48% 27% 25% 2,739 54% 27% 19% China 1,253 27% 54% 19% 1,244 36% 49% 14% Colombia 329 43% 41% 16% 333 50% 37% 13% France 406 54% 25% 21% 405 57% 26% 18% Germany 678 49% 27% 24% 681 51% 28% 21% Hong Kong 228 41% 38% 21% 225 40% 40% 20% India 1,378 32% 49% 18% 1,376 39% 46% 14% Ireland 331 56% 26% 18% 337 57% 28% 15% Italy 576 59% 24% 17% 578 63% 24% 13% Japan 557 49% 29% 22% 550 50% 31% 18% Malaysia 330 42% 35% 23% 325 52% 36% 12% Mexico 350 46% 38% 16% 349 52% 33% 15% Netherlands 279 52% 22% 26% 279 51% 26% 23% New Zealand 389 54% 24% 21% 385 63% 19% 18% Nigeria 157 27% 61% 11% 155 50% 41% 9% Peru 214 48% 39% 13% 215 53% 38% 9% Saudi Arabia 255 37% 44% 19% 243 54% 33% 13% Singapore 537 47% 36% 17% 544 50% 38% 12% South Korea 162 36% 34% 30% 150 49% 31% 21% Spain 392 47% 32% 21% 390 51% 30% 19% Sweden 357 54% 27% 19% 357 50% 30% 21% Switzerland 269 51% 28% 21% 268 59% 20% 21% Taiwan 199 31% 47% 22% 193 44% 42% 15% United Arab Emirates 378 36% 42% 22% 368 58% 28% 14% United Kingdom 584 58% 22% 20% 580 60% 22% 18% United States 12,398 46% 27% 27% 12,363 51% 26% 23%
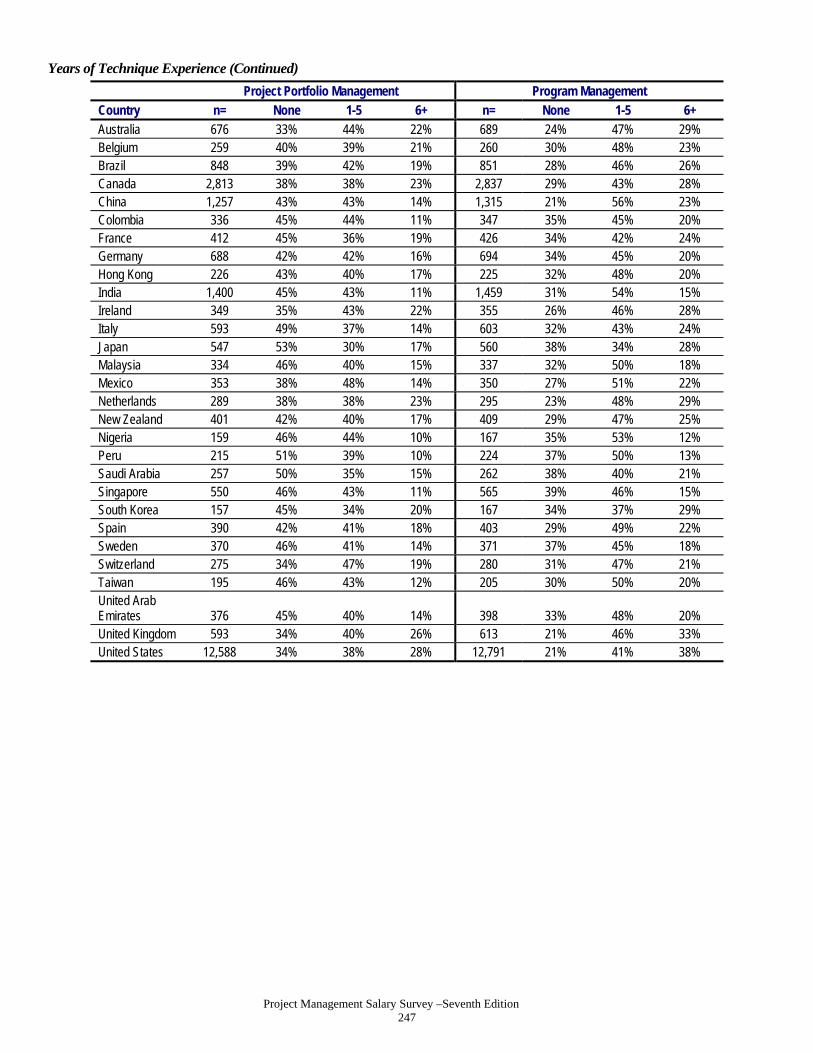
Project Management Salary Survey –Seventh Edition 247
Years of Technique Experience (Continued)
Project Portfolio Management Program Management
Country n= None 1-5 6+ n= None 1-5 6+
Australia 676 33% 44% 22% 689 24% 47% 29% Belgium 259 40% 39% 21% 260 30% 48% 23% Brazil 848 39% 42% 19% 851 28% 46% 26% Canada 2,813 38% 38% 23% 2,837 29% 43% 28% China 1,257 43% 43% 14% 1,315 21% 56% 23% Colombia 336 45% 44% 11% 347 35% 45% 20% France 412 45% 36% 19% 426 34% 42% 24% Germany 688 42% 42% 16% 694 34% 45% 20% Hong Kong 226 43% 40% 17% 225 32% 48% 20% India 1,400 45% 43% 11% 1,459 31% 54% 15% Ireland 349 35% 43% 22% 355 26% 46% 28% Italy 593 49% 37% 14% 603 32% 43% 24% Japan 547 53% 30% 17% 560 38% 34% 28% Malaysia 334 46% 40% 15% 337 32% 50% 18% Mexico 353 38% 48% 14% 350 27% 51% 22% Netherlands 289 38% 38% 23% 295 23% 48% 29% New Zealand 401 42% 40% 17% 409 29% 47% 25% Nigeria 159 46% 44% 10% 167 35% 53% 12% Peru 215 51% 39% 10% 224 37% 50% 13% Saudi Arabia 257 50% 35% 15% 262 38% 40% 21% Singapore 550 46% 43% 11% 565 39% 46% 15% South Korea 157 45% 34% 20% 167 34% 37% 29% Spain 390 42% 41% 18% 403 29% 49% 22% Sweden 370 46% 41% 14% 371 37% 45% 18% Switzerland 275 34% 47% 19% 280 31% 47% 21% Taiwan 195 46% 43% 12% 205 30% 50% 20% United Arab Emirates 376 45% 40% 14% 398 33% 48% 20% United Kingdom 593 34% 40% 26% 613 21% 46% 33% United States 12,588 34% 38% 28% 12,791 21% 41% 38%

Project Management Salary Survey –Seventh Edition 248
Years of Technique Experience (Continued)
Earned Value Management Lean Project Management
Country n= None 1-5 6+ n= None 1-5 6+
Australia 676 33% 43% 24% 663 58% 31% 11% Belgium 263 27% 48% 25% 256 62% 29% 9% Brazil 848 26% 51% 23% 830 54% 32% 14% Canada 2,791 38% 41% 20% 2,775 56% 31% 13% China 1,260 34% 51% 15% 1,237 39% 48% 13% Colombia 351 15% 65% 20% 328 56% 34% 10% France 415 31% 49% 20% 407 63% 29% 8% Germany 694 24% 51% 25% 679 53% 32% 15% Hong Kong 228 49% 40% 11% 223 55% 34% 11% India 1,429 32% 55% 13% 1,389 51% 41% 8% Ireland 339 44% 38% 18% 343 59% 34% 7% Italy 614 24% 48% 28% 573 65% 27% 8% Japan 555 33% 41% 26% 546 54% 26% 20% Malaysia 328 43% 46% 11% 329 51% 41% 8% Mexico 353 30% 52% 17% 350 57% 31% 11% Netherlands 284 26% 49% 25% 289 48% 37% 15% New Zealand 400 40% 41% 20% 389 67% 25% 8% Nigeria 164 35% 55% 10% 160 54% 39% 7% Peru 225 21% 64% 16% 222 52% 41% 7% Saudi Arabia 263 29% 54% 17% 249 52% 35% 14% Singapore 549 43% 45% 12% 544 52% 38% 10% South Korea 166 31% 40% 30% 150 42% 39% 19% Spain 397 23% 53% 24% 389 57% 31% 12% Sweden 373 32% 45% 23% 367 59% 33% 8% Switzerland 275 34% 44% 22% 268 55% 33% 12% Taiwan 195 42% 47% 11% 191 48% 41% 12% United Arab Emirates 375 27% 51% 22% 381 51% 35% 14% United Kingdom 598 29% 47% 23% 579 59% 31% 11% United States 12,604 37% 41% 23% 12,457 53% 33% 14%

Project Management Salary Survey –Seventh Edition 249
Years of Technique Experience (Continued)
Critical Chain Project Management Waterfall Project Management
Country n= None 1-5 6+ n= None 1-5 6+
Australia 657 54% 30% 16% 679 36% 27% 37% Belgium 254 50% 30% 20% 254 34% 29% 37% Brazil 843 40% 40% 20% 840 52% 26% 22% Canada 2,757 53% 30% 17% 2,799 42% 24% 34% China 1,239 33% 48% 18% 1,258 38% 44% 18% Colombia 346 29% 49% 21% 326 60% 26% 14% France 406 48% 33% 20% 406 61% 18% 21% Germany 689 37% 35% 28% 691 39% 22% 39% Hong Kong 228 46% 36% 18% 226 43% 27% 30% India 1,375 50% 39% 11% 1,474 20% 46% 34% Ireland 331 58% 28% 14% 346 44% 22% 34% Italy 586 42% 39% 19% 586 59% 19% 22% Japan 549 49% 30% 21% 563 18% 29% 53% Malaysia 325 49% 38% 14% 330 40% 34% 26% Mexico 349 39% 42% 19% 341 51% 29% 21% Netherlands 289 46% 29% 25% 291 39% 20% 41% New Zealand 388 58% 29% 13% 400 44% 18% 39% Nigeria 151 44% 47% 9% 150 70% 25% 5% Peru 218 35% 49% 16% 208 64% 29% 7% Saudi Arabia 256 48% 38% 14% 248 67% 23% 10% Singapore 540 51% 38% 11% 561 38% 39% 23% South Korea 152 38% 38% 24% 150 45% 28% 27% Spain 396 33% 43% 24% 386 49% 26% 25% Sweden 366 40% 37% 23% 371 37% 22% 41% Switzerland 270 46% 29% 24% 269 37% 21% 42% Taiwan 195 40% 46% 14% 191 51% 34% 16% United Arab Emirates 369 41% 42% 17% 361 65% 21% 14% United Kingdom 586 56% 27% 16% 604 33% 21% 46% United States 12,374 53% 28% 19% 12,617 37% 24% 39%

Project Management Salary Survey –Seventh Edition 250
Years of Technique Experience (Continued)
Risk Management Change Management
Country n= None 1-5 6+ n= None 1-5 6+
Australia 694 7% 41% 52% 700 9% 41% 50% Belgium 266 10% 42% 47% 268 9% 40% 51% Brazil 861 12% 53% 35% 848 9% 50% 41% Canada 2,868 10% 44% 46% 2,865 9% 41% 51% China 1,310 11% 65% 25% 1,296 11% 61% 28% Colombia 353 10% 62% 28% 352 13% 53% 34% France 426 8% 50% 41% 426 13% 44% 43% Germany 707 8% 40% 52% 714 7% 39% 54% Hong Kong 233 19% 50% 31% 231 10% 52% 39% India 1,519 7% 63% 30% 1,508 7% 60% 33% Ireland 357 12% 49% 39% 357 13% 44% 43% Italy 610 12% 54% 34% 602 15% 45% 40% Japan 568 10% 46% 44% 559 18% 41% 41% Malaysia 339 12% 61% 28% 344 10% 54% 35% Mexico 355 14% 60% 26% 355 16% 54% 30% Netherlands 294 4% 37% 59% 290 8% 38% 54% New Zealand 415 8% 39% 53% 414 13% 42% 45% Nigeria 179 13% 72% 15% 174 14% 68% 18% Peru 227 17% 60% 23% 222 17% 58% 25% Saudi Arabia 270 19% 59% 22% 265 20% 53% 27% Singapore 571 16% 59% 25% 584 11% 60% 30% South Korea 173 17% 49% 34% 162 27% 39% 35% Spain 398 6% 53% 41% 400 11% 47% 43% Sweden 376 4% 38% 58% 379 8% 39% 53% Switzerland 280 9% 41% 51% 282 9% 41% 50% Taiwan 204 25% 53% 22% 202 17% 55% 28% United Arab Emirates 412 17% 59% 24% 397 17% 55% 28% United Kingdom 624 7% 36% 57% 615 9% 35% 56% United States 12,785 10% 40% 50% 12,792 10% 35% 54%
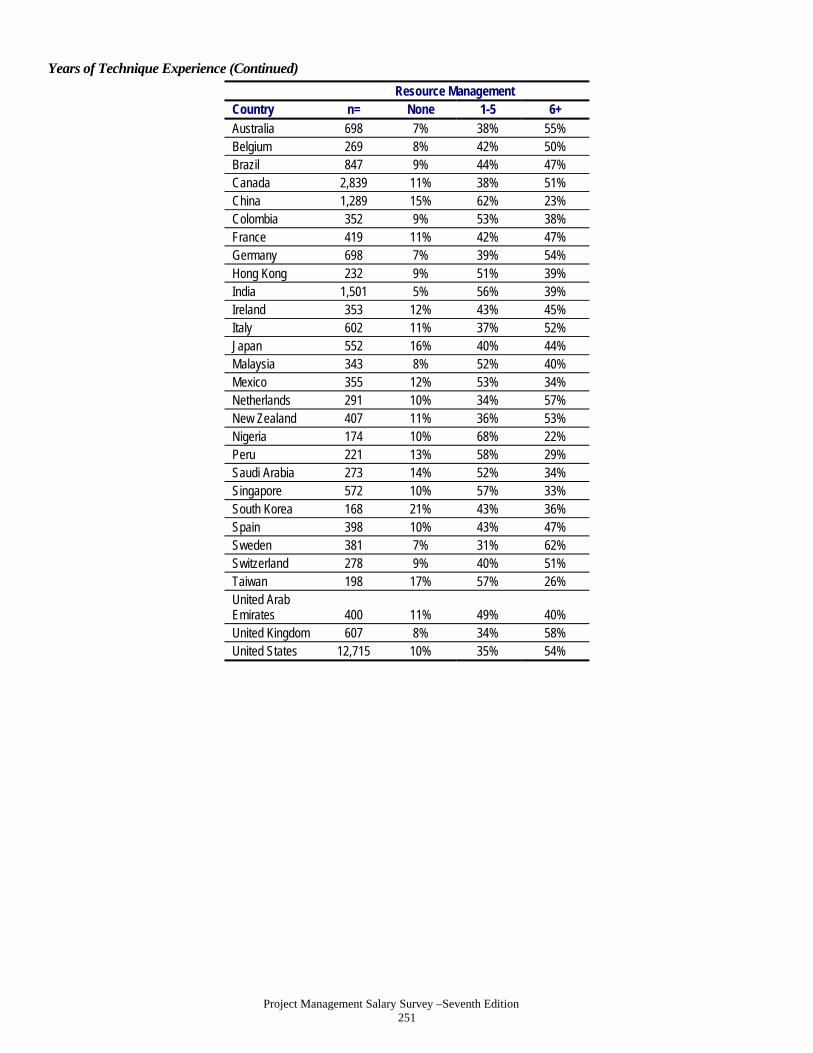
Project Management Salary Survey –Seventh Edition 251
Years of Technique Experience (Continued)
Resource Management Country n= None 1-5 6+
Australia 698 7% 38% 55% Belgium 269 8% 42% 50% Brazil 847 9% 44% 47% Canada 2,839 11% 38% 51% China 1,289 15% 62% 23% Colombia 352 9% 53% 38% France 419 11% 42% 47% Germany 698 7% 39% 54% Hong Kong 232 9% 51% 39% India 1,501 5% 56% 39% Ireland 353 12% 43% 45% Italy 602 11% 37% 52% Japan 552 16% 40% 44% Malaysia 343 8% 52% 40% Mexico 355 12% 53% 34% Netherlands 291 10% 34% 57% New Zealand 407 11% 36% 53% Nigeria 174 10% 68% 22% Peru 221 13% 58% 29% Saudi Arabia 273 14% 52% 34% Singapore 572 10% 57% 33% South Korea 168 21% 43% 36% Spain 398 10% 43% 47% Sweden 381 7% 31% 62% Switzerland 278 9% 40% 51% Taiwan 198 17% 57% 26% United Arab Emirates 400 11% 49% 40% United Kingdom 607 8% 34% 58% United States 12,715 10% 35% 54%

Project Management Salary Survey –Seventh Edition 252
Highest Formal Education Level
Country n= High
School Associates
Degree 4-year Degree Masters Doctoral
Australia 734 6% 14% 42% 31% 7% Belgium 275 4% 7% 12% 61% 15% Brazil 901 3% 1% 22% 58% 17% Canada 3,023 2% 16% 50% 30% 2% China 1,528 1% 5% 59% 34% 2% Colombia 369 3% 2% 32% 56% 8% France 456 7% 6% 7% 69% 10% Germany 742 7% 6% 13% 63% 10% Hong Kong 259 2% 2% 42% 53% 1% India 1,689 1% 5% 44% 44% 6% Ireland 386 3% 10% 45% 38% 5% Italy 678 19% 3% 16% 51% 11% Japan 652 4% 6% 64% 24% 1% Malaysia 370 2% 6% 61% 28% 3% Mexico 369 1% 2% 51% 44% 1% Netherlands 303 6% 6% 26% 53% 8% New Zealand 442 12% 19% 42% 23% 3% Nigeria 203 1% 1% 57% 39% 0% Peru 244 5% 5% 35% 51% 4% Saudi Arabia 307 1% 2% 65% 30% 2% Singapore 624 4% 5% 51% 37% 3% South Korea 221 0% 2% 71% 25% 2% Spain 424 7% 4% 24% 58% 7% Sweden 397 5% 12% 17% 62% 4% Switzerland 304 3% 4% 21% 63% 10% Taiwan 230 0% 6% 34% 58% 2% United Arab Emirates 474 1% 4% 53% 37% 4% United Kingdom 647 8% 12% 41% 33% 6% United States 13,572 1% 9% 43% 45% 2%
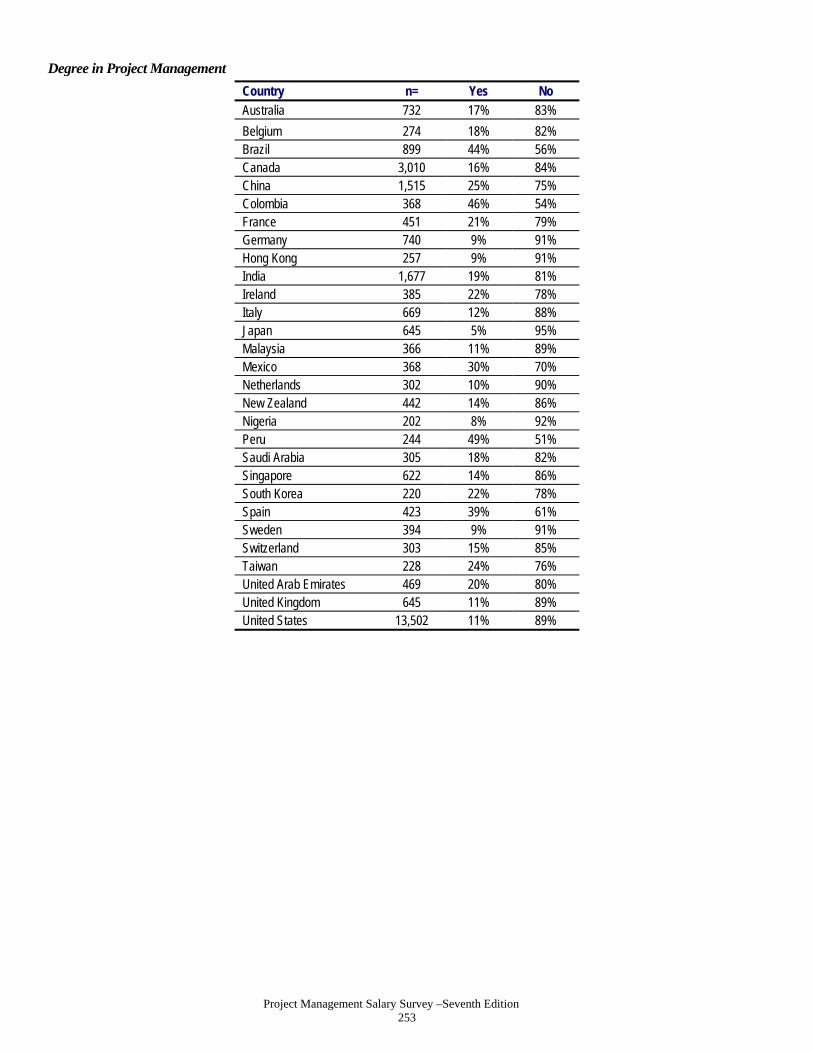
Project Management Salary Survey –Seventh Edition 253
Degree in Project Management
Country n= Yes No
Australia 732 17% 83%
Belgium 274 18% 82% Brazil 899 44% 56% Canada 3,010 16% 84% China 1,515 25% 75% Colombia 368 46% 54% France 451 21% 79% Germany 740 9% 91% Hong Kong 257 9% 91% India 1,677 19% 81% Ireland 385 22% 78% Italy 669 12% 88% Japan 645 5% 95% Malaysia 366 11% 89% Mexico 368 30% 70% Netherlands 302 10% 90% New Zealand 442 14% 86% Nigeria 202 8% 92% Peru 244 49% 51% Saudi Arabia 305 18% 82% Singapore 622 14% 86% South Korea 220 22% 78% Spain 423 39% 61% Sweden 394 9% 91% Switzerland 303 15% 85% Taiwan 228 24% 76% United Arab Emirates 469 20% 80% United Kingdom 645 11% 89% United States 13,502 11% 89%
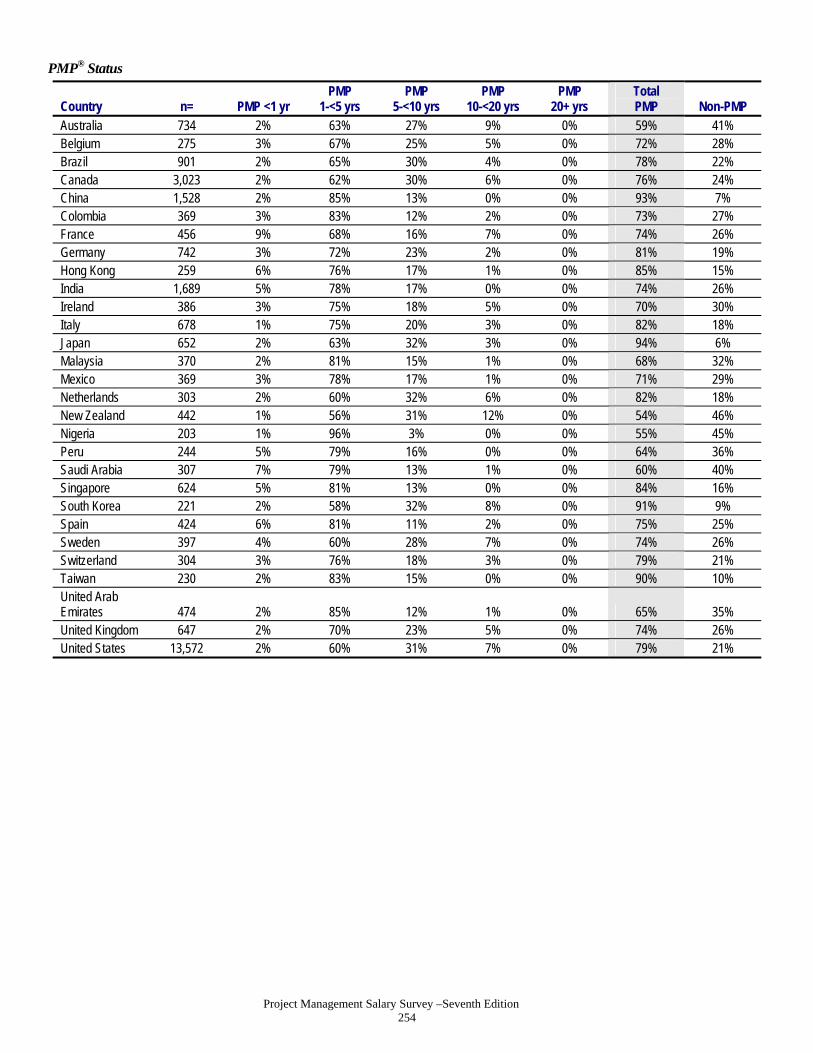
Project Management Salary Survey –Seventh Edition 254
PMP® Status
Country n= PMP <1 yr PMP
1-<5 yrs PMP
5-<10 yrs PMP
10-<20 yrs PMP
20+ yrs Total PMP Non-PMP
Australia 734 2% 63% 27% 9% 0% 59% 41% Belgium 275 3% 67% 25% 5% 0% 72% 28% Brazil 901 2% 65% 30% 4% 0% 78% 22% Canada 3,023 2% 62% 30% 6% 0% 76% 24% China 1,528 2% 85% 13% 0% 0% 93% 7% Colombia 369 3% 83% 12% 2% 0% 73% 27% France 456 9% 68% 16% 7% 0% 74% 26% Germany 742 3% 72% 23% 2% 0% 81% 19% Hong Kong 259 6% 76% 17% 1% 0% 85% 15% India 1,689 5% 78% 17% 0% 0% 74% 26% Ireland 386 3% 75% 18% 5% 0% 70% 30% Italy 678 1% 75% 20% 3% 0% 82% 18% Japan 652 2% 63% 32% 3% 0% 94% 6% Malaysia 370 2% 81% 15% 1% 0% 68% 32% Mexico 369 3% 78% 17% 1% 0% 71% 29% Netherlands 303 2% 60% 32% 6% 0% 82% 18% New Zealand 442 1% 56% 31% 12% 0% 54% 46% Nigeria 203 1% 96% 3% 0% 0% 55% 45% Peru 244 5% 79% 16% 0% 0% 64% 36% Saudi Arabia 307 7% 79% 13% 1% 0% 60% 40% Singapore 624 5% 81% 13% 0% 0% 84% 16% South Korea 221 2% 58% 32% 8% 0% 91% 9% Spain 424 6% 81% 11% 2% 0% 75% 25% Sweden 397 4% 60% 28% 7% 0% 74% 26% Switzerland 304 3% 76% 18% 3% 0% 79% 21% Taiwan 230 2% 83% 15% 0% 0% 90% 10% United Arab Emirates 474 2% 85% 12% 1% 0% 65% 35% United Kingdom 647 2% 70% 23% 5% 0% 74% 26% United States 13,572 2% 60% 31% 7% 0% 79% 21%
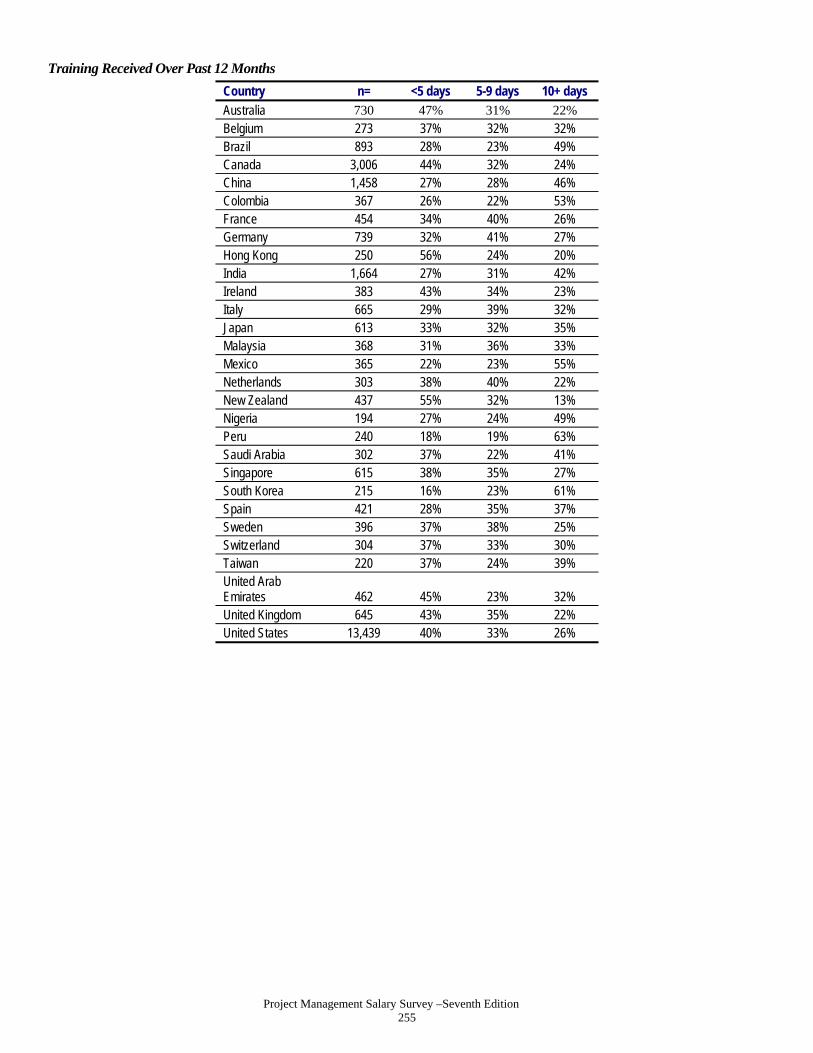
Project Management Salary Survey –Seventh Edition 255
Training Received Over Past 12 Months
Country n= <5 days 5-9 days 10+ days
Australia 730 47% 31% 22% Belgium 273 37% 32% 32% Brazil 893 28% 23% 49% Canada 3,006 44% 32% 24% China 1,458 27% 28% 46% Colombia 367 26% 22% 53% France 454 34% 40% 26% Germany 739 32% 41% 27% Hong Kong 250 56% 24% 20% India 1,664 27% 31% 42% Ireland 383 43% 34% 23% Italy 665 29% 39% 32% Japan 613 33% 32% 35% Malaysia 368 31% 36% 33% Mexico 365 22% 23% 55% Netherlands 303 38% 40% 22% New Zealand 437 55% 32% 13% Nigeria 194 27% 24% 49% Peru 240 18% 19% 63% Saudi Arabia 302 37% 22% 41% Singapore 615 38% 35% 27% South Korea 215 16% 23% 61% Spain 421 28% 35% 37% Sweden 396 37% 38% 25% Switzerland 304 37% 33% 30% Taiwan 220 37% 24% 39% United Arab Emirates 462 45% 23% 32% United Kingdom 645 43% 35% 22% United States 13,439 40% 33% 26%

Project Management Salary Survey –Seventh Edition 256
Gender
Country n= Male Female
Australia 709 79% 21% Belgium 266 85% 15% Brazil 889 83% 17% Canada 2,949 67% 33% China 1,514 79% 21% Colombia 366 77% 23% France 450 81% 19% Germany 724 89% 11% Hong Kong 257 70% 30% India 1,653 91% 9% Ireland 370 77% 23% Italy 663 84% 16% Japan 645 93% 7% Malaysia 364 67% 33% Mexico 365 80% 20% Netherlands 296 92% 8% New Zealand 429 72% 28% Nigeria 196 83% 17% Peru 243 84% 16% Saudi Arabia 296 99% 1% Singapore 611 81% 19% South Korea 221 94% 6% Spain 412 82% 18% Sweden 394 76% 24% Switzerland 298 84% 16% Taiwan 227 78% 22% United Arab Emirates 462 94% 6% United Kingdom 631 81% 19% United States 13,267 63% 37%

Project Management Salary Survey –Seventh Edition 257
Functional Area
Country n= Admin/
Gen Mgnt Consulting Engineering IT/IS PMO Other Australia 731 5% 11% 4% 29% 38% 14% Belgium 273 8% 10% 2% 33% 32% 14% Brazil 898 10% 8% 10% 29% 31% 12% Canada 3,013 7% 9% 9% 26% 33% 16% China 1,500 7% 6% 13% 22% 29% 23% Colombia 367 17% 10% 8% 19% 35% 12% France 454 4% 7% 7% 27% 33% 22% Germany 740 10% 17% 5% 21% 28% 20% Hong Kong 258 4% 7% 8% 43% 23% 15% India 1,681 2% 6% 5% 46% 27% 14% Ireland 385 6% 7% 9% 26% 29% 22% Italy 672 6% 12% 7% 29% 32% 15% Japan 645 4% 4% 14% 50% 14% 13% Malaysia 369 4% 9% 4% 26% 47% 10% Mexico 367 13% 15% 4% 28% 26% 14% Netherlands 303 7% 7% 1% 28% 31% 25% New Zealand 440 10% 8% 12% 20% 40% 10% Nigeria 200 7% 5% 16% 14% 35% 24% Peru 244 11% 8% 10% 29% 25% 17% Saudi Arabia 304 9% 6% 12% 15% 47% 11% Singapore 623 2% 7% 7% 39% 25% 20% South Korea 221 9% 5% 20% 13% 37% 17% Spain 423 7% 14% 8% 31% 30% 9% Sweden 397 10% 14% 4% 18% 38% 16% Switzerland 303 7% 7% 6% 31% 27% 22% Taiwan 226 8% 3% 9% 20% 28% 31% United Arab Emirates 470 9% 7% 13% 16% 44% 11% United Kingdom 644 3% 9% 5% 32% 36% 15% United States 13,513 5% 9% 7% 30% 30% 18%

Project Management Salary Survey –Seventh Edition 258
Industry
Country n= Consulting Engineering Financial Service Government IT Manufacturing Telecom Other
Australia 734 9% 6% 11% 6% 31% 2% 9% 26% Belgium 275 12% 5% 8% 7% 30% 6% 13% 19% Brazil 901 9% 9% 5% 4% 33% 6% 10% 23% Canada 3,023 9% 8% 10% 10% 20% 5% 7% 31% China 1,528 5% 13% 4% 1% 34% 14% 15% 14% Colombia 369 9% 8% 6% 2% 24% 3% 14% 33% France 456 8% 12% 3% 1% 36% 6% 16% 18% Germany 742 13% 10% 5% 1% 35% 7% 14% 15% Hong Kong 259 4% 5% 22% 5% 26% 8% 11% 19% India 1,689 5% 5% 3% 0% 71% 3% 6% 7% Ireland 386 5% 8% 13% 1% 31% 6% 13% 23% Italy 678 8% 5% 4% 2% 42% 6% 17% 16% Japan 652 4% 12% 6% 2% 57% 4% 8% 8% Malaysia 370 6% 8% 7% 2% 39% 5% 11% 22% Mexico 369 20% 4% 7% 3% 36% 5% 10% 17% Netherlands 303 7% 7% 4% 2% 40% 10% 8% 23% New Zealand 442 10% 12% 4% 10% 23% 3% 11% 26% Nigeria 203 5% 8% 17% 3% 5% 4% 20% 38% Peru 244 10% 7% 12% 5% 20% 2% 11% 33% Saudi Arabia 307 7% 8% 5% 4% 14% 7% 13% 42% Singapore 624 4% 9% 15% 2% 36% 10% 6% 18% South Korea 221 3% 25% 4% 4% 17% 9% 4% 33% Spain 424 12% 8% 4% 2% 38% 3% 17% 17% Sweden 397 16% 12% 3% 3% 24% 11% 17% 15% Switzerland 304 7% 10% 14% 2% 24% 7% 9% 28% Taiwan 230 4% 15% 7% 3% 27% 17% 8% 20% United Arab Emirates 474 9% 10% 5% 7% 16% 2% 7% 45% United Kingdom 647 6% 4% 13% 1% 36% 5% 11% 23% United States 13,572 9% 6% 8% 10% 22% 7% 5% 32%

Project Management Salary Survey –Seventh Edition 259
Type of Project
Country n= Business
Transformation Constuction Engineering IT Manufacturing Operations Australia 734 31% 15% 18% 67% 4% 18% Belgium 275 27% 8% 16% 73% 5% 20% Brazil 901 19% 17% 26% 62% 8% 17% Canada 3,023 25% 19% 21% 57% 5% 21% China 1,528 8% 9% 28% 47% 13% 11% Colombia 369 18% 20% 30% 58% 4% 16% France 456 18% 8% 26% 57% 9% 16% Germany 742 24% 5% 18% 65% 6% 14% Hong Kong 259 19% 5% 14% 72% 4% 19% India 1,689 18% 3% 12% 81% 4% 15% Ireland 386 24% 13% 17% 61% 6% 20% Italy 678 13% 7% 19% 67% 8% 13% Japan 652 8% 6% 19% 74% 5% 6% Malaysia 370 19% 15% 19% 65% 5% 16% Mexico 369 25% 8% 13% 73% 5% 17% Netherlands 303 31% 5% 14% 68% 8% 20% New Zealand 442 22% 24% 26% 49% 4% 13% Nigeria 203 21% 27% 33% 32% 4% 26% Peru 244 16% 27% 26% 58% 4% 19% Saudi Arabia 307 14% 42% 32% 37% 7% 16% Singapore 624 17% 4% 18% 71% 7% 18% South Korea 221 6% 36% 33% 26% 8% 8% Spain 424 18% 10% 20% 70% 4% 15% Sweden 397 21% 8% 25% 54% 9% 17% Switzerland 304 30% 9% 18% 66% 7% 19% Taiwan 230 13% 10% 25% 39% 19% 13% United Arab Emirates 474 13% 47% 28% 34% 4% 16% United Kingdom 647 32% 6% 12% 72% 4% 19% United States 13,572 23% 10% 18% 63% 7% 25%

Project Management Salary Survey –Seventh Edition 260
Type of Project (Continued)
Country n= Quality Mgnt. Regulatory Compliance R&D
Supply Chain Mgnt. Other
Australia 734 7% 9% 4% 6% 5% Belgium 275 12% 7% 7% 8% 8% Brazil 901 12% 6% 8% 9% 6% Canada 3,023 9% 9% 9% 6% 7% China 1,528 11% 2% 18% 7% 2% Colombia 369 8% 6% 3% 6% 10% France 456 9% 2% 12% 7% 4% Germany 742 11% 4% 15% 7% 6% Hong Kong 259 8% 5% 9% 6% 4% India 1,689 14% 4% 8% 6% 3% Ireland 386 10% 9% 9% 6% 5% Italy 678 7% 3% 10% 6% 7% Japan 652 9% 1% 7% 3% 2% Malaysia 370 9% 7% 9% 7% 5% Mexico 369 13% 8% 4% 8% 8% Netherlands 303 8% 6% 16% 12% 7% New Zealand 442 7% 10% 7% 4% 8% Nigeria 203 14% 6% 4% 7% 8% Peru 244 12% 7% 7% 4% 10% Saudi Arabia 307 11% 5% 5% 4% 8% Singapore 624 7% 6% 8% 7% 5% South Korea 221 11% 0% 9% 3% 2% Spain 424 7% 4% 10% 5% 6% Sweden 397 7% 3% 19% 10% 7% Switzerland 304 13% 8% 17% 11% 4% Taiwan 230 12% 4% 20% 7% 3% United Arab Emirates 474 12% 5% 3% 4% 6% United Kingdom 647 6% 8% 10% 8% 5% United States 13,572 11% 11% 11% 7% 8%

Project Management Salary Survey –Seventh Edition 261
Position Description
Country n= Dir. PMO Portfolio
Mgr. Program
Mgr. PM
Consultant Australia 734 4% 7% 19% 9% Belgium 275 5% 7% 17% 9% Brazil 901 6% 8% 15% 12% Canada 3,023 5% 6% 17% 8% China 1,528 9% 4% 17% 4% Colombia 369 10% 5% 14% 8% France 456 6% 7% 19% 9% Germany 742 4% 3% 17% 10% Hong Kong 259 2% 3% 20% 8% India 1,689 2% 5% 24% 4% Ireland 386 6% 7% 21% 4% Italy 678 5% 5% 18% 7% Japan 652 7% 3% 10% 6% Malaysia 370 5% 4% 17% 5% Mexico 369 8% 7% 18% 10% Netherlands 303 4% 7% 25% 6% New Zealand 442 5% 8% 18% 6% Nigeria 203 1% 4% 14% 6% Peru 244 3% 7% 13% 9% Saudi Arabia 307 8% 3% 13% 7% Singapore 624 3% 6% 14% 5% South Korea 221 10% 5% 6% 6% Spain 424 6% 5% 18% 6% Sweden 397 6% 2% 13% 11% Switzerland 304 9% 6% 14% 7% Taiwan 230 5% 4% 17% 7% United Arab Emirates 474 6% 4% 11% 6% United Kingdom 647 5% 8% 24% 5% United States 13,572 6% 6% 24% 7%

Project Management Salary Survey –Seventh Edition 262
Position Description (Continued)
Country n= Project Mgr. III
Project Mgr. II
Project Mgr. I
PM Specialist
Australia 734 28% 19% 9% 6% Belgium 275 32% 21% 7% 3% Brazil 901 19% 18% 13% 10% Canada 3,023 27% 20% 11% 6% China 1,528 13% 20% 23% 9% Colombia 369 22% 20% 11% 9% France 456 20% 25% 9% 5% Germany 742 27% 27% 10% 3% Hong Kong 259 19% 22% 19% 7% India 1,689 16% 26% 19% 4% Ireland 386 24% 20% 13% 4% Italy 678 26% 24% 11% 4% Japan 652 13% 20% 31% 10% Malaysia 370 18% 29% 20% 2% Mexico 369 22% 17% 14% 4% Netherlands 303 28% 25% 5% 1% New Zealand 442 31% 20% 8% 5% Nigeria 203 14% 13% 30% 17% Peru 244 16% 18% 21% 13% Saudi Arabia 307 13% 22% 21% 13% Singapore 624 18% 20% 26% 8% South Korea 221 9% 16% 26% 21% Spain 424 24% 26% 11% 3% Sweden 397 37% 23% 5% 3% Switzerland 304 31% 19% 10% 4% Taiwan 230 11% 20% 17% 18% United Arab Emirates 474 16% 23% 18% 16% United Kingdom 647 26% 22% 8% 3% United States 13,572 28% 16% 9% 4%
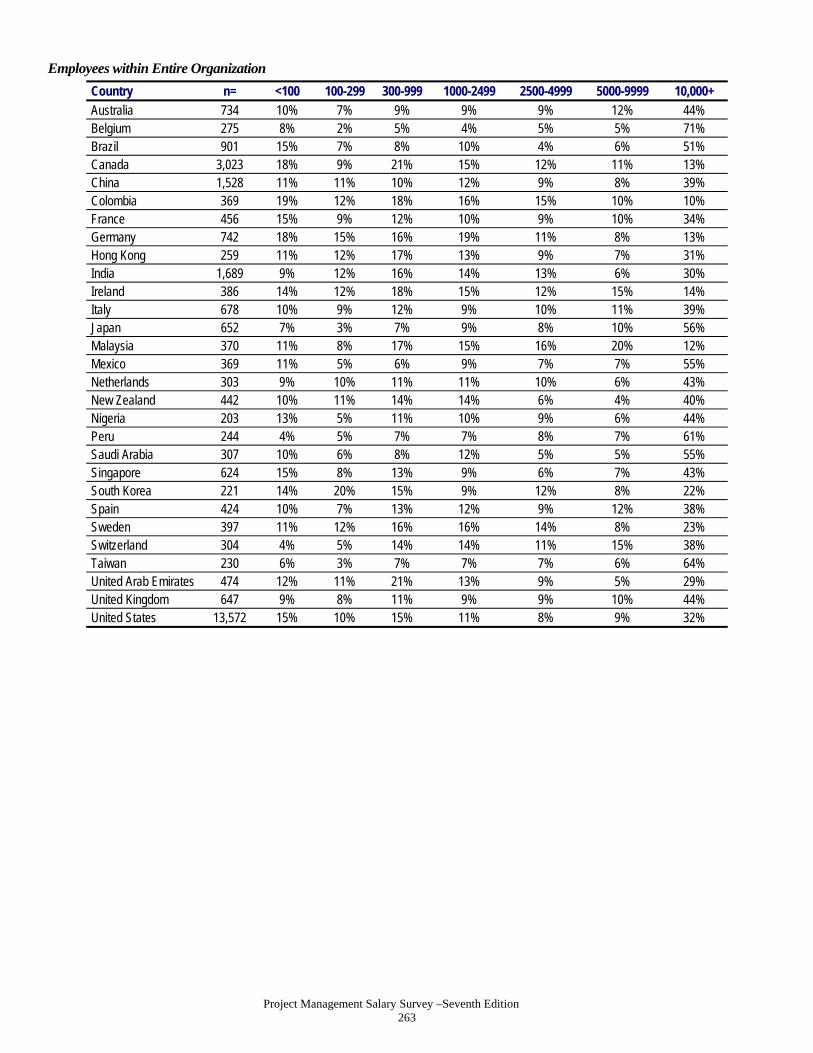
Project Management Salary Survey –Seventh Edition 263
Employees within Entire Organization
Country n= <100 100-299 300-999 1000-2499 2500-4999 5000-9999 10,000+
Australia 734 10% 7% 9% 9% 9% 12% 44% Belgium 275 8% 2% 5% 4% 5% 5% 71% Brazil 901 15% 7% 8% 10% 4% 6% 51% Canada 3,023 18% 9% 21% 15% 12% 11% 13% China 1,528 11% 11% 10% 12% 9% 8% 39% Colombia 369 19% 12% 18% 16% 15% 10% 10% France 456 15% 9% 12% 10% 9% 10% 34% Germany 742 18% 15% 16% 19% 11% 8% 13% Hong Kong 259 11% 12% 17% 13% 9% 7% 31% India 1,689 9% 12% 16% 14% 13% 6% 30% Ireland 386 14% 12% 18% 15% 12% 15% 14% Italy 678 10% 9% 12% 9% 10% 11% 39% Japan 652 7% 3% 7% 9% 8% 10% 56% Malaysia 370 11% 8% 17% 15% 16% 20% 12% Mexico 369 11% 5% 6% 9% 7% 7% 55% Netherlands 303 9% 10% 11% 11% 10% 6% 43% New Zealand 442 10% 11% 14% 14% 6% 4% 40% Nigeria 203 13% 5% 11% 10% 9% 6% 44% Peru 244 4% 5% 7% 7% 8% 7% 61% Saudi Arabia 307 10% 6% 8% 12% 5% 5% 55% Singapore 624 15% 8% 13% 9% 6% 7% 43% South Korea 221 14% 20% 15% 9% 12% 8% 22% Spain 424 10% 7% 13% 12% 9% 12% 38% Sweden 397 11% 12% 16% 16% 14% 8% 23% Switzerland 304 4% 5% 14% 14% 11% 15% 38% Taiwan 230 6% 3% 7% 7% 7% 6% 64% United Arab Emirates 474 12% 11% 21% 13% 9% 5% 29% United Kingdom 647 9% 8% 11% 9% 9% 10% 44% United States 13,572 15% 10% 15% 11% 8% 9% 32%

Project Management Salary Survey –Seventh Edition 264
Number of People on Project Teams
Country n= 1-4 5-9 10-14 15-19 20+
Australia 608 15% 34% 20% 9% 22% Belgium 216 6% 38% 25% 11% 21% Brazil 702 14% 31% 22% 9% 24% Canada 2,426 13% 36% 23% 10% 17% China 1,142 12% 32% 22% 7% 27% Colombia 307 10% 36% 24% 10% 20% France 325 14% 27% 23% 14% 23% Germany 652 12% 28% 24% 11% 26% Hong Kong 182 22% 40% 19% 7% 12% India 1,490 5% 17% 22% 12% 44% Ireland 314 12% 44% 21% 6% 17% Italy 572 14% 33% 25% 8% 20% Japan 483 9% 22% 24% 10% 35% Malaysia 319 12% 43% 18% 8% 20% Mexico 315 15% 36% 21% 10% 19% Netherlands 253 8% 32% 25% 8% 26% New Zealand 360 13% 41% 28% 5% 14% Nigeria 148 12% 30% 23% 9% 26% Peru 202 14% 40% 19% 9% 18% Saudi Arabia 252 15% 24% 20% 8% 33% Singapore 477 19% 40% 20% 7% 15% South Korea 144 15% 32% 19% 8% 26% Spain 381 15% 36% 20% 8% 20% Sweden 349 6% 29% 26% 12% 28% Switzerland 253 13% 35% 24% 10% 18% Taiwan 124 25% 29% 21% 5% 20% United Arab Emirates 381 13% 29% 22% 4% 32% United Kingdom 555 9% 30% 22% 8% 32% United States 11,025 13% 36% 22% 10% 20%

Project Management Salary Survey –Seventh Edition 265
Average Budget of Projects
Country n= <$100K $100K-$499K $500K-$999K $1mm-$10mm $10mm+
Australia 733 6% 21% 15% 36% 15% Belgium 273 5% 23% 20% 34% 10% Brazil 895 9% 22% 17% 28% 15% Canada 3,006 10% 21% 17% 33% 13% China 1,465 20% 26% 12% 18% 9% Colombia 369 12% 24% 15% 29% 13% France 452 8% 19% 17% 32% 12% Germany 739 7% 21% 17% 37% 10% Hong Kong 250 20% 34% 14% 18% 3% India 1,667 13% 28% 15% 27% 7% Ireland 386 16% 26% 13% 29% 6% Italy 666 9% 24% 20% 30% 12% Japan 607 8% 23% 16% 29% 9% Malaysia 369 11% 28% 17% 26% 11% Mexico 365 15% 27% 21% 23% 5% Netherlands 303 7% 21% 18% 39% 9% New Zealand 440 10% 23% 20% 35% 9% Nigeria 198 10% 25% 11% 27% 13% Peru 243 28% 23% 11% 22% 11% Saudi Arabia 304 5% 13% 10% 26% 37% Singapore 616 13% 27% 15% 30% 7% South Korea 212 7% 14% 8% 25% 31% Spain 422 11% 29% 18% 30% 8% Sweden 396 6% 19% 15% 38% 14% Switzerland 301 7% 24% 17% 36% 11% Taiwan 226 21% 22% 17% 12% 9% United Arab Emirates 467 7% 14% 14% 24% 34% United Kingdom 645 5% 19% 15% 41% 13% United States 13,478 9% 22% 16% 34% 10%

Project Management Salary Survey –Seventh Edition 266
How has your total compensation changed over the past 12 months?
Country n= Decreased Remained the same Inc. <1%
Inc. 1-2.9%
Inc. 3-4.9%
Inc. 5-9.9%
Inc. 10+%
Australia 734 2% 25% 3% 16% 22% 13% 18% Belgium 275 5% 21% 6% 31% 18% 8% 10% Brazil 901 3% 16% 2% 5% 15% 33% 26% Canada 3,023 4% 25% 3% 25% 20% 12% 11% China 1,528 3% 20% 2% 6% 10% 24% 35% Colombia 369 3% 12% 2% 12% 35% 13% 23% France 456 5% 28% 8% 25% 18% 11% 6% Germany 742 3% 23% 7% 32% 16% 9% 9% Hong Kong 259 3% 29% 1% 11% 21% 17% 17% India 1,689 1% 13% 1% 3% 7% 29% 47% Ireland 386 18% 39% 3% 19% 8% 6% 8% Italy 678 5% 50% 7% 16% 8% 7% 6% Japan 652 10% 46% 8% 17% 8% 7% 4% Malaysia 370 1% 18% 1% 12% 20% 28% 20% Mexico 369 4% 25% 3% 7% 18% 13% 30% Netherlands 303 3% 28% 8% 30% 15% 9% 7% New Zealand 442 3% 31% 2% 22% 19% 10% 12% Nigeria 203 2% 28% 2% 5% 7% 14% 41% Peru 244 0% 28% 2% 7% 9% 17% 37% Saudi Arabia 307 2% 29% 1% 6% 15% 19% 28% Singapore 624 2% 23% 3% 13% 21% 20% 17% South Korea 221 2% 19% 2% 14% 27% 25% 11% Spain 424 7% 38% 7% 23% 9% 9% 6% Sweden 397 1% 13% 4% 38% 20% 13% 11% Switzerland 304 6% 23% 8% 33% 13% 9% 9% Taiwan 230 5% 32% 7% 15% 17% 16% 8% United Arab Emirates 474 4% 44% 3% 9% 9% 16% 14% United Kingdom 647 5% 28% 5% 24% 16% 8% 14% United States 13,572 5% 22% 3% 23% 25% 11% 11%

Project Management Salary Survey –Seventh Edition 267
How do you expect your total compensation to change over the next 12 months?
Country n= Decrease Remain the
same Inc. <1% Inc.
1-2.9% Inc.
3-4.9% Inc.
5-9.9% Inc.
10+% Australia 734 1% 18% 2% 18% 28% 19% 13% Belgium 275 0% 22% 6% 36% 20% 9% 7% Brazil 901 0% 10% 0% 4% 13% 34% 39% Canada 3,023 2% 22% 4% 28% 25% 13% 8% China 1,528 1% 7% 1% 2% 6% 16% 68% Colombia 369 0% 11% 1% 9% 33% 22% 25% France 456 2% 22% 8% 30% 24% 8% 6% Germany 742 1% 24% 7% 34% 18% 9% 7% Hong Kong 259 1% 20% 2% 7% 22% 30% 17% India 1,689 0% 3% 0% 2% 5% 24% 64% Ireland 386 10% 40% 5% 19% 11% 8% 7% Italy 678 3% 46% 9% 17% 11% 8% 6% Japan 652 9% 38% 6% 17% 11% 12% 7% Malaysia 370 0% 12% 2% 6% 16% 33% 31% Mexico 369 0% 14% 0% 7% 18% 22% 38% Netherlands 303 3% 27% 8% 31% 20% 8% 3% New Zealand 442 1% 29% 3% 26% 22% 12% 7% Nigeria 203 0% 9% 0% 3% 5% 15% 66% Peru 244 0% 19% 0% 5% 6% 15% 55% Saudi Arabia 307 1% 20% 3% 3% 16% 24% 34% Singapore 624 1% 13% 3% 11% 23% 24% 25% South Korea 221 3% 12% 1% 11% 28% 30% 14% Spain 424 3% 37% 5% 25% 14% 10% 7% Sweden 397 1% 14% 5% 37% 29% 8% 6% Switzerland 304 2% 28% 6% 34% 13% 10% 6% Taiwan 230 1% 17% 5% 10% 24% 22% 21% United Arab Emirates 474 2% 28% 1% 9% 10% 21% 29% United Kingdom 647 4% 29% 5% 26% 20% 9% 8% United States 13,572 2% 22% 3% 24% 30% 12% 7%

Project Management Salary Survey –Seventh Edition 268
Project Management Career Path within Organization
Country n=
Yes – Clearly Defined
Yes – Informal No
Don’t know
Australia 732 26% 47% 22% 4% Belgium 274 27% 36% 33% 3% Brazil 899 27% 35% 34% 3% Canada 3,011 22% 45% 27% 6% China 1,466 33% 41% 18% 8% Colombia 369 25% 37% 33% 4% France 454 27% 36% 30% 7% Germany 741 41% 32% 23% 4% Hong Kong 253 17% 46% 30% 8% India 1,674 36% 50% 12% 3% Ireland 385 21% 44% 33% 2% Italy 666 23% 31% 40% 6% Japan 612 36% 33% 18% 13% Malaysia 370 25% 56% 14% 5% Mexico 367 34% 37% 25% 4% Netherlands 302 43% 31% 23% 2% New Zealand 442 17% 47% 31% 5% Nigeria 200 23% 51% 21% 6% Peru 243 28% 47% 22% 3% Saudi Arabia 304 19% 46% 28% 7% Singapore 617 21% 51% 19% 8% South Korea 216 42% 34% 17% 7% Spain 421 32% 31% 32% 6% Sweden 395 36% 31% 30% 3% Switzerland 303 30% 38% 28% 4% Taiwan 224 17% 38% 37% 8% United Arab Emirates 465 16% 46% 28% 10% United Kingdom 647 36% 38% 22% 3% United States 13,506 26% 44% 26% 4%

Project Management Salary Survey –Seventh Edition 269
Project Management Career Path Connect to Roles in Upper Management
Country n=
Yes – Clearly Defined
Yes – Informal No
Don’t know
Australia 538 24% 49% 19% 9% Belgium 174 25% 35% 29% 10% Brazil 557 22% 38% 30% 10% Canada 2,006 14% 52% 26% 8% China 1,064 35% 49% 12% 3% Colombia 229 28% 52% 15% 4% France 284 19% 55% 17% 8% Germany 538 31% 57% 7% 5% Hong Kong 158 40% 50% 5% 4% India 1,412 27% 58% 10% 5% Ireland 250 35% 54% 9% 2% Italy 351 21% 60% 12% 7% Japan 417 23% 51% 18% 9% Malaysia 299 51% 37% 7% 5% Mexico 257 27% 35% 28% 9% Netherlands 224 30% 45% 20% 6% New Zealand 281 22% 56% 16% 7% Nigeria 144 22% 31% 35% 12% Peru 177 35% 52% 8% 6% Saudi Arabia 197 19% 43% 31% 7% Singapore 440 22% 58% 13% 8% South Korea 158 29% 56% 12% 3% Spain 260 23% 47% 22% 8% Sweden 264 25% 56% 11% 8% Switzerland 207 38% 48% 8% 6% Taiwan 120 30% 45% 19% 6% United Arab Emirates 280 20% 60% 12% 8% United Kingdom 483 22% 52% 17% 9% United States 9,376 37% 47% 12% 4%

Project Management Salary Survey –Seventh Edition 270
Defined Set of Performance Skills for Project Managers within Organization
Country n=
Yes – Clearly Defined
Yes – Informal No
Don’t know
Australia 728 50% 29% 18% 4% Belgium 273 45% 27% 24% 4% Brazil 888 35% 34% 27% 3% Canada 2,996 40% 32% 23% 5% China 1,453 45% 36% 15% 4% Colombia 364 43% 33% 21% 3% France 449 49% 27% 20% 4% Germany 739 54% 25% 17% 4% Hong Kong 251 27% 33% 31% 8% India 1,656 51% 35% 11% 2% Ireland 385 39% 29% 29% 3% Italy 664 42% 29% 25% 5% Japan 609 41% 32% 18% 8% Malaysia 370 42% 38% 16% 4% Mexico 368 40% 35% 22% 3% Netherlands 299 70% 19% 10% 1% New Zealand 436 41% 32% 23% 4% Nigeria 194 43% 36% 18% 4% Peru 238 36% 42% 19% 3% Saudi Arabia 299 32% 38% 24% 6% Singapore 614 35% 38% 22% 5% South Korea 210 49% 35% 10% 6% Spain 420 44% 30% 23% 3% Sweden 396 47% 23% 25% 4% Switzerland 301 49% 27% 20% 4% Taiwan 220 25% 40% 31% 4% United Arab Emirates 457 34% 41% 22% 3% United Kingdom 646 60% 23% 14% 3% United States 13,401 42% 31% 22% 5%

Project Management Salary Survey –Seventh Edition 271
Equities Offered
Country n= Stock
Options Stocks Neither Australia 729 3% 10% 87% Belgium 273 14% 6% 83% Brazil 876 7% 4% 90% Canada 2,990 7% 11% 84% China 1,469 10% 9% 82% Colombia 361 5% 3% 93% France 454 8% 11% 82% Germany 733 6% 8% 87% Hong Kong 249 5% 4% 91% India 1,668 9% 6% 85% Ireland 382 13% 15% 74% Italy 663 7% 4% 90% Japan 597 9% 4% 87% Malaysia 367 13% 9% 81% Mexico 363 10% 5% 86% Netherlands 302 10% 12% 80% New Zealand 438 2% 5% 93% Nigeria 195 2% 7% 92% Peru 239 8% 5% 87% Saudi Arabia 298 3% 4% 93% Singapore 622 10% 11% 81% South Korea 213 3% 6% 92% Spain 419 7% 9% 86% Sweden 392 5% 11% 84% Switzerland 301 6% 4% 91% Taiwan 218 9% 9% 83% United Arab Emirates 452 2% 2% 97% United Kingdom 640 13% 13% 78% United States 13,407 10% 11% 81%

Project Management Salary Survey –Seventh Edition 272
Employee Benefits
Country n =
Company Car/
Allowance Housing/
Allowance Cell Phone
Usage On Site
Child Care Paid Life Insurance
None of these
Australia 728 13% 2% 59% 1% 18% 34% Belgium 274 62% 2% 82% 1% 16% 12% Brazil 893 76% 6% 76% 2% 62% 12% Canada 2,998 20% 0% 65% 0% 24% 27% China 1,480 21% 4% 54% 7% 61% 21% Colombia 367 61% 68% 60% 12% 26% 8% France 449 13% 2% 58% 1% 45% 27% Germany 728 17% 9% 71% 3% 40% 18% Hong Kong 250 28% 39% 58% 4% 52% 18% India 1,667 75% 85% 49% 8% 26% 8% Ireland 383 12% 4% 61% 3% 41% 24% Italy 669 21% 1% 56% 3% 29% 29% Japan 616 25% 4% 70% 1% 27% 19% Malaysia 367 22% 10% 41% 11% 38% 34% Mexico 364 34% 5% 59% 2% 17% 30% Netherlands 302 15% 1% 75% 4% 49% 16% New Zealand 440 10% 10% 39% 0% 32% 40% Nigeria 198 20% 1% 78% 1% 22% 18% Peru 242 31% 29% 55% 2% 41% 20% Saudi Arabia 303 22% 1% 70% 3% 14% 24% Singapore 621 34% 2% 60% 0% 42% 21% South Korea 213 18% 4% 33% 1% 27% 44% Spain 423 39% 3% 78% 2% 35% 14% Sweden 392 53% 60% 55% 7% 39% 13% Switzerland 300 21% 19% 37% 2% 9% 43% Taiwan 219 50% 3% 61% 1% 50% 15% United Arab Emirates 468 46% 13% 67% 4% 38% 16% United Kingdom 638 7% 2% 53% 1% 53% 25% United States 13,371 26% 3% 53% 2% 65% 20%

Project Management Salary Survey –Seventh Edition 273
Mean Number of Vacation Days
Country n= After 1 year n= After 10 years
Australia 725 17.6 636 25.0 Belgium 263 24.5 258 26.6 Brazil 888 26.7 696 22.8 Canada 2,839 12.8 2791 17.8 China 1,399 9.4 1281 15.0 Colombia 365 15.8 287 15.8 France 424 30.3 423 32.7 Germany 709 28.3 718 28.7 Hong Kong 244 15.0 214 18.4 India 1,604 19.1 1249 22.2 Ireland 359 21.9 362 24.3 Italy 584 25.0 608 27.4 Japan 588 18.2 542 20.5 Malaysia 349 15.3 333 19.4 Mexico 363 10.3 344 18.1 Netherlands 293 27.4 287 28.7 New Zealand 435 17.2 395 18.2 Nigeria 181 21.8 87 22.4 Peru 241 27.4 160 26.1 Saudi Arabia 302 29.2 229 30.2 Singapore 602 16.7 531 20.6 South Korea 204 13.2 187 19.7 Spain 402 23.7 371 24.0 Sweden 387 27.2 377 28.8 Switzerland 292 23.5 283 25.7 Taiwan 214 8.6 188 18.5 United Arab Emirates 467 28.6 309 30.0 United Kingdom 613 23.5 613 25.4 United States 12,916 12.7 12639 19.2
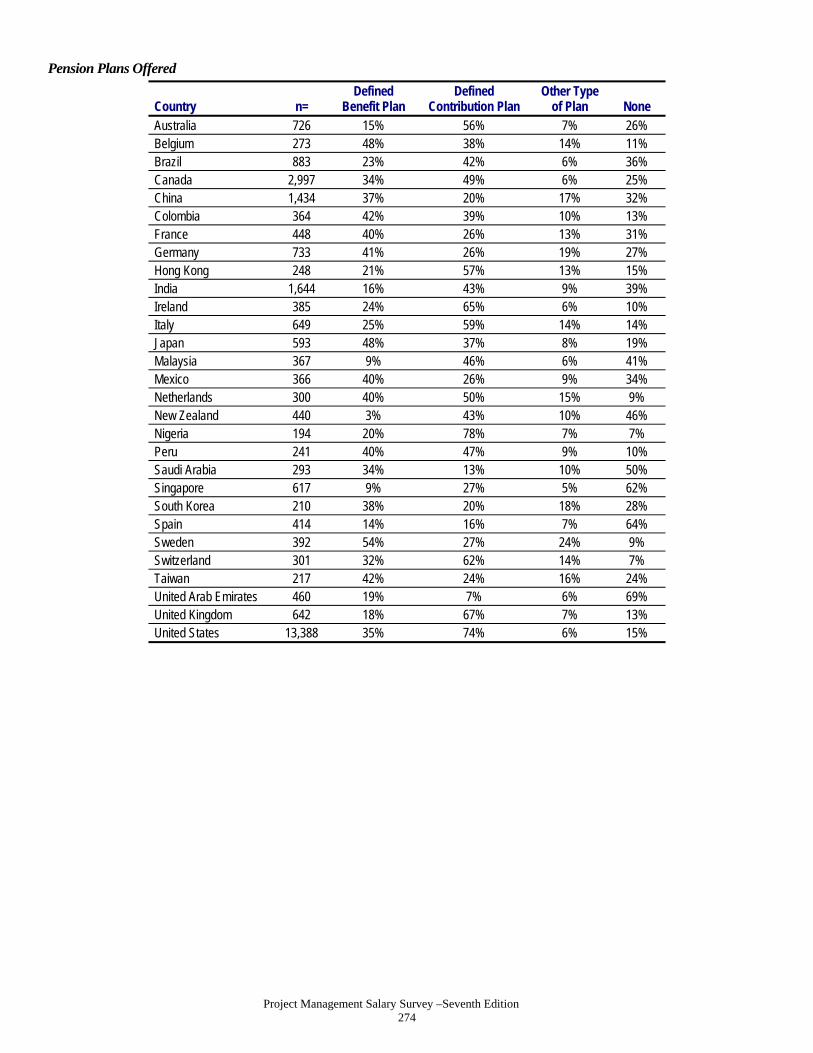
Project Management Salary Survey –Seventh Edition 274
Pension Plans Offered
Country n= Defined
Benefit Plan Defined
Contribution Plan Other Type
of Plan None Australia 726 15% 56% 7% 26% Belgium 273 48% 38% 14% 11% Brazil 883 23% 42% 6% 36% Canada 2,997 34% 49% 6% 25% China 1,434 37% 20% 17% 32% Colombia 364 42% 39% 10% 13% France 448 40% 26% 13% 31% Germany 733 41% 26% 19% 27% Hong Kong 248 21% 57% 13% 15% India 1,644 16% 43% 9% 39% Ireland 385 24% 65% 6% 10% Italy 649 25% 59% 14% 14% Japan 593 48% 37% 8% 19% Malaysia 367 9% 46% 6% 41% Mexico 366 40% 26% 9% 34% Netherlands 300 40% 50% 15% 9% New Zealand 440 3% 43% 10% 46% Nigeria 194 20% 78% 7% 7% Peru 241 40% 47% 9% 10% Saudi Arabia 293 34% 13% 10% 50% Singapore 617 9% 27% 5% 62% South Korea 210 38% 20% 18% 28% Spain 414 14% 16% 7% 64% Sweden 392 54% 27% 24% 9% Switzerland 301 32% 62% 14% 7% Taiwan 217 42% 24% 16% 24% United Arab Emirates 460 19% 7% 6% 69% United Kingdom 642 18% 67% 7% 13% United States 13,388 35% 74% 6% 15%

Project Management Salary Survey –Seventh Edition 275
Mean Hours Worked
Country n= Hours
Expected n= Actual Hours
Worked Australia 723 38.9 717 46.7 Belgium 274 38.8 272 46.8 Brazil 831 41.1 819 47.1 Canada 2,977 38.6 2,942 44.7 China 1,374 40.1 1,338 46.7 Colombia 349 43.5 341 49.1 France 448 37.9 441 46.3 Germany 734 39.6 734 47.2 Hong Kong 245 40.9 238 49.5 India 1,590 42.5 1,554 48.7 Ireland 383 38.5 376 46.3 Italy 657 39.5 645 47.8 Japan 573 39.7 559 49.6 Malaysia 348 40.5 343 48.9 Mexico 339 41.3 337 48.5 Netherlands 302 39.6 301 46.2 New Zealand 437 39.7 434 45.7 Nigeria 162 41.2 160 49.8 Peru 222 43.5 217 49.3 Saudi Arabia 280 43.4 270 49.9 Singapore 587 41.4 573 49.2 South Korea 196 40.5 187 50.2 Spain 418 40.1 417 46.7 Sweden 393 39.6 391 43.9 Switzerland 304 40.7 303 47.4 Taiwan 205 40.6 197 49.5 United Arab Emirates 428 43.6 423 50.4 United Kingdom 638 38.1 637 46.0 United States 13,392 40.1 13,272 47.8

Project Management Salary Survey –Seventh Edition 276
Appendix B – Survey Instrument
2011 PMI Salary Survey – 7th Edition PMI is the leading global organization serving the project management profession. PMI's 2011 Salary Survey is designed to create a profile of compensation levels and trends for project management professionals. The survey helps employers and project managers identify market compensation rates for various levels of project management professionals.
Your individual feedback remains completely confidential. PMI will not have access to survey data, except in aggregate. To assure confidentiality, PMI has engaged PeriscopeIQ, compensation and strategy specialists, to conduct the research.
PMI will make key portions of these data available, in aggregate form, to all respondents. Thank you for your valuable assistance.
Professional Profile
1) Please select the category that best reflects your employment status: 1. Full-time self-employed CONTINUE 2. Part-time self-employed TERMINATE 3. Full-time employed CONTINUE 4. Part-time employed TERMINATE 5. Currently unemployed TERMINATE 6. Student TERMINATE 7. Retired TERMINATE
2) Please select the country in which your office is located: If you are paid according to a scale based on an office in another location (for instance, your company's headquarters) please select the country corresponding to that location.
1. Australia 2. Belgium 3. Brazil 4. Canada 5. China 6. Columbia 7. France 8. Germany 9. Hong Kong 10. India 11. Ireland 12. Italy 13. Japan 14. Malaysia 15. Mexico 16. Netherlands
17. New Zealand 18. Nigeria 19. Peru 20. Saudi Arabia 21. Singapore 22. South Korea 23. Spain 24. Sweden 25. Switzerland 26. Taiwan 27. United Arab Emirates 28. United Kingdom 29. United States 30. Other; please specify:
TERMINATE

Project Management Salary Survey –Seventh Edition 384
(IF COUNTRY IS US, ASK:) 3) Please select the state in which your office is located:
1. Alabama 2. Alaska 3. Arizona 4. Arkansas 5. California 6. Colorado 7. Connecticut 8. Delaware 9. District of Columbia 10. Florida 11. Georgia 12. Hawaii 13. Idaho 14. Illinois 15. Indiana 16. Iowa 17. Kansas 18. Kentucky 19. Louisiana 20. Maine 21. Maryland 22. Massachusetts 23. Michigan 24. Minnesota 25. Mississippi 26. Missouri
27. Montana 28. Nebraska 29. Nevada 30. New Hampshire 31. New Jersey 32. New Mexico 33. New York 34. North Carolina 35. North Dakota 36. Ohio 37. Oklahoma 38. Oregon 39. Pennsylvania 40. Rhode Island 41. South Carolina 42. South Dakota 43. Tennessee 44. Texas 45. Utah 46. Vermont 47. Virginia 48. Washington 49. West Virginia 50. Wisconsin 51. Wyoming
(IF COUNTRY IS US, ASK:) 4) Please enter the name and the ZIP Code of the city or town where your office is located: Please enter your five (5) digit ZIP Code only.
City/Town Name:_________________ City/Town Zip Code:______________ (00000-99999)
(IF COUNTRY IS CANADA, ASK:) 5) Please select the province in which your office is located:
1. Alberta 2. British Columbia 3. Manitoba 4. New Brunswick 5. Newfoundland and Labrador 6. Northwest Territories 7. Nova Scotia 8. Nunavut 9. Ontario 10. Prince Edward Island 11. Quebec 12. Saskatchewan 13. Yukon Territory
6) What is your total number of years of work experience? Please round to the nearest whole number
_______________(Enter Response) (0-99)

Project Management Salary Survey –Seventh Edition 385
7) How many years in total have you worked in project management? Please round to the nearest whole number _______________(Enter Response) (0-99) 8) Please select the highest level of formal education you have obtained: Examples of post-graduate professional degrees are those in law and in medicine. Such degrees typically require three or more years of post-graduate formal education.
1. High school degree or equivalent, or less 2. Some college or Associate degree or equivalent 3. 4-year college degree or equivalent 4. Master’s degree or equivalent 5. Doctoral or post-graduate professional degree or equivalent
9) Do you have an academic degree in project management? 1. Yes 2. No
10) Are you currently a member of PMI? 1. Yes 2. No
11) Are you a PMP®? 1. Yes 2. No
(IF A PMP, ASK:) 12) For how many years have you been a PMP®? Please round to the nearest whole number
_______________(Enter Response) (0-32)
13) Other than PMP, which, if any, professional certifications do you hold? If you select anything outside of a PMI credential, please identify the certification.
1. CAPM® 2. PgMP® 3. PMI-SP® 4. PMI-RMP® 5. Internal company-sponsored certification 6. Certification from an association or organization not centered on project management 7. Certification from a project management association other than PMI 8. None
If you selected a certification from somewhere other than PMI, please describe it.
(Ask for each PMI certification selected in Question 13) 14) Please indicate how long you have held each certification below: Please round to the nearest whole number _______________(Enter Response)
CAPM® (0-7) PgMP® (0-5) PMI-SP® (0-4) PMI-RMP® (0-4)
15) Are you: 1. Male 2. Female

Project Management Salary Survey –Seventh Edition 386
16) Please select the category that best reflects the industry focus of your organization: 1. Aerospace 2. Business services (advertising, marketing, staffing, etc.) 3. Construction 4. Consulting 5. Engineering 6. Financial services 7. Food and beverage 8. Government 9. Healthcare 10. Information technology 11. Insurance 12. Legal 13. Manufacturing 14. Pharmaceuticals 15. Real Estate 16. Resources (Agriculture, Mining, Coal, Gas, Oil) 17. Telecommunications 18. Training/education 19. Utility 20. Other, please specify:
17) Which of these best describes the functional area to which you report? 1. Administration/General Management 2. Consulting 3. Customer Service/Public Relations 4. Engineering 5. Finance 6. Human Resources 7. Information Technology/Information Systems 8. Operations/Manufacturing 9. Project Management Department or PMO 10. Quality Management 11. Research and Development 12. Sales/Marketing 13. Supply Chain Management/Logistics 14. Training and Education 15. Other, please specify:
18) Which types of projects do you primarily manage or participate in? Please select all that apply.
1. Business Transformation 2. Construction 3. Engineering 4. Information Technology 5. Manufacturing 6. Operations 7. Quality Management 8. Regulatory Compliance 9. Research and Development 10. Supply Chain Management/Logistics 11. Other, please specify:
19) What is your job title?

Project Management Salary Survey –Seventh Edition 387
20) Please read the following descriptions carefully and select the position that best matches your current responsibilities: The answer does not have to be the same as your current job title. Instead, select the position on the basis of your actual current activities and responsibilities.
1. Chief Executive Officer (CEO): This position is the top executive position, responsible for the overall direction of the business and for achieving maximum return on invested capital. Leads the efforts of the senior executives and works with them to develop current and long-range objectives, policies, and procedures for the organization. Represents the organization to its customers, the financial community, and the general public
2. Chief Information Officer (CIO): Identifies changes and trends in computer and systems technology and interprets their meaning to senior management. Participates in overall business planning bringing a current knowledge and future vision of technology and systems as related to the organization's competitive position. Determines long-term organization-wide information needs and develops overall strategy for information needs, systems development and hardware acquisition, and integration, including mainframe, mini, macro, and client/server computing applications. Acts to assure integrity of organization data, proprietary information, and related intellectual property through information security and access management. Acts as highest interface with non-technical user functions in determining overall information systems approach. Frequently reports to a Chief Executive Officer.
3. Director of Project Management/Director of Project Management Office (PMO): Responsible for the organization-wide integration of consistent project management methodologies and terminology. May also be responsible for the operations of the organization's Project Management Office.
4. Portfolio Manager: In the extreme case, will be responsible for the management of the entire set of projects undertaken by an organization or division in a manner that optimizes the ROI from these projects and ensures their alignment with the organization’s strategic objectives. Particularly in large organizations, a Portfolio Manager may only have responsibility for a subset of the organization’s projects and their alignment to organizational strategic objectives. While the portfolio of projects may share resources, they may have diverse objectives and may be operationally independent of one another. A Portfolio Manager may interact with senior managers, executives, and major stakeholders to establish strategic plans and objectives for an organization. May also be responsible for the organization-wide integration of consistent project management methodologies and terminology.
5. Program Manager: Responsible for the coordinated management of multiple related projects, and in many (most) cases, ongoing operations, which are directed toward a common objective. Works with constituent Project Managers (who are responsible to the program manager for the execution of their project and its impact on the program) to monitor cost, schedule, and technical performance of component projects and operations, while working to ensure the ultimate success of the program. Generally responsible for determining and coordinating the sharing of resources among their constituent projects to the overall benefit of the program. Usually responsible for stakeholder management, particularly stakeholders external to the organization.
6. Project Manager III: Under general direction of either a Portfolio Manager or in some cases a Program Manager, oversees high-priority projects, which often require considerable resources and high levels of functional integration. In addition to duties of a Project Manager II, takes projects from original concept through final implementation. Interfaces with all areas affected by the project including end users, distributors, and vendors. Ensures adherence to quality standards and reviews project deliverables. May communicate with a company executive regarding the status of specific projects.
7. Project Manager II: Under general supervision of either a Portfolio Manager or a Program Manager, oversees multiple projects or one larger project. In addition to duties of Project Manager I, responsible for assembling project team, assigning individual responsibilities, identifying appropriate resources needed, and developing schedule to ensure timely completion of project. May communicate with a Senior Project Manager, Functional Area Manager, or Program Manager regarding status of specific projects.
8. Project Manager I: Under direct supervision of a more senior project manager, a Portfolio Manager, or a Program Manager, oversees a small project or phase(s) of a larger project. Responsibility for all aspects of the project over the entire project life (initiate, plan, execute, control, close). Must be familiar with system scope and project objectives, as well as the role and function of each team member, to effectively coordinate the activities of the team.
9. Project Management Specialist: Responsible for a specific area of project management (i.e., scheduling, cost management, risk management, etc.). Supports the Project Manager and his or her associated projects.

Project Management Salary Survey –Seventh Edition 388
10. Project Management Consultant: Acts as internal or external consultant to one or more levels of program or functional management in the areas of project planning, management, best practices, execution and analysis. Is likely to have held senior project management positions at one or more organizations before becoming a consultant.
11. Functional Manager: Responsible for the operations of any of the organization's functional groups (e.g., Accounting, Human Resources, Information Technology, etc.). May also be responsible for the organization-wide integration of policies and procedures related to the functional group.
12. Educator/Trainer: Primarily responsible for educating students, practitioners, or internal training professionals in the field of project management. Usually highly experienced and/or educated in project management. An educator is likely to work in a university or an educational institution setting. A trainer is likely to work as a part of a consulting organization or work within an organization as an internal trainer.
21) How well does the position description you selected above fit with your current job responsibilities? A match of 70% to 80% between your current responsibilities and those of the job you selected above would be considered a 'Good' fit. A match greater than 80% would be considered an 'Excellent' fit, and a match of less than 60% would be considered a 'Poor' fit.
1. Excellent 2. Good 3. Fair 4. Poor
Compensation Data
22) Please select the currency in which you are paid: If your currency is not listed, please select 'United States Dollars'.
1. Australian Dollars 2. Brazilian Reais 3. British (UK) Pounds 4. Canadian Dollars 5. Chinese Yuan 6. European Union Euros 7. Columbian Peso 8. Hong Kong Dollars 9. Indian Rupees 10. Japanese Yen
11. Malaysian Ringgit 12. Mexican Peso 13. New Zealand Dollars 14. Nigerian Naira 15. Peruvian Nuevo Sol 16. Saudi Riyals 17. Singapore Dollars 18. South Korean Won 19. Taiwan Dollars 20. United Arab Emirates Dirham 21. United States Dollars
GUIDELINES FOR REPORTING COMPENSATION
Annualized Earnings (2011) Enter gross annualized earnings by adding your estimated earnings from now until 31 December 2011 to your actual earnings since 1 January 2011. Gross earnings are before any deductions for taxes, healthcare or other insurance premiums, retirement plan contributions, etc.
Exclude bonus, special cash awards, or compensation for overtime. Exclude the value of employer-paid benefits like health insurance, retirement plans, housing allowance, car allowance, or travel reimbursements unless their value is rolled into your salary without itemization.
Include any commissions based on pre-specified criteria, such as sales revenues.
Bonus (2010) Include bonus(es) based on performance criteria and/or your organization's results. If a bonus earned in 2010 is paid in 2011, include it. Do not include one-time signing bonuses, deferred profit sharing, or special awards that are variable and unpredictable.

Project Management Salary Survey –Seventh Edition 385
Other monetary compensation Include any compensation not in the two categories above. For example — special awards such as one-time signing bonus, recognition awards and holiday bonuses, housing allowance and car allowance. If you get free housing or free use of a car or any other benefit of value, but without a specified monetary value, please use the market value of the benefit as an estimate. Do not include employer contributions to pension plans (such as 401(k) plans in the U.S., Provident Funds in India, etc.).
Exclusions Do not include in any of the compensation elements the value of long-term incentives (stock options, contingent stock grants, etc.), deferred compensation, unused vacation, or employer contributions to pension plans that involve vesting.
Questions Compensation practices may vary substantially across different organizations and countries. These guidelines may help:
1. Include only compensation that you have received or will receive in 2011 and that is owed to you unconditionally.
2. If you are unsure of how to allocate certain compensation elements, use your best judgment according to the above guidelines.
Still have a question? Send an email to [email protected].
23) Please enter amounts comprising your total compensation in {selected currency}: Please make sure you have read and understood the guidelines above before responding to this question. If your currency was not listed and you selected 'United States Dollars', convert your currency to US$ using the conversion rates found here. Please round to whole numbers and do not use currency symbols, commas or other delimiters when entering values.
a. Annualized salary/earnings (2011) ____________________ b. Bonus (2010) ____________________ c. Other monetary compensation (2010) ____________________
24) Please indicate the types of equities-based compensation you received in the past year. Please do not include any stock (i.e., shares) that you purchased (at full price or discounted price) as part of a stock purchase plan or any shares that were contributed by the company to your pension benefits as part of matching funds.
1. Stock options 2. Stock (i.e., shares)Neither
25) Do you receive any of the following employee benefits? Please select all that apply.
1. Company car or transportation allowance 2. Housing or housing allowance 3. Cell phone usage 4. On-site child care 5. Paid life insurance 6. None of these
26) How many days of paid vacation per year do you receive? Please enter whole numbers only.
1. After 1 year of service________________(0-60) 2. After 10 years of service______________ (0-60)
27) Please select the type(s) of pension plans you are entitled to from your employer. Defined Benefit Plans typically base retirement benefits on your compensation, age and length of service at the time you retire. Typically you make no contributions to these types of plans. Defined Contribution Plans typically base retirement benefits on contributions that you make (which are often tax-free or
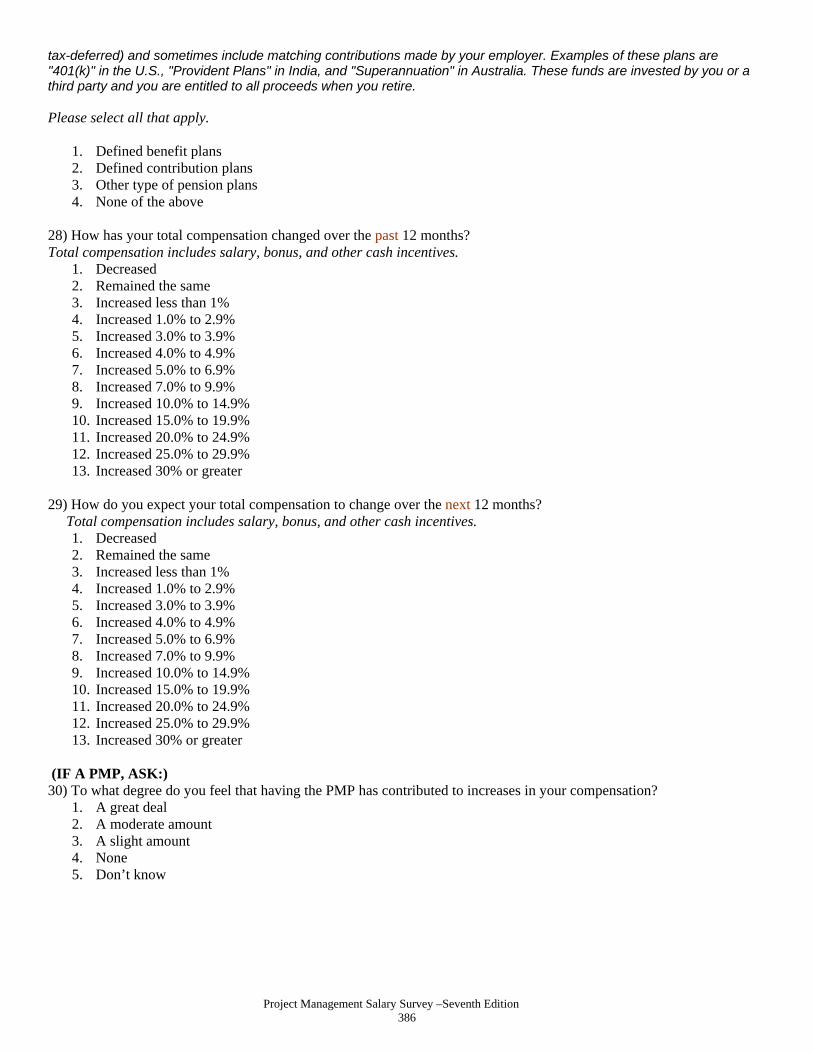
Project Management Salary Survey –Seventh Edition 386
tax-deferred) and sometimes include matching contributions made by your employer. Examples of these plans are "401(k)" in the U.S., "Provident Plans" in India, and "Superannuation" in Australia. These funds are invested by you or a third party and you are entitled to all proceeds when you retire. Please select all that apply.
1. Defined benefit plans 2. Defined contribution plans 3. Other type of pension plans 4. None of the above
28) How has your total compensation changed over the past 12 months? Total compensation includes salary, bonus, and other cash incentives.
1. Decreased 2. Remained the same 3. Increased less than 1% 4. Increased 1.0% to 2.9% 5. Increased 3.0% to 3.9% 6. Increased 4.0% to 4.9% 7. Increased 5.0% to 6.9% 8. Increased 7.0% to 9.9% 9. Increased 10.0% to 14.9% 10. Increased 15.0% to 19.9% 11. Increased 20.0% to 24.9% 12. Increased 25.0% to 29.9% 13. Increased 30% or greater
29) How do you expect your total compensation to change over the next 12 months? Total compensation includes salary, bonus, and other cash incentives.
1. Decreased 2. Remained the same 3. Increased less than 1% 4. Increased 1.0% to 2.9% 5. Increased 3.0% to 3.9% 6. Increased 4.0% to 4.9% 7. Increased 5.0% to 6.9% 8. Increased 7.0% to 9.9% 9. Increased 10.0% to 14.9% 10. Increased 15.0% to 19.9% 11. Increased 20.0% to 24.9% 12. Increased 25.0% to 29.9% 13. Increased 30% or greater
(IF A PMP, ASK:) 30) To what degree do you feel that having the PMP has contributed to increases in your compensation?
1. A great deal 2. A moderate amount 3. A slight amount 4. None 5. Don’t know

Project Management Salary Survey –Seventh Edition 387
Work Environment 31) Please indicate the total number of employees within your entire organization:
1. Less than 100 2. 100 to 299 3. 300 to 999 4. 1,000 to 2,499 5. 2,500 to 4,999 6. 5,000 to 9,999 7. 10,000 or more
32) How many hours do you work per week? Please round to the nearest whole number.
1. Required number of hours worked per company policy: 2. Actual number of hours you typically work:
33.) How many days of training (internal and external) did you receive over the last 12 months? _____________________ 34) Do you manage project teams? Yes No (If yes, ask) 35) What is the typical number of people that serve on project teams that you manage? _______________(Enter Response) 36) In US dollars ($), what is the average budget for the projects you manage? To convert local currency to US dollars ($), please use the conversion rates found here.
1. Less than $100,000 2. $100,000 to $499,999 3. $500,000 to $999,999 4. $1 million to $10 million 5. More than $10 million 6. Don’t manage projects 7. Don't know
Career Path 37) Is there a career path for someone engaged in project or program management within your organization?
1. Yes - Clearly defined and in writing 2. Yes - Informal or unstated career path 3. No 4. Don't Know
(If there is a Career Path, ASK:) 38) Is the career path for someone engaged in project or program management connected to roles in upper management?
1. Yes - Clearly defined and in writing 2. Yes - Informal or unstated 3. No 4. Don't Know

Project Management Salary Survey –Seventh Edition 388
39) Does your organization have a set of performance skills (or skill sets) defined for project or program managers? 1. Yes - Clearly defined and in writing 2. Yes - Informal or unstated 3. No 4. Don't Know
40.) How much experience do you have in each of the following project management techniques?
ROTATE 0 1-5 6-10 11-20 21-50 Over 50 Agile Project Management/Scrum Extreme Project Management Process Based Project Management Event Chain Project Management Interactive Project Management Incremental Project Management Project Portfolio Management Program Management Earned Value Management Lean Project Management Critical Chain Project Management Waterfall Project Management Risk Management Change Management Resource management to Estimate and Allocate Resources
41) Do you consider project management to be your primary profession, or a service you provide as part of another profession (e.g., you are a functional manager who often/sometimes manages projects)?
1. Project management is my primary profession 2. Project management is a service I provide as part of another professionNeither. I am simply interested in the topic
of project management
42) Which of these includes the total annual revenue of your organization (in US $)? To convert local currency to US $, please use the conversion rates found here.
1. Less than $50 million 2. $50 to $499 million 3. $500 to $999 million 4. $1 to $4.99 billion 5. $5 billion or more 6. Not applicable/Don't know
43) About how much does your organization spend on all its projects annually (in US $)? To convert local currency to US $, please use the conversion rates found here.
1. Less than $1 million 2. $1 to $9 million 3. $10 to $49 million 4. $50 to $249 million 5. $250 to $499 million 6. $500 to $999 million 7. $1 billion or more 8. Don't know
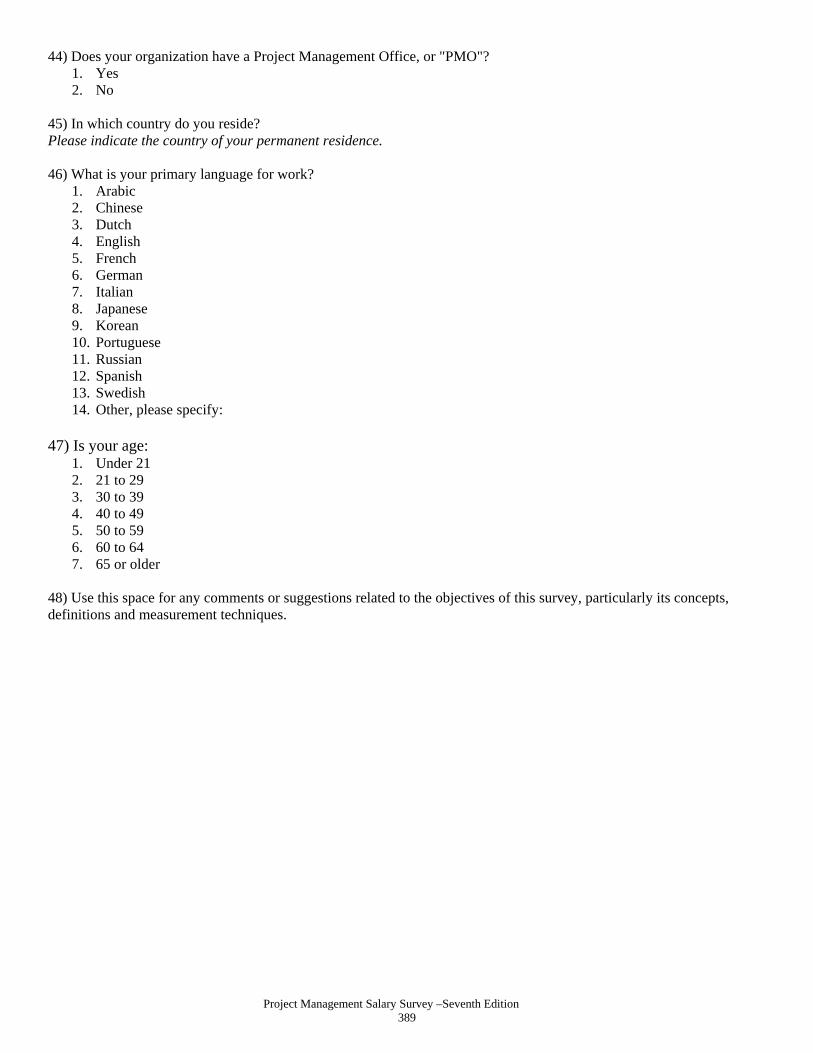
Project Management Salary Survey –Seventh Edition 389
44) Does your organization have a Project Management Office, or "PMO"? 1. Yes 2. No
45) In which country do you reside? Please indicate the country of your permanent residence. 46) What is your primary language for work?
1. Arabic 2. Chinese 3. Dutch 4. English 5. French 6. German 7. Italian 8. Japanese 9. Korean 10. Portuguese 11. Russian 12. Spanish 13. Swedish 14. Other, please specify:
47) Is your age:
1. Under 21 2. 21 to 29 3. 30 to 39 4. 40 to 49 5. 50 to 59 6. 60 to 64 7. 65 or older
48) Use this space for any comments or suggestions related to the objectives of this survey, particularly its concepts, definitions and measurement techniques.

Project Management Salary Survey –Seventh Edition 390
Appendix C – Sampling Methodology
The PMI Project Management Salary Survey, Seventh Edition, was sent to a stratified sampling of customers from 29 different countries. Countries included in the sampling were selected based on two factors; concentration of PMI members within a given country and the desire to represent all regions of the globe. The survey invitation was sent via an email that included a link to the Web-based survey. Using a Web-based survey benefited the research in several ways, including the ability to survey a large number of respondents at a relatively low cost (as compared to other data collection methods), a condensed data collection time period, and a fairly high response rate. PMI contracted with a third-party market research vendor, Quantum Performance Solutions (QPS), for this project. QPS used its PeriscopeIQ Web survey technology platform (www.periscopeiq.com) to conduct this research. QPS is a global strategy consulting and market research firm with focus on scientific rigor and research-based methodologies. The salary survey was conducted according to QPS's best compensation survey practices, including confidentiality of individual responses. The first email invitation to the Web-based survey was sent to 193,605 professionals on 7 June 2011. Non-responders were sent a total of three reminder emails throughout the five-week field period, which lasted until 11 July 2011. Data collection for the survey closed with a total of 40,587 completed surveys, yielding a response rate of 21%. The data collected were run through extensive quality checks by QPS, resulting in the elimination of 9,764 cases based on the following criteria:
Reason Number Deleted Not full time 2,288 Selected “poor fit” for job position 880 Selected undefined country = other 347 Analyzed to be an anomaly 175 Analyzed to be an outlier or violated other best compensation practice principles
2,574
Excluded job titles 3,500
As shown in the table above, 880 respondents were eliminated from the data because they noted that the position descriptions provided did not adequately represent their current job responsibilities. These 880 respondents represent only 2% of the total respondent population, which indicates that the position descriptions provided in the survey are fairly accurate and widely used.
As a result of this data cleaning process, a total of 30,823 respondents were included in the full report.
Due to the fact that a stratified sampling methodology was used rather than a random sampling, data are not reported in aggregate form (all countries combined together) in this report. Therefore, we have not calculated an overall sample error for the entire sample, but have instead included sample error estimates for each country in the table below.

Project Management Salary Survey –Seventh Edition 391
Country Respondents Sample Error* Australia 734 +/-3.6% Belgium 275 +/-5.9% Brazil 901 +/-3.3% Canada 3,023 +/-1.8% China 1,528 +/-2.5% Colombia 369 +/-5.1% France 456 +/-4.6% Germany 742 +/-3.6% Hong Kong 259 +/-6.1% India 1,689 +/-2.4% Ireland 386 +/-5.0% Italy 678 +/-3.8% Japan 652 +/-3.8% Malaysia 370 +/-5.1% Mexico 369 +/-5.1% Netherlands 303 +/-5.6% New Zealand 442 +/-4.7% Nigeria 203 +/-6.9% Peru 244 +/-6.3% Saudi Arabia 307 +/-5.6% Singapore 624 +/-3.9% South Korea 221 +/-6.6% Spain 424 +/-4.8% Sweden 397 +/-4.9% Switzerland 304 +/-5.6% Taiwan 230 +/-6.5% United Arab Emirates 474 +/-4.5% United Kingdom 647 +/-3.9% United States 13,572 +/-0.8% *Sample error at the 95% confidence level.

Project Management Salary Survey –Seventh Edition 392
Appendix D – Exchange Rates
Currency Exchange Rate* (USD to local)
Exchange Rate* (local to USD)
Australian Dollars 1.073 0.9319
EU Euros (Belgium) 1.452 0.6887
Brazilian Reais 0.06408 1.5605
Canadian Dollars 1.037 0.9643
Chinese Yuan 0.1547 6.4635
Columbian Peso 0.000562 1778.0000
EU Euros (France) 1.452 0.6887
EU Euros (Germany) 1.452 0.6887
Hong Kong Dollars 0.1285 7.7813
Indian Rupees 0.0224 44.6000
EU Euros (Ireland) 1.452 0.6887
EU Euros (Italy) 1.452 0.6887
Japanese Yen 0.0124 80.6571
Malaysian Ringgit 0.3313 3.0180
Mexican Peso 0.0853 11.7214
EU Euros (Netherlands) 1.452 0.6887
New Zealand Dollars 0.8283 1.2073
Nigerian Naira 0.00657 149.9222
Peruvian Nuevo Sol 0.3634 2.7520
Saudi Riyals 0.2667 3.7501
Singapore Dollars 0.8146 1.2276
South Korean Won 0.000937 1067.3504
EU Euros (Spain) 1.452 0.6887
Swedish Kronor 0.1586 6.3035
Swiss Francs 1.188 0.8416
Taiwan Dollars 0.0348 28.7120
United Arab Emirates Dirham 0.2723 3.6728
United Kingdom (British) Pounds 1.606 0.6225
United States Dollars 1.000 1.000 *Exchange rates as of 30 June 2011