# LIENT 3AT ISFACTION 3UR VEY - uit.stanford.edu · - iscellane ous 3ervicesfr om the 'e ne ral 3ur...
132
Transcript of # LIENT 3AT ISFACTION 3UR VEY - uit.stanford.edu · - iscellane ous 3ervicesfr om the 'e ne ral 3ur...

Watertown, MA 02472tel: 617.924.4501 fax:
617.924.8070morassociates.com
Brian McDonald, [email protected]


Survey Population
Selection Criteria - All Communities• Had to have a SUNet ID number.• Must have an email address.
Selection Criteria - Faculty• Tenured, Tenure Line, Appointment Line are included.• SLAC Faculty were excluded given they rely on their own systems to a large
extent.• Visiting faculty were not included.
Selection Criteria - Students• Included undergraduates and graduates living on campus.• Off campus were excluded.
Selection Criteria - Administrative• ITSS staff were excluded.• Certain staff members were excluded given computers are not part of how
they get their work done.• SLAC (Stanford Linear Accelerator Center) staff were excluded.
The following table presents a summary of the population and sample size esti-mates that result from applying the above criteria.

Since 2003, MIT’s Information Services and Technology (IS&T) has partnered with IT Services in IT survey efforts at both schools. In 2005 MIT IS&T moved from a 5-point scale to a 6-point scale for rating satisfaction. Beginning with this survey, we have adopted the 6-point scale as well. Because we have an interest in tracking changes in satisfaction over time, we conducted a parallel survey with students and administrative staff that was identical in all respects, save it used a 5-point scale for satisfaction questions onlyfor satisfaction questions only. While this provided us with the necessary data to for satisfaction questions only. Wh i l e t h i s p ro v i d e d u s w i t h t h e n e c e s s ar y d at a t o for satisfaction questions onlydevelop a formula for converting satisfaction means from previous surveys, this report does not reflect satisfaction responses from the parallel survey. However, given that all of the other questions were identical, we have incorporated these additional responses into this report.
6-Point Satisfaction Scale Questions SampleThe Target Sample Size was derived assuming a Confidence Interval of .20 and a Confidence Level of 99%. For satisfaction questions, Stanford received a 45% response rate from the randomly selected population that was asked to complete the survey. For all other questions, Stanford received a response rate of 49% from the randomly selected population. This robust response rate increases the likelihood that these results accurately represent the views of the Stanford community.
Group Initial Sample Size
Target No. Responses
Actual No. Responses
Projected Response
Rate
Actual Response
Rate
Faculty 500 150 172 30% 34%
Students 376 150 162 40% 43%
Admin Staff 300 150 197 50% 66%
Total 1176 450 531 30%-50% 45%
• For any cumulative statistics there will be relative over and under weighting of the specific groups (faculty, students and staff) because each groups representation of the population is not equal to their target sample representation of 33%.


Mean Tot Pos Count
13a. Reliability of wired network 4.98 93% 427
3e. HelpSU: Ease of submitting online request 4.96 92% 382
36a. Keeps the IT systems it provides up and running 4.95 95% 473
3c. HelpSU: Professionalism 4.94 93% 379
20c. ESS: Ease of installing software 4.93 96% 394
13b. Availability of wired network 4.92 91% 427
25d. Symantec/Norton Antivirus 4.90 92% 378
2d. 5-HELP: Professionalism 4.84 91% 342
14. Stanford network Services overall 4.77 93% 469
24a. Timeliness of security software updates 4.74 95% 413
Mean Tot Neg Count
18b. Stanford Web Mail features 3.91 34% 463
9b. Telephone billing system/statements 3.97 31% 239
12c. Wireless guest registration process 3.98 34% 229
15e. Ability to use Stanford services while traveling outside the U.S. 4.09 28% 224
18a. Stanford Web Mail speed 4.09 29% 472
18c. Stanford Web Mail ease of use 4.10 27% 468
21d. Sftwr Lic: Cost 4.13 25% 213
15a. Ability to use Stanford services working from home using Stanford modem 4.19 25% 165
12b. Availability of wireless network on campus 4.24 25% 367
25b. SpySweeper 4.29 25% 287

Question Mean Tot Pos Count
13a. Reliability of wired network 5.05 96% 142
3c. HelpSU: Professionalism 5.01 92% 112
36a. Keeps the IT systems it provides up and running 4.99 95% 159
20c. ESS: Ease of installing software 4.93 94% 134
25d. Symantec/Norton Antivirus 4.93 94% 127
3e. HelpSU: Ease of submitting online request 4.92 89% 112
2d. 5-HELP: Professionalism 4.88 91% 116
13b. Availability of wired network 4.87 90% 144
24a. Timeliness of security software updates 4.81 96% 138
21e. Sftwr Lic: Responsiveness of staff to your requests 4.78 92% 59
Question Mean Tot Pos Count
3e. HelpSU: Ease of submitting online request 4.91 94% 101
25d. Symantec/Norton Antivirus 4.90 92% 125
20c. ESS: Ease of installing software 4.86 96% 134
13a. Reliability of wired network 4.82 90% 135
36a. Keeps the IT systems it provides up and running 4.78 94% 141
13b. Availability of wired network 4.77 88% 131
3c. HelpSU: Professionalism 4.73 90% 100
13c. High-speed (gigabit) access to other universities 4.71 86% 93
20d. ESS: Helpfulness of Stanford-specifi c software documentation 4.62 91% 128
14. Stanford network services overall 4.60 91% 152
Question Mean Tot Pos Count
13b. Availability of wired network 5.10 95% 152
13c. High-speed (gigabit) access to other universities 5.09 94% 90
13a. Reliability of wired network 5.06 94% 150
36a. Keeps the IT systems it provides up and running 5.05 97% 173
3c. HelpSU: Professionalism 5.02 96% 167
3e. HelpSU: Ease of submitting online request 5.02 93% 169
20c. ESS: Ease of installing software 5.01 98% 126
2d.5-HELP: Professionalism 4.96 93% 149
25a. BigFix 4.94 97% 68
14. Stanford network services overall 4.94 96% 159

Question Mean Tot Neg Count
15e. Ability to use Stanford servics while traveling outside the U.S. 3.94 37% 106
9b. Telephone billing system/statements 3.97 30% 64
18b. Web Mail features 4.01 33% 146
12b. Availability of network on campus 4.12 26% 133
18c. Web Mail ease of use 4.14 29% 149
25b. SpySweeper 4.16 30% 83
12c. Wireless guest registration process 4.16 29% 70
21c. Sftwr Lic: Ease of ordering/purchasing 4.16 21% 76
21d. Sftwr Lic: Cost 4.17 23% 77
18a. Web Mail speed 4.19 29% 150
Question Mean Tot Neg Count
S2. Wireless networking in the residences 3.36 49% 108
9c. Voice mail 3.37 45% 60
18b. Web Mail features 3.52 47% 148
21d. Sftwr Lic: Cost 3.55 42% 69
12c. Wireless guest registration process 3.60 47% 88
18a. Web Mail speed 3.66 45% 148
25a. BigFix 3.72 40% 57
15a. Ability to use Stanford servics working from home using Stanford modem 3.74 37% 46
S10e. Central File Storage (AFS) 3.79 34% 85
18c. Web Mail ease of use 3.89 33% 148
Question Mean Tot Neg Count
9b. Telephone billing system/statements 4.02 30% 89
15e. Ability to use Stanford servics while traveling outside the U.S. 4.15 20% 46
18b. Web Mail features 4.17 23% 169
18c. Web Mail ease of use 4.25 21% 171
12c. Wireless guest registration process 4.28 23% 71
9a. Telephone problem resolution 4.34 22% 116
18a. Web Mail speed 4.37 16% 174
15a. Ability to use Stanford servics working from home using Stanford modem 4.38 20% 69
A2c. Ability to submit multiple requests at time of order 4.42 20% 71
2a. 5-HELP: Ability to get through to a person 4.45 17% 151

5-HELP
2003 2005 2006 Chnge Since 2005
2a. 5-HELP: Ability to get through to a person 4.57 4.43 4.43 0.00
2b. 5-HELP: Timeliness of initial response to your inquiry 4.54 4.45 4.49 0.04
2c. 5-HELP: Turnaround time for resolving your problem 4.45 4.41 4.40 -0.01
2d. 5-HELP: Professionalism 5.05 4.81 4.84 0.03
2e. 5-HELP: Ability to solve problem 4.73 4.62 4.49 -0.12
HelpSU
2003 2005 2006 Chnge
3a. HelpSU: Timeliness of initial response to your inquiry 4.77 4.53 4.59 0.06
3b. HelpSU: Turnaround time for resolving your problem 4.63 4.45 4.43 -0.03
3c. HelpSU: Professionalism 5.14 4.89 4.94 0.05
3d. HelpSU: Ability to solve problem 4.98 4.69 4.62 -0.08
3e. HelpSU: Ease of submitting online request 4.69 4.89 4.96 0.07
Problem Resolution Overall
2003 2005 2006 Chnge
4. Problem resolution 4.75 4.60 4.62 0.02
Telecommunications Services
2003 2005 2006 Chnge
9c. Voice mail 4.69 4.46 4.31 -0.15
11. Telecommunications overall 4.74 4.43 4.44 0.01
Network Services
2003 2005 2006 Chnge
12b. Availability of wireless network on campus 4.12 4.11 4.24 0.14
14. Stanford network services overall 4.92 4.74 4.77 0.03
Essential Stanford Software
2003 2005 2006 Chnge
20a. ESS: Available selection of software 5.03 4.52 4.62 0.10
20b. ESS: Timeliness of Stanford release of updated versions after vendor release 4.74 4.42 4.64 0.21
20d. ESS: Helpfulness of Stanford-specifi c software documentation 4.72 4.37 4.69 0.32
ITSS Overall
2003 2005 2006 Chnge
37. IT Services services as a whole 4.81 4.65 4.69 0.04

Additional Questions
2005 2006 Chnge Since 2005
1. Customer-oriented approach 4.54 4.61 0.07 *
9a. Telephone problem resoluion 4.25 4.26 0.01
9b. Billing system/statements 3.90 3.97 0.07
12a. Wireless signal strength/quality of connection 4.28 4.31 0.03
12c. Wireless guest registration process 3.88 3.98 0.10
S2. Wireless networking in the residences 4.14 3.36 -0.78
19. Stanford email overall 4.84 4.6 -0.24
21a. Sftwr Lic: Available selection of software 4.30 4.45 0.15 **
21b. Sftwr Lic: Timeliness of updates 4.18 4.56 0.38 **
21c. Sftwr Lic: Ease of ordering/purchasing 4.16 4.3 0.14 **
24a. Timeliness of security software updates 4.65 4.74 0.09
24b. Effectiveness of documentation and instructions in securing your computer and preventing attacks
4.45 4.53 0.08
24c. Effectiveness of documentation and instructions in recovering from incidents 4.27 4.41 0.14
Additional Questions (Students Only)
2005 2006 Chnge Since 2005
S10a. Web development and publishing tools 4.03 4.13 0.10
S10b. Email quota 3.94 4.27 0.33
S10c. Wired network bandwidth 4.36 4.48 0.12
S10d. Cable TV 3.96 4.02 0.06
S10e. Central File Storage (AFS) 3.94 3.79 -0.15
IT Services Site and Ordering Methods (Administrative Staff Only)
2005 2006 Chnge Since 2005
A1a. IT Services site 4.46 4.51 0.05
A1b. Online HelpSU request 4.57 4.93 0.36
A1c. Phone-in HelpSU request 4.25 4.73 0.48
A2a. Time to complete order form/communicate necessary information 4.39 4.64 0.25
A2b. Ease of access to ordering method 4.45 4.66 0.21
A2c. Ability to submit multiple requests at time of order 4.09 4.42 0.33
A2d. Time interval between submission of order and completion of order 4.17 4.57 0.40

Somewhat Important
Important Very Important
Total Imp
Mean Std Dev
99% CI+-
Count
17a. Better spam fi ltering 15% 21% 56% 91% 5.18 1.15 0.08 766
17b. Better centralized spam auto-deletion
16% 21% 51% 87% 4.98 1.35 0.10 750
17c. Better virus detection 16% 20% 47% 83% 4.87 1.39 0.10 753
17d. More reliable sending and receiving
19% 24% 38% 81% 4.70 1.37 0.10 739
6b. Self-help information on services you already have
22% 32% 28% 82% 4.61 1.25 0.10 635
6a. General information about services, features, rates and ordering
22% 31% 28% 81% 4.58 1.28 0.10 648
6c. News and status of systems and services (e.g., service outages)
19% 31% 26% 76% 4.47 1.35 0.10 636
17e. More disk space 18% 25% 31% 74% 4.44 1.51 0.11 744
34d. Expanded wireless networking
16% 24% 30% 69% 4.18 1.73 0.14 624


Satisfaction with Aspects of Telecommunications Mean N Detail
9c. Voice mail 4.31 341 Enter
9a. Telephone problem resolution 4.26 272 Enter
9b. Telephone billing
system/statements3.97 239 Enter
Satisfaction with Telecommunications Overall Mean N Detail
11. Telecommunications overall 4.44 457 Enter
F
S
A
F
S
A


Satisfaction that IT Services Takes a "Customer-Oriented" Approach Mean N Detail
1. Customer-oriented approach 4.61 419 Enter
Satisfaction with Aspects of 5-HELP Mean N Detail
2d. 5-HELP: Professionalism 4.84 342 Enter
2e. 5-HELP: Ability to solve
problem4.49 346 Enter
2b. 5-HELP: Timeliness of initial
response to your inquiry4.49 343 Enter
2a. 5-HELP: Ability to get through
to a person4.43 348 Enter
2c. 5-HELP: Turnaround time for
resolving your problem4.40 343 Enter
F
S
A

1 Customer-oriented approach
Mean VD D SD SS S VS Count Std. Dev. 99% CI+-
All 4.61 3% 3% 6% 24% 48% 16% 419 1.09 0.14
Faculty 4.63 3% 4% 5% 23% 43% 21% 135
Students 4.50 1% 2% 10% 31% 49% 8% 123
Admin 4.69 4% 2% 3% 20% 52% 19% 161
2a 5-HELP: Ability to get through to a person
Mean VD D SD SS S VS Count Std. Dev. 99% CI+-
All 4.43 3% 8% 7% 24% 42% 16% 348 1.22 0.17
Faculty 4.51 3% 8% 4% 23% 44% 18% 119
Students 4.27 1% 8% 14% 27% 40% 10% 78
Admin 4.45 3% 8% 7% 25% 41% 17% 151
2b 5-HELP: Timeliness of initial response to your inquiry
Mean VD D SD SS S VS Count Std. Dev. 99% CI+-
All 4.49 3% 5% 9% 23% 41% 18% 343 1.23 0.17
Faculty 4.48 6% 4% 4% 26% 40% 19% 118
Students 4.32 1% 6% 17% 26% 32% 17% 77
Admin 4.59 3% 4% 9% 19% 47% 18% 148
2c 5-HELP: Turnaround time for resolving your problem
Mean VD D SD SS S VS Count Std. Dev. 99% CI+-
All 4.40 5% 6% 9% 22% 41% 17% 343 1.30 0.18
Faculty 4.32 8% 6% 8% 22% 37% 19% 116
Students 4.32 4% 7% 9% 29% 37% 14% 76
Admin 4.51 3% 5% 10% 19% 46% 17% 151
2d 5-HELP: Professionalism
Mean VD D SD SS S VS Count Std. Dev. 99% CI+-
All 4.84 2% 3% 5% 18% 46% 27% 342 1.09 0.15
Faculty 4.88 2% 4% 3% 16% 43% 31% 116
Students 4.56 4% 4% 6% 22% 45% 18% 77
Admin 4.96 1% 1% 5% 16% 48% 29% 149
2e 5-HELP: Ability to solve problem
Mean VD D SD SS S VS Count Std. Dev. 99% CI+-
All 4.49 4% 7% 7% 20% 41% 21% 346 1.32 0.18
Faculty 4.47 5% 6% 7% 23% 40% 20% 120
Students 4.25 5% 9% 13% 18% 38% 17% 77
Admin 4.64 3% 6% 5% 18% 44% 23% 149

Satisfaction with Aspects of HelpSU Mean N Detail
3e. HelpSU: Ease of submitting
online request4.96 382 Enter
3c. HelpSU: Professionalism 4.94 379 Enter
3d. HelpSU: Ability to solve
problem4.61 386 Enter
3a. HelpSU: Timeliness of initial
response to your inquiry4.59 395 Enter
3b. HelpSU: Turnaround time for
resolving your problem4.42 388 Enter
Satisfaction with Problem Resolution Overall Mean N Detail
4. Problem resolution overall 4.61 460 Enter
Satisfaction with Specified Web Sites as Computing Resources Mean N Detail
5b (F,A). helpsu.stanford.edu
(HelpSU: for submitting help
requests)
4.74 268 Enter
5a (F,A). computing.stanford.edu
(Stanford's Central Computing
Website)
4.71 171 Enter
5c (F,A). ithelp.stanford.edu (Self-
help site)4.55 121 Enter
5d (F,A). it-services.stanford.edu
(Our organization's website)4.47 148 Enter

3a HelpSU: Timeliness of initial response to your inquiry
Mean VD D SD SS S VS Count Std. Dev. 99% CI+-
All 4.59 2% 5% 8% 22% 43% 20% 395 1.15 0.15
Faculty 4.60 3% 5% 6% 21% 44% 21% 119
Students 4.56 0% 6% 10% 24% 45% 16% 105
Admin 4.61 2% 5% 9% 22% 42% 21% 171
3b HelpSU: Turnaround time for resolving your problem
Mean VD D SD SS S VS Count Std. Dev. 99% CI+-
All 4.43 5% 4% 11% 23% 39% 18% 388 1.28 0.17
Faculty 4.42 8% 4% 5% 25% 38% 20% 114
Students 4.39 2% 6% 11% 30% 36% 16% 103
Admin 4.46 4% 4% 14% 16% 43% 19% 171
3c HelpSU: Professionalism
Mean VD D SD SS S VS Count Std. Dev. 99% CI+-
All 4.94 1% 3% 3% 18% 46% 30% 379 0.99 0.13
Faculty 5.01 1% 3% 4% 14% 42% 36% 112
Students 4.73 0% 4% 6% 21% 51% 18% 100
Admin 5.02 1% 2% 1% 18% 45% 33% 167
3d HelpSU: Ability to solve problem
Mean VD D SD SS S VS Count Std. Dev. 99% CI+-
All 4.62 4% 4% 8% 20% 41% 24% 386 1.25 0.16
Faculty 4.57 5% 5% 4% 23% 38% 24% 115
Students 4.47 4% 4% 11% 23% 40% 19% 101
Admin 4.74 2% 4% 8% 17% 43% 26% 170
3e HelpSU: Ease of submitting online request
Mean VD D SD SS S VS Count Std. Dev. 99% CI+-
All 4.96 1% 2% 4% 16% 44% 32% 382 1.02 0.13
Faculty 4.92 2% 4% 5% 15% 38% 36% 112
Students 4.91 0% 1% 5% 21% 49% 25% 101
Admin 5.02 1% 2% 4% 14% 44% 35% 169
4 Problem resolution overall
Mean VD D SD SS S VS Count Std. Dev. 99% CI+-
All 4.62 3% 3% 7% 21% 46% 20% 460 1.17 0.14
Faculty 4.63 5% 5% 5% 18% 44% 24% 153
Students 4.47 2% 3% 8% 29% 46% 11% 122
Admin 4.71 3% 3% 6% 18% 48% 22% 185
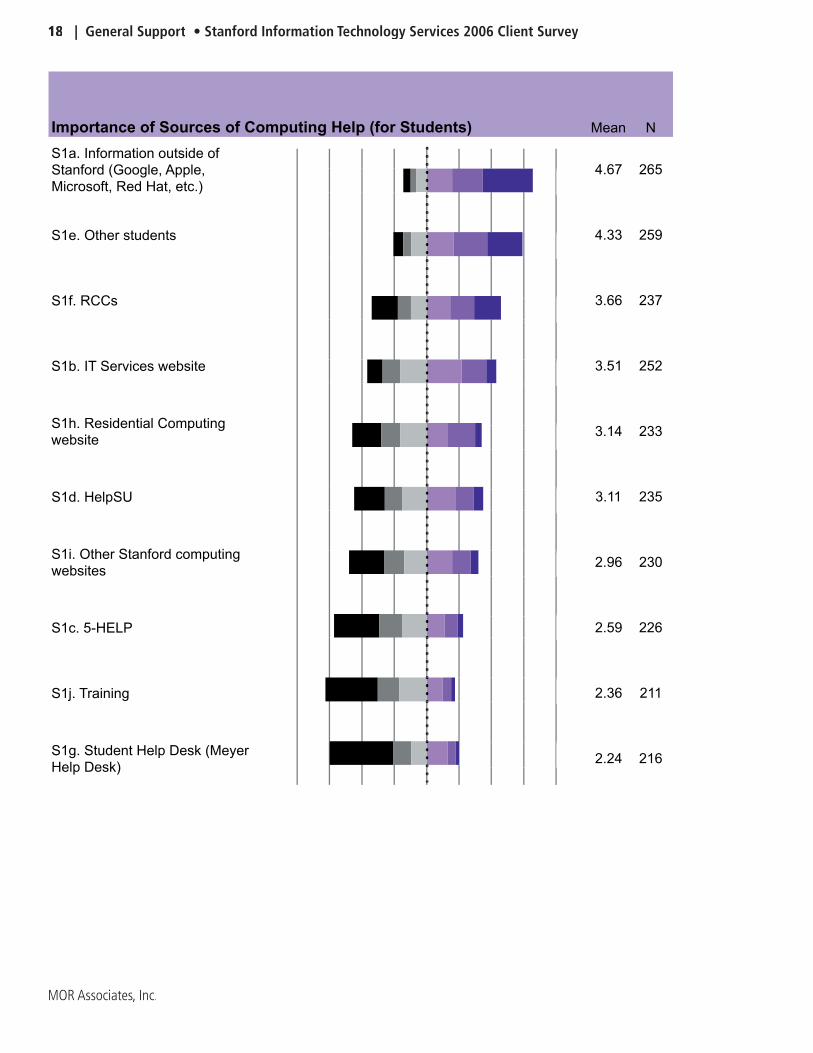
Importance of Sources of Computing Help (for Students) Mean N Detail
S1a. Information outside of
Stanford (Google, Apple,
Microsoft, Red Hat, etc.)
4.67 265 Enter
S1e. Other students 4.33 259 Enter
S1f. RCCs 3.66 237 Enter
S1b. IT Services website 3.51 252 Enter
S1h. Residential Computing
website3.14 233 Enter
S1d. HelpSU 3.11 235 Enter
S1i. Other Stanford computing
websites2.96 230 Enter
S1c. 5-HELP 2.59 226 Enter
S1j. Training 2.36 211 Enter
S1g. Student Help Desk (Meyer
Help Desk)2.24 216 Enter

31h (S) Other, please specify below
Daily Weekly Monthly <Monthly Never Count
Students 6% 0% 2% 2% 90% 124
S1a Information outside of Stanford (Google, Apple, Microsoft, Red Hat, etc.)
Mean 1-VU 2 3 4 5 6-VI Count Std. Dev. 99% CI+-
Students 4.67 6% 4% 8% 20% 24% 38% 265 1.45 0.23
S1b IT Services website
Mean 1-VU 2 3 4 5 6-VI Count Std. Dev. 99% CI+-
Students 3.51 12% 14% 20% 27% 19% 8% 252 1.45 0.24
S1c 5-HELP
Mean 1-VU 2 3 4 5 6-VI Count Std. Dev. 99% CI+-
Students 2.60 35% 18% 19% 14% 10% 4% 226 1.54 0.26
S1d HelpSU
Mean 1-VU 2 3 4 5 6-VI Count Std. Dev. 99% CI+-
Students 3.12 24% 13% 19% 23% 14% 8% 235 1.59 0.27
S1e Other students
Mean 1-VU 2 3 4 5 6-VI Count Std. Dev. 99% CI+-
Students 4.33 8% 6% 12% 21% 26% 27% 259 1.52 0.24
S1f RCCs
Mean 1-VU 2 3 4 5 6-VI Count Std. Dev. 99% CI+-
Students 3.67 20% 10% 12% 18% 19% 21% 237 1.81 0.30
S1g Student Help Desk (Meyer Help Desk)
Mean 1-VU 2 3 4 5 6-VI Count Std. Dev. 99% CI+-
Students 2.25 49% 14% 12% 16% 6% 3% 216 1.48 0.26
S1h Residential Computing website
Mean 1-VU 2 3 4 5 6-VI Count Std. Dev. 99% CI+-
Students 3.15 22% 15% 21% 16% 21% 5% 233 1.58 0.27
S1i Other Stanford computing websites
Mean 1-VU 2 3 4 5 6-VI Count Std. Dev. 99% CI+-
Students 2.97 27% 15% 17% 20% 14% 6% 230 1.60 0.27
S1j Training
Mean 1-VU 2 3 4 5 6-VI Count Std. Dev. 99% CI+-
Students 2.37 40% 17% 21% 12% 7% 3% 211 1.43 0.25

Satisfaction with Aspects of HelpSU Mean N Detail
3e. HelpSU: Ease of submitting
online request4.96 382 Enter
3c. HelpSU: Professionalism 4.94 379 Enter
3d. HelpSU: Ability to solve
problem4.61 386 Enter
3a. HelpSU: Timeliness of initial
response to your inquiry4.59 395 Enter
3b. HelpSU: Turnaround time for
resolving your problem4.42 388 Enter
Satisfaction with Problem Resolution Overall Mean N Detail
4. Problem resolution overall 4.61 460 Enter
Satisfaction with Specified Web Sites as Computing Resources Mean N Detail
5b (F,A). helpsu.stanford.edu
(HelpSU: for submitting help
requests)
4.74 268 Enter
5a (F,A). computing.stanford.edu
(Stanford's Central Computing
Website)
4.71 171 Enter
5c (F,A). ithelp.stanford.edu (Self-
help site)4.55 121 Enter
5d (F,A). it-services.stanford.edu
(Our organization's website)4.47 148 Enter
Importance of Specified Types of Documentation on Web Mean N Detail
6b. Self-help information on
services you already have4.61 635 Enter
6a. General information about
services, features, rates and
ordering
4.58 648 Enter
6c. News and status of systems
and services (e.g., service
outages)
4.47 636 Enter
Importance of Specified Telecommunications Offerings Mean N Detail
10a (F,A). Call forwarding for
your work phone3.63 433 Enter
10b (F,A). One mailbox for all
your telephone numbers3.57 415 Enter
10c (F,A). An integrated
messaging service linking voice
mail, email and fax
3.24 413 Enter
10e. Ability to make or receive
calls from your computer2.96 631 Enter
10d. Voice-over-Internet (VoIP)
phone services2.96 619 Enter
F
S
A

5a (F,A) computing.stanford.edu (Stanford's Central Computing Website)
Mean VD D SD SS S VS Count Std. Dev. 99% CI+-
All 4.71 0% 3% 5% 23% 56% 13% 171 0.87 0.17
Faculty 4.68 0% 3% 8% 20% 56% 13% 71
Admin 4.74 0% 3% 3% 25% 55% 14% 100
5b (F,A) helpsu.stanford.edu (HelpSU: for submitting help requests)
Mean VD D SD SS S VS Count Std. Dev. 99% CI+-
All 4.74 2% 4% 4% 21% 46% 23% 268 1.09 0.17
Faculty 4.60 3% 6% 5% 21% 47% 19% 108
y 4.84 1% 3% 3% 21% 46% 26% 160
5c (F,A) ithelp.stanford.edu (Self-help site)
Mean VD D SD SS S VS Count Std. Dev. 99% CI+-
All 4.55 1% 8% 7% 20% 48% 17% 121 1.15 0.25
Faculty 4.36 2% 9% 13% 15% 51% 11% 47
Admin 4.68 0% 8% 3% 23% 46% 20% 74
5d (F,A) it-services.stanford.edu (Our organization's website)
Mean VD D SD SS S VS Count Std. Dev. 99% CI+-
All 4.48 1% 8% 10% 21% 44% 16% 148 1.16 0.25
Faculty 4.29 2% 7% 18% 20% 38% 15% 55
Admin 4.59 0% 9% 5% 22% 47% 17% 93
6a General information about services, features, rates and ordering
Mean 1-VU 2 3 4 5 6-VI Count Std. Dev. 99% CI+-
All 4.58 3% 5% 11% 22% 31% 28% 648 1.28 0.13
Faculty 4.53 4% 7% 8% 23% 33% 27% 120
Students 4.37 4% 6% 14% 25% 26% 24% 251
Admin 4.80 1% 3% 10% 19% 35% 31% 277
6b Self-help information on services you already have
Mean 1-VU 2 3 4 5 6-VI Count Std. Dev. 99% CI+-
All 4.61 2% 4% 12% 22% 32% 28% 635 1.25 0.13
Faculty 4.54 3% 6% 10% 20% 34% 27% 116
Students 4.43 4% 5% 13% 25% 27% 26% 247
Admin 4.81 0% 2% 11% 19% 37% 30% 272
6c News and status of systems and services (e.g., service outages)
Mean 1-VU 2 3 4 5 6-VI Count Std. Dev. 99% CI+-
All 4.47 3% 6% 15% 19% 31% 26% 636 1.35 0.14
Faculty 4.57 3% 6% 12% 19% 30% 30% 120
Students 4.11 7% 7% 18% 24% 24% 20% 239
Admin 4.74 0% 5% 13% 15% 36% 31% 277
10a (F,A) Call forwarding for your work phone
Mean 1-VU 2 3 4 5 6-VI Count Std. Dev. 99% CI+-
All 3.63 19% 10% 15% 18% 18% 19% 433 1.76 0.22
Faculty 3.46 23% 9% 17% 18% 17% 16% 136
Admin 3.71 18% 10% 14% 19% 19% 21% 297
10b (F,A) One mailbox for all your telephone numbers
Mean 1-VU 2 3 4 5 6-VI Count Std. Dev. 99% CI+-
All 3.57 22% 8% 14% 18% 22% 16% 415 1.77 0.22
Faculty 3.42 23% 9% 16% 20% 17% 15% 132
Admin 3.64 21% 8% 13% 17% 24% 16% 283
10c (F,A) An integrated messaging service linking voice mail, email and fax
Mean 1-VU 2 3 4 5 6-VI Count Std. Dev. 99% CI+-
All 3.24 24% 13% 17% 17% 17% 12% 413 1.72 0.22
Faculty 3.25 26% 13% 19% 14% 13% 17% 133
Admin 3.24 24% 14% 16% 18% 19% 10% 280
10d Voice-over-Internet (VoIP) phone services
Mean 1-VU 2 3 4 5 6-VI Count Std. Dev. 99% CI+-
All 2.97 31% 12% 16% 17% 15% 8% 619 1.69 0.17
Faculty 3.08 26% 14% 19% 17% 12% 11% 129
Students 2.86 38% 10% 15% 15% 13% 10% 213
Admin 3.00 28% 14% 16% 20% 18% 5% 277
10e Ability to make or receive calls from your computer
Mean 1-VU 2 3 4 5 6-VI Count Std. Dev. 99% CI+-
All 2.97 31% 13% 15% 17% 17% 7% 631 1.69 0.17
Faculty 3.07 27% 16% 14% 16% 18% 8% 132
Students 2.88 37% 10% 14% 16% 12% 11% 218
Admin 2.99 28% 14% 16% 19% 20% 4% 281


7. Preferred Method for Learning About Computing
(Select one.) , n=706
0% 10% 20% 30% 40% 50%
One-on-one
training with
instructor
Online training
Hands-on,
instructor-led class
Asking a peer or
colleague for help
Self-instruction
Faculty
Students
Admin
S6. Relative Student Use of Specified Computing
Devices (n=529)
Laptop 65%
Desktop 24%
Cluster 8%
Handheld 3%
7
Hands-
on,
instructo
r-led
class
One-on-
one
training
with
instruc-
tor
Online
training
Self-
instruc-
tion
Asking a
peer or
col-
league
for help Count
All 20% 16% 18% 23% 22% 706
Faculty 7% 24% 17% 29% 22% 147
Students 14% 12% 12% 31% 30% 265
Admin 32% 16% 24% 13% 15% 294
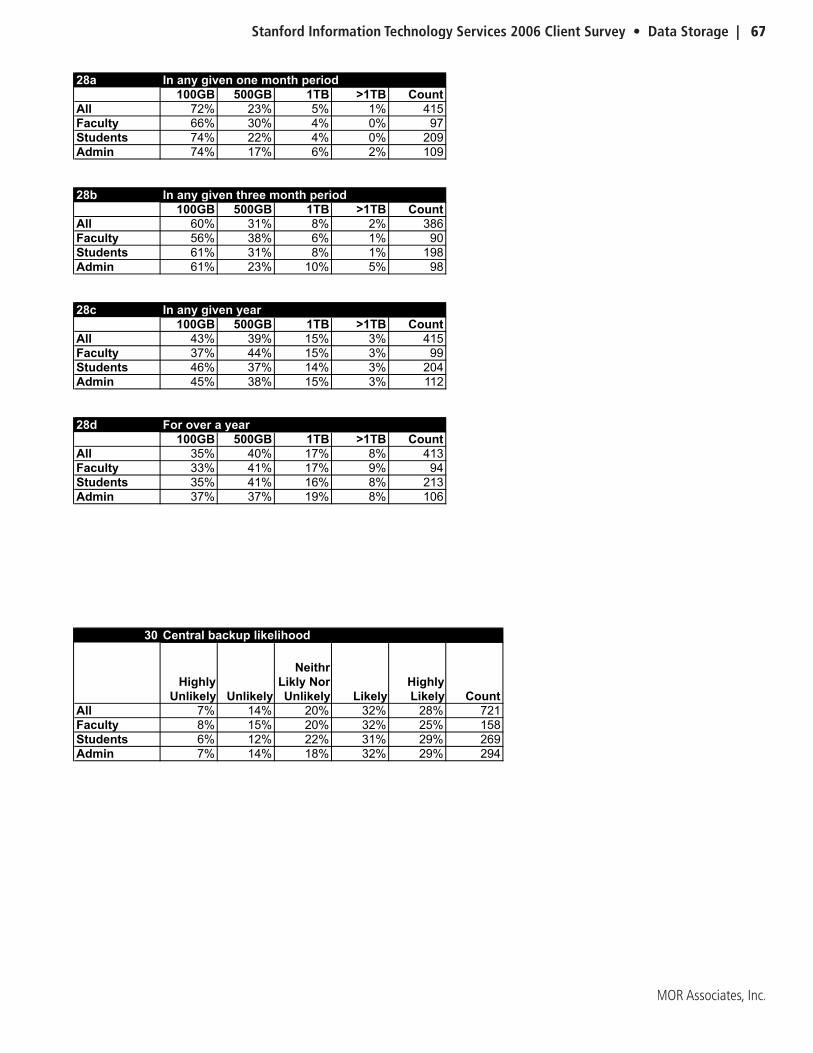
28a In any given one month period
100GB 500GB 1TB >1TB Count
All 72% 23% 5% 1% 415
Faculty 66% 30% 4% 0% 97
Students 74% 22% 4% 0% 209
Admin 74% 17% 6% 2% 109
28b In any given three month period
100GB 500GB 1TB >1TB Count
All 60% 31% 8% 2% 386
Faculty 56% 38% 6% 1% 90
Students 61% 31% 8% 1% 198
Admin 61% 23% 10% 5% 98
28c In any given year
100GB 500GB 1TB >1TB Count
All 43% 39% 15% 3% 415
Faculty 37% 44% 15% 3% 99
Students 46% 37% 14% 3% 204
Admin 45% 38% 15% 3% 112
28d For over a year
100GB 500GB 1TB >1TB Count
All 35% 40% 17% 8% 413
Faculty 33% 41% 17% 9% 94
Students 35% 41% 16% 8% 213
Admin 37% 37% 19% 8% 106
What is your preferred method for learning about
computing? (Select one.)


Satisfaction with Aspects of Telecommunications Mean N Detail
9c. Voice mail 4.31 341 Enter
9a. Telephone problem resolution 4.26 272 Enter
9b. Telephone billing
system/statements3.97 239 Enter
Satisfaction with Telecommunications Overall Mean N Detail
11. Telecommunications overall 4.44 457 Enter
F
S
A
F
S
A

9a Telephone problem resolution
Mean VD D SD SS S VS Count Std. Dev. 99% CI+-
All 4.26 5% 5% 13% 24% 44% 10% 272 1.25 0.19
Faculty 4.39 4% 6% 11% 18% 51% 11% 84
Students 4.00 8% 7% 11% 33% 31% 10% 72
Admin 4.34 4% 3% 15% 22% 47% 9% 116
9b Telephone billing system/statements
Mean VD D SD SS S VS Count Std. Dev. 99% CI+-
All 3.97 9% 8% 15% 23% 38% 8% 239 1.39 0.23
Faculty 3.97 9% 6% 14% 23% 42% 5% 64
Students 3.93 9% 8% 15% 24% 34% 9% 86
Admin 4.02 8% 8% 15% 21% 40% 8% 89
9c Voice mail
Mean VD D SD SS S VS Count Std. Dev. 99% CI+-
All 4.31 5% 6% 11% 19% 47% 12% 341 1.30 0.18
Faculty 4.30 3% 8% 11% 21% 44% 12% 118
Students 3.37 18% 12% 15% 27% 27% 2% 60
Admin 4.67 2% 2% 10% 14% 56% 16% 163
11 Telecommunications overall
Mean VD D SD SS S VS Count Std. Dev. 99% CI+-
All 4.44 2% 2% 9% 31% 49% 8% 457 0.99 0.12
Faculty 4.45 3% 1% 6% 34% 46% 9% 155
Students 4.16 3% 4% 15% 35% 37% 6% 127
Admin 4.64 1% 1% 6% 25% 59% 8% 175

Importance of Specified Types of Documentation on Web Mean N Detail
6b. Self-help information on
services you already have4.61 635 Enter
6a. General information about
services, features, rates and
ordering
4.58 648 Enter
6c. News and status of systems
and services (e.g., service
outages)
4.47 636 Enter
Importance of Specified Telecommunications Offerings Mean N Detail
10a (F,A). Call forwarding for
your work phone3.63 433 Enter
10b (F,A). One mailbox for all
your telephone numbers3.57 415 Enter
10c (F,A). An integrated
messaging service linking voice
mail, email and fax
3.24 413 Enter
10e. Ability to make or receive
calls from your computer2.96 631 Enter
10d. Voice-over-Internet (VoIP)
phone services2.96 619 Enter
F
S
A

6a General information about services, features, rates and ordering
Mean 1-VU 2 3 4 5 6-VI Count Std. Dev. 99% CI+-
All 4.58 3% 5% 11% 22% 31% 28% 648 1.28 0.13
Faculty 4.53 4% 7% 8% 23% 33% 27% 120
Students 4.37 4% 6% 14% 25% 26% 24% 251
Admin 4.80 1% 3% 10% 19% 35% 31% 277
6b Self-help information on services you already have
Mean 1-VU 2 3 4 5 6-VI Count Std. Dev. 99% CI+-
All 4.61 2% 4% 12% 22% 32% 28% 635 1.25 0.13
Faculty 4.54 3% 6% 10% 20% 34% 27% 116
Students 4.43 4% 5% 13% 25% 27% 26% 247
Admin 4.81 0% 2% 11% 19% 37% 30% 272
6c News and status of systems and services (e.g., service outages)
Mean 1-VU 2 3 4 5 6-VI Count Std. Dev. 99% CI+-
All 4.47 3% 6% 15% 19% 31% 26% 636 1.35 0.14
Faculty 4.57 3% 6% 12% 19% 30% 30% 120
Students 4.11 7% 7% 18% 24% 24% 20% 239
Admin 4.74 0% 5% 13% 15% 36% 31% 277
10a (F,A) Call forwarding for your work phone
Mean 1-VU 2 3 4 5 6-VI Count Std. Dev. 99% CI+-
All 3.63 19% 10% 15% 18% 18% 19% 433 1.76 0.22
Faculty 3.46 23% 9% 17% 18% 17% 16% 136
Admin 3.71 18% 10% 14% 19% 19% 21% 297
10b (F,A) One mailbox for all your telephone numbers
Mean 1-VU 2 3 4 5 6-VI Count Std. Dev. 99% CI+-
All 3.57 22% 8% 14% 18% 22% 16% 415 1.77 0.22
Faculty 3.42 23% 9% 16% 20% 17% 15% 132
Admin 3.64 21% 8% 13% 17% 24% 16% 283
10c (F,A) An integrated messaging service linking voice mail, email and fax
Mean 1-VU 2 3 4 5 6-VI Count Std. Dev. 99% CI+-
All 3.24 24% 13% 17% 17% 17% 12% 413 1.72 0.22
Faculty 3.25 26% 13% 19% 14% 13% 17% 133
Admin 3.24 24% 14% 16% 18% 19% 10% 280
10d Voice-over-Internet (VoIP) phone services
Mean 1-VU 2 3 4 5 6-VI Count Std. Dev. 99% CI+-
All 2.97 31% 12% 16% 17% 15% 8% 619 1.69 0.17
Faculty 3.08 26% 14% 19% 17% 12% 11% 129
Students 2.86 38% 10% 15% 15% 13% 10% 213
Admin 3.00 28% 14% 16% 20% 18% 5% 277
10e Ability to make or receive calls from your computer
Mean 1-VU 2 3 4 5 6-VI Count Std. Dev. 99% CI+-
All 2.97 31% 13% 15% 17% 17% 7% 631 1.69 0.17
Faculty 3.07 27% 16% 14% 16% 18% 8% 132
Students 2.88 37% 10% 14% 16% 12% 11% 218
Admin 2.99 28% 14% 16% 19% 20% 4% 281


Satisfaction with Aspects of the Wireless Network Mean N Detail
12a. Wireless signal
strength/quality of connection4.30 372 Enter
12b. Availability of wireless
network on campus4.24 367 Enter
12c. Wireless guest registration
process3.98 229 Enter
Satisfaction with Wireless Networking in Student Residences Mean N Detail
S2. Wireless networking in the
residences3.36 108 Enter
Satisfaction with Aspects of the Wired Network Mean N Detail
13a. Reliability wired of network 4.98 427 Enter
13b. Availability of wired network 4.92 427 Enter
13c. High-speed (gigabit) wired
access to other universities4.85 262 Enter
F
S
A
F
S
A
Satisfaction with Network Services Overall Mean N Detail
14. Stanford network services
overall4.76 469 Enter
Satisfaction with Specified Modes of Remote Access Mean N Detail
15c. Using Stanford services
working from home using other
Internet service provider
4.55 308 Enter
15b. Using Stanford services
working from home using
Stanford DSL service
4.54 183 Enter
15d. Using Stanford services
while traveling within the U.S.4.42 338 Enter
15a. Using Stanford services
working from home using
Stanford modem
4.19 165 Enter
15e. Using Stanford services
while traveling outside the U.S.4.08 224 Enter
F
S
A
F
S
A

12a Wireless signal strength/quality of connection
Mean VD D SD SS S VS Count Std. Dev. 99% CI+-
All 4.31 3% 6% 14% 24% 40% 13% 372 1.21 0.16
Faculty 4.31 3% 9% 11% 21% 43% 13% 132
Students 4.20 4% 4% 18% 31% 33% 11% 142
Admin 4.46 1% 7% 12% 18% 47% 14% 98
12b Availability of wireless network on campus
Mean VD D SD SS S VS Count Std. Dev. 99% CI+-
All 4.24 4% 8% 13% 25% 37% 14% 367 1.28 0.17
Faculty 4.12 5% 10% 11% 25% 41% 8% 133
Students 4.18 3% 8% 16% 32% 23% 18% 137
Admin 4.51 2% 5% 13% 14% 49% 15% 97
12c Wireless guest registration process
Mean VD D SD SS S VS Count Std. Dev. 99% CI+-
All 3.98 7% 10% 17% 24% 30% 12% 229 1.40 0.24
Faculty 4.16 4% 7% 17% 29% 26% 17% 70
Students 3.60 9% 14% 24% 25% 18% 10% 88
Admin 4.28 6% 7% 10% 18% 49% 10% 71
S2 Wireless networking in the residences
Mean VD D SD SS S VS Count Std. Dev. 99% CI+-
Students 3.36 18% 15% 17% 25% 17% 9% 108 1.58 0.39
13a Reliability of wired network
Mean VD D SD SS S VS Count Std. Dev. 99% CI+-
All 4.98 1% 1% 4% 14% 52% 28% 427 0.93 0.12
Faculty 5.05 1% 1% 1% 9% 60% 27% 142
Students 4.82 1% 2% 6% 20% 44% 27% 135
Admin 5.06 0% 1% 5% 12% 51% 31% 150
13b Availability of wired network
Mean VD D SD SS S VS Count Std. Dev. 99% CI+-
All 4.92 1% 2% 5% 13% 50% 28% 427 1.02 0.13
Faculty 4.87 3% 3% 5% 9% 56% 25% 144
Students 4.77 2% 3% 8% 18% 44% 26% 131
Admin 5.10 0% 1% 4% 13% 51% 32% 152
13c High-speed (gigabit) wired access to other universities
Mean VD D SD SS S VS Count Std. Dev. 99% CI+-
All 4.86 2% 3% 6% 12% 49% 28% 262 1.12 0.18
Faculty 4.77 4% 5% 5% 5% 58% 23% 79
Students 4.71 3% 2% 9% 22% 35% 29% 93
Admin 5.09 0% 2% 3% 9% 54% 31% 90
14 Stanford network services overall
Mean VD D SD SS S VS Count Std. Dev. 99% CI+-
All 4.77 1% 2% 4% 23% 54% 17% 469 0.90 0.11
Faculty 4.77 2% 3% 3% 18% 61% 15% 158
Students 4.60 1% 2% 5% 34% 43% 15% 152
Admin 4.94 0% 1% 4% 17% 58% 20% 159
15a Using Stanford services working from home using Stanford modem
Mean VD D SD SS S VS Count Std. Dev. 99% CI+-
All 4.19 5% 7% 12% 25% 37% 13% 165 1.32 0.27


Satisfaction with Network Services Overall Mean N Detail
14. Stanford network services
overall4.76 469 Enter
Satisfaction with Specified Modes of Remote Access Mean N Detail
15c. Using Stanford services
working from home using other
Internet service provider
4.55 308 Enter
15b. Using Stanford services
working from home using
Stanford DSL service
4.54 183 Enter
15d. Using Stanford services
while traveling within the U.S.4.42 338 Enter
15a. Using Stanford services
working from home using
Stanford modem
4.19 165 Enter
15e. Using Stanford services
while traveling outside the U.S.4.08 224 Enter
F
S
A
F
S
A
Interest in Specified Additions to Bundled Services (for Students) Mean N Detail
S4b. Cable TV 2.98 229 Enter
S4a. Domestic long distance 2.26 223 Enter

S11a Special function/reserved Unix clusters (e.g., specific software or cluster room reservations)
Mean 1-VU 2 3 4 5 6-VI Count Std. Dev. 99% CI+-
Students 2.83 36% 10% 18% 18% 11% 8% 120 1.70 0.40
S11b Moving away from on-site cluster access to remote access only
Mean 1-VU 2 3 4 5 6-VI Count Std. Dev. 99% CI+-
Students 2.90 33% 14% 13% 21% 12% 8% 120 1.70 0.40
S4a Domestic long distance
Mean
1-Not At
All Inter-
ested 2 3 4 5
6-Very
Inter-
ested Count Std. Dev. 99% CI+-
Students 2.27 55% 9% 12% 9% 9% 7% 223 1.67 0.29
S4b Cable TV
Mean
1-Not At
All Inter-
ested 2 3 4 5
6-Very
Inter-
ested Count Std. Dev. 99% CI+-
Students 2.99 42% 8% 8% 12% 12% 18% 229 2.00 0.34
30 Central backup likelihood
Highly
Unlikely Unlikely
Neithr
Likly Nor
Unlikely Likely
Highly
Likely Count
All 7% 14% 20% 32% 28% 721
Faculty 8% 15% 20% 32% 25% 158
Students 6% 12% 22% 31% 29% 269
Admin 7% 14% 18% 32% 29% 294
Faculty 4.36 4% 8% 8% 18% 52% 10% 50
Students 3.74 9% 11% 17% 35% 17% 11% 46
Admin 4.38 4% 4% 12% 25% 39% 16% 69
15b Using Stanford services working from home using Stanford DSL service
Mean VD D SD SS S VS Count Std. Dev. 99% CI+-
All 4.54 3% 5% 8% 21% 45% 18% 183 1.19 0.23
Faculty 4.66 1% 4% 6% 19% 53% 16% 68
Students 4.09 7% 9% 9% 28% 33% 13% 54
Admin 4.80 0% 3% 8% 18% 46% 25% 61
15c Using Stanford services working from home using other Internet service provider
Mean VD D SD SS S VS Count Std. Dev. 99% CI+-
All 4.56 3% 5% 7% 23% 47% 16% 308 1.14 0.17
Faculty 4.61 3% 6% 6% 17% 53% 17% 108
Students 4.36 5% 3% 7% 34% 36% 15% 95
Admin 4.69 0% 5% 8% 19% 51% 17% 105
15d Using Stanford services while traveling within the U.S.
Mean VD D SD SS S VS Count Std. Dev. 99% CI+-
All 4.42 3% 6% 7% 25% 45% 13% 338 1.18 0.17
Faculty 4.35 5% 5% 11% 22% 45% 12% 153
Students 4.47 3% 4% 6% 30% 42% 14% 97
Admin 4.49 1% 9% 2% 27% 48% 13% 88
15e Using Stanford services while traveling outside the U.S.
Mean VD D SD SS S VS Count Std. Dev. 99% CI+-
All 4.09 6% 8% 14% 25% 36% 11% 224 1.34 0.23
Faculty 3.94 7% 11% 19% 19% 33% 11% 106
Students 4.26 4% 6% 11% 32% 33% 14% 72
Admin 4.15 7% 7% 7% 30% 46% 4% 46


Importance of Specified Improvements for Stanford Email Mean N Detail
17a. Better spam filtering 5.18 766 Enter
17b. Better centralized spam
auto-deletion4.97 750 Enter
17c. Better email virus detection 4.87 753 Enter
17d. More reliable sending and
receiving of email4.70 739 Enter
17e. More disk space for email 4.43 744 Enter
F
S
A
S5
Yes No Count
Students 86% 14% 274
Do you use an
@stanford.edu address as
your primary email address?

17a Better spam filtering
Mean 1-VU 2 3 4 5 6-VI Count Std. Dev. 99% CI+-
All 5.18 1% 3% 5% 15% 21% 56% 766 1.15 0.11
Faculty 5.16 1% 3% 5% 15% 21% 55% 170
Students 4.99 3% 5% 5% 16% 19% 51% 270
Admin 5.35 0% 1% 4% 13% 22% 60% 326
17b Better centralized spam auto-deletion
Mean 1-VU 2 3 4 5 6-VI Count Std. Dev. 99% CI+-
All 4.98 4% 4% 6% 16% 21% 51% 750 1.35 0.13
Faculty 5.01 4% 4% 6% 13% 21% 52% 163
Students 4.71 6% 6% 7% 18% 16% 46% 267
Admin 5.19 2% 2% 4% 15% 24% 53% 320
17c Better email virus detection
Mean 1-VU 2 3 4 5 6-VI Count Std. Dev. 99% CI+-
All 4.87 4% 4% 9% 16% 20% 47% 753 1.39 0.13
Faculty 4.81 3% 4% 12% 16% 20% 45% 167
Students 4.54 8% 5% 9% 19% 18% 41% 263
Admin 5.17 0% 2% 7% 14% 22% 54% 323
17d More reliable sending and receiving of email
Mean 1-VU 2 3 4 5 6-VI Count Std. Dev. 99% CI+-
All 4.70 3% 5% 10% 19% 24% 38% 739 1.37 0.13
Faculty 4.52 4% 7% 12% 20% 26% 31% 160
Students 4.51 5% 7% 12% 20% 22% 34% 264
Admin 4.96 1% 3% 9% 17% 25% 45% 315
17e More disk space for email
Mean 1-VU 2 3 4 5 6-VI Count Std. Dev. 99% CI+-
All 4.44 6% 6% 13% 18% 25% 31% 744 1.51 0.14
Faculty 4.33 7% 8% 14% 17% 25% 29% 163
Students 4.37 7% 7% 15% 16% 22% 33% 268
Admin 4.56 5% 4% 12% 19% 28% 32% 313

Satisfaction with Aspects of Email Mean N Detail
18d. Stanford Web Mail reliability 4.42 456 Enter
18c. Stanford Web Mail ease of
use4.10 468 Enter
18a. Stanford Web Mail speed 4.09 472 Enter
18b. Stanford Web Mail features 3.91 463 Enter
Satisfaction with Email Overall Mean N Detail
19. Stanford email overall 4.60 520 Enter
F
S
A
F
S
A
F
S
A
F
S
A

18a Stanford Web Mail speed
Mean VD D SD SS S VS Count Std. Dev. 99% CI+-
All 4.09 5% 10% 14% 23% 37% 11% 472 1.33 0.16
Faculty 4.19 5% 9% 15% 21% 35% 16% 150
Students 3.66 7% 14% 24% 23% 24% 8% 148
Admin 4.37 3% 7% 6% 25% 51% 8% 174
18b Stanford Web Mail features
Mean VD D SD SS S VS Count Std. Dev. 99% CI+-
All 3.91 4% 13% 17% 27% 31% 8% 463 1.30 0.16
Faculty 4.01 3% 12% 17% 26% 29% 12% 146
Students 3.52 7% 18% 22% 26% 22% 5% 148
Admin 4.17 3% 8% 12% 30% 41% 7% 169
18c Stanford Web Mail ease of use
Mean VD D SD SS S VS Count Std. Dev. 99% CI+-
All 4.10 4% 10% 13% 26% 37% 10% 468 1.29 0.15
Faculty 4.14 5% 9% 15% 23% 34% 13% 149
Students 3.89 6% 13% 14% 26% 34% 6% 148
Admin 4.25 2% 9% 10% 29% 41% 9% 171
18d Stanford Web Mail reliability
Mean VD D SD SS S VS Count Std. Dev. 99% CI+-
All 4.43 3% 5% 8% 25% 48% 11% 456 1.14 0.14
Faculty 4.56 3% 3% 7% 26% 48% 14% 145
Students 4.11 6% 9% 10% 29% 35% 10% 144
Admin 4.59 1% 4% 7% 21% 58% 9% 167
19 Stanford email overall
Mean VD D SD SS S VS Count Std. Dev. 99% CI+-
All 4.60 1% 3% 7% 23% 54% 12% 520 0.98 0.11
Faculty 4.68 2% 3% 4% 23% 52% 16% 171
Students 4.30 2% 6% 11% 27% 46% 7% 157
Admin 4.78 0% 2% 6% 18% 62% 13% 192


7. Preferred Method for Learning About Computing
(Select one.) , n=706
0% 10% 20% 30% 40% 50%
One-on-one
training with
instructor
Online training
Hands-on,
instructor-led class
Asking a peer or
colleague for help
Self-instruction
Faculty
Students
Admin
S6. Relative Student Use of Specified Computing
Devices (n=529)
Laptop 65%
Desktop 24%
Cluster 8%
Handheld 3%
S6a Desktop
0 1-20% 21-40% 41-60% 61-80% 81-100% Count
Students 35% 29% 4% 10% 10% 11% 240
S6b Laptop
0 1-20% 21-40% 41-60% 61-80% 81-100% Count
Students 4% 9% 5% 7% 15% 61% 261
S6c Handheld/PDA
0 1-20% 21-40% 41-60% 61-80% 81-100% Count
Students 88% 8% 1% 1% 0% 1% 213
S6d Cluster machine
0 1-20% 21-40% 41-60% 61-80% 81-100% Count
Students 44% 49% 4% 2% 0% 1% 234
27a By you
Daily Weekly Monthly <Monthly Never Count
All 10% 11% 13% 31% 34% 667
Faculty 16% 18% 17% 28% 21% 146
Students 3% 7% 14% 42% 34% 273
Admin 13% 13% 11% 21% 42% 248
27b By someone else
Daily Weekly Monthly <Monthly Never Count
All 19% 9% 3% 11% 59% 601
Faculty 19% 9% 1% 13% 58% 117
Students 0% 2% 1% 10% 86% 232
Admin 36% 15% 5% 10% 34% 252
27
Daily Weekly Monthly <Monthly Never Count
All 23% 15% 13% 29% 20% 743
Faculty 26% 21% 14% 27% 13% 164
Students 4% 8% 14% 42% 32% 273
Admin 38% 19% 11% 18% 14% 306
Backed up at all

Satisfaction with Aspects of ESS Mean N Detail
20c. ESS: Ease of installing
software4.93 394 Enter
20d. ESS: Helpfulness of
Stanford-specific software
documentation
4.68 352 Enter
20b. ESS: Timeliness of Stanford
release of updated versions after
vendor release
4.63 382 Enter
20a. ESS: Available selection of
software4.62 411 Enter
F
S
A

20a ESS: Available selection of software
Mean VD D SD SS S VS Count Std. Dev. 99% CI+-
All 4.62 0% 3% 5% 29% 51% 12% 411 0.89 0.11
Faculty 4.55 1% 4% 7% 28% 51% 10% 137
Students 4.54 1% 3% 6% 33% 49% 9% 138
Admin 4.78 0% 1% 3% 27% 53% 15% 136
20b ESS: Timeliness of Stanford release of updated versions after vendor release
Mean VD D SD SS S VS Count Std. Dev. 99% CI+-
All 4.64 1% 2% 7% 27% 49% 14% 382 0.92 0.12
Faculty 4.54 2% 3% 9% 26% 48% 13% 128
Students 4.54 0% 3% 7% 34% 45% 11% 128
Admin 4.83 0% 1% 5% 22% 55% 17% 126
20c ESS: Ease of installing software
Mean VD D SD SS S VS Count Std. Dev. 99% CI+-
All 4.93 1% 1% 3% 21% 52% 24% 394 0.84 0.11
Faculty 4.93 1% 1% 4% 18% 50% 26% 134
Students 4.86 1% 1% 3% 22% 54% 19% 134
Admin 5.01 0% 0% 2% 21% 52% 25% 126
20d ESS: Helpfulness of Stanford-specific software documentation
Mean VD D SD SS S VS Count Std. Dev. 99% CI+-
All 4.69 1% 3% 5% 27% 46% 18% 352 0.99 0.14
Faculty 4.59 1% 5% 4% 28% 48% 14% 113
Students 4.62 2% 3% 5% 30% 45% 16% 128
Admin 4.86 1% 0% 5% 23% 46% 24% 111

Satisfaction with Aspects of Software Licensing Mean N Detail
21e. Sftwr Lic: Responsiveness
of staff to your requests4.64 181 Enter
21b. Sftwr Lic: Timeliness of
updates4.55 196 Enter
21a. Sftwr Lic: Available selection
of software4.44 229 Enter
21c. Sftwr Lic: Ease of
ordering/purchasing4.30 208 Enter
21d. Sftwr Lic: Cost 4.12 213 Enter
F
S
A
F
S
A

21a Sftwr Lic: Available selection of software
Mean VD D SD SS S VS Count Std. Dev. 99% CI+-
All 4.45 0% 7% 7% 30% 47% 9% 229 0.99 0.17
Faculty 4.39 0% 8% 6% 31% 47% 7% 83
Students 4.25 0% 7% 10% 39% 40% 4% 72
Admin 4.72 0% 4% 7% 19% 54% 16% 74
21b Sftwr Lic: Timeliness of updates
Mean VD D SD SS S VS Count Std. Dev. 99% CI+-
All 4.56 0% 3% 6% 30% 54% 7% 196 0.84 0.15
Faculty 4.51 0% 5% 5% 28% 54% 7% 74
Students 4.42 0% 2% 7% 45% 42% 5% 60
Admin 4.74 0% 2% 6% 18% 65% 10% 62
21c Sftwr Lic: Ease of ordering/purchasing
Mean VD D SD SS S VS Count Std. Dev. 99% CI+-
All 4.30 2% 7% 8% 34% 40% 9% 208 1.09 0.19
Faculty 4.16 3% 11% 8% 33% 39% 7% 76
Students 4.27 0% 5% 8% 50% 31% 6% 64
Admin 4.50 3% 4% 9% 21% 50% 13% 68
21d Sftwr Lic: Cost
Mean VD D SD SS S VS Count Std. Dev. 99% CI+-
All 4.13 4% 8% 13% 32% 33% 10% 213 1.23 0.22
Faculty 4.17 1% 5% 17% 35% 35% 6% 77
Students 3.55 7% 16% 19% 36% 16% 6% 69
Admin 4.67 3% 3% 3% 24% 49% 18% 67
21e Sftwr Lic: Responsiveness of staff to your requests
Mean VD D SD SS S VS Count Std. Dev. 99% CI+-
All 4.64 2% 4% 4% 29% 40% 21% 181 1.09 0.21
Faculty 4.78 2% 3% 3% 22% 46% 24% 59
Students 4.41 0% 5% 7% 46% 28% 15% 61
Admin 4.74 3% 5% 2% 20% 46% 25% 61

Satisfaction with Aspects of Shared Software Mean N Detail
22d (F,S). Shrd Sftwr: Stability of
the software4.57 104 Enter
22b (F,S). Shrd Sftwr: Timeliness
of updates4.49 105 Enter
22a (F,S). Shrd Sftwr: Availability
of software for course and
research needs
4.43 116 Enter
22c (F,S). Shrd Sftwr:
Documentation and
announcements of software
packages
4.29 99 Enter
Satisfaction with Aspects of Computer Security Mean N Detail
24a. Timeliness of security
software updates4.73 413 Enter
24b. Effectiveness of
documentation and instructions
in securing your computer and
preventing attacks
4.52 387 Enter
24c. Effectiveness of
documentation and instructions
in recovering from incidents
4.40 311 Enter
F
S
A

22a (F,S) Shrd Sftwr: Availability of software for course and research needs
Mean VD D SD SS S VS Count Std. Dev. 99% CI+-
All 4.43 1% 5% 7% 37% 37% 13% 116 1.03 0.25
Faculty 4.54 0% 4% 6% 35% 40% 15% 48
Students 4.35 1% 6% 7% 38% 35% 12% 68
22b (F,S) Shrd Sftwr: Timeliness of updates
Mean VD D SD SS S VS Count Std. Dev. 99% CI+-
All 4.50 0% 4% 8% 33% 46% 10% 105 0.91 0.23
Faculty 4.66 0% 4% 6% 23% 51% 15% 47
Students 4.36 0% 3% 9% 41% 41% 5% 58
22c (F,S) Shrd Sftwr: Documentation and announcements of software packages
Mean VD D SD SS S VS Count Std. Dev. 99% CI+-
All 4.29 0% 5% 11% 41% 34% 8% 99 0.95 0.25
Faculty 4.29 0% 7% 12% 38% 31% 12% 42
Students 4.30 0% 4% 11% 44% 37% 5% 57
22d (F,S) Shrd Sftwr: Stability of the software
Mean VD D SD SS S VS Count Std. Dev. 99% CI+-
All 4.58 0% 3% 7% 32% 47% 12% 104 0.89 0.22
Faculty 4.74 0% 2% 5% 26% 50% 17% 42
Students 4.47 0% 3% 8% 35% 45% 8% 62
24a Timeliness of security software updates
Mean VD D SD SS S VS Count Std. Dev. 99% CI+-
All 4.74 0% 2% 3% 26% 56% 13% 413 0.83 0.11
Faculty 4.81 1% 1% 1% 23% 59% 14% 138
Students 4.56 1% 3% 5% 33% 50% 9% 120
24b
Mean VD D SD SS S VS Count Std. Dev. 99% CI+-
All 4.53 1% 4% 7% 28% 47% 13% 387 1.03 0.13
Faculty 4.64 2% 2% 6% 26% 48% 16% 128
Students 4.32 1% 6% 8% 38% 39% 8% 117
Admin 4.60 1% 4% 8% 21% 51% 15% 142
24c Effectiveness of documentation and instructions in recovering from incidents
Mean VD D SD SS S VS Count Std. Dev. 99% CI+-
All 4.41 2% 6% 9% 30% 41% 13% 311 1.11 0.16
Faculty 4.39 2% 4% 10% 34% 34% 16% 89
Students 4.25 1% 8% 10% 36% 36% 9% 102
Admin 4.54 2% 6% 8% 21% 50% 14% 120
Effectiveness of documentation and instructions in securing your computer and
preventing attacks


Satisfaction with Aspects of Shared Software Mean N Detail
22d (F,S). Shrd Sftwr: Stability of
the software4.57 104 Enter
22b (F,S). Shrd Sftwr: Timeliness
of updates4.49 105 Enter
22a (F,S). Shrd Sftwr: Availability
of software for course and
research needs
4.43 116 Enter
22c (F,S). Shrd Sftwr:
Documentation and
announcements of software
packages
4.29 99 Enter
Satisfaction with Aspects of Computer Security Mean N Detail
24a. Timeliness of security
software updates4.73 413 Enter
24b. Effectiveness of
documentation and instructions
in securing your computer and
preventing attacks
4.52 387 Enter
24c. Effectiveness of
documentation and instructions
in recovering from incidents
4.40 311 Enter
F
S
A
Satisfaction with Specified Security Software Mean N Detail
25d. Symantec/Norton Antivirus 4.89 378 Enter
25c. Stanford's Security Self-
Help Tool4.39 172 Enter
25a. BigFix 4.39 169 Enter
25b. SpySweeper 4.29 287 Enter
Satisfaction with Specified Services (for Students) Mean N Detail
S10c. Wired network bandwidth 4.48 104 Enter
S10f. Web portal for ordering
services (phone, cable TV, etc.)4.28 66 Enter
S10b. Email quota 4.26 130 Enter
S10a. Web development and
publishing tools4.13 68 Enter
S10d. Cable TV 4.01 65 Enter
S10e. Central File Storage (AFS) 3.78 85 Enter

22a (F,S) Shrd Sftwr: Availability of software for course and research needs
Mean VD D SD SS S VS Count Std. Dev. 99% CI+-
All 4.43 1% 5% 7% 37% 37% 13% 116 1.03 0.25
Faculty 4.54 0% 4% 6% 35% 40% 15% 48
Students 4.35 1% 6% 7% 38% 35% 12% 68
22b (F,S) Shrd Sftwr: Timeliness of updates
Mean VD D SD SS S VS Count Std. Dev. 99% CI+-
All 4.50 0% 4% 8% 33% 46% 10% 105 0.91 0.23
Faculty 4.66 0% 4% 6% 23% 51% 15% 47
Students 4.36 0% 3% 9% 41% 41% 5% 58
22c (F,S) Shrd Sftwr: Documentation and announcements of software packages
Mean VD D SD SS S VS Count Std. Dev. 99% CI+-
All 4.29 0% 5% 11% 41% 34% 8% 99 0.95 0.25
Faculty 4.29 0% 7% 12% 38% 31% 12% 42
Students 4.30 0% 4% 11% 44% 37% 5% 57
22d (F,S) Shrd Sftwr: Stability of the software
Mean VD D SD SS S VS Count Std. Dev. 99% CI+-
All 4.58 0% 3% 7% 32% 47% 12% 104 0.89 0.22
Faculty 4.74 0% 2% 5% 26% 50% 17% 42
Students 4.47 0% 3% 8% 35% 45% 8% 62
24a Timeliness of security software updates
Mean VD D SD SS S VS Count Std. Dev. 99% CI+-
All 4.74 0% 2% 3% 26% 56% 13% 413 0.83 0.11
Faculty 4.81 1% 1% 1% 23% 59% 14% 138
Students 4.56 1% 3% 5% 33% 50% 9% 120
24b
Mean VD D SD SS S VS Count Std. Dev. 99% CI+-
All 4.53 1% 4% 7% 28% 47% 13% 387 1.03 0.13
Faculty 4.64 2% 2% 6% 26% 48% 16% 128
Students 4.32 1% 6% 8% 38% 39% 8% 117
Admin 4.60 1% 4% 8% 21% 51% 15% 142
24c Effectiveness of documentation and instructions in recovering from incidents
Mean VD D SD SS S VS Count Std. Dev. 99% CI+-
All 4.41 2% 6% 9% 30% 41% 13% 311 1.11 0.16
Faculty 4.39 2% 4% 10% 34% 34% 16% 89
Students 4.25 1% 8% 10% 36% 36% 9% 102
Admin 4.54 2% 6% 8% 21% 50% 14% 120
Effectiveness of documentation and instructions in securing your computer and
preventing attacks
25a BigFix
Mean VD D SD SS S VS Count Std. Dev. 99% CI+-
All 4.39 7% 4% 11% 19% 44% 16% 169 1.33 0.26
Faculty 4.41 7% 5% 11% 16% 41% 20% 44
Students 3.72 14% 7% 19% 21% 30% 9% 57
Admin 4.94 0% 0% 3% 19% 59% 19% 68
25b SpySweeper
Mean VD D SD SS S VS Count Std. Dev. 99% CI+-
All 4.29 5% 8% 11% 17% 43% 15% 287 1.37 0.21
Faculty 4.16 7% 10% 13% 13% 43% 13% 83
Students 4.09 9% 9% 12% 22% 35% 14% 93
Admin 4.57 1% 7% 10% 15% 50% 17% 111
25c Stanford's Security Self-Help Tool
Mean VD D SD SS S VS Count Std. Dev. 99% CI+-
All 4.40 2% 6% 8% 30% 38% 15% 172 1.17 0.23
Faculty 4.37 2% 7% 12% 24% 37% 17% 41
Students 4.08 3% 8% 11% 38% 34% 6% 71
Admin 4.78 2% 3% 2% 25% 45% 23% 60
25d Symantec/Norton Antivirus
Mean VD D SD SS S VS Count Std. Dev. 99% CI+-
All 4.90 1% 3% 4% 16% 50% 26% 378 0.97 0.13
Faculty 4.93 1% 2% 3% 16% 56% 23% 127
Students 4.90 1% 2% 5% 19% 44% 29% 125
Admin 4.87 1% 4% 5% 14% 50% 26% 126

26. Percent Taking Specified Preventive Security
Measures On a Regular Basis, n=799
0% 20% 40% 60% 80% 100%
Passwords changed
every 6 mos.
Apps updates
installed when
available
Antivirus/anti-
spyware disk-
scanning on
OS auto update
Antivirus/anti-
spyware auto
update
Faculty
Students
Admin

S12 Three most common activities on cluster machines
Email 90
Class work 70
Problem sets 65
Programming 65
Other homework 63
Web browsing 60
Simulations 40
Thesis research 32
Other 25
Commum. Other than newsgroups 10
26 Which of the following preventive security measures are regularly followed
Antivirus/anti-
spyware auto
update
OS auto update Antivirus/anti-
spyware disk-
scanning on
Apps updates
installed when
available
Passwords
changed every 6
mos.
All 555 437 411 371 174
Faculty 122 97 92 74 47
Students 196 167 147 145 32
Admin 237 173 172 152 95
26 Which of the following preventive scuity measures are regularly followed
Antivirus/anti-
spyware auto
update
OS auto update Antivirus/anti-
spyware disk-
scanning on
Apps updates
installed when
available
Passwords
changed every 6
mos.
All 69% 55% 51% 46% 22%
Faculty 70% 56% 53% 43% 27%
Students 68% 58% 51% 50% 11%
Admin 70% 51% 51% 45% 28%


27. Percent of Cohort With No Backup of Their Data for
the Specified Period's Worth of Work, n=743
0% 20% 40% 60% 80% 100%
>One Month's
7-31 Day's
1-7 Day's
<1 Day's
Faculty
Students
Admin
Faculty 13% 40% 54% 74%
Students 32% 74% 88% 96%
Admin 14% 32% 43% 62%
>One Month's 7-31 Day's 1-7 Day's <1 Day's

S6a Desktop
0 1-20% 21-40% 41-60% 61-80% 81-100% Count
Students 35% 29% 4% 10% 10% 11% 240
S6b Laptop
0 1-20% 21-40% 41-60% 61-80% 81-100% Count
Students 4% 9% 5% 7% 15% 61% 261
S6c Handheld/PDA
0 1-20% 21-40% 41-60% 61-80% 81-100% Count
Students 88% 8% 1% 1% 0% 1% 213
S6d Cluster machine
0 1-20% 21-40% 41-60% 61-80% 81-100% Count
Students 44% 49% 4% 2% 0% 1% 234
27a By you
Daily Weekly Monthly <Monthly Never Count
All 10% 11% 13% 31% 34% 667
Faculty 16% 18% 17% 28% 21% 146
Students 3% 7% 14% 42% 34% 273
Admin 13% 13% 11% 21% 42% 248
27b By someone else
Daily Weekly Monthly <Monthly Never Count
All 19% 9% 3% 11% 59% 601
Faculty 19% 9% 1% 13% 58% 117
Students 0% 2% 1% 10% 86% 232
Admin 36% 15% 5% 10% 34% 252
27
Daily Weekly Monthly <Monthly Never Count
All 23% 15% 13% 29% 20% 743
Faculty 26% 21% 14% 27% 13% 164
Students 4% 8% 14% 42% 32% 273
Admin 38% 19% 11% 18% 14% 306
Backed up at all

28d. Percent Requiring Specified Allotment of Storage
Space For Over a Year, n=413
0% 10% 20% 30% 40% 50%
>1TB
1TB
500GB
100GB
Faculty
Students
Admin
Likelihood of Backing Up to a Central Server Instead of Own Computer N Detail
30. Central backup likelihood 721 Enter
7
Hands-
on,
instructo
r-led
class
One-on-
one
training
with
instruc-
tor
Online
training
Self-
instruc-
tion
Asking a
peer or
col-
league
for help Count
All 20% 16% 18% 23% 22% 706
Faculty 7% 24% 17% 29% 22% 147
Students 14% 12% 12% 31% 30% 265
Admin 32% 16% 24% 13% 15% 294
28a In any given one month period
100GB 500GB 1TB >1TB Count
All 72% 23% 5% 1% 415
Faculty 66% 30% 4% 0% 97
Students 74% 22% 4% 0% 209
Admin 74% 17% 6% 2% 109
28b In any given three month period
100GB 500GB 1TB >1TB Count
All 60% 31% 8% 2% 386
Faculty 56% 38% 6% 1% 90
Students 61% 31% 8% 1% 198
Admin 61% 23% 10% 5% 98
28c In any given year
100GB 500GB 1TB >1TB Count
All 43% 39% 15% 3% 415
Faculty 37% 44% 15% 3% 99
Students 46% 37% 14% 3% 204
Admin 45% 38% 15% 3% 112
28d For over a year
100GB 500GB 1TB >1TB Count
All 35% 40% 17% 8% 413
Faculty 33% 41% 17% 9% 94
Students 35% 41% 16% 8% 213
Admin 37% 37% 19% 8% 106
What is your preferred method for learning about
computing? (Select one.)
S11a Special function/reserved Unix clusters (e.g., specific software or cluster room reservations)
Mean 1-VU 2 3 4 5 6-VI Count Std. Dev. 99% CI+-
Students 2.83 36% 10% 18% 18% 11% 8% 120 1.70 0.40
S11b Moving away from on-site cluster access to remote access only
Mean 1-VU 2 3 4 5 6-VI Count Std. Dev. 99% CI+-
Students 2.90 33% 14% 13% 21% 12% 8% 120 1.70 0.40
S4a Domestic long distance
Mean
1-Not At
All Inter-
ested 2 3 4 5
6-Very
Inter-
ested Count Std. Dev. 99% CI+-
Students 2.27 55% 9% 12% 9% 9% 7% 223 1.67 0.29
S4b Cable TV
Mean
1-Not At
All Inter-
ested 2 3 4 5
6-Very
Inter-
ested Count Std. Dev. 99% CI+-
Students 2.99 42% 8% 8% 12% 12% 18% 229 2.00 0.34
30 Central backup likelihood
Highly
Unlikely Unlikely
Neithr
Likly Nor
Unlikely Likely
Highly
Likely Count
All 7% 14% 20% 32% 28% 721
Faculty 8% 15% 20% 32% 25% 158
Students 6% 12% 22% 31% 29% 269
Admin 7% 14% 18% 32% 29% 294


iPod or other MP3 device
31. Percent Making Some Use of Specified Portable
Computing Devices, n=682
0% 20% 40% 60% 80% 100%
Blackberry
Pocket PC device/Windows Mobile
Treo
Other cell phone with data capabilities
(Internet)
Palm OS device
High capacity storage devices other than
iPods or other MP3 devices
iPod or other MP3 device
Faculty
Students
Admin
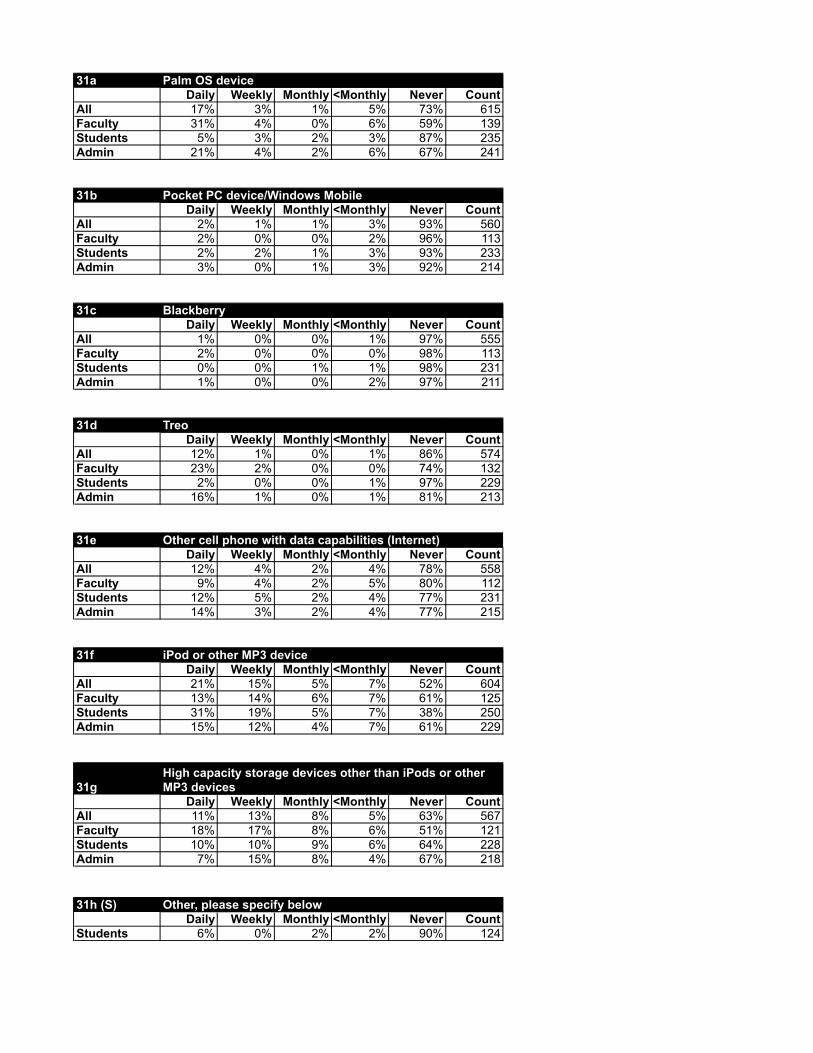
31a Palm OS device
Daily Weekly Monthly <Monthly Never Count
All 17% 3% 1% 5% 73% 615
Faculty 31% 4% 0% 6% 59% 139
Students 5% 3% 2% 3% 87% 235
Admin 21% 4% 2% 6% 67% 241
31b Pocket PC device/Windows Mobile
Daily Weekly Monthly <Monthly Never Count
All 2% 1% 1% 3% 93% 560
Faculty 2% 0% 0% 2% 96% 113
Students 2% 2% 1% 3% 93% 233
Admin 3% 0% 1% 3% 92% 214
31c Blackberry
Daily Weekly Monthly <Monthly Never Count
All 1% 0% 0% 1% 97% 555
Faculty 2% 0% 0% 0% 98% 113
Students 0% 0% 1% 1% 98% 231
Admin 1% 0% 0% 2% 97% 211
31d Treo
Daily Weekly Monthly <Monthly Never Count
All 12% 1% 0% 1% 86% 574
Faculty 23% 2% 0% 0% 74% 132
Students 2% 0% 0% 1% 97% 229
Admin 16% 1% 0% 1% 81% 213
31e Other cell phone with data capabilities (Internet)
Daily Weekly Monthly <Monthly Never Count
All 12% 4% 2% 4% 78% 558
Faculty 9% 4% 2% 5% 80% 112
Students 12% 5% 2% 4% 77% 231
Admin 14% 3% 2% 4% 77% 215
31f iPod or other MP3 device
Daily Weekly Monthly <Monthly Never Count
All 21% 15% 5% 7% 52% 604
Faculty 13% 14% 6% 7% 61% 125
Students 31% 19% 5% 7% 38% 250
Admin 15% 12% 4% 7% 61% 229
31g
Daily Weekly Monthly <Monthly Never Count
All 11% 13% 8% 5% 63% 567
Faculty 18% 17% 8% 6% 51% 121
Students 10% 10% 9% 6% 64% 228
Admin 7% 15% 8% 4% 67% 218
High capacity storage devices other than iPods or other
MP3 devices
31h (S) Other, please specify below
Daily Weekly Monthly <Monthly Never Count
Students 6% 0% 2% 2% 90% 124
S1a Information outside of Stanford (Google, Apple, Microsoft, Red Hat, etc.)
Mean 1-VU 2 3 4 5 6-VI Count Std. Dev. 99% CI+-
Students 4.67 6% 4% 8% 20% 24% 38% 265 1.45 0.23
S1b IT Services website
Mean 1-VU 2 3 4 5 6-VI Count Std. Dev. 99% CI+-
Students 3.51 12% 14% 20% 27% 19% 8% 252 1.45 0.24
S1c 5-HELP
Mean 1-VU 2 3 4 5 6-VI Count Std. Dev. 99% CI+-
Students 2.60 35% 18% 19% 14% 10% 4% 226 1.54 0.26
S1d HelpSU
Mean 1-VU 2 3 4 5 6-VI Count Std. Dev. 99% CI+-
Students 3.12 24% 13% 19% 23% 14% 8% 235 1.59 0.27
S1e Other students
Mean 1-VU 2 3 4 5 6-VI Count Std. Dev. 99% CI+-
Students 4.33 8% 6% 12% 21% 26% 27% 259 1.52 0.24
S1f RCCs
Mean 1-VU 2 3 4 5 6-VI Count Std. Dev. 99% CI+-
Students 3.67 20% 10% 12% 18% 19% 21% 237 1.81 0.30
S1g Student Help Desk (Meyer Help Desk)
Mean 1-VU 2 3 4 5 6-VI Count Std. Dev. 99% CI+-
Students 2.25 49% 14% 12% 16% 6% 3% 216 1.48 0.26
S1h Residential Computing website
Mean 1-VU 2 3 4 5 6-VI Count Std. Dev. 99% CI+-
Students 3.15 22% 15% 21% 16% 21% 5% 233 1.58 0.27
S1i Other Stanford computing websites
Mean 1-VU 2 3 4 5 6-VI Count Std. Dev. 99% CI+-
Students 2.97 27% 15% 17% 20% 14% 6% 230 1.60 0.27
S1j Training
Mean 1-VU 2 3 4 5 6-VI Count Std. Dev. 99% CI+-
Students 2.37 40% 17% 21% 12% 7% 3% 211 1.43 0.25


Importance of Specified Services for Completing Daily Work Mean N Detail
34d. Expanded wireless
networking4.17 624 Enter
34c. Expanded disk quota 3.71 612 Enter
34f. A university-wide
calendaring system3.70 620 Enter
34a. Central file storage services 3.69 631 Enter
34b. Email and calendaring on
PDAs3.33 619 Enter
34e. Stanford cell services 3.32 373 Enter
Importance of Specified Sweet Hall Cluster Options (for Students) Mean N Detail
S11b. Moving away from on-site
cluster access to remote access
only
2.9 120 Enter
S11a. Special function/reserved
Unix clusters (e.g., specific
software or cluster room
reservations)
2.82 120 Enter
F
S
A
F
S
A

34a Central file storage services
Mean 1-VU 2 3 4 5 6-VI Count Std. Dev. 99% CI+-
All 3.70 19% 10% 14% 15% 21% 20% 631 1.79 0.18
Faculty 3.69 21% 10% 14% 12% 22% 22% 146
Students 3.58 20% 10% 15% 17% 23% 15% 215
Admin 3.79 17% 11% 14% 16% 19% 23% 270
34b Email and calendaring on PDAs
Mean 1-VU 2 3 4 5 6-VI Count Std. Dev. 99% CI+-
All 3.34 34% 9% 10% 11% 12% 25% 619 2.04 0.21
Faculty 3.69 31% 6% 8% 10% 9% 36% 146
Students 2.78 42% 13% 11% 9% 12% 14% 207
Admin 3.57 29% 8% 10% 12% 13% 28% 266
34c Expanded disk quota
Mean 1-VU 2 3 4 5 6-VI Count Std. Dev. 99% CI+-
All 3.71 18% 8% 17% 17% 20% 20% 612 1.75 0.18
Faculty 3.94 14% 8% 14% 20% 19% 24% 145
Students 3.76 18% 7% 16% 17% 24% 17% 213
Admin 3.55 20% 10% 19% 16% 16% 19% 254
34d Expanded wireless networking
Mean 1-VU 2 3 4 5 6-VI Count Std. Dev. 99% CI+-
All 4.18 13% 7% 10% 16% 24% 30% 624 1.73 0.18
Faculty 4.50 9% 4% 11% 15% 27% 34% 151
Students 4.55 7% 6% 8% 18% 28% 33% 225
Admin 3.65 22% 11% 12% 14% 17% 24% 248
34e Stanford cell services
Mean 1-VU 2 3 4 5 6-VI Count Std. Dev. 99% CI+-
All 3.33 29% 10% 14% 12% 16% 20% 373 1.92 0.17
Faculty 3.39 32% 8% 13% 8% 16% 23% 130
Students
Admin 3.29 28% 11% 14% 14% 15% 18% 243
34f A university-wide calendaring system
Mean 1-VU 2 3 4 5 6-VI Count Std. Dev. 99% CI+-
All 3.70 19% 10% 12% 18% 20% 20% 620 1.78 0.18
Faculty 3.43 25% 15% 10% 15% 14% 22% 144
Students 3.60 20% 9% 14% 20% 24% 14% 203
Admin 3.93 16% 8% 12% 19% 21% 24% 273
S11a Special function/reserved Unix clusters (e.g., specific software or cluster room reservations)
Mean 1-VU 2 3 4 5 6-VI Count Std. Dev. 99% CI+-
Students 2.83 36% 10% 18% 18% 11% 8% 120 1.70 0.40
S11b Moving away from on-site cluster access to remote access only
Mean 1-VU 2 3 4 5 6-VI Count Std. Dev. 99% CI+-
Students 2.90 33% 14% 13% 21% 12% 8% 120 1.70 0.40
S4a Domestic long distance
Mean
1-Not At
All Inter-
ested 2 3 4 5
6-Very
Inter-
ested Count Std. Dev. 99% CI+-
Students 2.27 55% 9% 12% 9% 9% 7% 223 1.67 0.29
S4b Cable TV
Mean
1-Not At
All Inter-
ested 2 3 4 5
6-Very
Inter-
ested Count Std. Dev. 99% CI+-
Students 2.99 42% 8% 8% 12% 12% 18% 229 2.00 0.34
30 Central backup likelihood
Highly
Unlikely Unlikely
Neithr
Likly Nor
Unlikely Likely
Highly
Likely Count
All 7% 14% 20% 32% 28% 721
Faculty 8% 15% 20% 32% 25% 158
Students 6% 12% 22% 31% 29% 269
Admin 7% 14% 18% 32% 29% 294

Usefulness of Specified Services for Completing Daily Work Mean N Detail
35e. Integrated email,
calendaring, lists4.12 632 Enter
35g. Web services (design, data) 3.81 600 Enter
35b. Document management
software3.55 586 Enter
35d. Instant messaging 3.36 606 Enter
35c (F). Facility to support high-
performance computing3.30 132 Enter
35a. Collaboration software 3.30 585 Enter
F
S
A

35a Collaboration software
Mean
1-Not At
All
Useful 2 3 4 5
6-Very
Useful Count Std. Dev. 99% CI+-
All 3.30 24% 12% 17% 17% 16% 14% 585 1.74 0.19
Faculty 3.28 26% 15% 17% 8% 14% 20% 136
Students 3.20 25% 11% 17% 24% 12% 11% 211
Admin 3.41 21% 13% 16% 17% 21% 12% 238
35b Document management software
Mean
1-Not At
All
Useful 2 3 4 5
6-Very
Useful Count Std. Dev. 99% CI+-
All 3.56 20% 10% 17% 17% 19% 17% 586 1.75 0.19
Faculty 3.52 20% 11% 18% 17% 14% 19% 134
Students 3.36 24% 9% 18% 19% 16% 14% 212
Admin 3.75 17% 10% 15% 15% 24% 19% 240
35c (F) Facility to support high-performance computing
Mean
1-Not At
All
Useful 2 3 4 5
6-Very
Useful Count Std. Dev. 99% CI+-
Faculty 3.30 23% 16% 15% 17% 10% 19% 132 1.82 0.41
35d Instant messaging
Mean
1-Not At
All
Useful 2 3 4 5
6-Very
Useful Count Std. Dev. 99% CI+-
All 3.37 24% 13% 13% 19% 16% 16% 606 1.78 0.19
Faculty 2.57 38% 19% 15% 14% 6% 9% 127
Students 3.59 21% 10% 13% 22% 18% 18% 221
Admin 3.58 20% 12% 12% 19% 19% 17% 258
35e Integrated email, calendaring, lists
Mean
1-Not At
All
Useful 2 3 4 5
6-Very
Useful Count Std. Dev. 99% CI+-
All 4.12 13% 7% 11% 19% 22% 27% 632 1.70 0.17
Faculty 3.90 18% 8% 9% 20% 21% 24% 137
Students 4.05 13% 6% 14% 21% 20% 25% 220
Admin 4.29 11% 8% 10% 16% 25% 31% 275
35g Web services (design, data)
Mean
1-Not At
All
Useful 2 3 4 5
6-Very
Useful Count Std. Dev. 99% CI+-
All 3.81 15% 9% 17% 20% 19% 20% 600 1.67 0.18
Faculty 3.92 16% 9% 14% 19% 17% 26% 140
Students 3.55 18% 7% 22% 22% 14% 16% 209
Admin 3.97 11% 10% 16% 19% 24% 20% 251


Satisfaction with Specified Security Software Mean N Detail
25d. Symantec/Norton Antivirus 4.89 378 Enter
25c. Stanford's Security Self-
Help Tool4.39 172 Enter
25a. BigFix 4.39 169 Enter
25b. SpySweeper 4.29 287 Enter
Satisfaction with Specified Services (for Students) Mean N Detail
S10c. Wired network bandwidth 4.48 104 Enter
S10f. Web portal for ordering
services (phone, cable TV, etc.)4.28 66 Enter
S10b. Email quota 4.26 130 Enter
S10a. Web development and
publishing tools4.13 68 Enter
S10d. Cable TV 4.01 65 Enter
S10e. Central File Storage (AFS) 3.78 85 Enter

S10a Web development and publishing tools
Mean VD D SD SS S VS Count Std. Dev. 99% CI+-
Students 4.13 4% 3% 16% 31% 43% 3% 68 1.11 0.35
S10b Email quota
Mean VD D SD SS S VS Count Std. Dev. 99% CI+-
Students 4.27 3% 7% 15% 21% 45% 10% 130 1.22 0.28
S10c Wired network bandwidth
Mean VD D SD SS S VS Count Std. Dev. 99% CI+-
Students 4.48 2% 4% 8% 29% 46% 12% 104 1.05 0.27
S10d Cable TV
Mean VD D SD SS S VS Count Std. Dev. 99% CI+-
Students 4.02 8% 9% 12% 29% 28% 14% 65 1.43 0.46
S10e Central File Storage (AFS)
Mean VD D SD SS S VS Count Std. Dev. 99% CI+-
Students 3.79 9% 11% 14% 29% 31% 6% 85 1.39 0.39
S10f Web portal for ordering services (phone, cable TV, etc.)
Mean VD D SD SS S VS Count Std. Dev. 99% CI+-
Students 4.29 3% 8% 9% 26% 47% 8% 66 1.17 0.37


S12. Count of Three Most Common Activities
on Cluster Machines, n=182
0 20 40 60 80 100
Commum. Other than newsgroups
Other
Thesis research
Simulations
Web browsing
Other homework
Problem sets
Programming
Class work
S12 Three most common activities on cluster machines
Email 90
Class work 70
Problem sets 65
Programming 65
Other homework 63
Web browsing 60
Simulations 40
Thesis research 32
Other 25
Commum. Other than newsgroups 10
26 Which of the following preventive security measures are regularly followed
Antivirus/anti-
spyware auto
update
OS auto update Antivirus/anti-
spyware disk-
scanning on
Apps updates
installed when
available
Passwords
changed every 6
mos.
All 555 437 411 371 174
Faculty 122 97 92 74 47
Students 196 167 147 145 32
Admin 237 173 172 152 95
26 Which of the following preventive scuity measures are regularly followed
Antivirus/anti-
spyware auto
update
OS auto update Antivirus/anti-
spyware disk-
scanning on
Apps updates
installed when
available
Passwords
changed every 6
mos.
All 69% 55% 51% 46% 22%
Faculty 70% 56% 53% 43% 27%
Students 68% 58% 51% 50% 11%
Admin 70% 51% 51% 45% 28%


Satisfaction with Specified Ordering Methods (for Admin) Mean N Detail
A1b. Online HelpSU request 4.92 120 Enter
A1c. Phone-in HelpSU request 4.73 89 Enter
A1a. IT Services site 4.50 81 Enter
Satisfaction with Aspects of the Ordering Process (for Admin) Mean N Detail
A2b. Ease of access to ordering
method4.66 101 Enter
A2a. Time to complete order
form/communicate necessary
information
4.63 107 Enter
A2d. Time interval between
submission of order and
completion of order
4.57 100 Enter
A2c. Ability to submit multiple
requests at time of order4.42 71 Enter

A1a IT Services site
Mean VD D SD SS S VS Count Std. Dev. 99% CI+-
Admin 4.51 1% 7% 10% 17% 49% 15% 81 1.16 0.33
A1b Online HelpSU request
Mean VD D SD SS S VS Count Std. Dev. 99% CI+-
Admin 4.93 1% 3% 6% 14% 48% 29% 120 1.01 0.24
A1c Phone-in HelpSU request
Mean VD D SD SS S VS Count Std. Dev. 99% CI+-
Admin 4.73 2% 7% 4% 12% 51% 24% 89 1.20 0.33
A2a Time to complete order form/communicate necessary information
Mean VD D SD SS S VS Count Std. Dev. 99% CI+-
Admin 4.64 3% 3% 7% 18% 56% 14% 107 1.08 0.27
A2b Ease of access to ordering method
Mean VD D SD SS S VS Count Std. Dev. 99% CI+-
Admin 4.66 3% 4% 8% 14% 51% 20% 101 1.18 0.30
A2c Ability to submit multiple requests at time of order
Mean VD D SD SS S VS Count Std. Dev. 99% CI+-
Admin 4.42 3% 7% 10% 17% 52% 11% 71 1.20 0.37
A2d Time interval between submission of order and completion of order
Mean VD D SD SS S VS Count Std. Dev. 99% CI+-
Admin 4.57 3% 7% 5% 14% 57% 14% 100 1.19 0.31

Importance of Methods for Communicating About Service Offerings Mean N Detail
A4c. Email News Flash 4.18 253 Enter
A4e. Individual conversations
with IT Services staff4.06 224 Enter
A4d. IT Services Web pages 4.02 242 Enter
A4f. Other, please specify below 3.81 38 Enter
A4b. Articles, ads, and tips in the
Stanford Daily and Report3.30 240 Enter
A4a. IT Services Review
presentations3.16 224 Enter

A4a IT Services Review presentations
Mean 1-VU 2 3 4 5 6-VI Count Std. Dev. 99% CI+-
Admin 3.17 22% 15% 22% 17% 14% 10% 224 1.62 0.28
A4b Articles, ads, and tips in the Stanford Daily and Report
Mean 1-VU 2 3 4 5 6-VI Count Std. Dev. 99% CI+-
Admin 3.30 18% 13% 20% 25% 17% 7% 240 1.52 0.25
A4c Email News Flash
Mean 1-VU 2 3 4 5 6-VI Count Std. Dev. 99% CI+-
Admin 4.19 8% 6% 13% 24% 26% 22% 253 1.50 0.24
A4d IT Services Web pages
Mean 1-VU 2 3 4 5 6-VI Count Std. Dev. 99% CI+-
Admin 4.02 9% 6% 19% 26% 22% 18% 242 1.47 0.24
A4e Individual conversations with IT Services staff
Mean 1-VU 2 3 4 5 6-VI Count Std. Dev. 99% CI+-
Admin 4.06 9% 10% 15% 18% 27% 21% 224 1.57 0.27
A4f Other, please specify below
Mean 1-VU 2 3 4 5 6-VI Count Std. Dev. 99% CI+-
Admin 3.82 18% 3% 13% 26% 24% 16% 38 1.67 0.70


Satisfaction with Specified Service Attributes Mean N Detail
36a. Keeps the IT systems it
provides up and running4.94 473 Enter
36b. Delivers promised services
on a timely basis4.68 447 Enter
36d. Provides services that are
valuable to you4.67 463 Enter
36c. Helps you use technology
effectively4.53 447 Enter
Satisfaction with IT Services Overall Mean N Detail
37. IT Services services as a
whole4.68 490 Enter

36a Keeps the IT systems it provides up and running
Mean VD D SD SS S VS Count Std. Dev. 99% CI+-
All 4.95 0% 1% 3% 17% 55% 23% 473 0.82 0.10
Faculty 4.99 0% 3% 3% 11% 60% 23% 159
Students 4.78 0% 1% 6% 26% 50% 18% 141
Admin 5.05 0% 1% 2% 14% 55% 27% 173
36b Delivers promised services on a timely basis
Mean VD D SD SS S VS Count Std. Dev. 99% CI+-
All 4.68 1% 4% 5% 24% 49% 18% 447 1.02 0.12
Faculty 4.65 2% 6% 3% 20% 52% 17% 152
Students 4.59 2% 2% 6% 31% 47% 13% 129
Admin 4.79 1% 3% 5% 22% 47% 22% 166
36c Helps you use technology effectively
Mean VD D SD SS S VS Count Std. Dev. 99% CI+-
All 4.53 1% 5% 7% 29% 41% 16% 447 1.08 0.13
Faculty 4.42 1% 9% 7% 30% 40% 14% 149
Students 4.40 2% 5% 9% 33% 40% 11% 131
Admin 4.74 2% 1% 7% 25% 44% 22% 167
36d Provides services that are valuable to you
Mean VD D SD SS S VS Count Std. Dev. 99% CI+-
All 4.67 1% 3% 6% 24% 47% 18% 463 1.03 0.12
Faculty 4.69 1% 4% 6% 21% 49% 19% 155
Students 4.48 1% 4% 8% 30% 44% 12% 138
Admin 4.81 1% 2% 5% 22% 47% 23% 170
37 IT Services services as a whole
Mean VD D SD SS S VS Count Std. Dev. 99% CI+-
All 4.69 1% 2% 6% 22% 54% 14% 490 0.96 0.11
Faculty 4.67 2% 2% 6% 19% 55% 15% 164
Students 4.56 1% 3% 7% 28% 52% 9% 144
Admin 4.81 1% 2% 4% 20% 55% 18% 182


F S A
Faculty Students Administrative Staff
While the majority of questions were directed at all three cohorts (faculty, students and administrative staff), some questions in the survey were directed at only one or two cohorts. These questions have been fl agged with a colored letter box indicating which cohort(s) were asked.


F A
S
F A
F A
F A
S
S
S
S
S
S
S
S
S

F A
F A
F A

S
S

S

S
S
SS
F S
F S
F S
F S
S


S

S
S

A
A
A
A
A
A
A
A
A
A
A
A
A
A
A

S
S
S
S
S
S
F
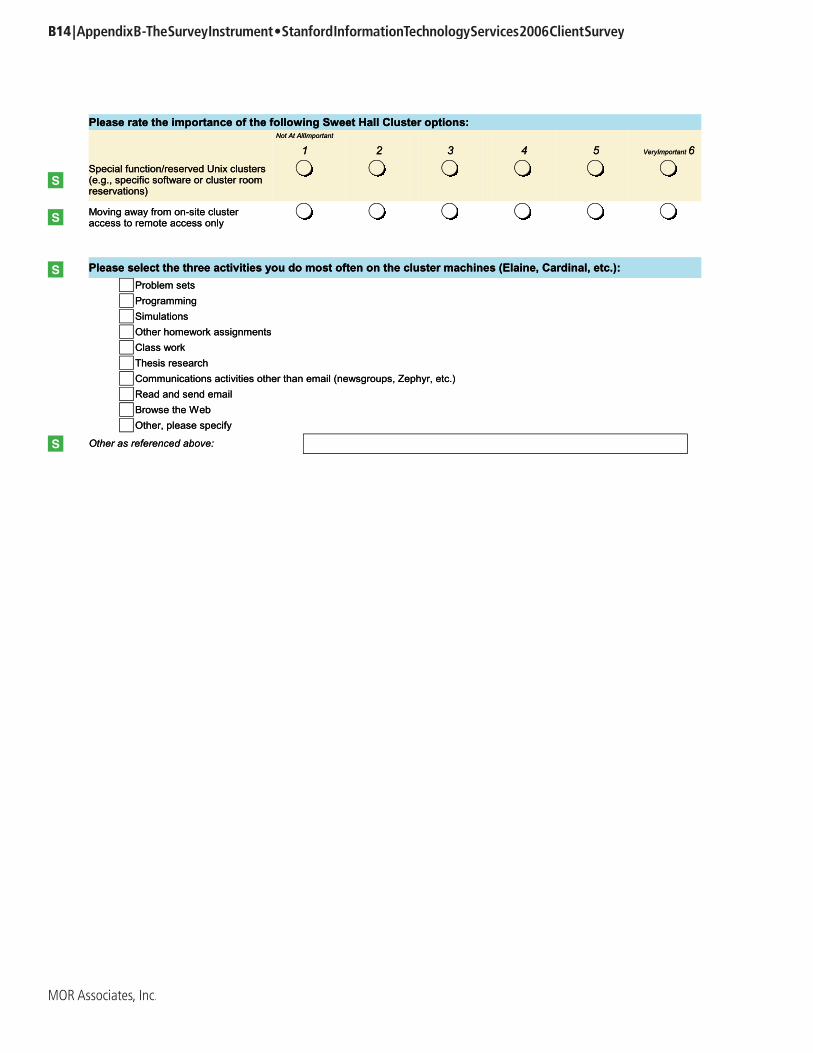
S
S
S
S

S
F


Summary
There have been two major changes to most of the rating scales to be used in this year’s client survey:
• The number of rating categories was increased from five to six.• There were substantial changes to how the categories are defined.
In previous surveys we used five point satisfaction scales of the form:
Very Dissatisfied
1Dissatisfied
2Neutral
3Satisfied
4
VerySatisfied
5NA
The six point scale we used this year is of the form:
Very Dissatisfied
1Dissatisfied
2
SomewhatDissatisfied
3
SomewhatSatisfied
4Satisfied
5
Very Satisfied
6
These changes should result in the following improvements:
• A greater ability to identify differences in the perception of services from one survey to the next; and between services within the same survey. This should result from the increase in the number of effective rating categories.
• Improved reliability and validity for rating questions by addressing the response problems associ-ated with the ambiguity of the Neutral and NA options.
Some details and rational for these scale changes are provided below.
Background
There are a wide variety rating scales but the five point scale is arguably the most common and its wide-spread use is largely a matter of familiarity or convention, rather than a deliberate choice of the most optimum scale. To some degree, all rating scales have problems with contraction bias and contraction bias a n d contraction bias satisficing as discussed below. The changes to our rating scales are intended to reduce these problematic effects.
Contraction Bias
As discussed by Tourangeau (2002), contraction bias - the tendency to avoid the end points of rating scales - is a common phenomenon in survey instruments. This typically results in clustered responses towards the middle of a scale and consequently makes it particularly problematic to detect changes over time, and identify differences across questions within the same survey. We’ve observed this problem directly in our own results and those of other institutions. The fewer the number of scale points, the more problematic this effect may be.

Satisficing
The concept of satisficing was forwarded by Krosnick and Alan (1987) as a particular type of response bias in which there is a tendency for survey respondents to often use the path of least cognitive work to minimally comply with survey obligations. Krosnick, et al. (2002), used the satisficing model to exam-ine the effect of no-opinion options in survey response and concluded that the “inclusion of no-opinion options in attitude measures may not enhance data quality and instead may preclude measurement of some meaningful opinions.” Our recent direct experience shows that the satisficing problem is further compounded by the ambiguity of Neutral or NA options, which appear to be used somewhat inter-changeably by respondents.
Contraction Bias, Satisficing and the Number of Scale Points
Our strategy was to reduce contraction bias by increasing the number of scale points, and to moderate satisficing effects by using a even numbered “forced choice” scale without a neutral mid point, or other explicit no-opinion option. Respondents were instructed to simply skip questions that did not apply. This left a well defined problem of determining the maximum even numbered scale. In a review of the litera-ture Krosnick and Fabrigar (1997) indicate that when there are greater than seven response categories, respondents fail to reliably distinguish between adjacent categories. This would indicate that since we wished to avoid an odd numbered scale with a neutral mid point, a six point scale should be optimal for our purposes.
Specific Changes to the Rating Scale
As noted above, our five point satisfaction scales have been of the form:
Very Dissatisfied
1Dissatisfied
2Neutral
3Satisfied
4
VerySatisfied
5NA
The NA (Not Applicable) choice is not technically considered part of the scale because it is not included in computations for level of satisfaction. There is also the option of skipping the question which provides a seventh response option. Note that:
• Of the seven available responses above (1,2,3,4,5, NA, skip), three of them (Neutral, NA, and skip) provide no, or ambiguous, information.
• There are really only four choices for level of satisfaction (1,2,4,5).• There is no obvious choice for a respondent who may “slightly” agree or disagree.
The six point scale we used this year is of the form:
Very Dissatisfied
1Dissatisfied
2
SomewhatDissatisfied
3
SomewhatSatisfied
4Satisfied
5
Very Satisfied
6
-Continued

There is an additional seventh response option, which is to skip the question. Note that:
• All the numbered choices indicate some level of satisfaction or dissatisfaction. • There is only one option for not providing information about level of satisfaction, and that is to skip
the question.• There is an unambiguous option for respondents who are only “somewhat” satisfied or dissatisfied.
Comparing Ratings between Five and Six Point Scales
A conversion process is required so that this years responses for the six point scale can be compared to the previous years ratings based on the five point scale. An additional 400 respondents were included in this years survey invitation, but these used a five point scale similar to those from previous years. Those responses were be used to develop a conversion table between the five and six point scales.
References
Groves, R.M., Fowler, F.J. Jr., Couper, M.P., Lepkowski, J.M., Singer, E., Tourangeau, R. (2004), Survey
Methodology. New York: Wiley-Interscience
Krosnick, J.A., Alwin, D.F. (1987). An evaluation of a cognitive theory of response ordereffects in survey measurement. Public Opinion Quarterly, 51, 201-219.
Krosnick, J.A., Holbrook, A.L., Berent, M.K., Carson, R.T., Hanemann, W.E., Kopp, R.J., Mitchell, R.C., Presser, S., Ruud, P.A., Smith, V.K., Moody, W.R., Green, M.C., and Conaway, M. 2002. “The Impact of ‘No Opinion’ Response Options on Data Quality.” Public Opinion Quarterly 66:371–403.Public Opinion Quarterly 6 6 : 3 7 1 – 4 0 3 .Public Opinion Quarterly
Krosnick, J.A. and L.R. Fabrigar. (1997). Designing rating scales for effective measurement in sur-veys. In: Survey Measurement and Process Quality, L. Lyberg, M. Collins, L. Decker, E. Deleeuw, C. Dippo, N. Schwarz, and D. Trewing eds. New York: Wiley-Interscience.
Tourangeau, R., Rips, L. J., & Rasinski, K. (2000), The psychology of survey response. Cambridge University Press.


FacultyQuestion Items in blue indicate questions that are primarily related to direct support. Items in green indicate questions dealing with broad facets of IT.
R2* N Strength of correlation
5-HELP Turnaround time for resolving your problem 68% 112
Delivers promised services on a timely basis 67% 146
Provides services that are valuable to you 66% 149 High
5-HELP Timeliness of initial response to your inquiry 64% 114
Problem resolution overall 64% 145
Helps you use technology effectively 61% 143
HelpSU Timeliness of initial response to your inquiry 56% 114
HelpSU: for submitting help requests (Admin, Faculty) 56% 103
5-HELP Ability to solve problem 56% 115
Customer-oriented approach 55% 129
HelpSU Turnaround time for resolving your problem 55% 109
5-HELP Ability to get through to a person 55% 115
HelpSU Ability to solve problem 50% 110
Self-help site (Admin, Faculty) 49% 44 Moderate
5-HELP Professionalism 48% 112 to high
Our organization’s website (Admin, Faculty) 47% 52
Keeps the IT systems it provides up and running 46% 153
High-speed (gigabit) access to other universities 43% 72
Telecomm Problem resolution 40% 81
HelpSU Professionalism 39% 107
BigFix 36% 42
Network services overall 35% 148
Documentation ... recovering from incidents 33% 84
Reliability of network: Wired 32% 134
Availability of network: Wired 31% 136
Stanford’s Central Computing Website (Admin, Faculty) 30% 66

Telecommunications overall 28% 145
ESS: Available selection of software 28% 131
Helpfulness of Stanford-specifi c software documentation 27% 109
Documentation ... securing your computer and preventing attacks 27% 121 Moderate
Wireless signal strength/quality of connection 23% 125 to low
HelpSU Ease of submitting online request 22% 106
Shrd Software: Timeliness of updates (Faculty, Student) 21% 45
Stanford’s Security Self-Help Tool 20% 40
Timeliness of security software updates 19% 130
Email overall 19% 160
ESS: Ease of installing software 19% 128
Software Lic: Responsiveness of staff to your requests 19% 58
Working from home using Stanford modem 18% 46
Shrd Software: Stability of the software (Faculty, Student) 17% 40
ESS: Timeliness of Stanford release of updated versions after vendor release 16% 123 Low
Shrd Software: Docs and announcements of software packages (Faculty, Student)
14% 40
Remote access while traveling within the U.S. 14% 145
Software Lic: Available selection of software 14% 78
Email Reliability 13% 136
Telecomm Billing system/statements 12% 60
Email Features 12% 137
Remote access while traveling outside the U.S. 12% 99
Working from home using Stanford DSL service 11% 63
Wireless availability of network on campus 10% 126
Shrd SW: Availability of software for course and research needs (Faculty, Student)
10% 46
Working from home using other Internet service provider 9% 103
Wireless guest registration process 8% 66
Email Speed 6% 141
Symantec/Norton Antivirus 6% 121 Very low
Email Ease of use 6% 141
Software Lic: Cost 5% 74
Voice mail 5% 111
Software Lic: Ease of ordering/purchasing 5% 73
Software Lic: Timeliness of updates 4% 71
SpySweeper 3% 78
* R2 is Pearson’s Correlation squared expressed as a percentage.

StudentsQuestion Items in blue indicate questions that are primarily related to direct support. Items in green indicate questions dealing with broad facets of IT.
R2 N Strength of correlation
Helps you use technology effectively 62% 128 High
HelpSU Professionalism 57% 92
Provides services that are valuable to you 56% 135
Problem resolution overall 54% 112
5-HELP Professionalism 50% 69
5-HELP Ability to solve problem 49% 69
Web development and publishing tools (Student) 48% 67 Moderate
Delivers promised services on a timely basis 44% 126 to high
Customer-oriented approach 38% 110
HelpSU Ability to solve problem 38% 93
HelpSU Turnaround time for resolving your problem 38% 93
BigFix 37% 53
5-HELP Turnaround time for resolving your problem 36% 68
Central File Storage (AFS) (Student) 35% 82
Shrd SW: Availability of software for course and research needs (Faculty, Student)
33% 66
Keeps the IT systems it provides up and running 33% 138
Email overall 29% 143
5-HELP Timeliness of initial response to your inquiry 24% 69
Email Reliability 24% 134
Telecomm Problem resolution 24% 65 Moderate
Web portal for ordering services (phone, cable TV, etc.)(Student) 22% 63 to low
Email Ease of use 21% 138
HelpSU Timeliness of initial response to your inquiry 20% 95
Email quota (Student) 20% 123
Shrd Software: Timeliness of updates (Faculty, Student) 20% 56

Remote access while traveling outside the U.S. 19% 65
Timeliness of security software updates 18% 113
Working from home using Stanford DSL service 18% 52
5-HELP Ability to get through to a person 17% 69
High-speed (gigabit) access to other universities 17% 88
Remote access while traveling within the U.S. 16% 90
Email Features 16% 138
Wired network bandwidth (Student) 16% 100 Low
Network services overall 15% 138
Telecommunications overall 15% 117
HelpSU Ease of submitting online request 14% 93
Voice mail 14% 57
Shrd Software: Docs and announcements of software packages (Faculty, Student)
14% 55
Documentation ... securing your computer and preventing attacks 14% 111
Email Speed 12% 138
SpySweeper 11% 87
Stanford’s Security Self-Help Tool 11% 65
Working from home using other Internet service provider 11% 87
Shrd Software: Stability of the software (Faculty, Student) 10% 60
Documentation ... recovering from incidents 10% 97
Telecomm Billing system/statements 10% 79
Reliability of network: Wired 9% 124
Software Lic: Ease of ordering/purchasing 8% 61
Working from home using Stanford modem 8% 43
Software Lic: Timeliness of updates 7% 58
Software Lic: Available selection of software 7% 69
Cable TV (Student) 6% 63 Very low
ESS: Ease of installing software 6% 125
Wireless signal strength/quality of connection 5% 128
Software Lic: Cost 5% 65
ESS: Available selection of software 5% 128
ESS: Helpfulness of Stanford-specifi c software documentation 5% 120
Availability of network: Wired 4% 121
ESS: Timeliness of Stanford release of updated versions after vendor release 4% 119
Wireless guest registration process 1% 81
Wireless availability of network on campus 1% 124
Symantec/Norton Antivirus 1% 116
Software Lic: Responsiveness of staff to your requests 0% 59
Wireless networking in the residences (Student) 0% 98
* R2 is Pearson’s Correlation squared expressed as a percentage.

AdministrativeQuestion Items in blue indicate questions that are primarily related to direct support. Items in green indicate questions dealing with broad facets of IT.
R2 N Strength of correlation
Helps you use technology effectively 71% 159
Delivers promised services on a timely basis 61% 159 High
Provides services that are valuable to you 61% 162
Phone-in HelpSU request (Admin) 53% 84
Keeps the IT systems it provides up and running 52% 164
Customer-oriented approach 51% 150
5-HELP Professionalism 51% 140
Problem resolution overall 51% 171
HelpSU Professionalism 48% 154
IT Services site (Admin) 47% 74
5-HELP Timeliness of initial response to your inquiry 46% 139
5-HELP Turnaround time for resolving your problem 45% 141 Moderate
5-HELP Ability to solve problem 43% 139 to high
HelpSU Timeliness of initial response to your inquiry 40% 158
HelpSU Ability to solve problem 40% 157
Telecomm Billing system/statements 39% 84
Ability to submit multiple requests at time of order (Admin) 39% 68
Telecomm Problem resolution 38% 108
Self-help site (Admin, Faculty) 37% 68
HelpSU Turnaround time for resolving your problem 37% 158
Online HelpSU request (Admin) 36% 113
5-HELP Ability to get through to a person 34% 140
Time to complete order form/communicate necessary information (Admin) 34% 101
HelpSU: for submitting help requests (Admin, Faculty) 32% 149
Ease of access to ordering method (Admin) 32% 97
Telecommunications overall 31% 163
Time interval between submission of order and completion of order (Admin) 30% 95 Moderate
Our organization’s website (Admin, Faculty) 25% 87 to low
HelpSU Ease of submitting online request 23% 157

Timeliness of security software updates 20% 146
ESS: Helpfulness of Stanford-specifi c software documentation 19% 107
Stanford’s Central Computing Website (Admin, Faculty) 18% 94
Network services overall 18% 148
Software Lic: Cost 17% 65
Documentation ... recovering from incidents 17% 111
Documentation ... securing your computer and preventing attacks 17% 132 Low
Wireless guest registration process 17% 68
Software Lic: Ease of ordering/purchasing 16% 66
Software Lic: Available selection of software 15% 72
ESS: Available selection of software 14% 129
BigFix 14% 65
ESS: Timeliness of Stanford release of updated versions after vendor release 14% 121
Reliability of network: Wired 12% 143
Software Lic: Timeliness of updates 11% 60
Stanford’s Security Self-Help Tool 11% 57
Availability of network: Wired 10% 145
Email overall 10% 178
Working from home using other Internet service provider 10% 100
Symantec/Norton Antivirus 9% 119
Remote access while traveling within the U.S. 8% 85
High-speed (gigabit) access to other universities 8% 85
Voice mail 7% 152
SpySweeper 7% 104
ESS: Ease of installing software 6% 120 Very low
Working from home using Stanford DSL service 6% 57
Wireless availability of network on campus 5% 92
Software Lic: Responsiveness of staff to your requests 5% 59
Email Reliability 5% 156
Wireless signal strength/quality of connection 4% 93
Email Features 4% 159
Working from home using Stanford modem 4% 65
Email Speed 3% 160
Email Ease of use 3% 158
Remote access while traveling outside the U.S. 0% 44