Large-sample confidence interval for a single proportion Significance test for a single proportion ...
28
8.1 Inference for a Single Proportion Large-sample confidence interval for a single proportion Significance test for a single proportion Choosing a sample size 1
-
Upload
aldous-shelton -
Category
Documents
-
view
221 -
download
2
Transcript of Large-sample confidence interval for a single proportion Significance test for a single proportion ...

8.1 Inference for a Single Proportion
Large-sample confidence interval for a single proportion Significance test for a single proportion Choosing a sample size
1

Recall: Population Proportion
Let p be the proportion of “successes” in a population. A random sample of size n is selected, and X is the count of successes in the sample.
We use the sample proportion as an estimator of the population proportion p.
ˆ X
pn
ˆ ˆ
(1 ) and
p p
p pp
n

3
Sampling Distribution of a Sample Proportion
As n increases, the sampling distribution becomes approximately Normal.
Sampling Distribution of a Sample Proportion
ˆFor large , has approximately the ( , (1 ) / ) distribution.n p N p p p n
4
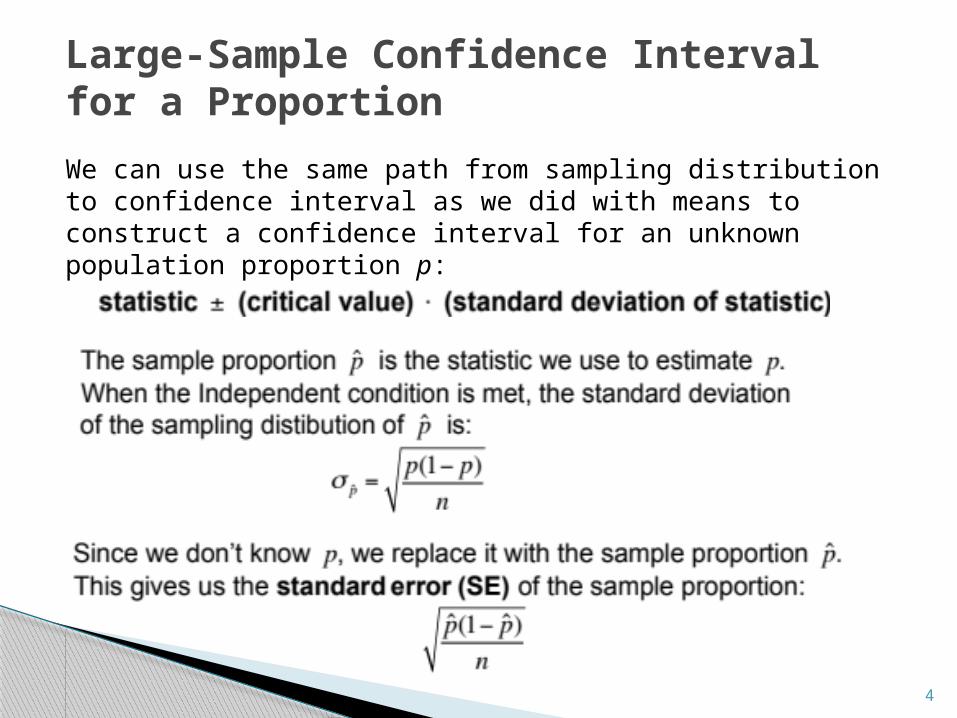
Large-Sample Confidence Intervalfor a Proportion
We can use the same path from sampling distribution to confidence interval as we did with means to construct a confidence interval for an unknown population proportion p:

5
Choose an SRS of size n from a large population that contains an unknown proportion p of successes. An approximate level C confidence interval for p is:
where z* is the critical value for the standard Normal density curve with area C between – z* and z*.
Use this interval only when the numbers of successes and failures in the sample are both at least 15.
One-Sample z Interval for a Population Proportion
Large-Sample Confidence Intervalfor a Proportion

Example: A news program constructs a call-in poll about
a proposed city ban on handguns. 2372 people call in to the show. Of these, 1921 oppose the ban.
Construct a 95% confidence interval for the true proportion of people who oppose the ban.
What are the possible problems with the study design?
Solution:
Note: Since p is a proportion, if you ever get an upper limit value of > 1 or lower <0 while calculating the CI, replace by 1 and 0 (respectively).
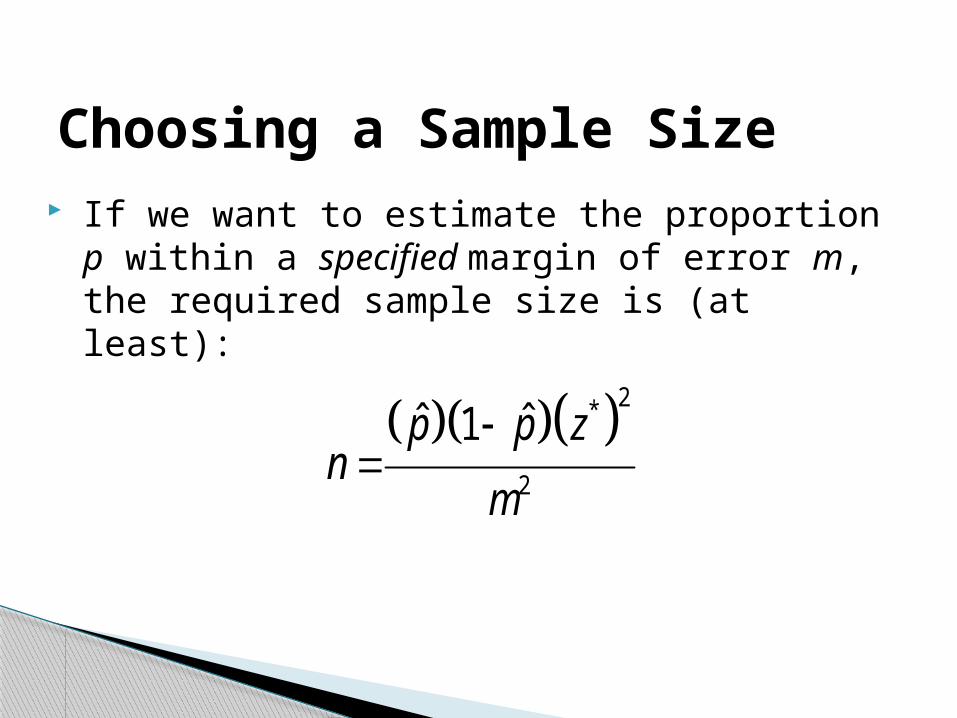
Choosing a Sample Size If we want to estimate the proportion p within a
specified margin of error m, the required sample size is (at least):
2*
2
ˆ ˆ1p p zn
m

Choosing a Sample Size
Since is unknown before the data is collected, we use any prior information we have to get a rough known estimate, p*.
◦ This is especially important if you believe p is close to 0 or 1.◦ Where might we find previous information about p?
If you have no information, we may replace p*, above, with 0.5 to obtain the most conservative sample size.
2* * *
2
1p p zn
m
2 2* *
2 2
0.5 1 0.5
4
z zn
m m
p̂

Example (handguns revisited):
Assume that we plan to ask randomly chosen people from the phone book.
We would like to have a margin of error of 0.03=3%. How big a sample size should we have now?

Another example: Suppose that the results of a survey of 2,000
television viewers at 11:40p.m. on Monday September 28, 1998 were recorded, and it was determined that 226 viewers watched “The Tonight Show.”
Estimate with 95% confidence the number of TVs tuned to “The Tonight Show” if there are 100 million potential television sets.

12
Significance Test for a ProportionThe z statistic has approximately the standard Normal distribution when H0 is true. P-values therefore come from the standard Normal distribution. Here is a summary of the details for a z test for a proportion.
Choose an SRS of size n from a large population that contains an unknown proportion p of successes. To test the hypothesis H0: p = p0, compute the z statistic:
Find the P-value by calculating the probability of getting a z statistic this large or larger in the direction specified by the alternative hypothesis Ha:
z Test for a Proportion

How big does the sample size need to be? The general rule of thumb to use here, as before
for approximation of binomial distribution by normal distribution, is
0 010, (1 ) 10np n p
Large-sample Significance Test for a Population Proportion
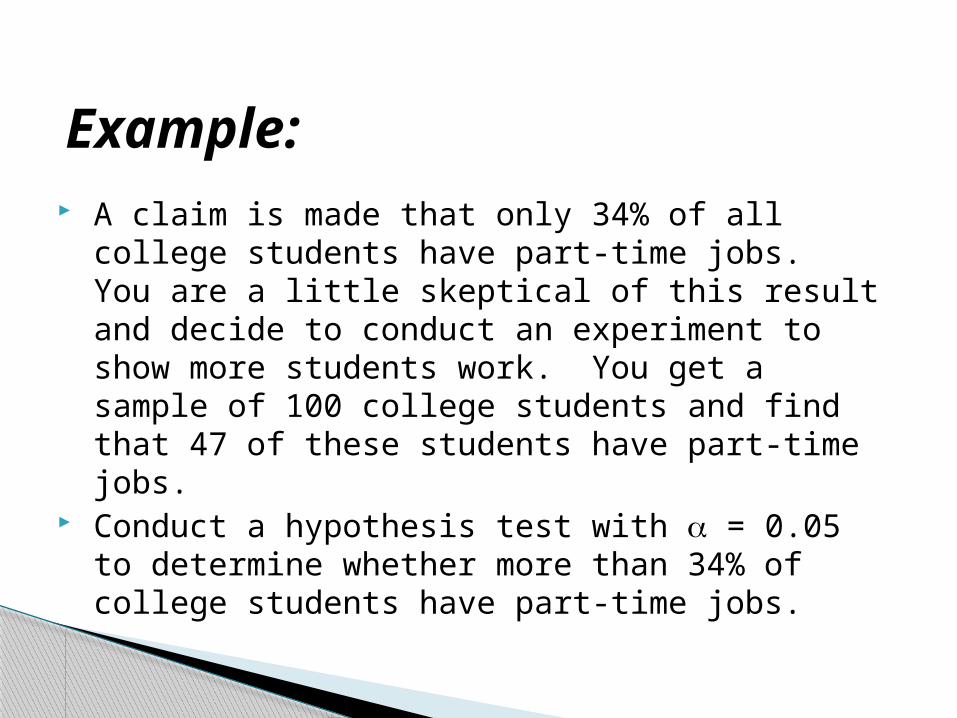
Example: A claim is made that only 34% of all college students
have part-time jobs. You are a little skeptical of this result and decide to conduct an experiment to show more students work. You get a sample of 100 college students and find that 47 of these students have part-time jobs.
Conduct a hypothesis test with = 0.05 to determine whether more than 34% of college students have part-time jobs.

SAS Programs
proportion.doc
But mostly hand computations.

8.2 Comparing Two Proportions
Large-sample confidence interval for a difference in proportions
Plus-four confidence interval for a difference in proportions
Significance test for a difference in proportions Relative risk
16
Comparing Two Proportions Before we begin… Intuitively, how do you think we will be comparing
two proportions?◦ Think in terms of two means, what did we do there?

18
Two-Sample Problems: ProportionsSuppose we want to compare the proportions of individuals having a certain characteristic in Population 1 and Population 2. Let’s call these parameters of interest p1 and p2. The ideal strategy is to take a separate random sample from each population and to compare the sample proportions with that characteristic.
What if we want to compare the effectiveness of Treatment 1 and Treatment 2 in a completely randomized experiment? This time, the parameters p1 and p2 that we want to compare are the true proportions of successful outcomes for each treatment. We use the proportions of successes in the two treatment groups to make the comparison. Here’s a table that summarizes these two situations.
19
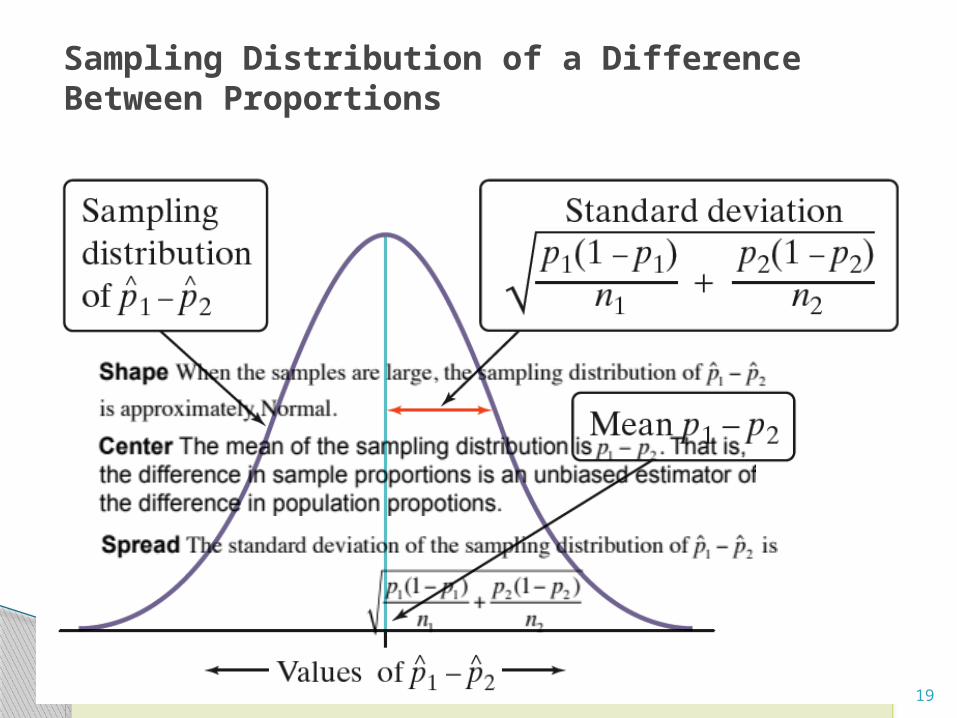
Sampling Distribution of a Difference Between Proportions
Choose an SRS of size n1 from Population 1 with proportion of successes
p1 and an independent SRS of size n2 from Population 2 with proportion of
successes p2.
The Sampling Distribution of the Difference Between Proportions

20
Confidence Interval for Comparing Proportions
21
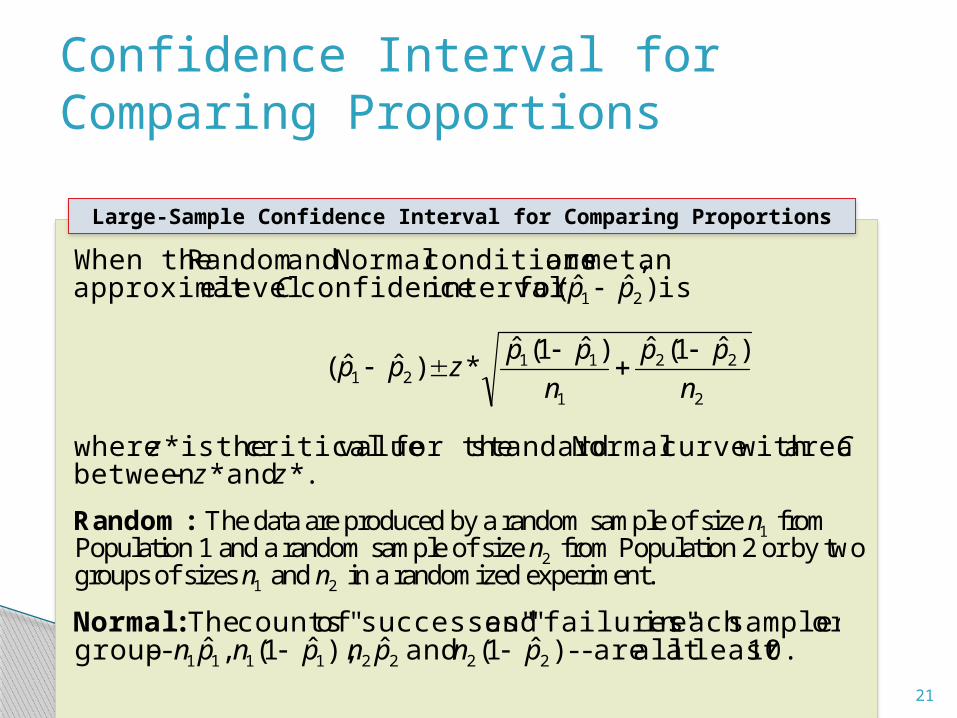
Large-Sample Confidence Interval for Comparing Proportions
1
2
1 2
The data are produced by a random sample of size fromPopulation 1 and a random sample of size from Population 2 or by twogroups of sizes and in a randomized experiment.
nn
n n
Random:
.* and *between area with curve Normal standard for the valuecritical theis * where
)ˆ1(ˆ)ˆ1(ˆ*)ˆˆ(
is )ˆˆ(for interval confidence level eapproximatan met, are conditions Normal and Random When the
2
22
1
1121
21
zzCz
n
pp
n
ppzpp
ppC
10.least at all are -- )ˆ1( and ˆ ),ˆ1( ,ˆ -- groupor sampleeach in failures"" and successes"" of counts The
22221111 pnpnpnpn :Normal
Confidence Interval for Comparing Proportions
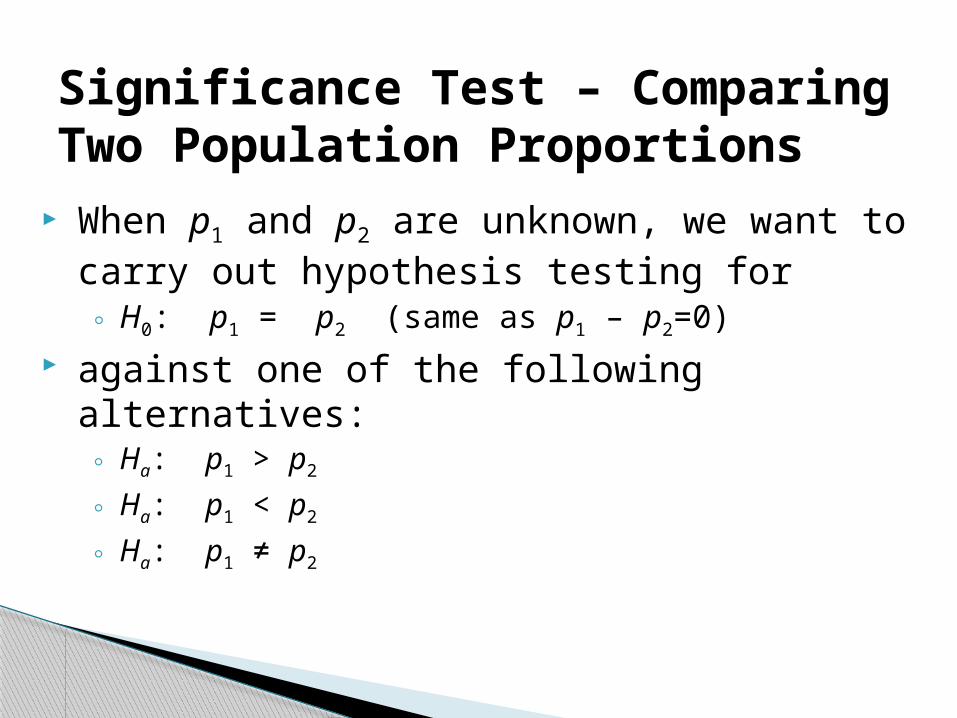
Significance Test – Comparing Two Population Proportions
When p1 and p2 are unknown, we want to carry out hypothesis testing for◦ H0: p1 = p2 (same as p1 – p2=0)
against one of the following alternatives:◦ Ha: p1 > p2
◦ Ha: p1 < p2
◦ Ha: p1 ≠ p2

Comparing Two Population Proportions: Significance Test
Under the null hypothesis H0: p1 = p2, we view all the data as coming from a single population with proportion p1=p2=p (p unknown).
To estimate p, we use:
21
21ˆnn
XXp
1 2
1 1 2 2ˆ ˆ
1 2 1 2
1 2
(1 ) (1 ) (1 ) (1 )
1 1(1 )
p p
p p p p p p p p
n n n n
p pn n

24
1
2
1 2
The data are produced by a random sample of size fromPopulation 1 and a random sample of size from Population 2 or by twogroups of sizes and in a randomized experiment.
nn
n n
Random
1 1 1 1 2 2 2 2
The counts of "successes" and "failures" in each sample orˆ ˆ ˆ ˆgroup -- , (1 ), and (1 ) -- are all at least 5.n p n p n p n p
Normal
The two samples are taken independently of each other. When samplingwithout replacement, check that the two populations are at least 10 timesas large as the corresponding samples (the 10%
Independent
condition).
Significance Test for Comparing Two Proportions
1 1
2
2
Draw an SRS of size from a large population having proportion of successes,and draw an independent SRS of size from a large population having proportion
of successes. To test the hypothesis
n pn
p 0 1 2
1 2
1 2
: 0, first find the pooled ˆproportion of successes in both samples combined. Then compute the statistic
ˆ ˆ( )
1 1ˆ ˆ(1 )
Find the -value
H p pp z
p pz
p pn n
P
by calculating the probability of getting a statistic this largeor larger in the direction specified by the alternative hypothesis :a
zH
Significance Test for Comparing Proportions

Example: In a highly-publicized study, doctors confirmed earlier
observations that aspirin seems to help prevent heart attacks. The research project employed 21,996 male American physicians. Half of these took an aspirin tablet every other day, while the other half took a placebo on the same schedule. After 3 years, researchers determined that 139 of those who took aspirin and 239 of those who took placebo had had heart attacks. Determine whether these results indicate that aspirin is effective in reducing the incidence of heart attacks at significance level 0.05.

Example (Aspirin and Heart Attacks):
Estimate with 95% confidence the difference in proportion of men risking a heart attack (in the next 3 years) among aspirin takers and non-takers.

Relative Risk
Another way to compare two proportions is to study the ratio of the two proportions, which is often called the relative risk (RR). A relative risk of 1 means that the two proportions are equal.
The procedure for calculating confidence intervals for relative risk is more complicated (use software) but still based on the same principles that we have studied.
The age at which a woman gets her first child may be an important factor in the risk of later developing breast cancer. An international study selected women with at least one birth and recorded if they had breast cancer or not and whether they had their first child before their 30th birthday or after.
Number with cancer Sample size
First birth at 30+
683 3220 21.2%
First birth at <30
1498 10,245 14.6%
45.1146.
212.RR
Women with a late first child have 1.45 times the risk of developing breast cancer.
p̂

Relative risk:
Example: Calculate the relative risk for the aspirin example:
Software gives confidence intervals (based on data) for population relative risk: p1 / p2
This is another way of comparing the two population proportions.
1
2
ˆ
ˆp
RRp