, Keivan G. Stassun , Robert D. Mathieu arXiv:0903.1892v1 ... · The very young system 2MASS...
19
arXiv:0903.1892v1 [astro-ph.SR] 11 Mar 2009 To appear in ApJ Circumstellar Environment and Effective Temperature of the Young Substellar Eclipsing Binary 2MASS J05352184-0546085 Subhanjoy Mohanty 1 , Keivan G. Stassun 2 , Robert D. Mathieu 3 ABSTRACT We present new Spitzer IRAC/PU/MIPS photometry from 3.6 to 24 μm, and new Gemini GMOS photometry at 0.48 μm, of the young brown dwarf eclipsing binary 2MASS J05352184-0546085, located in the Orion Nebula Cluster. No excess disk emission is detected: The measured fluxes at λ ≤ 8μm are within 1σ ( 0.1 mJy) of a bare photosphere, and the 3σ upper limit at 16 μm is a mere 0.04 mJy above the bare photospheric level. To- gether with the known properties of the system, this implies the absence of optically thick disks around the individual components. It also implies that if any circumbinary disk is present, it must either be optically thin and extremely tenuous (10 −10 M ⊙ ) if it extends in to within ∼0.1 AU of the binary (the approximate tidal truncation radius), or it must be optically thick with a large inner hole, >0.6–10 AU in radius depending on degree of flaring. The consequence in all cases is that disk accretion is likely to be negligible or absent. This supports the recent proposal that the strong Hα emission in the primary (more massive) brown dwarf results from chromo- spheric activity, and thereby bolsters the hypothesis that the surprising T eff inversion observed between the components is due to strong magnetic fields on the primary. Our data also set con- straints on the T eff of the components independent of spectral type, and thereby on models of the aforementioned magnetic field effects. We discuss the consequences for the derived fundamental properties of young brown dwarfs and very low-mass stars in general. Specifically, if very active isolated young brown dwarfs and very low-mass stars suffer the same activity/field related effects as the 2M0535-05 primary, the low-mass stellar/substellar IMF currently derived from standard evolutionary tracks may be substantially in error. Subject headings: stars: low-mass, brown dwarfs – stars: pre-main sequence – circumstellar matter – stars: fundamental parameters – techniques: photometric 1. Introduction The very young system 2MASS J05352184-0546085 (henceforth 2M0535-05), located in the Orion star- forming region, has been identified by Stassun et al. (2006, hereafter SMV06) as the first known substellar eclipsing binary (EB). EBs allow exquisitely precise direct determinations of the component masses and radii, as well the ratio of their surface brightnesses (or equivalently, ratio of their T eff ). As such, 2M0535-05 1 Harvard-Smithsonian Center for Astrophysics, Cambridge, MA 02138, USA. [email protected] 2 Department of Physics & Astronomy, Vanderbilt University, Nashville, TN 37235, USA. 3 Department of Astronomy, University of Wisconsin–Madison, Madison, WI 53706, USA.
-
Upload
nguyendang -
Category
Documents
-
view
214 -
download
1
Transcript of , Keivan G. Stassun , Robert D. Mathieu arXiv:0903.1892v1 ... · The very young system 2MASS...

arX
iv:0
903.
1892
v1 [
astr
o-ph
.SR
] 1
1 M
ar 2
009
To appear in ApJ
Circumstellar Environment and Effective Temperature of the Young Substellar
Eclipsing Binary 2MASS J05352184−0546085
Subhanjoy Mohanty1, Keivan G. Stassun2, Robert D. Mathieu3
ABSTRACT
We present new Spitzer IRAC/PU/MIPS photometry from 3.6 to 24 µm, and new
Gemini GMOS photometry at 0.48 µm, of the young brown dwarf eclipsing binary
2MASS J05352184−0546085, located in the Orion Nebula Cluster. No excess disk emission
is detected: The measured fluxes at λ ≤ 8µm are within 1σ (. 0.1 mJy) of a bare photosphere,
and the 3σ upper limit at 16 µm is a mere 0.04 mJy above the bare photospheric level. To-
gether with the known properties of the system, this implies the absence of optically thick disks
around the individual components. It also implies that if any circumbinary disk is present, it
must either be optically thin and extremely tenuous (10−10 M⊙ ) if it extends in to within ∼0.1
AU of the binary (the approximate tidal truncation radius), or it must be optically thick with a
large inner hole, >0.6–10 AU in radius depending on degree of flaring. The consequence in all
cases is that disk accretion is likely to be negligible or absent. This supports the recent proposal
that the strong Hα emission in the primary (more massive) brown dwarf results from chromo-
spheric activity, and thereby bolsters the hypothesis that the surprising Teff inversion observed
between the components is due to strong magnetic fields on the primary. Our data also set con-
straints on the Teff of the components independent of spectral type, and thereby on models of the
aforementioned magnetic field effects. We discuss the consequences for the derived fundamental
properties of young brown dwarfs and very low-mass stars in general. Specifically, if very active
isolated young brown dwarfs and very low-mass stars suffer the same activity/field related effects
as the 2M0535−05 primary, the low-mass stellar/substellar IMF currently derived from standard
evolutionary tracks may be substantially in error.
Subject headings: stars: low-mass, brown dwarfs – stars: pre-main sequence – circumstellar
matter – stars: fundamental parameters – techniques: photometric
1. Introduction
The very young system 2MASS J05352184−0546085 (henceforth 2M0535−05), located in the Orion star-
forming region, has been identified by Stassun et al. (2006, hereafter SMV06) as the first known substellar
eclipsing binary (EB). EBs allow exquisitely precise direct determinations of the component masses and
radii, as well the ratio of their surface brightnesses (or equivalently, ratio of their Teff). As such, 2M0535−05
1Harvard-Smithsonian Center for Astrophysics, Cambridge, MA 02138, USA. [email protected]
2Department of Physics & Astronomy, Vanderbilt University, Nashville, TN 37235, USA.
3Department of Astronomy, University of Wisconsin–Madison, Madison, WI 53706, USA.

– 2 –
allows the first stringent tests of the theoretical evolutionary models widely employed to characterize the
vast majority of brown dwarfs (for which direct measurements of mass and radius are not possible).
The analysis of SMV06 (and the follow-up analysis of Stassun et al. 2007) reveals that: (1) both com-
ponents of 2M0535−05 are moderate-mass brown dwarfs (0.057 ± 0.004 and 0.036 ± 0.003 M⊙); (2) their
radii are ∼10% larger than expected from standard evolutionary models for their assumed age of 1 Myr (see
Fig. 3 of Chabrier et al. 2007); and (3) the ratio of the secondary’s to primary’s Teff is T2/T1 ≈ 1.05, i.e., the
more massive primary is cooler than its less massive companion. This last point is highly surprising, since
all standard models for substellar evolution predict that for coeval bodies (as the EB components are likely
to be; but see §5.2), higher mass translates to higher Teff , not lower.
The most compelling explanation for the Teff reversal (and radius discrepancy) has been advanced by
Chabrier et al. (2007, henceforth CGB07), who propose that it arises from the suppression of convection by
rapid rotation and strong magnetic fields. In particular, they show that a significant reduction in convective
efficiency combined with a large areal coverage of cool magnetic spots, in the primary, can reproduce SMV06’s
results; as a by-product, they predict Teffs of 2320K and 2440K for the primary and secondary, respectively.
This hypothesis has been bolstered via optical spectroscopy by Reiners et al. (2007, henceforth R07), who find
that the primary is indeed rapidly rotating and evinces strong Hα emission indicative of large surface magnetic
fields (v sini ∼ 10 km s−1 ; Hα equivalent width (EW) & 32.6A ⇒ LHα/Lbol & −3.47 ⇒ magnetic field
strength Bf ∼ 4 kG), while the secondary is a slow rotator with comparatively weak Hα emission/magnetic
fields (v sini < 5 km s−1 ; Hα EW ∼ 4.8A ⇒ LHα/Lbol ∼ −4.30 ⇒ Bf ∼ 2 kG).
Nevertheless, two open questions remain. First, R07’s support of CGB07’s theory depends on ascribing
the strong Hα emission in the primary to chromospheric activity (which allows R07 to translate it to a
magnetic field strength using the field dwarf LHα/Lbol –B relationship found by Reiners & Basri 2008).
However, 2M0535−05 is an extremely young system in a star-forming region; like stars, brown dwarfs at
such ages very often exhibit strong Hα emission due to disk accretion instead of activity (e.g. Mohanty et al.
2005; Muzerolle et al. 2005). The contamination of the primary’s instrinsic emission by the strong nebular
emission (which permits R07 to set only a lower limit on its Hα EW) means that the line profile and EW
cannot categorically exclude accretion; another diagnostic is required.
Second, the absolute Teffs of the components of 2M0535−05 have yet to be accurately determined.
SMV06’s eclipse data do not allow a direct measure of the individual Teff of the components, only their
ratio, so spectral type information was used to estimate the separate temperatures. From optical and near-
infrared (NIR) spectra and colors, Stassun et al. (2007, henceforth S07) find spectral types of ∼ M6.5–M7
for the components, and thereby Teff ∼ 2700K and ∼ 2900K for the primary and secondary respectively.
R07 further find these temperatures to be consistent with detailed analysis of TiO bands in high-resolution
optical spectra. CGB07, on the other hand, predict Teffs significantly cooler, by ∼300K, for both (see above).
Temperatures derived independently of spectral types can thus validate/constrain both the CGB07 models
and the spectral type–Teff conversion scale in the presence of suppressed convection.
Detailed spectral energy distribution (SED) observations and modeling are ideal for investigating both
questions. For example, a lack of significant mid-infrared (MIR) excess dust emission would strongly argue
against any surrounding optically thick accretion disks in 2M0535−05, and thus against ongoing accretion,
making the case for chromospheric activity in the primary more robust. Simultaneously, detection of photo-
spheric levels from the optical to the MIR (in the absence of disk emission) would allow constraints on the
Teffs via more general blackbody/opacity considerations than spectral type arguments.
To accomplish these goals, in this paper we combine NIR photometry from the literature with new Spitzer
– 3 –
photometry over 3.6–24 µm and Gemini photometry at 0.48 µm, to construct a complete SED of 2M0535−05
from 0.48 µm to 24 µm (§2). In §3 we present synthetic SED models of substellar objects surrounded by disks
with various geometries, for the purpose of comparing against the observed SED of 2M0535−05. Results are
presented in §4, where we find that the observations clearly indicate that 2M0535−05 is devoid of optically
thick disk dust within at least ∼ 0.6–10AU of the brown dwarfs, sugesting that accretion is negligible or
absent in 2M0535−05. We also find that the observed SED is most consistent with a relatively warm
temperature scale for the brown dwarfs, similar to that found for field M dwarfs. As we discuss in §5,
the observational evidence now strongly implicates magnetic activity on the primary (more massive) brown
dwarf as the reason for the surprising reversal of temperatures in 2M0535−05. However, the CGB07 models
of young brown dwarfs undergoing magnetically suppressed convection predict Teffs several hundred K cooler
than inferred from the observed SED, and in §5 we discuss possible ways to rectify this discrepancy.
2. Observations
We constructed the spectral energy distribution (SED) of 2M0535−05 from broadband flux measure-
ments over the wavelength range 0.48–24 µm. These measurements are summarized in Table 1. In all cases
we confirmed that the observations were made outside eclipse, to ensure that the full combined flux of both
components was obtained. In addition, as noted below, we adopt uncertainties somewhat larger than the
formal measurement errors to account for systematic errors and/or spot-induced variability in 2M0535−05.
2.1. Photometry from the literature
NIR magnitudes at JHKS (1.2–2.2 µm) were taken from the 2MASS database and converted to fluxes
using the zero-points described in the 2MASS All-Sky Data Release Explanatory Supplement1. The formal
uncertainties in each passband are ∼ 0.02 mag. We adopt uncertainties of 0.05 mag to account for out-of-
eclipse variability at these wavelengths (Gomez Maqueo Chew et al. 2009). An optical flux at IC was taken
from the observations of Stassun et al. (1999), where we adopt an uncertainty of 0.1 mag to account for
out-of-eclipse variability observed in the I band (S07).
2.2. New photometry
A flux measurement in the Sloan g′ passband was obtained with the Gemini North GMOS instrument
under photometric conditions on 2008 Jan 24 with an exposure time of 300 s. There are few suitable
comparison stars in the small GMOS field of view. We selected the star Par 1812 as the comparison star
because it is reasonably bright but unsaturated in our observations, and has both B and V magnitudes
available in the SIMBAD catalog. 2M0535−05 was measured to be 5.93 mag fainter than Par 1812 in the g′
filter in this observation, and its g′ magnitude converted to absolute flux units using the zero-points defined
in Fukugita et al. (1996). The formal measurement error is ∼ 0.02 mag. We adopt an uncertainty of 0.1 mag
to account for intrinsic variability in the comparison star of ∼ 0.1 mag in the visible (Samus et al. 2004).
To cover the MIR portion of the SED where any disk emission would be expected to dominate, new
1http://www.ipac.caltech.edu/2mass/releases/allsky/doc/sec6 4a.html

– 4 –
imaging observations of 2M0535−05 were obtained with the Spitzer Space Telescope (program #40503). We
observed at all four passbands of the IRAC instrument (3.6–8 µm), with the IRS instrument in blue peak-up
mode (16 µm), and with the MIPS instrument at 24 µm. Forty IRAC frames were obtained in High Dynamic
Range mode in a medium-scale dither pattern. One 12-s long exposure and one 0.6-s short exposure were
obtained for each frame in all 4 channels, yielding total exposure times of 480 s and 24 s for the long and
short exposures respectively. This allowed us to avoid overexposing in the more sensitive channels 1 and 2
(3.6 and 4.5 µm) while obtaining sufficient S/N in the less sensitive channels 3 and 4 (5.8 and 8.0 µm). Fifty
dithered IRS blue peak-up images were obtained with a 30 s integration time for each, for a total on-source
integration time of 1500 s. Finally, 24 µm MIPS photometry was acquired in the small field of view mode,
with 20 cycles, 15 frames per cycle and 10-s frames, resulting in a total on-source integration time of 3000 s.
2M0535−05 was detected in all four of the Spitzer IRAC images. We followed the procedure described
in the IRAC Data Handbook2 for performing aperture photometry on the pipeline generated mosaic images.
Specifically, we used an aperture radius of 3 pixels and a background annulus of 3–7 pixels, and then applied
aperture correction factors of 1.124, 1.127, 1.143, and 1.234 in IRAC channels 1, 2, 3, and 4, respectively.
Photometry for channels 1 and 2 was performed on the short exposure images, and for channels 3 and 4 on
the long exposures. The measurement uncertainties of 10–50% (Table 1) are dominated by the bright and
highly spatially variable nebular background.
2M0535−05 was not detected in the IRS peak-up (16 µm) and MIPS 24 µm images. Thus we instead
determined upper limits by measuring the per-pixel background noise level in an annulus centered on the
source position, with inner and outer radii of 1 and 5 pixels, respectively. These too are reported in Table 1.
The resulting observed SED of 2M0535−05 at 0.48–24 µm is displayed in Fig. 1. For comparison, the
figure also shows a model SED using the dusty model atmospheres of Allard et al. (2001) at the radii and
temperatures determined by S07 (R1 = 0.675 R⊙, R2 = 0.486 R⊙, T1 = 2715 K, T2 = 2890 K). The
bolometric luminosities are computed directly from the temperatures and radii (via the Stefan-Boltzmann
relation). The model SED was fit to the data via χ2 minimization, where the only free parameters are the
distance and the extinction, for which we find d = 415 ± 19 pc and AV = 0.4 ± 0.2 mag. The reduced χ2
of the fit is χ2ν = 0.97 (ν = 7 degrees of freedom). These distance and extinction values are consistent with
other determinations to the young Orion Nebula Cluster (ONC; e.g., Hirota et al. 2007; Genzel et al. 1981;
Hillenbrand 1997).
3. Models Employed: Disks and Synthetic Spectra
To compare the observed SED of 2M0535−05 with that expected from young brown dwarfs with disks,
we employed the Monte Carlo radiative transfer code of Whitney et al. (2003a,b) to generate model SEDs.
The code randomly emits photons from the central illuminating source(s) and follows the photons as they
interact with (i.e., are absorbed or scattered by) any circumstellar material. Here we model the circumstellar
material as an optically thick circumbinary disk of dust extending from an inner truncation radius, Rtrunc, to
an outer radius of 100 AU. The code self-consistently solves for thermal equilibrium in the disk as absorbed
photons heat the disk and are re-radiated. Sublimation of dust is also included (for details of the dust
properties used by the code, see Table 3 of Whitney et al. 2003b).
2http://ssc.spitzer.caltech.edu/irac/dh/

– 5 –
The most important input parameters of the central illuminating source(s) are the total luminosity and
the intrinsic (photospheric) SED. We adopt the effective temperatures and luminosities for the components
of 2M0535−05 from S07. Built into the code are the solar-metallicity NextGen atmosphere models of
Hauschildt et al. (1999), which are virtually identical to the dusty models at the warm Teff of S07.
We considered two classes of disk models, corresponding to different flaring assumptions:
1. Flared disk, where disk scale-height h increases with radial distance from the star: h = h01.25 (h0 =
scale-height at stellar surface determined via hydrostatic equilibrium calculation, typically ∼ 0.01R⋆).
This corresponds to a disk in vertical hydrostatic equilibrium and well-mixed gas and dust, with flaring
caused by heating of grains in the optically thin disk surface by stellar irradiation.
2. Geometrically thin, flat disk, where h remains constant with . This corresponds to the case where
all the grains have settled to the disk mid-plane.
In all models (except one case in §4.1 where explicitly stated otherwise) we used a disk mass of 10−3 M⊙
with a surface density profile falling off like −2.25 (see Whitney et al. 2003a,b). In addition, the disks are
modeled as “passive” disks, i.e. they do not generate any intrinsic lumonisity via accretion. As such, the
fluxes predicted by these model SEDs should be regarded as the minimum fluxes that such disks would be
expected to produce. The resulting model SEDs for the two disk classes above are shown in Figs. 2 and 3.
4. Results
4.1. No evidence for accretion disks in 2M0535−05
Figs. 2–3 show that, if the disk is optically thick and viewed edge-on (i.e., in the orbital plane of the
eclipsing binary, as expected from the standard assumption of co-planarity), then only a geometrically thin
flat disk can fit the observed flux measurements at 0.48–8.0µm and upper limits at 16–24µm 3. Moreover,
such a flat disk, if present, must also possess a large inner hole at least 0.6 AU in radius.
Dropping the coplanarity assumption yields even larger inner holes (not shown): as the disk is seen
more face-on, the observed flux from it increases, requiring a larger hole to bring the flux back down to the
observed values / upper limits.
An optically thick “flared” disk can only fit the data if it is severely non-coplanar with the binary orbital
plane and has a very large inner hole (Fig.3). If seen edge-on, the relatively large vertical scale-heights of the
outer regions of such a disk produce & 5 mag of extinction at 1 µm, and even more at shorter wavelengths.
(The model SEDs show strong sampling noise in Fig. 3 due to the severe attenuation of photons from the
brown dwarfs at these wavelengths.) Thus to match the observed optical and NIR SED, it needs to be seen
at a much more face-on orientation. As in the flat disk case, however, the observed MIR flux increases with
such orientation (and more severely so for the flared disk than the flat, since the former intercepts more
stellar radiation than the latter for a given hole size). This again pushes the hole inner radius to even larger
3Strictly speaking, flat disk models consistent with the data can only fit the 16µm upper limit; while remaining consistent
with the 24µm upper limit, they imply that the true 24µm flux must be much lower. Any flat disk model that passes through
the 24µm upper limit produces a 16µm flux much higher than the observed upper limit in the latter band, and can thus be
ruled out.

– 6 –
values to remain consistent with the MIR data. The result, as shown in Fig. 3, is that an optically thick
flared disk can only fit the observed SED of 2M0535−05 if it is inclined to the orbital plane by 45◦ and
simultaneously possesses an inner hole at least ∼ 10 AU in radius.
All the above immediately also implies that no optically thick disk exists around the individual com-
ponents, since the smallest hole size the data can accomodate for such a disk is 0.6 AU, while the binary
semi-major axis is only 0.04 AU (S07). Thus an optically thick disk, if at all present, must be circumbinary.
The results also imply that any disk material that extends inwards of 0.6 AU must be optically thin.
We explore this case further by assuming an inner truncation radius equal to the tidal truncation radius
for the binary. Based on the simulations by Artymowicz & Lubow (1996), we take this to be ∼3 times the
semi-major axis (0.04 AU) ≈ 0.1 AU. For a flat disk with a hole of this size, and the same disk outer radius
and radial density profile as before, we find the maximum dust-disk mass consistent with the data to be
10−10 M⊙ (i.e., a paltry 10−9 of the total binary mass). Note that a smaller inner hole would imply an even
smaller disk mass; as a corollary, any optically thin disks around the individual components must also be
less massive than this limit.
Accretion can be ruled out for the optically thin disk cases: the extremely low dust masses implied
for these, < 3×10⁻³ lunar masses, are far too small for primordial accretion disks. For the optically thick
cases, the lower limits on inner hole size of 0.6-10 AU also makes accretion unlikely. Even the smaller value
of 0.6 AU equals &6 times the tidal truncation radius and ∼30 times the dust destruction radius. Such a
large hole in the dust disk may be cleared either by substantial grain growth, or by sweeping of material
by planet/planetesimal formation, or by photoevaporation. The first would imply very significant grain
evolution, suggesting that the disk has probably moved beyond the main accretion phase. The other two
scenarios would result in the clearing of gas as well as dust within the hole. All three scenarios therefore
make significant ongoing accretion unlikely.
Moreover, if accretion streams were indeed spiralling in from the inner edge of the circumbinary disk
onto the binary, the theory and simulations of Artymowicz & Lubow (1996) indicate that they should pref-
erentially land on the less massive component, manifestly not the situation in 2M0535−05 if the observed
& 7× stronger Hα emission in the primary (Reiners et al. 2007) is taken as an accretion indicator. Addi-
tionally, 2M0535−05 exhibits no large-amplitude photometric variability (S07), in contrast to that seen in
the young binaries so far shown to be experiencing accretion from circumbinary disks (Mathieu et al. 1997;
Jensen et al. 2007).
Finally, the data do not explicitly require the presence of a disk at all. The data out to 8 µm in fact
indicate a naked photosphere alone, and it is only the uncertainty embodied in the 16 and 24µm upper
limits (and the lack of data beyond) that forces a conservative inclusion of the possibility of a disk. All of
the evidence taken together therefore suggests that significant ongoing gas accretion in this system is very
unlikely, and that the strong Hα emission observed in the primary is indeed related to chromospheric activity
as suggested by R07.
4.2. Effective temperatures of 2M0535−05 are higher than predicted by CGB07 models
We now discuss the Teff of the 2M0535-05 components in more detail, by comparing the observed SED
to dusty synthetic spectra. We note that for the hotter Teff proposed by S07, nextgen spectra (which a
priori neglect dust formation) are very similar to dusty ones, since no dust forms at these relatively warm

– 7 –
Teff anyway. However, the cooler ones proposed by CGB07 would lead to dust formation. For consistency,
therefore, we use dusty models for evaluating both the the S07 and CGB07 temperatures.
Fig. 1 compares our observed optical-to-MIR photometry to dusty synthetic spectra at the spectral-
type-dependent Teff adopted by S07 (and supported by R07), namely, [T1, T2] = [2715K, 2890K]. The match
is clearly very good, with the predictions agreeing with the data to within ∼ 1σ in all bands.
Fig. 4 shows the analogous comparison at the cooler Teff proposed by CGB07: [T1, T2] = [2320K, 2440K].
In the NIR and MIR, the agreement with the synthetic photometry is just as good as in the hotter case
above; the reduced χ2 of the fit at 1 ≤ λ ≤ 8µm is χ2ν = 1.06 with a best-fit distance of 330 ± 11 pc and
AV = 0.0 ± 0.1. However, even at so near a distance and with no extinction, in the g′-band there is a large
discrepancy, with the predicted photometry fainter than the data by ∼ 4.5σ. Basically, the observed SED
appears significantly bluer than expected at the CGB07 temperatures. Prima facie, these results support
the hotter Teff suggested by S07/R07.
One may argue that the synthetic spectra suffer from opacity uncertainties that considerably weaken the
above comparisons and conclusion. Given the huge number and complexity of atomic and molecular opacities
that must be accurately modeled to reproduce such cool spectra, this objection is worthy of consideration.
A counter-argument might be that we find the optical data to be bluer than predicted in Fig. 4, while
shortcomings in the opacities have led, if anything, to the observed optical colors (e.g., V −I) of field M dwarfs
being redder than in the models (e.g., Allard et al. 2000). As those authors also show, newer opacities—
incorporated in the models we use—have now substantially mitigated this discrepancy. Nevertheless, it is
fruitful to attack the problem via more general considerations.
We do so by comparing our data to blackbody curves at the suggested temperatures. M-type spectra
clearly depart significantly from pure blackbodies, but the precise manner in which they do so provides
important insights. In particular, molecular opacities (predominantly TiO and VO) strongly suppress the
optical spectrum, relative to a blackbody at the same Teff , in early- to mid-M dwarfs; dust opacity exacerbates
this effect in the late M types. A smaller suppression of flux also occurs over a large swathe of the MIR due
to H2O absorption. For a given Teff , this flux must escape somewhere, and it does so predominantly in the
NIR, leading to an enhancement of flux, relative to a blackbody, at these wavelengths. The upshot is that
for M type objects, a blackbody at the same Teff represents an upper limit to the actual emitted flux in the
optical and MIR, and a lower limit in the NIR. This is a general prediction of basic opacity considerations
in these objects, independent of the precise details of synthetic spectra and attendant opacity uncertainties.
Figs. 1 and 4 show how our data compare to blackbodies at the S07/R07 and CGB07 Teff respectively.
In both plots, the blackbodies have been scaled to the same distance and have been reddened by the same
amount as the synthetic spectra, i.e., the relative differences between the two are preserved. At the hotter
proposed Teff (Fig. 1), where the synthetic spectra agree with the observations in all bands, the blackbody
follows the prediction above: in the optical and MIR it is brighter than, and in the NIR fainter than or at
most equal to, the observed (and synthetic) photometry. At the CGB07 Teff (Fig. 4), however, the situation
is very different: while the blackbody is somewhat brighter than the data in the MIR and fainter than or
equal to it in the NIR, as expected, in the optical g′-band the blackbody matches the data (which is more
than 4σ brighter than the synthetic g′, as stated earlier). In other words, if this were the correct Teff , the
synthetic spectra would have to produce flux at blackbody levels in the optical g′-band to reproduce the
data4. This is very much against expectations for M type objects, as outlined above. These results again
4One cannot escape this conclusion by invoking a change in scaling, such that the synthetic spectrum at the CGB07 Teff

– 8 –
indicate that the hotter Teff proposed by S07/R07 better represent the true situation than the significantly
cooler ones proposed by CGB07. At the very least, we can conservatively state that the CGB07 Teffs are a
lower limit, and reality is likely to be closer to the S07/R07 results.
It is somewhat more difficult to place an upper limit on the component Teffs based on our broad-band SED
measurements. At warmer Teffs, the model SEDs show bluer colors and produce higher luminosities (for fixed
radii). Consequently, to accommodate warmer temperatures, the system must be placed at a larger distance
and must be seen through larger amounts of extinction. Meanwhile, the model SEDs change relatively little
at λ > 1µm. Thus it is possible to fit the observed SED very well with virtually any warmer Teff so long
as the system is highly reddened and is placed at a suitably high distance. However, if we assume that the
system can be no further than 520 pc and reddened by at most AV = 2.0, then the maximum temperatures
that still allow the model SED to fit the data within 95% confidence are [T1, T2] = [3230K, 3435K], where
again we adopt the Teff ratio and radii from S07. We emphasize that this upper limit is based solely on
the broad-band SED; such high Teffs would not be consistent with the spectral typing of SMV06 or the
high-resolution spectral modeling of R07, which indicate maximum Teffs of [T1, T2] ≈ [2850K, 3000K].
5. Discussion and Conclusions
Our Spitzer observations rule out optically thick circumstellar disks around the individual components of
2M0535−05. While the data cannot completely rule out a optically thick circumbinary disk, due to the upper
limits in the 16 and 24µm photometry, any such disk must have a large inner hole: & 10 AU inner radius if
the disk is flared, or & 0.6 AU if it is flat. These dust hole sizes would imply clearing by either significant
grain growth and evolution, which in turn makes it likely that the disk is near the end of, or beyond, its main
accretion phase; or by planetesimal formation or photoevaporation, both of which would clear gas as well
as dust within the hole, also making significant ongoing accretion unlikely. We also stress that the derived
inner-disk hole sizes are lower limits based on our 16 and 24µm photometry upper limits; thus it is very likely
that the holes are significantly bigger (or indeed that there is no disk at all). Accretion is also unlikely given
that (a) it is the primary that shows large Hα emission (while binary accretion theory predicts preferential
accretion onto the secondary), and (b) there is no evidence for the type of large-amplitude photometric
variability usually observed in accreting systems (Gomez Maqueo Chew et al. 2009). In combination, these
results indicate that it is not accretion but chromopsheric activity that underlies the strong Hα emission
from the 2M0535−05 primary. In turn, this bolsters the argument, made by CGB07 and R07, that the Teff
reversal between the components is due to the combined effects of the rotation and magnetic fields that
underlie activity. We now discuss the S07/R07 and CGB07 Teff results in this light.
5.1. Problems with the cooler effective temperatures predicted for 2M0535−05
There are two important reasons for trying to distinguish between the hotter Teffs for 2M0535−05
determined by S07/R07 and the much cooler ones proffered by CGB07. The first concerns activity. CGB07
are able to match SMV06’s mass-radius data by invoking, in the primary, both a large global reduction
in convective efficiency (mixing length parameter α = 0.5 instead of the usual ≈ 2) and a large covering
approaches the optical data more closely, and the blackbody falls above the latter: any significant rescaling in this direction will
push the blackbody curve far above the NIR observations as well, which is also inadmissible by our simple arguments above.
– 9 –
fraction of cool spots β = 0.5, leading to a primary Teff = 2320K. At least in field dwarfs, however, such Teff
are typical of & M9 dwarfs, which are usually highly inactive despite rapid rotation (e.g., Mohanty & Basri
2003). The generally adopted reason for this is a rapid drop in the photospheric ionization levels at such
low Teff (Mohanty et al. 2002). This phenomenon appears to extend to M dwarfs in star-forming regions as
well, where the same reduction in activity (e.g., in X-rays) is seen with later M-types, and ascribed to the
same physics (e.g., Stelzer et al. 2005).
Adopting the CGB07 Teff would thus imply that the 2M0535−05 primary is somehow able to remain
extremely active despite being very cool. CGB07 acknowledge this problem, but their solution—activity
started on the primary when it was much hotter, but the resulting suppression of convection eventually
drove its Teff down to its present value—does not appear very satisfactory: the primary still has to maintain
very strong activity at its current Teff to explain the (observed) large Hα emission and (proposed) very
high spot covering fraction. The S07/R07 Teff , corresponding to usual mid-M values, would be much more
consistent with such activity / spot coverage: activity levels peak in the mid-M types (e.g., Gizis et al. 2002).
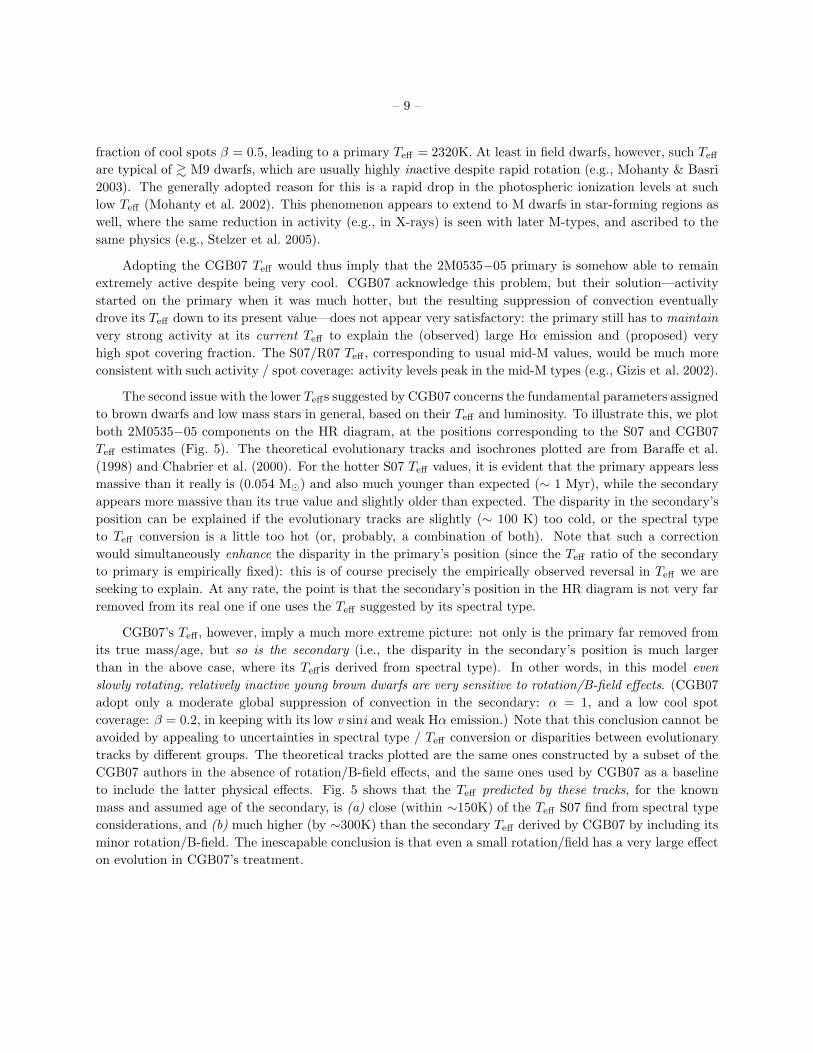
The second issue with the lower Teffs suggested by CGB07 concerns the fundamental parameters assigned
to brown dwarfs and low mass stars in general, based on their Teff and luminosity. To illustrate this, we plot
both 2M0535−05 components on the HR diagram, at the positions corresponding to the S07 and CGB07
Teff estimates (Fig. 5). The theoretical evolutionary tracks and isochrones plotted are from Baraffe et al.
(1998) and Chabrier et al. (2000). For the hotter S07 Teff values, it is evident that the primary appears less
massive than it really is (0.054 M⊙) and also much younger than expected (∼ 1 Myr), while the secondary
appears more massive than its true value and slightly older than expected. The disparity in the secondary’s
position can be explained if the evolutionary tracks are slightly (∼ 100 K) too cold, or the spectral type
to Teff conversion is a little too hot (or, probably, a combination of both). Note that such a correction
would simultaneously enhance the disparity in the primary’s position (since the Teff ratio of the secondary
to primary is empirically fixed): this is of course precisely the empirically observed reversal in Teff we are
seeking to explain. At any rate, the point is that the secondary’s position in the HR diagram is not very far
removed from its real one if one uses the Teff suggested by its spectral type.
CGB07’s Teff , however, imply a much more extreme picture: not only is the primary far removed from
its true mass/age, but so is the secondary (i.e., the disparity in the secondary’s position is much larger
than in the above case, where its Teff is derived from spectral type). In other words, in this model even
slowly rotating, relatively inactive young brown dwarfs are very sensitive to rotation/B-field effects. (CGB07
adopt only a moderate global suppression of convection in the secondary: α = 1, and a low cool spot
coverage: β = 0.2, in keeping with its low v sini and weak Hα emission.) Note that this conclusion cannot be
avoided by appealing to uncertainties in spectral type / Teff conversion or disparities between evolutionary
tracks by different groups. The theoretical tracks plotted are the same ones constructed by a subset of the
CGB07 authors in the absence of rotation/B-field effects, and the same ones used by CGB07 as a baseline
to include the latter physical effects. Fig. 5 shows that the Teff predicted by these tracks, for the known
mass and assumed age of the secondary, is (a) close (within ∼150K) of the Teff S07 find from spectral type
considerations, and (b) much higher (by ∼300K) than the secondary Teff derived by CGB07 by including its
minor rotation/B-field. The inescapable conclusion is that even a small rotation/field has a very large effect
on evolution in CGB07’s treatment.

– 10 –
5.2. Implications for theoretical models of young low-mass stars and brown dwarfs
All our above analyses—both from the observational standpoint of SEDs, and the theoretical ones of
plausibility of strong activity on the primary and agreement of the slowly rotating, weakly active secondary
with the isochrones—suggest that the hotter Teff proposed by S07/R07 are more likely for 2M0535−05’s
components than the cooler ones predicted by CGB07 by including rotation/field effects. Under the circum-
stances, we briefly examine the viability of two other potential mechanisms for producing the temperature
reversal.
Accretion: Disk accretion can change the properties (radius, luminosity) of T Tauri stars; while the
components of 2M0535−05 appear to be post-accretion, is it possible that the effects of their past accretion
phase (which must have occurred) linger, and give rise to the observed temperature reversal? The brief
answer is that this is quite improbable, for the following reason. In most T Tauri stars, with accretion rates
. 10−5 M⊙ yr−1, the accretion is assumed to be “cold”. That is, the thermal energy of the accreted material
is radiated away into space from the uppermost photospheric layers over a small fraction of the stellar surface,
and contributes negligibly to the internal energy of the star (Hartmann et al. 1997). It is only in the extreme
conditions and very high accretion rates found in FU Orionis-type objects that this condition is likely to be
violated. In the “cold” limit, the effect of accretion (when the accretion timescale becomes comparable to, or
shorter than, the Kelvin-Helmholtz timescale) is to decrease the stellar luminosity by decreasing the radius,
without affecting the stellar temperature very much: essentially, the star does not have time to expand to
the radius it would have for the corresponding mass in the absence of accretion.
In the case of the BD components under discussion here, the past accretion for each should have been
of order M . 5 × 10⁻⁷ M⊙ yr−1 (given their masses of ∼ 0.05 M⊙ , and assuming a minimum age of
105 years). Inserting this along with their other properties into the equations supplied by Hartmann et al.
(1997) shows that the “cold” limit is applicable to our BDs as well, as might have been intuitively expected
from the much smaller accretion rates in BDs compared to T Tauri stars. One does not therefore expect
the accretion to change their temperatures by any significant amount, only their radii. Recent calculations
assuming “cold” accretion in BDs bear this out: accretion rates of & 10−8 M⊙ yr−1 can decrease the BD
radius significantly (up to few tens of percent), thus making it sub-luminous compared to a non-accretor of
the same mass, but the temperature of the BD remains virtually unchanged from its value in the absence of
accretion (Gallardo et al. 2008, see also discussion of the latter results in Chabrier et al. 2007). Therefore,
while future calculations should further clarify the effects of accretion on BD properties, it appears quite
unlikely that the temperature reversal observed in 2M0535−05 is caused by the lingering effects of past
accretion.
Non-coevality: Second is the intriguing possibility that the assumption of coevality for the binary com-
ponents may not be quite true. From comparisons to theoretical tracks, S07 concluded that an age difference
of ∼ 0.5 Myr, together with a slight (∼ 70K) reduction in the Teff derived from spectral types, could in fact
explain the entirety of the Teff reversal without resorting to any other mechanism.
On the one hand, the reality of non-coevality effects in determining initial binary properties is strongly
suggested by another eclipsing binary, also in the ONC, discovered recently by Stassun et al. (2008). The
stellar components of this system have almost exactly the same mass (0.41 M⊙) but differ greatly in Teff (by
∼300K) and luminosity (by a factor of ∼ 1.5). With both stars exhibiting very small Hα emission, indicating
very low field strengths, as well as nearly the same v sini , field and rotation effects do not appear plausible
for explaining their differences. However, a difference of a few hundred thousand years in the individual
ages of the stars can indeed do the trick, as Stassun et al. postulate. A similar non-coevality in 2M0535−05

– 11 –
therefore cannot be discounted.
At the same time, the reality of field/rotation effects on low mass objects is also strongly supported
by recent data. In particular, Morales et al. (2008) show that very active field dwarfs are cooler and larger
than their non-active counterparts at the same luminosity (or equivalently same mass, given the tight mass-
luminosity correlation on the low-mass ZAMS). Given that the components of 2M0535−05 have the same
mid-M spectral type and interior structure (fully convective) as the low-mass end of Morales et al.’s sample,
do exhibit strong differences in rotation and activity, and evince precisely the same trend (more active
component is less luminous and larger than expected) as the field dwarfs, the role of activity/magnetic fields
in determining the properties of 2M0535−05 cannot be discounted either.
It therefore appears plausible that both age and rotation/field effects are important for understanding
the Teff reversal in 2M0535−05. Indeed, this may resolve the problem of uncomfortably low Teff derived in
the CBG07 analysis: if non-coevality (of < 0.5 Myr) moves the system partially towards Teff reversal, the
remainder of the reversal may be effected by rotation/field effects using temperatures more in line with the
higher values espoused here and by S07/R07.
Finally, we emphasize the importance of pinning down the potential effects of rotation/fields in young
low-mass objects for determining the overall IMF of low-mass stars and brown dwarfs. A large fraction of
young, non-accreting brown dwarfs rotate significantly faster than not only the 2M0535−05 secondary, but
than the primary as well; many of these also have Hα EWs, and thus presumably field strengths, comparable
to the primary’s (Mohanty et al. 2005). If rotation/field effects are important, as the results for 2M0535−05
and the field dwarfs suggest, the masses of these objects obtained from comparisons to the usual evolutionary
tracks (which do not include such effects) are possibly significantly incorrect (analogous to the situation for
the 2M0535−05 primary; see Fig. 5 and §5.1), and thus so is the derived IMF. 2M0535−05 is an extremely
fortuitous find in this regard, not only because it is an EB, but also because its two components represent
both classes of brown dwarfs: rapidly rotating highly active ones, and slowly rotating weakly active ones. A
good physical understanding of both components is essential for an accurate description of the fundamental
properties of brown dwarfs and low-mass stars.
S.M. is grateful to the Spitzer Fellowship program for funding this research. K.G.S. acknowledges funding
support from a Spitzer Cycle-4 GO grant and a Cottrell Scholar award from the Research Corporation.
REFERENCES
Allard, F., Hauschildt, P. H., & Schwenke, D. 2000, ApJ, 540, 1005
Allard,F., Hauschildt,P.H., Alexander,D., Tamanai,A., Schweitzer,A., 2001, ApJ, 556, 357
Apai, D., Pascucci, I., Bouwman, J., Natta, A., Henning, T., & Dullemond, C. P. 2005, Science, 310, 834
Artymowicz, P., & Lubow, S. H. 1996, ApJ, 467L, 77
Baraffe, I., Chabrier, G., Allard, F., & Hauschildt, P. H. 1998, A&A, 337, 403
Baraffe,I., Chabrier,G., Allard,F., Hauschildt,P., 2002, A&A, 382, 563
Baraffe,I., Chabrier,G., Barman,T., Allard,F., Hauschildt,P., 2003, A&A, 402, 701

– 12 –
Baraffe,I., Chabrier,G., Barman,T., Selsis,F., Allard,F., Hauschildt,P., 2005, A&A, 436, L47
Burrows,C., Stapelfeldt,K., Watson,A. et al., 1996, ApJ, 473, 437
Carpenter, J. M., Meyer, M. R., Dougados, C., Strom, S. E., & Hillenbrand, L. A. 1997, AJ, 114, 198
Chabrier,G. & Baraffe,I., 2000, ARA&A, 38, 337
Chabrier,G., Baraffe,I., Allard,F., Hauschildt,P., 2000, ApJ, 542, 464
Chabrier, G., Baraffe, I., Selsis, F., Barman, T. S., Hennebelle, P., & Alibert, Y. 2007, Protostars and
Planets V, 623
Chabrier, G., Gallardo, J., & Baraffe, I. 2007, A&A, 472L, 17
Chiang, E. I., & Goldreich, P. 1997, ApJ, 490, 368
Fukugita, M., Ichikawa, T., Gunn, J. E., Doi, M., Shimasaku, K., & Schneider, D. P. 1996, AJ, 111, 1748
Gallardo, J., Baraffe, I., & Chabrier, G. 2008, arXiv:0810.2931, in press
Genzel, R., Reid, M. J., Moran, J. M., & Downes, D. 1981, ApJ, 244, 884
Gizis, J. E., Reid, I. N., & Hawley, S. L. 2002, AJ, 123, 3356
Gomez Maqueo Chew, Y., Stassun, K. G., Prsa, A., & Mathieu, R. D. 2009, ApJ, submitted
Greene, T. P., & Meyer, M. R. 1995, ApJ, 450, 233
Greissl, J., Meyer, M. R., Wilking, B. A., Fanetti, T., Schneider, G., Greene, T. P., & Young, E. 2007, AJ,
133, 1321
Hartmann, L., Cassen, P., & Kenyon, S. J. 1997, ApJ, 475, 770
Hauschildt, P. H., Allard, F., & Baron, E. 1999, ApJ, 512, 377
Hillenbrand, L. A. 1997, AJ, 113, 1733
Hirota, T., et al. 2007, PASJ, 59, 897
Jensen, E. L. N., Dhital, S., Stassun, K. G., Patience, J., Herbst, W., Walter, F. M., Simon, M., & Basri,
G. 2007, AJ, 134, 241
Luhman, K. L. 1999, ApJ, 525, 466
Mathieu, R. D., Stassun, K. G., Basri, G., Jensen, E. L. N., Johns-Krull, C. M., Valenti, J. A., & Hartmann,
L. W. 1997, AJ, 113, 1841
Mohanty, S., Basri, G., Shu, F., Allard, F., & Chabrier, G. 2002, ApJ, 571, 469
Mohanty, S., & Basri, G. 2003, ApJ, 583, 451
Mohanty,S., Jayawardhana,R. & Basri,G., 2005, ApJ, 626, 498
Morales, J. C., Ribas, I., & Jordi, C. 2008, A&A, 478, 607
Muzerolle, J., Luhman, K. L., Briceno, C., Hartmann, L., & Calvet, N. 2005, ApJ, 620L, 107

– 13 –
Reiners, A., Seifahrt, A., Stassun, K. G., Melo, C., & Mathieu, R. D. 2007, ApJ, 671L, 149 (R07)
Reiners, A., & Basri, G. 2008, ApJ, in press
Samus, N. N., Durlevich, O. V., & et al. 2004, VizieR Online Data Catalog, 2250
Stassun, K. G., Mathieu, R. D., Mazeh, T., & Vrba, F. J. 1999, AJ, 117, 2941
Stassun, K. G., Mathieu, R. D., & Valenti, J. A. 2006, Nature, 440, 311
Stassun, K. G., Mathieu, R. D., & Valenti, J. A. 2007, ApJ, 664, 1154 (S07)
Stassun, K. G., Mathieu, R. D., Cargile, P. A., Aarnio, A. N., Stempels, E., & Geller, A. 2008, Nature, 453,
1079
Stelzer, B., Flaccomio, E., Montmerle, T., Micela, G., Sciortino, S., Favata, F., Preibisch, T., & Feigelson,
E. D. 2005, ApJS, 160, 557
Whitney, B. A., Wood, K., Bjorkman, J. E., & Wolff, M. J. 2003a, ApJ, 591, 1049
Whitney, B. A., Wood, K., Bjorkman, J. E., & Cohen, M. 2003b, ApJ, 598, 1079
Wilking, B. A., Meyer, M. R., Greene, T. P., Mikhail, A., & Carlson, G. 2004, AJ, 127, 1131
This preprint was prepared with the AAS LATEX macros v5.2.

– 14 –
[T1, T2] = [2715K, 2890K]
Fig. 1.— Observed spectral energy distribution (SED) of 2M0535−05 from 0.48 µm to 24 µm. Measured
fluxes (Table 1) are shown with 1σ vertical error bars and horizontal bars representing the filter passbands.
Downward arrows represent 3σ upper limits (the upper limit is the horizontal bar on the tail of the arrow).
Circles represent the predicted model fluxes for each of the observed bandpasses. The solid curve is a model
SED constructed from the dusty model atmospheres of Allard et al. (2001), with component temperatures
of 2715 K and 2890 K for the primary (more massive) and secondary brown dwarf, respectively (S07; R07).
The model SED has been scaled and reddened by best-fit values of 415 pc and AV = 0.4 mag. The dotted
curve represents the SED of pure blackbodies corresponding to the above temperatures.
– 15 –
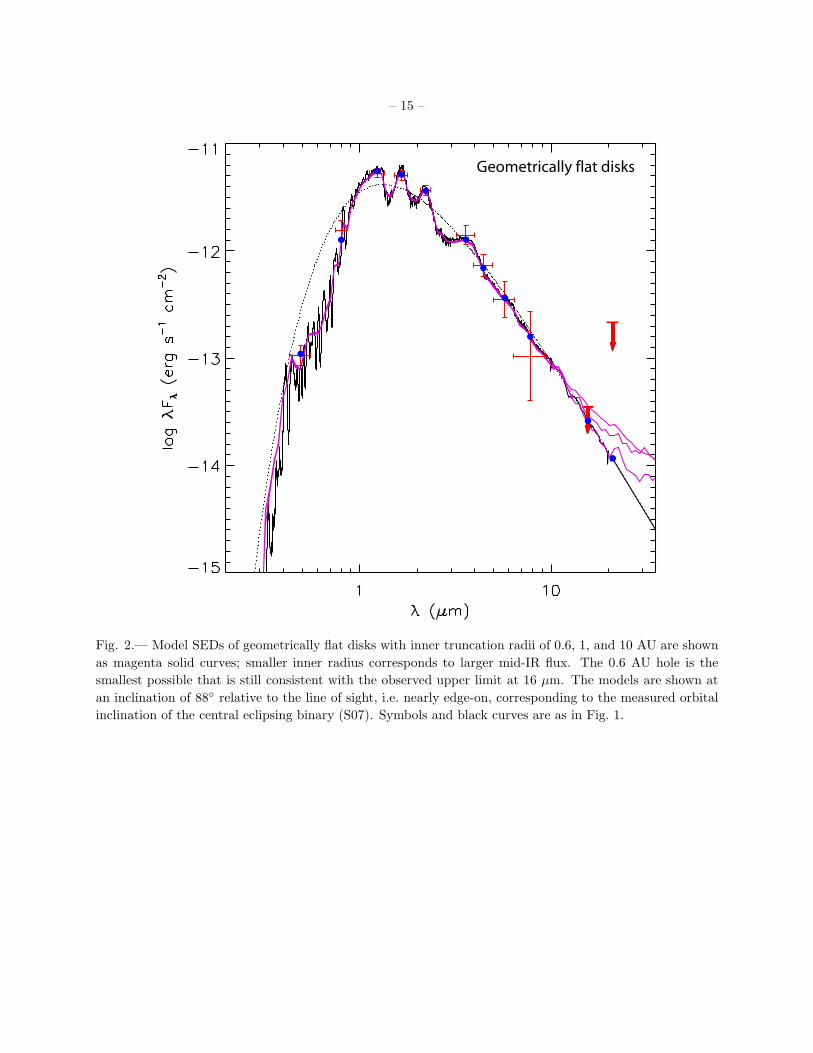
Geometrically flat disks
Fig. 2.— Model SEDs of geometrically flat disks with inner truncation radii of 0.6, 1, and 10 AU are shown
as magenta solid curves; smaller inner radius corresponds to larger mid-IR flux. The 0.6 AU hole is the
smallest possible that is still consistent with the observed upper limit at 16 µm. The models are shown at
an inclination of 88◦ relative to the line of sight, i.e. nearly edge-on, corresponding to the measured orbital
inclination of the central eclipsing binary (S07). Symbols and black curves are as in Fig. 1.

– 16 –
Flared disks
Rtrunc = 0.1 AU
1 AU
10 AU
i = 88o
i = 45o
Fig. 3.— Same as Fig. 2, but with magenta solid curves now representing model SEDs of flared disks. Blue
curves represent these same flared disks seen at a more face-on inclination of 45◦. The magenta curves have
not been scaled differently relative to Fig. 2; rather, the photospheric flux is heavily suppressed due to the
heavy obscuration by the edge-on flared disk. The sampling noise in the magenta curves is also due to the
heavy obscuration by the edge-on disk, resulting in relatively few Monte Carlo photons from the photospheres
passing unimpeded to the observer.

– 17 –
[T1, T2] = [2320K, 2460K]
Fig. 4.— Same as Fig. 1, but with model atmosphere temperatures of 2320 K and 2460 K for the primary
and secondary brown dwarfs, respectively. To best fit the data, the model has been scaled to a distance of
330 pc with no reddening.

– 18 –
Fig. 5.— The observed Teff and luminosities of the components of 2M0535−05 are compared to theoretical
predictions on a Hertzsprung–Russell diagram. Black curves are mass tracks at the (Jovian) masses indi-
cated, magenta curves are isochrones at the ages indicated in Myr (Baraffe et al. 1998; Chabrier et al. 2000).
Symbols represent the 2M0535−05 primary (filled) and secondary (bulls-eye). Black symbols represent the
predicted values for coeval brown dwarfs of the measured masses at 1 Myr. Red symbols represent the
observed values using the Teff determined by S07 and R07. Blue symbols represent the Teff predicted by the
models of Chabrier et al. (2007).
– 19 –
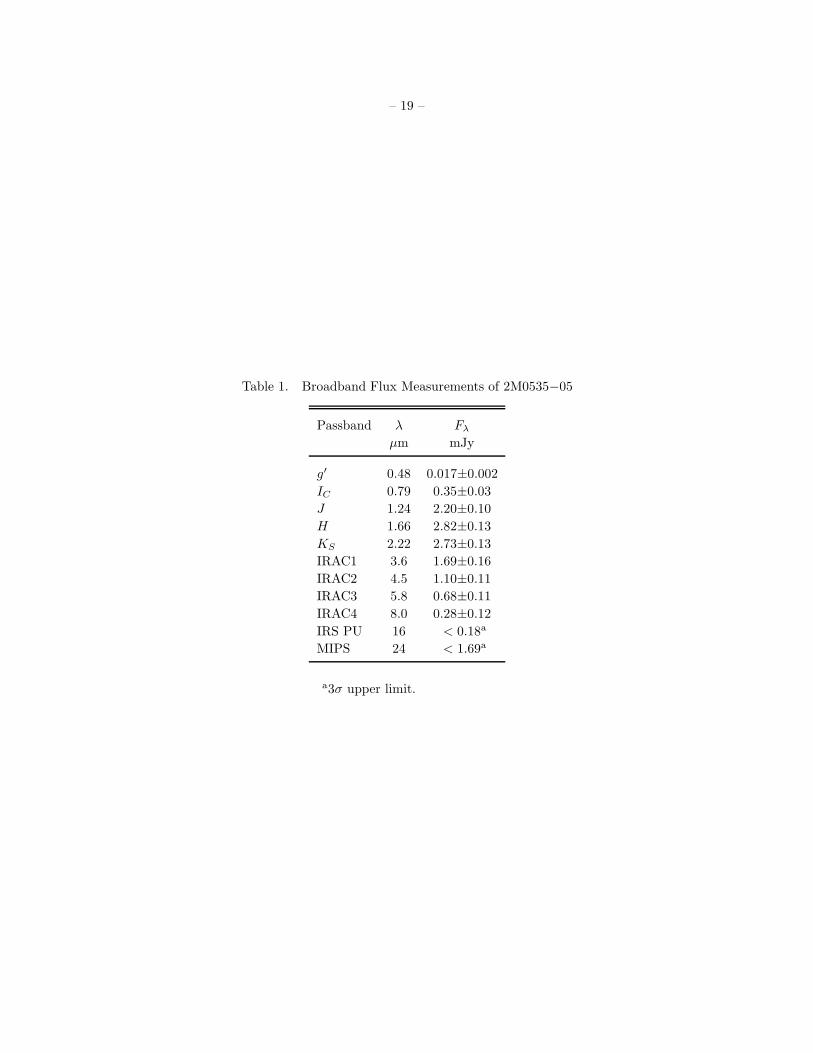
Table 1. Broadband Flux Measurements of 2M0535−05
Passband λ Fλ
µm mJy
g′ 0.48 0.017±0.002
IC 0.79 0.35±0.03
J 1.24 2.20±0.10
H 1.66 2.82±0.13
KS 2.22 2.73±0.13
IRAC1 3.6 1.69±0.16
IRAC2 4.5 1.10±0.11
IRAC3 5.8 0.68±0.11
IRAC4 8.0 0.28±0.12
IRS PU 16 < 0.18a
MIPS 24 < 1.69a
a3σ upper limit.