ssashagun.nic.inssashagun.nic.in/docs/minutes1718/Rajasthan/Rajasthan.pdf · Dr. Joga Ram,...
46
Transcript of ssashagun.nic.inssashagun.nic.in/docs/minutes1718/Rajasthan/Rajasthan.pdf · Dr. Joga Ram,...


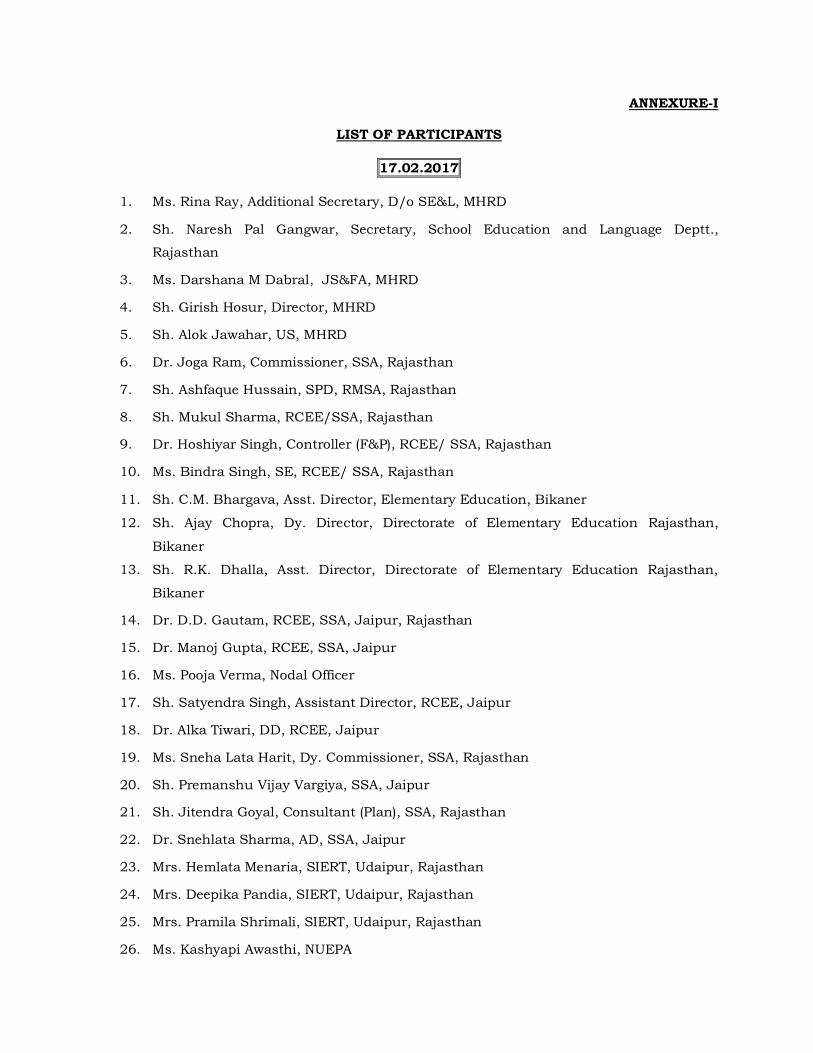
ANNEXURE-I
LIST OF PARTICIPANTS
17.02.2017
1. Ms. Rina Ray, Additional Secretary, D/o SE&L, MHRD
2. Sh. Naresh Pal Gangwar, Secretary, School Education and Language Deptt.,
Rajasthan
3. Ms. Darshana M Dabral, JS&FA, MHRD
4. Sh. Girish Hosur, Director, MHRD
5. Sh. Alok Jawahar, US, MHRD
6. Dr. Joga Ram, Commissioner, SSA, Rajasthan
7. Sh. Ashfaque Hussain, SPD, RMSA, Rajasthan
8. Sh. Mukul Sharma, RCEE/SSA, Rajasthan
9. Dr. Hoshiyar Singh, Controller (F&P), RCEE/ SSA, Rajasthan
10. Ms. Bindra Singh, SE, RCEE/ SSA, Rajasthan
11. Sh. C.M. Bhargava, Asst. Director, Elementary Education, Bikaner
12. Sh. Ajay Chopra, Dy. Director, Directorate of Elementary Education Rajasthan,
Bikaner
13. Sh. R.K. Dhalla, Asst. Director, Directorate of Elementary Education Rajasthan,
Bikaner
14. Dr. D.D. Gautam, RCEE, SSA, Jaipur, Rajasthan
15. Dr. Manoj Gupta, RCEE, SSA, Jaipur
16. Ms. Pooja Verma, Nodal Officer
17. Sh. Satyendra Singh, Assistant Director, RCEE, Jaipur
18. Dr. Alka Tiwari, DD, RCEE, Jaipur
19. Ms. Sneha Lata Harit, Dy. Commissioner, SSA, Rajasthan
20. Sh. Premanshu Vijay Vargiya, SSA, Jaipur
21. Sh. Jitendra Goyal, Consultant (Plan), SSA, Rajasthan
22. Dr. Snehlata Sharma, AD, SSA, Jaipur
23. Mrs. Hemlata Menaria, SIERT, Udaipur, Rajasthan
24. Mrs. Deepika Pandia, SIERT, Udaipur, Rajasthan
25. Mrs. Pramila Shrimali, SIERT, Udaipur, Rajasthan
26. Ms. Kashyapi Awasthi, NUEPA

27. Ms. Divya Singh, SSA, TSG
28. Ms. Ajit Kaur, SSA, TSG
29. Ms. Alka Mishra, Chief Consultant, TSG
30. Sh. R.S. Sharma, AD, SSA, Rajasthan
31. Dr. Sarla Verma, Asst. Professor, DEE, NCERT
32. Ms. Kiran Dogra, Sr. Consultant, TSG-SSA
33. Sh. P.K. Rangrajan, TSG-FMG-SSA
34. Dr. R.N. Lenka, Sr. Consultant, TSG-SSA
35. Sh. S.C. Arora, Consultant, TSG
36. Ms. Anupriya, consultant, TSG-SSA
37. Sh. Satya Prakash, Sr. Consultant, TSG-SSA
38. Ms. Talha Malik, TSG-SSA
39. Dr. Anshu, TSG-SSA
40. Sh. Adil Rasheed, TSG, SSA
41. Ms. Shahnaz Bano, TSG, SSA
42. Ms. Pankhuri Awasthi, TSG-SSA

1
23rd Joint Review Mission 21-28 July, 2016
Results Framework S.
No. Outcome Indicators Baseline 2015-16
Target 2015-16
Achievement Frequency and
Report Data
Collection Instruments
Responsibility for Data Collection
PDO: To improve education outcomes of elementary school children in India PDO Indicators
1. Increase in the student attendance rate
12 States/UTs reported student attendance ≥80% at primary
and 15 states/UTs reported student attendance ≥80% at
upper primary (Draft independent Study-2014 with data of 2012-13)
Independent Studies
Independent Sampling Studies
Independent Agencies/ GOI
2. Increase in the retention rate at primary level
Retention rate at primary level is 80% UDISE 2012-13
Increase retention rate to 83%
83.74% UDISE 2014-15
Annual UDISE Reports disaggregated by States
UDISE NUEPA
3. Increase in the transition rate from primary to upper primary
Transition rate from primary to upper primary is 86.7% UDISE 2012-13
Improvement in transition rates to 88.5%
89.74 UDISE 2014-15
Annual UDISE Reports disaggregated by States
UDISE NUEPA
4. Learning levels adequately and regularly monitored
NAS Grade 5 (2011-12) report available (cycle 3). NAS rounds of grades 3 and 8 in process of implementation (cycle 3)
NAS grade 3 report available (cycle 4) NAS grade 8 data collected (cycle 4)
NAS grade 5 (cycle 4) Report available
NAS Report of grades 3, 5 and 8 every three years
NAS NCERT
Intermediate outcome indicators Component 1: Improving quality for enhancing learning
1. Specific early grades quality programmes implemented to strengthen foundation in language and numeracy
No early grade learning program implemented in states that is ready for evaluation Baseline not available
Specific early grades quality programmes for language and numeracy being run in 15 States. National workshop to documents and disseminate good practice in early grade learning
18 states rolled out early grades learning programme. All states have received funding for early grades learning programmes in 2015-16
Annual PMIS Reports disaggregated by State
Programme MIS
States

2
S. No.
Outcome Indicators Baseline 2015-16 Target
2015-16 Achievement
Frequency and Report
Data Collection
Instruments
Responsibility for Data Collection
2.
System of state level achievement surveys(SLAS) established
Standard Operating Procedures developed by MHRD for conducting SLAS
15 States/UTs conducted SLAS
3 States (West Bengal, Tamil Nadu & Kerala) completed SAS for 2015-16 and Shared report
State SLAS reports
Program MIS
West Bengal, Tamil Nadu and Kerala
3. More government school teachers trained through improved in-service training
50% teachers receive in-service training during previous academic year PMIS 2012-13. (yearly percentages expected to be lower due to significant increase in number of teachers recruited and increase in training days
40% teachers received in service training
Government school teachers trained through improved in-service training at BRC level achievement is 70% and CRC level achievement is 75% (as on 31st March 2016)
Annual PMIS Reports
Programme MIS
States
4. Increased teacher attendance
Teacher attendance level is 81.7% at primary level and 80.5% at upper primary level Independent study, 2010 (data of 2006-07)
Independent studies
Independent Sample Studies
States Independent agencies/GOI
5. Increased training of head masters
Head master training has been sporadically and irregularly conducted in a few states
30% of head masters trained since 2012-13 (cumulative)
41% target achieved in 2015-16
Programme MIS PMIS
States
6. Increased training of educational administrators
Training for educational administrators from state to block level conducted sporadically
20% of educational administrators from State to Block level received training since 2012-13 (cumulative)
24% target achieved in 2015-16
Quarterly PMIS States
Component 2: Strengthening Monitoring and Evaluation 1. CRC and BRC
academic support and supervision
50% vacancies in BRCs on average PAB 2013-14
65% positions filled in BRCs and CRCs.
72% positions filled in BRCs and CRCs
Annual PMIS Reports
Programme MIS
States

3
S. No.
Outcome Indicators Baseline 2015-16 Target
2015-16 Achievement
Frequency and Report
Data Collection
Instruments
Responsibility for Data Collection
2. Improved community management of schools
>80% of SMCs constituted in most states. Training of SMCs conducted in some states.
80% of constituted SMCs reporting role in school supervision Evaluation of SMC functioning.
Yes, 80% of constituted SMCs reported role in school supervision.
PMIS Quarterly progress reports Independent Studies
PMIS Independent Sample Studies
States and Districts Independent agencies / GoI
3. Development and use of school performance standards
Capacity building done for development of school performance standards
25% State / UTs state adopt national school performance standards.
States are in process of implementing School performance standards with support from NUEPA. Funds has been provided to States for this purpose.
Annual Report by NUEPA
NUEPA NUEPA
4. Improved utilization of funds by states
3 states/UTs incur expenditure of 80% of received funds. MHRD financial statement for 2013-14
10 of States/UTs incur expenditure of 80% of received funds.
29 States / UTs incurred more than expenditure of 80% of the received fund. This includes: 1. Andhra Pradesh, 2. Arunchal Pradesh, 3. Assam, 4. Bihar, 5. Chandigarh, 6. Chhattisgarh, 7. D&N Haveli, 8. Daman & Diu, 9. Goa, 10. Gujarat, 11. Haryana, 12. Himachal Pradesh, 13. J&K, 14. Jharkhand, 15. Karnataka 16. Madhya Pradesh, 17. Maharashtra, 18. Mizoram, 19. Nagaland, 20. Odisha, 21. Punjab, 22. Rajasthan, 23. Sikkim, 24. Tamil Nadu, 25. Telangana, 26. Tripura, 27. Uttar Pradesh, 28. Uttarakhand, 29. West Bengal
IUFRs and FMRs
State-wise expenditure status of GOI and audit reports
States & GOI
Component 3: Improving equitable access and retention 1. Increase in the
number of children enrolled at upper primary level in
134 million at primary and 64.9 million at upper primary level (total)
Enrolment of children at upper primacy level increased to 66.5 million
130 million at primary and 67.16 million at upper primary level (total)
Annual DISE Reports disaggregated by State
DISE NUEPA

4
S. No.
Outcome Indicators Baseline 2015-16 Target
2015-16 Achievement
Frequency and Report
Data Collection
Instruments
Responsibility for Data Collection
schools UDISE 2012-13
UDISE 2014-15
2. Increase in separate toilets for girls in government schools
72.16% schools with separate toilets for girls UDISE 2011-12
Share of schools with separate toilet facility for girls increased to 73.5%
87.08% UDISE 2014-15 Under Swachh Vidylaya Programme the remaining govt. schools has been provided separate toilets for boys and girls.
Annual UDISE Reports
UDISE NUEPA
3.
Increased enrolment share of girls, ST, ST, Muslim children vis-a-vis relevant age group share in population at elementary stage; and increased enrolment % out of identified CWSN at elementary level
Enrolment share girls: 48.63% Girls’ share in population: 48% Enrolment share of SC:20.24% SC share in Population:16.6% Enrolment share of ST:10.85% ST share in population:8.6% Enrolment share of Muslims:13.5% Muslim share in population:13.4% UDISE 2012-13 (Census 2011 for girls, SC & ST: Census 2001 for Muslims) Enrolment of CWSN is 2.1m out of 2.7m identified (77% enrolled out of identified CWSN) UDISE 2012-13
Enrolment share of girls, SC, ST and Muslim children at upper primary level reflect their relevant age group share in population 80% of identified CWSN enrolled in school and education programs
Enrolment share of girls, SC, ST and Muslim children at upper primary level reflect their relevant age group share in population 95.89% of identified CWSN enrolled in school and education programs
Annual UDISE Reports disaggregated by State and districts Annual UDISE Reports disaggregated by State + Quarterly progress report based survey of IE unit
UDISE UDISE + Home based Survey for IE
NUEPA NUEPA + MHRD

Annexure-III
List of Special Focus Districts – Rajasthan-2017-18
Sl. No Districts
SOCIAL CATEGORY GROUP LWE worst
affected Districts Total
SFD Districts
Scheduled Tribes
(25% and above)
Scheduled Castes
(25% and above)
PMO's 121
Minority Districts
Muslim Concentration (20% and
above)
LWE Districts
1 Banswara 1 1 2 Dungarpur 1 1 3 Ganganagar 1 1 1 4 Hanumangarh 1 1 5 Jaiselmer 1 1
6 Sawai Madhopur 1 1
7 Udaipur 1 1
Sub Total 4 2 1 1 0 0 7

S. No. Name of
District
Name of the
Habitation where
UPS is proposed
Information about Primary School
proposed for Upgradation to UPS
School Name DISE Code
1 Barmer Durgapura PS Rohi ka Sara 8171402701
2 Dungarpur PAL GAMDI PS TRALA FALA 8270221804
3 Jodhpur Shergarh PS Devigarh 8150305402
4 Udaipur
Kham PS Kham 8260606701
Bakhel PS Bakhel 8260608401
Peepala PS Peepala 826618201
Bhaladiya PS MAHADEV KI NAL 8260905802
![RESULTS OF THE FOT]RTH EXPBRIMENTAL CYCLB...U.S.A. Yugoslavia 200 110 95 96 97 9B 99 100 101 103 1ù4 111 t12 113 tt4 108 105 106 107 oPv SH TH SH SH SFI SH SH S.H SH TH SH OPV SH](https://static.fdocuments.in/doc/165x107/6122076456ad9a146323e193/results-of-the-fotrth-expbrimental-cyclb-usa-yugoslavia-200-110-95-96-97.jpg)