. Is it statistical? Dot plots and mean Median, Mode, and Best Measure of Central Tendency Range,...
52
S
-
Upload
abner-baldwin -
Category
Documents
-
view
225 -
download
0
Transcript of . Is it statistical? Dot plots and mean Median, Mode, and Best Measure of Central Tendency Range,...

S

Is it statistical?
Dot plots and mean
Median, Mode, and
Best Measure of
Central Tendency
Range, Quartiles, and IQR
Outlier and Mean
Absolute Deviation
(MAD)
$100 $100 $100 $100 $100
$200 $200 $200 $200 $200
$300 $300 $300 $300 $300
$400 $400 $400 $400 $400
$500 $500 $500 $500 $500

Is it Statistical? $100 Question
Decide whether it is a statistical question or not, and explain:
Is it Statistical? $100 Answer
Yes, the answers can vary. Each student will have a different answer.
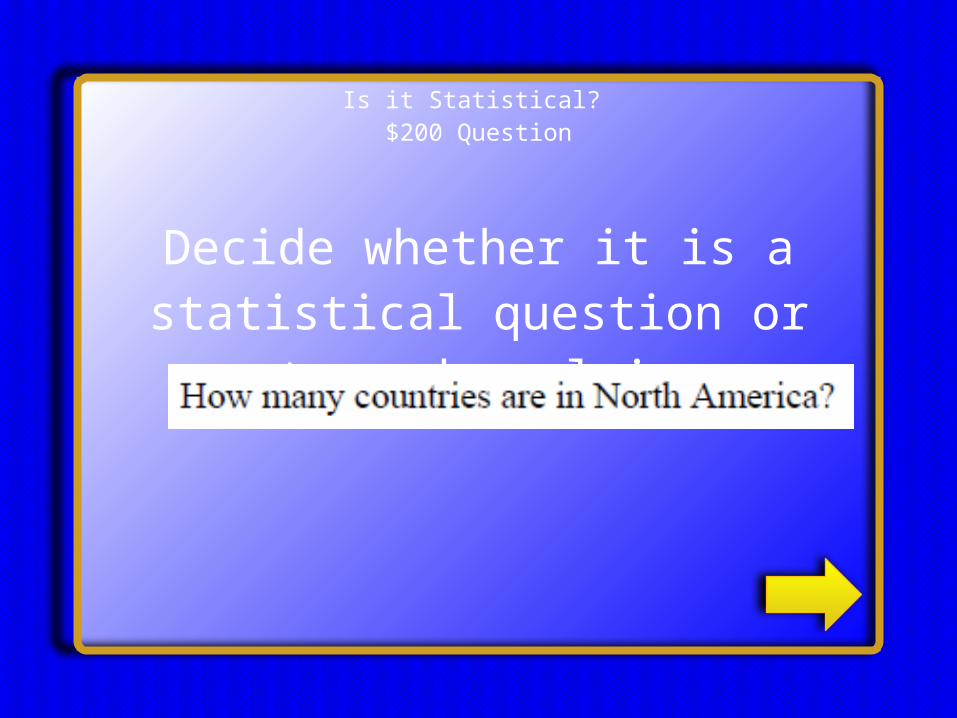
Is it Statistical? $200 Question
Decide whether it is a statistical question or not, and explain:
Is it Statistical? $200 Answer
No, this answer does not change no matter who you ask. There is
only one correct answer.
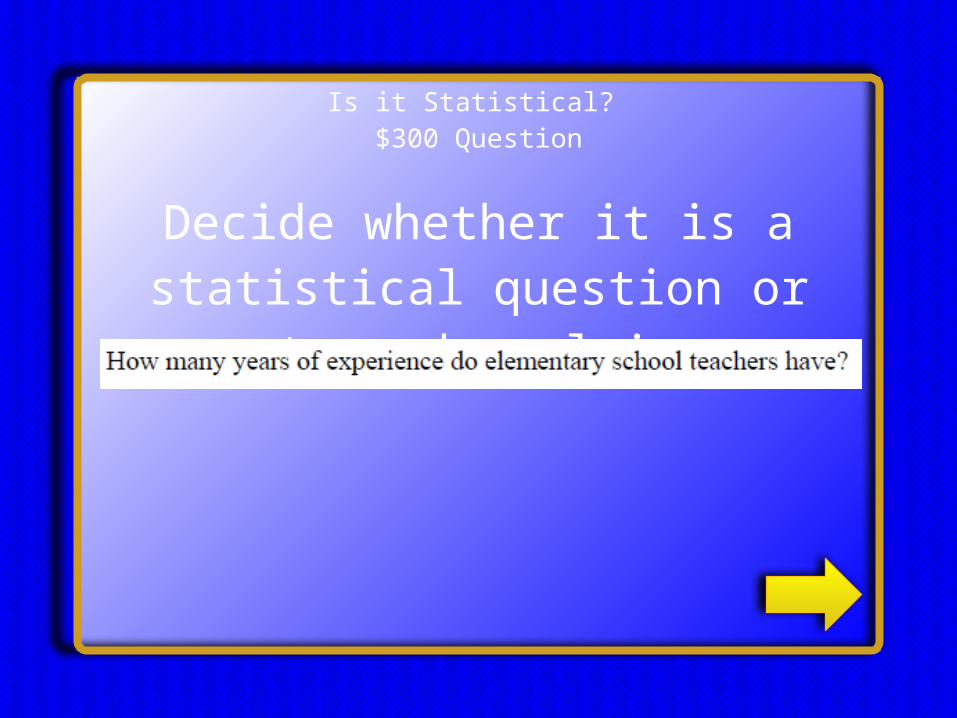
Is it Statistical? $300 Question
Decide whether it is a statistical question or not, and explain:

Is it Statistical? $300 Answer
Yes, the answers can vary. Each teacher will have a different answer.
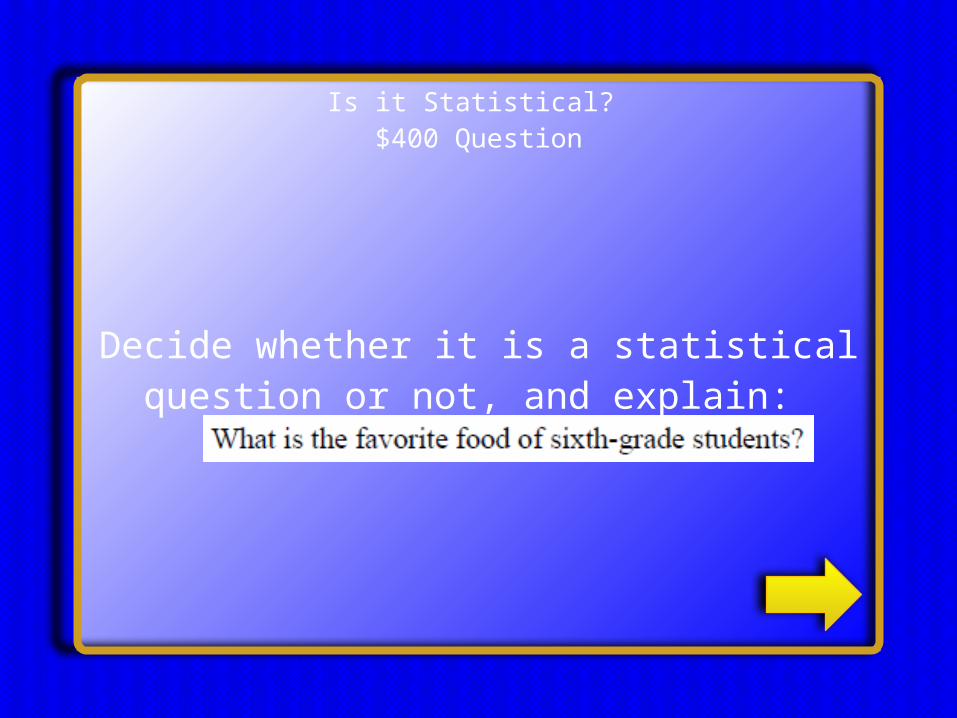
Is it Statistical? $400 Question
Decide whether it is a statistical question or not, and explain:
Is it Statistical? $400 Answer
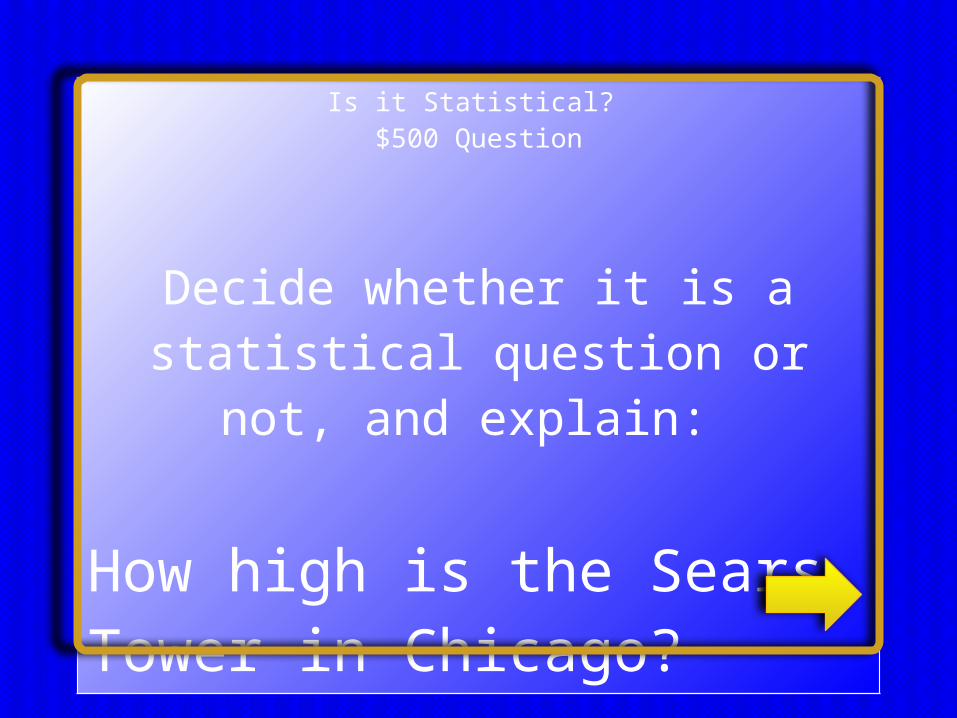
Is it Statistical? $500 Question
Decide whether it is a statistical question or not, and explain:
How high is the Sears Tower in Chicago?
Is it Statistical? $500 Answer
No, this answer does not change no matter who you ask. There is
only one correct answer.

Dot Plots and Mean$100 Question
Create a dot plot for the data, find any peaks, clusters, and
gaps
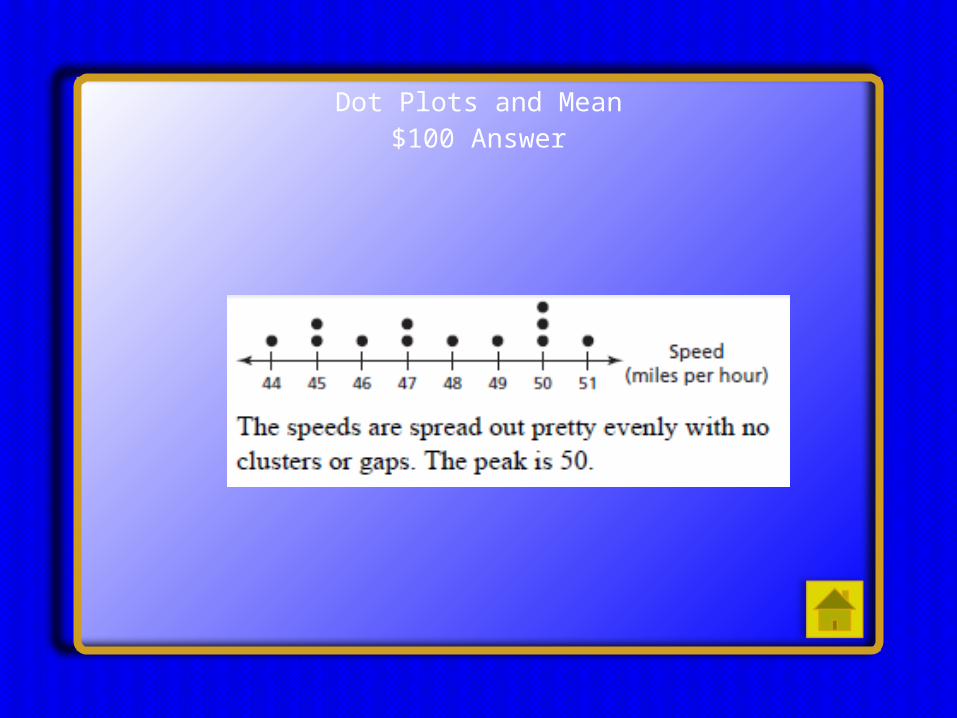
Dot Plots and Mean$100 Answer
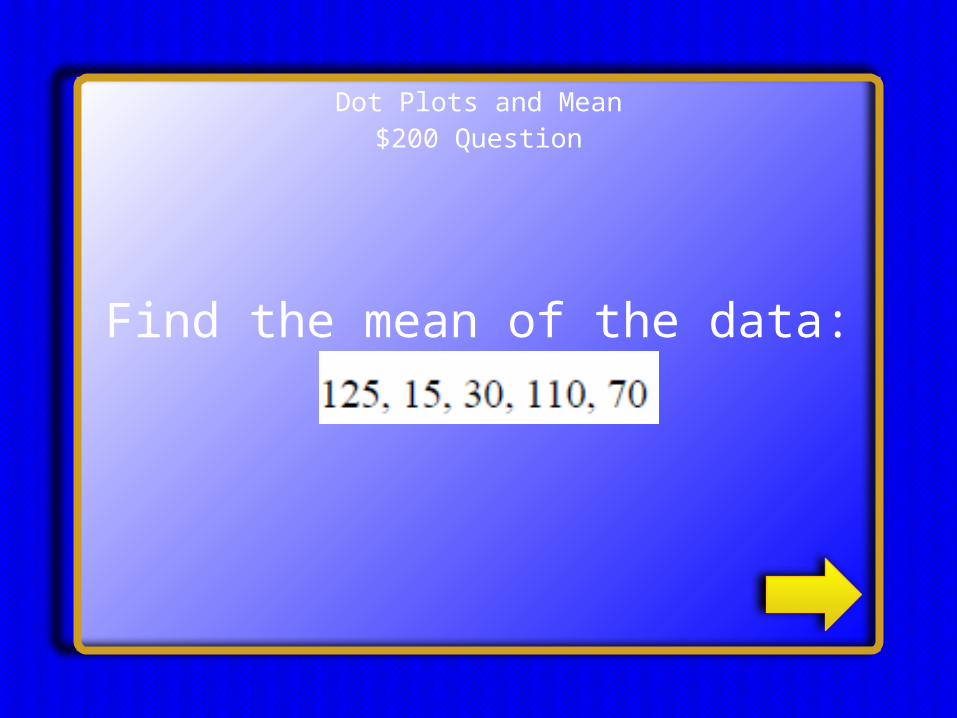
Dot Plots and Mean$200 Question
Find the mean of the data:

Dot Plots and Mean$200 Answer

Dot Plots and Mean$300 Question
Create a dot plot for the data, find any peaks, clusters, and
gaps
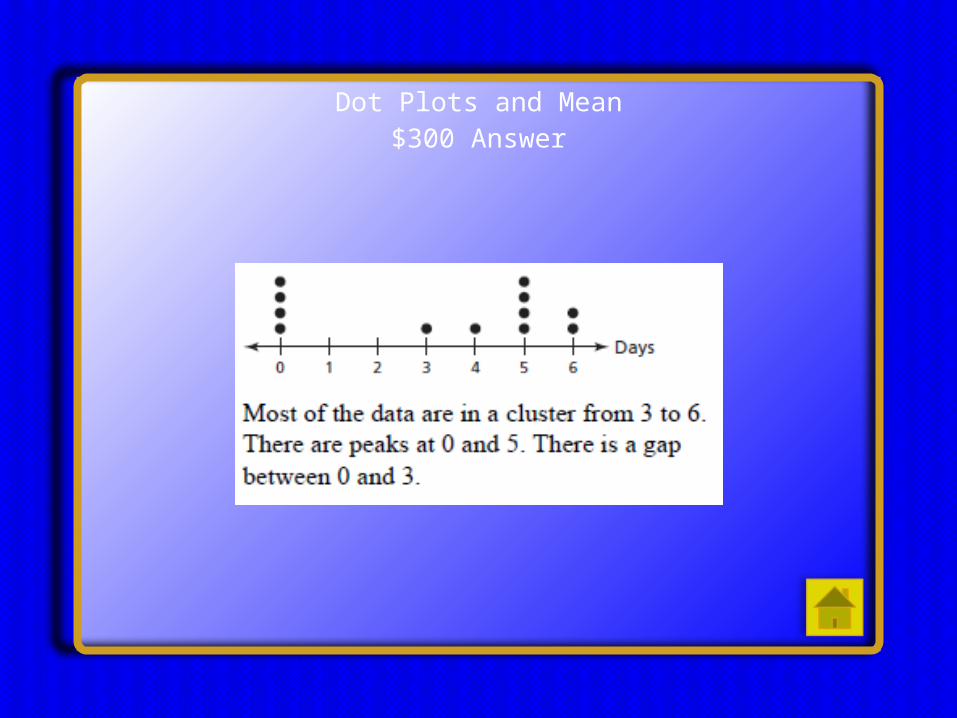
Dot Plots and Mean$300 Answer

Dot Plots and Mean$400 Question
Find the mean of the data.

Dot Plots and Mean$400 Answer

Dot Plots and Mean$500 Question
Find the mean of the data:

Dot Plots and Mean$500 Answer
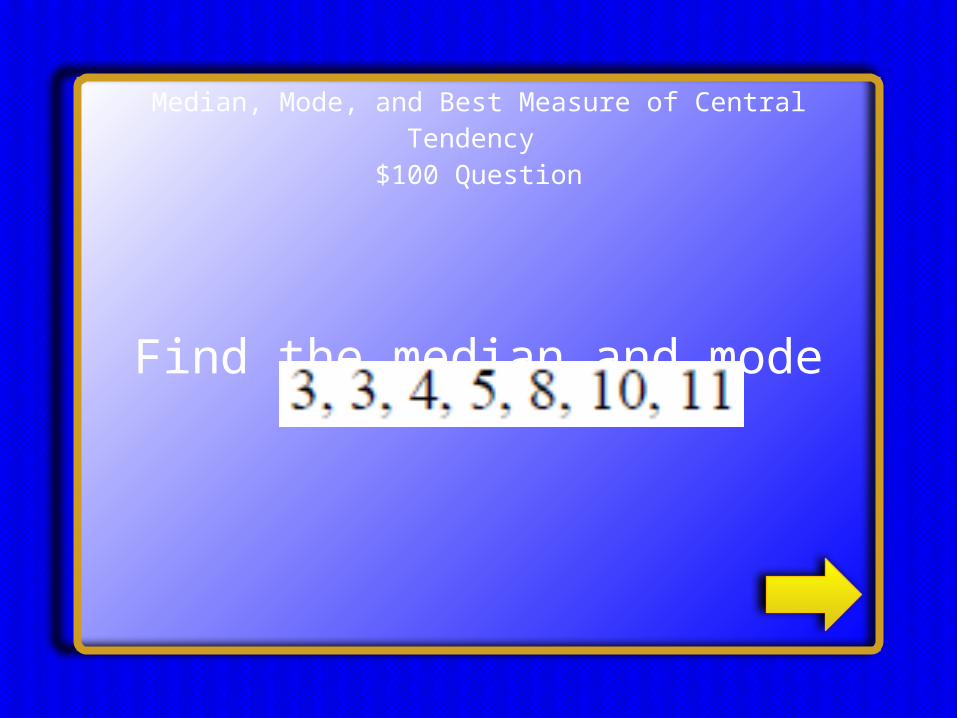
Median, Mode, and Best Measure of Central Tendency $100 Question
Find the median and mode
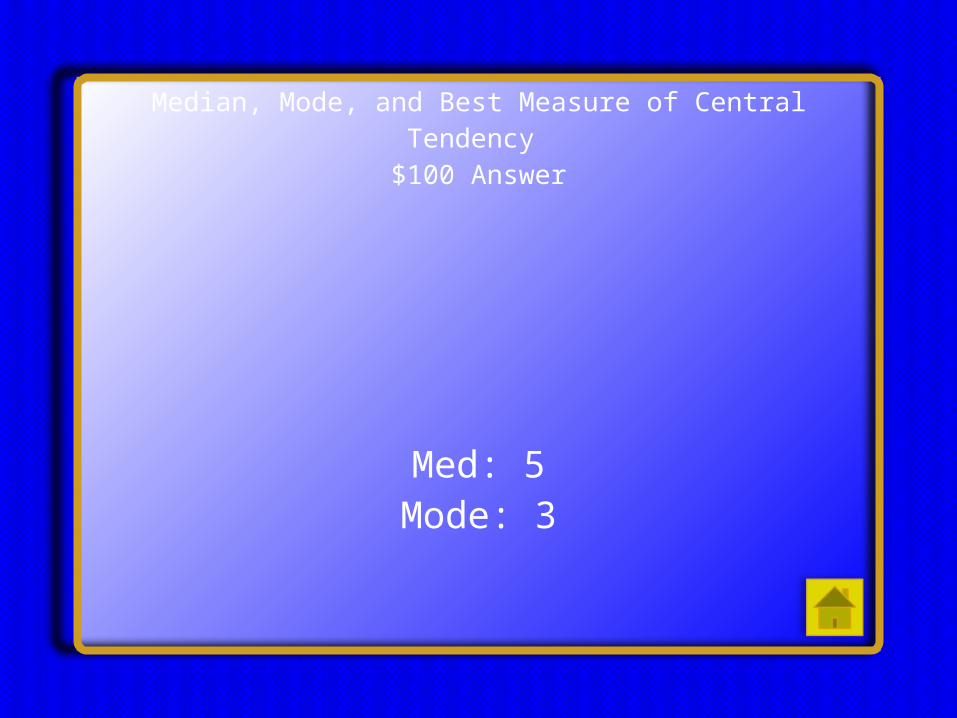
Median, Mode, and Best Measure of Central Tendency $100 Answer
Med: 5Mode: 3
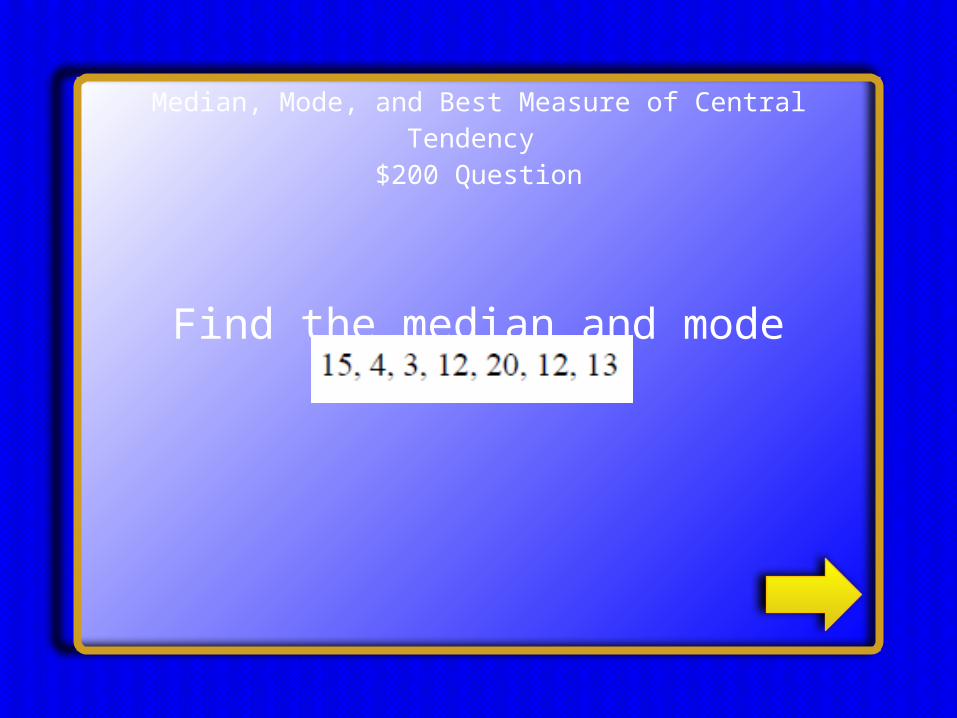
Median, Mode, and Best Measure of Central Tendency $200 Question
Find the median and mode
Median, Mode, and Best Measure of Central Tendency $200 Answer
Med: 12Mode: 12

Median, Mode, and Best Measure of Central Tendency $300 Question
Given:
MEAN: 76, MEDIAN: 79, MODE: no modeWhat is the best measure of center to
represent the data?
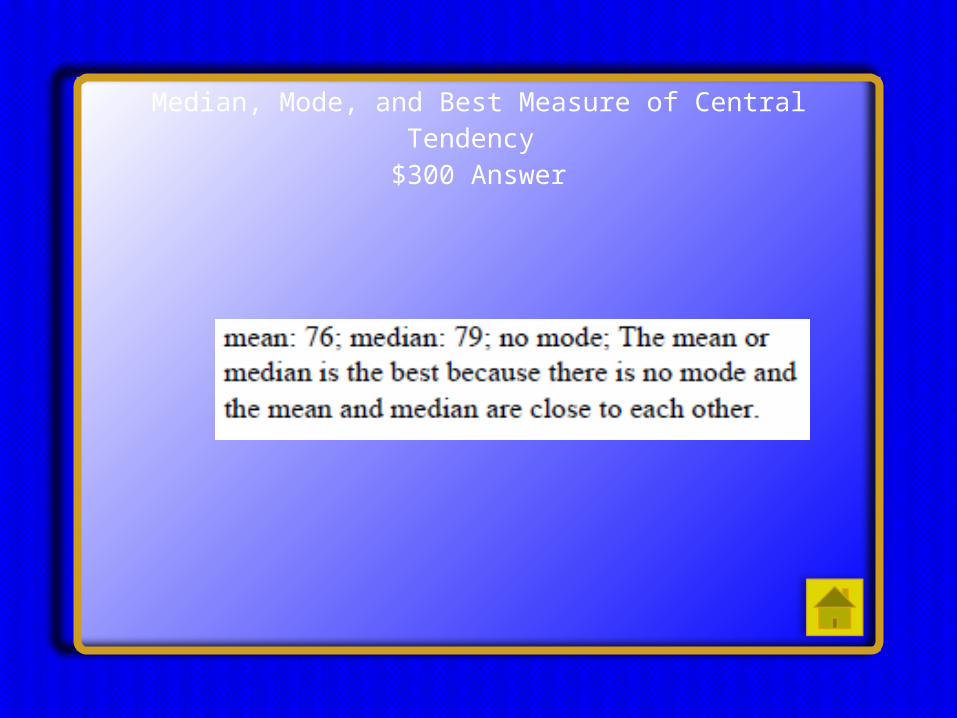
Median, Mode, and Best Measure of Central Tendency $300 Answer
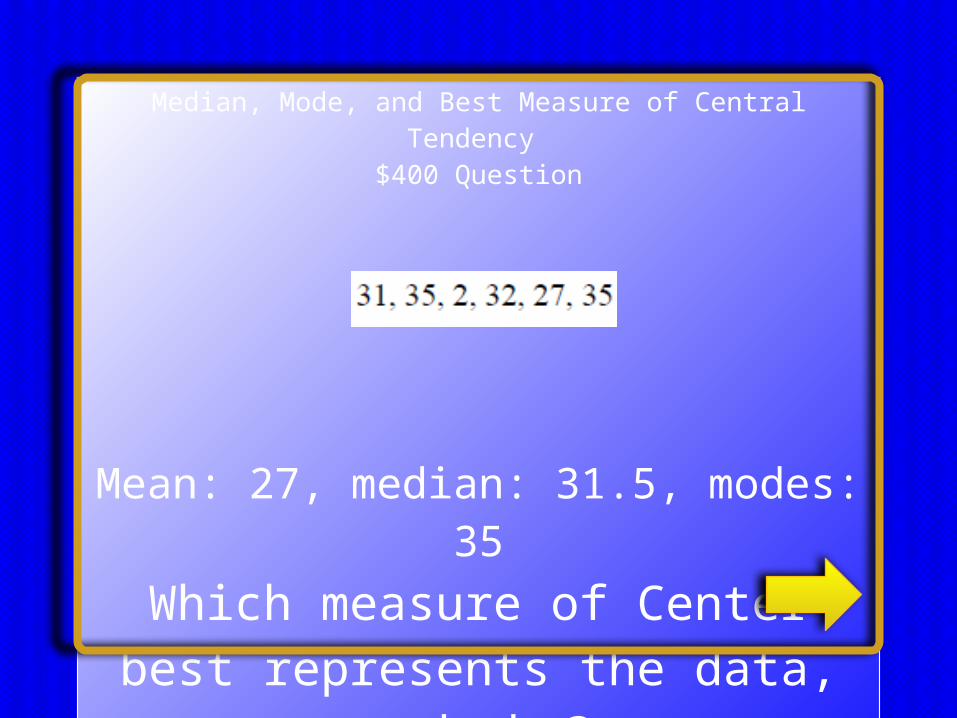
Median, Mode, and Best Measure of Central Tendency $400 Question
Given:
Mean: 27, median: 31.5, modes: 35Which measure of Center best represents the data, and why?

Median, Mode, and Best Measure of Central Tendency $400 Answer

Median, Mode, and Best Measure of Central Tendency $500 Question
Find the mean, median and mode of the data, then decide which represents the data the best,
and why:
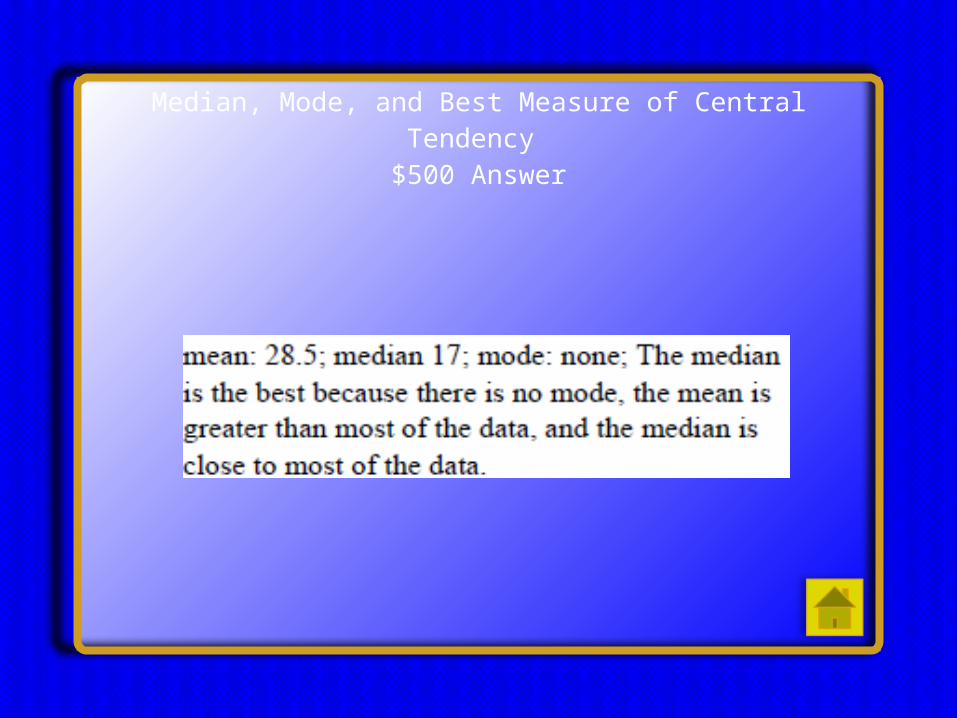
Median, Mode, and Best Measure of Central Tendency $500 Answer

Range, Quartiles, and IQR$100 Question
Find the range of the data:

Range, Quartiles, and IQR$100 Answer
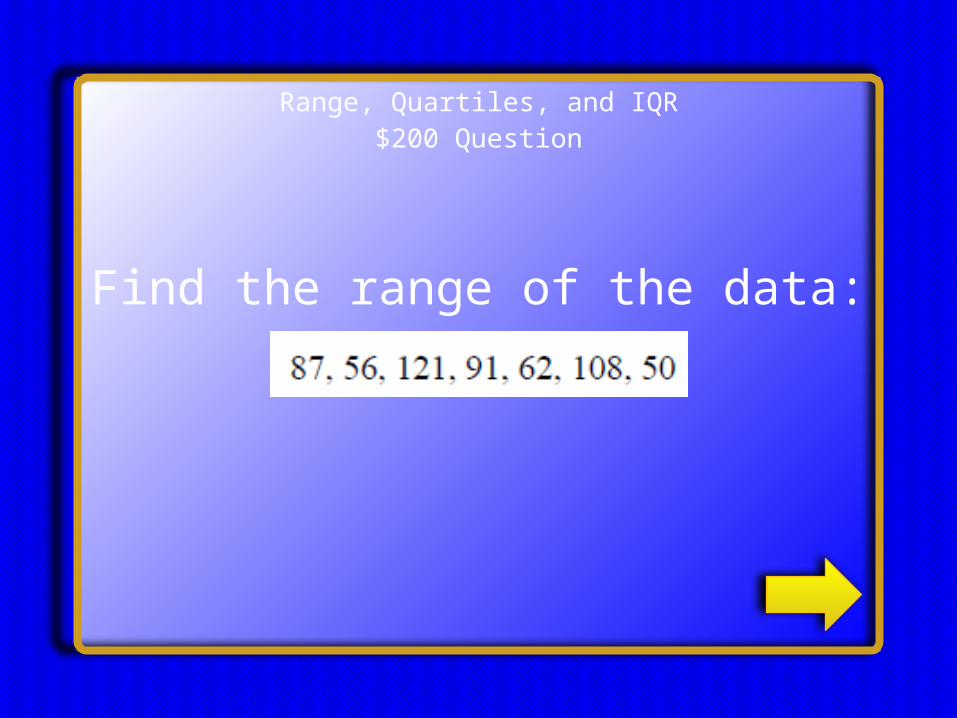
Range, Quartiles, and IQR$200 Question
Find the range of the data:

Range, Quartiles, and IQR$200 Answer
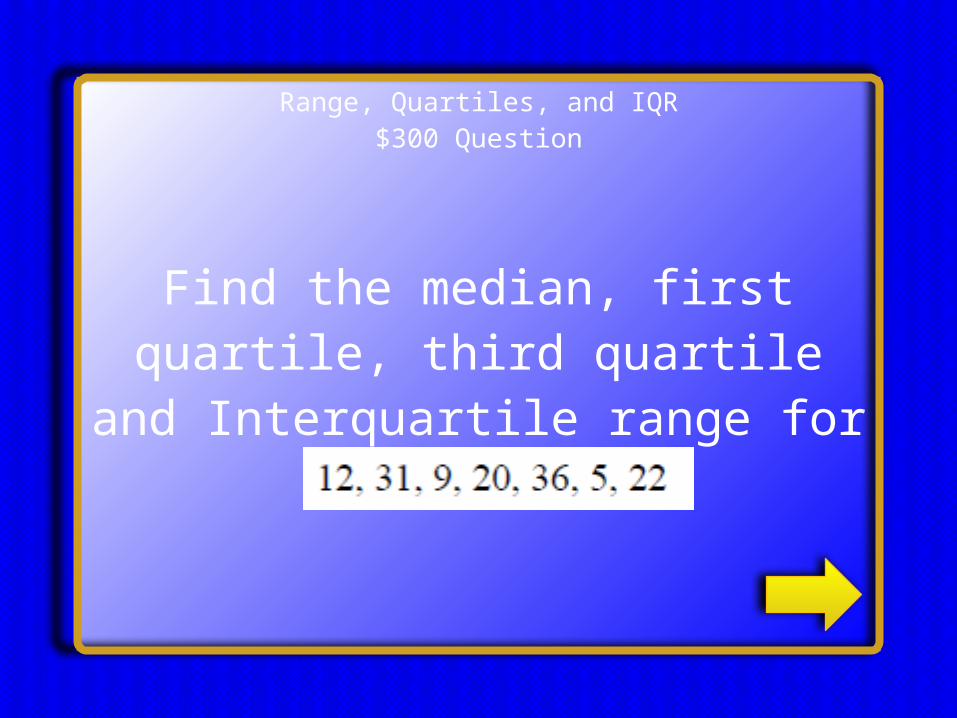
Range, Quartiles, and IQR$300 Question
Find the median, first quartile, third quartile and Interquartile
range for the data:
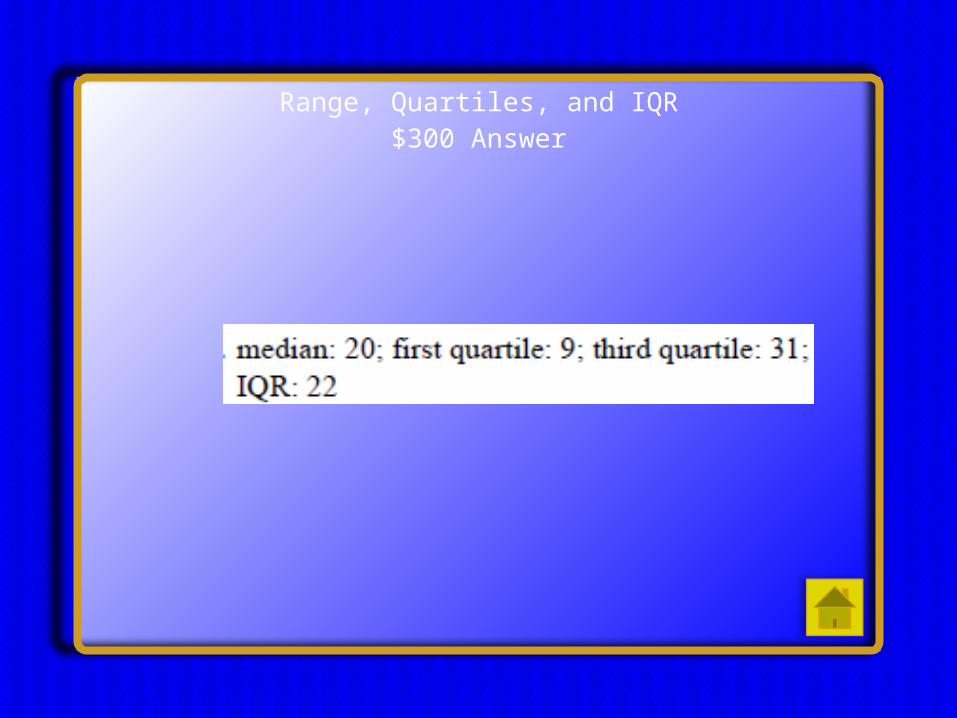
Range, Quartiles, and IQR$300 Answer
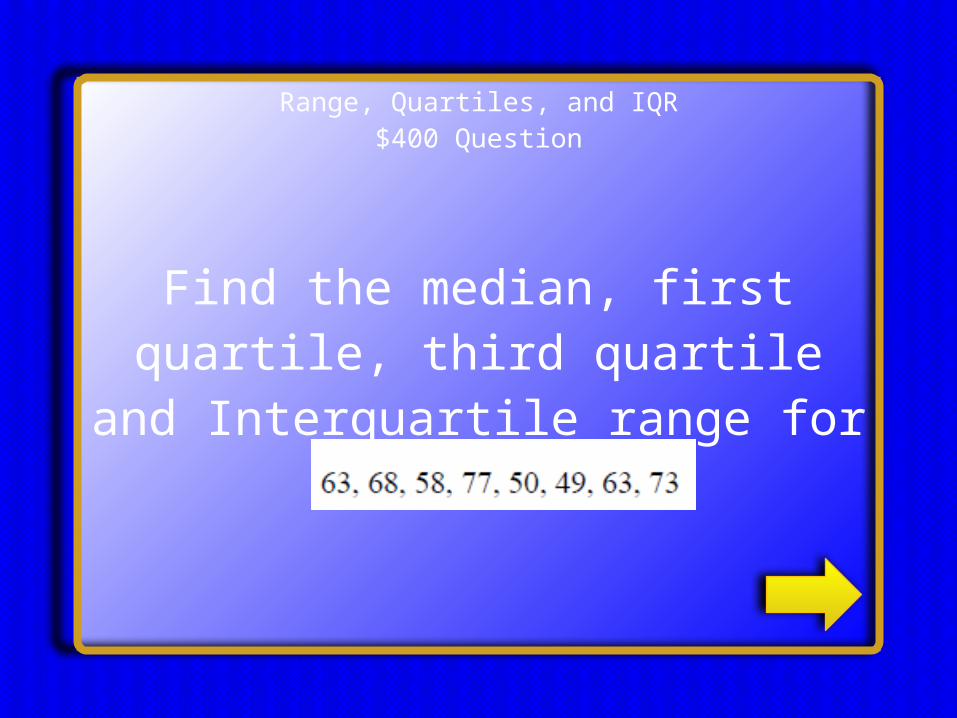
Range, Quartiles, and IQR$400 Question
Find the median, first quartile, third quartile and Interquartile
range for the data:
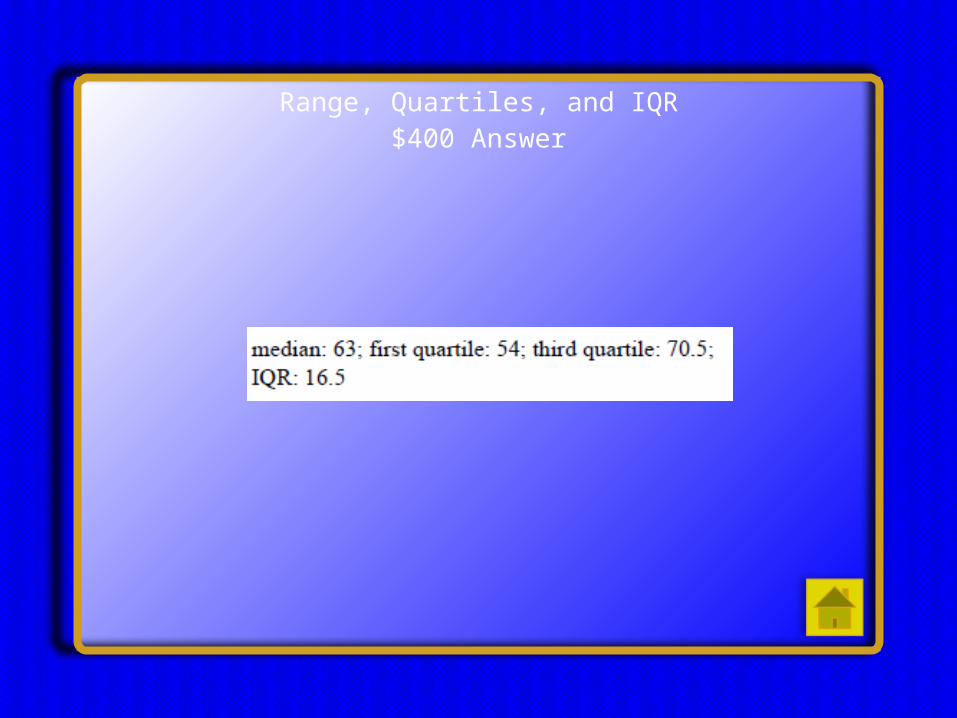
Range, Quartiles, and IQR$400 Answer
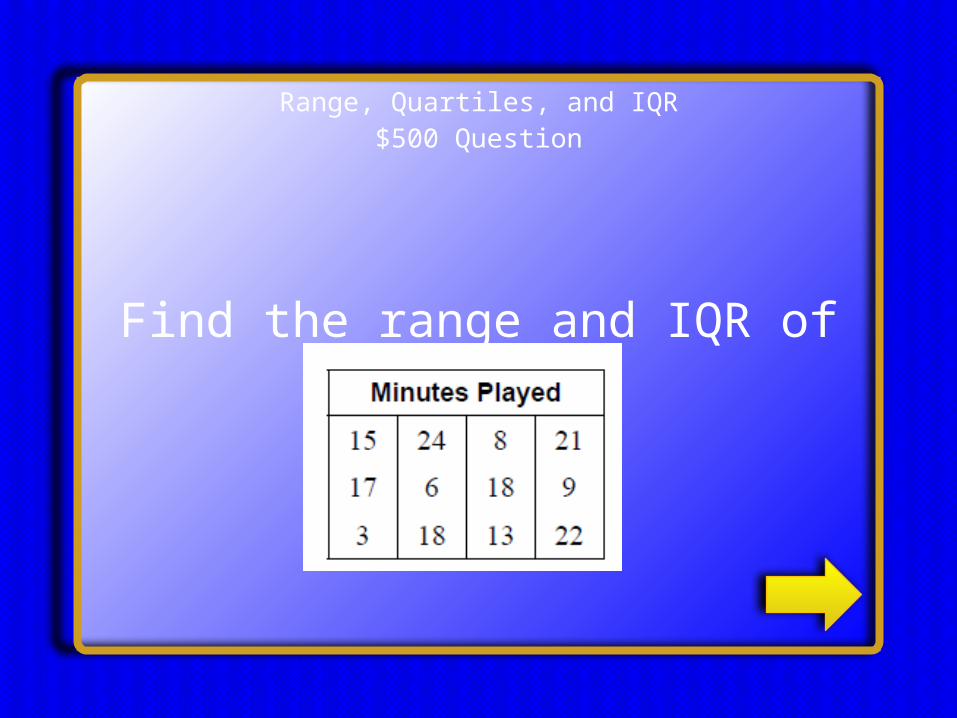
Range, Quartiles, and IQR$500 Question
Find the range and IQR of the Data:

Range, Quartiles, and IQR$500 Answer
2111

Outlier and Mean Absolute Deviation (MAD) $100 Question
This is a chart showing the number of minutes played in a soccer game. The range of minutes was 21, and the IQR
was 11. A goalie who played the entire 60 minutes was added to the data set. Is
this person on outlier? Hint: (
Outlier and Mean Absolute Deviation (MAD)$100 Answer
YES, 60 is an outlier
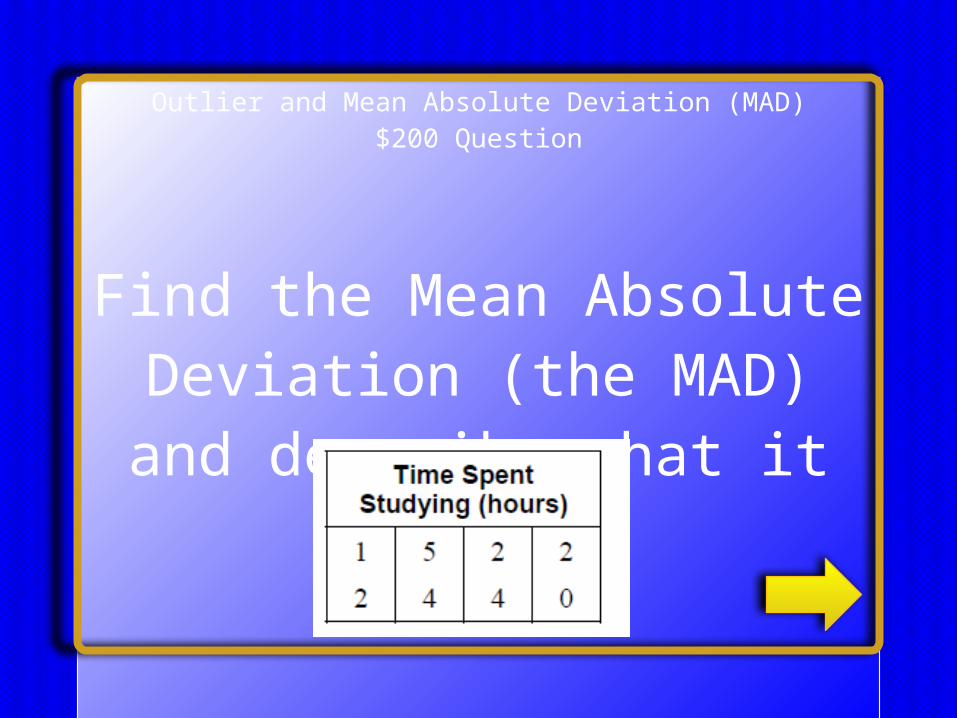
Outlier and Mean Absolute Deviation (MAD)$200 Question
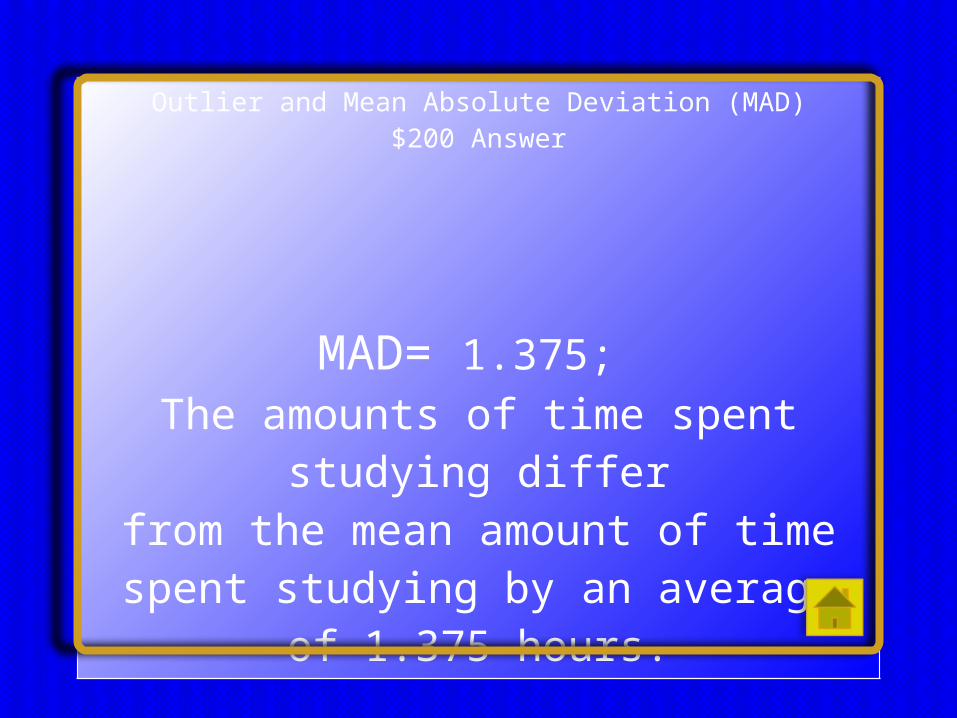
Find the Mean Absolute Deviation (the MAD) and describe what it means:
Outlier and Mean Absolute Deviation (MAD)$200 Answer
MAD= 1.375; The amounts of time spent studying
differfrom the mean amount of time
spent studying by an average of 1.375 hours.
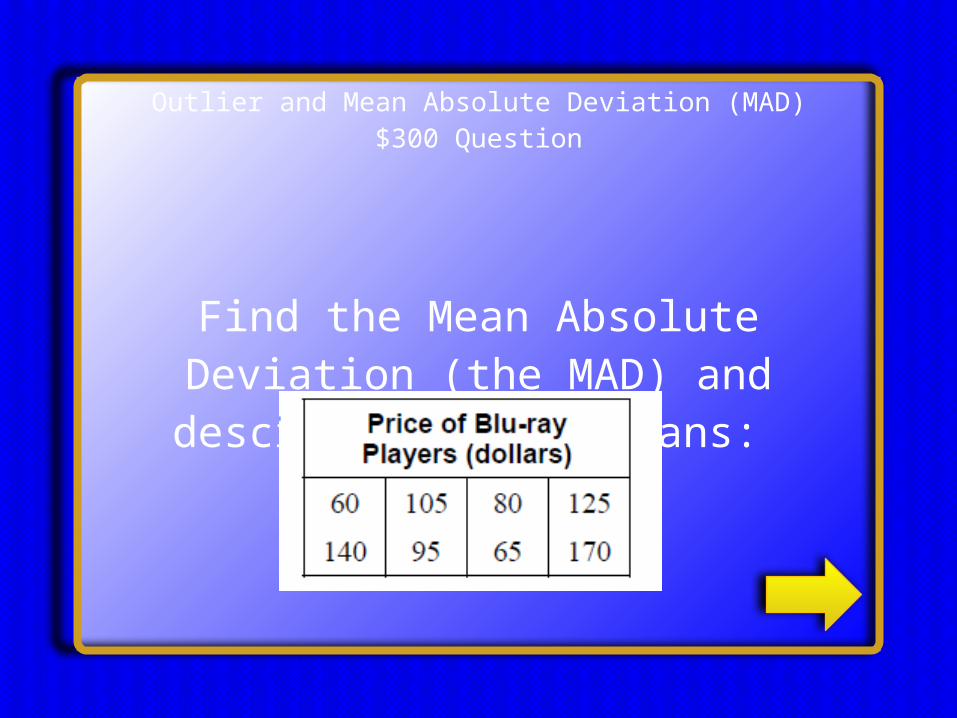
Outlier and Mean Absolute Deviation (MAD)$300 Question
Find the Mean Absolute Deviation (the MAD) and describe what it
means:

Outlier and Mean Absolute Deviation (MAD)$300 Answer
MAD= 30; The prices of a Blu-ray player differ from the mean price of a Blu-ray player by an
average of $30.

Outlier and Mean Absolute Deviation (MAD)$400 Question
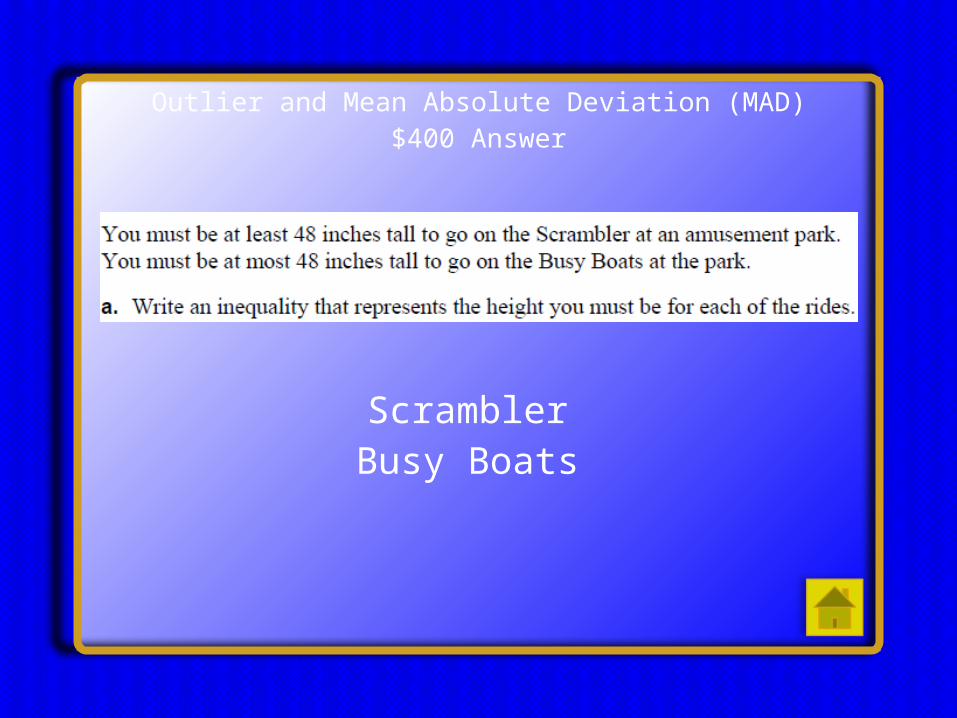
Outlier and Mean Absolute Deviation (MAD)$400 Answer
Scrambler Busy Boats
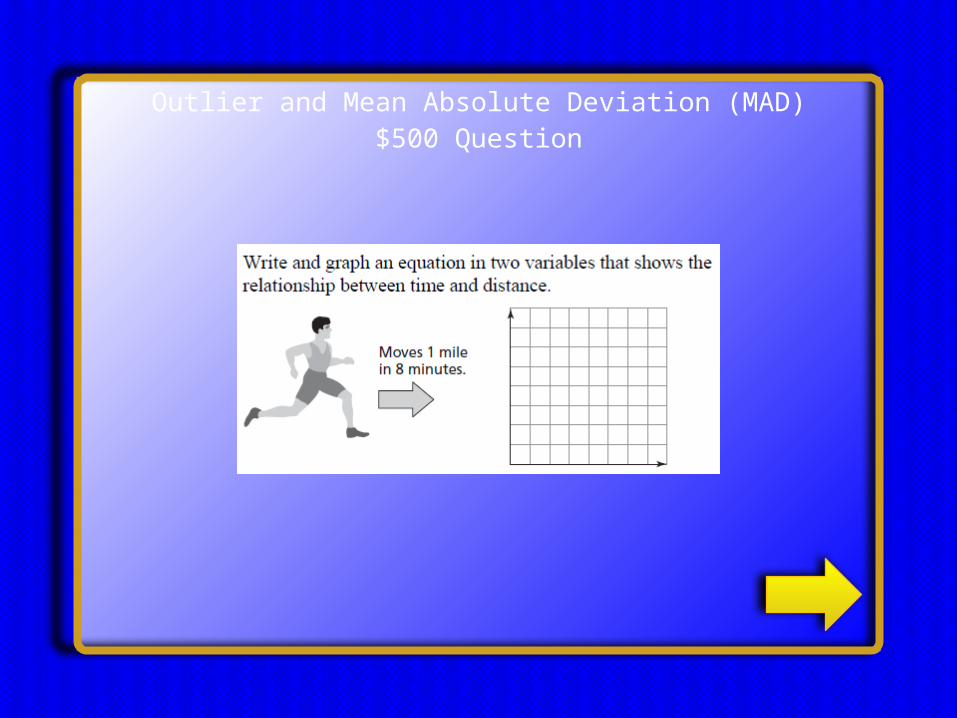
Outlier and Mean Absolute Deviation (MAD)$500 Question
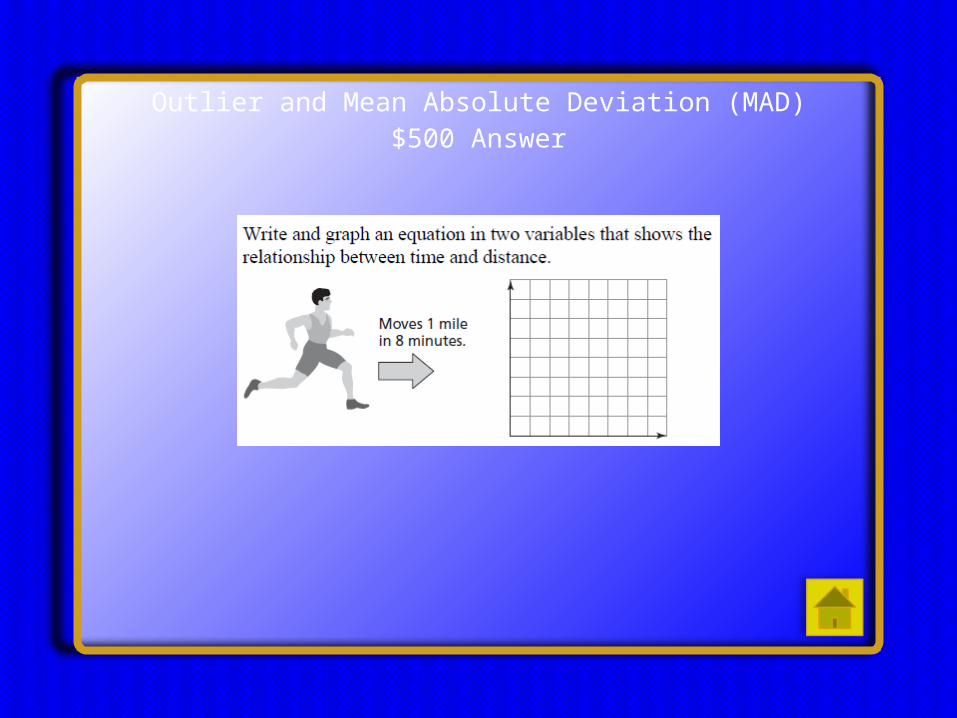
Outlier and Mean Absolute Deviation (MAD)$500 Answer