{ Intraarticular Triamcinolone versus Hyaluronate Injections for Lumbar Zygapophyseal Joint...
18
{ Intraarticular Triamcinolone versus Hyaluronate Injections for Lumbar Zygapophyseal Joint Arthropathy: A Pragmatic, Double Blind Randomized Controlled Trial Thiru Annaswamy Samuel Bierner Luke Carlson Ravid Avraham Corey Armstead VA North Texas Health Care System UT Southwestern Medical Center Dallas, TX
-
Upload
dulcie-sutton -
Category
Documents
-
view
224 -
download
2
Transcript of { Intraarticular Triamcinolone versus Hyaluronate Injections for Lumbar Zygapophyseal Joint...

{
Intraarticular Triamcinolone versus Hyaluronate Injections for Lumbar Zygapophyseal Joint Arthropathy: A Pragmatic, Double Blind Randomized Controlled Trial
Thiru AnnaswamySamuel BiernerLuke CarlsonRavid AvrahamCorey Armstead
VA North Texas Health Care SystemUT Southwestern Medical CenterDallas, TX
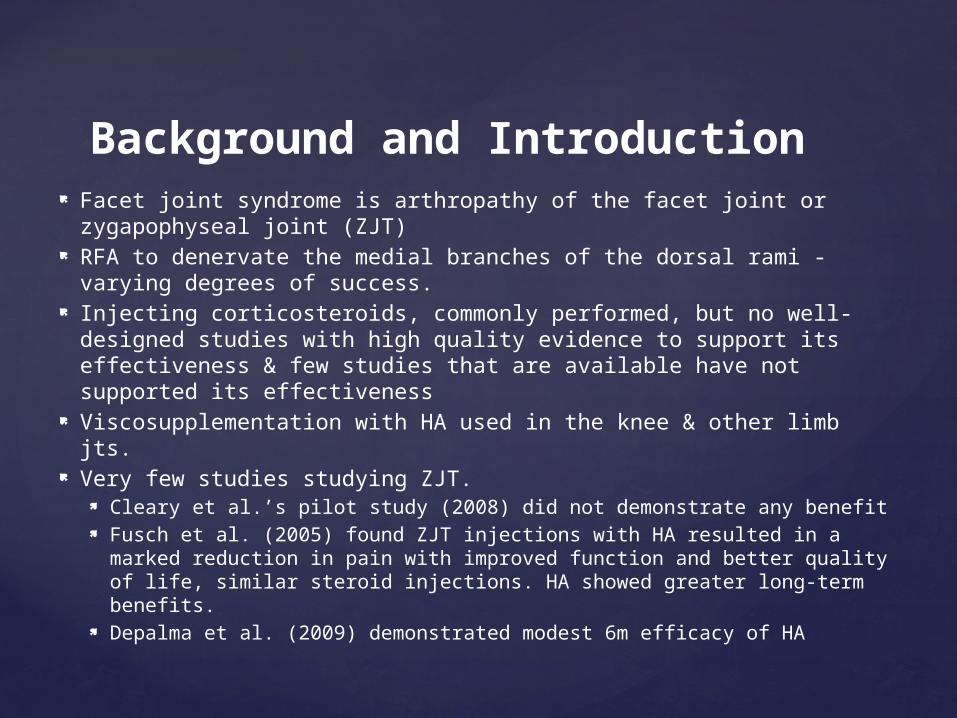
Facet joint syndrome is arthropathy of the facet joint or zygapophyseal joint (ZJT)
RFA to denervate the medial branches of the dorsal rami - varying degrees of success.
Injecting corticosteroids, commonly performed, but no well-designed studies with high quality evidence to support its effectiveness & few studies that are available have not supported its effectiveness
Viscosupplementation with HA used in the knee & other limb jts. Very few studies studying ZJT.
Cleary et al.’s pilot study (2008) did not demonstrate any benefit Fusch et al. (2005) found ZJT injections with HA resulted in a marked
reduction in pain with improved function and better quality of life, similar steroid injections. HA showed greater long-term benefits.
Depalma et al. (2009) demonstrated modest 6m efficacy of HA
Background and Introduction

The purpose of the study was to compare the effectiveness of sodium hyaluronate (HA) injections to triamcinolone injections in improving pain and function in patients with lumbar facet joint arthropathy.
Study Objectives

This was a prospective double-blind randomized controlled trial comparing the effectiveness of intra-articular ZJT injections of HA with Steroid for pain relief, functional improvement, patient satisfaction and clinical safety for ZJT mediated chronic low back pain (CLBP).
Study Design

CLBP patients referred to a Veteran Affairs Physical Medicine & Rehabilitation Spine clinic.
Study Population

Patients with symptomatic lumbar ZJT arthritis with axial CLBP
Physical exam demonstrating para-median lumbar tenderness without midline tenderness
Pain reproduced with hyperextension and lateral rotation (facet loading)
Radiographic evidence of ZJT degeneration
(Criteria consistent with the Helbig and Lee’s study (1988) on the probability of pain relief with ZJT injection)
Inclusion Criteria

History or presence of alcohol or drug abuse or unstable psychosis
Subjects unable to understand informed consent or having a high probability of noncompliance
Intra-articular treatment of any joint with corticosteroids or glycosaminoglycans within 3 months, or with a HA-based product within 6 months before injection
Patients with previous lumbar surgery or true radiculopathy
Known allergy or contraindication to administered agents Critical skin conditions at injection site Other medical conditions such as non-osteoarthritic joint
disease, immune deficiencies, malignant disease, use of anticoagulants, or joint infection
Exclusion Criteria

Power analysis was performed on pain reduction, the main outcome measure.
In order to obtain a mean inter-group difference of 30 ± 20 mm (VAS) with α error of 0.05, for a power of > 80%, the sample size would need to be 12 patients per group for a total of 24 patients.
Accounting for 6 drop-outs, we estimated enrolling 30 patients in our study
Power Analysis

Approved by our facility’s IRB After consent, H&P performed to determine if the patient met criteria. Baseline data
Demographic information, height, weight and duration of pain Pain (10-cm VAS), and disability (PDQ)
Randomization performed by a research pharmacist using computer-generated random numbers, provided the blinded medication in a syringe wrapped in opaque label.
Bilateral L3-4, L4-5 and L5-S1 ZJTs were fluoroscopically injected with the study medication by an independent, masked interventional radiologist.
Each joint received either 1ml of triamcinolone (10mg per ml Kenalog) or 1ml of Synvisc-One® (8mg of Hylan GF-20 per vial) for a total of 6ml injected per patient.
Study patients followed up at 1, 3, and 6 months following the procedure when additional data including pain (VAS) and functional status (PDQ) was collected.
In addition, an overall patient satisfaction score (percent improvement) was obtained at the 6-month visit.
Procedures

Primary outcome measures: Pain (VAS) and functional disability (PDQ), assessed at 1-month, 3-month and 6-months following the procedure.
Secondary outcome measure: Patient satisfaction @ 6-months following the procedure.
Outcome measures in the two groups were compared using the t-test (Mann-Whitney U test for non-normally distributed data).
Change in outcome measures over time in each study group, was assessed using the paired t-test (Wilcoxon sign-rank test for non-normally distributed data).
Data Analysis

A total of 30 subjects were enrolled [5 dropouts] in the study.
Results
Age 58.33±6.98 years
Height 69.18±3.54 inches
Duration of LBP
182±113 months
Weight 207.05±41.21 lbs
Pain Score 67.03±18.40 mm
PDQ Score 101.07±25.07
Table 1. Baseline Data (Mean ± Standard Deviation)
BMI
MeanFemale 34.67Male 30.29
Age(Yrs)
MeanKenalog 58Synvisc 59

4 subjects: 1 joint each couldn’t be accessed/injected (3 Kenalog, 1 Synvisc)
5 subjects: Transient or short-term pain increase (3 Kenalog, 2 Synvisc)
1 subject: Triggered Onset of RA (Was deemed allergic to Synvisc)
1 subject: Died 2/2 unrelated reasons later (Synvisc)
1 subject: Withdrawn after injection (Synvisc) 2/2 neurogenic claudication
Variances & Side Effects

Group Comparisons Baseline 1 month 3 month 6 monthKenalog 70 (Median;
55.75-76.5)58±29.32 58.33±28.72 59.23±27.73
Synvisc-One®
74 (Median; 51.25-84.5)
45.15±25.23 56.18±24.94 63.17±23.93
T Statistic 132.5 (Mann-Whitney U)
1.18 0.19 -0.38
P Value 0.418 0.25 0.85 0.71
Baseline 1 month 3 month 6 monthKenalog 100.2±22.9
377.42±29.89
87.25±26.23
96 (Median; 48.5-106.5)
Synvisc-One®
101.93±27.83
74.08±33.9 74±35.58 79 (Median; 52-99.5)
T Statistic -0.19 0.26 1.02 87.5 (Mann-Whitney U)
P Value 0.85 0.8 0.32 0.62
Overall Satisfaction at 6 monthsKenalog 51.46±34.55Synvisc-One® 42.42±32.96T Statistic 0.67P Value 0.51
Mean differences in the 2 primary and 1 secondary outcome measures showed no significant differences between the groups
Pain Score (VAS) Comparisons
PDQ Score
Overall Satisfaction

Variables studied (Pain Duration, Age, BMI, Baseline Pain, Baseline PDQ, Group Assignment [Synvisc or Kenalog])
Group assignments didn’t determine outcome
Initial pain and Initial PDQ made a difference, but others did not
Multiple ANOVA

Kenalog Group
Pain Score Comparisons
1 month 3 months 6 months
Baseline 64.47±17.33 64.47±17.33 64.47±17.33Follow up 58±29.32 58.33±28.72 59.23±27.73T Statistic 1.57 1.44 0.91P Value 0.14 0.18 0.38
Synvisc-One® Group 1 month 3 months 6 months
Baseline 69.60±19.68 69.60±19.68 69.60±19.68Follow up 45.15±25.23 56.18±24.94 63.17±23.93T Statistic 3.16 1.52 0.16P Value 0.008 0.16 0.88
Note: All values reported in the Baseline and Follow up rows are Means ± Standard Deviations.None of the group comparisons at any time point were statistically significant except for the Baseline vs. 1-month follow up comparisons in the Synvisc-One® group (highlighted P value).All tests performed were below the desired power of 0.800 except for the Baseline vs. 1-month follow up comparisons in the Synvisc-One® group. Less than desired power indicates less likelihood to detect a difference when one actually exists.

Kenalog Group
PDQ Score Comparisons 1 month 3 months 6 months
Baseline 100.2±22.93
100.2±22.93
100.2±22.93
Follow up 77.42±29.89
87.25±26.23
80.54±38.56
T Statistic 3.19 1.72 1.79P Value 0.009 0.11 0.1
Synvisc-One® Group 1 month 3 months 6 months
Baseline 101.93±27.83
101.93±27.83
100 (Medians; 92.25-122)
Follow up 74.08±33.90
74±35.58 79 (Medians; 52-99.5)
T Statistic 4.03 2.40 -2.98 (Wilcoxon Sign Rank Z statistic)
P Value 0.002 0.037 <0.001Note: All values reported in the Baseline and Follow up rows are Means ± Standard Deviations unless specified as Medians. Medians were reported along with 1st Quartile and 3rd Quartile values when the data did not pass the test of normality. When test of normality failed, Wilcoxon Sign Rank test was performed instead of the paired t-test.All of the group comparisons revealed statistically significant changes (highlighted P values) over time except for the Baseline vs. 3-month and Baseline vs. 6-month follow up comparisons in the Kenalog group.All tests performed were below the desired power of 0.800 for all the tests that did not reveal statistically significant differences. Less than desired power indicates less likelihood to detect a difference when one actually exists.

Analyzing total change over the 6 month period of the study:Strong bivariate correlation between change in VAS and change in PDQ scores (initial pain rating VAS, p = .011) and initial PDQ score (PDQ, p = .036)Controlling for duration of LBP, the total VAS score showed strong positive change, but total PDQ change didn’t improve much
Correlation Analyses (Total Cohort)

Triamcinolone and Hyaluronate injections into ZJTs provide similar pain and functional benefits in patients with symptomatic lumbar zygaphophyseal joint arthropathy causing chronic low back pain.
Hyaluronate injections provided statistically significant short- and long-term functional benefits and short-term pain improvement but Triamcinolone injections only provided statistically significant short-term functional benefit and no significant short- or long-term pain improvement compared to baseline levels.
Conclusions

![i-Visc · i-Visc VISCOELASTIC SOLUTION FOR INTRAOCULAR USE based on SODIUM HYALURONATE Specification Sodium hyaluronate Molecular weight [mio. Daltons] Viscosity* [mPas] Osmolality](https://static.fdocuments.in/doc/165x107/5f8d228ac639c80bb7041471/i-visc-i-visc-viscoelastic-solution-for-intraocular-use-based-on-sodium-hyaluronate.jpg)