中期報告 INTERIM REPORT 2016 -...
25
for identification only (Stock Code: 1385) (a joint stock limited company incorporated in the People's Republic of China) 2016 INTERIM REPORT
-
Upload
trinhkhuong -
Category
Documents
-
view
213 -
download
0
Transcript of 中期報告 INTERIM REPORT 2016 -...

for identification only
(Stock Code: 1385)(a joint stock limited company incorporated in the People's Republic of China)
(股份代號 : 1385)在中華人民共和國註冊成立的股份有限公司( )
2016INTERIM REPORT中 期 報 告
2016僅供識別

- 1 -
The board of directors (the “Board”) of Shanghai Fudan Microelectronics Group Company Limited (the “Company”) is pleased to announce the unaudited consolidated results of the Company and its subsidiaries (the “Group”) for the half-year ended 30 June 2016 together with the comparative figures for the corresponding period in 2015 as follows:
UNAUDITED CONDENSED CONSOLIDATED STATEMENT OF PROFIT AND LOSS
Half-year ended 30 June2016 2015
Notes RMB’000 RMB’000
REVENUE 2 483,105 419,884Cost of sales (223,107) (215,016)
Gross profit 259,998 204,868
Other income and gains 2 41,964 25,317Selling and distribution costs (30,534) (26,500)Administrative expenses (37,060) (31,419)Other expenses (133,651) (89,761)
PROFIT BEFORE TAX 4 100,717 82,505Income tax expense 5 (8,604) (11,746)
PROFIT FOR THE PERIOD 92,113 70,759
Profit attributable to: Owners of the parent 84,706 66,117 Non-controlling interests 7,407 4,642
92,113 70,759
EARNINGS PER SHARE ATTRIBUTABLE TO ORDINARY EQUITY HOLDERS OF THE PARENT
Basic and diluted – For profit for the period 6 13.72 cents 10.71 cents

- 2 -
UNAUDITED CONDENSED CONSOLIDATED STATEMENT OF COMPREHENSIVE INCOME
Half-year ended 30 June2016 2015
RMB’000 RMB’000
PROFIT FOR THE PERIOD 92,113 70,759
OTHER COMPREHENSIVE INCOMEOther comprehensive income to be reclassified to profit or loss in subsequent periods:Exchange differences on translation of foreign operations 242 28
Net other comprehensive income to be reclassified to profit or loss in subsequent periods 242 28
Other comprehensive income for the period, net after tax 242 28
TOTAL COMPREHENSIVE INCOME FOR THE PERIOD 92,355 70,787
Total comprehensive income attributable to: Owners of the parent 84,948 66,145 Non-controlling interests 7,407 4,642
92,355 70,787

- 3 -
CONDENSED CONSOLIDATED STATEMENT OF FINANCIAL POSITION
30 June2016
31 December 2015
(Unaudited) (Audited)Notes RMB’000 RMB’000
NON-CURRENT ASSETSProperty, plant and equipment 7 312,559 332,011Intangible assets 8 150,008 160,645Available-for-sale investments – –Deferred tax assets 37,325 38,264
Total non-current assets 499,892 530,920
CURRENT ASSETSInventories 276,730 214,110Trade and bills receivables 9 309,388 366,017Prepayments, deposits and other receivables 24,908 21,383Cash and cash equivalents 14 454,622 386,033
Total current assets 1,065,648 987,543
CURRENT LIABILITIESTrade and bills payables 10 102,663 124,703Other payables, accruals and deferred income 244,820 261,067Tax payable 1,834 13,369
Total current liabilities 349,317 399,139
NET CURRENT ASSETS 716,331 588,404
TOTAL ASSETS LESS CURRENT LIABILITIES 1,216,223 1,119,324
NON-CURRENT LIABILITIESDeferred income 10,282 5,738
NET ASSETS 1,205,941 1,113,586
EQUITIESEquity attributable to equity holders of the parentIssued capital 61,733 61,733Reserves 11 1,025,045 940,097
1,086,778 1,001,830Non-controlling interests 119,163 111,756
TOTAL EQUITY 1,205,941 1,113,586

- 4 -
CONSOLIDATED STATEMENT OF CHANGES IN EQUITY
Attributable to owners of the parent
Issued share
capitalShare
premium
Statutory surplus reserve
Exchange fluctuation
reserveOther
reservesRetained
profits Total
Non-controlling
interestsTotal
equityRMB’000 RMB’000 RMB’000 RMB’000 RMB’000 RMB’000 RMB’000 RMB’000 RMB’000
At 1 January 2016 (Audited) 61,733 168,486 44,717 (2,808) 7,821 721,881 1,001,830 111,756 1,113,586
Profit for the period – – – – – 84,706 84,706 7,407 92,113Exchange differences on translation of foreign operations – – – 242 – – 242 – 242
Total comprehensive income for the period – – – 242 – 84,706 84,948 7,407 92,355
At 30 June 2016 (Unaudited) 61,733 168,486* 44,717* (2,566)* 7,821* 806,587* 1,086,778 119,163 1,205,941
At 1 January 2015 (Audited) 61,733 168,486 42,701 (3,476) 7,821 564,999 842,264 92,664 934,928
Profit for the period – – – – – 66,117 66,117 4,642 70,759Exchange differences on translation of foreign operations – – – 28 – – 28 – 28
Total comprehensive income for the period – – – 28 – 66,117 66,145 4,642 70,787
At 30 June 2015 (Unaudited) 61,733 168,486* 42,701* (3,448)* 7,821* 631,116* 908,409 97,306 1,005,715
* These reserve accounts comprise the consolidated reserves of RMB1,025,045,000 (31 December 2015: RMB940,097,000) in the condensed consolidated statement of financial position.
- 5 -
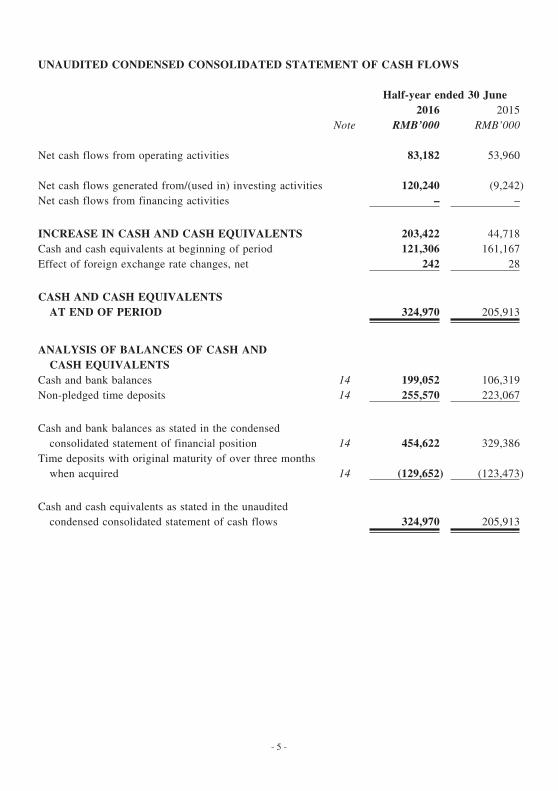
UNAUDITED CONDENSED CONSOLIDATED STATEMENT OF CASH FLOWS
Half-year ended 30 June2016 2015
Note RMB’000 RMB’000
Net cash flows from operating activities 83,182 53,960
Net cash flows generated from/(used in) investing activities 120,240 (9,242)Net cash flows from financing activities – –
INCREASE IN CASH AND CASH EQUIVALENTS 203,422 44,718Cash and cash equivalents at beginning of period 121,306 161,167Effect of foreign exchange rate changes, net 242 28
CASH AND CASH EQUIVALENTS AT END OF PERIOD 324,970 205,913
ANALYSIS OF BALANCES OF CASH AND CASH EQUIVALENTSCash and bank balances 14 199,052 106,319Non-pledged time deposits 14 255,570 223,067
Cash and bank balances as stated in the condensed consolidated statement of financial position 14 454,622 329,386Time deposits with original maturity of over three months when acquired 14 (129,652) (123,473)
Cash and cash equivalents as stated in the unaudited condensed consolidated statement of cash flows 324,970 205,913

- 6 -
Notes:
1. BASIS OF PRESENTATION
These financial statements have been prepared in compliance with Hong Kong Accounting Standard 34 “Interim Financial Reporting” issued by the Hong Kong Institute of Certified Public Accountants and in accordance with the applicable disclosure provision of the Listing Rules on the Stock Exchange. They have been prepared under the historical cost convention.
The accounting policies adopted in preparing these unaudited consolidated results are consistent with those followed in the preparation of the Group’s financial statements for the year ended 31 December 2015. The Group has adopted the new Hong Kong Financial Reporting Standards and Hong Kong Accounting Standards which are effective for the financial year beginning on or after 1 January 2016. The adoption of these new and revised standards, amendments and interpretations did not have any significant impact on the operating results and financial position of the Group.
All income, expenses and unrealised gains and losses resulting from intercompany transactions and intercompany balances within the Group are eliminated on consolidation in full.
2. REVENUE, OTHER INCOME AND GAINS
Revenue, which is also the Group’s turnover, represents the net invoiced value of goods sold, after allowance for returns and trade discounts and the value of services rendered.
An analysis of revenue, other income and gains is as follows:
Half-year ended 30 June2016
(Unaudited)2015
(Unaudited)RMB’000 RMB’000
RevenueSale of goods 452,984 398,257Services rendered 30,121 21,627
483,105 419,884
Other income and gainsInterest income 3,002 3,236Government grants received for research activities 26,450 4,481Other government grants 10,117 16,312Others 2,395 1,288
41,964 25,317

- 7 -
3. OPERATING SEGMENT INFORMATION
For management purposes, the Group is organised into business units based on their products and services and has two reportable operating segments as follows:
• the design, development and sale of IC products segment (“Design, development and sale of IC products”) and
• the provision of testing services for IC products segment (“Testing services for IC products”).
Design, development
and selling of IC products
Testing services of IC products Total
For the half year ended 30 June 2016 (Unaudited) (Unaudited) (Unaudited)RMB’000 RMB’000 RMB’000
Segment revenueSales to external customers 452,984 30,121 483,105Intersegment sales – 17,045 17,045
452,984 47,166 500,150Reconciliation:Elimination of intersegment sales (17,045)
Revenue 483,105
Segment results 80,000 17,050 97,050Reconciliation:Elimination of segment results (1,730)Interest income 3,010Unallocated gains 2,387
Profit before tax 100,717
Segment assets 1,091,500 443,388 1,534,888Reconciliation:Elimination of intersegment receivables (6,673)Corporate and other unallocated assets 37,325
Total assets 1,565,540
Segment liabilities 228,011 138,261 366,272Reconciliation:Elimination of intersegment payables (6,673)
Total liabilities 359,599
Other segment informationDepreciation 11,668 15,292 26,960Amortisation of intangible assets 22,843 – 22,843Capital expenditure 35,433 4,217 39,650*
* Capital expenditure consists of additions to property, plant and equipment and intangible assets.

- 8 -
Design, development
and selling ofIC products
Testing services of IC products Total
For the half year ended 30 June 2015 (Unaudited) (Unaudited) (Unaudited)RMB’000 RMB’000 RMB’000
Segment revenueSales to external customers 398,257 21,627 419,884Intersegment sales – 16,107 16,107
398,257 37,734 435,991Reconciliation:Elimination of intersegment sales (16,107)
Revenue 419,884
Segment results 66,650 10,531 77,181Reconciliation:Elimination of segment results (801)Interest income 3,236Unallocated gains 2,889
Profit before tax 82,505
Segment assets 1,030,925 262,713 1,293,638Reconciliation:Elimination of intersegment receivables (10,295)Corporate and other unallocated assets 30,239
Total assets 1,313,582
Segment liabilities 237,448 80,714 318,162Reconciliation:Elimination of intersegment payables (10,295)Corporate and other unallocated liabilities –
Total liabilities 307,867
Other segment informationDepreciation 10,619 8,994 19,613Amortisation of intangible assets 8,043 – 8,043Capital expenditure 50,822 21,533 72,355*
* Capital expenditure consists of additions to property, plant and equipment and intangible assets.

- 9 -
Geographical information
a) Revenue from external customers
Half-year ended 30 June2016
(Unaudited)2015
(Unaudited)RMB’000 RMB’000
Mainland China 449,163 383,884Asia Pacific (excluding Mainland China) 27,744 31,686Others 6,198 4,314
483,105 419,884
The revenue information from operations above is based on the location of the customers.
b) Non-current assets
Half-year ended 30 June2016
(Unaudited)2015
(Unaudited)RMB’000 RMB’000
Mainland China 462,563 512,052Asia Pacific (excluding Mainland China) 4 4
462,567 512,056
The non-current asset information above is based on the location of assets and excludes financial instruments and deferred tax assets.
Information about a major customer
Revenue of approximately RMB73,080,000 (2015: RMB66,438,000) from a main customer in regard of design, development and selling of IC products and is individually accounted for more than 10% of the Group’s total revenue during the six months ended 30 June 2016.

- 10 -
4. PROFIT BEFORE TAX
The Group’s profit before tax is arrived at after charging/(crediting):
Half-year ended 30 June2016
(Unaudited)2015
(Unaudited)RMB’000 RMB’000
Depreciation 27,351 19,613Provision/(reversal) for doubtful debts (8,925) 1,221Payments under operating leases in respect of land and buildings 4,009 4,495Amortisation of deferred development costs* 22,843 8,043Provision for impairment of inventories 2,760 416Interest income (3,002) (3,236)Other government grants (10,117) (16,312)Government grants received for research activities** (26,450) (4,481)
Note: * The amortisation of deferred development costs for the period is included in “Other expenses” on the face of the condensed consolidated income statement.
** The government grants received for certain research activities have been recognised as other income if there are no unfulfilled conditions or contingencies relating to these grants and they are not matched with the related costs which they are intended to compensate. Government grants received for which related expenditure has not yet been undertaken are included in “other liabilities” in the condensed consolidated statement of financial position.
5. INCOME TAX EXPENSES
Under the PRC Corporate Income Tax Law (the “CIT Law”), which became effective on 1 January 2008, the Company is subject to income tax at a base rate of 25%. The Company is eligible to a preferential income tax rate of 15% as a High New Technology Enterprise (“HNT Enterprise”). Further pursuant to the notice of the State Council on “Issuing Several Policies on Further Encouraging the Development of the Software and Integrated Circuit Industries” (Guo Fa (2011) No. 4) and “Notice Concerning Policies on Enterprise Income Tax for Further Encouraging the Development of Software and Integrated Circuit Industries” (Cai Shui (2012) No. 27) issued by the Ministry of Finance of the PRC, the Company’s application as a “key software enterprise falling within the State’s planned arrangement” was approved and a notice of approval results for enjoying the preferential tax rate of 10% for 2013 and 2014 was issued by the State Administration of Taxation, Yangpu, Shanghai on 18 March 2014. During the period, the Company received notice issued by the relevant tax bureau for enjoying the preferential tax rate of 10% for 2015. Prior to the formal written approval issued by the relevant tax bureau for the current year, income tax has been provided at 15% on the assessable income of the Company for the financial year ended 31 December 2016 (2015:15%).

- 11 -
Under the CIT Law, the Company’s subsidiary, Sino IC Technology Co., Ltd. (“Sino IC”) is subject to income tax at a base rate of 25%. Sino IC is entitled to a preferential income tax rate of 15% as a HNT Enterprise. For the financial year ended 31 December 2016, income taxes on assessable income of Sino IC will be provided at the rate of 15% (2015: 15%).
Under the CIT Law, the Company’s subsidiary, Shanghai Fukong Hualong Micro-system Technology Co., Ltd. (“Fukong Hualong”) is subject to income tax at a base rate of 25%. The income taxes on assessable income of Fukong Hualong will be provided at the rate of 15% (2015: 15%) for the financial year ended 31 December 2016 as it is a HNT Enterprise.
Under the CIT Law, three of the Company’s subsidiaries, Shenzhen Fudan Microelectronics Company Limited, Beijing Fudan Microelectronics Technology Company Limited and Shanghai Doublepoint Information Technology Co., Ltd (“Doublepoint”) are subject to income taxes at a base rate of 25%. For the financial year ended 31 December 2016, income taxes on assessable income of these subsidiaries will be provided at the rate of 25% (2015: 25%).
Hong Kong profits tax has been provided at 16.5% (2015: 16.5%) on the estimated assessable profits arising during the period.
Half-year ended 30 June2016
(Unaudited)2015
(Unaudited)RMB’000 RMB’000
Current – Hong Kong Charge for the period – 34Current – PRC Charge for the period 11,732 10,793 2015 Preferential tax rate adjustment (3,776) –Deferred 648 919
Total tax charge for the period 8,604 11,746
6. EARNINGS PER SHARE ATTRIBUTABLE TO ORDINARY EQUITY HOLDERS OF THE PARENT
The calculation of the basic earnings per share for the half-year ended 30 June 2016 is based on the unaudited net profit attributable to ordinary equity holders of the parent of approximately RMB84,706,000 (2015: RMB66,117,000) and the weighted average number of 617,330,000 (2015: 617,330,000) ordinary shares in issue during the period.
No adjustment has been made to the basic earnings per share amounts presented for the half years ended 30 June 2016 and 2015 in respect of a dilution as the Group had no potentially dilutive ordinary shares in issue during these periods.
7. PROPERTY, PLANT AND EQUIPMENT
During the half-year ended 30 June 2016, the Group acquired machinery and office equipment amounted to approximately RMB22,295,000 (31 December 2015: RMB77,176,000).

- 12 -
8. INTANGIBLE ASSETS
30 June 2016(Unaudited)
31 December 2015(Audited)
RMB’000 RMB’000
Cost at 1 January, net of accumulated amortisation and impairment 160,645 131,763Additions – internal development 28,605 79,452Write-off – internal development (7,319) (8,139)Impairment (11,476) (16,389)Amortisation provided (20,447) (26,042)
Net carrying amount 150,008 160,645
9. TRADE AND BILLS RECEIVABLES
The Group’s trading terms with its customers are mainly on credit and the credit period is generally up to 30 days to 90 days. An ageing analysis of trade and bills receivables at 30 June 2016 is as follows:
30 June 2016(Unaudited)
31 December 2015(Audited)
RMB’000 RMB’000
Within 3 months 211,721 291,8583 to 6 months 58,728 48,1526 to 12 months 20,582 3,397Over 12 months 18,357 22,610
309,388 366,017
10. TRADE AND BILLS PAYABLES
An ageing analysis of trade and bills payables at 30 June 2016 is as follows:
30 June 2016(Unaudited)
31 December 2015(Audited)
RMB’000 RMB’000
Within 3 months 83,901 122,7513 to 6 months 7,407 686 to 12 months 9,351 815Over 12 months 2,004 1,069
102,663 124,703
- 13 -
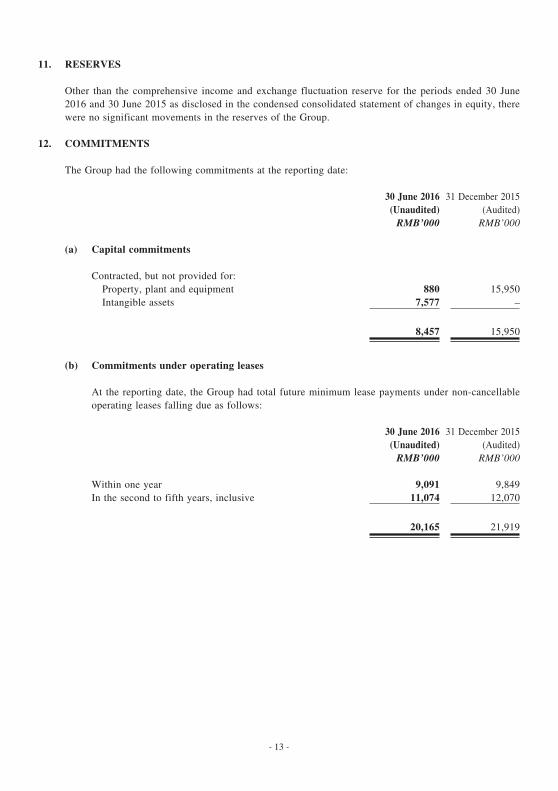
11. RESERVES
Other than the comprehensive income and exchange fluctuation reserve for the periods ended 30 June 2016 and 30 June 2015 as disclosed in the condensed consolidated statement of changes in equity, there were no significant movements in the reserves of the Group.
12. COMMITMENTS
The Group had the following commitments at the reporting date:
30 June 2016(Unaudited)
31 December 2015(Audited)
RMB’000 RMB’000
(a) Capital commitments
Contracted, but not provided for: Property, plant and equipment 880 15,950 Intangible assets 7,577 –
8,457 15,950
(b) Commitments under operating leases
At the reporting date, the Group had total future minimum lease payments under non-cancellable operating leases falling due as follows:
30 June 2016(Unaudited)
31 December 2015(Audited)
RMB’000 RMB’000
Within one year 9,091 9,849In the second to fifth years, inclusive 11,074 12,070
20,165 21,919

- 14 -
13. RELATED PARTY TRANSACTIONS
During the period, the Group had the following transactions with the related parties:
Half-year ended 30 JuneName ofrelated party
Relationshipwith the Group
Nature oftransaction
2016(Unaudited)
2015(Unaudited)
RMB’000 RMB’000
Fudan University Owner of a substantial shareholder
Technical and equipment support fee 285 201Rental fee 142 –
Fukong Hualong A subsidiary and is connected with an enterprise controlled by a substantial shareholder
Purchases of raw materials 997 1,080Finished goods 1,669 1,917Technical services charges 1,500 –
The independent non-executive directors of the Company have reviewed the continuing connected transactions set out above and have confirmed that these continuing connected transactions were entered into (i) in the ordinary and usual course of business of the Group; (ii) on normal commercial terms or on terms no less favourable to the Group than terms available to independent third parties; and (iii) in accordance with the relevant agreements governing them on terms that are fair and reasonable and in the interests of the shareholders of the Company as a whole.
14. CASH AND CASH EQUIVALENTS
Half-year ended 30 June2016 2015
(Unaudited) (Unaudited)RMB’000 RMB’000
Time deposits with original maturity of less than 3 months when acquired 125,918 99,594Cash on hand and demand deposits 199,052 106,319
Cash and cash equivalents 324,970 205,913Time deposits with original maturity of over 3 months when acquired 129,652 123,473
Cash and bank balances 454,622 329,386
15. EVENTS AFTER THE REPORTING PERIOD
After the end of the current reporting period, there is no event that has material impact to the Group.
- 15 -
INTERIM DIVIDEND
The Board does not recommend the payment of an interim dividend for the half-year ended 30 June 2016 (30 June 2015: nil).
MANAGEMENT DISCUSSION AND ANALYSIS
Business Review
During the period, the global economic situation was still recovering in a different manner. The United States economy was recovered and there was an upward adjustment in the interest rate. The European economy was still suffering from the refugee problem and the Brexit issue in relation to the United Kingdom off the European Union referendum. Due to the external uncertainties, the growth of the China economy was adversely affected as well. The Group still continued to benefit from the high demand of the integrated circuits market, it showed a steady growth in both product sales and service income by approximately 15.06%. As the profit margin of new products was comparatively high, the overall product gross profit margin increased by approximately 53.82% compared to last corresponding period. As the Security and Identification IC Chips, which represented a larger proportion of sales, are increasing their applications and had been entered into the market for a considerable time, the market share was rather stable. The sales of smart card chips increased because the Government has aggressively promoted the usage of domestic IC chips; the smart card chips like public transportation cards and financial cards recorded with satisfactory sales growth. As the market for storage card chips is widen, sales increased steadily. Due to the market saturation and keen competition in the industry of Smart Meter chips, even though the sales increased during the period, tender prices have gone down and turnover were slightly reduced. The sales of non-volatile memory products have greatly increased as some of the competitors in the industry exited the market and there are more market spaces available. Sales of the products of specific analog circuits have recorded an awesome increase. However, this category had a marginal impact on turnover and business results given its limited weight in the Group’s overall sales. Moreover, due to the improvement of the business policy and the increasing demand of the testing services for IC products, revenue from external testing services increased significantly.
Financial Review
For the half-year ended 30 June 2016, the Group recorded a turnover of approximately RMB483,105,000 (30 June 2015: RMB419,884,000), an increase of approximately 15.06% as compared to the same period last year. Profit attributable to owners of the parent amounted to approximately RMB84,706,000 (30 June 2015: RMB66,117,000), an increase of approximately 28.12% over the same period last year. As compared to the same period last year, the overall product gross profit margin increased from 48.79% to 53.82%.
As compared to the same period last year, other income and gains for the period have a significant increase of approximately RMB16,647,000 because of increasing government projects and several government projects brought forward from previous year were completed and recognized, however, other government subsidies were slightly decreased.

- 16 -
As a result of increase in sales and adjustment in salaries, selling and distribution costs and administrative expenses have increased by approximately 15.22% and 17.95% respectively. Other expenses have largely increased by approximately 48.90% as there was provision for impairment of research and development costs due to certain research and development projects could not meet the market expectation and in addition, the amortization of the intangible assets also increased over the years following the application of huge resources in recent years.
With regard to taxation, the tax charge for the period increased as the profit before tax increased during the period. However, the Company was benefited from the approval of preferential tax rate of 10% for the year of 2015 issued by the Chinese tax bureau, the related tax adjustment was approximately RMB3,775,000. Thus the overall tax charge during the period decreased by approximately RMB3,142,000 compared to the same period last year.
As at 30 June 2016, net assets of the Group amounted to approximately RMB1,205,941,000 (31 December 2015: RMB1,113,586,000), increased by approximately 8.29%. Non-current assets amounted to RMB499,892,000 (31 December 2015: RMB530,920,000), the decrease was due to amortization and impairment of intangible assets. Current assets amounted to approximately RMB1,065,648,000 (31 December 2015: RMB987,543,000), as the trade receivables were settled satisfactorily, cash increased and trade receivables dropped. Inventory increased relatively as sales increased. The Group keeps sufficient liquidity and is able to meet its daily operations and future development.
The Group’s current liabilities as at 30 June 2016 amounted to approximately RMB349,317,000 (31 December 2015: RMB399,139,000) because incomplete projects of previous period were completed and recognised within the period. Non-current liabilities amounted to approximately RMB10,282,000 (31 December 2015: RMB5,738,000) and the increase over the last corresponding period was mainly because of research and development activities of some projects under government grants have longer completion time and which are expected to finish and settle over a year.
The net assets value per share was approximately RMB1.95 (31 December 2015: RMB1.63). The Group’s current ratio of total current liabilities over total current assets was approximately 32.78% (31 December 2015: 35.84%) and the gearing ratio was approximately 29.82% (31 December 2015: 30.61%) on the basis of total liabilities over net assets.
The Group manages its capital structure and makes adjustments to it in light of business development and changes in economic conditions. During the half year ended 30 June 2016, the Group had a net inflow in cash and cash equivalents of approximately RMB203,422,000 (30 June 2015: RMB44,718,000), an increase over the same period last year was because of the early settlement of trade receivables and the drop of the long-term deposits incurred in the current period. As at 30 June 2016, the Group had no bank or other borrowings (31 December 2015: nil).

- 17 -
The Directors believe that the Group is not exposed to any material interest rate risk in view that the Group does not have any debt obligations that are subject to fluctuations in market interest rates. The Group has transactional currency exposures arise from sales or purchases by operating units in currencies other than the units’ functional currency. The Group keeps monetary items in foreign currencies at a certain level in order to meet the needs of purchases that are denominated in the foreign currencies. It is the Group’s policy not to enter into forward contracts until a firm commitment is in place. During the reporting period, the fluctuations in foreign exchange have no material effect on the Group’s operations and cash flows.
As the Group trades only with recognised and creditworthy third parties, there is no requirement for collateral. During the period, the Group has certain concentrations of credit risk as the Group’s sales are made to several major customers. The Group seeks to maintain strict control over its outstanding receivables and closely monitor the collection to minimize credit risk. The credit risk of the Group’s other financial assets, which comprise cash and cash equivalents, deposits and other receivables, arises from default of the counterparty, with a maximum exposure equal to the carrying amounts of these instruments.
During the period, the Group did not have other significant investments, material acquisitions or disposals of subsidiaries.
During the period, the capital structure of the Company has no change and only comprises of ordinary shares. The Group relies on its internal resources and profits as a source of funding and keeps most of its cash in Renminbi in bank accounts as working capital.
As at 30 June 2016, the Group has capital commitments in respect of acquisition of property, plant, equipment and intangible assets amounted to RMB8,457,000 (31 December 2015: RMB15,950,000), and has operating leases commitments amounted to RMB20,165,000 (31 December 2015: RMB21,919,000) and did not have any material contingent liabilities (31 December 2015: nil). The Group has not pledged its assets to any third parties (31 December 2015: nil).
Employee Information
As at 30 June 2016, the Group employed approximately 973 (30 June 2015: 951) staff and the total staff costs reflected in the unaudited condensed consolidated statement of comprehensive income amounted to RMB107,564,000 (30 June 2015: RMB60,041,000). The increase in staff costs was mainly due to the increase in staff for the business development, the overall standard of staff remuneration increased and the capitalization of the amount of development costs during the period.
- 18 -
Prospects
As for the outlook of the second half year of 2016, it is expected that the sales of security and identification IC chips and non-volatile memory products like public transportation card, financial IC card, resident card, storage card and serial EEPROM can maintain their steady sales. The testing services for IC products will be increased as well. All of the above will trigger the overall turnover for a steady growth. Due to the keen competition in the industry, the Group needs to put in more resources in developing new products and modifying existing products that will resulted with increases in development costs as well as its related amortization and impairment, and to a certain extent, the results will be under pressure. The Directors expect that the Group could keep a steady result in the second half year.
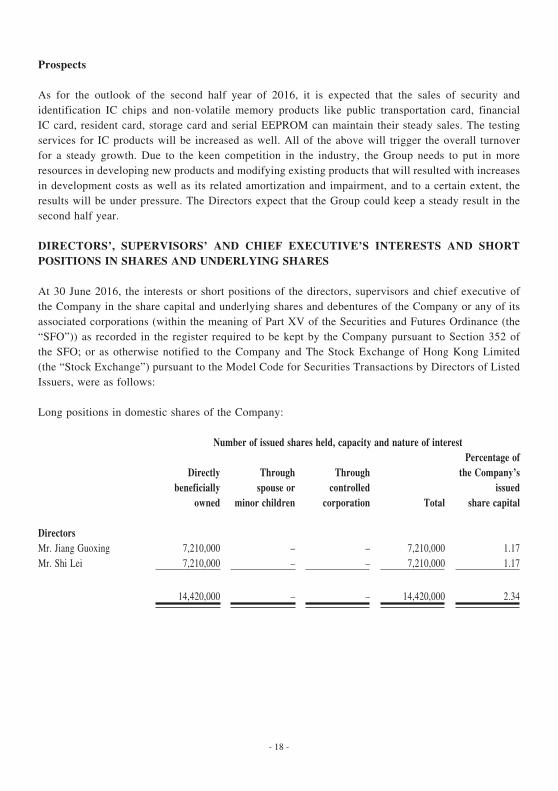
DIRECTORS’, SUPERVISORS’ AND CHIEF EXECUTIVE’S INTERESTS AND SHORT POSITIONS IN SHARES AND UNDERLYING SHARES
At 30 June 2016, the interests or short positions of the directors, supervisors and chief executive of the Company in the share capital and underlying shares and debentures of the Company or any of its associated corporations (within the meaning of Part XV of the Securities and Futures Ordinance (the “SFO”)) as recorded in the register required to be kept by the Company pursuant to Section 352 of the SFO; or as otherwise notified to the Company and The Stock Exchange of Hong Kong Limited (the “Stock Exchange”) pursuant to the Model Code for Securities Transactions by Directors of Listed Issuers, were as follows:
Long positions in domestic shares of the Company:
Number of issued shares held, capacity and nature of interest
Directlybeneficially
owned
Throughspouse or
minor children
Throughcontrolled
corporation Total
Percentage ofthe Company’s
issuedshare capital
DirectorsMr. Jiang Guoxing 7,210,000 – – 7,210,000 1.17Mr. Shi Lei 7,210,000 – – 7,210,000 1.17
14,420,000 – – 14,420,000 2.34

- 19 -
Long positions in shares of associate corporations:
Name ofassociatedcorporation
Relationshipwith theCompany
Shares/equityderivatives
Numbers ofshares/equity
derivativesheld
Capacityand natureof interest
Percentage ofthe associatedcorporation’s
issuedshare capital
DirectorMr. Yu Jun Doublepoint Company’s
subsidiaryOrdinary shares 200,000 Directly
beneficially owned
2.06
SupervisorMr. Li Wei Doublepoint Company’s
subsidiaryOrdinary shares 100,000 Directly
beneficially Owned
1.03
Sino IC Company’s subsidiary
Ordinary shares 126,000 Directly beneficially owned
0.10
Save as disclosed above, as at 30 June 2016, none of the directors, supervisors or chief executive had registered an interest or short positions in the shares, underlying shares or debentures of the Company or any of its associated corporations that was required to be recorded pursuant to Section 352 of the SFO; or as otherwise notified to the Company and the Stock Exchange pursuant to the Model Code for Securities Transactions by Directors of Listed Issuers.
DIRECTORS’ RIGHTS TO ACQUIRE SHARES OR DEBENTURES
At no time during the period were rights to acquire benefits by means of the acquisition of shares in or debentures of the Company granted to any director or their respective spouse or minor children, or were any such rights exercised by them; or was the Company, or any of its subsidiaries a party to any arrangement to enable the directors to acquire such rights in any other body corporate.
- 20 -
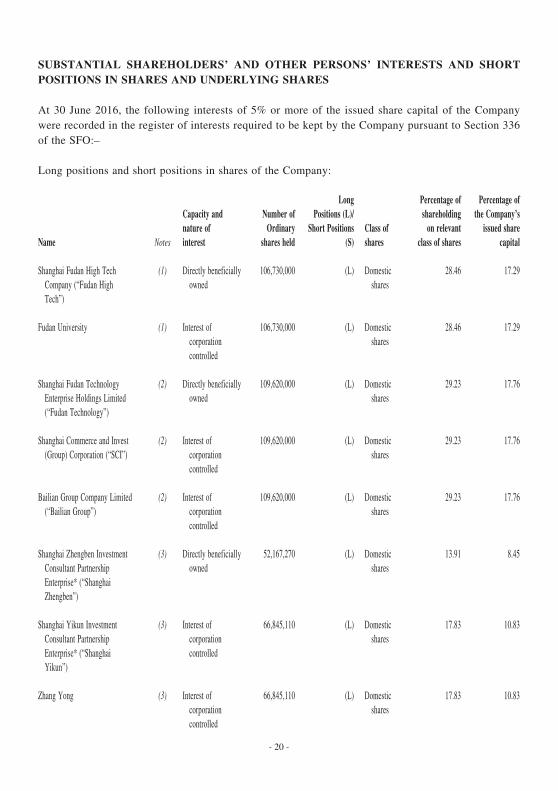
SUBSTANTIAL SHAREHOLDERS’ AND OTHER PERSONS’ INTERESTS AND SHORT POSITIONS IN SHARES AND UNDERLYING SHARES
At 30 June 2016, the following interests of 5% or more of the issued share capital of the Company were recorded in the register of interests required to be kept by the Company pursuant to Section 336 of the SFO:–
Long positions and short positions in shares of the Company:
Name Notes
Capacity andnature ofinterest
Number ofOrdinary
shares held
LongPositions (L)/
Short Positions(S)
Class ofshares
Percentage ofshareholding
on relevantclass of shares
Percentage ofthe Company’s
issued sharecapital
Shanghai Fudan High Tech Company (“Fudan High Tech”)
(1) Directly beneficially owned
106,730,000 (L) Domestic shares
28.46 17.29
Fudan University (1) Interest of corporation controlled
106,730,000 (L) Domestic shares
28.46 17.29
Shanghai Fudan Technology Enterprise Holdings Limited (“Fudan Technology”)
(2) Directly beneficially owned
109,620,000 (L) Domestic shares
29.23 17.76
Shanghai Commerce and Invest (Group) Corporation (“SCI”)
(2) Interest of corporation controlled
109,620,000 (L) Domestic shares
29.23 17.76
Bailian Group Company Limited (“Bailian Group”)
(2) Interest of corporation controlled
109,620,000 (L) Domestic shares
29.23 17.76
Shanghai Zhengben Investment Consultant Partnership Enterprise* (“Shanghai Zhengben”)
(3) Directly beneficially owned
52,167,270 (L) Domestic shares
13.91 8.45
Shanghai Yikun Investment Consultant Partnership Enterprise* (“Shanghai Yikun”)
(3) Interest of corporation controlled
66,845,110 (L) Domestic shares
17.83 10.83
Zhang Yong (3) Interest of corporation controlled
66,845,110 (L) Domestic shares
17.83 10.83
- 21 -
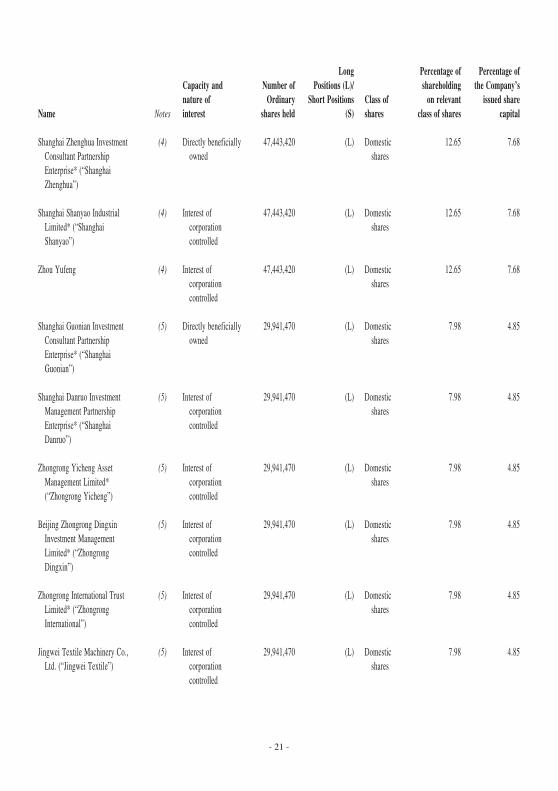
Name Notes
Capacity andnature ofinterest
Number ofOrdinary
shares held
LongPositions (L)/
Short Positions(S)
Class ofshares
Percentage ofshareholding
on relevantclass of shares
Percentage ofthe Company’s
issued sharecapital
Shanghai Zhenghua Investment Consultant Partnership Enterprise* (“Shanghai Zhenghua”)
(4) Directly beneficially owned
47,443,420 (L) Domestic shares
12.65 7.68
Shanghai Shanyao Industrial Limited* (“Shanghai Shanyao”)
(4) Interest of corporation controlled
47,443,420 (L) Domestic shares
12.65 7.68
Zhou Yufeng (4) Interest of corporation controlled
47,443,420 (L) Domestic shares
12.65 7.68
Shanghai Guonian Investment Consultant Partnership Enterprise* (“Shanghai Guonian”)
(5) Directly beneficially owned
29,941,470 (L) Domestic shares
7.98 4.85
Shanghai Danruo Investment Management Partnership Enterprise* (“Shanghai Danruo”)
(5) Interest of corporation controlled
29,941,470 (L) Domestic shares
7.98 4.85
Zhongrong Yicheng Asset Management Limited* (“Zhongrong Yicheng”)
(5) Interest of corporation controlled
29,941,470 (L) Domestic shares
7.98 4.85
Beijing Zhongrong Dingxin Investment Management Limited* (“Zhongrong Dingxin”)
(5) Interest of corporation controlled
29,941,470 (L) Domestic shares
7.98 4.85
Zhongrong International Trust Limited* (“Zhongrong International”)
(5) Interest of corporation controlled
29,941,470 (L) Domestic shares
7.98 4.85
Jingwei Textile Machinery Co., Ltd. (“Jingwei Textile”)
(5) Interest of corporation controlled
29,941,470 (L) Domestic shares
7.98 4.85

- 22 -
Name Notes
Capacity andnature ofinterest
Number ofOrdinary
shares held
LongPositions (L)/
Short Positions(S)
Class ofshares
Percentage ofshareholding
on relevantclass of shares
Percentage ofthe Company’s
issued sharecapital
Springs China Opportunities Master Fund (“Spring China”)
(6) Interest of corporation controlled
19,224,000 (L) H shares 7.93 3.11
Zhao Jun (6) Interest of corporation controlled
19,224,000 (L) H shares 7.93 3.11
Chi Rui(6) Interest of
corporation controlled
19,224,000 (L) H shares 7.93 3.11
Credit Suisse Group AG Interest of corporation controlled
17,376,000 (L) H shares 7.17 2.8138,000 (S) H shares 0.02 0.01
Notes:
(1) Shanghai Fudan High Tech Company is a state-owned enterprise wholly-owned by Fudan University.
(2) Bailian Group is a state-owned enterprise wholly owned by the Shanghai Municipal Government and wholly owned SCI, and SCI held 70.2% of the equity interest of Fudan Technology. Accordingly, each of SCI and Bailian Group is deemed to be interested in Fudan Technology’s interest in the Company.
(3) Zhang Yong held 95% of the equity interest in Shanghai Yikun, and Shanghai Yikun held 99.81% of the equity interest in Shanghai Zhengben (formerly known as “Shanghai Zhengben Investment Consultant Partnership Enterprise”). Accordingly, each of Shanghai Yikun and Zhang Yong is deemed to be interested in Shanghai Zhengben’s interest in the Company. Shanghai Yikun and Zhang Yong further held the Company’s interest through another controlled corporation.
(4) Zhou Yufeng held 99% of the equity interest in Shanghai Shanyao, and Shanghai Shanyao held 99.79% of the equity interest in Shanghai Zhenghua. Accordingly, each of Shanghai Shanyao and Zhou Yufeng is deemed to be interested in Shanghai Zhenghua’s interest in the Company.
(5) Jingwei Textile held 37.47% of the equity interest in Zhongrong International;. Zhongrong International wholly owned Zhongrong Dingxin; Zhongrong Dingxin held 80% of the equity interest in Zhongrong Yicheng; Zhongrong Yicheng held 0.01% of the equity interest in Shanghai Danruo and is the general partner; and Shanghai Danruo held 72.69% of the equity interest in Shanghai Guonian (formerly known as Shanghai Guonian Investment Consultant Partnership Enterprise). Accordingly, each of Shanghai Danruo, Zhongrong Yicheng, Zhongrong Dingxin, Zhongrong International and Jingwei Textile is deemed to be interested in Shanghai Guonian’s interest in the Company.
(6) Spring China is beneficially owned by Zhao Jun and Chi Rui.

- 23 -
Save as disclosed above, as at 30 June 2016, no person, other than the directors and supervisors of the Company, whose interests are set out in the section “Directors’ and supervisors’ interests and short positions in shares and underlying shares” above, had registered an interest or short position in the shares or underlying shares of the Company that was required to be recorded pursuant to Section 336 of the SFO.
DIRECTORS’ INTERESTS IN A COMPETING BUSINESS
During the year and up to the date of this report, none of the directors of the Company had an interest in a business which competes or is likely to compete, either directly or indirectly, with the businesses of the Group, as defined in the Rules Governing the Listing of Securities on the Stock Exchange (the “Listing Rules”).
CORPORATE GOVERNANCE
The Company has complied with the code provisions as set out in the Code on Corporate Governance Practices contained in Appendix 14 of the Listing Rules throughout the half-year ended 30 June 2016.
AUDIT COMMITTEE
The Company has an audit committee which was established with written terms of reference in compliance with the Listing Rules and Corporate Governance Code and Corporate Governance Report as set out in Appendix 14 of the Listing Rules. The primary duties of the audit committee are to review and supervise the financial reporting process and internal control system of the Group. At the date of this announcement, the audit committee comprises three independent non-executive directors Mr. Cheung Wing Keung, Mr. Guo Li and Mr. Lin Fujiang. The Group’s unaudited financial statements for the half-year ended 30 June 2016 have been reviewed by the committee, who were of the opinion that such statements complied with the applicable accounting standards, the Listing Rules and legal requirements, and that adequate disclosures had been made.
CODE OF CONDUCT REGARDING SECURITIES TRANSACTIONS BY DIRECTORS
The Company has adopted a code of conduct on terms no less exacting than the Model Code for Securities Transactions by Directors of Listed Issuers at the Appendix 10 of the Listing Rules. Having made specific enquiry to all directors, the directors have complied with such code of conduct and the required standard throughout the half-year ended 30 June 2016.

- 24 -
PURCHASE, SALE OR REDEMPTION OF THE COMPANY’S LISTED SECURITIES
During the half-year ended 30 June 2016, neither the Company, nor any of its subsidiaries purchased, redeemed or sold any of the Company’s listed securities.
By Order of the BoardShanghai Fudan Microelectronics Group Company Limited*
Jiang GuoxingChairman
Shanghai, PRC, 23 August 2016
As at the date of this report, the Company’s executive directors are Mr. Jiang Guoxing, Mr. Shi Lei, Mr. Yu Jun and Ms. Cheng Junxia; the non-executive directors are Ms. Zhang Qianling, Mr. Ma Zhicheng, Mr. Yao Fuli and Ms. Zhang Huajing; the independent non-executive directors are Mr. Cheung Wing Keung, Mr. Guo Li, Mr. Chen Baoying and Mr. Lin Fujiang.
* For identification purpose only


![INTANGIBLE VALUE –FACT OR FICTION - AI Home | … · [IAS 38.8] 3. INTANGIBLE VALUE –FACT OR FICTION ... 2.36 INTANGIBLE PROPERTY (INTANGIBLE ASSETS): Non-physical assets, …](https://static.fdocuments.in/doc/165x107/5af0812f7f8b9ac2468e1bc2/intangible-value-fact-or-fiction-ai-home-ias-388-3-intangible-value.jpg)