© Infosys Technologies Limited 2002-2003 Performance of Infosys for the Fourth Quarter and Year...
30
© Infosys Technologies Limited 2002-2003 Performance of Infosys for the Fourth Quarter and Year ended March 31, 2003 Nandan M. Nilekani Chief Executive Officer, President and Managing Director
-
Upload
conrad-cobb -
Category
Documents
-
view
224 -
download
0
Transcript of © Infosys Technologies Limited 2002-2003 Performance of Infosys for the Fourth Quarter and Year...

© Infosys Technologies Limited 2002-2003
Performance of Infosys for the Fourth Quarter and Year ended March 31, 2003
Nandan M. NilekaniChief Executive Officer, President and Managing Director
Slide 2© Infosys Technologies Limited 2002-2003
Safe HarbourSafe Harbour
Certain statements in this release concerning our future growth prospects are forward-looking statements, which involve a number of risks, and uncertainties that could cause actual results to differ materially from those in such forward-looking statements. The risks and uncertainties relating to these statements include, but are not limited to, risks and uncertainties regarding fluctuations in earnings, our ability to manage growth, intense competition in IT services including those factors which may affect our cost advantage, wage increases in India, our ability to attract and retain highly skilled professionals, time and cost overruns on fixed- price, fixed-time frame contracts, client concentration, restrictions on immigration, our ability to manage our international operations, reduced demand for technology in our key focus areas, disruptions in telecommunication networks, our ability to successfully complete and integrate potential acquisitions, liability for damages on our service contracts, the success of the companies in which Infosys has made strategic investments, withdrawal of governmental fiscal incentives, political instability, legal restrictions on raising capital or acquiring companies outside India, and unauthorized use of our intellectual property and general economic conditions affecting our industry. Additional risks that could affect our future operating results are more fully described in our United States Securities and Exchange Commission filings including our Annual Report on Form 20-F for the fiscal year ended March 31, 2002 and Quarterly Reports on Form 6-K for the quarters ended June 30, 2002, September 30, 2002 and December 31, 2002. These filings are available at www.sec.gov. Infosys may, from time to time, make additional written and oral forward looking statements, including statements contained in the company’s filings with the Securities and Exchange Commission and our reports to shareholders. The company does not undertake to update any forward-looking statement that may be made from time to time by or on behalf of the company.

© Infosys Technologies Limited 2002-2003 Slide 3
AgendaAgenda
Financial Performance
Operational Performance
Client Acquisition & Expansion of Services
Human Resources
Capex and Infrastructure
Outlook for the Future
Summary

© Infosys Technologies Limited 2002-2003
Financial Performance
© Infosys Technologies Limited 2002-2003 Slide 5
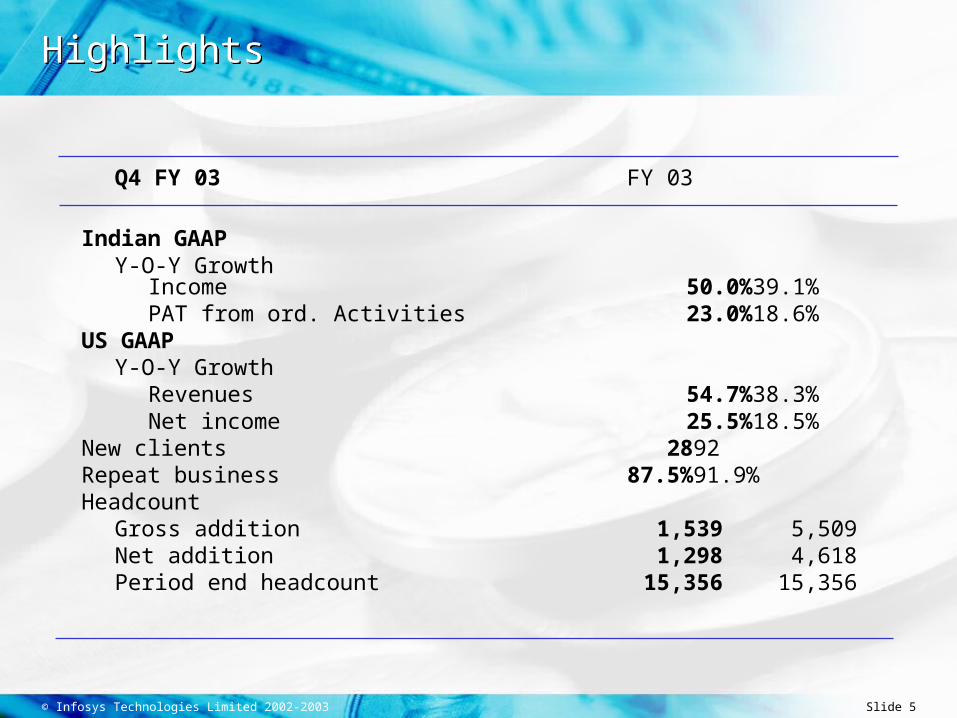
HighlightsHighlights
Q4 FY 03 FY 03
Indian GAAPY-O-Y Growth
Income 50.0% 39.1%PAT from ord. Activities 23.0% 18.6%
US GAAPY-O-Y Growth
Revenues 54.7% 38.3%Net income 25.5% 18.5%
New clients 28 92Repeat business 87.5% 91.9%Headcount
Gross addition 1,539 5,509Net addition 1,298 4,618Period end headcount 15,356 15,356
© Infosys Technologies Limited 2002-2003 Slide 6
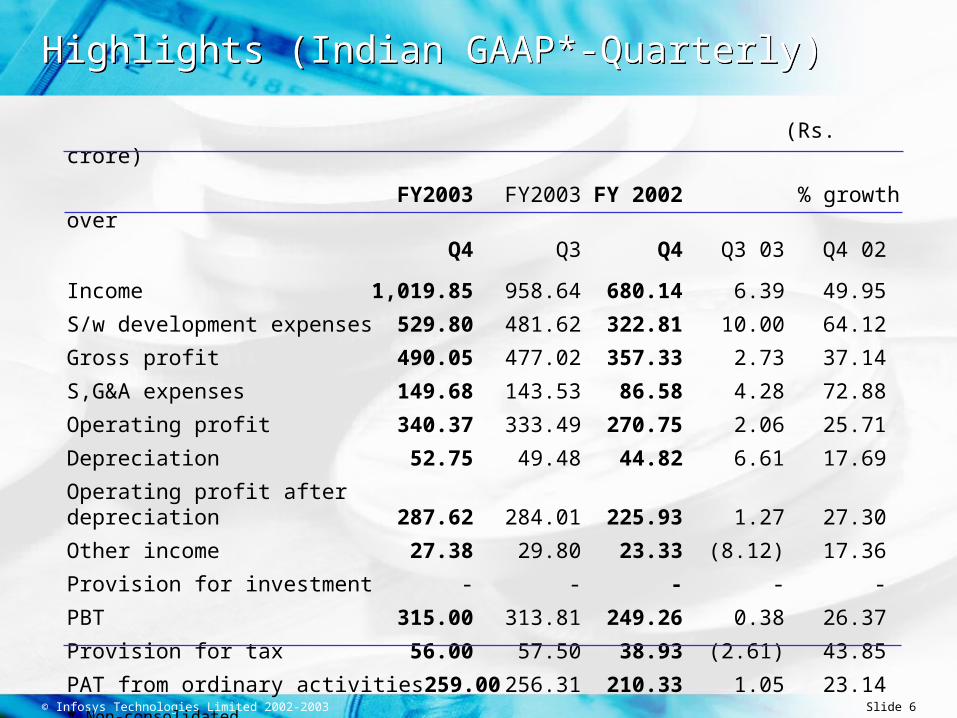
Highlights (Indian GAAP*-Quarterly)Highlights (Indian GAAP*-Quarterly)
(Rs. crore)
FY2003 FY2003 FY 2002 % growth overQ4 Q3 Q4 Q3 03 Q4 02
Income 1,019.85 958.64 680.14 6.39 49.95
S/w development expenses 529.80 481.62 322.81 10.00 64.12
Gross profit 490.05 477.02 357.33 2.73 37.14
S,G&A expenses 149.68 143.53 86.58 4.28 72.88
Operating profit 340.37 333.49 270.75 2.06 25.71
Depreciation 52.75 49.48 44.82 6.61 17.69
Operating profit after depreciation 287.62 284.01 225.93 1.27 27.30
Other income 27.38 29.80 23.33 (8.12) 17.36
Provision for investment - - - - -
PBT 315.00 313.81 249.26 0.38 26.37
Provision for tax 56.00 57.50 38.93 (2.61) 43.85
PAT from ordinary activities 259.00 256.31 210.33 1.05 23.14
* Non-consolidated
© Infosys Technologies Limited 2002-2003 Slide 7
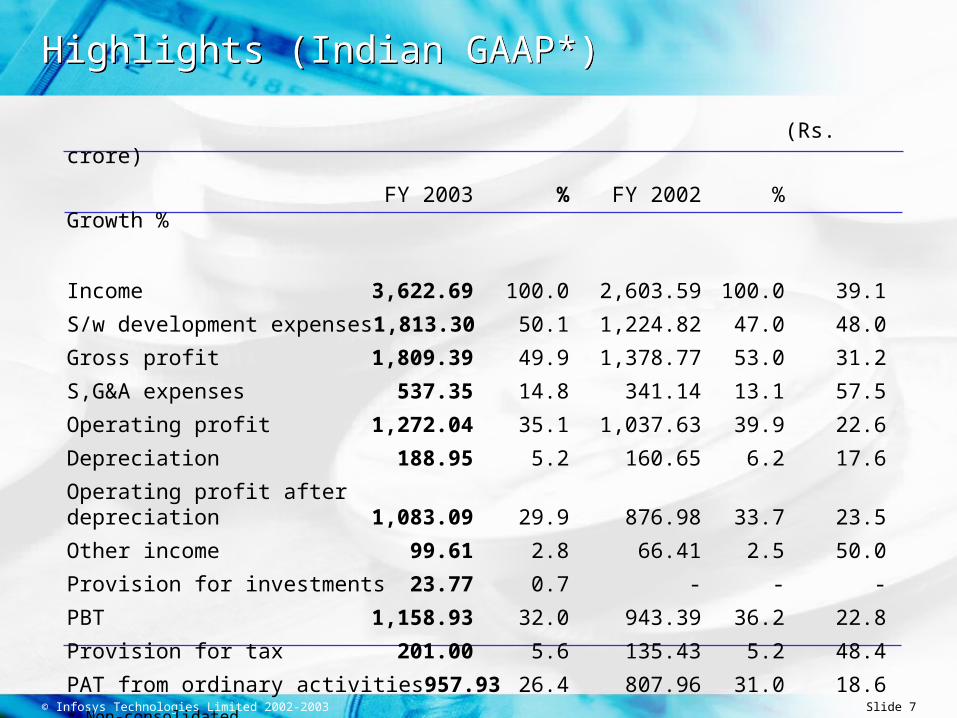
Highlights (Indian GAAP*)Highlights (Indian GAAP*)
(Rs. crore)
FY 2003 % FY 2002 % Growth %
Income 3,622.69 100.0 2,603.59 100.0 39.1
S/w development expenses 1,813.30 50.1 1,224.82 47.0 48.0
Gross profit 1,809.39 49.9 1,378.77 53.0 31.2
S,G&A expenses 537.35 14.8 341.14 13.1 57.5
Operating profit 1,272.04 35.1 1,037.63 39.9 22.6
Depreciation 188.95 5.2 160.65 6.2 17.6
Operating profit after depreciation 1,083.09 29.9 876.98 33.7 23.5
Other income 99.61 2.8 66.41 2.5 50.0
Provision for investments 23.77 0.7 - - -
PBT 1,158.93 32.0 943.39 36.2 22.8
Provision for tax 201.00 5.6 135.43 5.2 48.4
PAT from ordinary activities 957.93 26.4 807.96 31.0 18.6
* Non-consolidated
© Infosys Technologies Limited 2002-2003 Slide 8
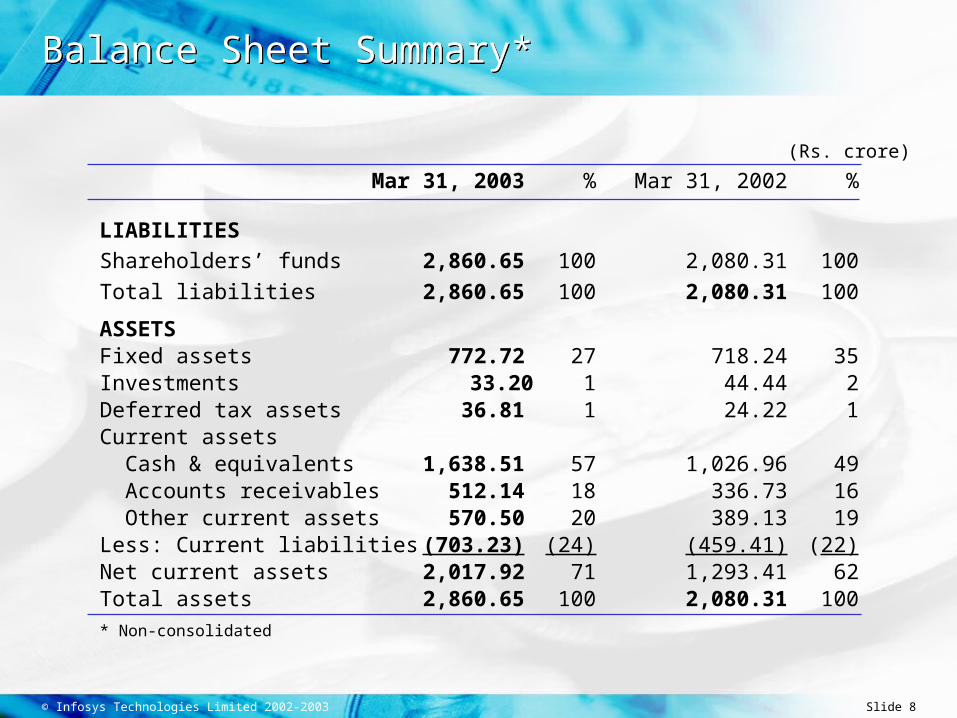
Balance Sheet Summary*Balance Sheet Summary*
(Rs. crore)
Mar 31, 2003 % Mar 31, 2002 %
LIABILITIES
Shareholders’ funds 2,860.65 100 2,080.31 100
Total liabilities 2,860.65 100 2,080.31 100
ASSETS Fixed assets 772.72 27 718.24 35Investments 33.20 1 44.44 2Deferred tax assets 36.81 1 24.22 1Current assets Cash & equivalents 1,638.51 57 1,026.96 49 Accounts receivables 512.14 18 336.73 16 Other current assets 570.50 20 389.13 19Less: Current liabilities (703.23) (24) (459.41) (22)Net current assets 2,017.92 71 1,293.41 62Total assets 2,860.65 100 2,080.31 100
* Non-consolidated
© Infosys Technologies Limited 2002-2003 Slide 9
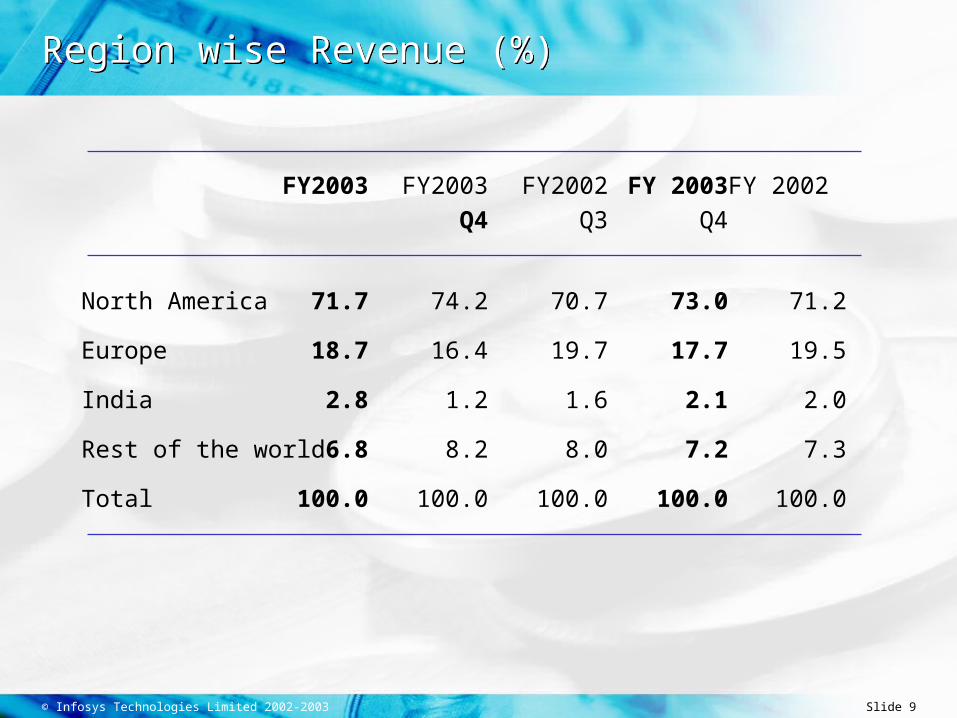
Region wise Revenue (%)Region wise Revenue (%)
FY2003 FY2003 FY2002 FY 2003FY 2002
Q4 Q3 Q4
North America 71.7 74.2 70.7 73.0 71.2
Europe 18.7 16.4 19.7 17.7 19.5
India 2.8 1.2 1.6 2.1 2.0
Rest of the world 6.8 8.2 8.0 7.2 7.3
Total 100.0 100.0 100.0 100.0 100.0

© Infosys Technologies Limited 2002-2003
Operational Performance
© Infosys Technologies Limited 2002-2003 Slide 11
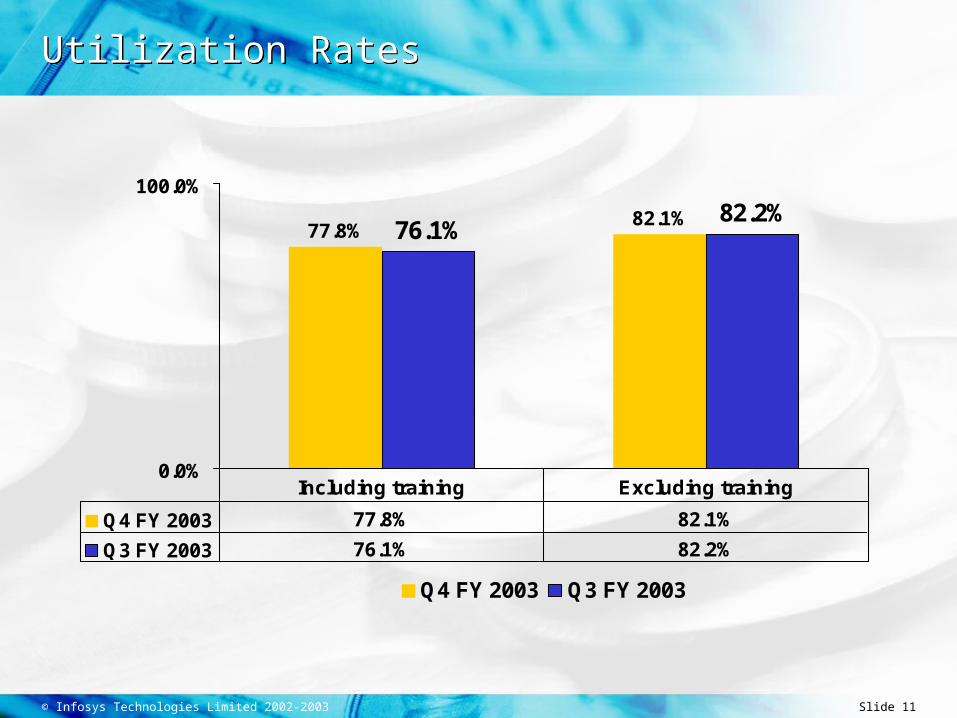
Utilization RatesUtilization Rates
82.1%76.1%82.2%
77.8%
0.0%
100.0%
Q4 FY 2003 Q3 FY 2003
Q4 FY 2003 77.8% 82.1%
Q3 FY 2003 76.1% 82.2%
Including training Excluding training
© Infosys Technologies Limited 2002-2003 Slide 12
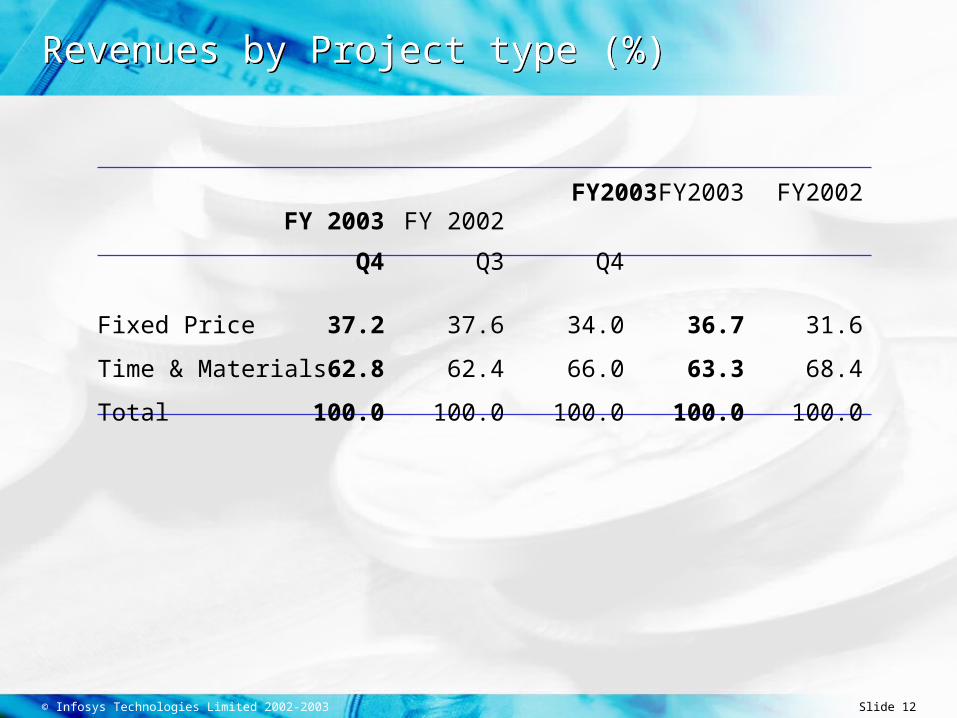
Revenues by Project type (%)Revenues by Project type (%)
FY2003 FY2003 FY2002 FY 2003 FY 2002
Q4 Q3 Q4
Fixed Price 37.2 37.6 34.0 36.7 31.6
Time & Materials 62.8 62.4 66.0 63.3 68.4
Total 100.0 100.0 100.0 100.0 100.0
© Infosys Technologies Limited 2002-2003 Slide 13
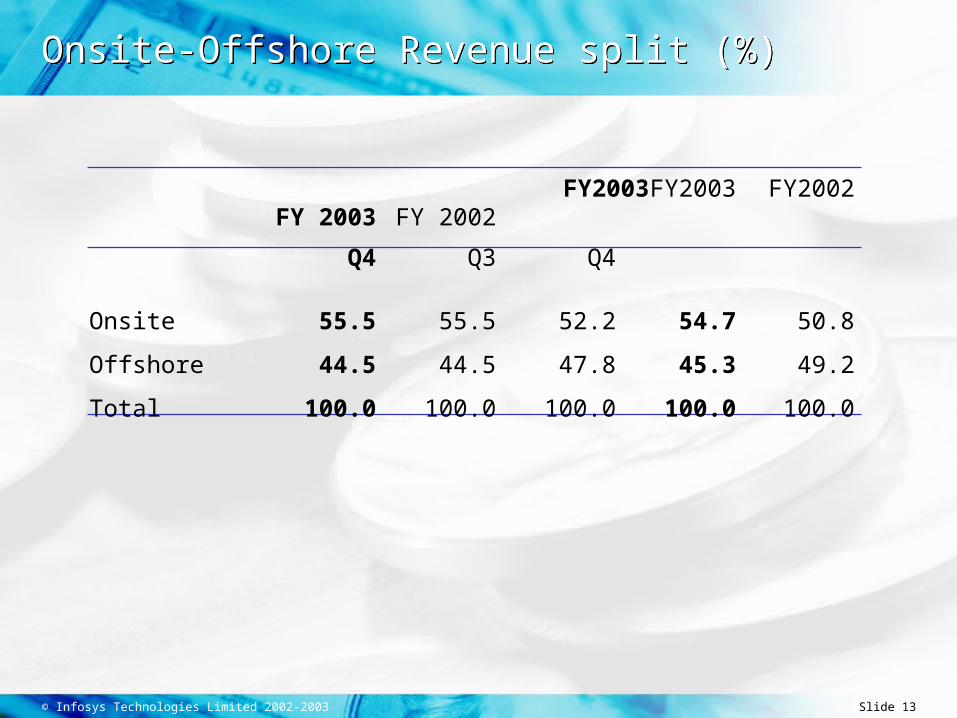
Onsite-Offshore Revenue split (%)Onsite-Offshore Revenue split (%)
FY2003 FY2003 FY2002 FY 2003 FY 2002
Q4 Q3 Q4
Onsite 55.5 55.5 52.2 54.7 50.8
Offshore 44.5 44.5 47.8 45.3 49.2
Total 100.0 100.0 100.0 100.0 100.0
© Infosys Technologies Limited 2002-2003 Slide 14
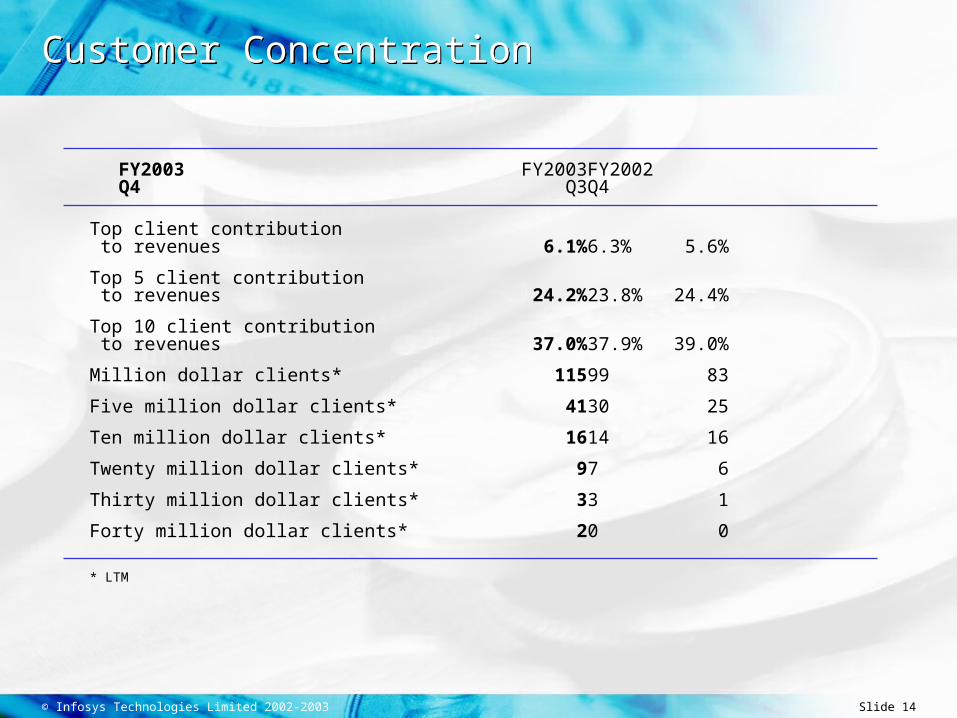
Customer ConcentrationCustomer Concentration
FY2003 FY2003 FY2002Q4 Q3 Q4
Top client contribution to revenues 6.1% 6.3% 5.6%
Top 5 client contribution to revenues 24.2% 23.8% 24.4%
Top 10 client contribution to revenues 37.0% 37.9% 39.0%
Million dollar clients* 115 99 83
Five million dollar clients* 41 30 25
Ten million dollar clients* 16 14 16
Twenty million dollar clients* 9 7 6
Thirty million dollar clients* 3 3 1
Forty million dollar clients* 2 0 0
* LTM
© Infosys Technologies Limited 2002-2003 Slide 15
Other HighlightsOther Highlights
Software revenues in US dollar terms grew by 7.7% for the
quarter as compared to the quarter ended December 31,
2002. Revenue growth comprised a volume growth of 12.8%
offset by a price decline of 5.1%, as compared to the quarter
ended December 31, 2002.

© Infosys Technologies Limited 2002-2003
Client Acquisition & Expansion of Services
© Infosys Technologies Limited 2002-2003 Slide 17
Client Acquisition & Expansion of ServicesClient Acquisition & Expansion of Services
Client acquisitions during the quarter were 28
Strengthened its presence in financial services industry Completed the launch of a new client account analysis and reporting tool
for one of the largest private banking businesses in the world
Engaged by the North American subsidiary of a global insurance
brokerage for developing IT solutions in the policy management and
premium accounting functions
Worked with Microsoft for a leading telecom company in the APAC
region for developing a ‘proof of concept’ using the .NET platform for its
‘Next Generation OSS’ system
Selected by Nextel Partners Inc., a leading provider of digital wireless
communication services for testing its upcoming billing system software
© Infosys Technologies Limited 2002-2003 Slide 18
Client Acquisition & Expansion of ServicesClient Acquisition & Expansion of Services
Electronics and engineering space Working with a world leader in high-performance signal processing
solutions on an IT outsourcing engagement
Selected by a leading distributor of passive, interconnect and electromechanical components to define the IT architecture for a key business transformation initiative.
Enhanced presence in manufacturing space Delivered a consolidation strategy and sourcing plan for the IT
architecture support groups of a leading global automotive company
Worked with easyCar to ensure the performance, scalability and availability of its on-line booking and operations website as well as to provide enhanced functionality
© Infosys Technologies Limited 2002-2003 Slide 19
Client Acquisition & Expansion of ServicesClient Acquisition & Expansion of Services
Continued progress in the life sciences and pharmaceutical markets
Wins include a global leader in contract research, an European biotechnology leader and an emerging India-based global pharmaceutical company
Working with the US division of a global pharmaceutical leader on a performance management dashboard for its senior executives
In the retail industry, prestigious new clients include a global multi-channel retailer
© Infosys Technologies Limited 2002-2003 Slide 20
Banking ProductsBanking Products
Banking Business Unit continued to expand its presence both within and outside India
Increased acceptance for FINACLETM
Canara Bank signed up with Infosys for the use of its FINACLETM
eChannels and for FINACLETM eCorporateA leading private sector bank headquartered in Mumbai signed up
for FINACLETM Core BankingUnion Bank of India went live with FINACLETM Core Banking across
several branchesAcceptance for FINACLETM by Bank of Bahrain and Kuwait, India

© Infosys Technologies Limited 2002-2003
Human Resources
© Infosys Technologies Limited 2002-2003 Slide 22
Human ResourcesHuman Resources
Total employee strength at 15,356 as on March 31, 2003,
up from 14,058 as on December 31, 2002
Net addition of 1,298 employees during the quarter as
compared to 948 during the quarter ended December 31,
2002
Gross addition of employees during the quarter was 1,539,
out of which 363 were laterals
14,001 software professionals as on March 31, 2003, up
from 12,801 as on December 31, 2002
Of these software professionals, 572 belong to the Banking
Business Unit
© Infosys Technologies Limited 2002-2003
Capex and Infrastructure
© Infosys Technologies Limited 2002-2003 Slide 24
Capex and InfrastructureCapex and Infrastructure
Capital expenditure of Rs. 70.6 cr was incurred during the
quarter
As on March 31, 2003, the company had 34,31,350 sq. ft of
space capable of accommodating 16,970 professionals and
4,07,400 sq. ft under completion capable of
accommodating 3,300 professionals

© Infosys Technologies Limited 2002-2003
Outlook for the Future
© Infosys Technologies Limited 2002-2003 Slide 26
Indian GAAP – Non-consolidatedIndian GAAP – Non-consolidated
Quarter ending June 30, 2003 Income from software development services and products is
projected to be between Rs. 1,033 cr to Rs. 1,043 cr
Earnings per share is expected to be between Rs. 38.6 and Rs.
38.8
Fiscal year ending March 31, 2004 Income from software development services and products is
projected to be between Rs. 4,408 cr to Rs.4,479 cr
Earnings per share is expected to be between Rs. 161 to Rs. 163
© Infosys Technologies Limited 2002-2003 Slide 27
Indian GAAP – ConsolidatedIndian GAAP – Consolidated
Quarter ending June 30, 2003 Income is projected to be between Rs. 1,043 cr to Rs. 1,054 cr
Earnings per share is expected to be between Rs. 38.7 and Rs.
38.9
Fiscal year ending March 31, 2004 Income is projected to be between Rs. 4,484 cr to Rs.4,565 cr
Earnings per share is expected to be between Rs. 162 to Rs. 164
© Infosys Technologies Limited 2002-2003
Summary
© Infosys Technologies Limited 2002-2003 Slide 29
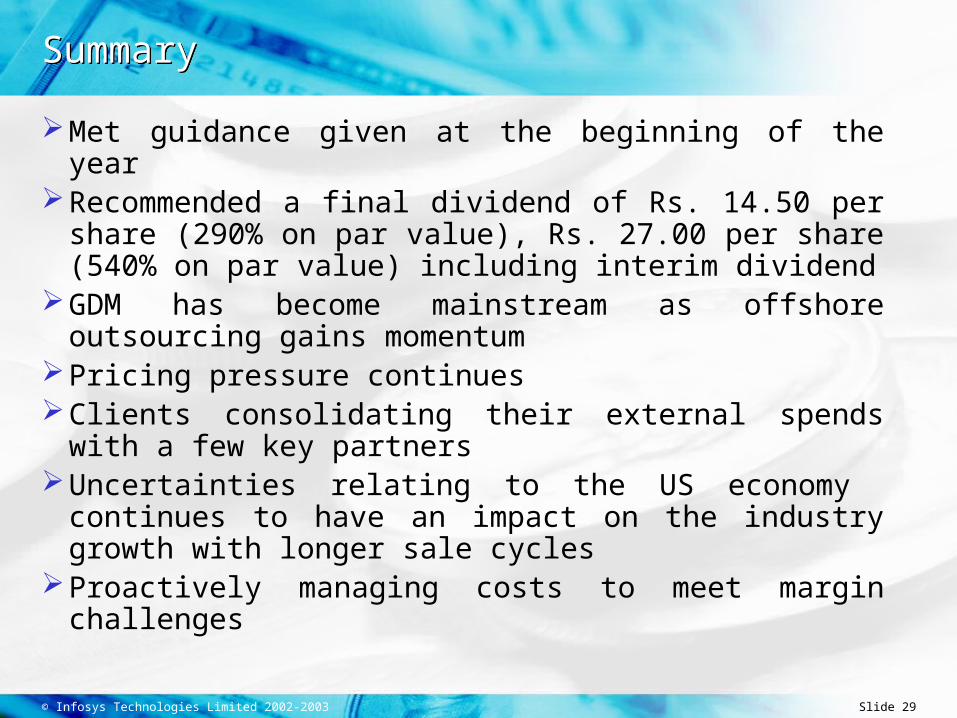
SummarySummary
Met guidance given at the beginning of the yearRecommended a final dividend of Rs. 14.50 per share
(290% on par value), Rs. 27.00 per share (540% on par value) including interim dividend
GDM has become mainstream as offshore outsourcing gains momentum
Pricing pressure continuesClients consolidating their external spends with a few key
partnersUncertainties relating to the US economy continues to
have an impact on the industry growth with longer sale cycles
Proactively managing costs to meet margin challenges

© Infosys Technologies Limited 2002-2003
Thank You