DTIC · III Sl DEVELOPMENT OF A FIELD METHOD TO MEASURE OUT-OF-FLATNESS OF STRUCTURAL STEEL PLATES...
58
AD-A268 008 DTIC ELECrv]t SAUG1713D SEle Dnistribu$*5 93-19054
Transcript of DTIC · III Sl DEVELOPMENT OF A FIELD METHOD TO MEASURE OUT-OF-FLATNESS OF STRUCTURAL STEEL PLATES...

AD-A268 008
DTICELECrv]t
SAUG1713DSEle
Dnistribu$*5
93-19054

III
Sl
DEVELOPMENT OF A FIELD METHOD TO MEASURE
OUT-OF-FLATNESS OF STRUCTURAL
STEEL PLATES
Accesion For
NTIS CRA&M
DTIC TAB 0UnannouncedJustification
By ...........................Distribution I
Availability Codes
Avail and IorDist Special
SI 10
APPROVED: WIC QUALM IN PECTD 3
Supervisor: ,,._',l-
Michael D. Engefhardt
Karl H. Frank
DEVELOPMENT OF A FIELD METHOD TO MEASURE
OUT-OF-FLATNESS OF STRUCTURAL
STEEL PLATES
by
TODD T. TAMURA, B.S.
THESIS
Presented to the Faculty of the Graduate School of
The University of Texas at Austin
in Partial Fulfillment
of the Requirements
for the Degree of S
MASTER OF SCIENCE IN ENGINEERING
THE UNIVERSITY OF TEXAS AT AUSTIN
AUGUST 1993
TABLE OF CONTENTS
Chapter Page
INTRODUCTION 11.1 Background and Purpose Statement 1
1.2 Summary and Organization of Thesis 1
2 PRELIMINARIES 3
2.1 Out-of-Flatness Defined 32.2 Requirements for Measuring Out-of-Flatness 3
3 MEASURING OUT-OF-FLATNESS: METHODOLOGY
AND DEVICES 53.1 Methodology 5
3.1.1 Scheme of Measurement 53.1.2 Data Reduction 6
3 1.3 Presentation of Results 8
3.2 Devices 9
3.2.1 Manual Rotating Beam Laser Level 93.2.2 Precision Leveling Rod 12
4 DEMONSTRATION AND VALIDATION 13
4.1 Preliminary Remarks 13
4.1.1 Laser Safety 13
4.1.2 Instrument Calibratioa 14
4.2 Measurement of a Granite Surface Table 14
4.2.1 General 14
4.2.2 Test Setup 154.2.3 Results 17
4.2.3.1 Accuracy 17
iiio

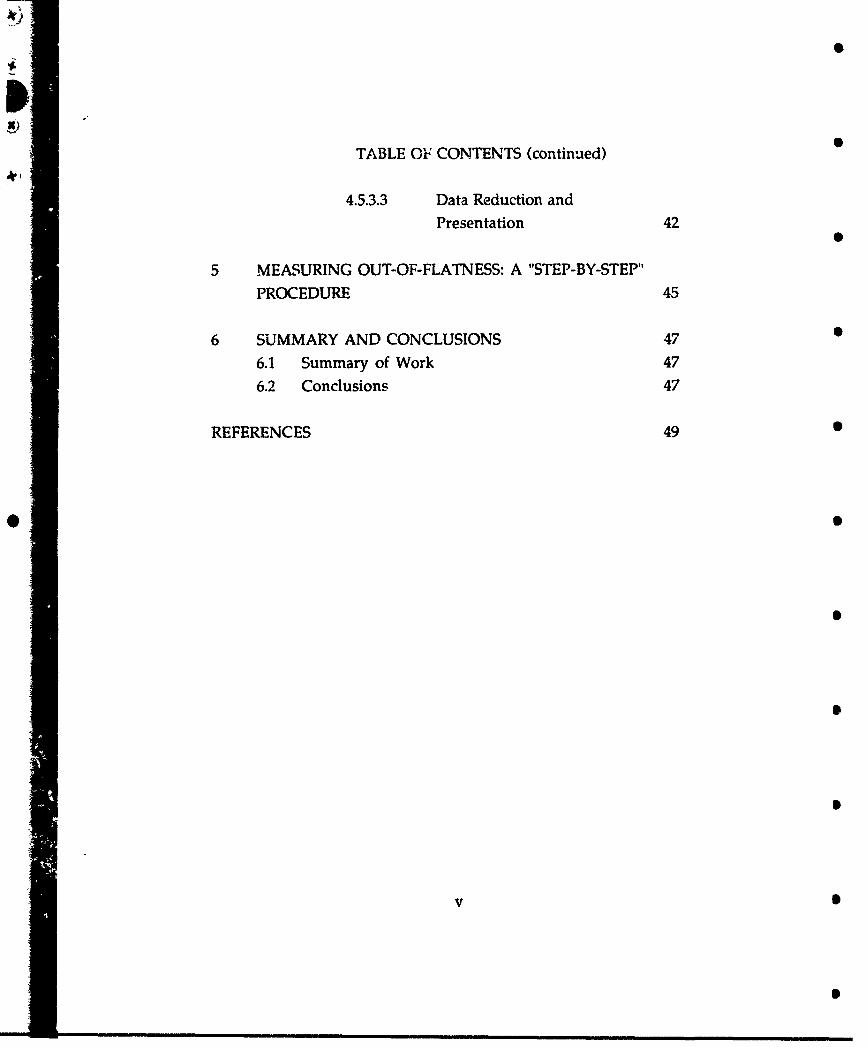
TABLE OF CONTENTS (continued)
4.2.3.2 Range 17
4.2.3.3 Time 17
4.2.3.4 Laser Detector 18
4.2.3.5 Data Reduction and
Presentation 18
4.3 Measurement of a Plate Specimen with Noticeable
Curvature 24
4.3.1 General 244.3.2 Test Setup 24
4.3.3 Results 25
4.3.3.1 Accuracy 25
4.3.3.2 Time 254.3.3.3 Data Reduction and
Presentation 274.4 Measurement of a Plate Girder Flange 32
4.4.1 General 32
4.4.2 Test Setup 324.4.3 Results 34
4.4.3.1 Accuracy 34
4.4.3.2 Time 34
4.4.3.3 Data Reduction an'.i
Presentation 344.4.3.4 Measurement with the
Automatic Optical Level 40
45 Measurement of a Plate Girder Web 414.5.1 General 414.5.2 Test Setup 41
4.5.3 Results 414.5.3.1 Accuracy 41
4.5.3.2 Time 42
iv •
S
iS
TABLE OF CONTENTS (continued)
4.5.3.3 Data Reduction and
Presentation 42
5 MEASURING OUT-OF-FLATNESS: A "STEP-BY-STEP"
PROCEDURE 45
6 SUMMARY AND CONCLUSIONS 47 •
6.1 Summary of Work 47
6.2 Conclusions 47
REFERENCES 49
v S
LIST OF FIG URES •
Figure Page
3.1 General scheme of measurement 5 0
3.2 Field of measurement viewed in three-dimensional
space with orthogonal axes X, Y and Z 73.3 Laser Alignment LB-5 Laser Beacon 9
3.4 Precision leveling rod with pocket level 12 0
4.1 Measuring the out-of-flatness of a granite surface table 16
4.2 Surface table 20
4.3 Surface table with "best fit" reference plane selected 23
4.4 Measuring the out-of-flatness of a plate specimen 264.5 Plate specimen measured in horizontal orientation 29
4.6 Plate specimen measured in vertical orientation 31
4.7 Measuring the out-of-flatness of a plate girder flange 334.8 Plate girder flange measured using laser method 37 0
4.9 Plate girder flange measured using automatic optical level 394.10 Measuring the out-of-flatness of a plate girder web 42
4.11 Plate girder web 44
vi S
S . .. .. ...... ... • • II m A I] J n |ib i u i Hial i a R n • n ii ib g m U n m • I I RN S
LIST OF TABLES
Table Page
4.1 Data for surface table 19 •
4.2 Data for surface table with "best fit" reference plane
selected 22
4.3 Data for plate specimen measured in horizontal
orientation 28 •
4.4 Data for plate specimen measured in vertical orientation 30
4.5 Data for plate girder flange measured using laser method 36
4.6 Data for plate girder flange measured using automatic
optic-,l level 38
4.7 Data for plate girder web 43
vii S

CHAPTER ONE
INTRODUCTION
1.1 Background and Purpose Statement
The out-of-flatness of structural steel plates in bolted
connections can prevent desired bolt tensions from being achieved,
even when specified installation procedures are used. A bolt in a
connection of out-of-flat plate elements will have a unique bolt-
loosening response because of its relative position in the connection
and its tightening order. Bolts tensioned adequately may lose asignificant portion of their tension as the joint is completed,
particularly those tightened early in the sequence.In order to correlate the out-of-flatness of structural steel plates
and its bolt-loosening effect, an efficient and accurate means of fieldmeasuring out-of-flatness is required. The purpose of this thesis is to
detail and demonstrate the devices and methodology to field measure
surface profiles of structural steel plates, like the webs and flanges ofplate girders.
1.2 Summary and Organization of ThesisS
This thesis is organized into six chapters. Chapter 2 defines out-of-flatness and establishes criteria for a method of field measuring out-
of-flatness. Chapter 3 presents a method of measurement using amanual rotating beam laser level and precision leveling rod.
Techniques for data reduction and presentation are also addressed. The
method is demonstrated and validated on a number of specimens in

2
Chapter 4. A "step-by-step" procedure is formalized in Chapter 5.
Chapter 6 presents a summary of work and conclusions.
S
S
CHAPTER TWO
PRELIMINARIES
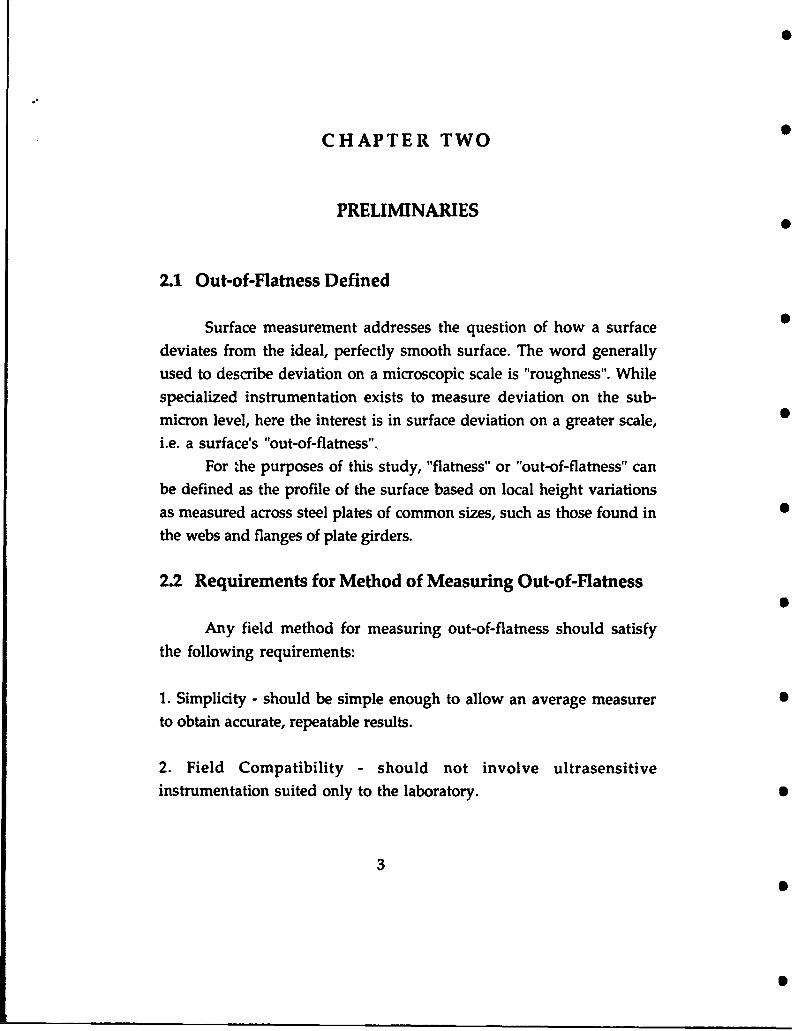
2.1 Out-of-Flatness Defined
Surface measurement addresses the question of how a surface
deviates from the ideal, perfectly smooth surface. The word generallyused to describe deviation on a microscopic scale is "roughness". Whilespecialized instrumentation exists to measure deviation on the sub-micron level, here the interest is in surface deviation on a greater scale,
i.e. a surface's "out-of-flatness".
For the purposes of this study, "flatness" or "out-of-flatness" canbe defined as the profile of the surface based on local height variations
as measured across steel plates of common sizes, such as those found in 5the webs and flanges of plate girders.
2.2 Requirements for Method of Measuring Out-of-Flatness
Any field method for measuring out-of-flatness should satisfy
the following requirements:
1. Simplicity - should be simple enough to allow an average measurer 5
to obtain accurate, repeatable results.
2. Field Compatibility - should not involve ultrasensitiveinstrumentation suited only to the laboratory. S
3

4
3. Horizontal and Vertical Surface Measurement Capability - must becapable of measuring nominally horizontal and vertical surfaces asthese represent the most common situation.
4. Economy - must be as economical as possible.
5. Accuracy - must be as accurate as possible.
6. Typical In-Plane Dimensions - must be capable of measuring surface Iareas up to several square feet, i.e, typical connection areas found onthe webs and flanges of plate girders.
I
I
I
)v
CHAPTER THREE
MEASURING OUT-OF-FLATNESS:METHODOLOGY AND DEVICES
3.1 Methodology
3.1.1 Scheme of Measurement
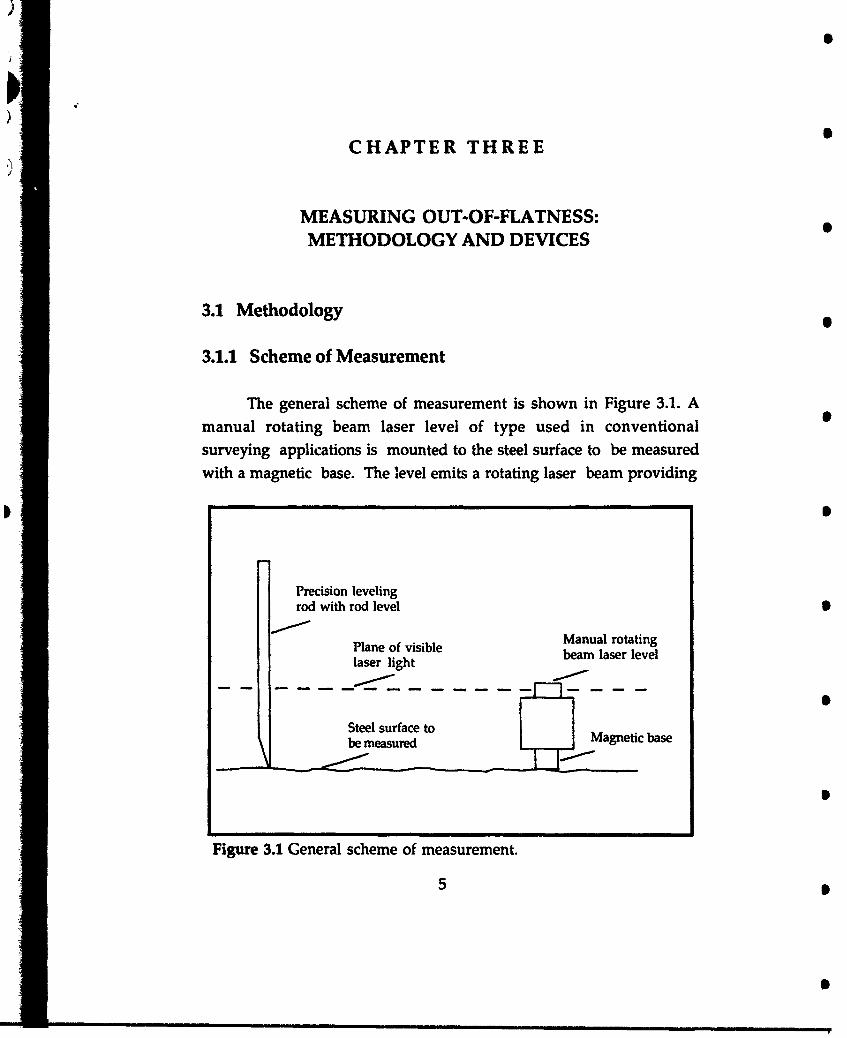
The general scheme of measurement is shown in Figure 3.1. A
manual rotating beam laser level of type used in conventional
surveying applications is mounted to the steel surface to be measured
with a magnetic base. The level emits a rotating laser beam providing
Precision levelingrod with rod level •
Plane of visible Manual rotating
laser light beam laser level
Steel surface to [
mea Magnetic base
Figure 3.1 General scheme of measurement.
5 5
6
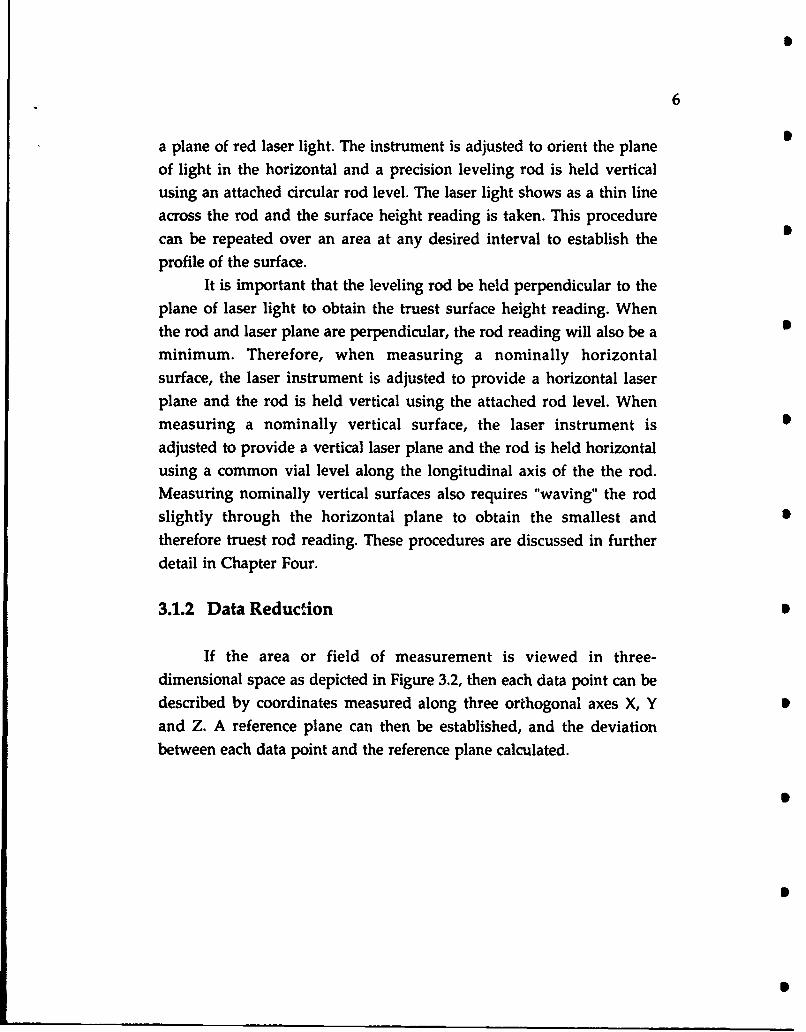
a plane of red laser light. The instrument is adjusted to orient the plane
of light in the horizontal and a precision leveling rod is held vertical
using an attached circular rod level. The laser light shows as a thin lineacross the rod and the surface height reading is taken. This procedure
can be repeated over an area at any desired interval to establish the
profile of the surface.It is important that the leveling rod be held perpendicular to the
plane of laser light to obtain the truest surface height reading. Whenthe rod and laser plane are perpendicular, the rod reading will also be a
minimum. Therefore, when measuring a nominally horizontal
surface, the laser instrument is adjusted to provide a horizontal laser
plane and the rod is held vertical using the attached rod level. When
measuring a nominally vertical surface, the laser instrument is
adjusted to provide a vertical laser plane and the rod is held horizontal
using a common vial level along the longitudinal axis of the the rod.
Measuring nominally vertical surfaces also requires "waving" the rodslightly through the horizontal plane to obtain the smallest and
therefore truest rod reading. These procedures are discussed in further
detail in Chapter Four.
3.1.2 Data Reduction
If the area or field of measurement is viewed in three-
dimensional space as depicted in Figure 3.2, then each data point can be
described by coordinates measured along three orthogonal axes X, Y
and Z. A reference plane can then be established, and the deviation
between each data point and the reference plane calculated.
St
7
YS
S
I / i/ I if /i l l I !
•1 l Il I -i i i i iI
tI!!/I I f x il/
Figure 3.2 Field of measurement viewed in three-dimensional space with orthogonal axes X, Y and Z.
A reference plane can be defined by any three non-colinear datapoints (xj, y,, z1), (x2, y2, zJ, (x3, y3, z3) using the following equation:
Y2Y 1 z2 I ZlX( +21 2ix(y-y)j2i Y2)Y1 Z-Zi=o 3.1
Y3Y z3- iz3z x3-xl •1 !I /xl Y3
Equation 3.1 can be reduced to the following form where A, B, C
and D are constants:
Ax+By+Cz+ D = 0t3.2
Ax +B+Cz+D 0 3.
S
8
The perpendicular distance between a data point (xo,ya,zo) and a
reference plane of the form above is given by
Ax0 +By 0 +Cz 0 +D 3.3
-4A2 +B2 + C2
Equations 3.1 to 3.3 can be found in standard mathematics handbooks.
(See, for example, reference 1.) The negative sign in the denominator isrequired to account for the fact that data points with the higher rod
readings are actually the lower points on the surface. The sign of theresult of Equation 3.3 indicates the distance "above" (positive) and
"below" (negative) the reference plane.
Given the coordinates for all data points, a simple computerprogram can be written to determine a reference plane based on any
three non-colinear points and the deviation of each point relative tothe reference plane. Commercial spreadsheet programs can also be used
to perform the required calculations. In this thesis, all spreadsheetcalculations and graphical representations of data were accomplishedusing Microsoft Excel, Version 4.0.
3.1.3 Presentation of Results
There are commercial programs available that can graphically
depict a three-dimensional surface profile. By magnifying the scale fordeviation from a reference plane (Z axis direction) and using features
such as grid lines, contour lines and color, the surface profile is visually
illustrated. These capabilities are demonstrated in Chapter Four.

S
9
3.2 Devices
3.2.1 Manual Rotating Beam Laser Level
The laser instrument selected for measuring out-of flatness wasthe LB-5 Laser Beacon by Laser Alignment Inc., shown in Figure 3.3.
Laser beam
- On/Off/Head SpeedControl Knob
i Level vial forlaydown operation
Level vials forShorizontal operation
Leveling screws
Figure 3.3 Laser Alignement LB-5 Laser Beacon. Shown50% actual size.
10
The LB-5 was chosen because it possessed the following
characteristics:
1. Manual leveling capability
2. Visible laser light
3. Compactness, durability and economy0
Manual leveling capability enables the LB-5 to establishhorizontal and vertical planes so nominally horizontal and vertical
surfaces can be measured. To measure a nominally horizontal surface,
a horizontal plane is established by adjusting the two leveling screws 0
to center the two level vials for horizontal operation indicated inFigure 3.3. To measure a nominally vertical surface, the LB-5 is
mounted with the vial for laydown operation facing up and a verticalplane is established by adjusting the top leveling screw to center the "
laydown vial.
The importance of manual leveling capability is seen in the fact
that so-called automatic or "self-leveling" levels of the laser and optical
type cannot establish planes outside the horizontal. They employ a -gravity-referenced prism or mirror compensator to orient the beam or
line-of-sight (LOS). The instrument is typically leveled using a circular
spirit level; when the bubble is centered (or nearly so), the compensator
takes over and maintains a horizontal beam or LOS, even if theinstrument is slightly moved (3). If such an automatic level were tilted
to achieve a plane out of the horizontal, the compensator would
continue to maintain a horizontal reference to the limits of its stops.
Beyond this point performance is completely unreliable and in most S
cases automatic laser levels will automatically shut down (3). In
addition, automatic leveling capability adds cost, weight and bulkiness
to the laser unit.S
11
The LB-5 is called a visible beam instrument because it houses a
visible Helium-Neon (HeNe) laser which produces a characteristic
bright red beam. The ON/OFF/Head Speed Control Knob turns the
laser on and off, and determines the rate of rotation. At operating
speeds, the LB-5 produces a laser plane which appears on the leveling
rod as a thin line of red light. This allows a single measurer to orient
the instrument for horizontal or vertical operation, turn it on, and take
readings directly off the rod.
It should be noted that many laser levels are classified as
invisible beam instruments because the beam falls in the infra-red
portion of the electro-magnetic spectrum. These beams can only be
detected with .he aid of a laser detector. While the LB-5 produces a
visible beam, it also comes equipped with a laser detector since the
beam can be electronically detected at far greater ranges than it can be
seen on a leveling rod with the human eye. Over the short distancesassociated with out-of-flatness measurement, visual readings are easily
taken off the rod. But the laser detector is evaluated as an alternative
device for taking rod readings in Chapter Four.Finally, the compactness, durability and economy of the LB-5
make it ideally suited to measuring out-of-flatness. With a 4"X4" base
and 7" height, the unit can be used on small or congested surface areas.
Self-contained power in the form of four "c" cell batteries adds to this
flexibility. Weighing only 3.5 pounds, the LB-5 is safely mounted to
steel surfaces with a magnetic base. The LB-5 is a purpose-built
surveying instrument designed for use on everyday construction sites.
It is shock and water resistant, and dustproof, but it is not
indestructible. As with all surveying equipment, it must be handled
with care to maximize performance and service life. Based on 1993
prices, the LB-5 has a manufacturer's suggested retail price of $1400 (2)which includes the accessory laser detector and laydown bracket.
Admittedly, economy is always a relative term, but it should be noted
that many conventional optical levels are more expensive. In addition,

12
like most surveying equipment, the LB-5 can be rented for a reasonable
fee from most distributors.
3.2.2 Precision Leveling Rod
A precision leveling rod was developed for measuring out-of-flatness and is shown in Figure 3.4. The rod was made from an 18"rigid steel rule. It has graduations in 10ths, 50ths and 100ths of an inch,
allowing precise rod readings.. The end of the rod is tape3red to allo vpositioning at discrete points on the measured surface. An attachedcircular rod level is used to hold the rod vertical. A small pocket level,also shown, can be secured along the longitudinal axis of the rod tohold the rod horizontal.
Figure 3.4 Precision leveling rod with pocket level.

CHAPTER FOUR
DEMONSTILATION AND VALIDATION
4.1 Preliminary Remarks
The laser method of measuring out-of-flatness outlined inChapter Three was used on several specimens: a granite surface table, aplate specimen with noticeable curvature, and the top flange and webof a plate girder. Before a presentation of the results, a brief discussionof laser safety and instrument calibration are in order.
4.1.1 Laser Safety
Users of laser surveying equipment should be aware that eventhough the lasers being used are relatively low-powered, there is still apotential hazard of damage to the retina of the eye; if this damage takesplace, no pain is necessarily felt and vision may not be severelyimpaired, although it will deteriorate with repeated exposures (3).
In the United States, the agency responsible for setting safety
standards for the manufacturers of laser products is the Center forDevices and Radiological Health (CDRH) of the US Department of
Health and Human Services (3). The CDRH produces a standard
entitled "Performance Standard for Laser Products" (3), the last versionof which was published in 1985. In accordance with this standard, theLB-5 is classified as a CLASS IlIa laser product based on the potentialhazard of its emissions (4). Required certification and warning labelsare also fixed to the unit (4). The safety instructions in the LB-5'sOperation Manual r'ead as follows: S
13
S

14
The LB-5 contains a semiconductor laser diode with awavelength of 650 nanometers and is red in color, Itscontinuous output is 5 milliwatts or less. Never staredirectly into the laser beam or view the beam with opticalinstruments. Whenever possible, set the unit above orbelow eye level. Turn the laser off when not in use. Donot point the laser unnecessarily at others.
Fortunately, accidents caused by misuse of the low-poweredlasers used in construction surveying are virtually nil (3).Nevertheless, care must always be exercised when working with lasers.The bottom line is that safety instructions included with any laserproduct must be read and adhered to.
4.1.2 Instrument Calibration
Before measurements are made, the LB-5, like any surveyinginstrument, should be properly calibrated. Calibration is required toensure the laser beam rotates through a true horizontal or verticalplane. Calibration instructions are included in the LB-5's OperationManual. These instructions will not be included here as the procedureis simple to follow and should be done routinely as on any surveying
instrument.
4.2 Measurement of a Granite Surface Table
4.2.1 General
The purpose of measuring a granite surface table was to see if theiaser method of measurement would verify what was already knownto be true - that the surface table is extremely flat. The LB-5'saccompanying laser detector was evaluated as an alternative device to

S
15
take rod readings. The effect of choosing a "best fit" reference plane fordata reduction and presentation was also investigated.
4.2.2 Test Setup
The specimen measured was a Mitutoyo black granite surfacetable. The size of the plate was 18"X24" with a 4" thickness. Rated a "B"or "shop grade" surface table, its accuracy is guaranteed to 260millionths of an inch or 0.0003" (5). The interpretation of this value isthat all points on the surface of the table will be contained between twoparallel planes 0.0003" apart (6).
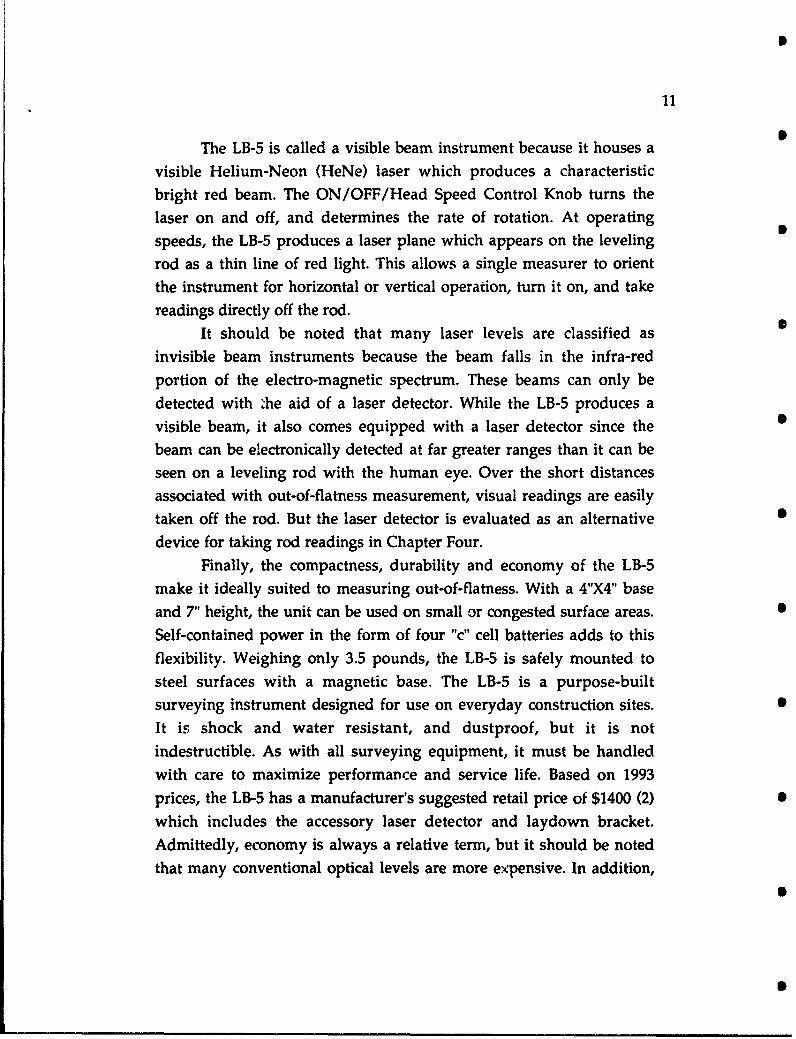
A 12"X12" measuring field was drawn on the table's surface inremovable china marker. Establishing an X and Y axis, and an interval Sof 1" along each, a grid of 169 points was created. The LB-5 was placedon the granite surface (without magnetic base), leveled in thehorizontal, and turned on. The leveling rod was held vertical using theattached rod level. Surface height readings were taken at each grid •point as shown in Figure 4.1(a).
Readings were also taken using the LB-5's laser detector, as
shown in Figure 4.1(b). The laser detector was typical of detectorsassociated with laser surveying equipment. Both visual and audio Sindications of beam detection are provided. The detector was slowlyslid down the rod so as to always approach the beam from the samedirection. On first detection of the beam, the detector was clamped tothe rod, and the reading taken off the rod. S
16
(a)
(b)
Figure 4.1 Measuring the out-of-flatness of a granite surface table. (a)Direct reading of the rod; (b) Using a laser detector to obtain rodreadings.
S
17
4.2.3 Results
4.2.3.1 Accuracy
The narrower the laser beam as it strikes the rod, the better the
read. It was found that the beam could be narrowed by placing small
strips of black electrical tape on the top and bottom edge of the laser'sexit aperture. It was possible to narrow the beam's width toapproximately 0.02". The center of the beam was estimated on the rod,and rod readings could be estimated to the nearest 0.01". It is necessaryto estimate beam center on the rod rather than read the top or bottomedge of the beam as beam width varies slightly with range and ambientlight conditions. Rod readings were easy to reproduce.
The accuracy of the laser method of measurement was within+/-0.009" as will be shown in Section 4.2.3.5.
4.2.3.2 Range
Narrowing the beam to obtain more accurate rod readings hadthe effect of reducing the range over which the laser beam could beread on the leveling rod. This range was also a function of the ambientlight conditions. Under normal interior lighting conditions, the visiblerange of the laser on the rod was over ten feet. In direct bright sunlight,this range was reduced to about five feet. However, over the shortranges associated with out-of-flatness measurement, this reduction was
determined to be inconsequential unless measuring extremely largefields.
4.2.3.3 Time
Time to measure a 12"X12" field (169 data points) was about 45
minutes or four readings and recordings per minute.
18
4.2.3.4 Laser Detector
Rod readings obtained with the laser detector were notrepeatable and varied as much as +/-0.03". In addition, suchmeticulous attention was required to obtain readings with the ",Aser
detector so as to be completely impractical.
4.2.3.5 Data Reduction and Presentation
Data for the visual read of the surface table is shown on aspreadsheet in Table 4.1. The top portion of the table gives the X,Y,Z
coordinates of each data point and represents the "raw" data. Note thatthe surface height readings from the rod (Z axis coordinates) are ':) the 0nearest 0.01". Three data points were arbitrarily chosen to establish areference plane and are indicated by asterisks.The equation for thereference plane was calculated using equations 3.1 and 3.2. Thedeviation of each data point from the reference plane was calculated •using equation 3.3. The deviations of each data point are shown in thebottom portion of Table 4.1 and represent the "reduced" data. Note thatdeviations were calculated to the nearest 0.001" and that deviations for
the point- used to establish the reference plane are zero, as expected. 0
It is important to understand that deviation of data points froman arbitrary reference plane does not in itself indicate an unflat surface.A close look at the reduced data in Table 4.1 shows that eight of 169 datapoints deviate from the reference plane by more than 0.01", with amaximum deviation of 0.013". But it is intuitive that the deviation of
any data point will depend on the three data points chosen to establishthe reference plane. The real indication of out-of-flatness is found in
the patterns of deviation from a reference plane, and this is best shown S
by a graphical depiction of the data.

19
Table 4.1 Data for surface table. Data point coordinates and deviations
front the reference plane are shown. Points used to establish the
reference plane are indicated by asterisks.SURFACE TAIKE I
LAE -VISUA IKAD ICoorc-mtm (in)
12 VI 5.67 5.6 5M 5.6m 5 5.65 5.64 563 5,6 5.625110 VII0 VO V W S68 5.67 5-- M SS W &4 53 52 56
9W 5.9 &5.676 7 * 6 6 6 5636_66 6+1 5.61 S.60 5.60 5.6 5.68
E 691 5.6 7 65 &6 6.68 SM 5. 3 5.64 & 5.63 5.60 5.60 558 5.5- 7i 591 U S &67 5,66 566 5.6 5. &64 5.63 5&63 5.w 5.61 &.60: &,59•
m 5 . 67 5.66 7 6 5,6 4 SM 356 5.61 560 3.60 6 5.5 & 5.0 5
2 5.6 S.M, 5.6 6 SM 5 5,63 63 5,6,2 61 5.60 5.8 5.57 5.8 63 S7 5.666 SM 6S 5.64 5.63 5. .61 5.60 5 .61 6 5.57 5., 7 5.662 • 5.66 5A6 &65 fim &61 Sm 5UO K W 577+ fký6' 1 5.66 5. Sm 5.63 5 .62 5. 61 _ .60 5.19 &56 567 5.56 5.60 5w' .64] 5.4 56m S.62 '&61 5'N1 5"" &59 5.58m S571 &56' 5.'•
0. 1i 2 41 5 6 7 9 10 11 12
ISDelewabon from Reftce Plane (rn)
6 (12 423 - 4o01 (10006 Ol 40 03 -00 01 6 -00 01 6 -00237 -(11 -0004 -013w -0o,3 03 0oo3 1 oo O, 40o9 -4o01 400o -aoW 40023 0242 -00 -003 4o a+ -0o20
9i +0003 (10 •0.06 01]D -o.07" 3 0 - (1o0.0() -a000 .0 .O9+.G 0 7 -. 0 -0.071
210 0 +.004 -021 0W1 (1024 (10: -0007 1(O ( 0 04 ,0 l -0013 (11 00619 1002 (1006 (1071 4021 (1- (0 1 -00063 (1.01 -(1009 .2OO 7 -0.0067 4010 -(O.18 O.(100 011 4(1(0 (1024 (10 ' a00002 0 -0 006 -0 004 0 4103 4000 (100 0 (027
7 2LO 3.0 L03 0 4 404 4 S3 6aD 700 8 9 107 4 06 4 11 12O
6.......4. . (1oral Ie ooom o~ -ooll O oo31 ooMb - o a -0 003 401 .OOD- a 9 -0m .1oW4 0001O ----.- 001 CLO CLOW-(+0) . . 0003' C1004 +.4 -0003 -0001! a000 -00M9 0003 0006
L+OOO ...
' . . ... .a0O • (004 a0 106 1 0 G O 0.007 00 L O 0.001 1 0.03 0004 -0.00 a003 -.9 0.00 - U• 0 1
Q010 0.0• 1 r CL 1O o (1W a ooo 0 "ON 091 ' 0-000 Q00o'o"1o, "r0 € I1 2] 3 4 81 61 7 10. 11 12
20
SURFACE TABLE12"X12" FIELDLASER - VISUAL READ
0. 1
-0.05•Z AXIS 0
-0.1 -
Y AXISX AXIS
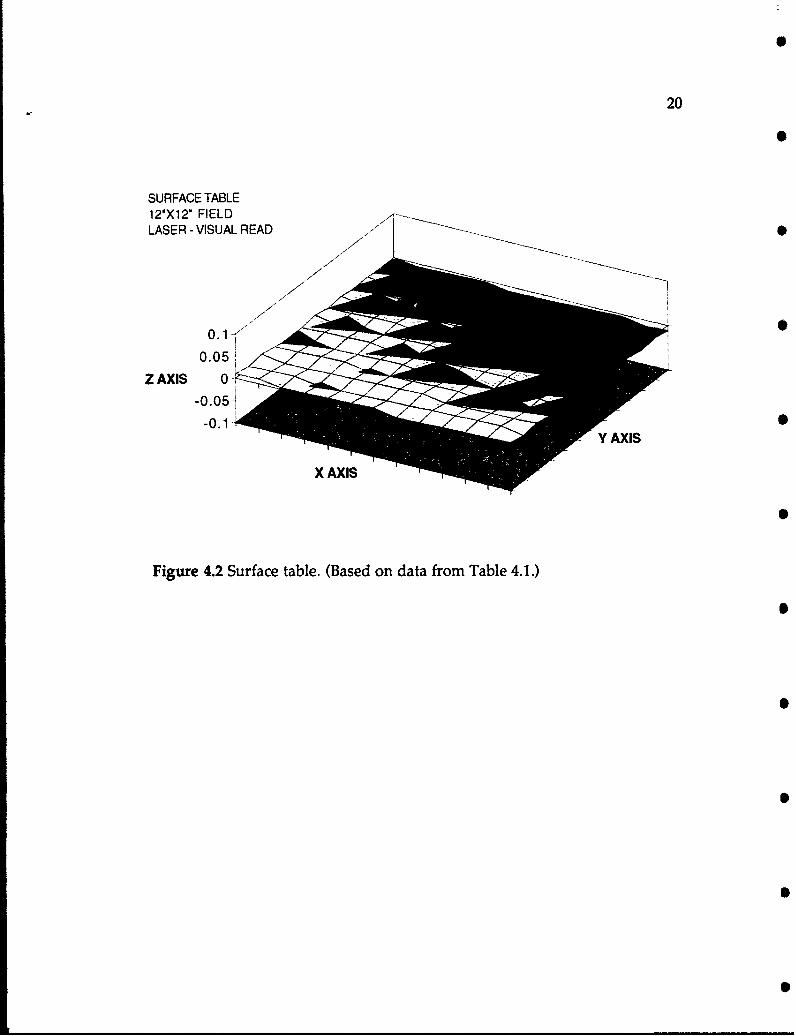
Figure 4.2 Surface table. (Based on data from Table 4.1.)

21
Using the graphing capabilities of Microsoft Excel, the profile of
the surface table was graphically illustrated and is shown in Figure 4.2.
This figure confirms the flatness of the surface table. The surface is
shown to slope slightly downward toward the top right portion of the
field due to the arbitrary selection or "tilting" of the reference plane.
But the slope is uniform, indicating the flat nature of the measured
surface. Note that the Z axis can be magnified to any desired scale to
further scrutinize the surface. The use of color contouring to highlight
areas above and below the reference plane is also helpful in
understanding patterns of deviation relative to the selected plane.
It is possible to choose a reference plane that minimizes
deviations. Using a least squares regression analysis, a "best fit"
reference plane can be found and the deviation of data points
calculated. Such a reference plane allows a more rational graphical
depiction of the data by eliminating the "tilting" effect of an arbitrarily
selected reference plane. For more information on regression analysis
refer to Linear Algebra and Its Applications by Strang (7) or a similar
linear algebra book.
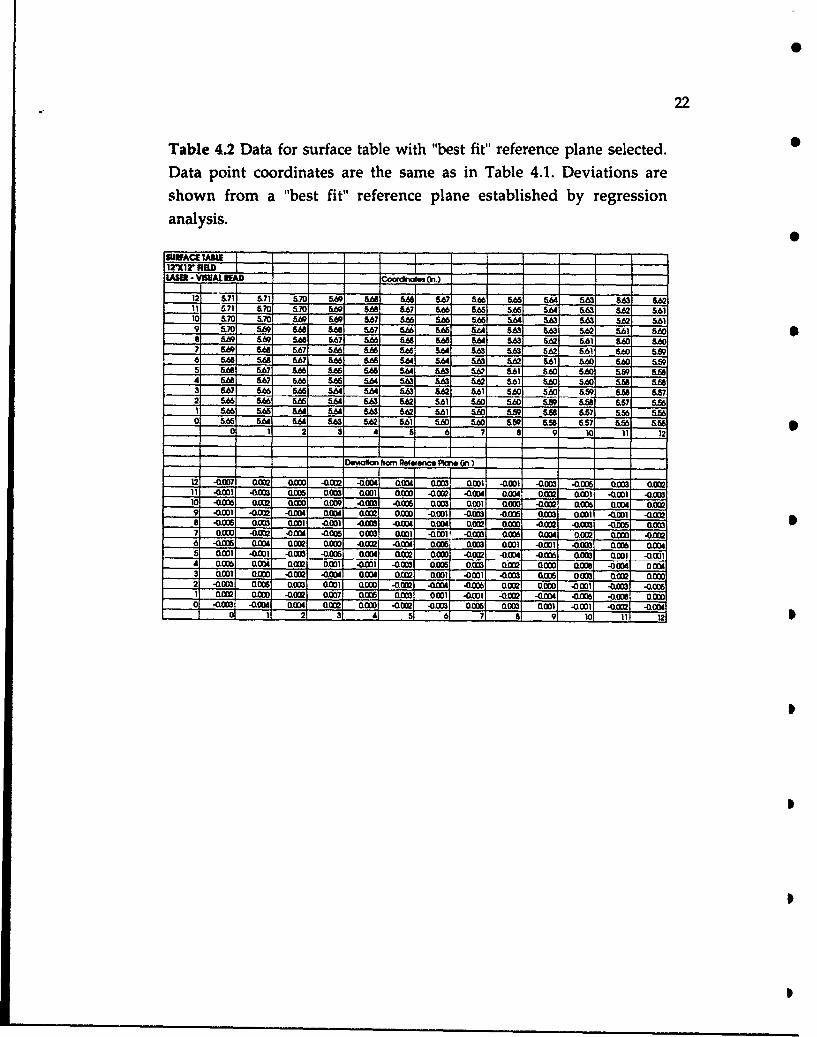
To illustrate the selection of a "best fit" reference plane, the same
raw data as in Table 4.1 was considered in Table 4.2. But a regression
analysis was run on the data point coordinates to establish a "best fit"
reference plane. A close look at the deviations in Table 4.2 shows a
maximum deviation of 0.009" with an average deviation of 0.003". The
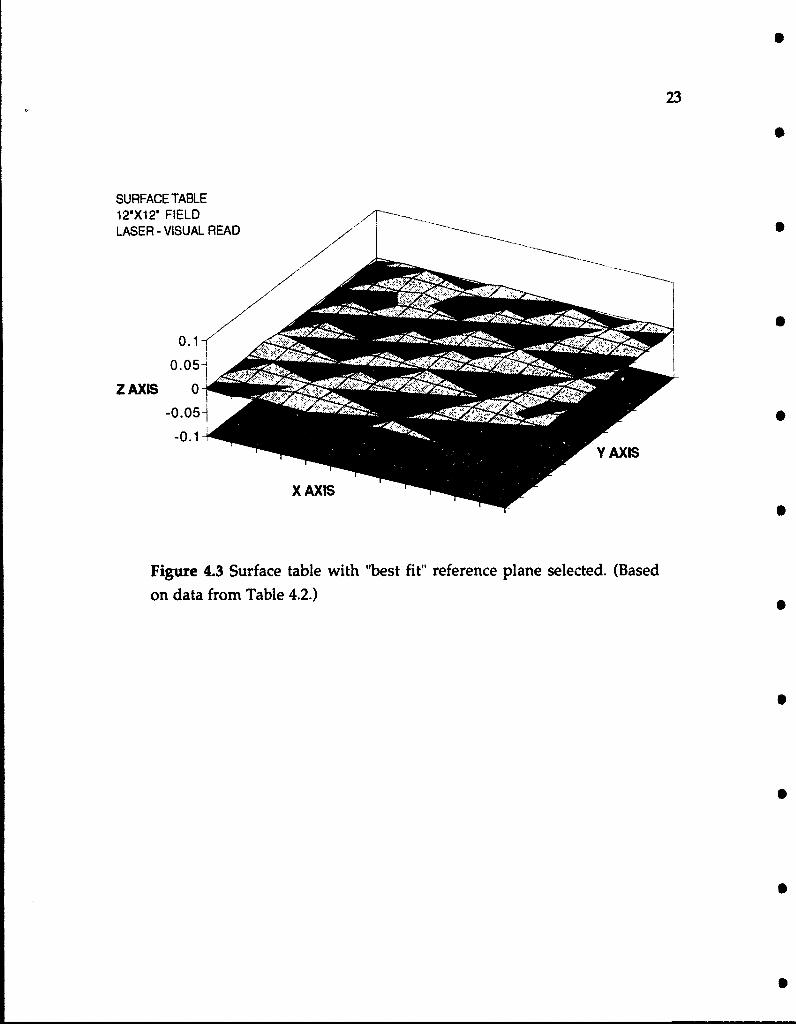
graphical depiction of data in Table 4.2 is shown in Figure 4.3. Again,
the flatness of the surface table is confirmed. However, the data and the
figure show a surface with smaller deviations from the "best fit"
reference plane.
Since the granite surface table is known to be extremely flat, the
deviations in Table 4.2 represent error in the laser method's ability to
measure out-of-flatness. Based on the deviations in Table 4.2, an
accuracy within +/-0.009" can be expected using the laser method of
measurement.
22
Table 4.2 Data for surface table with "best fit" reference plane selected.Data point coordinates are the same as in Table 4.1. Deviations areshown from a "best fit" reference plane established by regression
analysis.
SUFACE TAME
LAS UALMAOCoeruatee (in.)
12 5.71 5.71 5.70 S69 SM SM 65.67 566 SMUS ,64 W63 5.63 &W11 571 570 5.70 5W69 SAO 5.67 56 566 SA6S 5M U &63 5.62 56110 5.70 5.70 £ £W69 &W 567 566 566 566 S£64 &.63 5£63 5.62 5£619 5.70 569 S£6 5.66 5,67 666 £• 6 SM 5. 63 5.63 5£62 5.61 £60•a £69 SA9 SAB£ 6.67 5.,66 5.6 £66 4 5£63 W62 561 £60 £,607 £69 5.68 £67 5.66 5.66 5 5£6 4 563 5.63 6562 £.61 560 £696 £66 £665.67 £.66 5,66 S." 5.64 £63 662 6.61 5.60 60 .S55 £6 5.67 &.66 5.66 US66 SM 563 62 £561 _5.60 £60 £.9 5.56
2 66 £66 5.66 5.66 5.63 5.62 £.61 £65.60 SA£6 £56 £.66
1 5£66 5,66 SM S64 5,63 5M2 5.61 .60 5,9 6.58 £,57 6,6 5.60 5.66 " 5.64 5£63 W62 £61 £&60 _£60 5,£ 59 5.5£67 5£6 .56
0 1 2 3 4 S 6 07 9 I1 11 12
_ e'wlcn from Rerene 'a, (n r,)
12 -0.=07 0.002 0t) 0 0 -aOma a 0W4 a LODI aO--01 4003 .ann 0.003 0.00211 40.01 4003 OL005 L0-(a (LOl O00 4-0. 02 -. OO4 aOcd o 0.00oo 1 -cool aooa10oQ -O6( a1 Cma L09 410.3 4005 a aO Gc0 410 a0 -Loo ci Cj• 9 -0.00 40002 ,,,,M0 0,04 L0,02e 04W0 4-0001 -0aOM -0.00 a0O3 0.001 .. 0DI0 ,-0a081 -0.0 61 QW 0.O 01 40001 -. oCoa -a .04 o .Loo4 Co On2 ,, oo -a oo -a o 0 -a .= 0 0.0aw7 aO.ma 40 -om•- -acm0 -cm w a a -0.003 O.0 0.04 a L0 ana 4os O076 40CwllG05 ) o )2 a .amao • 4 um0 .W6l amL003 -,0.001 4003. OMm 6 nnnU65 -O01 4am0 4003 4006 a.4 a 9(M a 0(m ) 4002 -caa. -a mi6 OL003 OM1 -col4 awl6 aow =21am awl-oi -aom 666 awa am aom iow oo ao-66 3Wl3OL(DI 0M0 40•2o ( -am04 cm0 aOM aw00 -cOO1 4oMn1 oM61 OO3 a•m O~Ow2 4aa aM06 a0a c003 a -O 4 m0M 4 a-004 m - cimax? a0.0 -o".0 -coo -0oos
1o ..ow a4 a 7 0r0 uoos =3m OMl .cnnl -an -ama ama, 4m 0o00001 -ama3 -ama amad 0 ama D 4002 4a03 ama o OM ama ) aI awOl am2 am4a.
0 1 2 3 4 6 61 7 8 91 10 11 12W
p
23
SURFACE TABLE12'X12' FIELDLASER - VISUAL READ Zz
0. 10.105-4 =M!7
Z AXIS 0-0.05 ,
-0.1
Figure 4.3 Surface table with "best fit" reference plane selected. (Based
on data from Table 4.2.)
S
24
4.3 Measurement of a Plate Specimen with Noticeable
Curvature
4.3.1 General
The purpose of measuring a plate specimen with noticeable
curvature was to validate the measuring method on nominallyvertical surfaces. The plate specimen was first measured in a horizontalorientation. Then it was measured in a vertical orientation to see howclosely the results matched.
4.3.2 Test Setup
The surface of the plate specimen measured was noticeablyconcave. The steel plate's dimensions were 30"X36"X 3/8".
The plate specimen was first measured in a horizontal
orientation. Like the granite surface table, a 12"X12" measuring field Swith 1" grid was drawn on the plate's surface in china marker. Threelarge steel nuts were placed on a worktable in triangular fashion toprovide stable support for the plate. The plate was laid on top of thenuts. The LB-5 was connected to the magnetic base using a 5/ 8"-11 1threaded adapter. The LB-5 was then mounted to the plate. Common tomagnetic bases are on/off switches or buttons that allow easyplacement and removal of the magnet. The LB-5 was leveled in thehorizontal and turned on. The leveling rod was held vertical using the •attached rod level. Surface height readings were taken at each gridpoint as shown in Figure 4.4(a).
To orient the plate for vertical measurement, the plate waspositioned atop a pair of nuts bolted to the flange of a steel column as S
shown in Figure 4.4(b). Clamps were used to secure the plate againstthe column's flange. Care was taken to stabilize the plate without
S
25
inducing deformation. The LB-5, since removed, was remounted to
the plate's surface at a different location with the laydown vial facingup. Using the top leveling screw, the laydown vial was centered,leveling the instrument in the vertical. The LB-5 was turned on
and the leveling rod was held horizontal with the aid of a pocket levelsecured along the longitudinal axis of the rod. Measuring a nominallyvertical surface required waving the rod slightly in the horizontalplane in order to capture the lowest and therefore truest rod reading.
Surface height readings were taken at each grid point as shown in 1Figure 4.4(b).
4.3.3 ResultsI
4.3.3.1 Accuracy
By estimating beam center, it was still possible to estimate rodreadings to the nearest 0.01" for the plate specimen in both thehorizontal and vertical orientation. Again, the readings were easy to
reproduce. Accuracy was within +/-0.009" as was shown in Section
4.2.3.5.p
4.3.3.2 Time
Time required to measure the 12"X12" field (169 data points)with the plate nominally horizontal remained at approximately 45
minutes or four readings and recordings per minute. With the plate
nominally vertical, time required increased to about 60 minutes or
three readings and recordings per minute. This increase was attributedto the extra attention required to obtain readings on a nominally S
26
P_ I
S
(a)
jS
- it
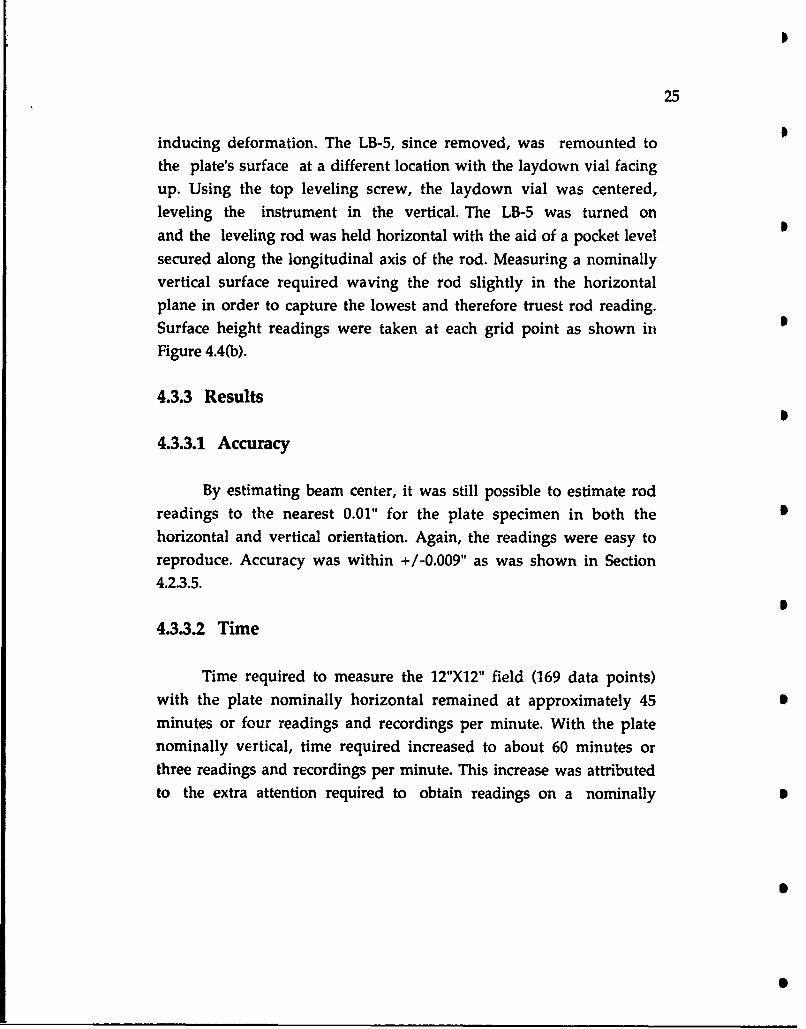
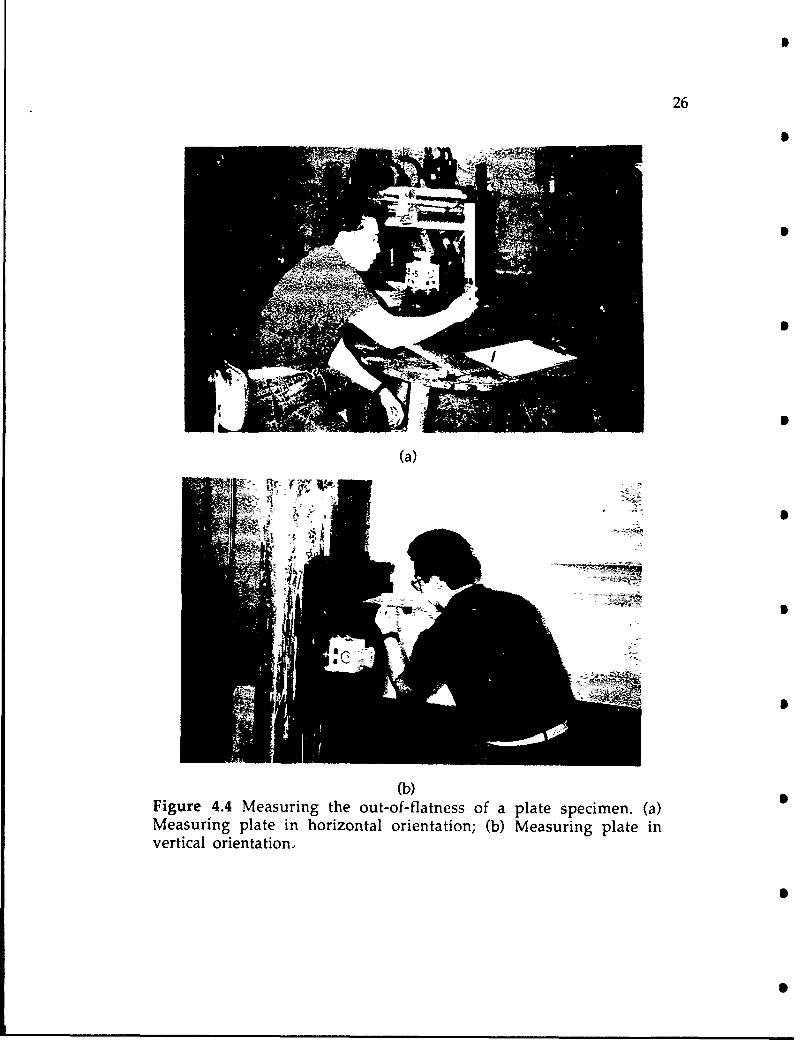
(b)Figure 4.4 Measuring the out-of-flatness of a plate specimen. (a)Measuring plate in horizontal orientation; (b) Measuring plate invertical orientation.

27
vertical surface. As mentioned previously, the measurer must hold therod horizontal and wave it slightly in the horizontal plane to obtainthe lowest reading.
4.3.3.3 Data Reduction and Presentation
Data for the plate specimen measured in a horizontalorientation is shown in Table 4.3. The table gives the data pointcoordinates and the deviatioti of each data point from the refereiiceplane, as in Section 4.2. The points used to establish the arbitraryreference plane are indicated by asterisks. The surface profile isgraphically illustrated in Figure 4.5.
Similarly, data for the plate specimen measured in a verticalorientation is shown in Table 4.4. The- data points used to establish thereference plane are the same as in Table 4.3 for the plate specimen inthe horizontal orientation. Again, the surface profile is graphicallyillustrated in Figure 4.6.
A comparison of the surface profiles in Figures 4.5 and 4.6 showsan almost exact match. A close look at the data in Tables 4.3 and 4.4gives further confirmation. Only 15 of 169 points showed a differencein deviation of greater than 0.01" with a maxim'im difference of 0.015".It should be noted that these differences in deviation may have beengreater or smaller if a different reference plane had been selected.Nevertheless, the close match of the profiles together with the fact thatrod readings for the vertical plate suffered no loss in accuracy, validatesthe measuring method on nominally vertical surfaces.
The profiles in Figures 4.5 and 4.6 demonstrate how graphics canmake the magnitudes and patterns of deviation readily apparent. Theuse of grid lines and color contouring are extremely helpful in

28
Table 4.3 Data for plate specimen measured in horizontal orientation.Data point coordinates and deviations from the reference plane areshown. Points used to establish the reference plane are indicated byasterisks.
PLATE WOMCUEN I___12"X12" HELD O4ORIZONTA_•__ . .......
LASER. VISUA READ ICcordinoto,.)
12 U2 30 831 832 8.33 8 8.33 833 832 832 831 830 82911 830 8.31 8.32 8.33 8.34 834 8.34 83 834 833 8.33 8,32 83010 831 8.32 *8.34 8.3 835 8.35 8.36 836 836 83 $34 8.33 _8319 8.32 834 83 836 &36 836 836 836 836 836 835 834 8.328 8.3a 8.34 8.3 836 836 837 837 837 836 836 835 834 8337 834 &3 8.36 836 8.37 838 &38 838 837 836 835 8.34 8336 8,33 8.3 835 836 837, &37 8.37f 837 836 8.36 835 834, 8325 8331 8.34 835 8.3 8.36 &36 8.37 836 8.36 835 8,34 8.33 8314 8.31 833 8. 834 8.35 835 836 83 836 834 833 832 8.303_830 8.31 .&32 833 833 834 834 834 833 833 832 831 8302 8281 29 830 830 8.31 831 832 831 8.31 831 830 8.29 8271 825 8.26 827 828 89 82 830 830 829 829 828 8.27 820 8.22 8.23 M2 8.26 8.2 8.26 8.26 8.26 8.26 8.26 8.26 824 823
0 1 2 3 4 5 6 7i 8 9 O 10 12 T
Deowatan from Refnence Rane (in.) I
12 (1064 10048 0.041 .004 (0.n7 (1031 ,0.34 0.037 0,060 a,064 0067 (0.0 (109411 (109 0.032 (1036 0.019 a1012 (1016S (019 (0322 (0305 (1038 1042 006 a07810 (1033 0.017 * OD -(107 acom 0.000 4007 -(1 0 0010 0.013 006 0040 00B9 0LOS .- 0.0 -0016 4022 4019 4016 -0012 -OM -0 4002 0011 0024 (.0478 4007 14014 4031 -0.38 4024 4031 .0=38 -0,4 -4,011 -0038 0036 0019 (10327 -033 4030 -0W036 -033 4040 -0.046 4043 .004 .0 4027 -0013 * a(1 (1013 10•'76 4018 .0m5 -0032 .038 4045 4 1042 4 4039 4036 4032 4019 -0036 (03M 0031_ _40_. _4030 407. .403 4040 4037 40044 40o31 4027 -0014 -0001 0.o12 00364 40 .026 -0032 40329 4036 -0033 -0029 -0026 4033 -(1010 a004 0017 6.0403 4004 4011 4018 4025 .03021 4038 .4025 -0021 -0000 -006 0508 (1032 00352 0.0101OL003 -.03 * O 40037 . .-0010 003 0.006 0010 0-023 10.36 00601 0.035 (1038 0.021 (1016 1 00 a004 0.006 (031 0024 (1038 0.061 10074
0.059 (1063 10046 0.039 00421 0036 0039 0042 0046 0059 0042 0075 00590o 1 2 31 " 4 6 6 7 $1 9 10 111 121 S
S
S

0
29
PLATE SPECIMEN12"X12' FIELD (HORIZONTAL)LASER - VISUAL READ
0.05,i
ZAXIS 0 - .
"-0.05-0.1
X AXIS
Figure 4.5 Plate specimen measured in horizontal orientation. (Basedon data from Table 4.3.)

30
Table 4.4 Data for plate specimen measured in vertical orientation. Datapoint coordinates and deviations from the reference plane are shown.Points used to establish the reference plane are the same as in Table 4.3for the plate specimen in a horizontal orientation, and are indicated byasterisks.
PLATE SPECRMEN I12X12 FIELD (VERTICAL)LASER:- VISUAL RE:AD CooqW* (i~t.•Cn ) ,
12 8 36 840 8.42 856 S5 8450 8682 854 8565 8.58 859 860 8,6111 8.39 8.2 8.5 849 851 853 8.6• 8.67 859 860 861 8762 816310 8.42 8.45 3 8.56 8.58 8.81 163 86 8867 8.61 8.69 870 71 874 8.50 853 851 . 8.9 8.61 8.64 866 862 8.64 8765 8766 8.67 8673 8A6 8.50 8.52 856 858 88 6 8.63 862 8.64 868 8 S7 A87S 8719 87697 8AS 851 8.4 ' 857 85. 8.62 8.64 8.65 8.678 8780 70 876 8706 8,A9 8,52 8.,• 85 a . 60 .62 8,• 8,67 SAS 891 8 70 8 70 8 715 8,50 8 53 8.6.T 8 .5 15 8161 8,63 S.A5 8,67 8.69 .6,69 8 70 8.71 8 724 8,5 $53 66 $59 8.61 8,64 3.6 867 816 870 871i 8.71 a ri3 am4 852 ass 850 6,60 813 8$65 8,6 86 8 70 87 0 e $ 71 872
1 8.A7 850 8.53. 855 859 8.6O 8.63 8.65 8,67 s.68 869 8.70 8700 8.45 8.48 8.51 854 8.57 8.60 8.61 864 8.65 8.66 88 8.69 869
0 1 2 3 4 5 . 6 7 8 a 10 11 12
Dev4olron from R wfice Slae (in)
12 0.071 O053 1L056 0.048 0040 L0O42 0.45 0.47 049 0052 O0641 0.076 00911 nL048 0.040 0.033 0015 10017 10.020 0.022 0014 0.7 0.039 01051 11063 0.07610 0.025 0,018 * (OOD 1002 -1105 -0.00 3 -,10 _ 0 .111) a014 0.016 0.028 11041 0.0639 11013 -0.05 -0013 -. 010 .0018 -0016 -0014 -0011 -0009 (1003 11016 0028 0.0508 0000X) -0018 -0.016 -0.023 -0031 -0.329 4056 -0024 -0012 -0.010 0003 0015 0.0377 -11013 -11021 -0.028 4036 4034 -4041 -0.039 -0.027 -0055 4a012 * _0.00 0022 (10356 4016 -0023 4031 -0,039 -4037 -0.034 _4042 -0.040 4,027 4015 -0.003 0.00 10325 -4019 -0-026 4034 -0,032 4039 -0a37 4035 4032 -0.030 -0.008 0004 0.017 10594 -60.11 -0019 -0017 -0034 40.32 -0040 -0028 -0025 -0023 -0011 00Q 004 00363 -.004 -O002 -0010 -0017 -0.015 4-043 -0020 4018 -0006 -0003 0.019 C1031 0j043
11013 (1105 -0002 0000 -0l3• -00t6 -0503 -0001 001 ) 1034 110,6 1038 0051
0 040 1033 055 057 002 0 0022, 1014 0016 0019 0031 2 0043 006 0.07811M058 105 00052, 0044 0037 00591 0041 0034 0046 0058 05 103 09a, a 00001 007, 09
0 1 2 3. 4 5 6 71 8 91 0 1 _ 12

31
PLATE SPECIMEN12-X12- FIELD (VERTICAL)LASER - VISUAL READ
0.10.051
Z AXIS 0-
-0.1
X AXIS
Figure 4.6 Plate specimen measured in vertical orientation. (Based ondata from Table 4.4.)

32
understanding the deformed shape. And profiles of different
specimens are easily compared.
4.4 Measurement of a Plate Girder Flange
4A.1 General
The purpose of measuring a plate girder flange was to
demonstrate the laser method of measurement on a realistic,
nominally horizontal specimen, Measurement of the flange was also
done using an automatic optical level to evaluate its effectiveness in
measuring nominally horizontal surfaces.
4.4.2 Test Setup
The specimen measured was the top flange of a plate girder. The
flange had a width of 16" and a tbickness of 11/2".
The flange was first measured using the laser method. A 10"X15"
measuring field with 1" grid was drawn on the flange. The LB-5 was
mounted to the flange with the magnetic base, leveled in the
horizontal, and turned on. The leveling rod was held vertical using the
attached rod level, Surface height readings were taken at each grid
point as shown in Figure 47(a),
The flange was then measured using an automatic optical level.
The optical level was mounted to the flange with the magnetic base,
and the instrument was leveled. The leveling rod was held vertical by
the rodperson while the level operator sighted on the rod, Surface
height readings were taken at each grid point as shown in Figure 4.7(b)

33
(a)
5Z-(b)
Figure 4.7 Measuring the out-of-flatness of a plate girder flange.(a)Measurement using LB-5 laser level; (b) Measurement usingautomatic optical level.
S
34
4.4.3 Results
4.4.3.1 Accuracy
As previously mentioned, estimating beam center allows anestimated rod reading to the nearest 0.01". The accuracy of the lasermethod is within +/-0.009" as was shown in Section 4.2.3.5.
On the other hand, the magnification of the leveling rodgraduations made possible by the automatic optical level allowed aclear rod reading to the nearest 0.01". The optical method was moreaccurate than the laser method. However, the coordination betweenthe level operator and rodperson required by the optical methodincreased the likelihood of human errors.
4.4.3.2 Time
Time required to measure a 10"X15" field (176 data points) using •the laser method was about 45 minutes or four readings andrecordings per minute. Time required using the optical method wasabout 25 minutes but required two people.
O
4.4.3.3 Data Reduction and Presentation
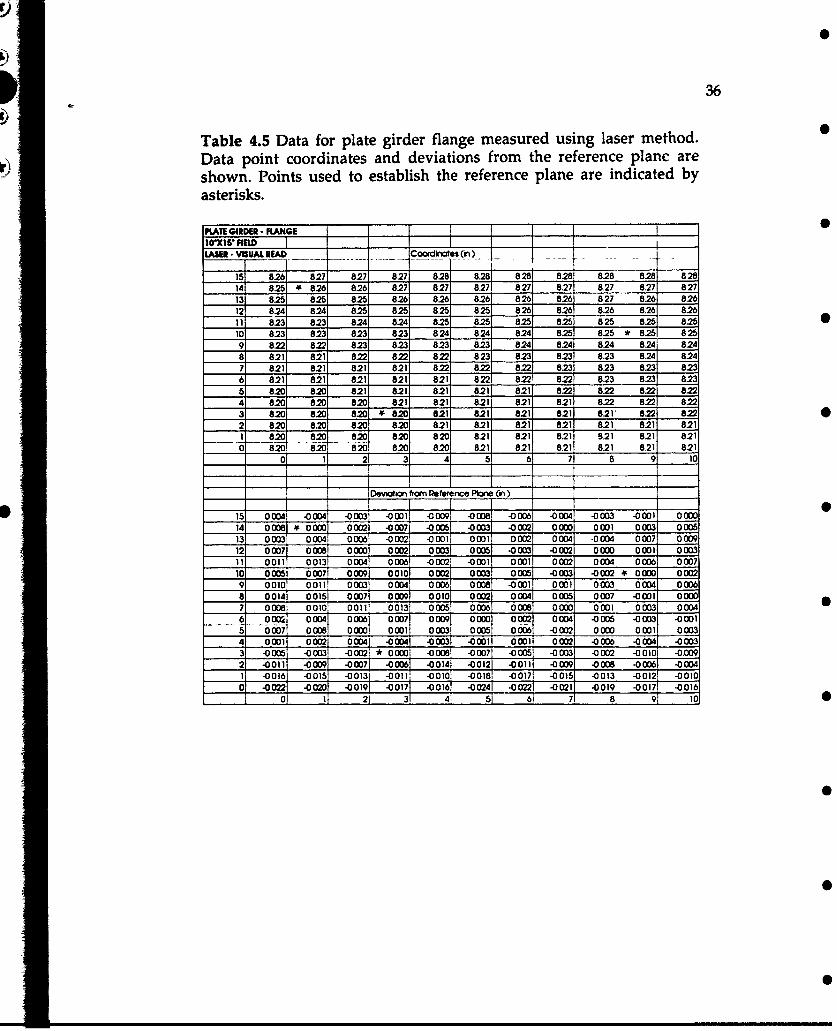
Data for the plate girder flange measured using the laser method
is shown in Table 4.5. The table gives the data point coordinates and S
the deviation of each data point from the reference plane, as inprevious sections. The points used to establish the arbitrary reference
plane are indicated by asterisks. The surface profile is graphicallyillustrated in Figure 4.8. S
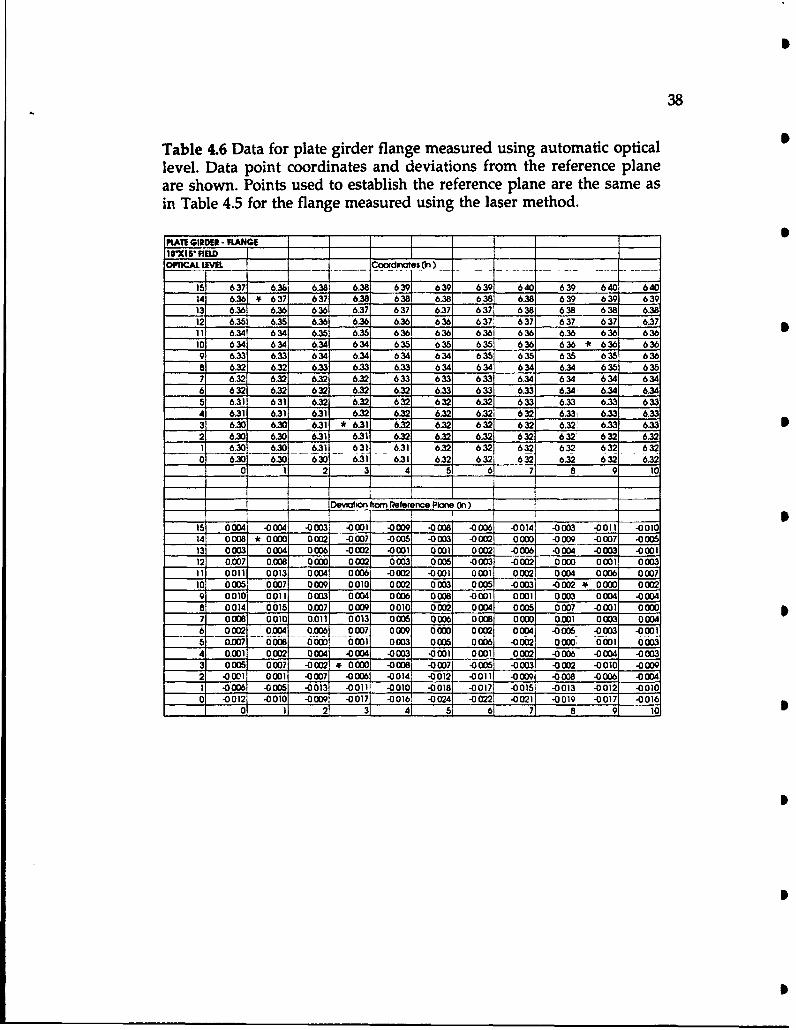
Similarly, data for the flange measured using the automaticoptical level is shown in Table 4.6. The data points used to establish thereference plane are the same as in Table 4.5 for the flange measured

35
using the laser method. The surface profile is graphically illustrated inFigure 4.9.
A comparison of the surface profiles in Figures 4.8 and 4.9 shows
an almost exact match. A close look at the data in Tables 4.5 and 4.6gives further confirmation. With the exception of 19 of 176 points, all 5
deviations from the reference plane are exactly the same. The
difference in deviation shown by the 19 points that did differ wasexactly 0.01". This reflects the fact that estimating beam center on therod gave an estimated rod reading to the nearest 0.01" that was wrong 0
at only 19 points. And when the reading was wrong, it was simply amatter of rounding to the next higher 0.01" graduation instead ofthe next lower 0.01" graduation, or vice versa. In the great majority ofcases, measurement with the laser level gave the same relative rodreading as measurement with the optical level.
36
Table 4.5 Data for plate girder flange measured using laser method.Data point coordinates and deviations from the reference plane areshown. Points used to establish the reference plane are indicated byasterisks.
PLATE GIRDER- FLANGE __ __ Z ~101'5" FIELD I ILASER. -VISUAL READ Coordinates (-i).
1 8261 827 827 827 8.28 828 828 828 828 i28 82814 8.25 • 826 8.26 8.27 827 8.27 827 827 8.27 8.27 82713 825 8.25 8.25 8.26 8.26 8.26 826 826 827 8.26 8.2612 8.24 8.24 8.25 8.25 825 8.25 826 8.26 8.26 8.26 8.2611 823 823 8.24 8.24 8.25 825 825 825 825 825 8.2510 8.23 823 8.23 823 824 824 8.24 825 8.25 * 825 8259 8.22 8.22 823 823 823 82.3 824 824 8.24 8.24 8.248 821 821 8.22 822 822 823 823 823 823 8.24 8.247 8.21 821 8.21 821 8.22 822 822 823 823 8.23 8236 8.21 821 821 821 821 822 822 822 823 823 8235 8.20 8.20 821 821 821 821 821 822 822 822 8224 8.20 8.20 820 821 821 821 821 821 8.22 822 8223 820 820 82 2 8.20 821 8.21 8.21 821 821' 822 8.222 820 820 820 820 8.21 821 8.21 8.21 821 8.21 8.211 820 820 _ 820 820 820 821 821 821 821 821 821
0 o & 820 820 820 820 820 821 821 821 821 821 82101 I 21 3 4 5 6 71 6 9 10
Dewaton frorn Reference Plane (in)
15 0 W -0004 -0003 -00011 -0v09i - )M8 -0006 -0 OW -0003 -0001 000014 0008 w 0000 0002 -0007 -0005 -0003 -0002 0000 0001 0003 0005
13 0003 013W 0006 -0002 -0001 0001 0002 0004 -0004 0 07 000912 0007 0008 000 0 0002 0 003 000 5 -0003 -0002 0000 0001 0003l1 0011 0011 000 000 6 -0006 -0001 0001 0 0 00 0004 oo6 0007io0 0014 0 015 0007 0 00l9 0010 0002 003 005 o00053 -0 002 0 00009 0010 0011 0003 0 005 0006 0008 -0001 0001 0003 0004 00066 0014 0015 0007 0 009 0010 0002 0004 0005 0007 -0001 00007 0008 0010 0011 0013 000 5 0006 0008 0000 0001 0003 00046: oom 0004 000o 0007 0 oo9 0000 0002 0004 -0005 -0003 -0OOlI
--- 0s66-71d O W 00 0000o o001 0003 0005 o066 -0002 000ooo 1 O D31oo4 0001 0002 0004 -0004 -0003 -0001 0001 0002 -0006 -0004 -00033 -000 5 -00o3 -0002. * oo00 -0008 -0007 -0005 -0003 .0002 -0010 -0.0092 -0011 -00o9 .00o7 -00 6 -0014 .0012 -0011 -0009 -0008 -0006 -0004i -0016 -0015 -0013 -0011 -0010 -0018 -0017 -0015 -0013 -0012 -00100 -0022 -0020 -0019 -0017 .0016 -0024 .0022 -0021 .0019 -0017 .0016
0 1 2 3 41 5 6 71 8 9 10
qS
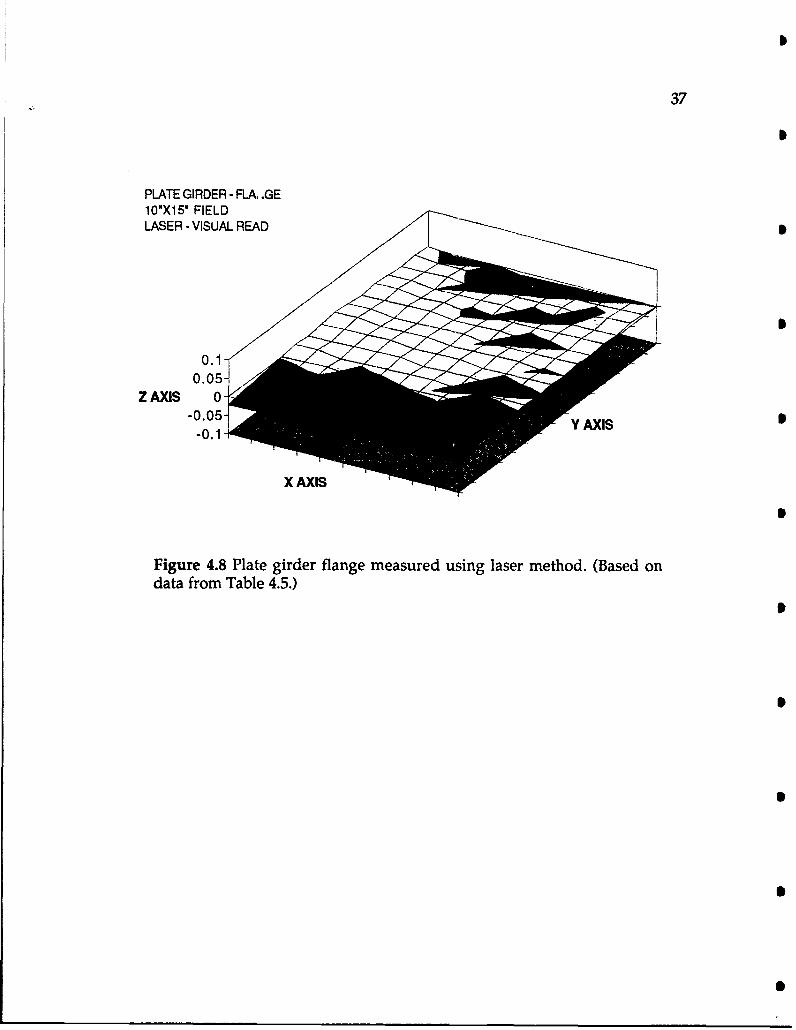
37
PLATE GIRDER - FLA .GE10'X15' FIELDLASER -VISUAL READ -
0.05-•
Z AXIS 0- --0.05- Y AXIS
-0.1
X AXIS
Figure 4.8 Plate girder flange measured using laser method. (Based ondata from Table 4.5.)
38
Table 4.6 Data for plate girder flange measured using automatic opticallevel. Data point coordinates and deviations from the reference planeare shown. Points used to establish the reference plane are the same asin Table 4.5 for the flange measured using the laser method.
KATE GIRDER - RLANGE _
IOrXI" FELD _
OMIlCAL LEVEL _Coordnates (o)
15 637 6.36 6.38 6.38 639 639 639 640 639 640 64014 6.36 637 637 6.38 638 6,38 638 6.38 639 639 63913 6.36 6.36 636 6. 63 637m 6.37 637 638 _638 638 6.3812 6.36 6.35 6.36 6.36 636 636 6371 637 637 637 683711 6,34 634 6.35 6.35 636 636 636 636 6.36 636 63610 634 634 6.34 634 635 635 635 636 636 * 636 6369 6.33 6.33 634 6.34 634 634 635 635 635 635 6368 6.32 632 6,33 6.33 6.33 634 634 634 6.34 635 63577 6.32 6.32 6.32 6.32 633 633 633 6.34 634 634 6346 632 6.32 632 6.32 6.32 6.33 633 6.33 6.34, 6.34 6.345 6.31 631 6.32 6.32 632 632 6.32 633 6.33 6.33 633K 4 6.31 6.31 6.31 6.32 6.32 6.32 6.32 632 6.33i 6.33 6.333. 6.30 6.30 6.31 *6.31 6.32 6.32 632 6321 632 6.33 6.332 6.30 6.30 6.31 6.31 6.32 6.32 6.32 632 632' 632 6.321 6.30 6.30 6.31 631 6.31 6.32 632 632 632 632 6320 6.30 6.30 6•30"- 6.31 6.31 6,32 632 632 6.32 632 6-.32
20 2 13 4 5__7 8 _0
_Deiatibon Rtem erence Plane (in)
15 0004 -0004 -0003 -0001 -0009 -0008 -0006 -0014 -0003 -0011 -0010
14 0008 , 0000 0002 -0007 -.005 -0003 -00(2 0000 -0009 -0007 -00013 0003 0004 0006 -0002 -0001 0001 0002 -0006. -0004 -0003 -000112 0.007 0.0• .0000 0002 0003 0005 -0003 -00021 0000 0001 000311 0011 0013 0004 0006 -0002 -0001 0001 0002 0004 0006 000710 0005 0007 0009 0010 0002 0003 0005 -0003 -0002 ( 0000 00029 0010 0011 000 3 0004 0006 0o08 -0001 0001 00o3 0004 -00o48 0014 0015 0.007 0009 0010 0002 0004 0005 00o7 -0001 00oo7 0008 0010 0.011 0013 0005 0006 0008 00OD 0.001 0003 00046 0002 o0.004 0.006 0007 0o09 0000 0002 00o4 -0005 -0003 -00015 0.007 0008 00000001 0003 0005 0006 -0002 0000. -0-001 60034 0.001 0002 0004 -0004 -0003 -0001 0001 0002 -0006 -0004 -00033 0005 0007 -002 0 0000 -0008 -0007 -0005 -0003 -0002 -0010 -00092 -0001 0001 -0007 -0 06 -00141 -0012 -0011 -0009 -0008 -0006 -0004
-000 -001 -0011 -00o1 -0018 -0017 -0015 -0013 -0012 -00100 -0012 -00,0 -0009 -0017 -00161 -0024 -0022 -0021 -0019 -0017 -0016
1 01 11 2 --- ---4-It 5 61 71 8 9 1
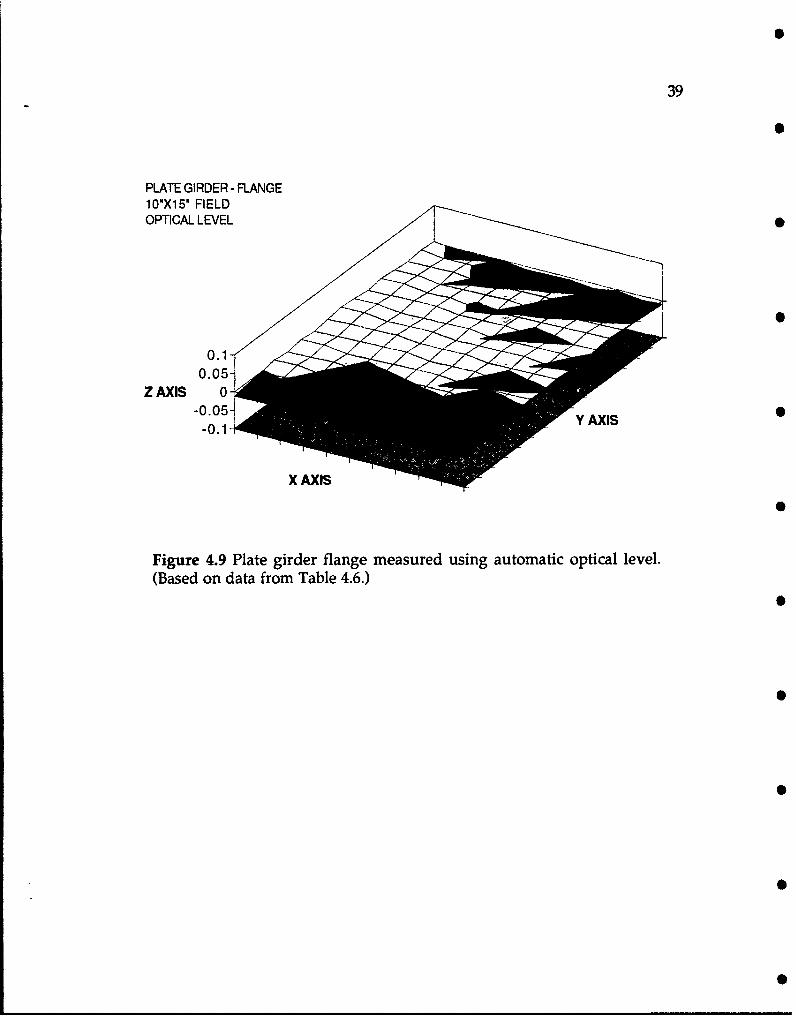
39
PLATE GIRDER - FLANGE10"X15' FIELDOPTICAL LEVEL
0.10
0.05
Z AXIS 0-
-0.1
X AXIS
Figure 4.9 Plate girder flange measured using automatic optical level.(Based on data from Table 4.6.)
40
4.4.3.4 Measurement with the Automatic Optical Level
The automatic optical level will measure the out-of-flatness ofnominally horizontal surfaces with greater accuracy and in less timethan the laser level. Therefore the optical level can be considered whencircumstances allow. However, the optical level is subject to a numberof limitations that reduce its flexibility as a measuring device:
1. Measurement with the optical level requires two people: a leveloperator and a rodperson.
2. The coordination between the level operator and the rodpersonincreases the chance of human errors.
3. The automatic optical level can only establish a horizontal plane andis therefore only useful in measuring nominally horizontal surfaces.
4. The minimum focus range for optical levels can be as much as eightfeet, limiting their use over the short ranges associated with out-of-flatness measurement. While optical levels are available withminimum focus ranges of less than three feet, these are the exception.
5. If the optical level is mounted on the surface to be measured, thelevel operator must assume rather awkward and difficult positionswhile sighting on the rod. A 900 eyepiece may help somewhat, but is arare and suprisingly expensive accessory.
Thus, the automatic optical level can be used to measure out-of-flatness within the constraints of the foregoing limitations. However,the laser method is a one-person operation, gives the greatest ease andflexibility of measurement, and provides an accuracy of within +/-0.009". Unless greater accuracy is required, the use of the optical level inout-of-flatness measurement is not recommended.
41
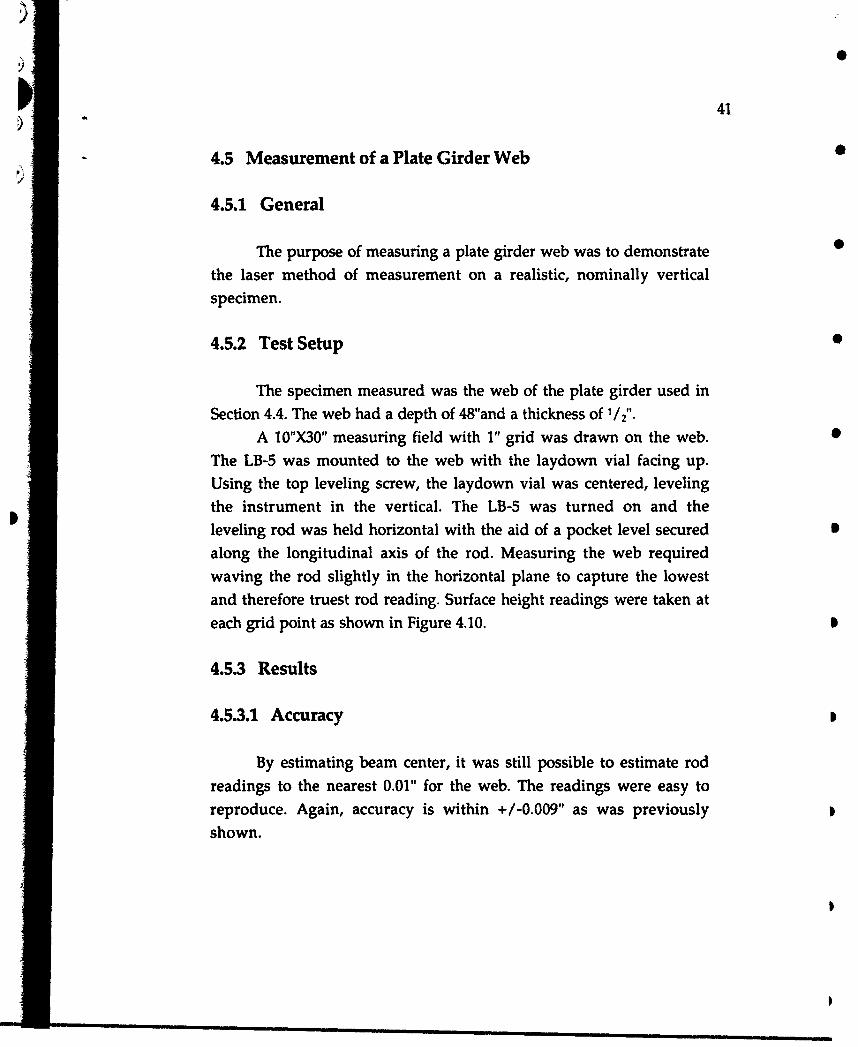
4.5 Measurement of a Plate Girder Web
4.5.1 General
The purpose of measuring a plate girder web was to demonstratethe laser method of measurement on a realistic, nominally verticalspecimen.
4.5.2 Test Setup
The specimen measured was the web of the plate girder used inSection 4.4. The web had a depth of 48"and a thickness of 1/2".
A 10"X30" measuring field with 1" grid was drawn on the web.
The LB-5 was mounted to the web with the laydown vial facing up.Using the top leveling screw, the laydown vial was centered, levelingthe instrument in the vertical. The LB-5 was turned on and theleveling rod was held horizontal with the aid of a pocket level secured S
along the longitudinal axis of the rod. Measuring the web requiredwaving the rod slightly in the horizontal plane to capture the lowestand therefore truest rod reading. Surface height readings were taken ateach grid point as shown in Figure 4.10. 0
4.5.3 Results
4.5.3.1 Accuracy
By estimating beam center, it was still possible to estimate rodreadings to the nearest 0.01" for the web. The readings were easy toreproduce. Again, accuracy is within +/-0.009" as was previouslyshown.

42
HS
/S
Figure 4.10 Measuring the out-of-flatness of a plate girder web.
4.5.3.2 Time 5
The total time to measure the 10"X30" field (341 data points) was
about three hours or two readings and recordings per minute.Measurements could be taken at the rate of three readings and
recordings per minute, but fatigue of the measurer was a factor and
required breaks in the work.
4.5.3.3 Data Reduction and Presentation 5
Data for the web is shown in Table 4.7. The table gives the data
point coordinates and the deviation of each data point from the
reference plane, as in previous sections, The points used to establishthe arbitrary reference plane are indicated by asterisks. The surface
profile is graphically illustrated in Figure 4.11. Patterns and severity of
deviation from the reference plane are readily apparent.

43
Table 4.7 Data for plate girder web. Data point coordinates anddeviations from the reference plane are shown. Points used to establishthe reference plane are indicated by asterisks.
20 5.7 5.17 517 $ 1 7 S 170 817 5.17 5.17 5.17 5.17 5170 19 8.15 all 81 .15 5.15 5.15 5.17 5.17 5.17 5.17 517 5.17
215 5195 .Il _ 8,519 151 851 8.19 515 515 5.15 515 5.1517~22 G. 2 52 5116 819 5.19 5.16 518 1 .1 9 .1 1 5 .1 $s 51
21 8,27 827 5.26 8,17 5.26 &16 5.16 5.23 5.25 5.25 256
20 8.27 8.27 527 5.27 5.26 527 5.26 5.25 8.2 5.25 523
30 -0024 -002 -001 -0.1 11 -006 1-00 00171 8.17 001 0016 002029 W02 V001 S001 -0.00 -000 8.1 0111 0011 0015 0019 002425 -001 -001 -0201 -013 -0.009 -00049 $19 0004 0009 0013 0019
16 0219 -000 0000 000 -000 0.003 0.00 0.12 0016 00219 002323 -0,215 -0011 -000 0021 0.20 0.207 2011 2021 020 20225 20.224 8,21 -0.001 80.003 00021 0006 021 00215 0020 002 .2022 003323 -0.22 80.223 021 0.006 0.01 0.01 00219 0023 0025 00321 0.03
1 -000 0001 0 0.209 0014 001 0013 0.017 0022 0026 003121 000 000 4 0009 0.13 0015 0023 01 0.021 0023 0020 003420 -000 -0024 0.00 007 8.024 00316 0.20 0023 0.22903 0.22 35219 002 0a00 000 0211 0015 021 8.24 0219 0.23 0227 0.032
__15 0001 002 0M1 0215 0019 0025 0015 0024 0227 003 1 -0034_ 17 i 0 &0 M 001025 4.5 2 0.04 0 013 07 0224 026 003 00" 003982
16 0,203 0005 00126 0217 0025 0025 0.025 002 0029 0033
E 1 5 0203 0207 0.025 0016 0.011 0015 0.01 0224 0225 0.03 203
12 0.204 2 0,013 0. 001 0216 0011 0215 0&Z 0024 002511 007 002 0007 0011 0a01 0,2610 0015 0019 0023 0015 0252
__10 0,202 0.007 00 0007 00 0014 0,015 0023 0017 0&2 0025
90 -0.024 -0.0200 0.0045 0.0109 0021 -0002 0.012 0.017 0221 0.215 0.0202__ -0.0201 -0.0 -0.002 -0203 0007 0012 0016 0010 0015 0019 0.0241
2__7 -0007 -0.002 0002 -02009 -00201 0205 0200 0014 0009 0013 0017
02 030 02 -0 221 - 0,0 -. 0 17W 003 0 01 -0.011 -0100015 -0.01 .0.024 Oe 0633
23 000 -OOD3 0.01 OM 001 OA5 019 023 002 0 W 003

44
PLATE GIRDER - WEB10"X30" FIELDLASER -VISUAL READ
Z AXIS 0
-0.1
X AXIS
Figure 4.11 Plate girder web. (Based on data from Table 4.7.)
j/S
/S
//S
//I
/ I

CHAPTER FIVE
MEASURING OUT-OF-FLATNESS:A "STEP-BY-STEP" PROCEDURE
A "step-by-step" procedure for field measuring the out-of-flatness of structural steel plates is presented below. The procedure isbased on the development in preceding chapters. Familiarity with theLaser Alignment LB-5 Laser Beacon and precision leveling rod isassumed.
1. Read and follow all safety instructions included with the LB-5.
2. Calibrate the LB-5. Calibration instructions can be found in theOperation Manual.
3. Place a strip of electrical tape at the top and bottom edge of the laserbeam's exit aperture to narrow the beam's width. Turn the LB-5 on andview the beam on the leveling rod. If necessary, further adjust the •strips of tape to obtain a thin line of light on the rod. Narrowing thebeam's width to approximately 0.02" works well.
4. Draw the measuring field on the surface to be measured. Removablechina marker is useful for this purpose. Use of a 1" grid is •recommended unless a smaller interval is needed or desired. Be sure toindicate an X and Y axis to "fix" the orientation of the field.
5. Horizontal surfaces. To measure nominally horizontal surfaces,mount the LB-5 near the measuring field with the magnetic base.Adjust the leveling screws to center the level vials for horizontaloperation, and tuln the instrument on. Hold the leveling rod verticalusing the attached rod level. Take and record surface height readings ateach grid point.
oVertical surfaces. To measure nominally vertical surfaces, mount theLB-5 near the measuring field with the laydown vial facing up. Use thetop leveling screw to center the laydown vial, and turn the instrumenton. Hold the leveling rod horizontal using a pocket level secured along
45 S

46
the longitudinal axis of the rod. Wave the rod slightly in thehorizontal plane to capture the lowest and therefore truest rod reading.Take and record surface height readings at each grid point.
Note: To take a rod reading, estimate the center of the beam as itappears on the rod. Then estimate the rod reading to the nearest 0.01".This procedure will give an accuracy within +/-0.009".
6. Data reduction. Define a reference plane using any three non-colinear data points (x1, y1, z), (x2, y2, z2), (x3, Y3, z3) using the followingequation:
Y'2-)1 z2 -z1iI 1)Z 2 -Z1 X2-Xl(y-yp)+X2-Xl Y"2>'lzzi= 6.1Y3 -Y1 z3 Z11 I Zl x3 ix3"xl Y3"Y( 1
Reduce the above equation for a reference plane to the following formwhere A, B, C and D are constants:
Ax + By + Cz + D = 0 6.2
Use a commercial spreadsheet program to calculate the perpendiculardistance from the reference plane to each data point (x0,yo,z 0) by
Ax 0 + By 0 + Cz0 + D 6.3
-'A2 + B2 +c 2
Note: If desired, a regression analysis can be performed on the datapoint coordinates to obtain a "best fit" reference plane (see reference 7).
7. Presentation. Use the graphing capabilities common to spreadsheetprograms to graphically illustrate the surface profile. Use graphingfeatures such as scale sizing, grid lines and color contouring to enhancethe presentation.
S
CHAPTER SIX
SUMMARY AND CONCLUSIONS
6.1 Summary of Work 0
The out-of-flatness of structural steel plates in bolted
connections can prevent desired bolt tensions from being achieved,
even when specified installation procedures are used. In order to
correlate out-of-flatness and its bolt-loosening effect, an efficient and
accurate means of field measuring out-of-flatness is required.This thesis presents the development of a field method to
measure the out-of-flatness of structural steel plates. First, out-of- 0
flatness was defined and a list of measuring method requirements was
established. Next, a method using a manual rotating beam laser level
and a purpose-built precision leveling rod was presented. The
methodology and devices were detailed to include techniques for data 0
reduction and presentation. Finally, the measuring method was
demonstrated and validated on a number of specimens: a granite
surface table, a plate specimen with noticeable curvature, and the top
flange and web of a plate girder. 0
6.2 Conclusions
The laser method of measuring out-of-flatness presented in this 9
thesis provides a simple, economical means of measuring nominally
horizontal and vertical surfaces in the field. The method requires only
one measurer and will determine the surface profile of a plate to
within +/-0.009". Time to measure a 12"X12" field with a 1" grid is •
about 45 minutes for a nominally horizontal surface. Time increases to
about 60 minutes for a nominally vertical surface. The range over
which measurements can be made varies from about five feet in direct
47 S

S
48
bright sunlight to over ten feet in normal interior lighting conditions.
Range is not a limiting factor over the short ranges associated with out-
of-flatness measurement.
The laser detector is ineffective as an alternative device to take
rod readings.
The automatic optical level can be used to measure nominally
horizontal surfaces with greater accuracy and in less time than the laser
method. However, the optical method requires two people, increases
the chance of human errors, can only be used on nominally horizontal S
surfaces, and can require the level operator to assume difficult
positions while sighting on the rod. The minimum focus range of theoptical level may further limit its use on certain specimens. Unlessgreater accuracy is required, the use of an optical level in out-of-flatness 5
measurement is not recommended.
Data reduction and presentation is greatly facilitated by the
power of a spreadsheet program and its associated graphing capabilities.
Graphing features like scale-sizing, grid lines and color contouring areeffective in enhancing the presentation. Magnitudes and patterns ofdeviation from a selected reference plane are readily apparent.Immediate qualitative judgements can be made about the severity of
out-of-flatness. Profiles of different specimens are easily compared. S
Using an arbitrary reference plane will still allow an accuratedepiction of the surface profile. However, a regression analysis can be
run on the data point coordinates to obtain a "best fit" reference plane.A "best fit" plane will minimize deviations and provides a more S
rational reduction and presentation of data by eliminating the "tilting"
effect of an arbitrarily selected reference plane.

6
REFERENCES
1. Spiegel, M.R., Mathematical Handbook of Formulas and Tables,McGraw-Hill, Inc., 1968, pp. 47-48.
2. Laser Alignment, Inc., Sales Division, 2850 Thornhills SE, GrandRapids, MI 49546, 800-4-LASERS.
3. Price, W.F., and Uren, J., Laser Surveying, Van NostrandReinhold (International) Co. Ltd, 1989.
4. Laser Alignment, Inc., LB-5 Operation Manual, 2850 ThornhillsSE, Grand Rapids, MI 49546, 800-4-LASERS.
5. MTI Corp., Mitutoyo Measuring Instruments, Catalog No. 9000,Paramus, NJ, 07652-1990, 201-368-0525, pp. 396-397. 0
6. Anthony, D.M., Engineering Metrology, Pergamon Press, 1986, p.
43.
7. Strang, Gilbert, Linear Algebra and Its Applications, HarcourtBrace Jovanovich, Inc., 1988.
49 0
S
VITA
Todd Thomas Tamura was born in Tacoma, Washington State, onOctober 20, 1962, the son of Thomas T. Tamura and Maile T. Tamura.He graduated from Bishop Ireton High School, Alexandria, Virginia, in
1980. He received the degree of Bachelor of Science from The United
States Air Force Academy and was commissioned an officer in the
United States Air Force in 1984. He graduated from pilot training in
1985 and in following years was employed as an F-16 pilot. He continues
to serve on active duty. In June, 1992, he entered The Graduate School
of The University of Texas. Upon completion of his work at the
University of Texas, he will instruct at The United States Air Force
Academy.
Permanent Address: 19115-D Beachcrest Ln.
Huntington Beach, California 92646
This thesis was typed by the author.
0


![tardir/mig/a301923 · TCN Number: 94020 Scientific Services Program Accesion For NTI3 CRASI DTIC TAB Ufianr'iOisi'iced Justification By Distribution / V] u Availability Cocas Dist](https://static.fdocuments.in/doc/165x107/606f3eed4726b1473b2f94ca/tardirmiga301923-tcn-number-94020-scientific-services-program-accesion-for-nti3.jpg)
![Blue-Green Lasers and Electrodeless Flashlamps Lasers and Electrodeless Flashlamps F. W. Perkins CIAM * Accesion For7 DTIC TAB [] Urnannouriced lI Justification By Dist ibutio.. August](https://static.fdocuments.in/doc/165x107/5ab786897f8b9a684c8b991e/blue-green-lasers-and-electrodeless-flashlamps-lasers-and-electrodeless-flashlamps.jpg)


![D-A259 350 - Defense Technical Information Center 350 ptoved foe pubHe DistrEbutlM UnUnated 4. BRAZIL and the vital SOUTH ATLANTIC Accesion For NTIS CRA& OTIC TAB i] Unannounced 0](https://static.fdocuments.in/doc/165x107/5b05de607f8b9a93418bf9ec/d-a259-350-defense-technical-information-350-ptoved-foe-pubhe-distrebutlm-ununated.jpg)