® IBM Software Group © 2011 IBM Corporation RDz Workbench – Debugging z/OS COBOL Applications...
19
® IBM Software Group © 2011 IBM Corporation RDz Workbench – Debugging z/OS COBOL RDz Workbench – Debugging z/OS COBOL Applications Applications Batch COBOL Debugging Batch COBOL Debugging Workshop Workshop Jon Sayles, Rational System z Products - [email protected]
-
Upload
luke-small -
Category
Documents
-
view
233 -
download
0
Transcript of ® IBM Software Group © 2011 IBM Corporation RDz Workbench – Debugging z/OS COBOL Applications...
®
IBM Software Group
© 2011 IBM Corporation
RDz Workbench – Debugging z/OS COBOL ApplicationsRDz Workbench – Debugging z/OS COBOL Applications
Batch COBOL Debugging WorkshopBatch COBOL Debugging Workshop
Jon Sayles, Rational System z Products - [email protected]
2
Using this PowerPoint Slide DeckThere are two types of slides in this PowerPoint:
1. Workshop slides: These are slides that will help you master RDz through technical
development techniques and hands-on exercises
Workshop slides have this character: in the slide header– Note that some workshop slides have the word "Workshop" in the slide header
– However all workshop slides have the character in the slide header
2. Learning content: Any slide that doesn't contain a character in the slide header contains
conceptual learning material– To be read for understanding– Often these slides are preparation for the workshop exercises that follow
There are additional Powerpoint slides that contain deep RDz learning content, without exercises and without lab instructions If you want to learn more about any particular RDz topic, you can
learn more about it from the Powerpoint slides.
3
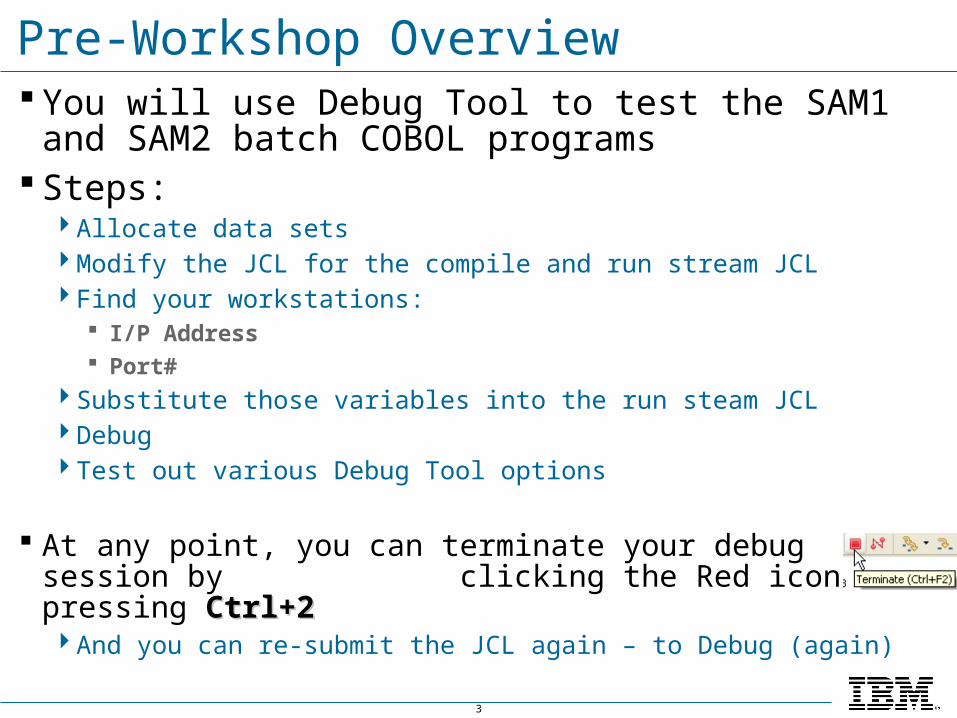
Pre-Workshop Overview You will use Debug Tool to test the SAM1 and SAM2
batch COBOL programs Steps:
Allocate data setsModify the JCL for the compile and run stream JCLFind your workstations:
I/P Address Port#
Substitute those variables into the run steam JCLDebugTest out various Debug Tool options
At any point, you can terminate your debug session by clicking the Red icon or pressing Ctrl+2Ctrl+2And you can re-submit the JCL again – to Debug (again)
4
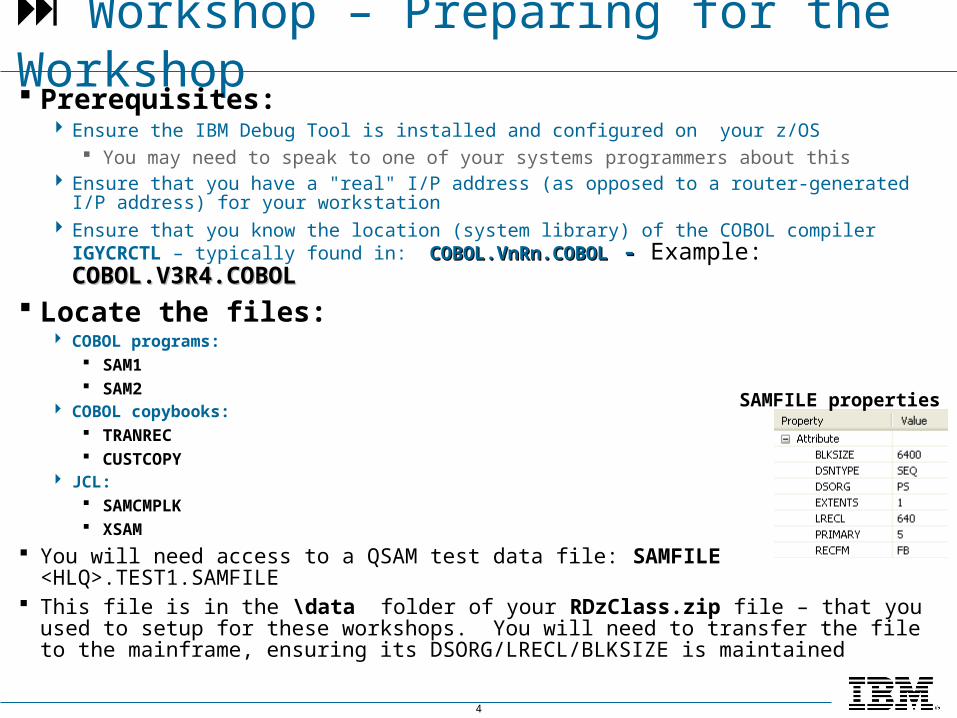
Workshop – Preparing for the Workshop Prerequisites:
Ensure the IBM Debug Tool is installed and configured on your z/OS You may need to speak to one of your systems programmers about this
Ensure that you have a "real" I/P address (as opposed to a router-generated I/P address) for your workstation
Ensure that you know the location (system library) of the COBOL compiler IGYCRCTL – typically found in: COBOL.VnRn.COBOLCOBOL.VnRn.COBOL - - Example: COBOL.V3R4.COBOLCOBOL.V3R4.COBOL
Locate the files: COBOL programs:
SAM1 SAM2
COBOL copybooks: TRANREC CUSTCOPY
JCL: SAMCMPLK XSAM
You will need access to a QSAM test data file: SAMFILE <HLQ>.TEST1.SAMFILE This file is in the \data folder of your RDzClass.zip file – that you used to setup for
these workshops. You will need to transfer the file to the mainframe, ensuring its DSORG/LRECL/BLKSIZE is maintained
SAMFILE properties
5
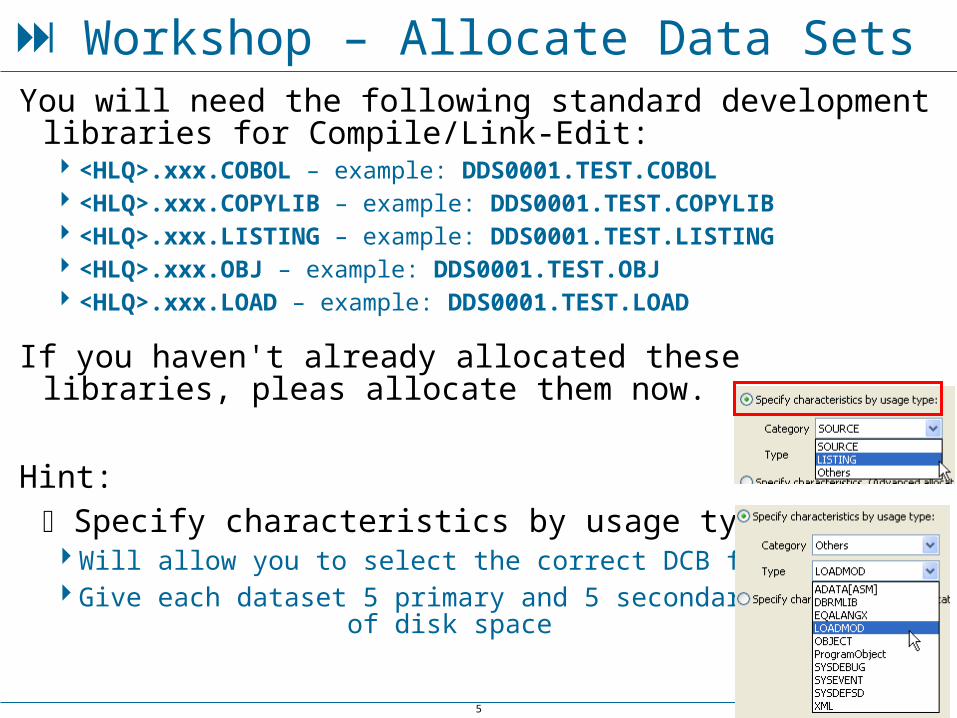
You will need the following standard development libraries for Compile/Link-Edit: <HLQ>.xxx.COBOL – example: DDS0001.TEST.COBOL <HLQ>.xxx.COPYLIB – example: DDS0001.TEST.COPYLIB <HLQ>.xxx.LISTING – example: DDS0001.TEST.LISTING <HLQ>.xxx.OBJ – example: DDS0001.TEST.OBJ <HLQ>.xxx.LOAD – example: DDS0001.TEST.LOAD
If you haven't already allocated these libraries, pleas allocate them now.
Hint: Specify characteristics by usage type:Will allow you to select the correct DCB for the filesGive each dataset 5 primary and 5 secondary TRKS of
disk space
Workshop – Allocate Data Sets
6
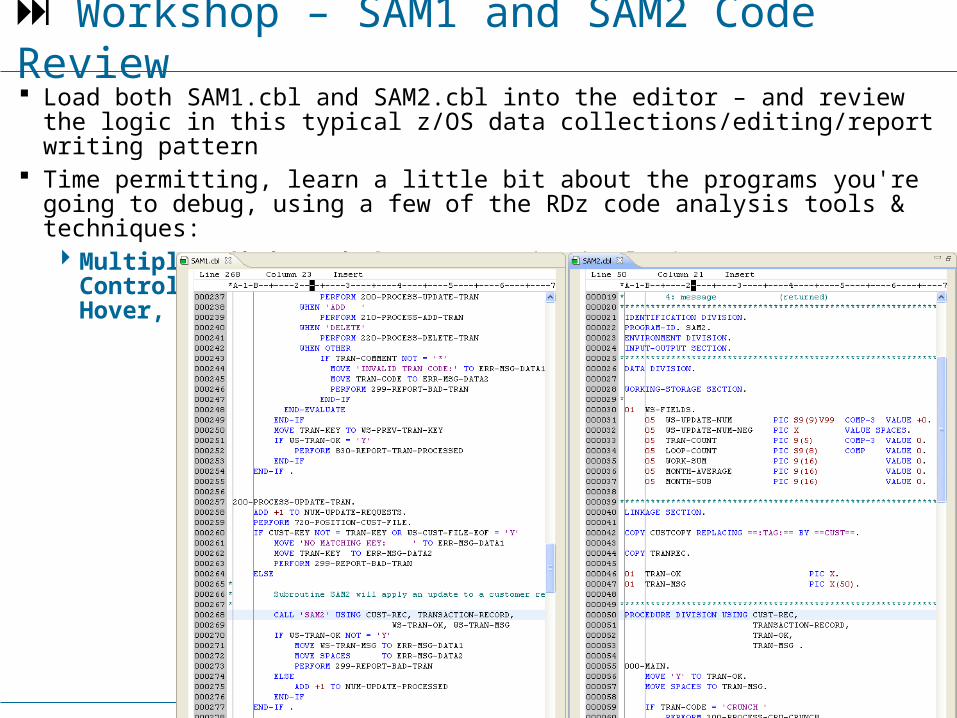
Workshop – SAM1 and SAM2 Code Review Load both SAM1.cbl and SAM2.cbl into the editor – and review the logic in this
typical z/OS data collections/editing/report writing pattern Time permitting, learn a little bit about the programs you're going to debug, using a
few of the RDz code analysis tools & techniques: Multiple editing windows to study the logic, Program Control Flow, Perform
Hierarchy, navigation techniques, Hover, etc.
7
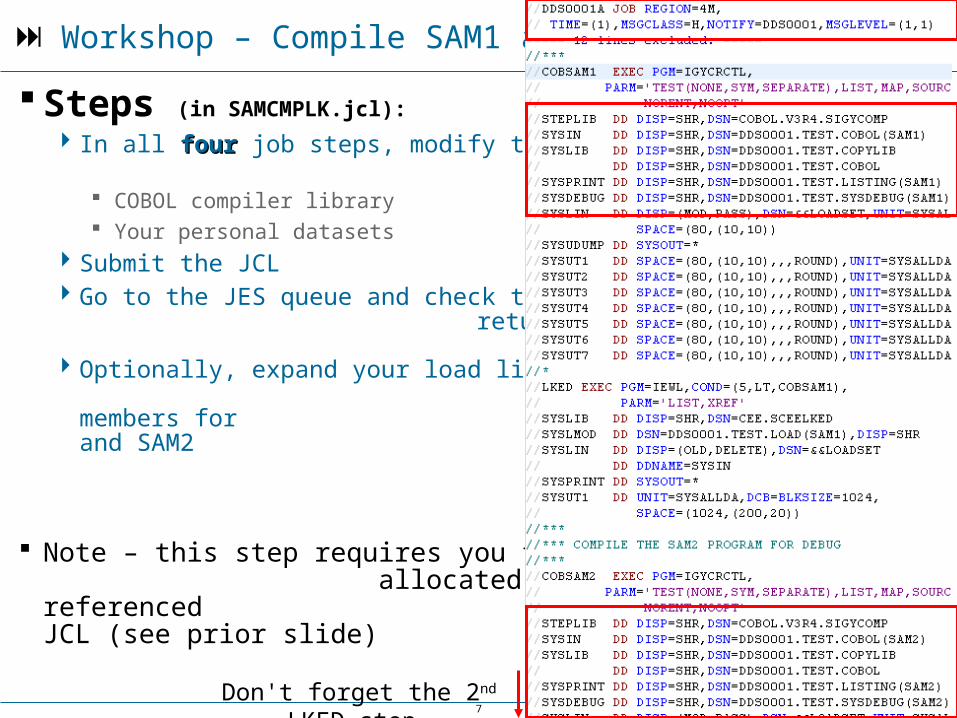
Workshop – Compile SAM1 and SAM2
Steps (in SAMCMPLK.jcl):
In all fourfour job steps, modify the library names for: COBOL compiler library Your personal datasets
Submit the JCL Go to the JES queue and check the
return codes for each step
Optionally, expand your load library and ensure that there are members for SAM1 and SAM2
Note – this step requires you to have allocated all of the datasets referenced in the JCL (see prior slide)
Don't forget the 2nd LKED step
8
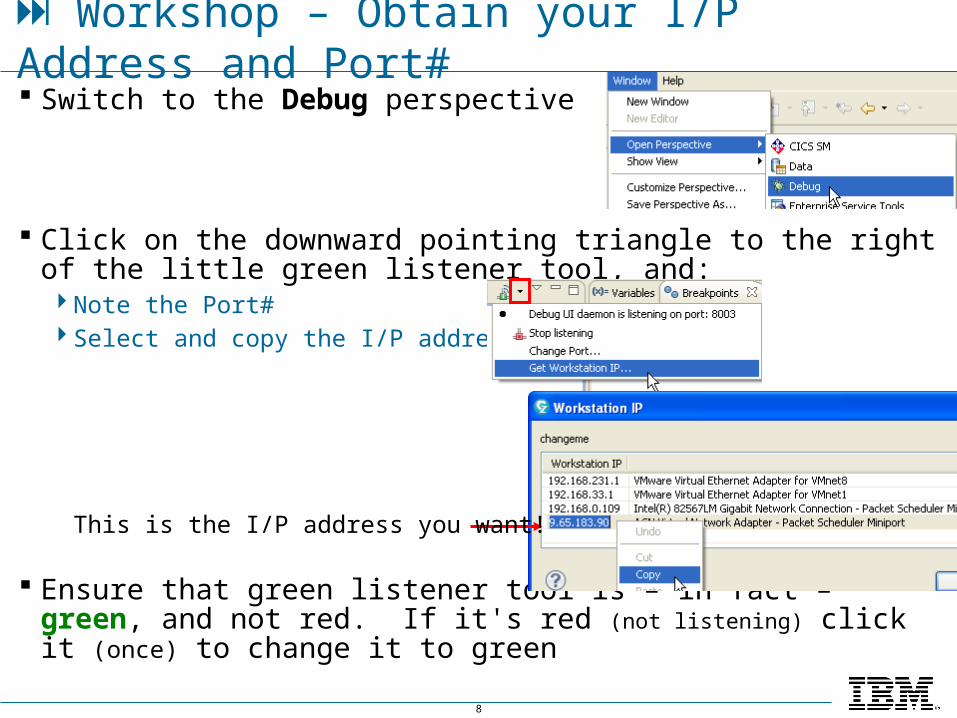
Switch to the Debug perspective
Click on the downward pointing triangle to the right of the little green listener tool, and:Note the Port#Select and copy the I/P address
Ensure that green listener tool is – in fact – green, and not red. If it's red (not listening) click it (once) to change it to green
Workshop – Obtain your I/P Address and Port#
This is the I/P address you want!
9
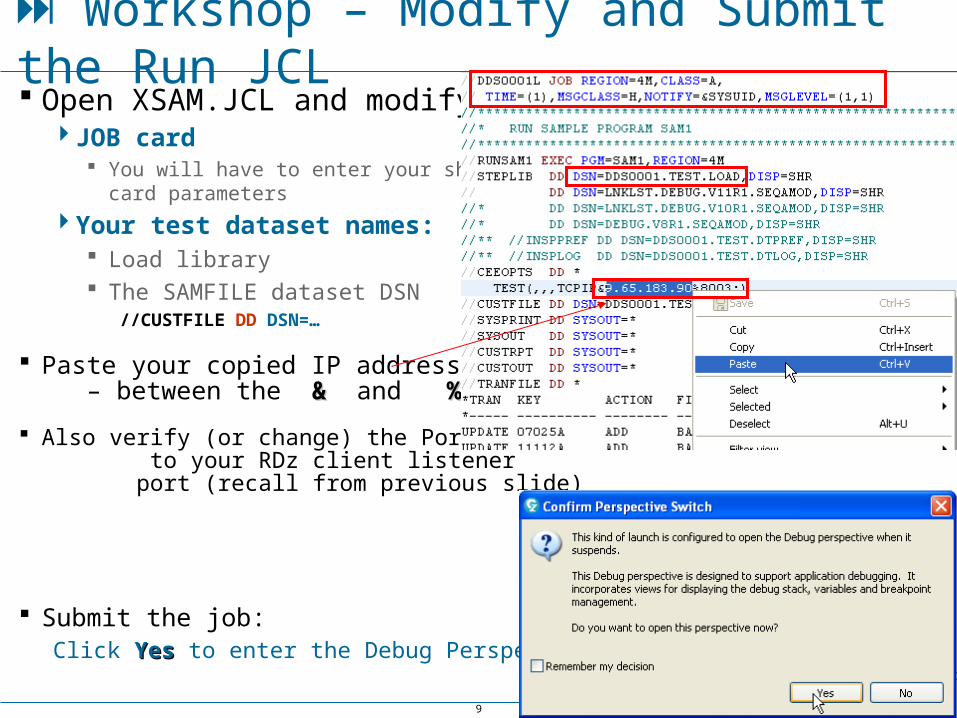
Open XSAM.JCL and modify:JOB card
You will have to enter your shop's specific JOB card parameters
Your test dataset names: Load library The SAMFILE dataset DSN
//CUSTFILE DD DSN=…
Paste your copied IP address – between the && and %%
Also verify (or change) the Port # to your RDz client listener port (recall from previous slide)
Submit the job:Click YesYes to enter the Debug Perspective
Workshop – Modify and Submit the Run JCL
10
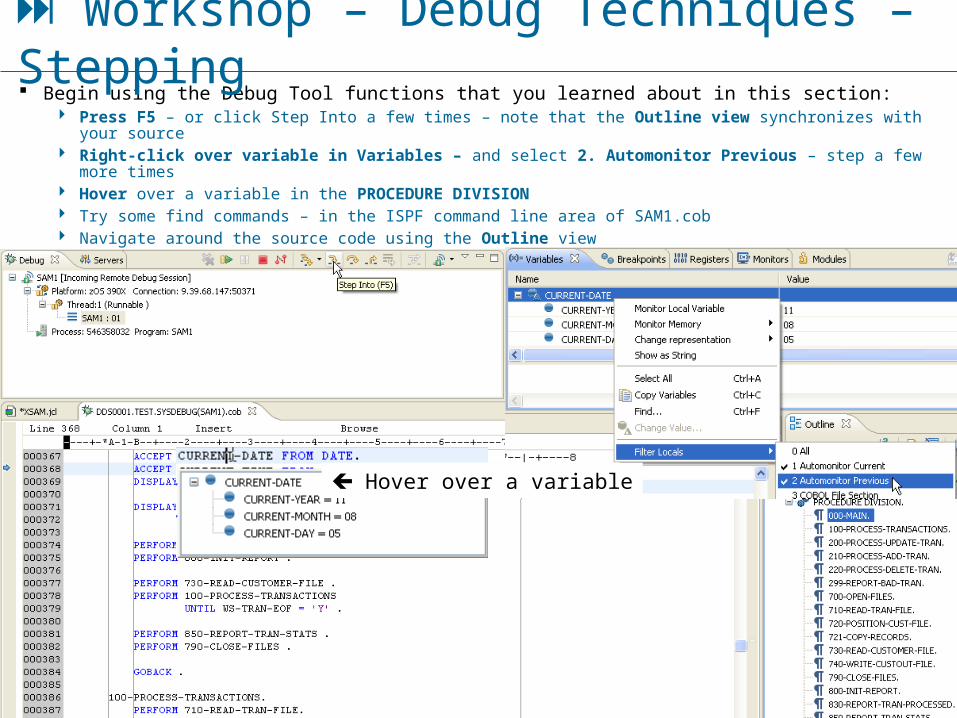
Begin using the Debug Tool functions that you learned about in this section: Press F5 – or click Step Into a few times – note that the Outline view synchronizes with your source Right-click over variable in Variables – and select 2. Automonitor Previous – step a few more times Hover over a variable in the PROCEDURE DIVISION Try some find commands – in the ISPF command line area of SAM1.cob Navigate around the source code using the Outline view Press F6 – a few times. It will act the same as F5 until you get to a CALL statement
Workshop – Debug Techniques – Stepping
Hover over a variable
Hover over a variable
11
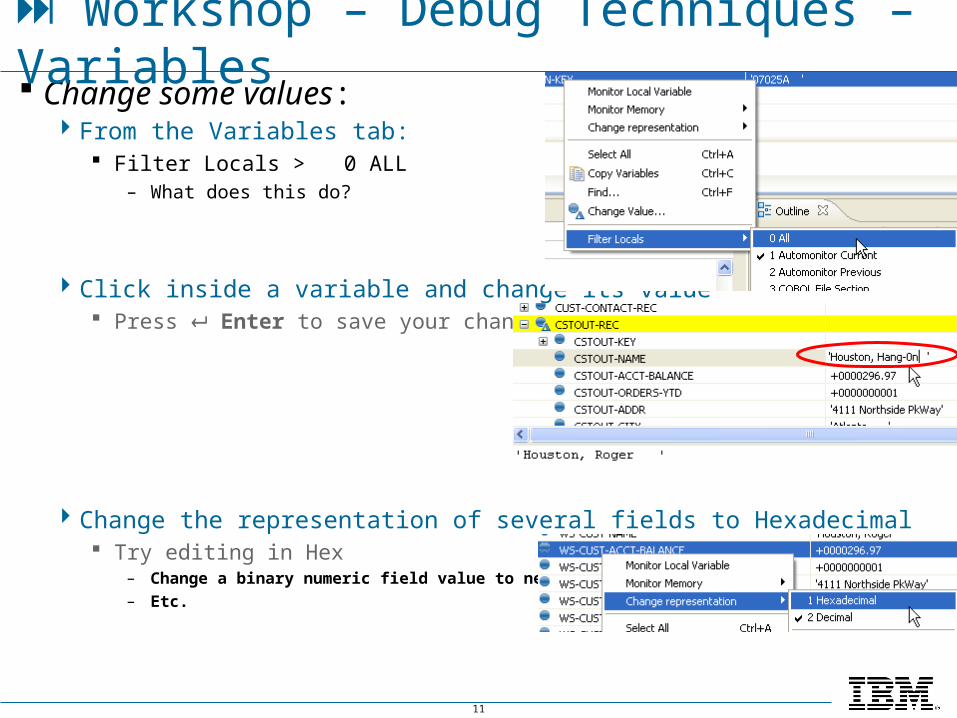
Change some values: From the Variables tab:
Filter Locals > 0 ALL– What does this do?
Click inside a variable and change its value Press Enter to save your change
Change the representation of several fields to Hexadecimal Try editing in Hex
– Change a binary numeric field value to negative– Etc.
Workshop – Debug Techniques – Variables
12
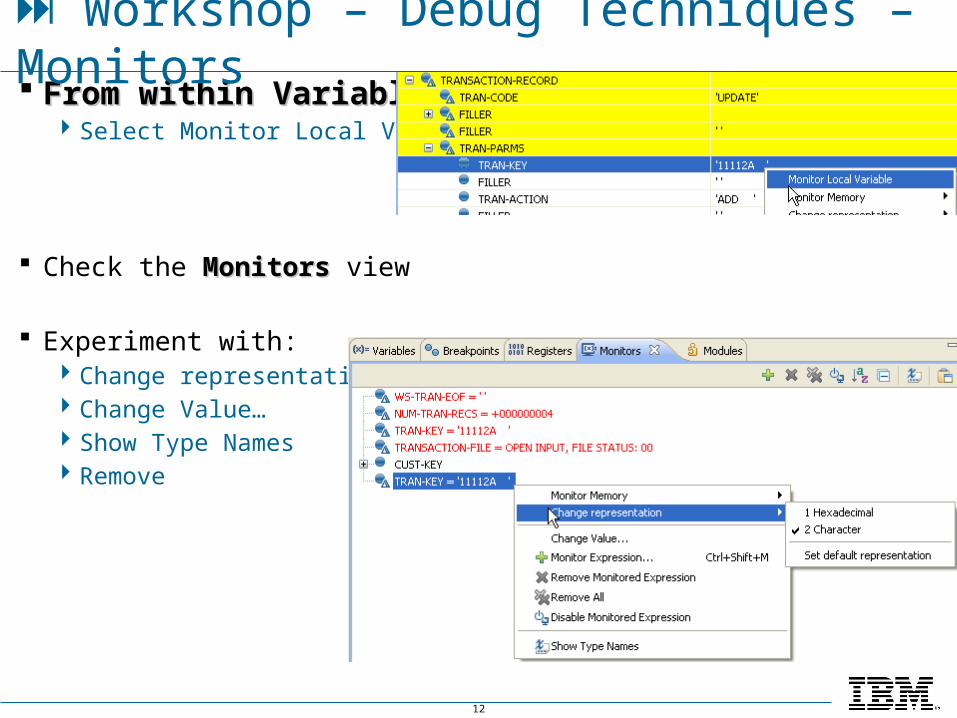
From within VariablesFrom within Variables Select Monitor Local Variable
Check the MonitorsMonitors view
Experiment with: Change representation Change Value… Show Type Names Remove
Workshop – Debug Techniques – Monitors
13
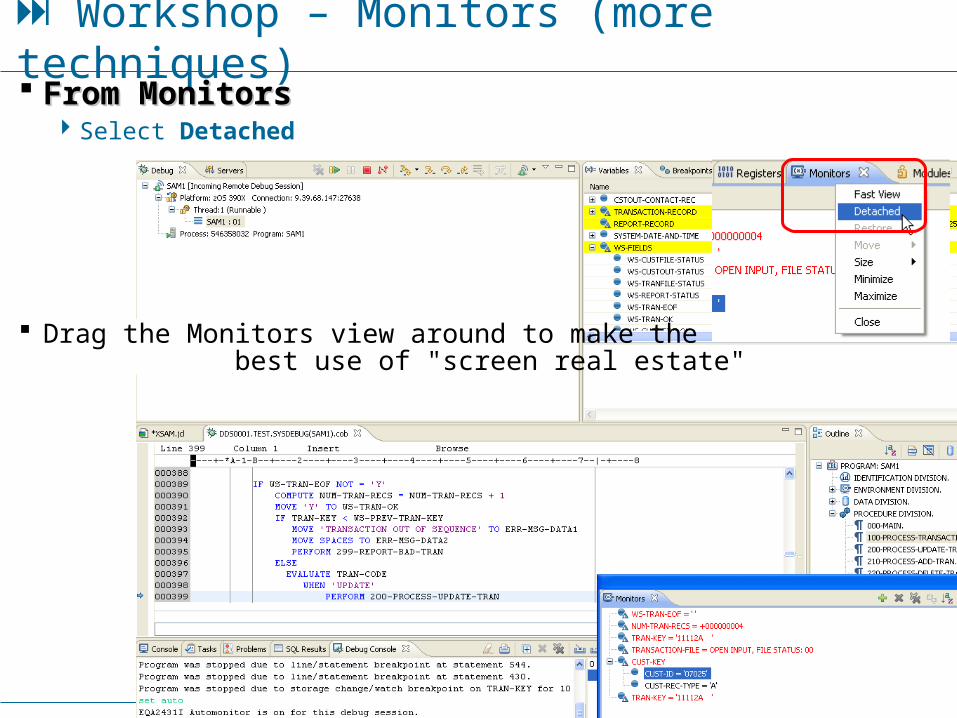
Workshop – Monitors (more techniques) From MonitorsFrom Monitors
Select Detached
Drag the Monitors view around to make the best use of "screen real estate"
14
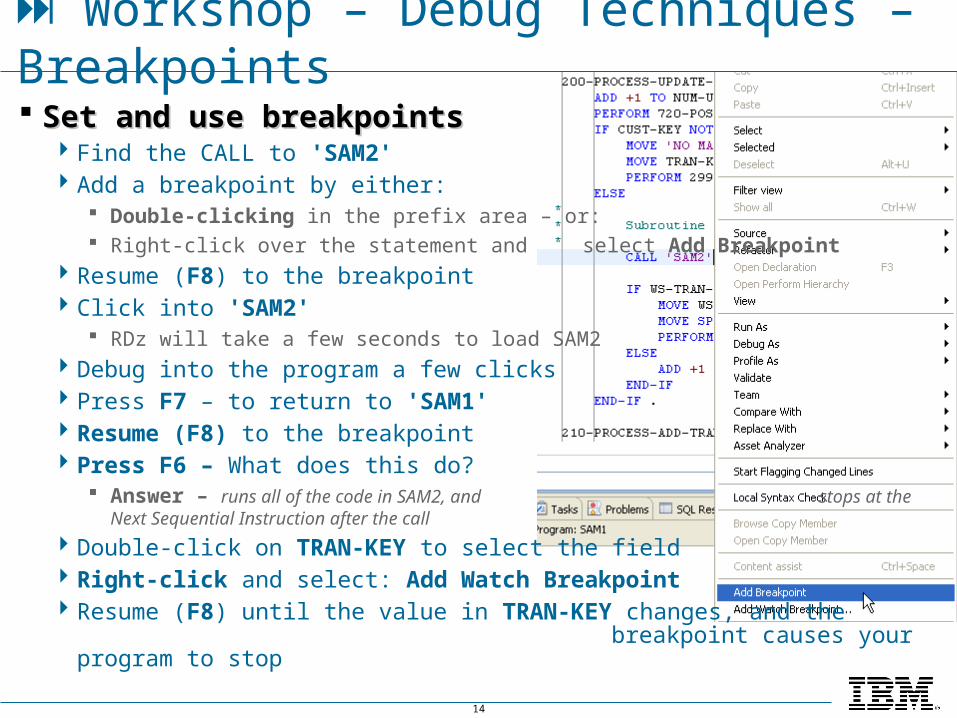
Set and use breakpointsSet and use breakpoints Find the CALL to 'SAM2' Add a breakpoint by either:
Double-clicking in the prefix area – or: Right-click over the statement and
select Add Breakpoint Resume (F8) to the breakpoint Click into 'SAM2'
RDz will take a few seconds to load SAM2 Debug into the program a few clicks Press F7 – to return to 'SAM1' Resume (F8) to the breakpoint Press F6 – What does this do?
Answer – runs all of the code in SAM2, and stops at the Next Sequential Instruction after the call
Double-click on TRAN-KEY to select the field Right-click and select: Add Watch Breakpoint Resume (F8) until the value in TRAN-KEY changes, and the
breakpoint causes your program to stop
Workshop – Debug Techniques – Breakpoints
15
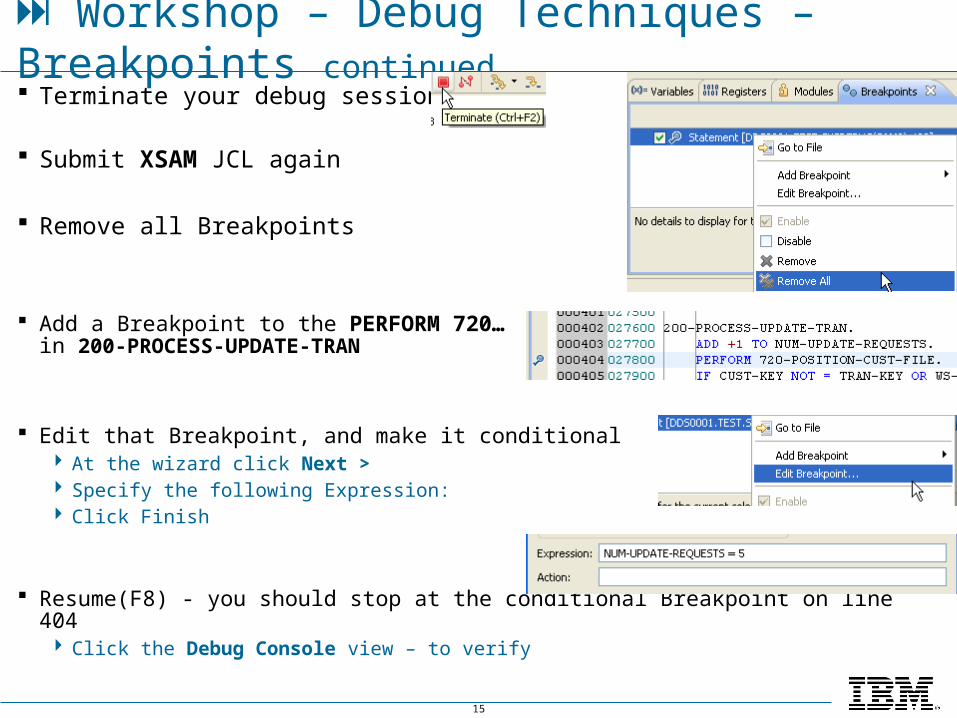
Terminate your debug session
Submit XSAM JCL again
Remove all Breakpoints
Add a Breakpoint to the PERFORM 720… statement in 200-PROCESS-UPDATE-TRAN
Edit that Breakpoint, and make it conditional At the wizard click Next > Specify the following Expression: Click Finish
Resume(F8) - you should stop at the conditional Breakpoint on line 404 Click the Debug Console view – to verify
Workshop – Debug Techniques – Breakpoints continued
16
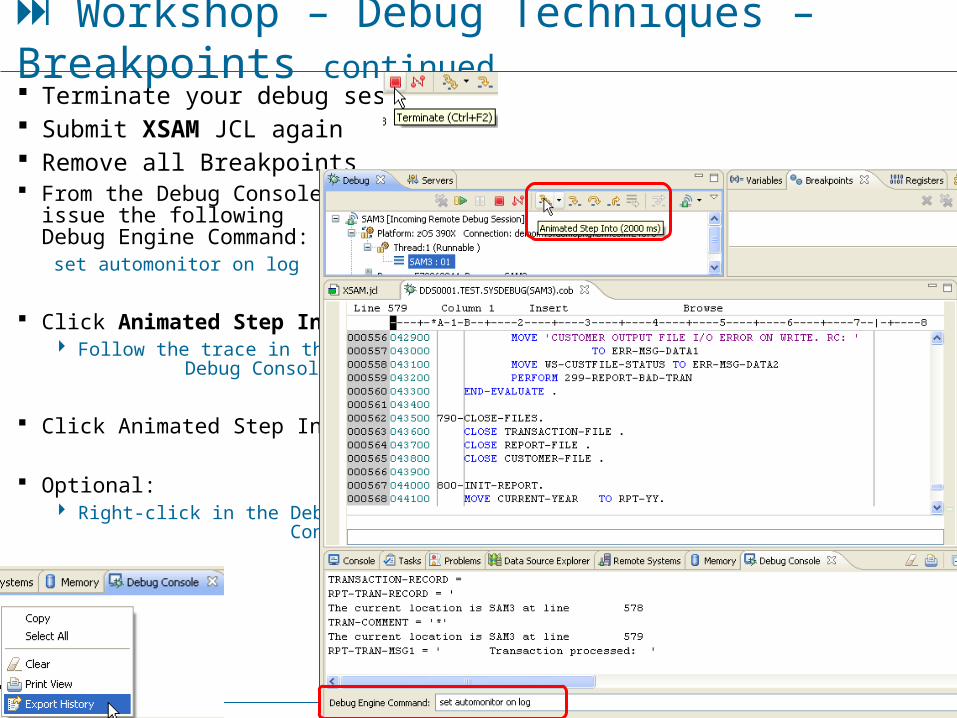
Terminate your debug session Submit XSAM JCL again Remove all Breakpoints From the Debug Console
issue the following Debug Engine Command:
set automonitor on log
Click Animated Step Into Follow the trace in the Debug
Console
Click Animated Step Into
Optional: Right-click in the Debug
Console and Export History – for your debug trace
Workshop – Debug Techniques – Breakpoints continued
17
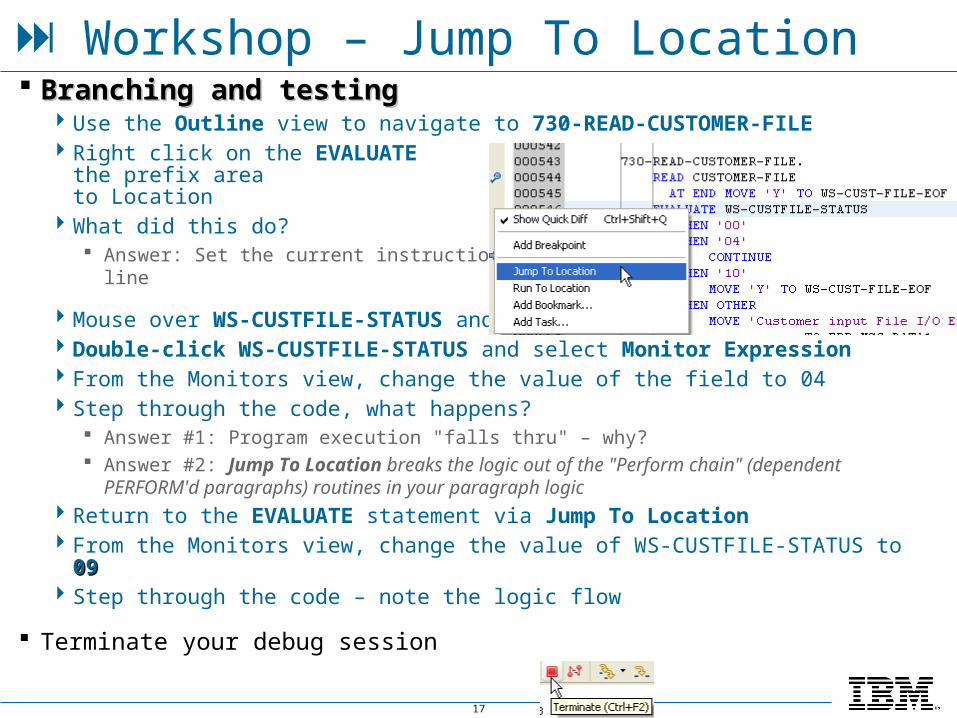
Branching and testingBranching and testing Use the Outline view to navigate to 730-READ-CUSTOMER-FILE Right click on the EVALUATE statement
and in the prefix area (on the left) select Jump to Location
What did this do? Answer: Set the current instruction pointer
to the line
Mouse over WS-CUSTFILE-STATUS and note its current value Double-click WS-CUSTFILE-STATUS and select Monitor Expression From the Monitors view, change the value of the field to 04 Step through the code, what happens?
Answer #1: Program execution "falls thru" – why? Answer #2: Jump To Location breaks the logic out of the "Perform chain" (dependent
PERFORM'd paragraphs) routines in your paragraph logic Return to the EVALUATE statement via Jump To Location From the Monitors view, change the value of WS-CUSTFILE-STATUS to 0909 Step through the code – note the logic flow
Terminate your debug session
Workshop – Jump To Location
18
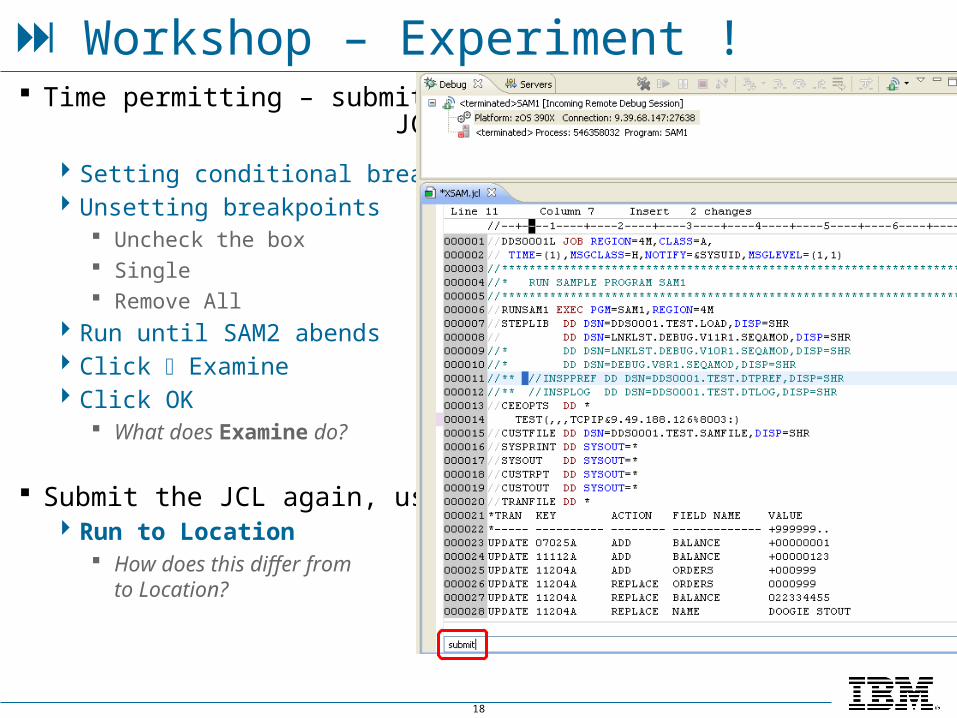
Time permitting – submit the JCL again, and try:
Setting conditional breakpoints Unsetting breakpoints
Uncheck the box Single Remove All
Run until SAM2 abends Click Examine Click OK
What does Examine do?
Submit the JCL again, use: Run to Location
How does this differ from Jump to Location?
Workshop – Experiment !
19
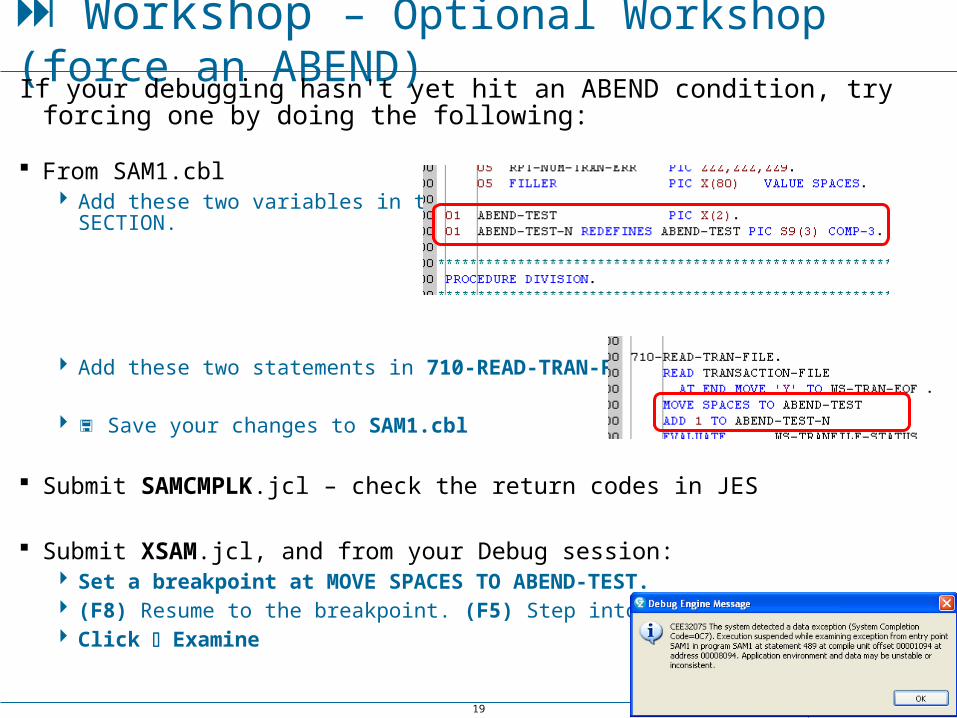
Workshop – Optional Workshop (force an ABEND)If your debugging hasn't yet hit an ABEND condition, try forcing one by doing
the following:
From SAM1.cbl Add these two variables in the
WORKING-STORAGE SECTION.
Add these two statements in 710-READ-TRAN-FILE.
Save your changes to SAM1.cbl
Submit SAMCMPLK.jcl – check the return codes in JES
Submit XSAM.jcl, and from your Debug session: Set a breakpoint at MOVE SPACES TO ABEND-TEST. (F8) Resume to the breakpoint. (F5) Step into the ABEND Click Examine