Growth & Nutrition in Cystic Fibrosis Assessing differences between two Wisconsin cohorts Claire...
14
Growth & Nutrition in Cystic Fibrosis Assessing differences between two Wisconsin cohorts Claire Clemens, MS, RD Pediatric Pulmonary Center Trainee January 24, 2012
-
Upload
vincent-parsons -
Category
Documents
-
view
219 -
download
2
Transcript of Growth & Nutrition in Cystic Fibrosis Assessing differences between two Wisconsin cohorts Claire...

Growth & Nutrition in Cystic FibrosisAssessing differences between two Wisconsin cohorts
Claire Clemens, MS, RDPediatric Pulmonary Center TraineeJanuary 24, 2012

Background
2005 MSN Benchmarking visit 2006 Return to clinic algorithm
2005 CFF recommendations: BMI goal = 50%tile
2009 CFF Infant Care Guidelines
Assume Greater focus on NUTRITION

Research Question
Does increased focus on nutrition improve growth outcomes in children with CF from 0-2 years?

Methodology
Retrospective medical record analysis Growth Feeding
Madison and Milwaukee CF centers
Cohort comparison: Born 2000-2004 Born 2006-2010

Cohort Characteristics
Characteristic 2000-2004 (n=53) 2006-2010 (n=37)
Age: Dx (mo) Mean 0.98 --
Median 0.30 --
Age: First visit (mo) Mean 1.48 1.00
Median 0.69 0.63
Gender Male 26 (49%) 16 (43%)
Female 27 (51%) 21 (57%)
Phenotype MI 8 (15%) 5 (13%)
PS 6 (11%) 11 (30%)
PI 39 (74%) 21 (57%)
Birth Wt (g) 3303 3260

Growth Outcomes
p = 0.5458
p = 0.0408
p = 0.0072

Growth Outcomes: PIp = 0.0184
p = 0.8406
p = 0.0570

Feeding Practices: Breastfeeding
Feeding practice 2000-2004 2006-2010
Ever BF# 4.99 5.59
Ex BF 1.26 1.63
Phenotype 2000-2004 2006-2010
MI 3/8 0/5
PS 2/6 4/11
PI 20/39 4/21
Never breastfed:
Average breastfeeding duration (mos):
#Ever BF = Ex BF + Partial BF
*p = 0.0108

Feeding Practices: Supplementation
High calorie formula or shakes
No difference in age when supplementation began
Phenotype 2000-2004 2006-2010
MI 3/8 0/5
PS 5/6 6/11
PI 27/39 2/21
Phenotype of subjects not receiving high calorie supplementation:
*p < 0.0001

Clinic Visits
Cumulative clinic visits through 24 months
*P = 0.0014#P = 0.0002+P < 0.0001
**
#
#
+
+

Infection
Mean positive sputum cultures through age 2 yr
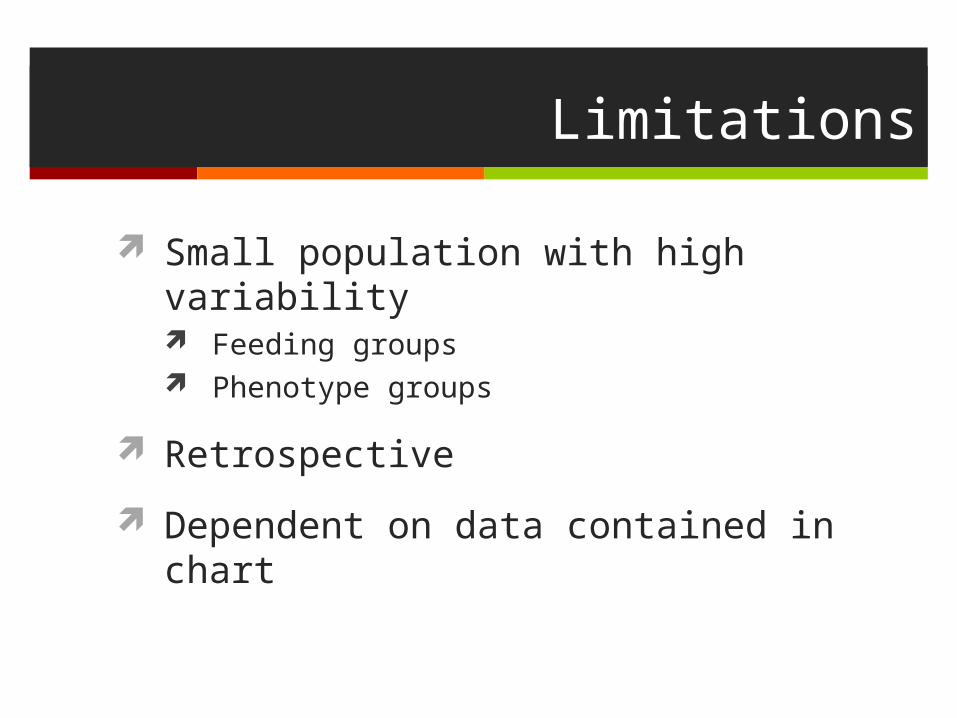
Limitations
Small population with high variability Feeding groups Phenotype groups
Retrospective
Dependent on data contained in chart

Conclusions
In more recent cohort:
More aggressive nutrition intervention may contribute to improved weight-for-length percentiles prior to age 2
More children were breastfed
More children received high calorie supplementation
Thank You!
Tami Miller
Dr. Lai’s lab: Zhumin Zhang Suzanne Shoff
Mary Marcus