
& Google Forms for Libraries Google Sheets Session 3A ... · Results from the form look like this:...
47
Google Sheets & Google Forms for Libraries By Helena Marvin [email protected] University of Missouri-St. Louis Reference / Institutional Repository Librarian Session 3A March 1st, 2017
Transcript of & Google Forms for Libraries Google Sheets Session 3A ... · Results from the form look like this:...

Google Sheets& Google Formsfor Libraries
By Helena Marvin [email protected] of Missouri-St. LouisReference / Institutional Repository Librarian
Session 3A March 1st, 2017

Established 1963
Commuter school
~15K students
Two libraries in one:Thomas Jefferson Library & Mercantile Library
University of Missouri-St. Louis

Journal Review Project
Public Service Desk Statistics
A one time review of 270 resources by 11 librarians.
The ongoing collection of information regarding patron interactions at the desk.
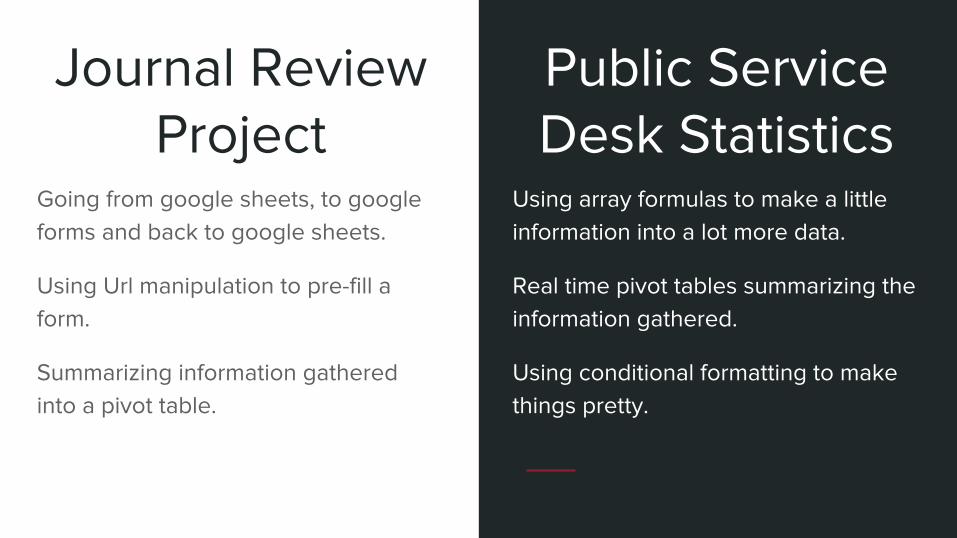
Using array formulas to make a little information into a lot more data.
Real time pivot tables summarizing the information gathered.
Using conditional formatting to make things pretty.
Going from google sheets, to google forms and back to google sheets.
Using Url manipulation to pre-fill a form.
Summarizing information gathered into a pivot table.
Journal Review Project
Public Service Desk Statistics

Journal Review Project

The ChallengeStarting and ending with a spreadsheet.
Coordinating the notes of almost a dozen librarians responding to
hundreds of resource.


Added a link for voting.
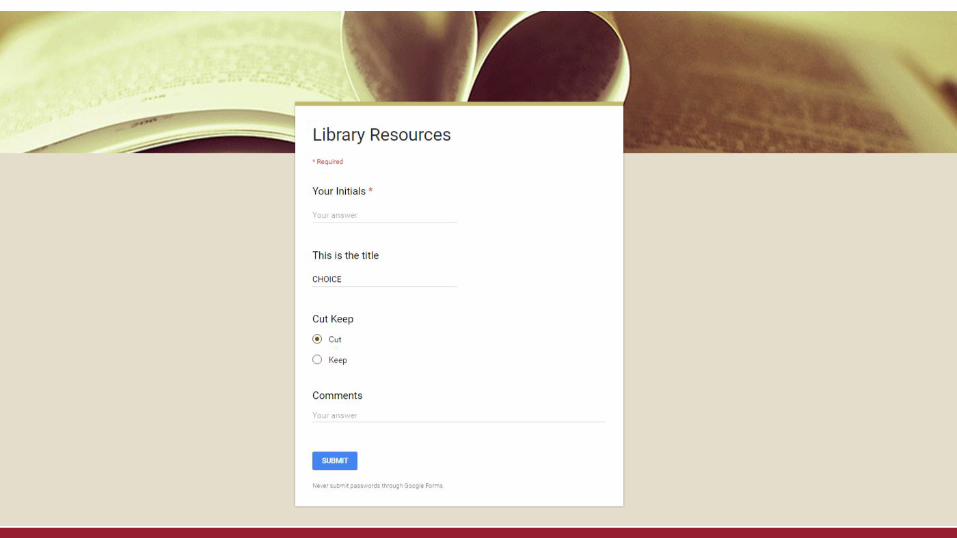

The Vote LinkSelectors filled out a lot of forms.

Documentation is wonderful!https://support.google.com/docs/answer/2839588
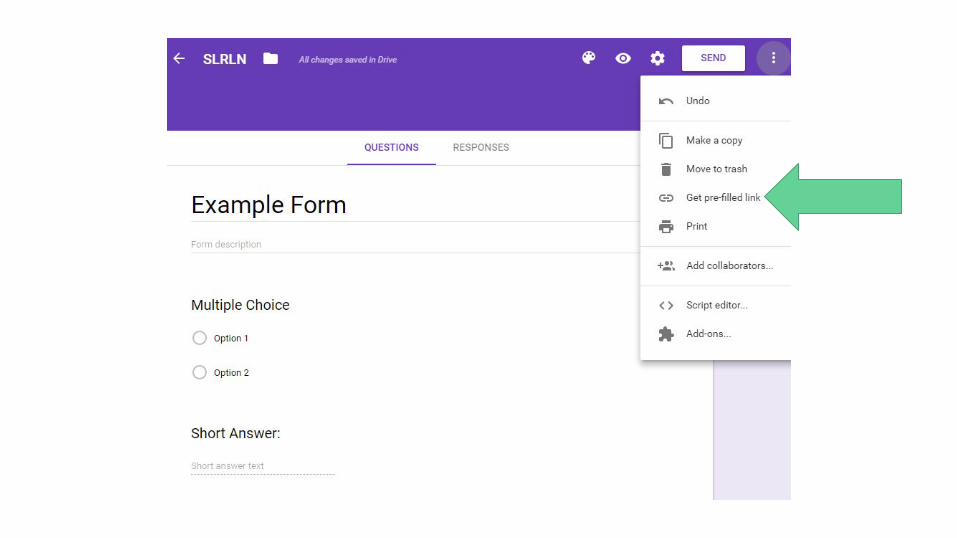

https://docs.google.com/forms/d/e/1FAIpQLSc2W2N4-f5s2NMNWwpBhqSftUuYn9ZxfeQ8B3GrC_g8OTYmtw/viewform?entry.693600165=PreFilled!

https://docs.google.com/forms/d/e/1FAIpQLSc2W2N4-f5s2NMNWwpBhqSftUuYn9ZxfeQ8B3GrC_g8OTYmtw/viewform?entry.693600165=PreFilled!
https://docs.google.com/forms/d/e/1FAIpQLSc2W2N4-f5s2NMNWwpBhqSftUuYn9ZxfeQ8B3GrC_g8OTYmtw/viewform?entry.693600165=Change%20the%20URL

The power of &
Appending strings to one another.
A1 is =TheB1 is =Presentation
=concatenate(a1,b1)Results: ThePresentation
Or =a1&b1Results: ThePresentation
Or =a1&“ ”&b1Results: The Presentation
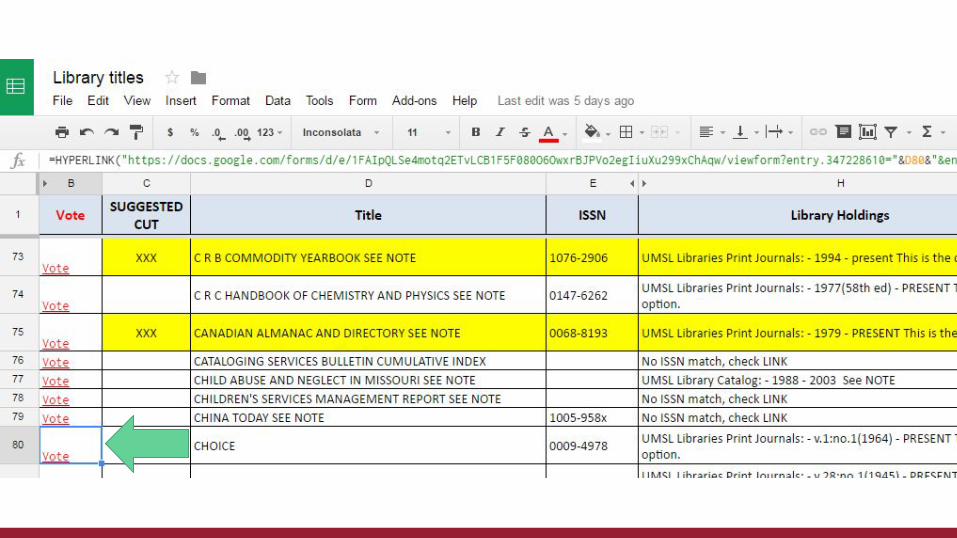

Prefilled Vote Link
Hyperlinks in sheets:https://support.google.com
/docs/answer/3093313?hl=en
=HYPERLINK("https://docs.google.com/forms/d/e/1FAIpQLSe4motq2ETvLCB1F5F080O6OwxrBJPVo2egIiuXu299xChAqw/viewform?entry.347228610="&D80&"&entry.1223291224=Cut&entry.1191583565","Vote")


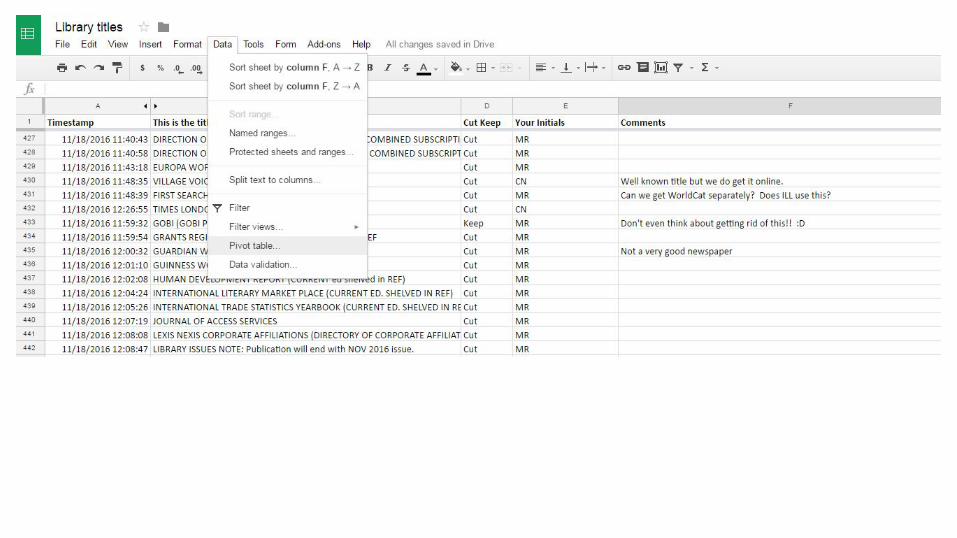
Results from the form look like this:
● Timestamp of when the form submitted● Title : what resource is being commented on● Vote to keep or cut the resource● Who is voting (librarian initials)● Any additional comments (optional)

The data collected consists of who voted (librarian initials), the vote to keep or cut, and any comments that were made about the resources.
Pivot TableA tool to summarize and explore
data interactively.


Resource Title Comments Initials Votes
___
_____
___
_____

The data collected helped decide what resources to keep and what to cut.
Our final results could also be sorted by cost.

Public Service Desk
Statistics

The ChallengeIt started with paper.
Going from paper to electronic statistics collection.

The sheets were collected and
counted up (by hand). Later that
data was compiled into a variety of
tables answering different questions.


We needed to collect equivalent information as we had with paper.
This collection form had to be
easy to use.

A form with three questions gives us four data points.

Monthly, weekly and yearly totals for reference, circulation, general inquiries, as occurred at the desk and on the phone.
The number of minutes extended sessions lasted, and when they occurred.
The paper could tell the story of what happened in a day and in a week. I wanted the data collected electronically to tell these same stories.
Not a lot of information, can really tell you a lot
When - Where - What


Combine: Where, What and say if it was extended.

This is power.It is intimidating. Luckily there is a lot of documentation.
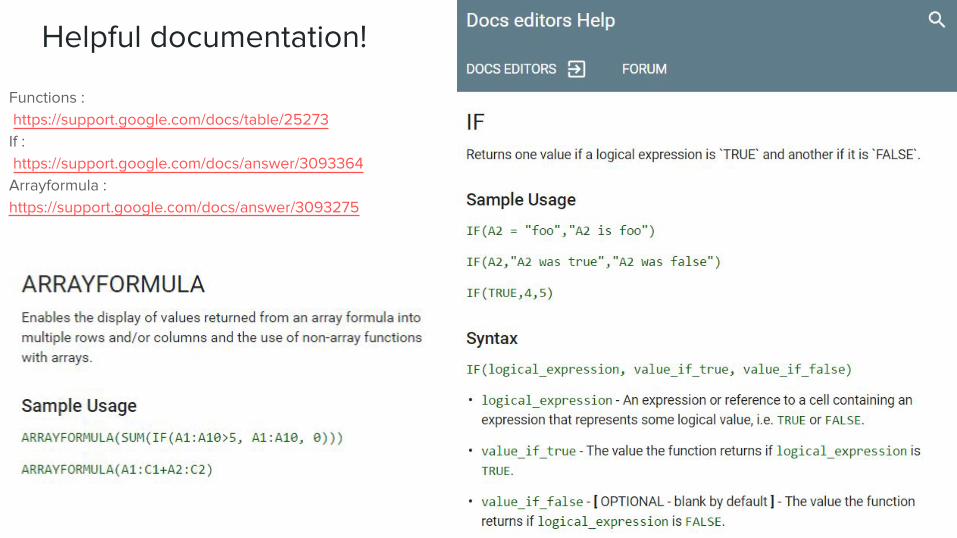
Functions : https://support.google.com/docs/table/25273If : https://support.google.com/docs/answer/3093364Arrayformula : https://support.google.com/docs/answer/3093275
Helpful documentation!

An array formula allows sheets to automagically extract the year from the timestamp for every entry to the form, including new entries.
Timestamp:YearMonth DayHour
For the first row ‘Year’, if the cell is empty stay empty, otherwise extract the year from timestamp (last 2 digits).

Thank goodness for documentation!
Text can be manipulated in a lot of ways in google sheets
Find out more:https://support.google.com/docs/answer/3094139?hl=en

Total number of interactions
Both regular and extended inquires.
The Rows are Month, Columns are TasksThe values displayed are the ‘counted’ sum of those tasks.

Total number of interactions
Regular and extended inquires presented separately
The Rows are Month, Columns are Tasks & Tasks Extended (separate columns)The values displayed are the ‘counted’ sum of those tasks.

Both the pivot table and the
colors are automatically generated!
Conditional format rules.

Pivot Tables Make Pretty Graphs


At the desk, showing day and hour and if extended (by how many 5 minute intervals)

8/25/2016 - today
Over 16,000 entries
Automatically Generated Real Time Patron Interaction
Statistics

Google Sheets Thank you& Google Forms for yourfor Libraries attention!
By Helena Marvin [email protected] of Missouri-St. LouisReference / Institutional Repository Librarian
Session 3A March 1st, 2017

Learning ResourcesIntroduction to Spreadsheets and Models - University of Pennsylvania ...https://www.coursera.org/learn/wharton-introduction-spreadsheets-modelsA free MOOC (massive open online course) useful for getting to know the power of spreadsheets.
Text Functions in Excel - EASY Excel Tutorialwww.excel-easy.com/functions/text-functions.htmlAn introduction to text basic manipulation in excel.
Google Sheets Lesson 3 – ARRAYFORMULA – Teacher Paulwww.teacherpaul.org/3063Paul has great video tutorials for using arrayformulas with google form results.
Learn To Use PivotTables - Build Reports, Analyze Data & Morewww.lynda.com/PivotTablesIf your library or a local library you’re a patron at has access to Lynda.com it is an amazing resource.
Google Spreadsheets | Charts | Google Developershttps://developers.google.com/chart/interactive/docs/spreadsheetsMaking charts with google spreadsheets.

Presentation available online athttps://works.bepress.com/LenaMarvin/5/


