
[ Getting Started with Analyzer ... - Pentaho User...
30
Version 5.4 [ Getting Started with Analyzer, Interactive Reports, and Dashboards ] ] https://help.pentaho.com/Draft_Content/Version_5.4 Updated: Fri, 29 May 2015 14:52:00 GMT 1/30
Transcript of [ Getting Started with Analyzer ... - Pentaho User...

Version 5.4
[ Getting Started with Analyzer,Interactive Reports, and
Dashboards ]
]
https://help.pentaho.com/Draft_Content/Version_5.4Updated: Fri, 29 May 2015 14:52:00 GMT
1/30

Copyright Page
This document supports Pentaho Business Analytics Suite 5.4 GA and Pentaho Data Integration 5.4 GA,
documentation revision June 9th, 2015, copyright © 2015 Pentaho Corporation. No part may be reprinted
without written permission from Pentaho Corporation. All trademarks are the property of their respective
owners.
Help and Support Resources
To view the most up-to-date help content, visit https://help.pentaho.com.
If you do not find answers to your questions here, please contact your Pentaho technical support
representative.
Support-related questions should be submitted through the Pentaho Customer Support Portal at
http://support.pentaho.com.
For information about how to purchase support or enable an additional named support contact, please
contact your sales representative, or send an email to [email protected].
For information about instructor-led training, visit http://www.pentaho.com/training.
Liability Limits and Warranty Disclaimer
The author(s) of this document have used their best efforts in preparing the content and the programs
contained in it. These efforts include the development, research, and testing of the theories and programs to
determine their effectiveness. The author and publisher make no warranty of any kind, express or implied,
with regard to these programs or the documentation contained in this book.
The author(s) and Pentaho shall not be liable in the event of incidental or consequential damages in
connection with, or arising out of, the furnishing, performance, or use of the programs, associated instructions,
and/or claims.
Trademarks
The trademarks, logos, and service marks ("Marks") displayed on this website are the property of Pentaho
Corporation or third party owners of such Marks. You are not permitted to use, copy, or imitate the Mark, in
whole or in part, without the prior written consent of Pentaho Corporation or such third party. Trademarks of
Pentaho Corporation include, but are not limited, to "Pentaho", its products, services and the Pentaho logo.
https://help.pentaho.com/Draft_Content/Version_5.4/Copyright_PageUpdated: Fri, 29 May 2015 14:52:00 GMT
2/30
Trademarked names may appear throughout this website. Rather than list the names and entities that own the
trademarks or inserting a trademark symbol with each mention of the trademarked name, Pentaho
Corporation states that it is using the names for editorial purposes only and to the benefit of the trademark
owner, with no intention of infringing upon that trademark.
Third-Party Open Source Software
For a listing of open source software used by each Pentaho component, navigate to the folder that contains
the Pentaho component. Within that folder, locate a folder named licenses. The licenses folder contains
HTML.files that list the names of open source software, their licenses, and required attributions.
Contact Us
Global Headquarters Pentaho Corporation Citadel International, Suite 460
5950 Hazeltine National Drive Orlando, FL 32822
Phone: +1 407 812-OPEN (6736)
Fax: +1 407 517-4575
http://www.pentaho.com
Sales Inquiries: [email protected]
https://help.pentaho.com/Draft_Content/Version_5.4/Copyright_PageUpdated: Fri, 29 May 2015 14:52:00 GMT
3/30

Introduction
The User Console is a fun, easy to use, web-based design environment where you can analyze data, create
interactive reports, dashboard reports, and build integrated dashboards to share business intelligence
solutions with others in your organization and on the internet. In addition to its design features, the User
Console offers a wide variety of system administration features for configuring the Business Analytics (BA)
Server, maintaining Pentaho licences, setting up security, managing report scheduling, and tailoring system
performance to meet your requirements.
The topics found in this section give you an overview of the reports and dashboards you create with the User
Console, to help you became familiar with the look and feel of the console.
PrerequisitesBefore you can work with the User Console, you will have to have installed the Pentaho software and
configured the BA Server.
ExpertiseThe User Console does not require any special skills or knowledge to use its design environment. However, to
use its system administration features you should know where your data is stored and how to access it, as well
as details about your system configuration and security providers.
ToolsThrough the User Console you can access these Pentaho tools and features, as well as the BA Repository on
the BA Server.
Analyzer
Interactive Reports
Dashboard Reports
Dashboard Designer
Data Source Wizard
Data Source Model Editor
Login CredentialsThese tasks require that you login to the User Console with an evaluator user name and password.
https://help.pentaho.com/Documentation/5.4/0J0/0D0/000Updated: Fri, 29 May 2015 14:52:00 GMT
4/30
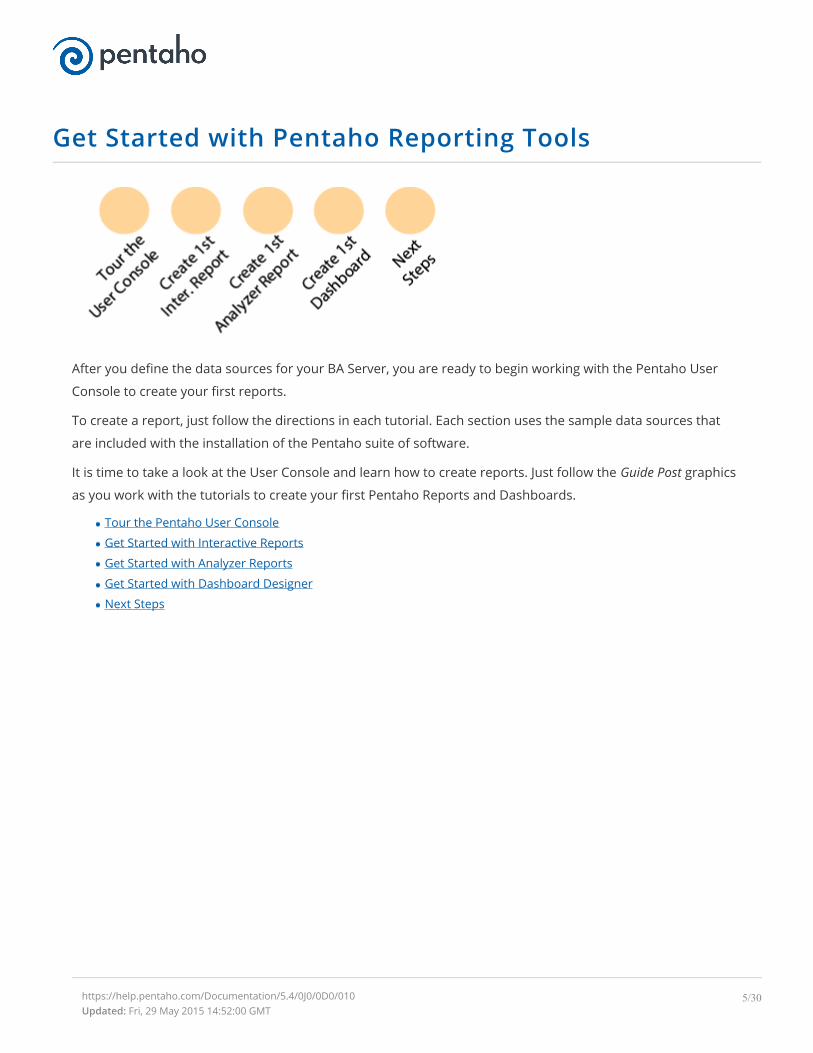
Get Started with Pentaho Reporting Tools
After you define the data sources for your BA Server, you are ready to begin working with the Pentaho User
Console to create your first reports.
To create a report, just follow the directions in each tutorial. Each section uses the sample data sources that
are included with the installation of the Pentaho suite of software.
It is time to take a look at the User Console and learn how to create reports. Just follow the Guide Post graphics
as you work with the tutorials to create your first Pentaho Reports and Dashboards.
Tour the Pentaho User Console
Get Started with Interactive Reports
Get Started with Analyzer Reports
Get Started with Dashboard Designer
Next Steps
https://help.pentaho.com/Documentation/5.4/0J0/0D0/010Updated: Fri, 29 May 2015 14:52:00 GMT
5/30

Quick Tour of the Pentaho User Console
If you use file management tools or any web browser, you should feel right at home with the Pentaho User
Console. To familiarize yourself with the different pages and controls of User Console, let us take you through
a quick tour.
Log In to the User ConsoleLogging in to the User Console for the first time is easy with these steps.
1. Launch any web browser and enter the URL of the Pentaho server. The page loads an introductoryscreen with a Login section.
2. Enter your user name and password and click Login, or use the Login as an Evaluator option.
HomeThe first thing you see after you login to the console is the Home page, which serves as the starting place for
the User Console and all of the tasks that you do with it.
https://help.pentaho.com/Documentation/5.4/0J0/0D0/020Updated: Fri, 29 May 2015 14:52:00 GMT
6/30

Item Name Function
Home view The Home drop-down menu lets you flip easily from page to page, orreturn to your Home page.
Getting StartedWelcome shows an introductory video about Pentaho
products.
Samples holds a variety of sample reports and dashboards
that you can use to get familiar with the software.
Tutorials contains a number of tutorial videos that give you a
visual tour of the User Console, reports, and dashboards.
Current User and LogOut
Shows the name of the person currently logged in to the User Console.Clicking the arrow next to the name lets you log out of the User Console.
Browse Files Brings you to the Browse Files window, where you can locate your filesusing the Browsing and Files panes, and manage them using the Actionspane. Any files that you open appear in a new window.
Create New Gives you choices to create a new Analysis report, Interactive report, orDashboard. You can also create a new Data Source, if you havepermissions to work with data sources.
Documentation Leads you to the Pentaho Documentation, which opens in a new windowor tab.
Recents, Favorites Shows a list of your most recently opened files. Clicking on the star next toa recently opened file adds it to your Favorites list.
https://help.pentaho.com/Documentation/5.4/0J0/0D0/020Updated: Fri, 29 May 2015 14:52:00 GMT
7/30

Browse FilesThe Browse Files page helps you keep your files organized and makes them easier for you to find and work
with.
OpenedThe Opened page activates after you open a file from the Browse Files page and provides a simple space to
work with your files.
https://help.pentaho.com/Documentation/5.4/0J0/0D0/020Updated: Fri, 29 May 2015 14:52:00 GMT
8/30
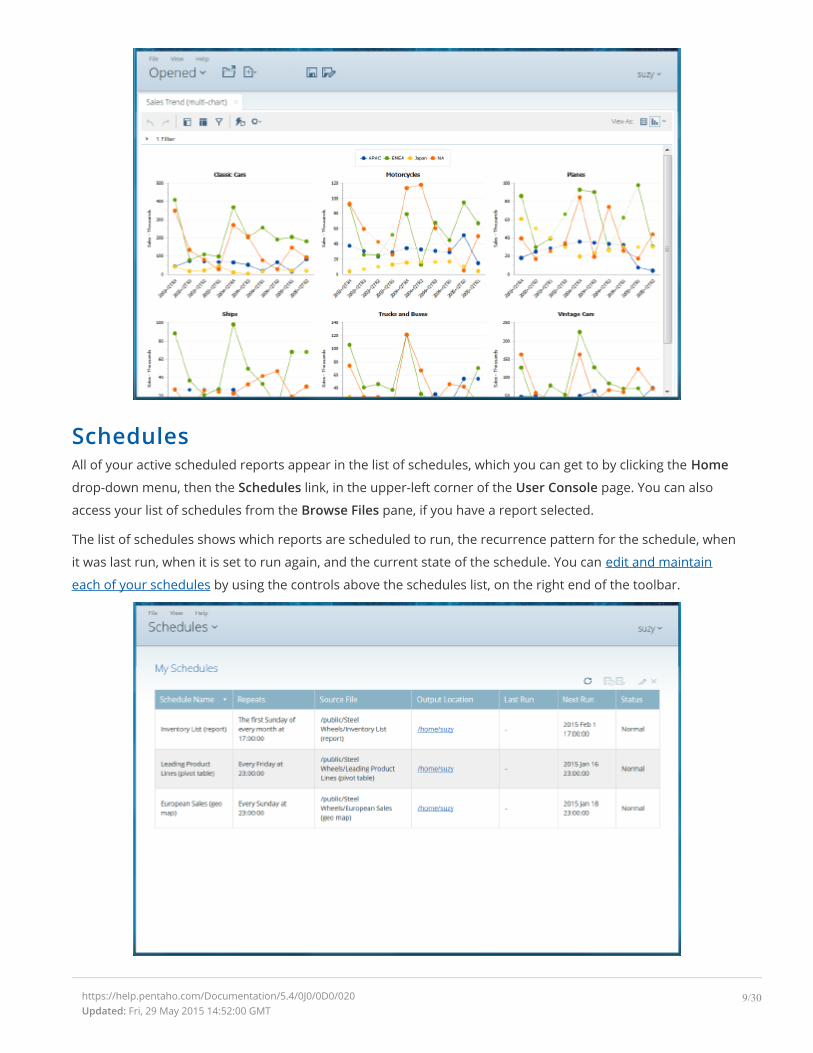
SchedulesAll of your active scheduled reports appear in the list of schedules, which you can get to by clicking the Home
drop-down menu, then the Schedules link, in the upper-left corner of the User Console page. You can also
access your list of schedules from the Browse Files pane, if you have a report selected.
The list of schedules shows which reports are scheduled to run, the recurrence pattern for the schedule, when
it was last run, when it is set to run again, and the current state of the schedule. You can edit and maintain
each of your schedules by using the controls above the schedules list, on the right end of the toolbar.
https://help.pentaho.com/Documentation/5.4/0J0/0D0/020Updated: Fri, 29 May 2015 14:52:00 GMT
9/30
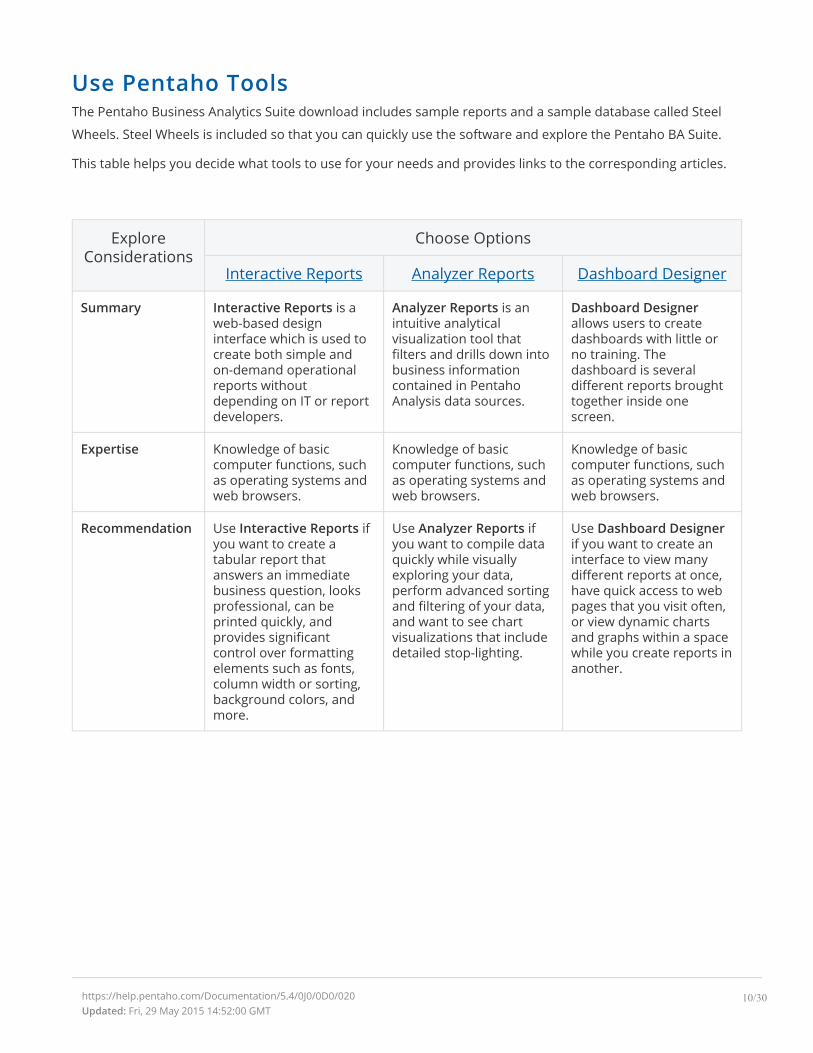
Use Pentaho ToolsThe Pentaho Business Analytics Suite download includes sample reports and a sample database called Steel
Wheels. Steel Wheels is included so that you can quickly use the software and explore the Pentaho BA Suite.
This table helps you decide what tools to use for your needs and provides links to the corresponding articles.
Choose OptionsExploreConsiderations
Interactive Reports Analyzer Reports Dashboard Designer
Summary Interactive Reports is aweb-based designinterface which is used tocreate both simple andon-demand operationalreports withoutdepending on IT or reportdevelopers.
Analyzer Reports is anintuitive analyticalvisualization tool thatfilters and drills down intobusiness informationcontained in PentahoAnalysis data sources.
Dashboard Designerallows users to createdashboards with little orno training. Thedashboard is severaldifferent reports broughttogether inside onescreen.
Expertise Knowledge of basiccomputer functions, suchas operating systems andweb browsers.
Knowledge of basiccomputer functions, suchas operating systems andweb browsers.
Knowledge of basiccomputer functions, suchas operating systems andweb browsers.
Recommendation Use Interactive Reports ifyou want to create atabular report thatanswers an immediatebusiness question, looksprofessional, can beprinted quickly, andprovides significantcontrol over formattingelements such as fonts,column width or sorting,background colors, andmore.
Use Analyzer Reports ifyou want to compile dataquickly while visuallyexploring your data,perform advanced sortingand filtering of your data,and want to see chartvisualizations that includedetailed stop-lighting.
Use Dashboard Designerif you want to create aninterface to view manydifferent reports at once,have quick access to webpages that you visit often,or view dynamic chartsand graphs within a spacewhile you create reports inanother.
https://help.pentaho.com/Documentation/5.4/0J0/0D0/020Updated: Fri, 29 May 2015 14:52:00 GMT
10/30
Get Started with Interactive Reports
Interactive Reports is a web-based interface which is used to create on-demand operational reports.
Interactive Reports is a web-based design interface which is used to create both simple and on-demand
operational reports without depending on IT or report developers. Use Interactive Reports if you want to
create a quick report that answers an immediate business question, looks professional, and provides
significant control over formatting elements such as fonts, column width or sorting, background colors, and
more.
If you want to start creating your first report right away, feel free to jump ahead to Create Your First Interactive
Report.
View an Interactive Report SampleThis section highlights some popular Interactive Report capabilities that are available, using the sample report
called Vendor Sales Report, located in the Getting Started widget.
1. In the Getting Started widget on the Home perspective, click the Samples tab.
https://help.pentaho.com/Documentation/5.4/0J0/0D0/030Updated: Fri, 29 May 2015 14:52:00 GMT
11/30

2. Click to select Vendor Sales from the scrolling panel on the right.
3. Click Explore in the Samples pane. A new window opens showing the Vendor Sales sample report.
https://help.pentaho.com/Documentation/5.4/0J0/0D0/030Updated: Fri, 29 May 2015 14:52:00 GMT
12/30
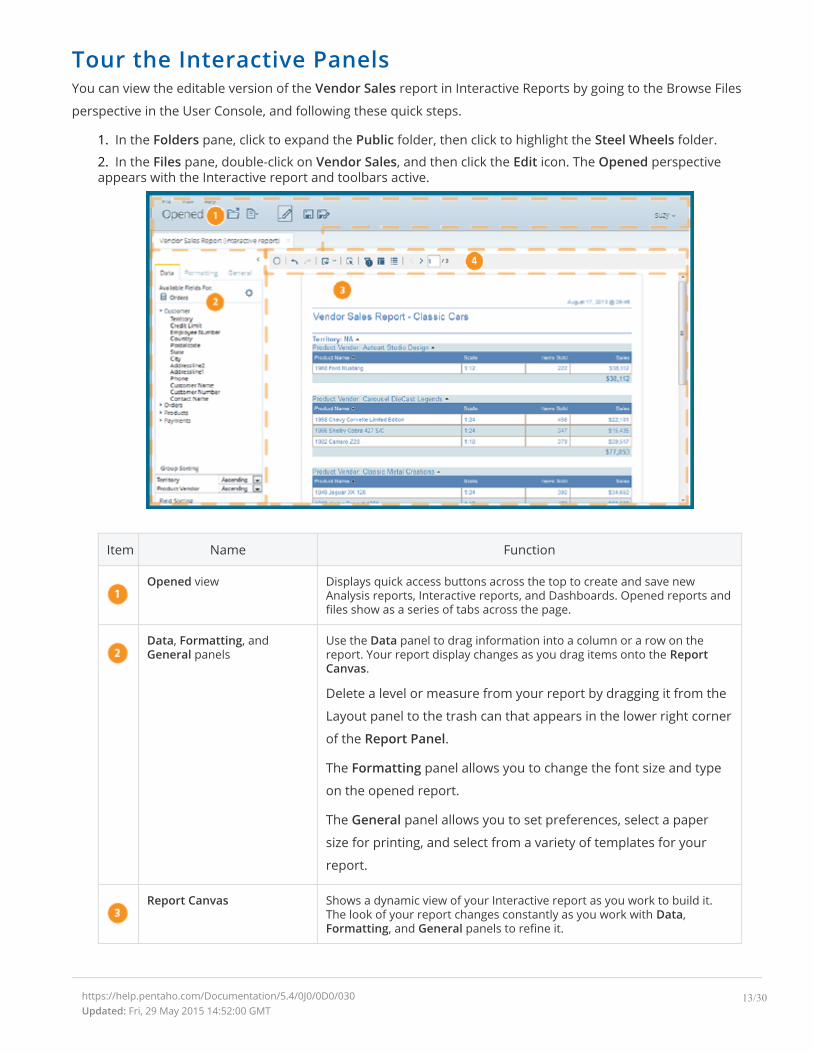
Tour the Interactive PanelsYou can view the editable version of the Vendor Sales report in Interactive Reports by going to the Browse Files
perspective in the User Console, and following these quick steps.
1. In the Folders pane, click to expand the Public folder, then click to highlight the Steel Wheels folder.
2. In the Files pane, double-click on Vendor Sales, and then click the Edit icon. The Opened perspectiveappears with the Interactive report and toolbars active.
Item Name Function
Opened view Displays quick access buttons across the top to create and save newAnalysis reports, Interactive reports, and Dashboards. Opened reports andfiles show as a series of tabs across the page.
Data, Formatting, andGeneral panels
Use the Data panel to drag information into a column or a row on thereport. Your report display changes as you drag items onto the ReportCanvas.
Delete a level or measure from your report by dragging it from the
Layout panel to the trash can that appears in the lower right corner
of the Report Panel.
The Formatting panel allows you to change the font size and type
on the opened report.
The General panel allows you to set preferences, select a paper
size for printing, and select from a variety of templates for your
report.
Report Canvas Shows a dynamic view of your Interactive report as you work to build it.The look of your report changes constantly as you work with Data,Formatting, and General panels to refine it.
https://help.pentaho.com/Documentation/5.4/0J0/0D0/030Updated: Fri, 29 May 2015 14:52:00 GMT
13/30

Item Name Function
Interactive Toolbar andFilters
Use the Toolbar functions to undo or redo actions, hide lists of fields, addor hide filters, disable the auto-refresh function, adjust settings, andchange the view of your report.
Use the Filters panel to display a list of filters applied to the active
report, or edit or delete filters.
Create Your First Interactive ReportThe instructions below guide you through the creation of your first Interactive report using the Steel Wheels
sample data.
1. From the Home perspective, click Create New, then choose Interactive Report.
2. Choose the Inventory data source from the Select Data Source dialog box. Click OK.
3. Click Get Started on the dialog box that appears. A blank Interactive report canvas appears.
https://help.pentaho.com/Documentation/5.4/0J0/0D0/030Updated: Fri, 29 May 2015 14:52:00 GMT
14/30

4. Click and drag the Product Code element onto the report canvas until a highlighted vertical lineappears. Drop it onto the Report Canvas.
5. Continue dragging and dropping these fields onto the canvas: Product Name, Product Vendor,Quantity in Stock, MSRP, and Buy Price.
The data from the chosen fields appears on the report canvas and populates with the information fromthe server.
NOTE:
You can change the order of the columns by clicking the column heads and dragging the columns left or
right until they are in the order you want. If you want to delete a column, just drag and drop the column
title into the trash can.
6. Rename your report by double-clicking on Untitled in the Report Canvas, and typing a name in the fieldthat appears. In Stock Report is used in this example.
https://help.pentaho.com/Documentation/5.4/0J0/0D0/030Updated: Fri, 29 May 2015 14:52:00 GMT
15/30

7. After you have arranged your columns in order, apply a filter to the data by clicking on the Filter icon inthe toolbar. After the filter pane expands, drag the Product Code field onto the filter workspace.
8. In the Filter on... dialog box, click Select from a list.
9. Choose items from the Filter list by using one of these methods.
Click on the arrows to move your selected filters on to or off of the Filter list.
• To choose more than one item from the Filter list, hold down the Ctrl key and click the items thatyou want to filter by, then click the top arrow to move the items to the right panel.
• Or you can choose a series from the list by holding down the Shift key and clicking on the first itemyou want to use, then clicking on the last item that you want to use.
• Choose individual items by clicking to highlight them, and then clicking on the top arrow to move itto the right panel.
10.
https://help.pentaho.com/Documentation/5.4/0J0/0D0/030Updated: Fri, 29 May 2015 14:52:00 GMT
16/30

Click OK, then click the Save As button in the toolbar.
A.
When the Save As dialog box appears, save your report using the title that you used for your report.
B.
Choose your user folder as the location, and click Save.
11. If you want to export the report, click the Export icon on the toolbar and chose a format from thedropdown list for the export.
The report exports in the selected format and a paper copy can be printed from the export.
You have successfully created a simple Interactive report from scratch. Use Interactive Reports shows you
how to work with more complex Interactive reports.
https://help.pentaho.com/Documentation/5.4/0J0/0D0/030Updated: Fri, 29 May 2015 14:52:00 GMT
17/30

Get Started with Analyzer Reports
Analyzer Reports is an intuitive analytical visualization tool that filters and drills down into business
information contained in Pentaho Analysis data sources. Use Analyzer Reports if you want to compile data
quickly in an interactive environment, perform advanced sorting and filtering of your data, and want to see
chart visualizations that include conditional stop-lighting.
View an Analyzer Report SampleThis section highlights some popular Analyzer capabilities that are available, using the sample report called
European Sales located in the Getting Started widget.
1. In the Getting Started widget on the Home page, click the Samples tab.
2. Click to select European Sales from the scrolling panel on the right.
3. Click Explore in the Samples pane.
https://help.pentaho.com/Documentation/5.4/0J0/0D0/040Updated: Fri, 29 May 2015 14:52:00 GMT
18/30

A new window opens showing the European Sales sample report.
Tour the Analyzer PanelsYou can view the editable version of European Sales in Analyzer by going to the Browse Files page in the User
Console, and following these quick steps.
1. In the Browsing pane, click to expand the Public folder, then click to expand the Steel Wheels folder.
2. In the center pane, double-click on European Sales. The Opened page appears with the Analysis report.Click the Add More Fields and Rearrange Fields icons on the toolbar to expand the Available Fields andLayout panels.
https://help.pentaho.com/Documentation/5.4/0J0/0D0/040Updated: Fri, 29 May 2015 14:52:00 GMT
19/30

Item Name Function
Opened view Displays quick access buttons across the top to create and save newAnalysis reports, Interactive reports, and Dashboards. Opened reports andfiles show as a series of tabs across the page.
Available Fields and Layoutpanels
Use the Available Fields and Layout panels to drag levels and measuresinto a report.
Your report displays changes in the Report Canvas as you drag
items onto the Layout panel.
Delete a level or measure from your report by dragging it from the
Layout panel to the trashcan that appears in the lower right corner
of the Report Canvas.
Report Canvas Shows a dynamic view of your report as you work to build it. The look ofyour report changes constantly as you work with Available Fields andLayout panels to refine it.
The Report Canvas shows different fields based on the chart type
selected.
Analyzer Toolbar and Filters Use the Analyzer Toolbar functions to undo or redo actions, hide lists offields, add or hide filters, disable the auto-refresh function, adjust settings,and change the view of your report.
Use the Filters panel to display a list of filters applied to the active
report, or edit or delete filters.
https://help.pentaho.com/Documentation/5.4/0J0/0D0/040Updated: Fri, 29 May 2015 14:52:00 GMT
20/30

Create Your First Analyzer ReportThe instructions below guide you through the creation of your first Analyzer report, using the Steel Wheels
sample data.
1. From the User Console Home page, click Create New, then choose Analysis Report.
2. Choose the Steel Wheels data source from the Select Data Source dialog box. Click OK. A blankAnalyzer report appears.
3. Click and drag the Territory element and drop it into the Rows field. Click and drag the Years elementand drop it into the Columns field. Click and drag the Sales element into the Measures field.
A table with the Territory, Years, and Sales data appears and populates with the information from theserver.
4. Click and drag the Line field and drop it next to the Territory column on the canvas. Right-click the Linecolumn header and select Show Subtotals from the menu that appears.
https://help.pentaho.com/Documentation/5.4/0J0/0D0/040Updated: Fri, 29 May 2015 14:52:00 GMT
21/30
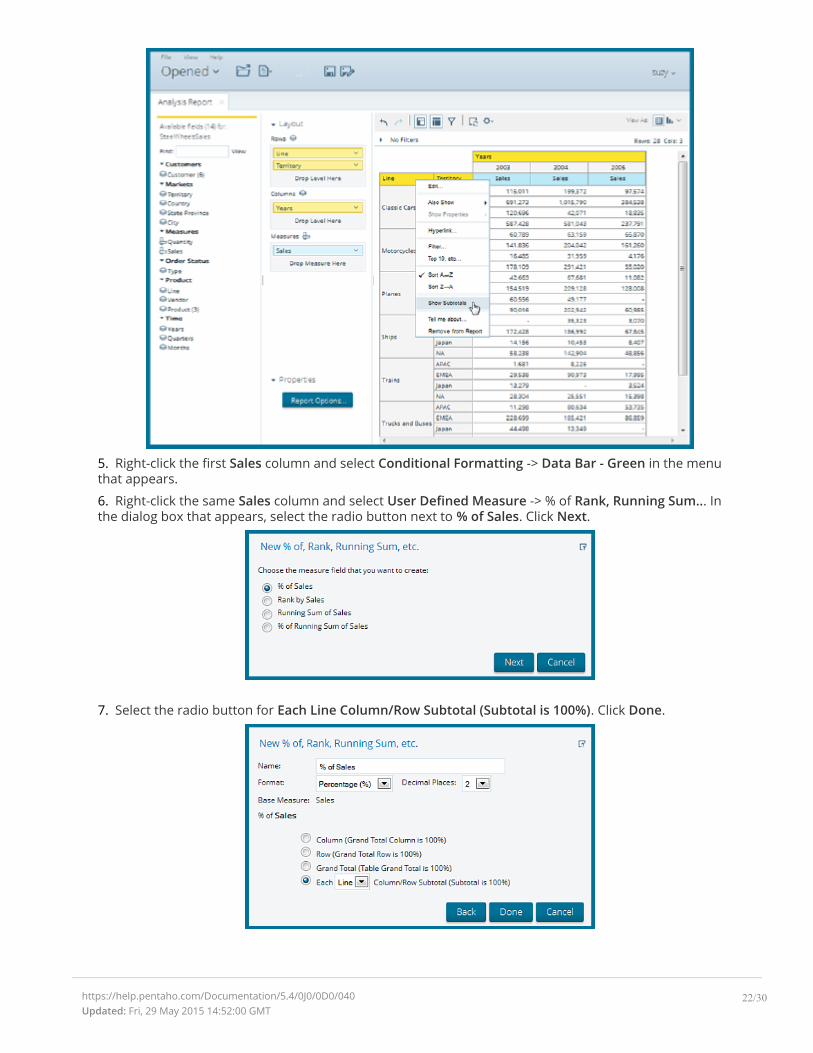
5. Right-click the first Sales column and select Conditional Formatting -> Data Bar - Green in the menuthat appears.
6. Right-click the same Sales column and select User Defined Measure -> % of Rank, Running Sum... Inthe dialog box that appears, select the radio button next to % of Sales. Click Next.
7. Select the radio button for Each Line Column/Row Subtotal (Subtotal is 100%). Click Done.
https://help.pentaho.com/Documentation/5.4/0J0/0D0/040Updated: Fri, 29 May 2015 14:52:00 GMT
22/30

8. Expand the Filters canvas by clicking the Show Filters icon. Click and drag the Territory field from theAvailable Fields panel into the filter canvas. The Filter on Territory dialog box appears.
9. In the Filter on Territory dialog box, select APAC from the list and click the top, right-pointing arrow tomove it to the box on the right.
10. Enable Parameter Name by clicking on the check box in the bottom left of the dialog box. Type regionas your parameter name in the text box. Click OK.
The report updates and displays sales data for APAC exclusively.
Click the line that separates each column to adjust it for better viewing. Move the line right or left as
needed.
11. Click the Save As icon in the toolbar. When the Save As dialog box appears, save your report asTerritory - Sales in your user folder and click Save.
https://help.pentaho.com/Documentation/5.4/0J0/0D0/040Updated: Fri, 29 May 2015 14:52:00 GMT
23/30

You have successfully created a simple Analyzer report from scratch. You may export the report to one of
several different formats or close the report. Use Analyzer Reports guides you through working with complex
Analyzer reports.
https://help.pentaho.com/Documentation/5.4/0J0/0D0/040Updated: Fri, 29 May 2015 14:52:00 GMT
24/30

Get Started with Dashboard Designer
Dashboard Designer allows you to create dashboards with little or no training. The dashboard is several
different reports brought together inside one screen. Use Dashboard Designer if you want to create an
interface to view many different reports at once, have quick access to web pages that you visit often, or view
dynamic charts and graphs within a space while you create reports in another.
View a Dashboard SampleThis section highlights some popular Dashboard Designer capabilities that are available, using the sample
dashboard called Sales Performance (Dashboard), located in the Getting Started widget.
1. In the Getting Started widget on the Home page, click the Samples tab.
2. Scroll to the right to find the Dashboard samples.
3. Click on Sales Performance (Dashboard) to view the sample.
https://help.pentaho.com/Documentation/5.4/0J0/0D0/050Updated: Fri, 29 May 2015 14:52:00 GMT
25/30
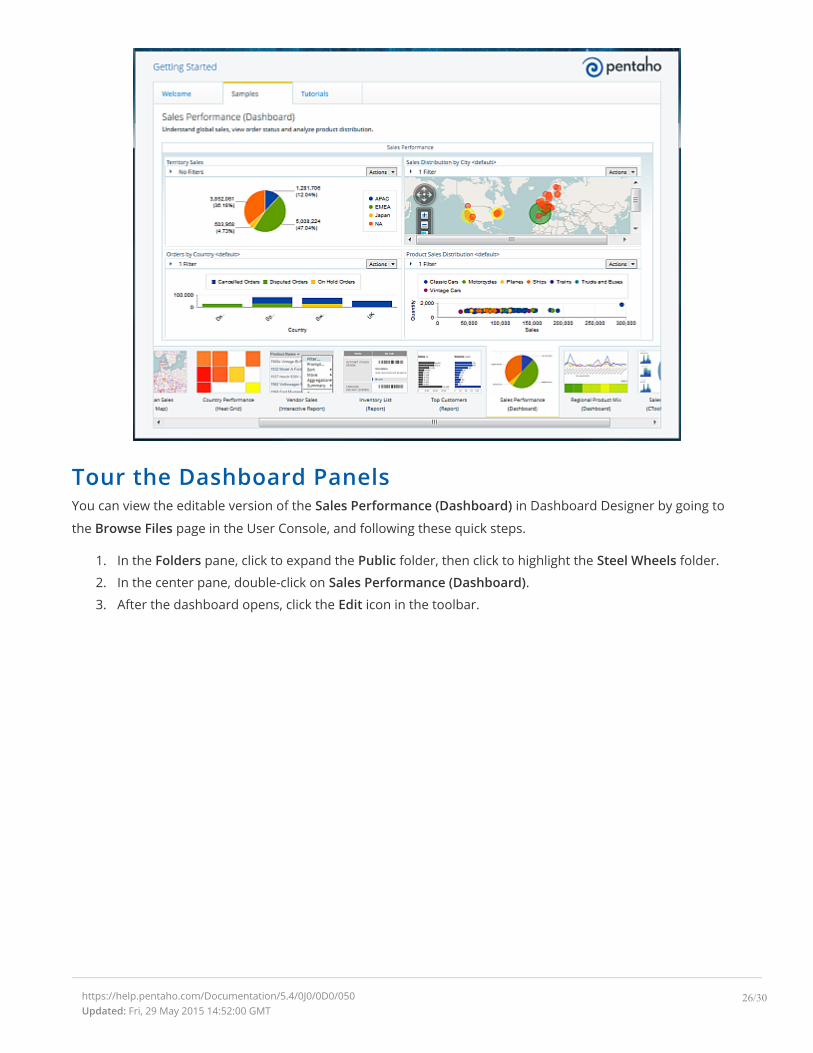
Tour the Dashboard PanelsYou can view the editable version of the Sales Performance (Dashboard) in Dashboard Designer by going to
the Browse Files page in the User Console, and following these quick steps.
1. In the Folders pane, click to expand the Public folder, then click to highlight the Steel Wheels folder.
2. In the center pane, double-click on Sales Performance (Dashboard).
3. After the dashboard opens, click the Edit icon in the toolbar.
https://help.pentaho.com/Documentation/5.4/0J0/0D0/050Updated: Fri, 29 May 2015 14:52:00 GMT
26/30
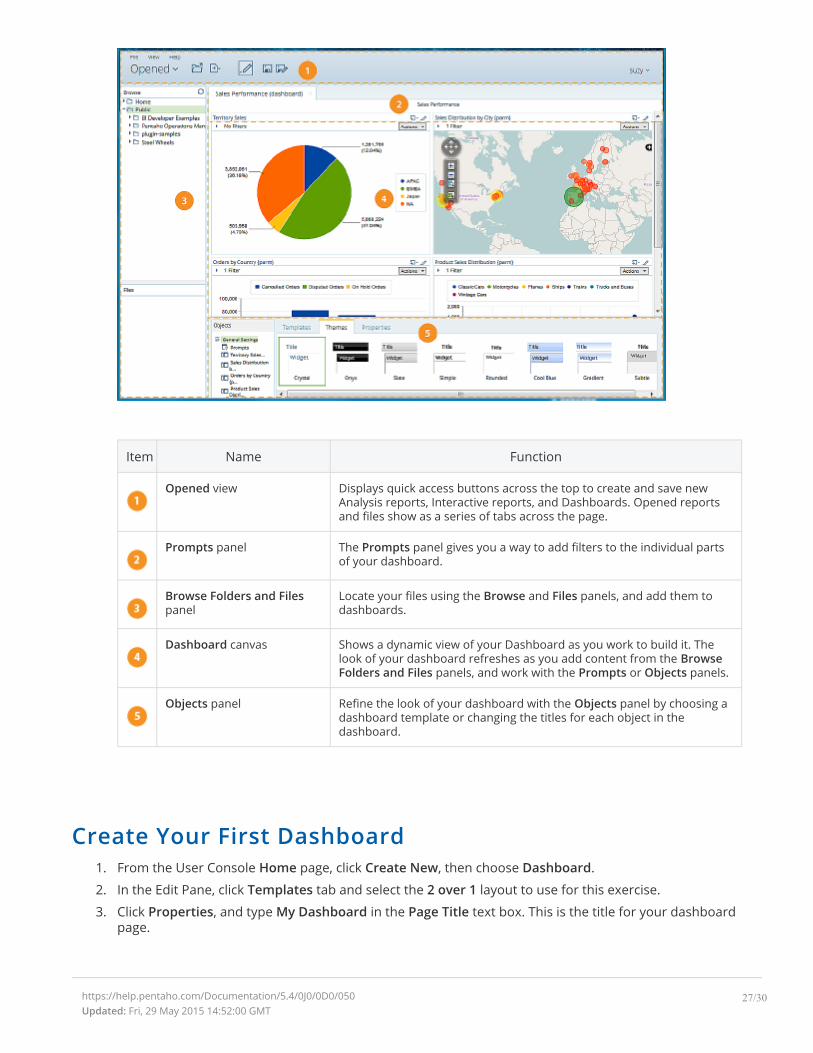
Item Name Function
Opened view Displays quick access buttons across the top to create and save newAnalysis reports, Interactive reports, and Dashboards. Opened reportsand files show as a series of tabs across the page.
Prompts panel The Prompts panel gives you a way to add filters to the individual partsof your dashboard.
Browse Folders and Filespanel
Locate your files using the Browse and Files panels, and add them todashboards.
Dashboard canvas Shows a dynamic view of your Dashboard as you work to build it. Thelook of your dashboard refreshes as you add content from the BrowseFolders and Files panels, and work with the Prompts or Objects panels.
Objects panel Refine the look of your dashboard with the Objects panel by choosing adashboard template or changing the titles for each object in thedashboard.
Create Your First Dashboard1. From the User Console Home page, click Create New, then choose Dashboard.
2. In the Edit Pane, click Templates tab and select the 2 over 1 layout to use for this exercise.
3. Click Properties, and type My Dashboard in the Page Title text box. This is the title for your dashboardpage.
https://help.pentaho.com/Documentation/5.4/0J0/0D0/050Updated: Fri, 29 May 2015 14:52:00 GMT
27/30

4. Click the Themes tab and select the theme of your choice. The new theme will be applied to yourdashboard immediately.
5. Locate the Analyzer report you created earlier by going to the Browse pane to the left of the Dashboardcanvas and clicking on the Users folder and clicking to highlight your folder. Click-and-drag theTerritory - Sales file from the Files pane and onto the top-left dashboard panel.
6. Within the Edit Pane, type Territory - Sales in the Title text box and click Apply. The dashboard panel ispopulated with the Territory - Sales report.
7. Locate your Interactive report by going to the Browse pane to the left of the Dashboard canvas andclicking on the Users folder and clicking to highlight your folder. Click-and-drag the First InteractiveReport file from the Files pane and onto the top-right dashboard panel.
8. Within the Edit Pane, type First Interactive Report in the Title text box and click Apply. The rightdashboard panel is populated by the First Interactive Report report. You can drag any report from theSteel Wheels folder in Public into the bottom dashboard panel.
https://help.pentaho.com/Documentation/5.4/0J0/0D0/050Updated: Fri, 29 May 2015 14:52:00 GMT
28/30

9. Click on the Save as icon in the toolbar. When the Save As dialog box appears, save your dashboard asMy Dashboard in your user folder and click Save.
a. Close the dashboard, then go to Browse Files and double-click on My Dashboard in the Filespane.
You have successfully created a simple Dashboard from scratch. Use Dashboard Designer illustrates
how to work with complex dashboards.
https://help.pentaho.com/Documentation/5.4/0J0/0D0/050Updated: Fri, 29 May 2015 14:52:00 GMT
29/30

Next Steps
After you have finished working through the walk through tutorials, you are ready to learn more about
Pentaho reporting.
Learn More
Create Analysis, Interactive Reports, and Dashboards provides in-depth details about creating eye-
catching business intelligence deliverables for your user community.
The Build Full-Featured Solutions category contains a large number of topics on working with the BA
Suite. Here you can learn about defining data models, fine-tuning your reports and dashboards, how to
create print-quality reports, or work with Big Data.
Work with Big Data tells you how to use big data as a data source.
https://help.pentaho.com/Documentation/5.4/0J0/0D0/060Updated: Fri, 29 May 2015 14:52:00 GMT
30/30


![[ Getting Acquainted with Pentaho Components ]reportes.fuxionbiotech.com/pentaho/docs/components.pdf · [ Getting Acquainted with Pentaho Components ]] ... Pentaho BA Suite helps](https://static.fdocuments.in/doc/165x107/5ad7ac027f8b9a991b8c5bad/-getting-acquainted-with-pentaho-components-getting-acquainted-with-pentaho-components.jpg)