from Paul Dean, UK/Augus… · Created Date: 6/30/2005 11:32:24 PM

U.S. Environmental Protection AgencyEnvironmental Research Laboratory AUG '
Narragansett, R.I.
OFFICE OF REGIONAL COUNSELDate: August 21, 1986
Subject: Preliminary chemistry results from New BedfordHarbor studies.
From: David Hansen via Walter Berry
To: Charles Bering.
Attached is a summary of all the chemistry data for NewBedford Harbor which we have generated to date.
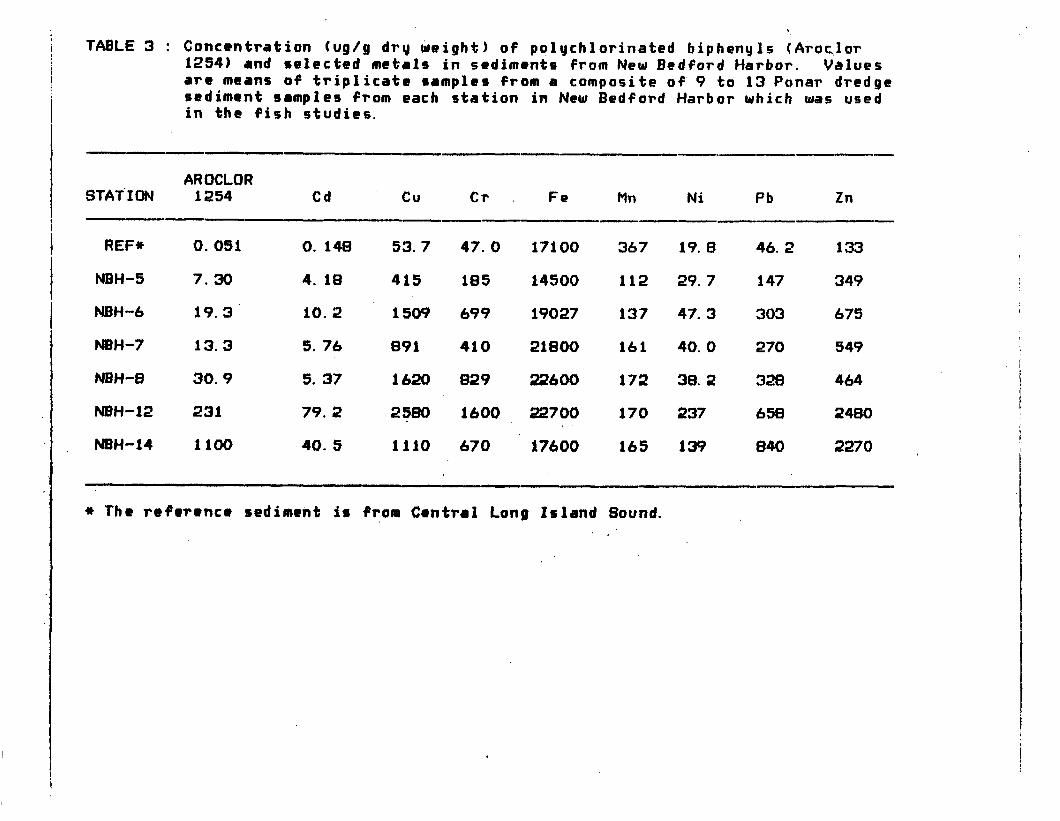
The data in this report came from 3 different sets ofsamples: 1) single preliminary core samples from 13 sitesin New Bedford Harbor, 2) triplicate analyses of sedimentfrom the 6 sites which we used in our toxicity testing (plusthe reference sediment which we used), and 3) tissue and eggsamples from fish exposed to those sediments. Analyses wereperformed in three ways: 1) selected metals were measuredusing flame atomic absorption, 2) PCBs were measured as Aro-c1 or 1254 by electron capture gas chromotography, 3) PCBswere also measured as chlorine number congeners and totalPCBs by gas chromotography/mass spectrometry (according tothe procedures of EPA EMSL, Cincinnati). Draft chemicalprocedures are available upon request. The values from thetriplicate samples are presented both as individual values(tables 2 and 4) and as means (tables 3 and 5).
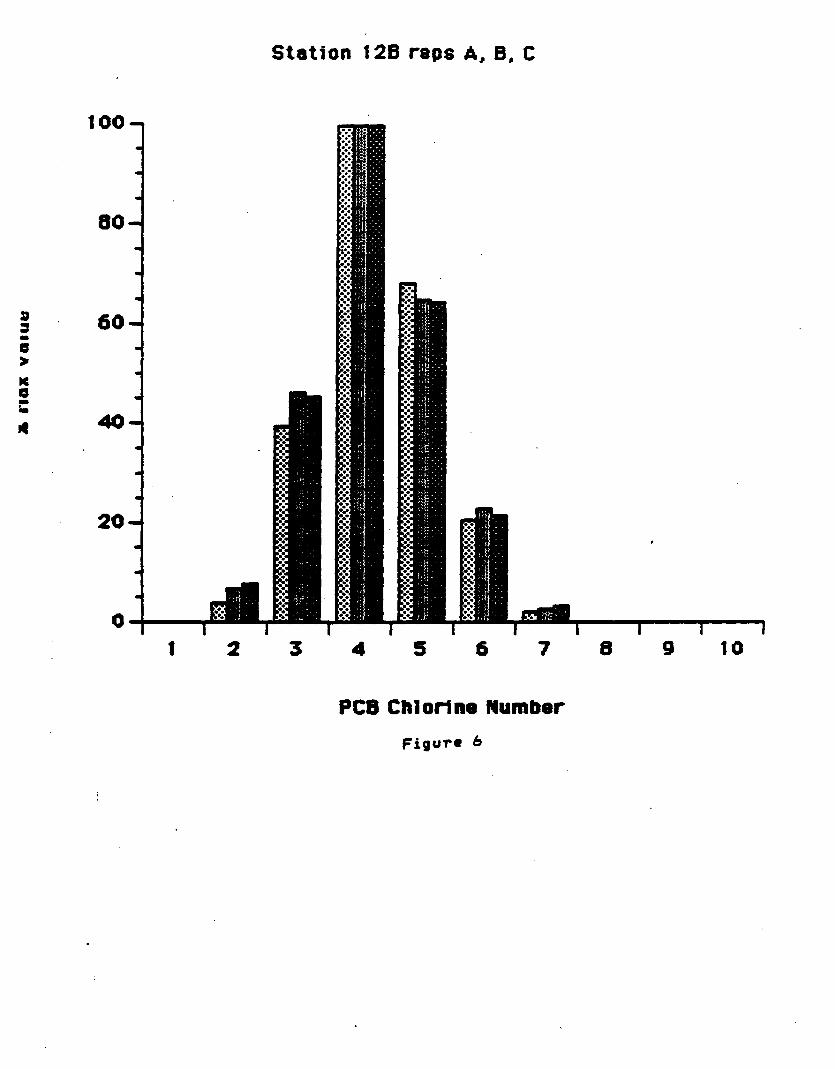
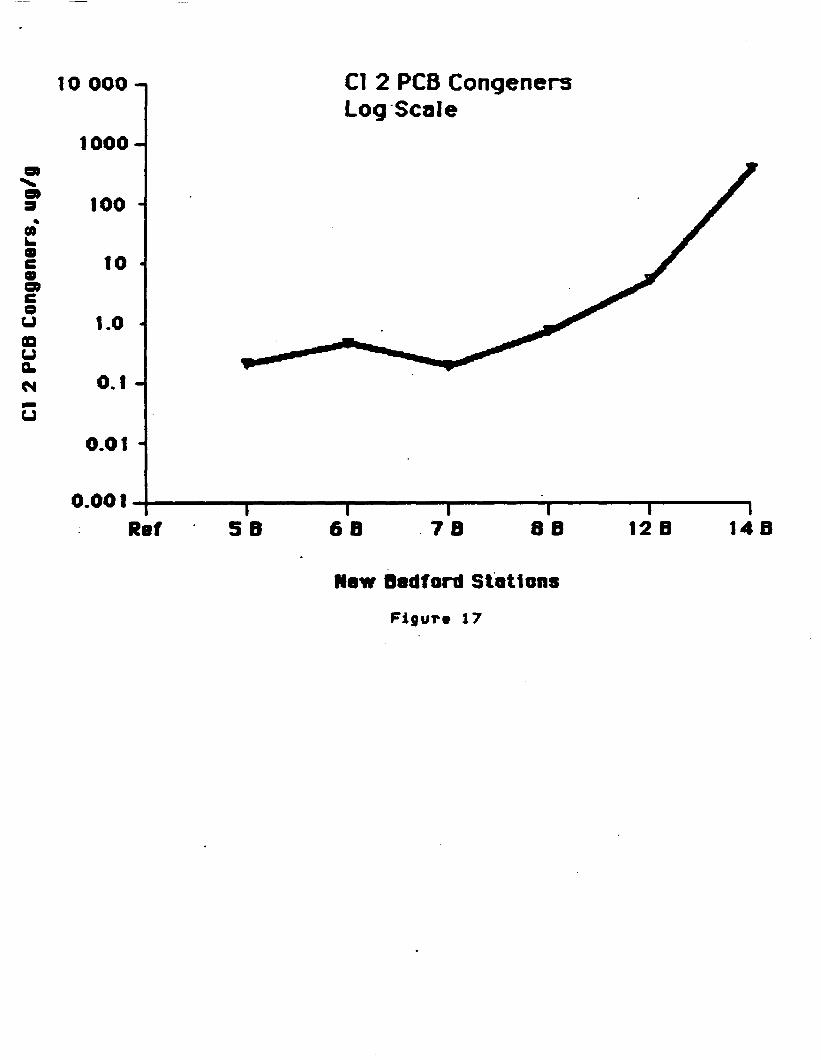
The 6C-MS data from the triplicate analyses are alsopresented in two different graphical formats. Figs 2-7 arebar graphs showing PCB composition by chlorine number con-gener of the sediments from each station. The composition.by chlorine number congener, of 7 reference Aroclor mixtures<e. g. Aroclor 1254) are included for comparison (fig-s.8-14). Finally, total PCB and PCB broken down into chiorin*number congeners are plotted vs. statio.n number (figs.15-25). Higher station numbers generally correspond to agreater distance upstream from the hurricane barrier (seefig. 1).
We have also included a proposal for some PAH work. Inaddition we are planning to do chlorine number congener ana-lysis on tissue samples which have already been analyzed ^o^Aroclor 1254 and selected metals.

H
5
S3
*^
^M
r
H*
^*
*»
o»
to
O
kO
OB
^g
tU
IA
oW
fO
M
H
r* ii
78
?
22
3 A
A
rr
A H
p^
O0.f
t h
-h
-M
|-
H»
CJ
Ul
UI
W.
IO
W
I W
M
N
>O
1—HiH
.
s Ss
9k
UI
U*
^k
O9
kU
l9
k0
9^
*§• 1
*
OB?"
4>
9k
**
-
Nl
OB
9k
Ul
k-
*>
^U
»*
«H
-w
in
kO
Q
O
09
•
^
OA
^
O
^
M0?*
^
09
9k *
U»
O«
4I
Ol
«>
MI
O^
49
kU
I
iff?
M
M
M
M
h-
»-•
•0nr
r V
•
V
r-
A.
Ul
ve
»^
B0
9U
l»
>9
k»
U»
k-
*
U»
\£
O'
OI
O»
«'
>9
k9
«k
-«
n
•H
O
«>
OO
IO
O^
OB
9k
a>
U »
s§
s H
Io
19
-0
8&
I H
* M
o
ian
••
^I
kO
^^
JM
OI
tO
MU
l rre
9*
-.4
1-V
l 9
k9
k»
IO
UI
^4
4>
M>
j9
k
o
ft ftM
H
-1
0
OU
l QB
4)
»
H
4
^
£
^j
OB
•
O
0
0
9k
£«3®
O
H>
a109
•
H-frrt
A
A
NV
W
9k
^
kO
*.
*»
tO
MO
BU
I^
l9
kH
-»
I?
t£
4»»
«»
^>
WM
9k
«»
^4
H»
9k
9k
lO
O
9*
88
8
88
88
88
88
8°
<••
A^1
h-9
OkO*
4
S
S
3 H
-O
9k
9k
«-
»I
O*
»U
*O
Bl
->
£
A9kf
t O
U*
»U
I4
>t
OM
Ul
*
•
09
Ul
0.*^
H
>
,||»
A-
0>
r-O
H
* H*
IO
U
IU
IW
U»
«»
IO
IO
IO
M^
4
2
•AH
O
IO
UI
kO
9k
^«
»I
O0
9 *
**
M
. n%*
^.
k 8•
Mm
9»
09
u»
H-
o»
t-
mu
iO
B
-S gC
r-a
ui
Aft*
•
800
J
9k
t
Ol
OU
It
Of
OM
ft
fM
MU
l 1I
09
UJ
H*
u»
mi
ou
ik
ou
i'
>4
ui
io
<e
>
IO
h*
JU
l D
^
H*
£*
^
4k^
d
£*
* Q
* fit
k«
g15S
M HH
»
M
A A
M
n
s.s;
10
10
M
M
p,,
•o*
HiT
3"•
• W
U>
(O
Ul
^l
O>
OB
IO
UI
ke
u>
U»
9k
N>
9
HO
B
«s
j|
OU
It
OU
It
Oh
->
IO
«»
fO
m
A
H
.rr
S rrf
t COA
»
rr•Q
D ft rr
oH
> c
H»HI9
f*
SO0
8Ar
r 2-
-I
OI
Ot
OU
»I
OI
OM
IO
to
M
to
to
to
-SS
.O
B,
4>
09
vO
Ul
IO
IO
9k
UI
UI
tO
V>
>U
lO
^
• AH
. U
l O
-*
<
«4
MO
>k
eu
iN
»^
»U
>O
IO
•8
*<
9
«

9
I
A O
Z OB
f
ON
W
l tO
South Reference*
ii i
IO
•
H» «
li|
A z
a A
«
tf rr
HI
S O
O O
;ss
10
r-
N>
r4 " ?*
IO
H-4>
vO
Wl
vfi
OB
M
W
l U
) O
N
HI
9vo
O v
O
w$
3
10
Wl
N>
O> O
N ON
ro
wi
wi
§S S
o
O1
Sn
x^
.
0?00
U»
4*
4>
>4
<«
J vO
o o
o
1vO
O •-
* O
10
0 O
•
0
*0
. v*»
u*
OB
• •
•
ON
4
rr o
1
2
*•
Wl
ON
4> O
N ON
M
IS)
*•
W
l O
B OB
Wi
r* 1
*<
vO
Wl
O •
n A
9 *«
10
10
10
r-
9
Wl
Wi
Wl
Z g
rt
O
M r-
Wl
ON
ON
*• W
l W
l M
H*
O
O O
N *
K
» *• ^
4
M
ON
OB
H
3B
S
O 0
0
O
wi
ON
at k
HI
|3,
H
H S?
iss
s ON
^j
^4
S 4»
4»-
ON
ON
ON
U
> ^^ O
B v
O
m ^
5 W
l 4*
O
B
Wl
O O
* r-
r-
>O O
B «
W
^^ ^
O ^
5 W
i O
N r
-10
«O
4>
ON
w 1
0 1
H
ST H
> H
>
10
10 1
0
is> t
o rs»
&
g
ON
04
OB
10
10
10
1
VO
vo
H
* M
M
ON O
B ^
rr
n
A
f fli O
. IO
IO
M
rr
rr
A
O"
88
8
8 S
»i|
•
*—
»
• v
* O
>
^B!
OB)
S W
l vO
r-
r-o
*>
^4
0»
ON 4
> O
N
v»
Wl
Mis
* <
0
OM
10
w
i ON
ON
O^
^9
OJ
p
.7
z9
H
» x«
k
(Brr S
f r
••*
•.*
•
O.
to r
- O
N
Wl
OB
•**
O
B H
-ss
s 2
" §
OB
Wl
OB
rr
O r
-O
N O
N
Wl
O
OB
vO
O
B O
N ^
<4
» O
N
O
A
3
O
10O
. A
H
O
HI
O
>•*
0
O 10
O
N U
l U
l 10
10
10
*"
*• i
1 •
Wl
Wl
S2
S
U»
M9
N>
32
S
\C H
-^*
^^
OD
10
<49
U»
OB
*4 O
N
10 O
N r-
O
10 W
l
A
r*
pi
K* r
r 3
x^
i-l
A
O.
•
10 t
o ro
N
) rr
H
I a
ON
ON
«W
Wl
Wl
Wl
V*>
W
3S
W
i ON
«*•
W
O O 0
V*
ON
*>
S 52
. 00 O
OB
*•
O
*» *
• -J
«O
U»
ON
»
0*
IO
IT1 I?
H
* vo
rr
SrrS
.
u* u
> 10
10
10
10
IO
IO
u>
rr
*•
fl*
<**U) u
> *
4
ON ^
J O
B
wi
ON O
N rs>
^
«O
10
ON
*•
O
O
B O
B O
B W
l "8
&
a. n
n
A
n M
2.&
ITS
a r
* •
o
a rr OB
CD
H
yj
g
*
§§i
1 §i
m
H
XX
XX
XX
r1
1•n
m
1 1i
—^
vj
01
4kfu
*i
CJ
T>
^^ •J
>
vl
p
i_>
35
!•»
(•»
IU
CJ
i—
a *»•»
M.
Ul
ft~
o
3 ID
IU
o
1-1
CJ
p
CJ
-o
•
IU O
0.
01 3
4a
nn
ID
8
CJ
CJ
Q3
•
o
SP
01
S-S
'
H*
vl
o
ID •
ID
3
«t
3ft
ft rt
-ID
-b
<*•
a 3 1
O
. »•
•• Q
. ft
M-
in «
<f
9
7 ft0 *t
M>
3
•to«
O
a
4k
VI
01
01
h^
4kp
in
•o
*-3
rt
-O
p
0
rt-
»-*
ID
n ^
I-*
C
ID
*
CJ
Q.
M.
Ol
IUvl
IU
CD
4k
& in
rt* 1
H>
rt
-c
m
^j
CD
»*•
^«
10
ID
-b
QL v
. •-•
m -i H
-10
•
on
3o
3 f
t ID
O
L 3
I-.
IU
IP*
CD
H*
4k
Ol
rt1 -1
»•
»
0*
Ol
»•»
CJ
o
ID
ID
ft «c
(i*
•1
•••>
^s
O
l c
ft fr
»*
^^
OQ
>ft
VJ
n
« E
a *
srft*
«rt
>i ft
3
M-
M
mTB
3
<a
Q*»
!•*
t«fc
4k
rt-
(•rf
=r
^
^^
t-M
V
J
0*
*+
X
) CD
V
| 0
ft ID
m
rt-
O
>0
O
-o
Ol
rt-
in*
<~
r
8 O
1
»*•
Q.
oO
a
3
•b
t
>*
O
3 i»
to
O
ID
fc*
ftj
MIU
l_
k i
i
M
*3
3
T>
Vj
lU
RS
•o
4kvj
art
-o*>
4
M
0»
vl
0-
CDo
O
l •n
ft
in
i—
IM
IU
IDz
ft vl
ID n
i» n
88
8g
88
a
e O
1 3"
Q.
3o
•-•
ca•o
3
o
^ ID
o
1
Ul
w
Ml
S" c
0*
VI
vl
a-CJ
Ch
•b
iD
3
a
Ol
O
IU
vl
IU
vl
Ort
-£
O
l Q
L ID
rt
0.
03 I
D
O
ID a.
fr*
IU
a.
p4k
Q
p
vl
* *
z
Ol
**«b
o-
^0
•J
-J
"OO
>•
*•
^
or
-J -
o IU
O
CJvl
CD
O
rt-
O.
3*
T»O
ID
X
3
H*
Q,
u=E
CD
Ch
C
J IU
CJ
•»
• 4k
T
J :r
CJ"J I-
1
w in
§
8 P
" o-
nT
Jo
IU
3-
O1
-»
^
3
1 >
IU
IU
4k
Ol
Ch
CJ
H*
M
S
V 1
o
<n
0.
ft •_<
vl
3
c-J
I— O
fc
O
l u
MID
c 1
O
o
ID
a.
ID
Q.IB
in
ID

Table 4. Concentration (ug/g dry weight) of polychlorinated biphenyls
(PCBs) in sediments from New Bedford Harbor Analysis was performed by
GC/MS. Concentrations are reported by chlorine number congeners, and as
total PCBs. Values are from triplicate samples from one composite from
9 to 13 Ponar dredge samples from each station in New Bedford Harbor
that have been tested for their toxicity.
Sample 10 Cl - 1 CI-2 C1-3 Cl-4 CI-5 Cl-6 CI-7 C1-8 CI-9 C1 - 10 I ug/g
3082 Ref nd» nd* nd* nd* nd» nd* nd* nd* nd* nd* nd* 3083 Ref nd* nd* nd* nd» nd» nd* nd» nd* nd* nd* nd* 3084 Ref nd« nd» nd" nd* 0.02 0.02 0.02 0.02 nd* 0.02 0.08
3085 SB nd* 0.22 1.4 4.0 4.0 2.1 0.20 nd* nd* nd* 12 308656 nd» 0.21 1.2 3.4 3.1 1.4 0.08 nd* nd* nd* 9.4 3087 SB nd* 0.21 1.2 3.4 3.2 1.6 0.21 nd" nd* nd* 9.7
3088 6B nd» 0.46 4.1 13 12 5.6 0.67 nd* nd* nd* 36 3090 6B nd» 0.49 3.9 1 1 10 4.5 0.43 nd* nd* nd* 30 3091 6B nd* 0.50 3.5 9.8 9.8 5.6 0.72 nd* nd* nd* 30
3092 7B nd* 0.15 1.5 5.5 5.8 3.0 0.22 nd* nd* nd" 16 3093 7B nd» 0.08 1.4 5.6 6.2 1.8 nd* nd* nd* nd* 15 3094 7B nd* 0.38 2.1 6.3 6.8 3.0 0.30 nd* nd* nd* 19
3095 8B nd* 0.60 6.2 17 18 8.2 1.4 nd* nd* nd* 51 3096 8B nd» 0.88 8.0 19 18 7.8 0.55 nd* nd* nd* 55 3098 86 nd* 0.97 8.2 21 21 9.4 1.6 0.06 nd* nd* 62
3099 12B nd» 3.5 36 91 62 19 1.8 nd* nd* nd* 210 3100 126 nd* 5.0 35 75 49 17 2.0 nd* nd* nd* ISO 3101 126 nd» 8.6 51 110 73 24 3.6 nd* nd* nd* 270
3102 146 7.8 390 830 910 380 110 13 1.3 0.43 nd* 2600 3103 146 8.9 380 770 790 350 100 1 1 0.71 0.36 nd* 2400 3104 146 9.6 440 920 990 410 120 12 0.91 nd* nd* 2900
"nd * non detectable (As low as 0.02 ug/g. depending on sample dry weight and congener response)

Table 5. Mean concentration (ug/g dry weight) of polychlorinated
biphenyls (PCBs) in sediments from New Bedford Harbor. Analysis was
performed by GC/MS. Concentrations are reported by chlorine number
congeners, and as total PCBs. Values are from triplicate samples (see
Table 4) from one composite from 9 to 13 Ponar dredge samples from each
station in New Bedford Harbor that have been tested for their toxicity.
Sample ID Cl 1 Cl-2 C1-3 Cl 4 C1-5 Cl-6 C1 7 CI-8 CI-9 Cl 10 2 ug/g
Avg Ref nd* nd* nd* nd" 0.01 0.01 0.01 0.01 nd* 0.01 0.03 AvgSB nd* 0.22 1.2 3.6 3.4 1.7 0.16 nd* nd* nd* 10 Avg 6B nd* 0.49 3.8 11 11 5.2 0.61 nd* nd» nd* 32 Avg 7B nd» 0.20 1.7 5.8 6.3 2.6 0.17 nd* nd* nd* 17 Avg OB nd» 0.82 7.5 19 19 8.5 1.2 0.02 nd» nd* 56 Avg 126 nd* 5.7 40 93 61 20 2.4 nd* nd* nd* 220 Avg 14 B 8.8 410 840 900 380 110 12 0.98 0.26 nd* 2600
'nd * non delectable (As low as 0.02 ug/g. depending on sample dry weight and congener response)
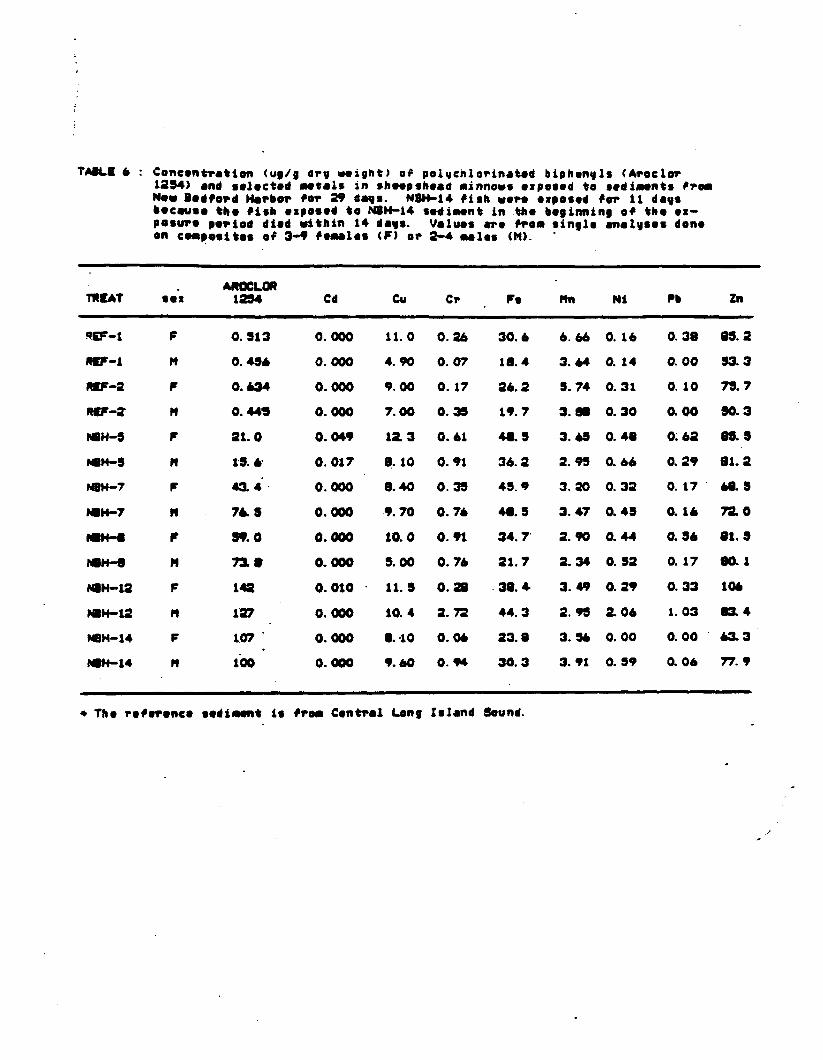
TABLE 6 : Concentration <ug/g dry weight) of polgcnlorinated biphinqls (Aroclor 1294) end selected Mtalc in •heep«head Minnow* eipocod to »edi«entc from New Bedford Harbor for 29 deal. NBH-14 fish wore exposed for 11 days because the rich exposed to NBH-14 tedinent in the ••ginning of the exposure period di*d within 14 days. Values arc from single analyses don* on composites of 3-9 ^«Ml«« (F) or 3-4 «•!•• (N).
AROCLOR TKCAT •ex 1294 Cd Cu Cr F« Hn Ni Pb Zn
SEF-1 F 0.913 0. 000 11.0 0.24 30.4 4.44 0. 14 0.38 89.2
MCF-1 N 0.49* 0. 000 4.90 0.07 18.4 3.44 0. 14 0.00 93.3
MCF-S F 0.434 0. 000 9.00 0. 17 24.2 9.74 0.31 0. 10 79.7
RCF-2 H 0.449 0. 000 7.00 0.39 19.7 3.88 0.30 0.00 90.3
ICH-S F 21.0 0. 049 12.3 0.41 48.9 3.49 0.48 0.42 89.9
NBH-9 N 19. e 0. 017 8.10 0.91 34.2 2.99 0.44 0.29 81.2
*H-7 F 43.4 0. 000 S. 40 0.39 49.9 3. SO 0.32 0. 17 48.9
NBH-7 H 74.9 0. 000 9.70 0.74 48.9 3.47 a 49 0. 14 72.0
•>iBm_A IW1~V F 99.0 0. 000 10.0 0.91 34.7 2.90 0.44 0.94 81.9
NBH-8 H 73. t 0.000 9.00 0.74 21.7 2.34 0.92 0. 17 80. 1
N8H-12 F 142 0. 010 11.9 0.28 38.4 3. 49 0.29 0.33 104
fOH-12 H 127 0. 000 10.4 2.72 44.3 2.99 2.04 1.03 83.4
NBH-14 F 107 0. 000 8.10 0.04 23.8 3.94 0.00 0.00 43.3
I«H-14 n 100 0. 000 9.40 0.94 30.3 3.91 0.99 a 04 77.9
The reference •edi«ent it from Central Long I•land Sound.
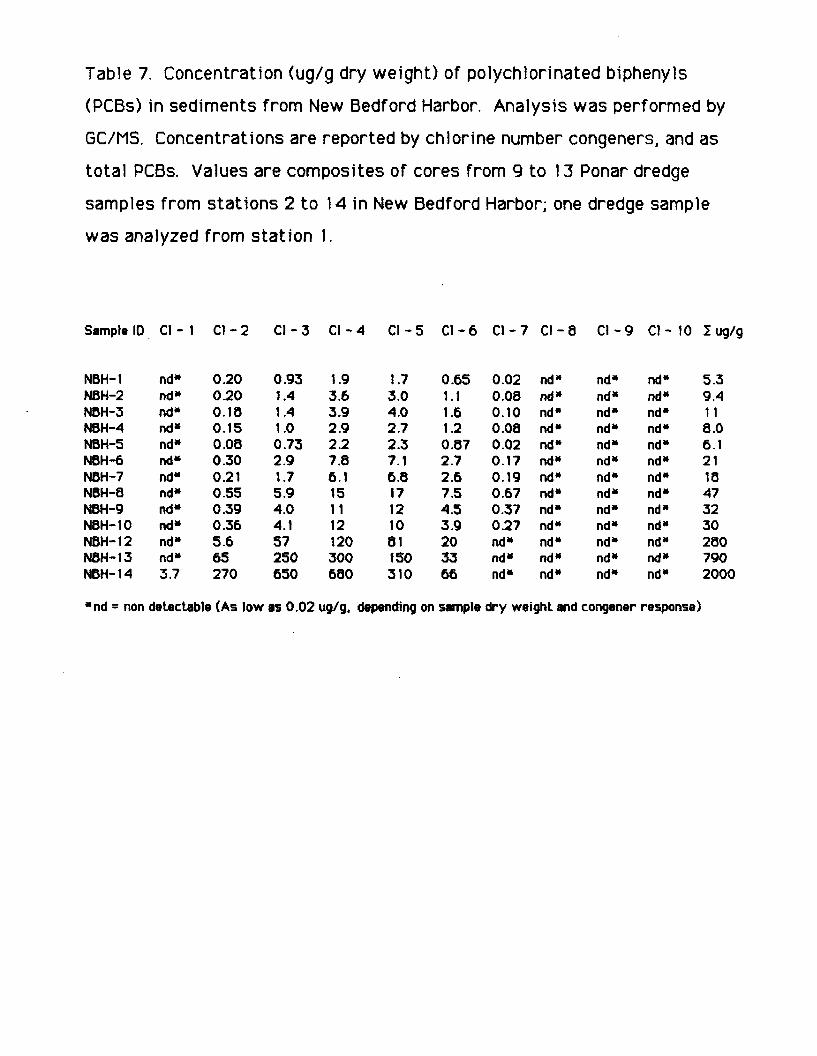
Table 7. Concentration (ug/g dry weight) of polychlorinated biphenyls
(PCBs) in sediments from New Bedford Harbor. Analysis was performed by
GC/MS. Concentrations are reported by chlorine number congeners, and as
total PCBs. Values are composites of cores from 9 to 13 Ponar dredge
samples from stations 2 to 14 in New Bedford Harbor; one dredge sample
was analyzed from station 1.
Sample ID Cl - 1 Cl - 2 Cl - 3 CI - 4 Cl - 5 Cl - 6 Cl - 7 Cl - 8 Cl - 9 CJ - 10 I ug/g
NBH-1 nd» 0.20 0.93 1.9 1.7 0.65 0.02 nd» nd" nd" 5.3 NBH-2 nd" 0.20 1.4 3.6 3.0 1.1 0.08 nd" nd" nd" 9.4 NBH-3 nd" 0.18 1.4 3.9 4.0 1.6 0.10 nd" nd" nd" 1 1 NBH-4 nd" 0.15 1.0 2.9 2.7 1.2 0.08 nd" nd" nd" 8.0 NBH-5 nd" 0.08 0.73 2.2 2.3 0.87 0.02 nd" nd" nd" 6.1 N5H-6 nd* 0.30 2.9 7.8 7.1 2.7 0.17 nd" nd" nd" 21 NBH-7 nd" 0.21 1.7 6.1 6.8 2.6 0.19 nd" nd" nd" 18 NBH-8 nd" 0.55 5.9 15 17 7.5 0.67 nd" nd" nd" 47 NBH-9 nd" 0.39 4.0 1 1 12 4.5 0.37 nd" nd" nd" 32 NBH-10 nd" 0.36 4.1 12 10 3.9 0.27 nd" nd" nd" 30 NBH-1 2 nd" 5.6 57 120 81 20 nd" nd" nd" nd" 280 NBH-1 3 nd" 65 250 300 ISO 33 nd" nd" nd" nd" 790 NBH-1 4 3.7 270 650 680 310 66 nd" nd" nd" nd" 2000
"nd = non delectable (As low as 0.02 ug/g. depending on sample dry weight and congener response)
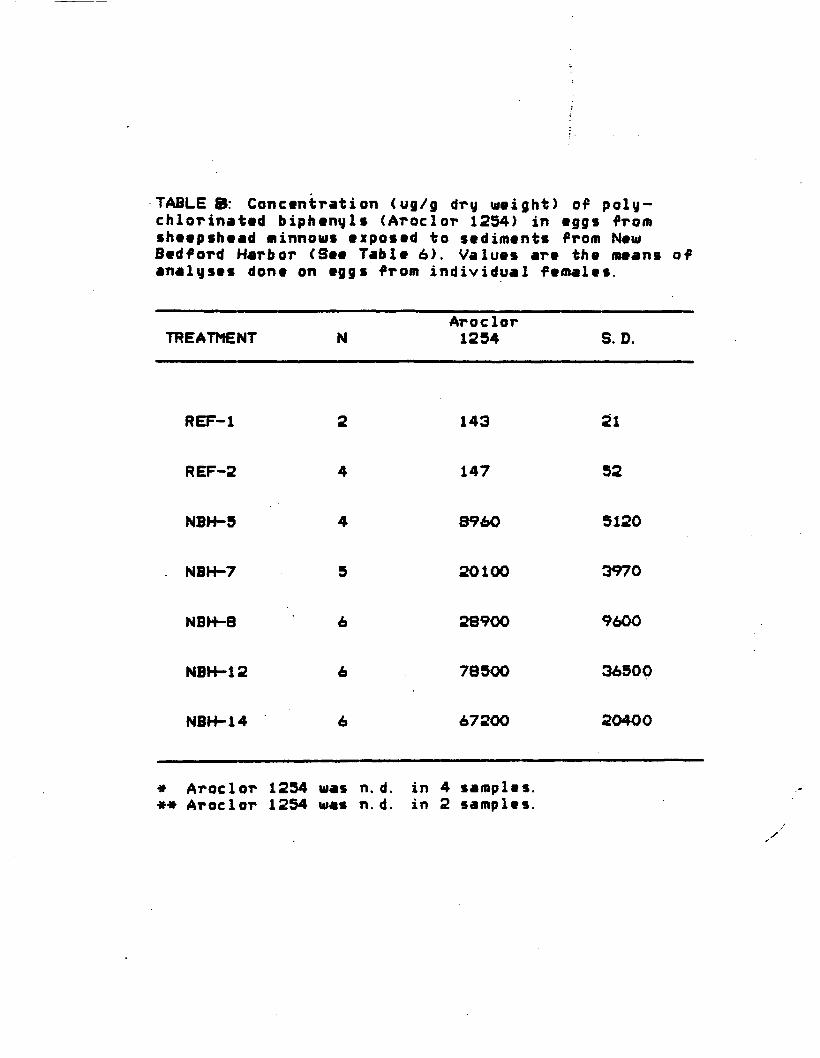
TABLE 8: Conctntration (ug/g dry weight) of polychlorinated biphenyls (Aroclor 1254) in eggs fromsheepshead minnows exposed to sediments from NewBedford Harbor (See Table 6). Values are the means ofanalyses done on eggs from individual females.
AroclorTREATMENT N 1254 S. D.
REF-1 2 143 21
REF-2 4 147 52
NBH-5 4 8960 5120
. NBH-7 5 20100 3970
NBH-8 6 28900 960O
NBH-12 6 785OO 36500
NBH-14 6 67200 2O400
* Aroclor 1254 was n. d. in 4 samples.** Aroclor 1254 was n. d. in 2 samples.

•o01 4*
01*H
01
i-t
U
JC
O
i -P
C U
i o
•rl
».
0 o
•P
01 u
Oi 4
* f-l
01 C
05 X
. (-
O
3
01 a
3
m
. i-P
C
"*
m
c o -« t *i
Ml •rt
01 C
lO
4*
C
Q|
f||
10 (
6
f-4>
O
•-»
0. in
o
01 \~ f.
<»in
o o
ai ID x; i-«
Oi <*u
o> <*•
•M
C 4
»
O
x:
ID ID
6 +»
Oi
Oi O
4>
-rt
(. x: u t
a-u
ai (.
IQ r
i (Q
P ui -4 n
o o
xi
u
a» f-
.
c ID -O
«
ID
X
CD
Oi u
ON 1-1 -H
^3 ***
CL (• (.
e (
o ,
ID 3
«»- ru «
x o> o
3
Ol
z ^
t-oCM
ID c
c *
•H
3>
O "O
t- a. •-*
w
ID in
. c
o CO 4*
w o
c
*H 3
u
•H
«g o
•«* 4> ~>
o
c ID
4>
W
O
4>
C
ID
P
0)
O O
3
4>
Ul
cr CJ>I—
I ll.

Station SB, reps A,B,C
100-,
80-1
60H
X 9
PCB CMorln* Number
Figure 2

Station 6B reps A,B,C
IOC-.
80
60
40
83
O
X0
W
20
I I8 1O
PCB Chlorine Number Figur* 3

Station 76 reps A.B.C
100
80
603
g
3
40«
20
PCB Chlorine Number
Figor* 4

9 3
Xe
M
Station SB reps A.B.C
10O
50
60-
40-1
20
10
PCB Chlorine Number
Figur* 5
93
Ke
Station 12B reps A, B. C
100
80H
60
40
20
PCB Chlorine Number
Figure 6

100-.
80
9 3 600
x0
4O
20
Station 146 Raps A, B, C
PCB Chlorine Number
Figur* 7

Aroclor 1016
100
80
60
40
20
PCB Chlorine Number
Figur* 8

Aroclor 1221
100
x9
8
80
60
40
20
PCS Chlorine Number Figur* 9
10

Arochlor 1232
10O
80
X
C
*
I r i l l 1 2 3 4 5 6 7 8 9 1 0
PCD Chlorine Number Figur* 10

Aroclor 1242160
x 9 c
80
60
40
20
I I I ! I 1 2 3 4 5 6 7 8 9 1 0
PCB Chlorine Number Figur* 11
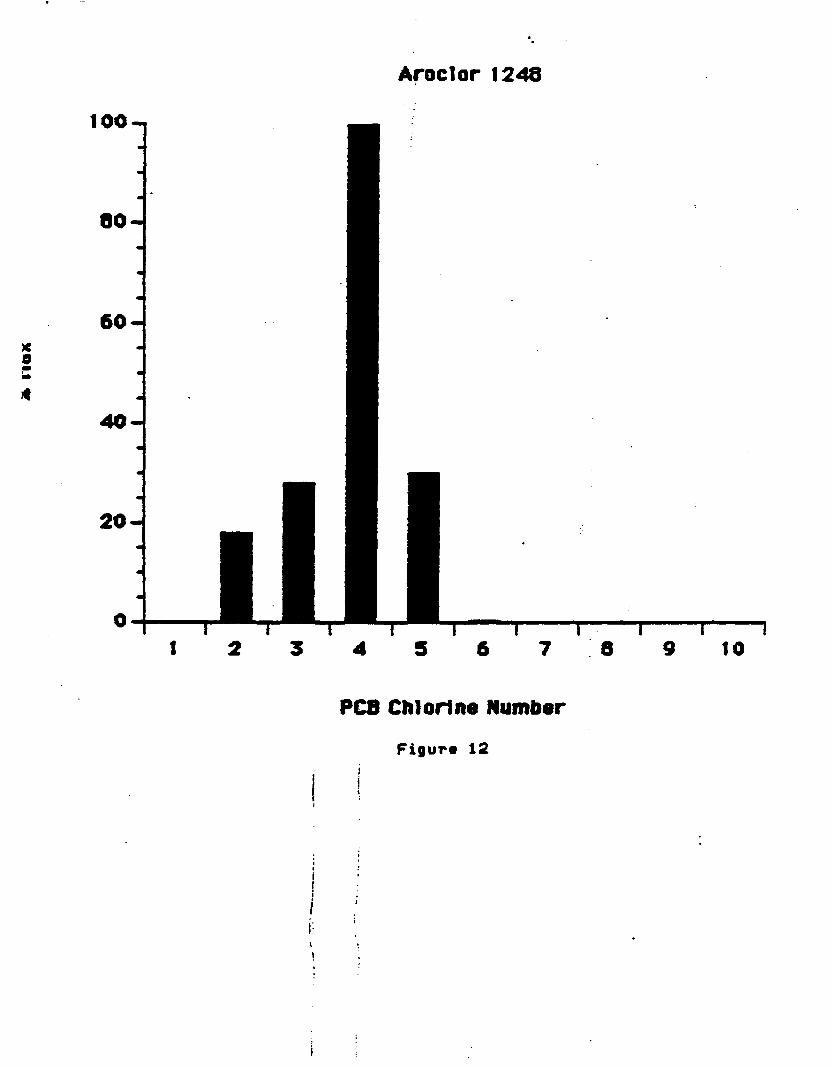
Aroclor 1248
100
80
60
0
* 40
20
r r r I I 6 7 8 9 10
PCB Chlorine Number
Figur* 12

<9
Aroclor 1254
100 -,
PCB ChlorliM Number
Figur* 13

Aroclor 1260
too-.
x0
M
PCB Chlorine Number
Figur* 14

10 000- 2 Cl PCB Congeners Log Scale ,
1000- ; ^^^
0)
9 100 CO , - ^**^ u 01 ^^e 9
10 ^^^
1.0
0.1 -
0.01
f
///
e e u CD U 0. —
U
0 O0 1
Ref S B G B 7 B 8 B 12 B 14B
NBW Bedford Slot Ions
Figur* 15

10 OOO-i Ci I PCD Congeners Log Scale
1000
O)9 100 •
* (0 ' 0 e 10 o OJ e e u 1.0
u - 0.1
u 0.01 -
0.00 1 i i i i i i R< If S B 6B 7B 8B 12 B 14 B
New Bedford Stations
Figur* 16
10 000
1000
100 -(0
0 10
1.0
u 0. w 0.1
G 0.01 •
0.001
Ref S B 6 B 7 B 8 B
New Bedford Stations
Figur* 17
Cl 2 PCB Congeners Log Scale
I i 12 B 14B
I

10 000 Cl 3 PCB Congeners Log Scale
1000
100
10
1.0
0.1
0.01
£ 9e0o>
u0.
0.001 T i 6 B 7 B 8 B 12 B 14B R8f S B
New Bedford Stations
Figure 18
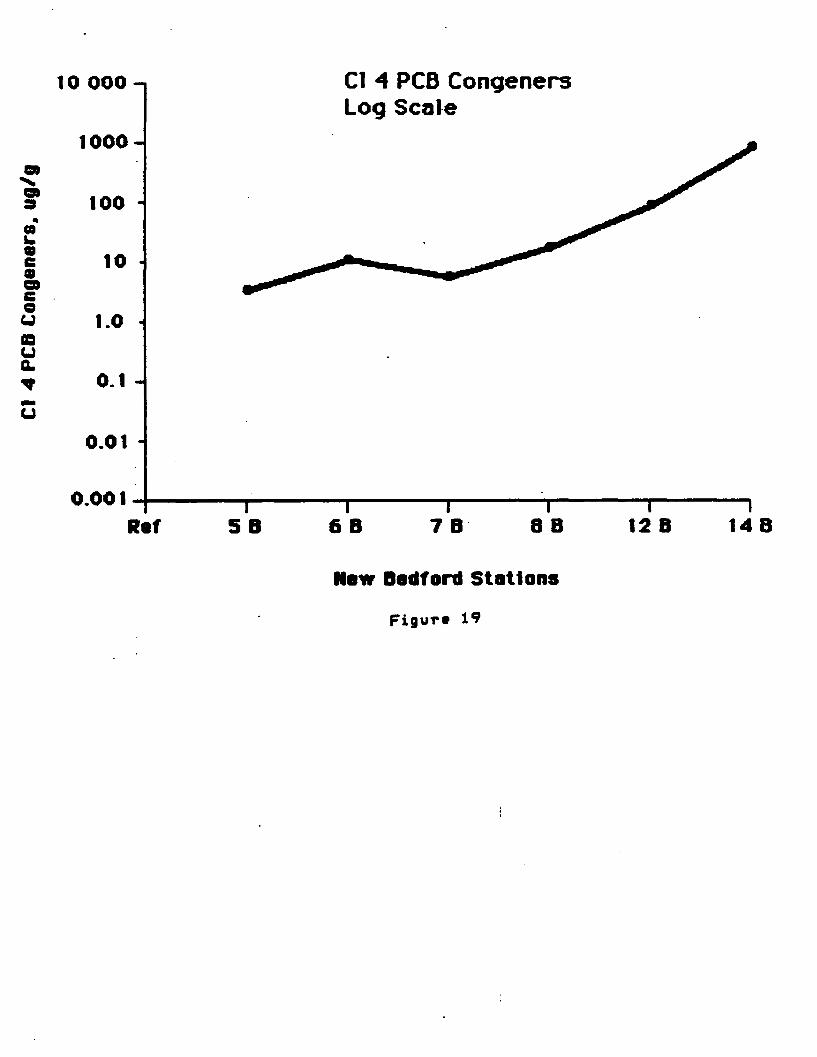
10 000 Cl 4 PCB Congeners Log Scale
1000
100 0)
CO 10
CD CD
eu CD uQ.
1.0
0.1
0.01
0.001 6 B
i 7 B 8 B 12 B 14B Ref S B
New Bedford Stations
Figure 19

Oufiua.inu
10 000- Cl 5 PCB Congeners Log Scale
1000
100 -
0.001 Ref 12 B 14B
New Bedford Stations
Figur* 20

Cl 6 PCD Congeners Log Scale
(0
«eoo»e u
1 i i i i Rfif S B 6 B 7 B 8 B 12 B 14B
New Bedford Stations
Figure 21
i
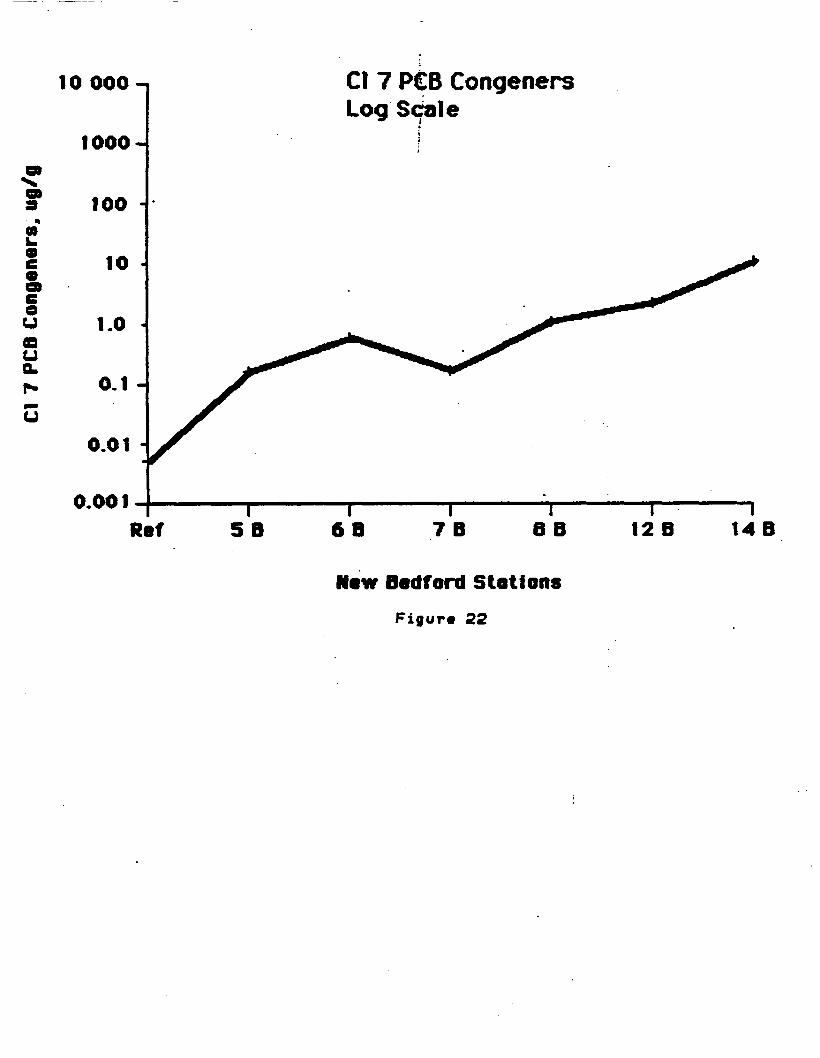
Cl 7 PCB Congeners Log Scale
z9
U o.
Ref 12 B 14B
Now Bedford Stations
Figur* 22

10 000 Cl 8 PCB Congeners Log Scale
1000Q)
O> a 100 • w mm
9 e0 10 0)
e u 1.0 * u Q. CO 0.1
U T
o.oi • 1 r
0.001-1 1 1 1 1 1
Rl 5f 5B 6B 7B 8B 12 B 14 B
New Bedford Stations
Figur* 23

2 9
99e
10 000-. C1 9 PCB Congeners Log Scale
1000O)
D) 3 100
10 •
e CJ 1.0 •
CJ 4
01 0.1
u 0.01 -
0.00 1 - 1 1 1 1 1 1 Rlif S B 6B 7B 8B 12 B 14 B
New Bedford Stations
Figure 24
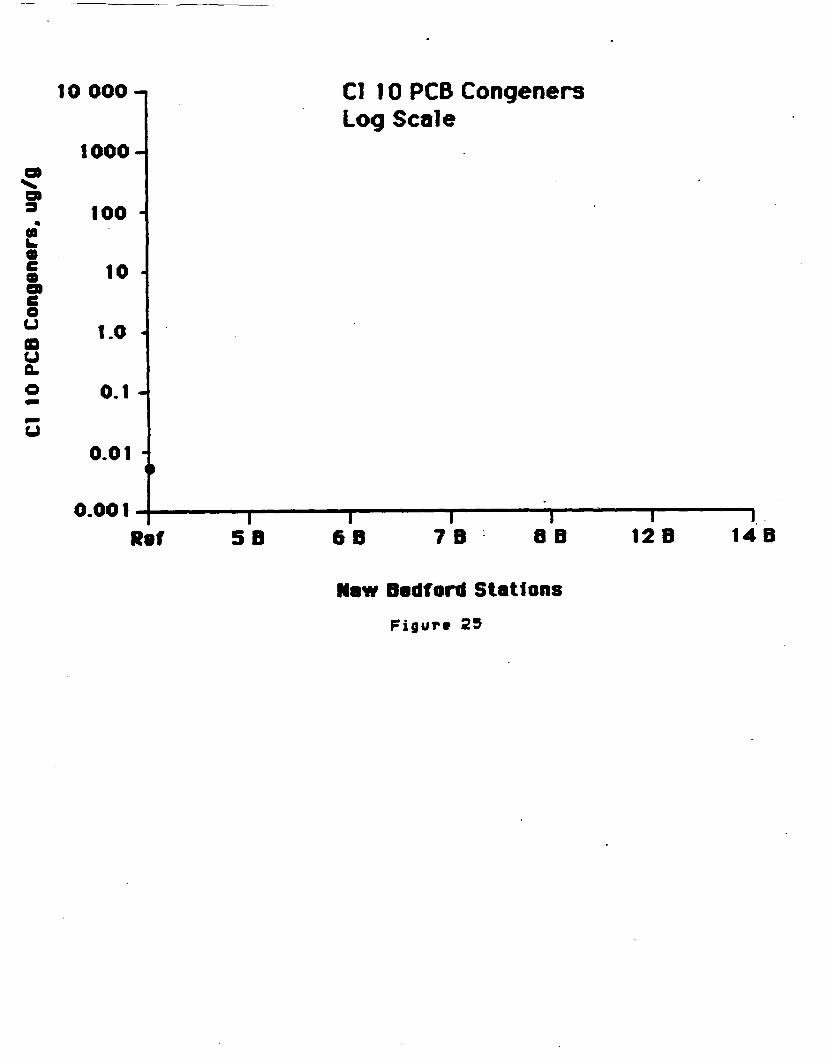
lOOOO-i Cl 1 0 PCB Congeners Log Scale
10000» X
100 •
c 0)0»
10
e u GO
1.0 U QL 0 0.1-
U
0.01 • 1
0.00 1 i i i i i i. Ri If S B 6B 7B 8B 12B 14 B
New Bedford Stations
Figur* 25