
Recording.aspx?fileid=LA F3494 10302014070221726 1176270 ...
36
National Capitol Region HAZUS User Group Call October 30, 2014 10:00 AM EST Listen to the recording here to follow along with the presentation: http://www.freeconferencecalling.com/recordings/Recording.aspx?fileid=LA F3494_10302014070221726_1176270&bridge=697620&email=&accountid =1116753
Transcript of Recording.aspx?fileid=LA F3494 10302014070221726 1176270 ...
National Capitol Region
HAZUS User Group Call
October 30, 2014 10:00 AM EST
Listen to the recording here to follow along with the presentation:
http://www.freeconferencecalling.com/recordings/Recording.aspx?fileid=LA
F3494_10302014070221726_1176270&bridge=697620&email=&accountid
=1116753

NCR HUG Call Details
Conference Call Details: 1. Dial-in: 1-267-507-0240
2. Conference code: 697620
Join the Meeting through Adobe Connect:
(No Registration Required)
Click here to access the Adobe Connect meeting
The call will be recorded and the audio will be combined with the presentation
and sent out at the end of the call. The audio and presentation will also be
made available on the following websites:
NCR HUG Use HAZUS page - http://www.usehazus.com/ncrhug
NCR HUG LinkedIn page - http://www.linkedin.com/groups/National-Capitol-
Region-HAZUS-User-4790251?trk=myg_ugrp_ovr
2
Agenda
• Welcome + Announcements
• Statewide Geospatial Coordination – Progress Report
• Risk Assessment Presentation – Danielle Nagele (NOAA) : CO-OPS
Inundation Network
• “How To” Presentation – Mike McGeehin (RAMPP): Updated Total
Exposure in Floodplain (TEIF) 2.0 Method – Washington County, MD Pilot
• Reminder - HAZUS Data & Training Collaboration Sharepoint
• Request for Volunteers – Next NCR HUG Call
• Adjourn
3
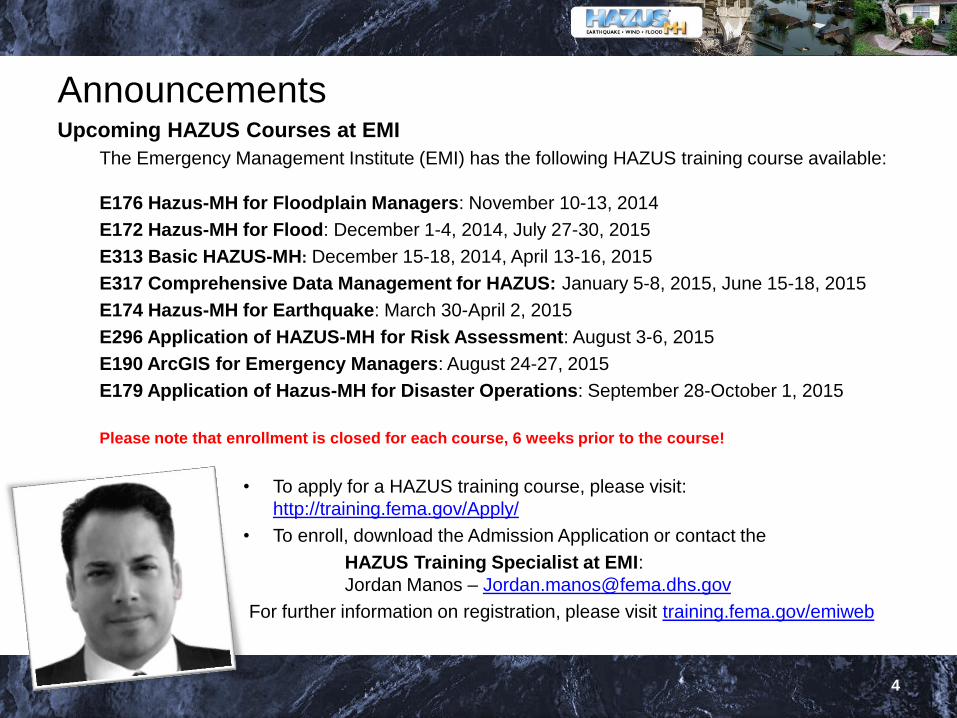
Announcements Upcoming HAZUS Courses at EMI
The Emergency Management Institute (EMI) has the following HAZUS training course available:
E176 Hazus-MH for Floodplain Managers: November 10-13, 2014
E172 Hazus-MH for Flood: December 1-4, 2014, July 27-30, 2015
E313 Basic HAZUS-MH: December 15-18, 2014, April 13-16, 2015
E317 Comprehensive Data Management for HAZUS: January 5-8, 2015, June 15-18, 2015
E174 Hazus-MH for Earthquake: March 30-April 2, 2015
E296 Application of HAZUS-MH for Risk Assessment: August 3-6, 2015
E190 ArcGIS for Emergency Managers: August 24-27, 2015
E179 Application of Hazus-MH for Disaster Operations: September 28-October 1, 2015
Please note that enrollment is closed for each course, 6 weeks prior to the course!
• To apply for a HAZUS training course, please visit:
http://training.fema.gov/Apply/
• To enroll, download the Admission Application or contact the
HAZUS Training Specialist at EMI:
Jordan Manos – [email protected]
For further information on registration, please visit training.fema.gov/emiweb
4

Announcements FEMA Region III E317 Comprehensive Data Management for HAZUS – 3rd Course in Series
Focused on the State’s specific needs related to data management for geospatial risk assessment .
4 day Course – Onsite session
Day 1-3: Official E317 Comprehensive Data Management for HAZUS training course
Day 4 : Interactive session with dynamic discussion, highlighting the State’s specific needs related to data development, geospatial governance and the development of tools to streamline workflows.
Tentative Training Sites – Delaware, Pennsylvania and West Virginia **If other states have interest, please contact Cynthia!
Proposed period of training: Spring 2015 Request for interest will go out in December/January
Trainers: Kevin Mickey and David Coats from the POLIS Center at Indiana University – Purdue University
Desired Outcomes:
• Improved coordination among State and Local
• Increased awareness of geospatial data availability and barriers to access
• Develop strategic plan for geospatial governance
• Discuss the value of tools and workflows to streamline use of HAZUS-MH
Next Steps:
• Future Region III HAZUS training will be supported through each State – State Hazard Mitigation Officer, NFIP Coordinator and Universities
• FEMA Region III will support the development of tools and workflows to streamline the use of local data for HAZUS analysese, to improve local risk assessments and awarenese.
5

Statewide Geospatial Coordination: Monthly Progress Report
Current Effort
• Performing State/District level data gap analysis/Outreach to Counties
Next steps
• Develop outreach strategy to the Local Governments
• Outreach to the Counties using the revised list (remaining datasets).
• Develop tools and workflows – streamline input of multi-jurisdictional data
State and District update
District of Columbia – Completed District wide assessment. Final assessment can be found
here: http://www.usehazus.com/ncrhug/projects
Delaware – Completed Statewide and Local assessment. Current assessment can be found
here: http://www.usehazus.com/ncrhug/projects . Datasets will be made available on the eGIS
system in September, and this assessment will be updated with the links to these datasets.
• Maryland – MDE, MEMA and DoIT are performing their State level gap analysis. Coordination call
scheduled tomorrow.
Pennsylvania – Completed State level and County level assessment!
63 out of 67 counties responded!!! This will be located on the NCR HUG Use HAZUS site soon.
• Virginia – VDEM Completed State level gap analysis. Developing language with VDEM and VITA
for local level outreach.
West Virginia – WVDHS, WVU and WV DoE Completed State level gap analysis.
PDCs level assessment complete. This will be located on the NCR HUG Use HAZUS site soon.
6

Importing Old HAZUS HPR Data into SQL Server
Having trouble importing old Hpr. files into newer versions of HAZUS?
There is a Solution: FEMA Region IV developed a process for importing old Hazus Hpr. data directly
into SQL Server.
Please access the link below for this document:
http://www.usehazus.com/uploads/forum/Import_Hazus_HPR_Results_Into_SQL.pdf
7

Transportation Specific HAZUS User Group
For information on joining our group contact:
Silvana Croope (Delaware DOT) - [email protected]
Thomas Gates (Florida DOT) - [email protected], [email protected]
• Fledgling group
• Primary goal - Improve / maximize transportation analytics within Hazus MH
• Provide a platform discussion & collaboration on ideas on transportation analytics
• Identify sources of funding for research
• Identify the necessary data to provide robust meaningful transportation analytics
• Act as an Information portal for the state of Hazus & modernization efforts
• Help identify training opportunities through EMI
• Foster interest & participation from other organizations & regions
LinkedIn Group Link:
https://www.linkedin.com/groups?home=&gid=8158295&trk=groups_item_detail-h-
logo&goback=%2Egmp_8158295
FLHUG call next Wednesday 11/05/2014 3pm EST
8
CO-OPS
Inundation
Network Danielle Nagele CO-OPS Risk Communication Specialist [email protected]
FEMA HUG Meeting

Project Objectives
Provide support to local WFO, emergency managers, and broadcast media
Enhance visualization of water level information using socially relevant landmarks
Ultimately, assist local partners in their utilization and communication of inundation events

What is the network?
Familiar community locations
referenced to a single point
Socially relevant to the
community: statues, historic
sites
Important to planning process
of local EMs and government:
metro station, fire station

What’s the need?
Communication around storm surge and inundation events
Less confusion around referencing water height
More meaningful than 2 ft. above MHHW
Can describe water level to the public in the context of places they know
Frame of reference for historical events
Ex. Flooding during Superstorm Sandy reached to the waist of ‘X’ statue
New York Prototype
Benchmark installed at seawall in Battery Park
Network of landmarks throughout lower Manhattan chosen and surveyed
Engagement with local partners planned for early next year
‘Unveiling’ around hurricane season – possibly
coinciding with Sandy anniversary

Future Expansion Expanding to 2 or 3 new communities in
FY15
Norfolk, Annapolis – ‘top inundation’ areas
Integration and consideration of the local
community
Discussion with local partners on landmark
locations
Iterative feedback on design of new
platform or integration into existing platform

Potential Process
Engage local partners
• Needs assessment
Choose landmark locations
• Feedback
• Technical considerations
Platform/User-interface
• Iterative feedback
• Potential integration with existing tools
Continually consideration of potential partnerships in
each area – USGS, FEMA,
Sea Grant extension agents

Cynthia McCoy, FEMA Region III, Mike McGeehin, RAMPP, and Glenn Locke, Tetra Tech
Updated Total Exposure in Floodplain (TEIF) Method –
Washington County, MD Pilot

17
Need - Alternative Approach to Evaluate Potential Risk
FEMA Region III utilizes multiple parameters to
prioritize Risk MAP communities for engagement.
• At risk population, existing relationships, level of potential
risk
The Average Annualized Loss (AAL) study has been
used to identify and compare at risk communities.
• LIMITATIONS: Based on the 2000 Census, County-
wide study regions, and utilized course 30 meter DEM •
CHALLENGE - The AAL underestimates losses even
when used for relative comparison
• Especially in coastal communities.
• Ex. Bethany Beach, DE (Sussex Co) –
AAL reports NO coastal flood losses
THEREFORE the AAL does not meet our needs, and
requires an alternate approach
• Enhanced HAZUS for entire Region (or at least by
States?)
• Other lower-cost solutions, such as a “TEIF” analysis!
No
Risk?

18
New Approach - Total Exposure in Floodplain (TEIF) version 1.0
FEMA Region IV released 2010 Census
and ACS data integrated into HAZUS
• Updated to census tracts, applying 2012 RS
Means valuations.
• Includes update to the 2010 nationwide total
exposure data.
Development of Total Exposure in
Floodplain (TEIF) -
• Create a dataset using Arc GIS and MS
Excel.
• Determine an approximate value of Total
Exposure in Special Flood Hazard Areas
(SFHAs).
• Use in lieu of the AAL study.
• Utilized for relative comparison for community
engagement and action potential ranking.

19
GIS Solution – A Three Step Process Step 1
• Transfer 2000 Census Tract Total Exposure Dollar Values (Updated by
Region IV) to 2010 Census Blocks.
• 2010 Census Building Counts were used to distribute the 2000 Census Tract Dollar
amount to the 2010 Census Block units through binomial areal interpolation.
Step 2
• Assemble a statewide SFHA layer.
• Effective DFIRMs in the NFHL, Current Draft Preliminary DFIRMs, Preliminary
DFIRMs, DFIRMs at LFD, or newly effective DFIRMs
Step 3
• Intersect the 2010 Census Block Geography with Total Exposure Dollar
values and the statewide SFHA
• Areal Interpolation of 2010 Census Block in SFHA resulted in the ultimate TEIF value

20
Additional Applications of TEIF Onset of a Risk MAP project
• Inform engagement priorities – aid team in making more informed resource
decisions
Identify highest risk communities
Generally, more “accurate” risk assessment than AAL from perspective of relative risk
(i.e., this community has more risk or “exposure” than others)
Marketing tool
• Illustrate to communities the value of developing enhanced HAZUS risk
assessments through Risk MAP
Used to Prioritize CAV (Community Assistance Visits) meeting
schedule for FEMA Staff.
Supplement AAL with TEIF
• Non-regulatory HAZUS Risk Assessment product development
Another risk assessment tool for communities to consider
May help inform project scope needs by identifying need for enhanced HAZUS analyses in
some project areas
21
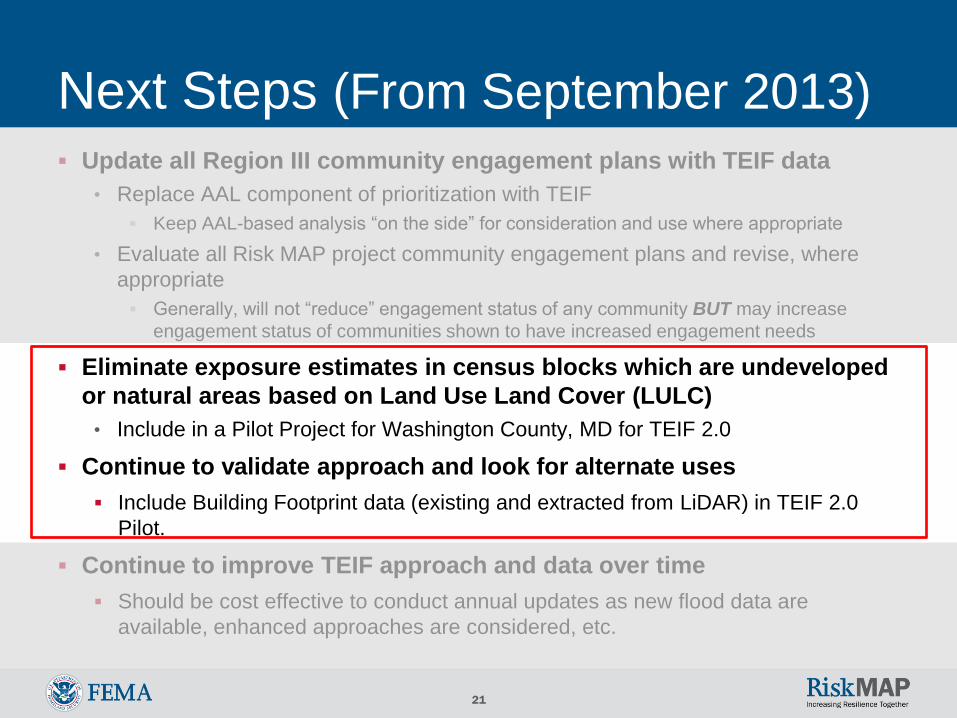
Next Steps (From September 2013)
Update all Region III community engagement plans with TEIF data
• Replace AAL component of prioritization with TEIF
Keep AAL-based analysis “on the side” for consideration and use where appropriate
• Evaluate all Risk MAP project community engagement plans and revise, where
appropriate
Generally, will not “reduce” engagement status of any community BUT may increase
engagement status of communities shown to have increased engagement needs
Eliminate exposure estimates in census blocks which are undeveloped
or natural areas based on Land Use Land Cover (LULC)
• Include in a Pilot Project for Washington County, MD for TEIF 2.0
Continue to validate approach and look for alternate uses
Include Building Footprint data (existing and extracted from LiDAR) in TEIF 2.0
Pilot.
Continue to improve TEIF approach and data over time
Should be cost effective to conduct annual updates as new flood data are
available, enhanced approaches are considered, etc.

22
Updated Approach - Total Exposure in Floodplain (TEIF) version 2.0 FEMA Region IV released 2010 Census
and ACS data integrated into HAZUS
• Updated to census tracts, applying 2012 RS
Means valuations.
• Includes update to the 2010 nationwide total
exposure data.
Development of Total Exposure in
Floodplain (TEIF) version 2.0 -
• Create a dataset using Arc GIS.
• Determine an approximate value of Total
Exposure in Special Flood Hazard Areas
(SFHAs).
• Use Building Counts from LiDAR extracted
buildings footprints.
• Apply Dasymetric approach to eliminate loss
estimates being applied to undeveloped
areas within Census Blocks.
23
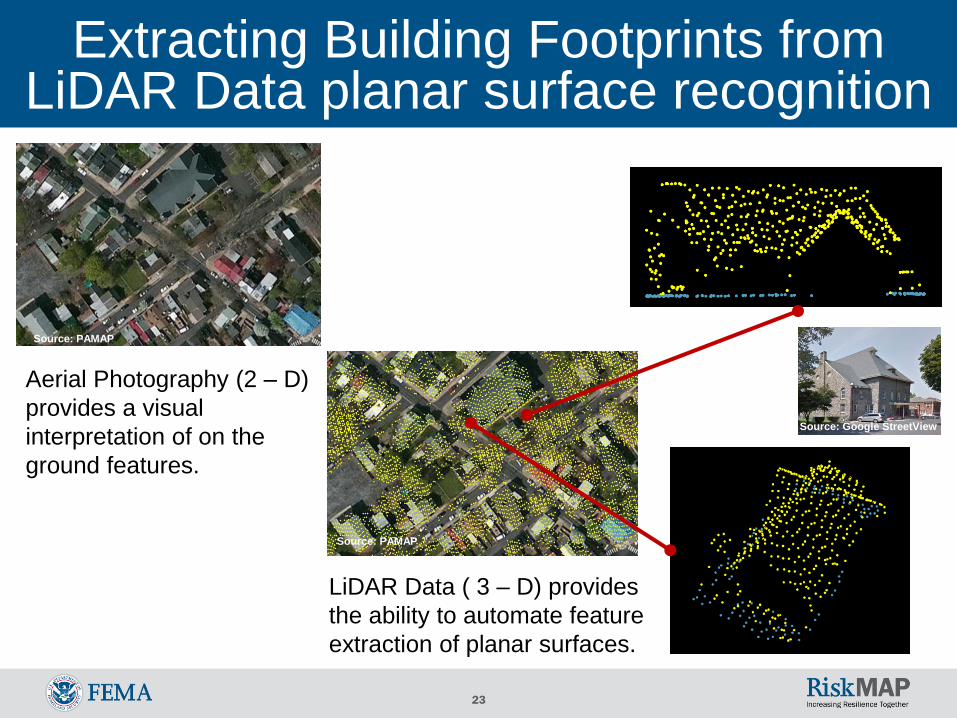
Extracting Building Footprints from LiDAR Data planar surface recognition
Source: PAMAP
Source: PAMAP
Source: Google StreetView
Aerial Photography (2 – D)
provides a visual
interpretation of on the
ground features.
LiDAR Data ( 3 – D) provides
the ability to automate feature
extraction of planar surfaces.

24
Automated and Manual Process using TerraScan Software and ArcGIS
Automated – Part 1 • TerraScan Software (runs on MicroStation)
Building Classification Tool
Input needed: Point rich LiDAR file (.las) file
with ground classified.
• Produces rough polygon shapes through
export to ArcGIS. Automated process can
clean up rough outlines.
Manual – Part 2 • Automated process is not fool proof.
It’s incredibly cost efficient, but not
100 % accurate.
• There will be omission (missing
footprints) and commission (footprints
where no building exists) errors.
• Manual clean up involves spending
time with an aerial photo and intensity
imagery derived from the LiDAR data.
Rough Realistic

25
Results of LiDAR Building Extraction
88.2 % accuracy
rate for automated
feature extraction
98 % accuracy rate
after manual
corrections

26
Comparison with County Building Footprint Data (2005)
Face Value Big Difference – 36,000
Missing Footprints?
Gray – LiDAR
Extracted Building
Black – County
Building Footprints
Average area of
missing building is
35 sq. feet. Non-
inhabitable
structures (sheds,
outbuildings, other
storage …)

27
Dasymetric Approach to eliminate loss estimates in undeveloped areas
Follow Dasymetric Methodology for Hazus
Functional Enhancements for General
Building Stock exposure distribution
• Only difference was to
use a 2010 10 M
Resolution Maryland
Land Use – Land
Cover Dataset.
• Matched Maryland
Land Use Codes with
the NLCD codes for
consistency.

28
Example in Washington County, MD
New Development
Outlier

29
TEIF 2.0 GIS Solution – A Three Step Process Step 1
• Transfer 2000 Census Tract Total Exposure Dollar Values (Updated by
Region IV) to 2010 Census Blocks.
• Building Counts based on LiDAR derived Building Footprints and County Building
Footprint layer aggregated to 2010 Census Block data were used to distribute the
2000 Census Tract Dollar amount to the 2010 Census Block units through binomial
areal interpolation.
Step 2
• Assemble a statewide SFHA layer.
• Effective DFIRMs in the NFHL, Current Draft Preliminary DFIRMs, Preliminary
DFIRMs, DFIRMs at LFD, or newly effective DFIRMs
Step 3
• Intersect the 2010 Census Block Geography minus undeveloped areas
with Total Exposure Dollar values and the statewide SFHA
• Areal Interpolation of 2010 Census Block in SFHA resulted in the ultimate TEIF value

30
Step 1 - Transfer 2000 Census Tract Total Exposure Dollar Values (Updated by Region IV) to 2010 Census Blocks.

31
Step 2 – Assemble Statewide SFHA
A B
Assemble and Dissolve a statewide SFHA layer Zones: A, AE, AH, AO, V, VE, and X Prot. By Levee

32
Step 3 - Intersect the 2010 Census Block Geography (minus undeveloped areas) with Total Exposure Dollar values and the statewide SFHA.
TEIF

33
Results

34
Questions and Contact Info
Glenn Locke • [email protected]
Cynthia McCoy • [email protected]
Mike McGeehin • [email protected]
UPDATE: HAZUS Data & Training Collaboration
• NEW - HAZUS Sharepoint Site: has been set up to facilitate HAZUS data and training collaboration.
• Knowledge asset tool and an archive of Hazus knowledge.
• The goal of this effort is to increase its use and create a platform for deliberation and delivery of Hazus work products through the site.
This site will allow any registered user to (1) post a description of data/results they have to share with others,
(2) post a request of enhanced datasets or results that other’s might have already done,
(3) post information about an upcoming training, and
(4) post a request for training on a specific or general topic.
• To register, send Jenna McGee([email protected]) your
(name, email, phone and organization) so she can build a list to generate initial accounts. Then we can deploy the Region III – NCR HUG group page!
35
Thursday November 20, 2014 at 10:00 AM EST
Use the same number and conference code:
Call 1-267-507-0240 and enter this conference code # 697620
**Request volunteer for next month’s presentation
• HAZUS / Risk Assessment project
• HAZUS “How to” presentation
Meeting notes and an updated presentation with audio will be sent out after this call
Adjourn
Next Call
36


![[cover]gscs-b2c.lge.com/downloadFile?fileId=KROWM000038720.pdf7 Getting Started VoiceUsage:PCSFree&ClearArea-WidePlans TotalVoiceMinutesinmyPCSFree&Clear Area-WidePlan: _____? AnytimeMinutes:](https://static.fdocuments.in/doc/165x107/5fe0b0a37ab90015863285e7/covergscs-b2clgecomdownloadfilefileid-7-getting-started-voiceusagepcsfreecleararea-wideplans.jpg)


