, FI LE CoP, - dtic. · PDF fileFIELD GROUP SUB-GROUP Cyclic lateral loading2 Piles * Scour...
226
, FI LE CoP, MISCELLANECUS PAPER GL 88 10 EXPERIMENTAL RESEARCH INTO THE of EngnBEHAVIOR OF PILES AND PILE GROUPS SUBJECTED TO CYCLIC LATERAL LOADING AD-A 196 799 Lymon C. Reese. Da, A-i, Brown. Sha-r-Tvwer Wang 11512 Tni Cu p Drive, No. 19 Austln, Texas 78750 DTIC i1ELECTE JUN 2 2 198 8 . June 1988 Final Report "- n, .... "/ Minerals Management Service US Department of Interior, Reston, Virginia 22090 and Department of Research. Federal Highway Administration Washinc ton. DC 20590 r. US Army En ineer Division, Lower Mississippi Vall-y PO Box 80. Vicksbiirg, Mississipp 39180-0080 IN.. , Geotuchnical Laihoiatnry ,.-, US Army Enqminer Wterways *) : ... "c2 PO Box 631 VicksbLirq. Mississipp 39180-0631 Contract No DACW3 -M-.67 .' , .. - % . % " ....- , , - . . . . .. . . : -. : , : : . .: ". : . . - . ... : .._ . .. . . - .
-
Upload
nguyenquynh -
Category
Documents
-
view
223 -
download
2
Transcript of , FI LE CoP, - dtic. · PDF fileFIELD GROUP SUB-GROUP Cyclic lateral loading2 Piles * Scour...

, FI LE CoP,MISCELLANECUS PAPER GL 88 10
EXPERIMENTAL RESEARCH INTO THEof EngnBEHAVIOR OF PILES AND PILE GROUPS
SUBJECTED TO CYCLIC LATERAL LOADING
AD-A 196 799 Lymon C. Reese. Da, A-i, Brown. Sha-r-Tvwer Wang
11512 Tni Cu p Drive, No. 19Austln, Texas 78750
DTICi1ELECTE
JUN 2 2 1988 .
June 1988
Final Report
"- n, .... "/
Minerals Management ServiceUS Department of Interior, Reston, Virginia 22090
and
Department of Research. Federal Highway AdministrationWashinc ton. DC 20590 r.
US Army En ineer Division, Lower Mississippi Vall-yPO Box 80. Vicksbiirg, Mississipp 39180-0080
IN.. , Geotuchnical Laihoiatnry ,.-,US Army Enqminer Wterways *) : ... "c2
PO Box 631 VicksbLirq. Mississipp 39180-0631
Contract No DACW3 -M-.67 .' , .. -
% . % "
. . . .- , , - . . . . .. . . : -. : , : : . . : ". : . . - . . . . : . . _ . . . . . - .

UnclassifiedSECURITY CLASSIFICATION OF THIS PAGE
Form 1pp'oedREPORT DOCUMENTATION PAGE OM8 No 0704 0188
__________________________________________I tp Date Jun 30, 1986la REPORT SECURITY CLASSIFICATION lb RESTRICTIVE MARKINGSUnclassified _
2a SECURITY CLASSIFICATION AUTHORITY 3 DISTRIBUTION IAVAILABILITY OF REPORT
Approved for public release;2b DECLASSIFICATIONI DOWNGRADING SCHEDULE distribution unlimited
4 PERFORMING ORGANIZATION REPORT NUMBER(S) S MONITORING ORGANIZATION REPORT NUMBER(S)
Miscellaneous Paper GL-88-10
Ea. NAME OF PERFORMING ORGANIZATION 6b OFFICE SYMBOL 7a NAME OF MONITORING ORGANIZATION
(If applicable) USAEWESGeotechnical Laboratory -.
6c. ADDRESS (City, State, and ZIPCode) 7b ADDRESS(City, State, and ZIP Code) - ,
1 1 5 1 2 T i n C u n D r i v e , '2 , . I n P O B o x 6 3 1 '. .. ,Austin, TX 78750 Vicksburg, MS 39180-0631
Ba. NAME OF FUNDING (SPONSORING St OF-.IE SYMBOL 9 rROCUREMZT iNSTRuMENT IDENTIFICATION NUMBER 0ORGANIZAIION (If applicable)
See reverse Contract No. DACW39-8 -08678c. ADDRESS (City, State, and ZIP Code) 10. SOURCE OF FUNDING NUM RS
PROGRAM PROJECT TASK WORK UNITELEMENT NO NO NO ACCESSION NO
See reverse
11 TITLE (Include Security Classification) 0Experimental Research Into the Behavior of Piles and Pile Groups Subjected to CyclicLateral Loading
12 PERSONAL AUTHOR(S)Reese, Lvmon C.; Brown, Dan Allen; Wang, Shin-Tower " r.13a TYPE OF REPORT 13b TIME COVERED 14 DATE OF REPORT (Year, Month, Day) 15 PAGE COUNTFinal report FROM TO June 1988 228
16 SUPPLEMENTARY NOTATION SAvailable from National Technical Information Service, 5825 Port Royal Road, ,
17 COSATI CODES 18, SUBJECT TERMS (Continue on reverse if necessary and identify by block number) /
FIELD GROUP SUB-GROUP Cyclic lateral loading2 Piles * ScourInteraction factors Pile groups1 " - /, ,i .
19 ABSTRACT (Continue on reverse if necessary and identify by block number)IA research program to study the behavior of piles and pile groups subjected to cyclic ,
lateral loading was conducted at a Houston, Texas site. A single pile and a nine-pile group
situated in the natural clay were tested and then the upper several feet *of clay wereremoved and replaced with sand and the tests were repeated.
Following these tests, another study was undertaken to measure experimentally pile-headflexibility reduction (interaction) factors for the pile group in sand. Tests were madecyclically ar varying magnitudes of applied groundline shear on single piles and two-pileand three-pile subgroups, and the response of unloaded piles in the group was measured.
Concurrent with these studies, pressuremeter (PNT) and cone penetrometer (CPT) tests ,were performed in both the clay and the sand from which capacity predictions were made.
Each of these studies generated a report with voluinous data. This report summarizesthe major findings into one volume. ,
20 DISTRIBUTION /AVAILABILITY OF ABSTRACT 21 ABSTRACT SECURITY CLASSIFICATION[MUNCLASSIFIEDUNLIMITED 0 SAME AS RPT C] DTC USERS Unclassified
22a NAME OF RESPONSIBLE INDIVIDUAL 22b TELEPHONE (Include Area Code) 22c OFFICE SYMBOL
DO FORM 1473. B4 MAR 83 APR ed,tion may be used untl exhausted SECkR.Y CLASSIFICATON OF S PAGEAll other editions are obsolete %classified .\ .,..
Unclasifie
IN.
6
%. 5
Unclassified
SECL'1TV CASSIF ICATION OF THIS PAGE
8a. & 8c. NAME AND ADDRESS OF FUNDING/SPONSORING ORGANIZATION
Minerals Management Service
US Department of Interior 7
Reston, VA 22090
Department of Research
Federal Highway Administration
Washington, DC 20590
US Army Engineer Division, Lower Mississippi ValleyPO Box 80
Vicksburg, MS 39180-0080
I1%,
Unclassified
SECURITY CLASSIFICATION OF THIS PAGE
% % %

I N %PREFACE A
This is a summary report of several studies performed by the University of
Texas at Austin, the University of Houston, and Texas A&M University under con-
tract to the US Army Engineer Waterways Experiment Station (WES), Vicksburg,
Mississippi, for the Minerals Management Service, US Department of Interior; the
Department of Research, Federal Highway Administration; and the US Army Engi-
neer Division Lower Mississippi Valley. The report was prepared under Contract \Jd,
No. DACW39 -M-0867.
This rep rt was prepared by Drs. Lymon C. Reese, Dan Allen Brown, and
Shin-Tower Wang, consulting engineers, and was reviewed by Mr. G. Britt Mitchell,
Chief, Engineering Group, Soil Mechanics Division (SMD), Geotechnical Laboratory
(GL), WES. General supervision was provided by Mr. Clifford L. McAnear, Chief,
SMD, and Dr. William F. Marcuson III, Chief, GL.
COL Dwavne G. Lee, CE, is Commander and Director of WES. Dr. Robert W.
Vhalin is Technical Director.
'Accesiof For- -NTIS CRA& I
UTIC T(AHj oL', "f 4_I , ; .............
P,_d
I ift 0 o
... .. ... .-1-5 '
o :Cr

A
Table of Contents 0
LISTING OF NOTATTONS ......................................... vLISTING OF TABLES ........................................ viiLISTING OF FIGURES ....................................... ixCHAPTER 1 INTRODUCTION ................................. 1CHAPTER 2 SITE CONDITIONS AND FIELD TEST SETUP .......... 9
INTRODUCTION........................................... 9SOIL CONDITIONS AT THE TEST SITE ....................... 9
Natural Clay ...................................... 9Compacted Sand ................................... 14
ARRANGEMENT FOR LATERAL TESTING ....................... 16Site Preparation ................................. 19Measurement of Bending Moments ................. 21Loading Frame and Load Measurement ............ 23Measurement of Deflection and Slope ............ 23Load Application and Control ................... 26Data-Acquisition System ......................... 27 COther Comments ................................... 27
CHAPTER 3 BEHAVIOR OF LATERALLY LOADED PILES AND PILEGROUPS IN CLAY ............................................. 29
BEHAVIOR OF SINGLE PILES IN STIFF CLAYSUBJECTED TO LATERAL LOADING ...................... 30
Measured and Computed Results for Static 0Loading ..................................... 31
Response of Pile ........................... 32Response of Soil .......................... 32
Measured and Computed Results for CyclicLoading .... ................................. 39
Response of Pile ........................... 39 0Response of Soil ........................... 44
Concluding Comments for Single Piles in StiffClay ........................................ 48
BEHAVIOR OF GROUPS OF PILES IN STIFF CLAYSUBJECTED TO LATERAL LOADING ........................ 50
Results of the Pile Group Experiment and •Comparison of Pile Group Behavior withSingle Pile Behavior ........................ 51
General Response ......................... 51Load-Deflection Response ............. 51 *.-
Bending Moments ....................... 53Cyclic Loading ........................ 55 0
Distribution of Load to the Piles ......... 57Load-Transfer (p-y) Curves ............... 63
Comparison of Experimental Results with -.Predictions Using Relevant Precedures of >Analysis ....................................... 70
Introduction ................... .......... 70Elasticity-Based Methods .................. 72Modified Unit-Load-Transfer Models ....... 80
iv S

CHAPTER 4 BEHAVIOR OF LATERALLY LOADED PILES AND PILE
GROUPS IN SAND ......................................... 91BEHAVIOR OF SINGLE PILES IN SAND SUBJECTED TO
LATERAL LOADING ................................... 92 6Measured and Computed Results for Static
Loading ..................................... 93Response of Pile ........................... 93Response of Soil ........................... 93
Measured and Computed Results for CyclicLoading ........................................ 97
Response of Pile ........................... 97
Response of Soil.......................... 107Concluding Comment for Single Piles in Sand ... 114
BEHAVIOR OF GROUPS OF PILES IN SAND SUBJECTEDTO LATERAL LOADING .................................. 114
Results of the Pile-Group Experiment andComparison of Pile-Group Behavior with SinglePile Behavior ................................. 115
Load Deflection Response .................. 115Distribution of Bending Stresses ......... 119Load-Transfer (p-y) Curves ............... 122Summary .................................. 126
Comparison of Experimental Results withPredictions Using Available Analytical DesignProcedures .................................... 127
Introduction .............................. 127Elasticity-Based Methods ........................ 128
DEFPIG ................................... 128Focht-Koch ................................. 130
Modified Unit-Load-Transfer Models ............ 132Single Pile Method ......................... 134Bogard-Matlock Procedure .................. 136
Experimental Interaction Factor ............... 139Interaction Factors ....................... 140 0Design Procedure .......................... 149Comparison of Experimental and PredictedBehavior of Pile Group .................. 150
Summary ....................................... 156CHAPTER 5 USE OF PRESSUREMETERS AT THE TEST SITE FOR
PREDICTING THE BEHAVIOR OF SINGLE PILES ................. 159INTRODUCTION ........................................ 159BASIC THEORY FOR SOIL RESISTANCE CURVES ............. 162
The Q-y Curve and the Pressuremeter Curve ..... 166The F-y Curve and the Pressuremeter Curve ..... 169Critical Depth .................................. 171
PROCEDURES EMPLOYED AT THE TEST SITE ................ 174PROCEDURES FOR CONSTRUCTING p-y CURVES .............. 175
Static Loading .................................. 175Cyclic Loading .................................. 178
PREDICTED RESULTS FROM PRESSUREMETER TESTSIN CLAY ......................................... 180
Static Loading .................................. 181 -Cyclic Loading .................................. 185
. - .I ,

M
PREDICTED RESULTS FROM PRESSUREMETER TESTSIN SAND ......................................... 189
Static Loading ................................ 189Cyclic Loading ................................ 195
CONCLUDING COMMENTS ................................. 199CHAPTER 6 SUMMARY OF RESULTS AND RECOMMENDATIONS FOR
FURTHER STUDY .......................................... 201SUMMARY OF RESULTS .................................. 201
Single Pile Tests ............................. 201Pile-Group Tests .............................. 203Pressuremeter Method for Predicting the
Behavior of a Single Pile ................... 204RECOMMENDATIONS FOR FURTHER STUDY ................... 205
REFERENCES ......................................... 207
iv
% % %

LISTING OF NOTATIONS
b pile diameter
CPMT cone pressuremeter test
CPT quasi-static cone penetration test
c cohesion of the soil
Cu undrained shear strength /', ,-
DCPMT driven cone pressuremeter test
E modulus of pile material
F unit skin-friction component in pressuremetermethod
FVT field vane-shear test
I moment of inertia
J empirical constant, = 0.25
Ko coefficient for at-rest earth pressure S
k soil modulus
Gs the secant modulus to the pressuremeter curve
N number of cycles 0
P j averaged lateral load on each pile in a group
PL limit pressure
Pr pressure related to the injected volume Vr
Pu force per unit of length
p lateral soil reaction per unit length
PCPMT pushed cone pressuremeter test
Q unit frontal resistance in pressuremeter method
qc cone tip resistance
R(pile) pile radius
V 1. .0
% ')". %% %V

R(pnm t) initial radius on the soil cavity in thepressuremeter test
rO radius of pressuremeter probe
S(Q), S(F) shape factor
Sp5% a load on the single pile that causes adisplacement at the pile head corresponding to 5%of the pile diameter
Vr injected volume in pressuremeter
x depth
y(pile) lateral deflection of the pile
y(pmt) increase in radius of the soil cavity in thepressuremeter test
aij interaction factor between piles i and j
S parameter related to the degradation model <"
aparameter related to the degradation model
y unit weight of soil
yr effective unit weight
E 5 0 axial strain of soil corresponding to one-half themaximum principal stress difference
p parameter related to the degradation model
arr radial stress A
shear stress
departure angle
vi
--- %.%

* p
LISTING OF TABLES
Table. No. Page No. 0
1.1 Chronology of Pile Test Program ..................... 7
4.1 Load by row, as percent of total, anddeflection for nine-pile group,loading south .................................... 155
5.1 Pressuremeter test performed at the University ofHouston Foundation Test Facility Sand Site ....... 190
.......
MA
.%
vi i%
a0
LISTING OF FIGURES
Fig. No. Page No. .0
2.1 Stratigraphy of the test site, natural clay ........ 11
2.2 Shear-strength data, natural clay ................... 13
2.3 Compaction of sand with vibratory-platecompactor ............................................ 15
2.4 Grain size distribution for sand .................... 17
2.5 Information on strength of sand at testsite (from Ochoa and O'Neill, 1986) ................ 17
2.6 Excavation and pipe system for saturatingthe sand ......................................... 18
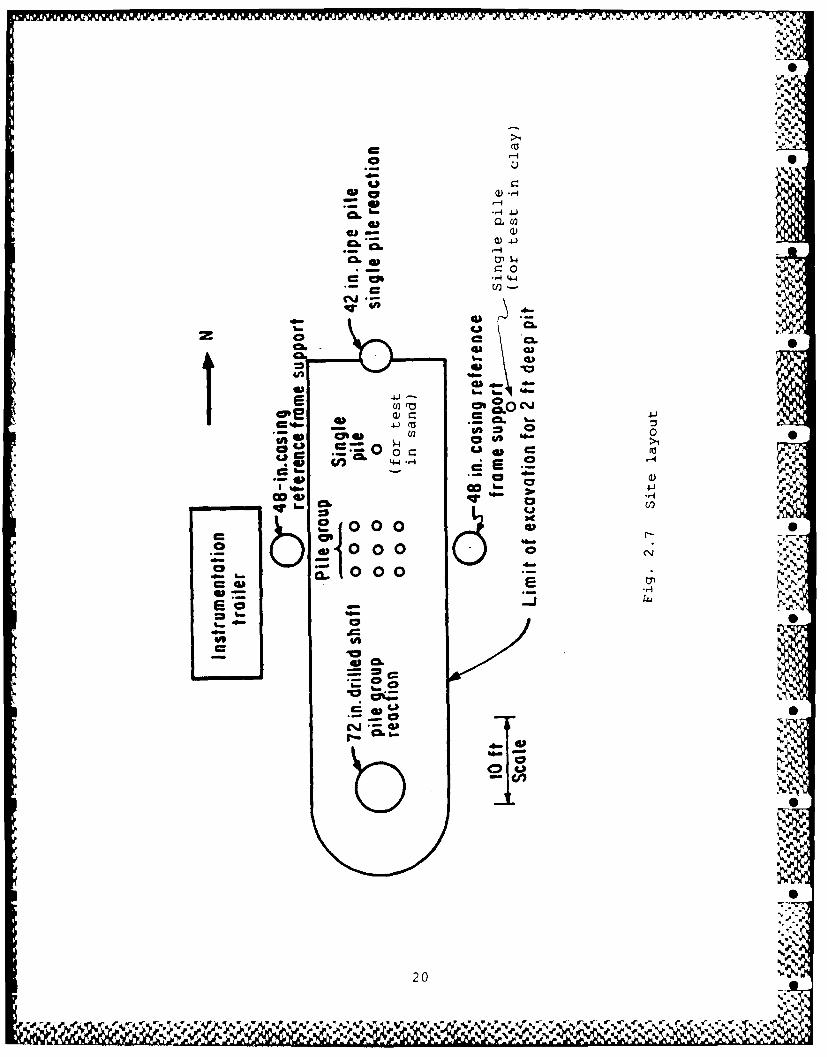
2.7 Site layout .......................................... 20
2.8 Instrumentation for measurement of bending Smoment ............................................... 22
2.8a Single pile in sand .................................. 22
2.8b Single pile in clay .............................. 22
2.8c Group piles (sand or clay) .......................... 22
2.9 Load-cell assembly and view of the loadingframe from the northwest (from Brown &Reese report) ........................................ 24
2.10 Reference frame and loading system ................. 25
2.11 View of data-acquisition system ..................... 28
3.1 Pile-head load vs deflection for 10.75-in.pile during loading .............................. 33
3.2 Pile-head load vs maximum bending moment for10.75-in. pile during static loading ............... 34
3.3 Pile-head load vs deflection for 48-in.pile during static loading .......................... 35
3 .4 Pile-head load vs maximum bending moment .for 48-in. pile during static loading .............. 36
3.5 Experimental first-cycle p-y results,10.75-in, pile ................................... 38
ix
.r F e r % % %% %

3.6 Pile-head load vs deflection for 10.75-in.diameter pile during primary loading(after O'Neill and Dunnavant, 1984) ................ 40
3.7 Pile-head load versus deflection for48.00-in. diameter pile during primaryloading (after O'Neill and Dunnavant,1984 ) ................................ ............ 41
3.8 Bending moment vs depth for single pile ............ 43
3.9 Effect of repeated loading on normalizedp-y response for single pile atselected depths ..................................... 45
3.10 Ground surface gap around 10.75-in. 0pile at end of primary testing.Gap size is estimated ................................ 46
3.11 Ground surface gap a-ound 48-in.pile at end of primary testing ...................... 47
3.12 Pile-head load vs deflection for10.75-in, pile during healing andsand series .......................................... 49
3.13 Curves showing deflection of piles asa function of lateral load .......................... 52
3.14 Maximum bending moment as a functionof lateral load ...................................... 54
3.15 Cyclic response normalized to static 71<response ......................................... 56
3.16 Scour and gapping around piles ...................... 58
3.17 Distribution of load by row ......................... 60
3.18 Bending moment vs depth .............................. 62 0
3.19 Measured p-y curves, depth of 4 ft .................. 64
3.20 Ultimate soil resistance vs depth ................ 67
3.21 Ratio of the values of residual soilresistance to the ultimate soilresistance ........................................... 69
3.22 DEFPIG of lateral load versus deflectionat working loads using constant Es byDEFPIG method, fitted to singlepile data ...................................... ...... 76
P. 1"
-. X,
-j- .r .,, ' r 0%

3.23a Predictions of lateral load vs deflection
by use of Focht-Koch Method, Cycle 1(static) ......................................... 77
i 3.23b Predictions of lateral load vs deflection €by use of Focht-Koch Method, Cycle 100 ........... 77 .
3 .24a Predictions of lateral load vs deflection "/by use of PILGP2R Method, Cycle 1(static) ......................................... 78
3.24b Predictions of lateral load vs deflectionby use of PILGP2R Method, Cycle 100 .............. 78
3.25 Predictions of bending moment vs depthoby Focht-Koch method, Cycle 1 (static) ........... 79
3.26 Predictions of bending moment vs depthby PILGP2R method, Cycle 1 (static) 79
3.27 Predictions of load vs deflection by
a
usingle-pile method, Cycle 1 (static) ............... 84
3.28a Predictions of load vs deflection byB ogard-Matlock method, Cycle 1 ((static) ......................................... 85
3.28b Predictions of load vs deflection by -Bogard-Matlock Method, Cycle 100 ................. 85 .
3.29 Predictions of ultimate soil resistance vsdepth by Bogard-Matlock method, CclCycle 1 .......................................... 86
3 .30 Predictions of bending moment vs depth
by Bogard-Matlock method, Cycle 1 .................. 86
3.31 Predicted ratio Of PRES to PULT vs.adepth using Bogard-Matlock procedure .88
4.1 Load-deflection curve for single pile in sand " .under static loading ... ............................. 94"
4.2 Measured maximum bending moment for single
pile under static loading ............. 94•
by ogad-atlck etodCyce......................86 ..
4.3 Experimentai p-y curves for depths of 12 in. and24 in. for single pile under static loading ...... 95...
4.4 Experimental p-y curves for depths of 36 in. and a"
48 in. for single pile under static loading ...... 95
Xi
%a.

4.5 Experimental p-y curves for depths of 60 in. and .72 in. for single pile under static loading ...... 96
4 .6 Comparison of experimental and computed p-ycurves for single pile under static loading ...... 96..9
4.7 Comparison of experimental and computed p-ycurves for single pile under static loading ...... 98
4.8 Comparison of experimental and computed p-ycurves for single pile under static loading ...... 98
4 .9 Comparison of computed and measured deflectionsfor the single pile under static loading ......... 99.-
4.10 Comparison of computed and measured maximumbending moment for the single pile understatic loading ....................................... 99
4.11 Topography of depression around the singlepile i.............................................101
4.12 Load-deflection curves for single pile for ..cycle 100 ........................................ 102
4.13 Normalized moment curves for single pilefor first deflection increment ..................... 103
4.14 Normalized moment curves for single pilefor third deflection increment ................... 104
4.15 Normalized moment curves for single pilefor fifth deflection increment .................... 105
4.16 Pile-head load vs maximum moment forsingle pile during cyclic loading .................. 106
4.17 Loads and deflections applied on compres-sion stroke of cycle, single-pile test ............ 108
4.18 Loads and deflections applied on tensionstroke of cycle, single-pile test ................ 109
4.19 Experimental p-y curves for depths of 12 in. and24 in. for single pile under cyclic loading ...... 110
4.20 Experimental p-y curves for depths of 36 in. and %48 in. for single pile under cyclic loading ...... 110
4.21 Experimental p-y curves for depths of 60 in. and72 in. for single pile under cyclic loading ...... 111
xii

4.22 Comparison of experimental and computed p-ycurves for single pile under cyclic loading ...... 111
4.23 Comparison of experimental and computed p-y 6curves for single pile under cyclic loading ...... 112
4.24 Comparison of experimental and computed p-ycurves for single pile under cyclic loading ...... 112
4.25 Comparison of computed and measured deflectionand maximum bending moment for the single pileunder cyclic loading ................................ 113
4.26 Pile-head load vs deflection by row position, %-cycle 1 .......................................... 116
4.27 Pile-head load vs deflection by row position,cycle 100 ........................................ 118
4.28 Pile-head load vs maximum bending moment by
row position ........................................ 120
4.29 Bending moment vs depth by row position,normalized to pile-head load ....................... 121
4.30 Typical p-y curves by row position ................. 123
4.31 DEFPIG predictions of group response ............. 129 S
4.31a Comparison of measured deflections with singlepile deflections computed by elasticanalysis ............................................ 129 %
4.31b Comparison of measured deflections with defl-fc- 0tions computed by DEFPIG without local yield ..... 129
4.31c Comparison of measured load distribution withload distribution computed by DEFPIG withlocal yield ...................................... 129
4.32 Focht-Koch predictions of group response forstatic loading ................................... 131
4.32a Comparison of measured deflections with static j
deflections computed by the Focht-Koch method .... 131
4.32b Comparison of measured maximum moment withstatic maximum moments computed by the Focht-Koch method ..................................... 131
4.32c Comparison of measured load distribution withload distribution computed by the Focht S-Koch method ..................................... 131 %A
xiii
-.
V
4.33 Focht-Koch prediction of group response forcyclic loading ..................................... 133 Z Ir
4.33a Comparison of measured deflections with cyclic -deflections computed by the Focht-Koch method .... 133
4.33b Comparison with measured maximum moments withcyclic maximum moments computed by the Focht-Koch method ........................................ 133
4.33c Comparison of measured load distribution withload distribution computed by the Focht-Koch method ....................................... 133
4.34 Predictions of group response using thesingle pile method .................................. 135 .
4.34a Comparison of measured deflections with staticdeflections computed by the single pilemethod ........................................... 135
4.34b Comparison of measured deflections with cyclic Sdeflections computed by the single pile -
method ........................................... 135
4.35 Bogard-Matlock predictions of group responsefor static loading ................................. 137
4.35a Comparison of measured deflections with staticdeflections computed by the Bogard-Matlock method ................................... 137
4.35b Comparison of measured maximum momentswith static maximum moments computedby the Bogard-Matlock method ....................... 137
4.36 Bogard-Matlock predictions of group responsefor cyclic loading ................................. 138
4.36a Comparison of measured deflections with •cyclic deflections computed by theBogard-Matlock method ............................... 138
4.36b Comparison of measured maximum moments withcyclic maximum moments computed by theBogard-Matlock method ............................... 138 0
4.37 Flexibility matrix for a nine-pile group withfree-head connections (after O'Neill, 1983) ...... 142
4.38 Design chart: aij vs S/D for , = 00, Cycle 1 ..... 143
01
xiv %
- . ..- ....- . -' ."-" " . A ." "
4.39 Design chart: aij vs S/D for { = 00, Cycle 100 ... 144
4 .40 Design chart: Xij vs S/D for =1800, Cycle 1 ... 1454.41 Design chart: aij vs S/D for = 1800, Cycle 100 . 146 !
4.41 Design chart: aj vs S/D for 900, Cycles 10.4.42 Design chart: ctj vs S/D for = 90, Cycles 1
and 100 ............................................. 147
4.43 Definition of . .................................. 148
4.44 Distribution of load and deflection of groupCycle 1, loading north, group load = 66.08 k .... 151
4.45 Distribution of load and deflection of group :Cycle 1, loading south, group load = 63.47 k .... 152
4.46 Distribution of load and deflection of groupCycle 100, loading north, group load = 64.83 k .. 153
4.47 Distribution of load and deflection of groupCycle 100, loading south, group load = 58.48 k .. 154
5.1 Schematic of the preboring pressuremeter modelTEXAM (PBPMT) ................................... 160 WW
5.2 Schematic of the cone pressuremeter modelPENCEL (CPMT) ....................................... 161
5.3 Static equilibrium of stresses on a pile (after S
Digioa, et al., 1981) .............................. 163
5.4 Distribution of friction resistance and frontresistance (after Briaud, et al., 1983b) ......... 164
5.5 Texas A&M University bored pile load test 0
(after Kasch, et al., 1977) ........................ 165
5 .6 Obtaining the Q-y and F-y curves from thepressuremeter curve (from Braiud, et al., 1983b). 168 "S
5.7 Pile critical depth versus soil-pile relativerigidity (from Briaud, et al., 1983b) ............. 173
5.8 Pile reduction factor (from Briaud, et al.,(1983b ) .......................................... 173
5.9 Pressuremeter reduction factor (from Briaud, etal., 1983b) ......................................... 173
A %
xv
%_
%-'

5.10 Probe inflation in cyclic pressuremeter testwith displacement control .......................... 176
5.11 Cyclic degradation parameters definition .......... 179
5.12 PBPMT: predicted monotonic p-y curve for 10.75 in.diameter pile (preboring pressuremeter test) ..... 182
5.13 Measured and predicted displacement of 10.75 in.diameter pile ...................................... 183
5.14 Measured and predicted displacement of 48.00 in.diameter pile ...................................... 184
5.15 PBPMT monotonic and cyclic p-y curves for10.75 in. diameter pile at 17.00 ft. depth(degradation parameter a = 0.06) .................. 186
5.16 Comparison of predicted and experimental load-deflection curves for 100 cycles for the 10.75-in.-diameter pile ....................................... 187
5.17 Comparison of predicted and experimental load-deflection curves for 100 cycles for the 48-in.-diameter pile ....................................... 188
5.18 p-y curves derived from pre-bored TEXAMpressuremeter tests at the University ofHouston Sand Site .................................. 191
5.19 PBPMT: Predicted monotonic response of the singlepile compared to the measured response ........... 192 4
5.20 PCPMT: Predicted monotonic response of the single Spile compared to the measured response ........... 193
5.21 DCPMT: Predicted monotonic response of the singlepile compared to the measured response ........... 194
5.22 PBPMT: Predicted cyclic response of the single •p ile ............................................. 196
5.23 PCPMT: Predicted cyclic response of the singlep ile ............................................. 197
5.24 DCPMT: Predicted cyclic response of the singlep ile ............................................. 198
xvi
w

CHAPTER 1
INTRODUCTION
This report provides a summary of a research program on
the behavior of piles and pile groups subjected to lateral
loading. The program was sponsored jointly by the Minerals
Management Service (MMS), U.S. Department of Interior; The
Office of Research, Federal Highway .Administration (FHWA);
and the U.S. Army Corps of Engineers, Waterways Experiment
Station (WES). The primary focus of the research consists of
field testing of a full-scale pile group at the University of
Houston Pile Test Facility. The availability of an existing
pile group, as well as a wealth of geotechnical data and
previous pile test data provided an opportunity to conduct
the experimental studies in an efficient and cost-effective
manner. The nine-pile group was tested first in the natural
clays at the site. Then several feet of the clay was
excavated and replaced with sand and the group was retested.
A number of reports and voluminous data have been
generated as a result of these studies, and this report
summarizes the major findings into one volume of convenient
size. References to the complete reports are provided to
allow the interested reader to investigate a particular topic
in detail. This report will include only data necessary to
s 5-4%

illustrate observed trends or to support relevant
conclusions.
Chapter 2 of this report describes the site conditions,
both for the clay and the sand, and also describes the
arrangement for the testing. The test setup is described for
the single pile and for the pile group.
Chapter 3 deals with the performance of piles and pile
groups in the natural stiff clays, and Chapter 4 deals with
the behavior of piles and groups of piles under similar
loading conditions in sand. Care was taken to not load the
piles to structural yield during the tests in clay, thus
allowing the same testing arrangement to be used for the
testS n sand.
The chapters on pile behavior in stiff clay and sand are
subdivided into sections discussing the research on single
piles, and sections on the group response. The research on
single piles was originally intended to provide the basis for
the evaluation of group effects, but the study was expanded
to include research into prediction of behavior under lateral 0
loading by use of the pressuremeter.
The sections on group performance include both a
discussion of major findings related to the behavior of
2

groups of piles compared with that of isolated single piles
and a comparison of results with available analytical
procedures. Some additional work to experimentally determine
the "interaction factors" used with some of these available
design procedures was also performed.
Chapter 5 presents information on the use of results
from the pressuremeter in the analysis of piles under lateral
loading. Because the installation and procedure used in
conducting pressuremeter tests are so critical to the
interpretation of the data and use of the pressuremeter
design method, such relevant information is included in
Chapter 5.
Presented in Table 1 is a chronological history of the
oile installation and testing relevant to this research. The
original installation of the piles in the natural stiff clay
%:.as part of an FHWA sponsored study of pile group action
during axial loading. Considerable data on the pile and soil
response during and after driving was generated during that
study, along with geotechnical data. The lateral test of the
single pile in clay was performed as a part of an industry-
Sponsored research project into the effects of pile diameter
and loading rate; this testing is relevant to the current
research in that the results are utilized for the response of '
-'-e single pile in clay. The reports generated by the % " I,
3
current research and which are of direct importance to this S
research are listed below. .>
Test of the single pile in clay:
O'Neill, M.W. and Dunnavant, T.W., "A Study of the
Effects of Scale, Velocity, and Cyclic Degradability on
Laterally Loaded Single Piles in Overconsolidated Clay,"
Report No. CE 84-7, Dept. of Civil Engineering,
University of Houston University Park, Oct., 1984.
Test of the group in clay and summary of the single pile in
clay:
Brown, D. and Reese, L.C., "Behavior of a Large-Scale
Pile Group Subjected to Cyclic Lateral Loading,"
Geotechnical Engineering Report GR85-12, Geotechnical
Engineering Center, The University of Texas at Austin,Austin, Texas, May, 1985.
Tests of the single pile and pile group in sand:
Morrison, C. and Reese, L.C., "A Lateral Load Test of a
Full-Scale Pile Group in Sand," Geotechnical Engineering
Report GR86-1, Geotechnical Engineering Center, The
University of Texas at Austin, Austin, Texas, August,
1986.
Experimental determination of group interaction factors in
sand:
4

Ochoa, M. and O'Neill, M.W., "Lateral Pile-Group ,
Interaction Factors for Free-Headed Pile Groups in Sand
from Full-Scale Experiments," Report No. UHCE 86-12, V
Department of Civil Engineering, University of Houston
University Park, Houston, Texas, Oct., 1986.
Pressuremeter testing in clay:
Makarim, C.A. and Briaud, J.L., "Pressuremeter Method
for Single Piles Subjected to Cyclic Lateral Loads in
Overconsolidated Clay," Research Report, Department of •Civil Engineering, Texas A&M University, Dec., 1986. r
Pressuremeter testing in sand:
Little, R.L. and Briaud, J.L., "A Pressuremeter Method
for Single Piles Subjected to Cyclic Lateral Loads in
Sand," Research Report No. 5357, Department of Civil
Engineering, Texas A&M University, April, 1987.
While not directly used in the current research program,
several references in the bibliography are relevant to the
specific piles and soils at the site. These include the
references by O'Neill, Hawkins, and Mahar (1981,1982), by
O'Neill, Hawkins, and Audibert (1982), and by Mahar and
O'Neill (1983).
5, . -* . -- V-* . .% % %
% .1 ." I

The chapters which follow present the major findings of
this research, followed by a summary of the most important
conclusions affecting design, and recommendations for further kresearch.
Note: Because this report is a summary of the several 4
reports that are listed above, the usual rules of referencing
are not followed in all instances in order to streamline this
presentation. However, referencing is used where it is
desired to advise the reader that more detailed information S
is available elsewhere.
.5N
.0-
6
%

Table 1.1 Chronology of Pile Test Program S
Installation of test piles (FHWA study) Oct., 1979
Axial load testing of group Nov., 1979-Apr,1980
Flood test pit for single pile in clay June, 1982
installation of single pile in clay Nov., 1982
Lateral test of single pile in clay Feb., 1983
Excavate and flood test pit for group Oct., 1983
Lateral test of group in clay May, 1984
Excavate clay, place sand, flood site July-Aug., 1984
Lateral test of single pile in sand Oct., 1984
Lateral test of group in sand Oct.-Dec., 1984
70
p,'
Sen.
0. ,:'%N.
".;,-
'. '. c' .":.. % .... ' "..........;?... .. ' .'?¢ ............. ...; .;+..z ; .i ... ....... i -';-,...'?-'......,',"?.2-. -. , !_ . : ' : ,,"i._ i !.... "-"'iiTflii'i li-iii-i'i'ilil
UV.4
CHAPTER 2
SITE CONDITIONS AND FIELD-TEST SETUP
INTRODUCTION
A brief description of the site conditions for the pile-
testing program is presented in this chapter. Also presented
is a discussion of the most important features of the test 0
setup, loading, and experimental measurements. The section
on site conditions covers both the test conditions for the
natural, stiff clay and the conditions of the sand fill.
SOIL CONDITIONS AT THE TEST SITE
Natural Clay
The natural, stiff clay soils of the upper 24 ft.
consist of preconsolidated clays and silty clays of the
Pleistocene-age Beaumont Clay formation. These materials
encompass the zone of primary importance during lateral
loading. Underlying the Beaumont is the Montgonery
formation, a similar but older Pleistocene deposit. Both
were formed as deltaic terraces, deposited during
interglacial periods and preconsolidated by desiccation
during periods of glaciation (when the sea level was ..
lo,.ered) .
% %
,,,, - -. 4• . ..-.-..-.- - - - - - - - .]%'.V

The stratigraphy of the test site, along with -'
classification test results, are presented in Fig. 2.1.
Observations during excavation after load testing revealed a
pattern of very closely spaced joints and fissures in much of
Stratum I. Stratum II had numerous slickensides, as
indicated during geotechnical sampling and laboratory J
testing.
A variety of data on the strength of the clay was %
acquired in the considerable geotechnical research at the •
test site (Mahar and O'Neill, 1983; O'Neill and Dunnavant,.%. .
1984). Testing for shear-strength evaluation was
concentrated on undrained laboratory and in-situ tests,
including:
1. unconsolidated, undrained (UU) triaxial tests,
2. isotropically consolidated, undrained (CIU)
triaxial compression tests,
3. quasi-static cone penetration tests (CPT),
4. field vane-shear tests (FVT),
5. pressuremeter tests (PMT),
6. Ko-consolidated (CKoU) triaxial compression tests,
and
7. one-dimensional consolidation tests. .,
1.0.

WATER CONTENT, %
0010 20 30 40 50 60 70 800S
IA*
030
ww
0 30
0T0TIGIVH
0-- 40I ST-F TOVEY -TIFGRY- NDTA-LA--LH
6VSIF0 OHR LIGHT GRA NPANSNYCLY(L
V DENSE RED AND LIGHT GRAY SILT WITH CLAYEYSILT AND SAND LAYERS (ML)
Fig. 2.1 Stratigraphy of the test site, natural clay
.1*
*.1* l
Ph
11O
or~~~~~~ ~ ~ ~ ~ ~ prdro r.,-', % 'NN.'N'y00'eOp., p R 0' 10 o 41ofl Z% 1, o.

Items 6 and 7 were performed prior to flooding the site and
are reported by Mahar and O'Neill (1983). The pressuremeter
tests are described in detail in Chapter 5.
The strength tests listed as Items 1 through 4 are
presented in Fig. 2.2. These tests were performed after N
flooding the site for a period of at least several months.
Measurements of compression-wave velocities with cross-hole
seismic tests indicated that flooding was effective in
achieving substantially complete saturation of the soils
above the natural water table. Except for the top few
inches, pore pressure changes due to flooding produced only
subtle changes in shear strength. The UU triaxial tests were ,.
performed with a cell pressure of 1.5 times the total
zverburden pressure, and the CIU triaxial tests were
:nsolidated to a stress equal to 1.2 times the effective
ver ical stress. The undrained shear strengths (Su) from .
results of the CPT test were computed from the cone tip
resistance (qc) using:
SS
U N
where Nc is the cone tip bearing capacity factor (=13.6,
based on correlations with the results from the field vane
test) and (Tv is the total vertical overburden stress.
12
*4%- "

%
UNDRAINED SHEAR STRENGTH, SU, PSI .
0 10 20 30 400
V2 v, 1/(FIELD VANE)
PINE'TERPRETED -SHEAR STRENGTH)\PROUILE -
10e
(CONE PENETROMETER)\,
o 15
0.w
iii 20otaco o
25
30-_NA UU TRIAXIAL TEST
401 8 CIU TRIAXIAL TEST r
Fig. 2.2 Shear-strength data, natural clay. ',
%'p
96%
13 'N "* .",
- - ;, ,> ,..; ., . .;-,..;... -;- --- '.- ;?N ' w.'.''.-".'.'.-.-';-" -.3,-c. .," .- :, ,-

Results from the FVT provide an estimate of sensitivity;
comparison of peak and residual shear resistance indicates a
sensitivity in th_ upper 5.5 ft. of about 2.
The scatter in test data on undrained strength shown in
Fig. 2.2 is typical of desiccated clay. Mahar and O'Neill
hypothesize that the cracks produced during desiccation allow
spatially-variable suction pressures in the pore spaces,
which leads to pointwise and directional variability in shear
strength and water content. The relatively close joint
spacing in Stratum I could account for less variability in
this zone than in deeper strata that are slickensided. Thin
partings and pockets of sand in Stratum IA likely contributed
to scatter in this zone, particularly in the CPT values.
Compacted Sand
The experiments in sand were performed after completion
of the work in clay. An excavation was made to a depth of
9.5 ft. and sand was compacted around the piles. Because the %
sand extends to a depth of slightly more than 10 pile
diameters, the response of the piles to lateral loading is
dominated by the response of the sand.
The sand was placed in a relatively dry state and NA
compacted in 6-inch lifts using a Dyna-pac EY15 vibrating-
plate compactor, as shown in Fig. 2.3. The compaction
achieved a medium density, with an average dry density after
14
%1 %d % %%l %.~ lI4*v...

AM~
,Wk
jWI
Fig.2.3Compctin o san wih vbratry-latcompacto
15P

conmaction of about 98 lbs/ft 3 . As indicated by the range of
grain-size curves from seven samples shown on Fig. 2.4, the
sand is of uniform gradation and is classified SP by the
Unified Soil Classification System. Results of direct shear
tests indicated the compacted sand to have an angle of
nternal friction, 4, of 38.50. Results from in-situ CPT and
standard penetration tests (SPT) are shown in Fig. 2.5, along
W:ith a correlation with the angle of internal friction. In-
situ PMT's were performed using a variety of installation
techniques; these test results are reported in detail in -
Chapter 5 of this report. :NThe geometry of the excavation and backfill is
illustrated in Fig. 2.6. As shown in that figure, perforated N
- ,C pices were embedded at the base of the sand fill and were ,'.
used -c saturate the sand by flooding from below. As the
sani backfill was placed, the water level was brought to the
tcp of each preceeding layer. Upon completion of placing all
of the sand, the water level was "flexed" several times by
drawing the water level all the way down and reflooding. The
site -,;as then maintained in a flooded condition.
ARRANGEMENT FOR LATERAL TESTING
The testing arrangement for the two programs of testing
cf the pile group was virtually identical. The arrangement
16
%
%. %"*,NCO %a

U.S. standard sieve number ---- 3100- 21- 1r410 16 3050 1002004 0
fl -- - --
CO40 -- --- 0 0
b U 0 0
0 100 a-- -
0 } , , ki l, , ,I 1 , , ,l , I 0
10050 o 5 1.0 0.5 OJ 0.05 0.0 0.00 0.00
Grain size in millimeters
Fig. 2.4 Grain size distribution for sand0
SPT COUNT, BLOWSIFT
0 10 20 30 40 50 60 70 0 90 100
ANGLE OF KTUm4A. FCTO, OEGFEES Tow RESISTANCE qC 0(91cm')
0 50 35 40 45 0 10 20o40 3o 4I I I 0.0 0 ,
SRPT-2 1.0
Id tL .5
,~CEA SAND.FID LOL
Q~W5A~QFL1. IP- 2.04 4 I 4, 4 !,35
4'STFV TO VEIVY STFP z
RE AM LJGT GRAY 3.0 Q-..A
NI37 [24FT. £t
L&P M20 AbAR AND OILL, 1931o o.
~ L5 ~20p 95.0- 39 I
a. Results from the standard b. Results from the cone ..,.,
penetration test and esti- penetration test and esti- 0
mated values of the angle mated values of the angle V
of internal friction of internal friction
Fig. 2.5 Information on strength of sand at test site
(from Ochoa find O'Neill, 1986)
17
35~~, -.[
a. ~ ~ ~ ~ ~ ~ ~ ~ ~ ~ ~ ~ m Reut rmtesadr b eut rmtecn
pentraio test an esi peerto test%~ an esti- .,

I. I
contours of excavation depth
0
0, -2s -48 -6#0 00A 1 A
-- 91 0 0 0 0
6 ft 0
Scale PLAN ..,,
Pile group
Original Ground Surfac PVC Single EaEl.'2.0 I -- . Rser Pile Elevation ;, ItRser2 It
Tot of Sand EI.O.O ft* -O ft-- -2 It : "-
Bottom of Pipes -- 6 IEl.-9.0 ft
Bottom ofExcavation E.-9.5 ft If
Perforated PVC Pipe
- 6SECTION A-AScale
Fig. 2.6 Excavation and pipe system for saturatingthe sand
0
181

for testing the single piles was also virtually the same for
the test in clay and in sand. The general testing
arrangement for all of the pile tests is described in the
following paragraphs. Any significant differences between
tests will be noted. The testing arrangement used by Ochoa
and O'Neill in the interaction factor study was similar to
that described in this chapter, except that all of the piles
in the group were not connected simultaneously to the loading
frame. Specific details related to the interaction factor
will be noted in Chapter 4.
Site Preparation
In order to simulate the offshore and riverine
environments as closely as possible (for cyclic loading), a
shallow pit was excavated around all of the piles and flooded
with water. The general layout of the site is showr in Fig. 0
2.7. The pit was 1.5 to 2 feet deep and was continually
submerged for several months prior to testing. For the tests ..
in sand the pit was filled by flooding from the perforated
pipes below the sand as described previously. Cyclic load is
to be expected on pile groups in most applications. The
assumption is made that submerged soil will behave less
favorably under cyclic loading than will partially saturated
soil or dry soil. The pore pressures that are generated in
submerged soil during cyclic loading and scour due to a gap -
19
% %i, % *'~ ~ ~ ~~~~~~ ~~~~~~~~~~~~~~~P r.- z.: . --"". ._ - -',% -A - ~ ' - ' -
>1
u
a. ~ -4 4
ci ~ -4440.0)
awl
= 0. 04>0. 44-4) - .
44-CL U)
ca W0 0 0
5D00 0 0cvv
CCL
220
V- r V
%S

that can develop between the soil and a pile are important
factors related to pile-soil interaction.
Measurement of Bending Moments
In order to determine the distribution of stresses along
the length of the piles in the group and to derive p-y curves
for the soil, bending moments were measured at various depths
on all piles for all of the tests. For the single pile
tests, these measurements were made using electrical
resistance strain gauges on the outside of the piles. -•
Because the piles in the group were already in place, -.
measurements were made in these piles by first applying the
strain gauge network to a smaller diameter pipe (6.625 in.
O.D.) and grouting this instrumented pipe into place within
each pile. A schematic diagram of the gauge locations is ...
shown in Fig. 2.8.
For the single pile in clay (by Dunnavant and O'Neill),
the bending-moment gauges on the pile were calibrated in the
laboratory prior to driving. For the group piles and the -.-
single pile in sand, calibration was performed in the field ,..-
after excavation of the pit for placement of the sand. 0
Because the gauges are not at the extreme fiber of the
piles and because of the influence of the small amount of V
cement grout, the instrumentation for the group piles
21
~ *-.:-~-.:-. ~ .x.. \ ~ ~ ~ ~ i~ ~ %**%~* .g ~.~..V

Ste Pie 107 In dia..va l.A
x~~~~~. 0,6 naal 0-
- Top o pile
Poin of oad2 WA LOA/DIPLAAfENG o -u a l v e l u d l i e C N T R O L E D C T U A O R 3 6 4
WITH~~~-f LODCELRFEEC
5O36 -n wa- T -10 -- -
Pon ofla A DDSP ACE EN
9 5 75F DE
Bottom of FTd
9.5\sandBRIDGESAT 2-FT
Stiff to Very Stiff Tan andLight Gray Clay2
BRIDGESAT 4-FTUSPACING
(8 i )
a. Single pile in sand BRIDGEAT 8-FT
SPACING(8
0.75-IN 00,
-5 - Top at Pip.e 40 5 FT LONG
5 O'PEN-ENDED P IPE
-2.3-_ Tpof___ WALL THICKNESS *0 365 S
-1 Point of Load A ppliCation NOTE TOP STRAIN GAGE LEVEL IS 1 5 FT BELOW PILE TOP
0INSTRUMENTATION LEGEND © LINEAR POTENTIOMETER
- Gouge lee" uln DIAL GAGE
2- - 2
3 - 3 b. Single pile in -lay- 4- 4 Gru
475 Saond - 56- - 6
7 -- 7X 8- - 8 61 , 6.625'o.d.
- steel pip- Clay - 10 selpp Fig. 2.8 Instrumentation
o for measurement13- - if of b ndin
Spacers, typ. moment
16 - Bottom of PipeGr %t
cGroup piles (sand or clay)
22
d.ft r 'rft - t

07, 1..5n
crovides a less accurate indication of bending moments than
does the instrumentation for the single piles. The accuracy 0 .5
of the bending measurements on the group piles are thought to
be in the range of plus or minus 10 in.-kips.
Loading Frame and Load Measurement
In order to accurately control the restraint conditions
at -_he pilehead and to measure the shear force distributed to
each pile, tae piles were loaded using a frame with moment-
free connections. Each of the pinned joints used to connect
the piles to the frame was instrumented to serve as a load IA.e
cell for measuring the load that came to a pile. A similar
connection was used for the single-pile tests. The loading
of selected piles for the interaction-factor study was easily
accomplished by simply disconnecting some of these joints. A
diagram of the load-cell assembly and a photograph of the
..ading frame is provided in Fig. 2.9.
Measurement of Deflection and Slope
Although the loading frame was quite rigid with respect
to the piles, measurements of deflection were made for each, e. -. -
nile. These measurements were made from a separate frame
a-_ -d to the large, embedded steel casings shown on Fig.
.-. Deflection measurements were made near the point of
l> ding using linear conductive-plastic potentiometers.
~.i .icr measurements were made at points four feet or more
23
e%.... W F. . e% .%.4:<:..% %i

Pile Mounting Plate Channel Cross Members
Pinieae
PiLoa Cella
Hge BracketPlate
Load cell assembly
Of %
.1 J
: .9 O d -ce l as embl and 4 ew of t e lo-a.qLrame~~~~~~a frmtenrhes fo rw
Ree-se repor-
24S
ZIP a

Reference Frame di
Pot-entiometer Wf or
Hydraulic Actuator
Fig. 2.10 Reference frame and loading system
252W~Yv

above the loading point to allow determination of the slope
at the LE uf the pile. Identical techniques were used for
the single pile tests, except that wooden reference frames
were constructed.
Load Application and Control
Loads during testing were in all cases provided by a
double acting hydraulic cylinder with a closed-loop system of
servo-control. Cyclic loading was two-way in all cases and
tracked a sinusoidal curve of deflection vs time. The
periods for a full cycle of loading were generally maintained
bet-ween 15 and 30 seconds, although some cycling at higher
frequencies was performed on the single pile in clay (pile
response was found not to be very sensitive to frequency by
Dunnavant and O'Neill) Overall load on the group was
measured by a single large load cell mounted on the hydraulic
cylinder (as well as the individual load cells). A linear
cotentiometer was mounted on the loading frame for deflection
feedback.
The first cycle of load was applied by slowly loading
the pile or group to a predetermined load, measuring the .
deflection at that load, and continuing to cycle at a
constant deflection equal to that measured on the first
cycle. The load was thus allowed to vary as loading
continued at a constant value of peak deflection. The load IAA
26
% % %

was stopped and maintained for the few seconds required for
data acquisition at the cycles for which measurements were
made. Two hundred cycles of loading were typically made at
each load level.
Data-Acauisition System-' A
The electronic instrumentation was monitored and the --
data recorded using the computer-controlled system shown in
Fig. 2.11. The data were stored on magnetic tape and later
transferred to the mainframe computer at the University of
Texas for processing. As a backup, data were also printed on
paper tape before leaving the test site. Display of selected
cata was used during the testing to evaluate the progress of
the experiment and to ensure that the group piles were not P
yielded during the test in clay (to allow later use in the
sand test).
Other Comments
The system described above generally worked well;
h.e-:er there was a structural failure in the loading frame
dur c :he test of the pile group in sand because of
misaiignment of the hydraulic cylinder. This failure
occurred as the second level of load was applied to the group
in October 1984. The necessary repairs were made and the
test was completed in December.
27
N.*% %

% 0
0
4 pr.
Fig. 2.11 View of data-acquisition system0
28
Of -- - .% .% - . ? p , 'e - .* .M e
V...

. . ,' , W UK-.-
CHAPTER 3
BEHAVIOR o LATERALLY LOADED PILES
AND PILE GROUPS IN CLAY
A major portion of the research was directed toward the
behavior of laterally loaded piles and pile groups in the
native stiff and overconsolidated Beaumont clay at the test
site. Tests of an individual pile behavior were performed as
a part of earlier research by O'Neill and Dunnavant (1984);
the sponsors of that work graciously consented to allow the
results of that research to be used as a part of this study.
The tests of the individual pile provided the baseline for !
comparison of pile-group effects as found in the testing of -w
the nine-pile group. S
This chapter is arranged into two major sections, with
the first dealing with the behavior of single piles in stiff
clay and the second addressing the behavior of pile groups.
The section on single piles includes a discussion of the pile
behavior and p-y curves derived for both static (monotonic)
and cyclic loading, and provides comparisons of the I'N
experimental data obtained with predictions made using
traditional methods of analysis for single piles. i
The section on pile groups provides a comparison of the X.
group-test results with those of the single pile for both
monotonic and cyclic loading. A comparison of predicted and
29
-- - . ':. V .'

measured response of the pile group is also made using
relevant procedures of analysis. The test results for the
single pile are utilized as much as possible to "calibrate"
the available design procedures and to ensure that the
discrepancies between predicted and measured results which
occur are related to the problem of pile-group effects.
Finally, a summary of the major research findings, *
relating to the behavior of piles and pile groups in stiff
clays, is presented. The most important parameters
influencing pile response, the major shortcomings in existing
procedures, and areas in which additional research might be
most fruitful are listed.
BEHAVIOR OF SINGLE PILES IN STIFF CLAY SUBJECTED TO
LATERAL LOADING
Lateral-load tests for single piles were scheduled and %'
performed at the University of Houston Pile Test Facility in
order to provide information for evaluating group effects.
The program on single piles includes the testing of pipe
piles with diameters of 48 in. and 10.75 in. Cyclic loading
with a maximum of 200 cycles was applied at the top of the
pile through a pinned connection. The 10.75-in.-diameter -
pile used for the single-pile test had the same dimensions as
the piles in the group and was tested under similar S
conditions. It was thoroughly instrumented for the purpose
30

of deriving p-y curves from the results. The measured and
predicted results will be summarized in this section.
Both of the single piles were tested as a part of S
another program; the results from the 48-in.-diameter test
were used only marginally in this report. '.'-
Measured and Computed Results for Static Loadinq
The behavior of two test piles in Beaumont clay was
measured by O'Neill and his research team and the data
presented here are excerpted from their original report.
More detailed and complete information can be found in Report y'\,
No. UHCE 84-7, by O'Neill and Dunnavant (1984). Because a
relatively large increment in load was used between each
successive load level, and because cyclic loading was
performed at constant deflection rather than at constant
load, the first-cycle measurements are considered to be
representative of behavior under static-load conditions.
Therefore, the static load or monotonic load mentioned
hereafter applies to the first cycle of loading. More than
one cycle of load for each constant deflection at the pile
top will be called cyclic loading and will be discussed after
the sections on static loading.
S.I -. "m
31
W..- % Ir.16 %
Lie~ MO

4 ---.- .Y7-x- A'
S%,. *
Response of Pile A
The variation of pile-head load with deflection for the
10.75-in.-diameter pile under static loading is shown in Fig.
3.1. Points are shown for the first cycle at each load level
and for measurements taken in each of two directions. Figure
3.2 illustrates the pile-head loads versus maximum bending
moments that were measured by use of the strain gauges. The
deflection, slope, and bending moment along the length of the
pile were also computed and were used to investigate the soil
response (p-y curves).
The variation of pile-head load with deflection for the .
48-in.-diameter pile under static loading is shown in Fig.
3.3. The variation of pile-head load with maximum bending
moment in the pile is shown in Fig. 3.4. The data on testing
for the 48-in.-diameter pile provided additional data on
behavior of a single pile.
Response of Soil
The soil-resistance curves were derived from the bending
moments as indicated by the strain gauges at the various
depths. A third-degree polynomial was generally used to fit
the data from the eleven gauge stations. The soil reaction, FIX
p, was obtained by double differentiation of the data on
bending moment, and the deflection, y, was obtained by double
integration of the same data. The p-y curves for static
32
VsJ!%;

%
First-Cycle Lo dings-
20 •
"155
A
0
_-,
00
0V
010
Pile-Head Deflection, Inches N-15
Fig. 3 .1 Pile-head load vs deflection for !0.75-in. ..,.pile during loading ¢<
33
-• ..A*d
0.%

%..,
1 6
20 .
15
V
0..00
-
Fig. 3.2 Pile-head load vs maximum bending moment for ,"'-i0.75-in, pile during static loading ,. .
34,•
z.:.

I Irv.
300 Loaded Using Loaded Using
150- Kip Actuator 300-Kip Hydraulic Jack
250
200
00
CL-1 5 0 , ,
0 100
CL 50%
0
0 0 .5 1.0 1.5 2 .0 2 .5 , .,i
= ,S .
Pile -Hood Deflection, Inches ",'
Fig. 3.3 Pile-head load vs deflection for 48-in. "...pile during static loading -''/'
A %
35 '
...1 ;..'"4 #'%" , .-".'=1= ' =. ..,=- = % - ," - "%".- %" w % .-• % w.= . 2,,_W % % % ",.W " .- -.'."-,".,-,j "- "j-,-. ., . "." € S

-jYYj -i NY- rTA--W1 -,rv Od v C
0
250
200. '
,, .. '.
00
150
10 0
1.0 2.0 30 4.0
Max. Bending Moment, x 10 3 in -kips".''
Fig. 3A4 Pile-head load vs maximum bending moment N-":]for 48-in. pile during static loading ,_'%
N
tp %" %,)
0- ,3 A,
--"
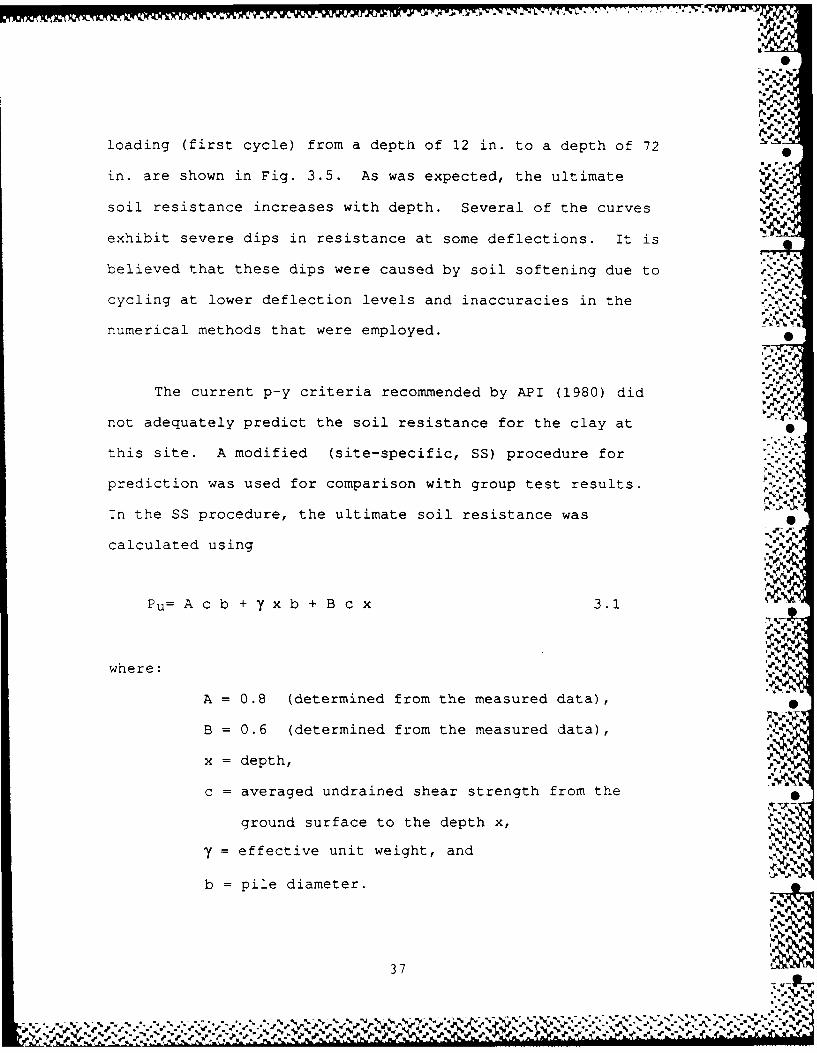
loading (first cycle) from a depth of 12 in. to a depth of 72
in. are shown in Fig. 3.5. As was expected, the ultimate
soil resistance increases with depth. Several of the curves
exhibit severe dips in resistance at some deflections. It is
believed that these dips were caused by soil softening due to
cycling at lower deflection levels and inaccuracies in the
numerical methods that were employed.
The current p-y criteria recommended by API (1980) did A
not adequately predict the soil resistance for the clay at
this site. A modified (site-specific, SS) procedure for
prediction was used for comparison with group test results.
In the SS procedure, the ultimate soil resistance was
calculated using
Pu= A c b + y x b + B c x 3.1
where: IleA = 0.8 (determined from the measured data),•
B = 0.6 (determined from the measured data),
x = depth,
c = averaged undrained shear strength from the
ground surface to the depth x,
y = effective unit weight, and
b = pile diameter.
37
V V* %% %%*~% %

*~~~% - Z..K *.%.-w~- - p. ~ .~. '7 - - . __*. b .
600'CIt I'
500-~
X"8-.59.i
600-Lda
250059.5. in
14 0 0
IX 1. in X-75i
00
1005in pl
380
% % % %%~~~. opI e-'l
0 %'

The measured ultimate soil resistance is significantly
lower than expected due to the following possible reasons.
1. There was wide scatter in the results from the UU
tests at shallow depths.
2. Values of undrained shear strength of clay vary
widely with test type and soil type.
3. The soil at this site had a secondary structure that
could affect shear strength as well as drainage.
Measured and Computed Results for Cyclic Loading
The lateral cyclic tests for 10.75-in.-diameter piles
were performed by displacement-control, two-way cycles, in
which the deflection both away from and toward the actuator
were equal. It should be noted that a one-way cycle was used
for the 48-in.-diameter pile when the applied load was above
93 kips. 0
Response of Pile %
For cyclic loading, a number of cycles, up to 200 for
each deflection, was applied to the single pile. The
experimental results indicate that the pile-head deflections
for 100 cycles are significantly greater than those for
static loading(cycle 1) for both 12-in. and 48-in.-diameter
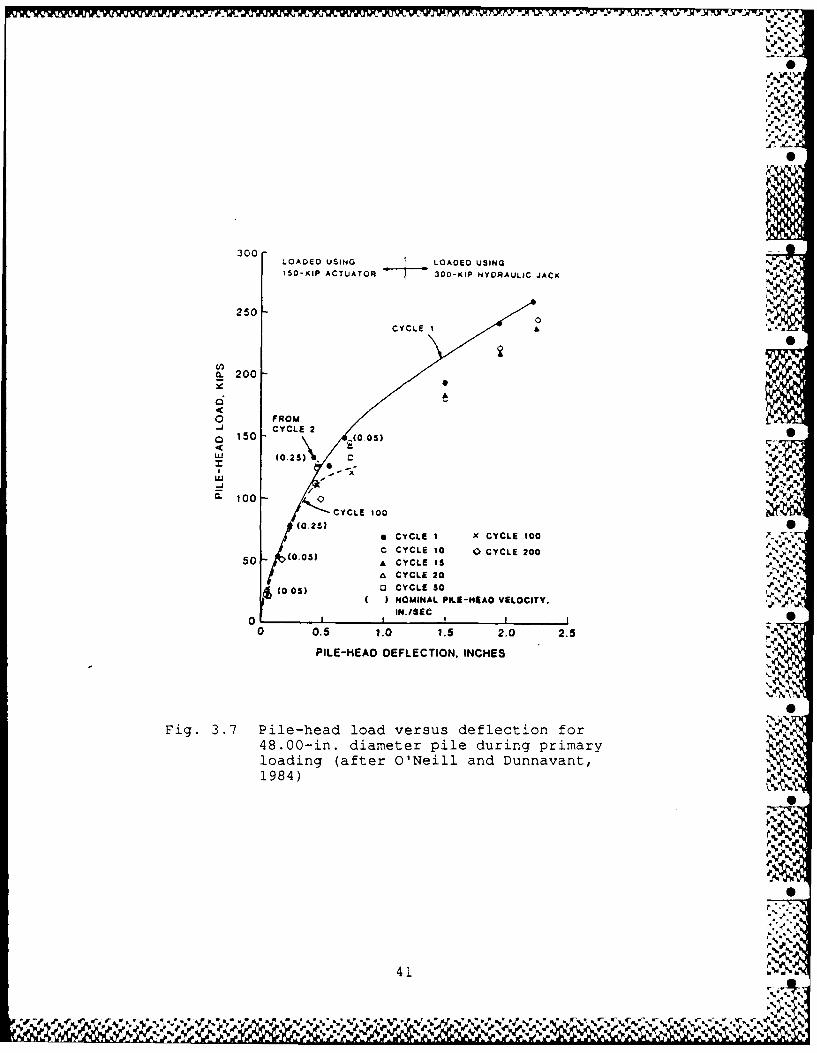
piles as shown in Figs. 3.6 and 3.7, respectively. In order kto cbserve cyclic-degradation effects, measured data for
cycles 1, 10, 20, 50, 100, and 200 are all presented in Fig.
39 1% % %
"kz "r 1

-% -If .
300
30 -V
40.2s)
2505
iENVILOPI Of MISULTS FORFIRST-CYCLE LOAODNOS
20 et(0.21)
d. ,* o., - "-. "00
a CYCLE 100
- (a 2 ,10 a
6 C€YCL I
10 00.(0205 10 OR)/(L||
a CYCLE to0,(021) CYCLE GO
0 1 )
At CYCLE 20
(02) 0CYCLE 10o
0 CYCLE 200
£I NOMINAL PEI-NIAO
00l VLLOCIftr . IISIEC
0 1.0 2.0 3.0 4.0 ,,
PILE-HEAD DEFLECTION. INCHES
•S
',
Fig. 3.6 Pile-head load vs deflection for 10.75-in.
diameter pile during primary loading(after O'Neill and Dunnavant, 1984) 0
..
40
. J % % %. %
-k".-----
300LOADED USING LOAOED USING150-KIP ACTUATOR -7 300-KIP HYDRAULIC JACK
250
00
c. 200
0 FROMCYCLE 2 . ..
150 (005)"r (0 0,25S).. C W
CE 100
CYL .100 , xCCL o .'* CYCLE I X CYCLE 100
C CYCLE 10 0 CYCLE 200 "" '50 (0.0C) * CYCLE
* CYCLE 20 .0
) (0.03) O CYCLE 5O .. N
( NOMINAL PILE-HIAO VELOCITY.IN.ISEC•
0 0.5 1.0 1.5 2.0 2.5
PILE-HEAD DEFLECTION, INCHES
Fig. 3.7 Pile-head load versus deflection for %
48.00-in. diameter pile during primaryloading (after O'Neill and Dunnavant,1984) , Nz
41
.-} :%.."
3.6 and 3.7. The following observations regarding the data
are made:
(1) Cycle-degration effects become significant at
deflections of about 0.8 percent of the pile diameter.
(2) At deflections greater than 0.8 percent of the pile
diameter, the lateral stiffness of pile head, defined as
pile-head shear divided by pile-head deflection, continuously
degraded with increased numbers of cycles. The degradation
did not stabilize after a given number of cycles. ,
(3) In the range of deflections where cyclic
degradation was significant, loading to 100 cycles typically
reduced the lateral stiffness about 25 to 30 percent with
respect to the static loading (one cycle) for the 12.75-in.-
diameter pile and approximately 16 percent for the 48-in.-
diameter pile. ON
]S
Some of the experimental moment curves for cycle 1 and
cycle 100 for the same deflection are shown in Fig. 3.8. The A.
moments are normalized by dividing by the pile-head load in
order to compare curves for different loads. lhe
experimental moments for 100 cycles, in general, are higher
than those from static tests. It simply indicates that the
soil resistance decreases due to the cyclic motion.
%
42
% % % %

0
6
o o0NNN N
00 * 0
a0 j 6 W
4*94 'Ild A0189 IdO
0*
o 7g2
0 %r %
C> 0
in 0
-j 0~
nq
-If~~, _w.-. . o -
%0% %.
Ni% 0ee

Nr,
Response of Soil
The soil-resistance curves for cyclic loading were
derived from the bending-moment data. The p-y curves for
cycle 1 and cycle 100, at depths of 48 in. and 72 in., are
both shown in Fig. 3.9 for easy comparison. The data from
all the cyclic p-y curves indicate that up to 100 cycles the
ratio of maximum cyclic soil resistance, Pcu, to maximum
static soil resistance, Pu, varied from 0.40 to 0.50 near the
surface to a value of 0.70 to 0.75 at and below a depth of
4ft. The ratio had intermediate values between the surface
and 4-ft depth. The cyclic p-y relations degraded to a A.
residual value less than Pcu at each of depths shown. The
degradation was essentially complete at a deflection of about
12 Y50. It is apparent that the soil resistance decreases
with the increase in the number of cycles.
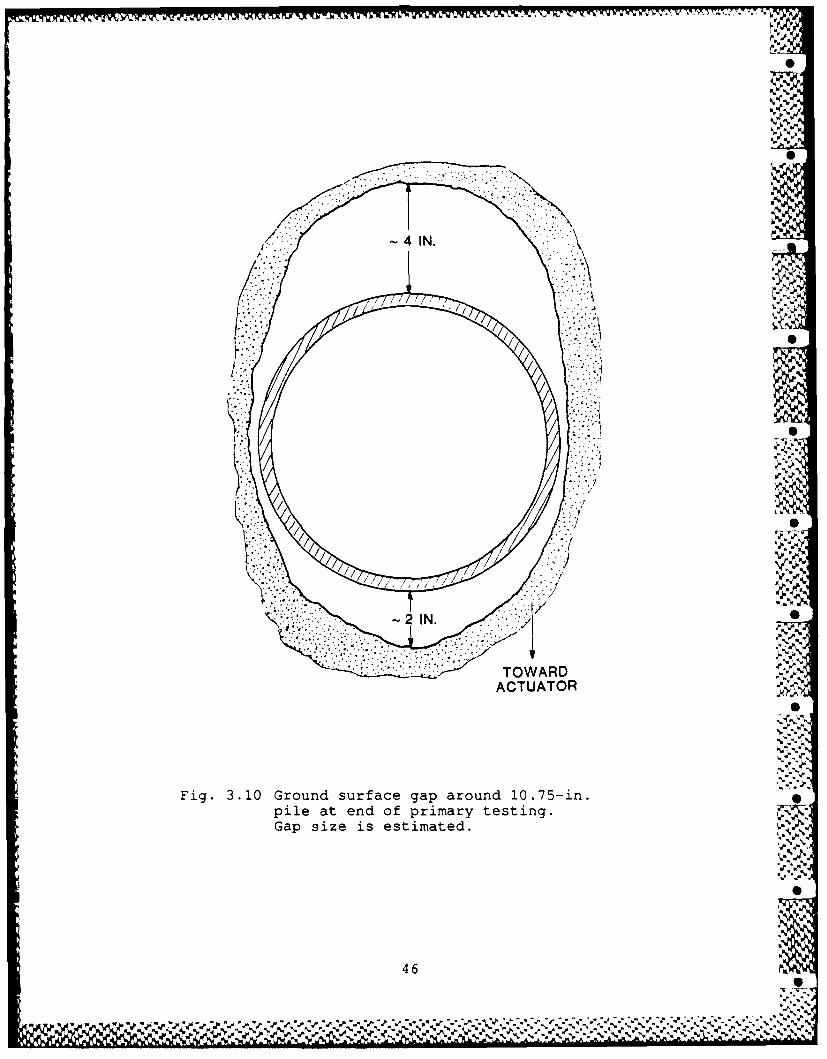
During testing, large gaps formed around each c: the
piles. Substantial clouds of fine-grained sediment were
observed to be forced out of these gaps during cycling.
Because the sediment pumped out of the gaps was gray and the
soil surface predominantly brown, the effect was very
noticeable. Figures 3.10 and 3.11 show the estimated gap
size at the end of the primary testing for the 10.75-in.-
diameter pile and the measured gap size for the 48-in.-
diameter pile. Volumes of about one cubic foot and five
* cubic feet of sand were used to fill the gaps of the 10.75
44
V. W W- I4 W- Or I

~. k
x 0
4~ ~ ~ N nN -
LI.1 . * - r-Jw
0 0
00
0 '-4
44 0
44 -4
U~C 0 0'---
00 0 1- 0 'CV ) N I
- o 0 0 0 0a 0 0 (0
"d/d00
% 0% % % JQ
4
A.
4 IN.
TOWARDe.wACTUATOR
Fig. 3.10 Ground surface gap around 10.75-in.pile at end of primary testing.Gap size is estimated.
46
.~~~~? .r .- . .. .

A 01
NOTE: GAP VOLUME -5 CU. FT.AI
I-
1.5 ;0. 19" WIDE AT -5 FT. DEPTH1.5
2.5"; 0.191 WIDE AT
3.5 -FT. DEPTH
*'e~~AT 44.5-FTW.
DEPTH
1";0. 19" WIDE AT 4 -FT. DEPTH
TO ACTUATOR
Fig. 3.11 Ground surface gap around 48-in.Pile at end of primary testing
47
in. and 48 in. diameter piles, respectively. It is apparent
that the scouring during cyclic loading will have significant
influence on the soil resistance. However, there is at
present no available method to quatitatively calculate the
percentage of loss of soil resistance due to scouring.
Behavior during the healing and sand-filled tests are
shown by the curves in Fig. 3.12. It should be mentioned
that all of the tests after filling the gaps with sand were
performed after the pile had been deflected 4 in. and after
some plastic strains had occurred in the pile. The lateral
pile-head stiffnesses for each series of tests are well below
those obtained during primary loading. A comparison of the
results between the primary tests and the healing tests
indicates some of the original soil resistance was destroyed.
The sand placed in the pile-soil gap was not effective in
producing a regain in lateral capacity. The reduction of
pile-head stiffness with increasing deflection during cyclic
loads must be taken into account.
Concluding Comments for Single Piles in Stiff Clay
The results of lateral load tests for a single pile in
clay have been summarized in this section. Based on the
results presented, the following conclusions can be drawn.
48
%.. % .. ..

0N30
CYCLE 1,25- PRIMARY SERIES
a. CYCLE 100, 0
S20- PRIMARY SERIESo
o .- - - -,#',',".
~15 --- I .-. "
Lii
LU 10,
, HEALING SERIES, CYCLE 1 ,,' . HEALING SERIES, CYCLE 100 %
,5 # SAND SERIES, CYCLE 15 I' / 0 SAND SERIES, CYCLE 100 ,
iI i -.- ;
00 1.0 2.0 3.0 4.0
PILE-HEAD DEFLECTION, INCHES
Fig. 3.12 Pile-head load vs deflection for10.75-in. pile during healing andsand series ,
49
. %.. "o 0. , p' " % - %. " - '" '. N. %"
1. The response of single piles to static loading is
stiffer than that to cyclic loading.
2. The maximum bending moment in a pile measured for
cyclic loads is greater than that for static loading under
the same deflection at the pile top due to a softened soil Zk
resistance.
3. The current p-y criteria recommended by API-RP2A
does not accurately predict the soil resistance for soils
encountered at the test site. Modified procedures for the
predictior of p-y curves are recommended.
4. The scouring during cyclic loading in stiff clay has
significant influence on the soil resistance.
BEHAVIOR OF GROUPS or PILES IN STIFF CLAY SUBJECTED TO
LATERAL LOADING
This section is subdivided into two parts. The first
presents the major results of the experimental program and
provides a comparison of the pile group behavior with that of
the single pile for monotonic and cyclic lateral loading.
The second section presents some predictions using available
analytical procedures and comments upon the ability of these .
procedures to model the most important effects of pile-soil-
pile interaction in pile groups.
0
50
% P % % %" %o>/ ~ ~ .. ... .. % - . ' ." "v v , : v ' " ' ', , . ' / . .': '' ': ' ' v .

Results of the Pile Grou_ Experiment and Comparison of
Pile Group Behavior with Single Pile Behavior
General Response
Load-Deflection Response The general load-deflection
response of the pile group and the single pile are presented N
in Fig. 3.13 in terms of average pile-head load vs pile-head
deflection. For the piles of the group, average pile-head
load is defined as the lateral load on the group divided by -%
nine, the number of piles. Curves of load vs deflection are .
presented for cycle 1 (monotonic loading) and cycle 100
(cyclic loading). As described in previous sections of this
report, loading consisted of 2-way cyclic loading at constant
peak deflection. The monotonic loading is thus not a true
"static" loading, but is thought to be representative of the A
static loading because relatively wide separations between
load levels were used. Curves for other than 1 and 100
cycles are presented in the detailed report by Brown and %
Reese (1985). Data points shown in Fig. 3.13 represent the
load and deflection measured in each of two directions; the
load-deflection response in the two directions was similar, -- ..- -
but not identical.
The data presented in Fig. 3.13 clearly indicate that %
significant group effects exist; the group capacity appears
to be greatly reduced relative to the single-pile capacity in
51
WN % %

.20
0 "'%V-
a.~ 15-
,r 0
-10- 0
B- SINGLE PILE, CYCLE 100 .
i 5 C*,-----O GROUP PILES, CYCLE I "
D0---- GROUP PILES, CYCLE 100 ,"
"~.-.
0 0.5 1.0 15 2.0 2.5
; DEFLECTION AT LOAD POINT, I N,---
• • ;...,
~~~Fig. 3.13 Curves showing deflection of piles as.-,,'w ~a function of lateral load ...
~52
L1.. /" %'"/',/
/"%,,/ .-
"' ' . .". " """- ';. .. . -- -" . .. . . .""w # . . ".2 . ,'#",r .'#_ ,,,_' ''2._w.W'.'.Z...,w ,', ... ... '#*..w .. ,/

terms of the average load per pile. The group effects are
observed to be small at loads less than about 5 kips per
pile, but become mo7e significant with increasing load level.
Bending Moments The maximum bending moments for the" "
piles in the group and for the instrumented single pile are .ON
presented as a function of lateral load in Fig. 3.14. A
range is shown for the piles in a group that encompasses the
variations for a given load (expressed as an average load per%
pile). The line marked "average pile" represents an average
in the sense that the bending moments for the piles at each Ilk
gauge sta-ion were averaged; because all of the piles did not -,
attain the maximum moment at the same depth, this line •
represents the maximum of the average moments rather than an".-
a'...
average of the maximum moments. % . I.
The data presented in Fig. 3.14 exhibit a similar trend I. ]
to that observed for the load versus deflection of the pile
head. The piles in the group behave similarly to the single 0
oile at average pile-head loads of about 5 kips per pile or
less, but the difference in behavior increases with dlvl
incBreasing load. Maximum bending moments in the group piles
were typically 25 to 30 percent higher than those in the
single pile for a given pile-head load at loads approaching er
failure in the piles.d n
53
attai t m mmnathsmdp, i i

20-OCYCLE 1
Range*r .
15.,
Average Pile
toI0
o 400 800 r20 60Maximum Bending Moment, Inch-Kips .
20 S
_ CYCLE 100,
i5-
CL Rangeto C'A
Average Pile
51-
45
0-OrI I I
0 0 80 10010

-... ..-
$, I,. '
Cyclic Loading A comparison of the effects of cyclic __
loading on the piles in the group relative to that of the
single pile indicates that cyclic loading has a significant
effect on the piles in the group. Data plotted in Fig. 3.15
illustrate the magnitude of pile-head deflection and maximum '
bending moment for cyclic loading (cycle 100) relative to
monotonic loading (cycle 1) for both the single pile and
piles in the group. The terms "Deflection Ratio" and "Moment
Ratio" as used in Fig. 3.15 are defined as follows:
Deflection Ratio =
Pilehead Deflection at 100 CyclesPilehead Deflection at 1 Cycles
Moment Ratio
%,nWc
Maximum Moment at 100 Cycles -Maximum Moment at 1 Cycle
The relative increase in deflections and moments due to
cyclic loading is seen to be proportionally greater for the
group piles than for the single pile. The data plotted in
55 1 I
It " K -, * *j2 ~ .

* --V
LD~ 2.4
2.2- -*
ZS
0
1.-
Z GRU
i - - ELETO
LLI
LOAD PER PIETKIP
00A 7

Fig. 3.15 also reveals that the effect of cyclic loading is
increased with increased load levels.
The relatively more significant effect of cyclic loading
on the piles in the group described above is quite surprising
in that the major effects of cyclic loading in stiff clays
has generally been thought to be more of an individual-pile
phenomenon (McClelland (1974), Focht and Koch (1973)). The
justification for this belief has been that effects of cyclic
loading were Lhought to be dominated by gapping and scour in
the immediate vicinity of each pile. As shown by the
photographs in Fig. 3.16, the gapping around each pile in the
group was significant; no evidence was observed of any
connecting gaps or cracks between the piles. The scour due
to rapid expulsion of water from the gap around each pile
left a gray sediment covering the pit to a depth of several
inches.
Distribution of Load to the Piles
Because a knowledge of the distribution of load to the
piles in the group is important to understanding group
effests and for proper design of piles in the group, this
experiment was designed to allow independent measurement of
the load transferred to each pile.
57-.

Linear Potentiometer,))1-
B < PileVw
Sediment Cloud .
j •
0
Gap After Test Completed ,,..,.
Fig. 3.16 Scour and gapping around ,oiieQ .. _5 8.
'* g % -.":S:

-%.
The results of the load measurements on individual piles
indicate that the distribution of load was predominantly a
function of row position within the group. No consistent
trend was apparent regarding the effect of position within a &
given row (perpendicular to the direction of loading).
Plotted in Fig. 3.17 is the general load-deflection response
by row for both the monotonic and cyclic cases. Because
measurements were made in each of two directions, the back
row for the compression direction acted as the front row for
the tension direction and vice versa. The data presented for
a given row, therefore, represent an average of six piles for
each row.
The distribution of load observed in this experiment
follows a pattern quite different from that anticipated by
elasticity-based procedures. The distribution can be thought
of best as related to "shadowing" in which the trailing row
piles are cast into the shadow of leading piles and are able SN?
to mobilize less soil resistance. Such patterns are likely
related to areas of shearing deformation in the soil ahead of
each pile as opposed to a simple superposition of elastic
strains.
As is evident from the data presented in Fig. 3.1'i, the
major effect of row position was at loads approaching
failure. The maximum load applied to the trailing rows was .
59
6P .5. --
%£'%%

I.7
20-
o- 15- 00 ~'
?: oJ
0~
. 5 /CYL I
0 90.5 1.0 1.5 2 .0 2.5
20 Deflection at Load Point, in. ,.'.,.
Cj).t.'
S"
15-
0-
0 0.5 1.0 1.5 2.0 2.5Deflection at Load Point, in.
5, ''%
Fig. 3.17 Distribution of load by row
60.._.
6 0 N J"N
. . , .. , .. . . .. ..... .. . . .. . . . .. .. .. ._ -. - .. ... ,,.. ., ,....-..,.- ._, .. .. ,...;.- ...., .. .,, ,, .,. ,. .,..., ::. :,.. .. ..

S J
significantly less than the maximum applied to the front row.
At loads approaching pile failure for monotonic loading, the
front-row piles are seen to continue to carry load with
increasing deflection while the trailing rows deflect without
supporting additional load. There was little difference in • .'
behavior between rows up to about one-half the maximum load.
The relative difference between rows was less
significant after 100 cycles of load, although a similar
pattern is evident. The more heavily loaded piles apparently
shed load with increasing number of cycles to less heavily
loaded piles in the group, producing a more uniform
distribution of load. S
Row position also influenced the distribution of bending
stresses, as illustrated by the data in Fig. 3.18. The
figure presents plots of bending moment as a function of
depth for selected loads that are typical of the observed
patterns. The front-row piles have the largest moments in
the upper 5 to 6 ft., reflecting the greater load on these
piles. The middle-row piles have lesser moments in the upper
5 to 6 ft., but attain a higher maximum moment below that
depth. The front-row piles are obviously transferring more
load to near-surface soil than are the middle-row piles, thus
accounting for the shallower depth to the peak moments in the
front-row piles. The back-row piles have peak moments even
61
%9% % % % % %-

0-0
CDC
00
0-1- 0 In
\i>S
0 CD to 0a) 'W '41dej -
E U-)
.S 0,a 0~J 0
4f&4
0-'
OD c
3..2o~cr
62
% % %
deeper than the middle-row piles, but because less load was S
supported by these piles the absolute maximum moments in the
group occurred in the middle-row piles.
In all rows the maximum moments were larger and occurred
at a greater depth than for the single pile at a load similar
to the average load per pile in the group. W
As was the case for load-deflection response, cyclic
loading tended to spread the loads and stresses in the group
toward a more uniform distribution. The trends are similar,
however. The data in Fig. 3.18 show that the maximum moments
in the group after 100 cycles of load are larger and occur at
a greater depth.
Load-Transfer (_-y) Curves •
Using a Winkler-type soil model, polynomial curves were
fitted to the bending moment data in a manner similar to that
described by Matlock and Ripperger (1956) and described
earlier in this report. This technique allows derivation of
the load-transfer relationships (p-y curves) relating p, soil
resistance per unit length of pile at a given point on the -
Oile to y, horizontal deflection of the pile at that point.
Shown in Fig. 3.19 are the derived p-y curves for the
piles at a depth of 4 ft. These curves are selected to be
63piles~~ atadet
... .. -N -".- ++.:., x+.: ,+-+..+:.-.,-.-:,. , .,-,:,::+, , ; +;,.).'-<;.'-;,...- -, k-'% %.k;; -

350 - C 350 0
300 / 300
(') -. PLAVG O
I 0NGOU - .yJ _S
- AVG. ALL PILES F1OT OIN GROUP .*;
-- - SINGLE PILE 0 .
0 0.5 1.0 0 0.5 1.0 2,-,
DEFLECTION,y,in. DEFLECTION,y,in. ,
CY CLE I - -.
o CYCLE 100 .-. :
*CYE 1O, LOAD 54 TENSION DFECT0 ONLY)
350- 350-.
. 0 300
+.. O 0.5 . O . . !-
4 V,-
V. CYCL a44 t J4VG.
z 200- < 200- 49Lp,
U) U)U) U)
I) LU0' 100- 1001
o 0~U)
U)MIDDLE ROW BACK ROW
-po0 0 ___________5~
0 0.5 1.0 0 0.5 1.0
DEFLECTION,y,in. DEFLECTION,y,in.
Fig. 3.19 Measured p-y curves, depth of 4 ft -5.
64
-. ,-.. .. - -- %' '- -. .' '- . .. .. ". - - , w , . ". ,. v ,,, w .". .,, ",-'." . '- '". , , , - " "- . - , , , - .. ,-l', -. "P . ." " " '# . " - -"+""+ -'"""""""- " "-" "- - -t--"'jw, ' '-%+ 'WL'. t ,w'. '%', -s-, '-% %.
'- -'
representative of the trends exhibited at other depths
(presented in detail in Brown and Reese, (1985)). The curves -
shown are averages for all piles and for piles in a given row
for load cycles 1 and 100. A p-y curve from the single pile
test at the same depth is also shown for comparison.
The major feature of the load-transfer relationships
revealed by these data is the reduction in the maximum load
transfer for the piles in the group relative to the single
pile. Deflections at small loads are not significantly
greater for the piles in the group than for the single pile.
The relative differences between rows in the group are
less dramatic than between the group and the single pile, but
the load-transfer curves vary with row position consistent -N
with the trends revealed by the pile-head load-deflection
response and the bending moment data. Deflections at small
valueL Df soil resistance are similar for all rows, but the
maximum soil resistance diminished from front to back row. 0
-he shape of the curves suggests strain-hardening behavior
for the front row p-y curves and strain-softening behavior NW
for the trailing rows.
N.
The p-y curves for cyclic loading exhibited similar
trends for the group as for the single pile, with loss of
soil resistance occurring during cyclic loading at values of
65
%

p greater than about one-half the maximum p value for -
monotonic loading. The maximum soil resistance after 00
cycles of load for the piles in the group is greatly reduced ''i
from that of the single pile after similar loading.
A comparison of the ultimate soil resistance mobilized".%
by the piles in the group relative to that of the single pile
is demonstrated in Fig. 3.20. Data from measured p-y curves '-"
are summarized in the form of a graph of ultimate soil :-.
resistance (taken as the last measured value) vs depth for
monotonic (cycle 1) loading. Also shown is the predicted.??[-
relationship using the 1980 API design rules (1979), that [.
follow the guidelines of Matlock (1970):
P 3 + , --W + -(x) (s) (b) 3.2 "tPb b u %e%
where: J empirical constant, =0.25 for many cases,
S=effective unit weight of soil, ;
x =depth below ground surface,...-
* - -.-
b =pile diameter, and""-:[
:J. -.'"-
Su =undrained shear strength for UU triaxial".'-
tests...
iP
The prediction using API rules was made with the undrained
strength fro, Uor theailests as stated in the API method.
66
A-). IL 0a6:

Pu, ULTIMA . SOIL RESISTANCE, lb./in.(LAST MEAURED VALUE)
0 200 400 600 800
API DESIGN
-, 2 v RULES
3 - 0 SINGLE_PILE
5- 9- 0 4
6-0
06 7-i~
I I(CYCLE I I
.,. LOADIN
o-o FRONT ROW 0-0 ACK ROW
Fig. 3.20 Ultimate soil resistance vs depth %.<
67!
Ii(CYCLE"I)Lu LOADING
,Z,.Z .Z. '3C~Z . # Z.< < '?..< ' . . , , , , ,.'.;,."...0 9". , "¢.,, '""' : """.</ '

-, -.
'.1 - , '
The data in Fig. 3.21 clearly illustrate the large and t
relatively consistent reduction in ultimate soil resistance
due to group effects. The reduction in Pu is more pronounced
with increasing depth and is generally greater for the
trailing-row piles than for the leading row. An
understanding of the mechanisms producing the loss of soil
resistance is undoubtedly the key to understanding group
effects for lateral loading.
The patterns of p-y responses for the piles in the group
and for the rows within the group appear to be related to
a) modification of the shear zone around the individual
piles in the group by the surrounding piles, and/or
b) modification of the effective stresses around the
individual piles in the group by the surrc-u: Iing ,
piles to produce a reduced shearing resistanze of the A-.
soil.
It was noted previously that the maximum soil resistance
mobilized after 100 cycles of load was considerably less for b
the piles in the group than for the single pile. This
observation is in contrast with the widely used design
.ssumotion that the loss of soil resistance during cyclic
loading is primarily a single-pile phenomenon, and that after
7any cycles of load the soil resistance in the piles of a ..
68
%~~~~~ ~ ~ .~ . taA" . ^ * %*
% % % %
2'.. - F6 8 ,O, -" A-

Pres/ Pu0 0.2 0.4 0.6 0.8 1.0
Note: PRe at 10 Cycles
2 *
Average Group PileSingle Pile
060
6[
70
Fig. 3.21 Ratio of the values of residual soilresistance to the ultimate soil .resistance
0 O
69S%R

group is equal to that of an isolated single pile that is
similarly loaded.
In Fig. 3.21 the ultimate soil resistance after 100.." .61
cycles of loading (labeled Pres) normalized by the ultimate
soil resistance for monotonic loading (cycle 1) is plotted
against depth for both the single and the average of the
piles in the group. These data indicate that the loss of
maximum soil resistance during cyclic loading is similar for
the group and single piles when taken in proportion to the
soil resistance for cycle 1. Based on these data, the effect
of cyclic loading on piles in a group is more appropriately
modelled as a proportional loss of soil resistance from some
initial (cycle 1) value rather than as a loss to some
absolute minimum value, independent from group effects..,
Comparison of Experimental Results with Predictions
Using Relevant Procedures of Analysis
Introduction
This section provides a comparison of the results of the
group test in clay with the results predicted by use of
analytical techniques that are available and widely used at N.V
Uhe time of this study. A more complete description of these .
techniques and a detailed presentation of the predictions
with these procedures is available in the report by Brown and
70"_ .
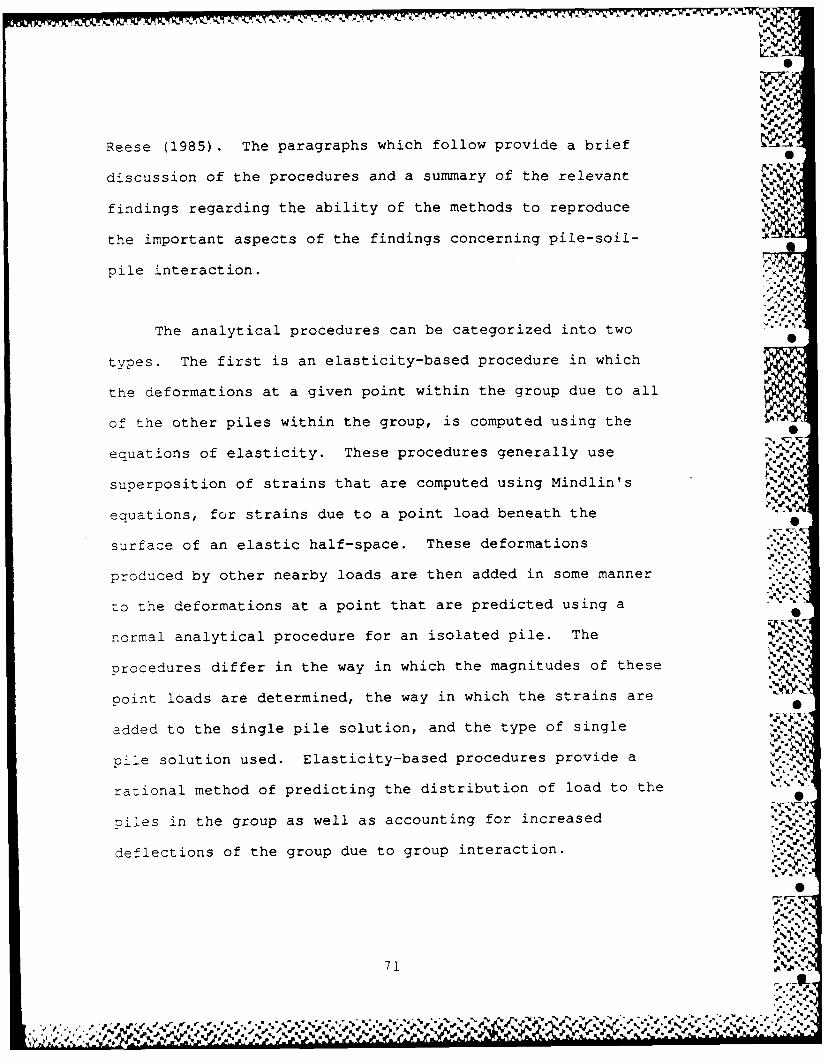
%
Reese (1985). The paragraphs which follow provide a brief
discussion of the procedures and a summary of the relevant
findings regarding the ability of the methods to reproduce A IV
the important aspects of the findings concerning pile-soil- 0
pile interaction.
The analytical procedures can be categorized into two "
types. The first is an elasticity-based procedure in which
the deformations at a given point within the group due to all
of the other piles within the group, is computed using the
equations of elasticity. These procedures generally use .. .
superposition of strains that are computed using Mindlin's -
equations, for strains due to a point load beneath the •
surface of an elastic half-space. These deformations
produced by other nearby loads are then added in some manner
to the deformations at a point that are predicted using a
normal analytical procedure for an isolated pile. The
procedures differ in the way in which the magnitudes of these
point loads are determined, the way in which the strains are S
added to the single pile solution, and the type of single
pile solution used. Elasticity-based procedures provide a
rational method of predicting the distribution of load to the "'S
oiles in the group as well as accounting for increased
deflections of the group due to group interaction.
71
. w *,,..N N N%% % NA

A.?
, A6
The second type of procedure (described as the "modified
unit-load-transfer" model by O'Neill, (1983)) models the pile
group as a large pile in which the pile group and the soil
within the group area are assumed to move together. The
stiffness of this large, imaginary pile is equal to the sum
of the stiffnesses of the individual piles. The behavior of
the group as a whole is analyzed by using p-y curves for
single-pile behavior for this large imaginary pile. No means
are available to predict the distribution of load to the
piles with this type of procedure, but it does offer some
rational way (albeit a purely empirical one) of predicting a
loss in ultimate soil resistance due to group effects and -
cyclic loading.
Elasticity-Based Methods
Procedures of this type which were analyzed include the -. -
DEFPIG code which follows the well-known elastic method of
Poulos' (1971,75), the Focht-Koch procedure (1973) developed
to analyze offshore groups, and the code PIIGP2R developed by
Ha and O'Neill (1981). DEFPIG is the most true to elasticity
theory, although the authors make some provisions for local
yield by including user-specified limits on soil resistance.
DEFPIG extends Poulos' solution for flexure of a thin-strip%,
pile within an elastic medium to pile groups in terms of two
interaction factors. These are defined as the relative
increase in deflection (or rotation) at the groundline of a
72-."
% %*

pile due to another pile. The computation of these
* N'
interaction factors is made similarly to that for the single. -
pile, except that the soil displacement must include the .
additional displacement due to the nearby pile. The DEFPIG--
code available to the authors did not have provisions for
A ,%A 11
computing bending moments as a function of depth. i
The Focht-Koch method represents an early attempt to N
combine the computation of pile-soil-pile interaction using
| Poulos' elastic solution with the widely used Winkler model
for single piles which includes nonlinear p-y curves The
procedure consists basically of computing the displacement ofmi d
an individual pil te u th accepted beam-column procedure,
and computing the increase in deflection due to pile-group
action using the elasticity procedure. The p-y curves for .
the piles are then "stretched" by multiplying the y values on e
the curves by a constant until the beam-column solution
yields a pile-head deflection equal to that computed for the,.%
group. The desirable features of the Focht-Koch procedure for
, ~desianers are that the modification of p-y curves allows ..-.
computation of bending stresses as a function of depth, the
distribution of shear to the piles in the group is computed,
and the use of nonlinear p-y curves allows cyclic-loading
ffects to be incorporated into the analysis. tper
actin uing he lasicit prcedue. he -y crve fo
thepiesar ten"srechd"bymutilyngth yvaue3o
N -4 N %Athe . curve by a osatuti h emcounslto
yields% a. pie-ea delcto eqAl to tat optdo h
group The deial fetue ofA thNoh- h rcdr o

PILGP2R is perhaps a logical extension of the Focht-Koch
procedure in order to provide a more rigorous analytical
model. This code was developed to model three-dimensional
geometry of pile groups, to apply at working loads, and to
yield behavior of axially-loaded groups of vertical piles for
the full range of loading. The model differs from Focht-Koch
in that the individual p-y curves on each pile are modified
individually for the deformations produced by other piles.
After solution of the group problem without pile-soil-pile
interaction, Mindlin's equation is used to computeS
deformation at a p-y curve location due to all of the other p
values at all of the other p-y curve locations within the
group. The group problem is then resolved using the modified
p-y curves, with additional iterations as necessary with
modified p-y curves. PILGP2R is a powerful model but
requires a large amount of computations.
The input parameters for all of these procedures were
"fitted" to the experimental data for the single pile to
minimize variability due to predictions of individual pile
behavior and to concentrate on the modelling of pile-group ,-
effects. Where possible, a range in elastic moduli was used A -
to examine the sensitivity of the predictions to relevant ..%.%
input parameters.
74 e
% %-m-
% %

Presented in Figs. 3.22 through 3.24 are some of the
predictions of load versus deflection for the pile group. It
is clearly evident from these figures that the elasticity-
based procedures did not predict the great increase in group
deflection at large loads and tended to overpredict group
deflection at small loads. .. 2.
The elasticity-based predictions of load distribution to
the piles in the group were significantly in error. The .
elastic solutions predict a symmetric distribution of load
with the greatest proportion of load coming to the corner
piles and the least to the center pile. No difference is .
predicted between the front and back rows. The actual
distribution of load was predominantly associated with row
position as discussed in the previous section. At small
loads (which one would expect to be most realistically
represented by elasticity), no distinct pattern of load
distribution to the piles in the group was evident. In fact,
at small loads there was no appearance of group effects at
all.
As shown in Figs. 3.25 and 3.26, the Focht-Koch and
PILGP2R methods at large loads underpredicted both maximum
moments and depth to maximum moments at large loads.
Consistent with the load-deformation predictions, the methods
overpredicted moments somewhat at small loads. With
75

0A.
SINGLE PILE
* U '. - '
E, 12 0 00 60
Goup
IJ e
t %
0;1 0. . . . 50 12 . .
J 4 lEos = 600
DEFFI meto d, f teoo s n l
Eo =,1 000
0.4
0 0.2 0.4 0.6 0 8 S .0 1 .2 14 .6 ..
PilIthei Dflcton . Inc~h es""
Fig. 322 DEFPIG of lateral load versus deflection -.
at working loads using constant Es by,, [
DEFPIG method, fitted to single
pile data,.,
76
P'-FV %%.
~*, - U.~ ~ .\...% "r -
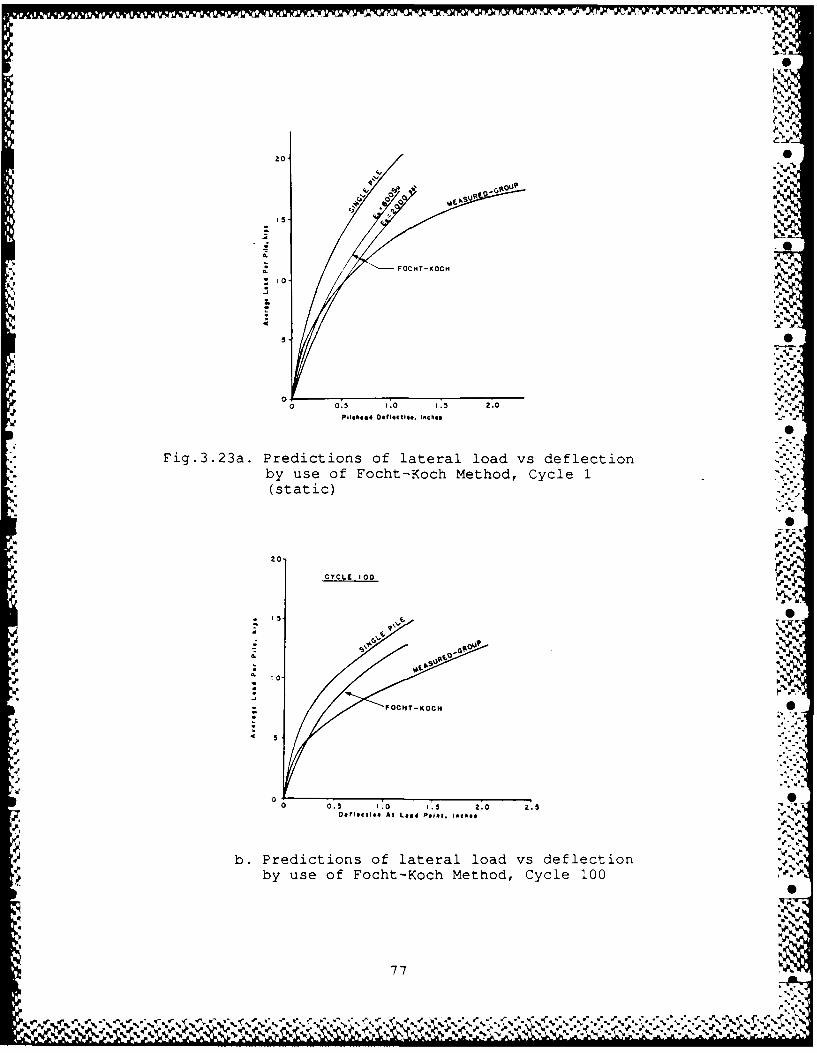
20 S4,
q! r10o
0
0 0.5 1.0 .:5 2.0
Pilshead D~tIoctifi. enchoe
Fig.3.23a. Predictions of lateral load vs deflectionby use of Focht-Koch Method, Cycle 1(static)
20
CYCLE 100 J
CON.
to-
? %de
N'4

-- Tvl-
200
'5 q'
'"'S
00
0 0.5 1.0 1.5 ZO 2.5 Z:5
PliIheeil DeftIctiom. inches
Fig. 3.24a. Predictions of lateral load vs deflectionby use of PILGP2R Method, Cycle 1(static)
200
111. 12110t I
.% %
5- iI. v
00'.5 1. b
Deflection at P-1040441. ",114111
b. Predictions of lateral load vs deflection ~by use of PILGP2R Method, Cycle 100
78 A
% % - %
an. %,
0~~~~~..f . '. e 1, %%N% % % % anle %p '.

('4
w 0
45 LL~ '* X - ~ SI0
.4 2L (U
C0 >U U)
-4>4
0 D
0 0. V r >
.,~- > s .
~ , 0
*~~Q E 4,- 50 / ,.
*4 0 CQ)4 5
.? ' ~ ; 04
20 10 1~ 4
00
0 .4j
U
>1 U
3 4-i
5' 4 -4'3 ~ 04 a
U) > u)
less *w l arl .011 11 00 80A - -555 .- Q j s ; 4: -0 U)U I. .
0 u 415 .Ijrq * a3
E -4>
E -
04
AV - al. %a.
_ _ _ _ %_ _ a.I

S
increasing loads, the depth to maximum moment in the,
experiment was observed to shift significantly deeper. These
procedures do not reproduce this shift of depth to maximum
moment.
In conclusion it can be stated that the superposition cL
elastic deformations did not model the most significant
factors that influence group behavior. The group effects
observed in the experiment were highly nonlinear and
associated with shadowing and row position of the piles; the
elasticity-based procedures did not reproduce these effects. %
Although one might suggest that elastic solutions could best
represent group behavior at working loads, there was no
evidence in this experiment that group effects at small loads
were significant. Furthermore, without a knowledge of the
failure loads for the group (which was unconservatively
predicted by these procedures) one has no guidance as to what
level of loading might appropriately be called "working"
load.
Modified Unit-Load-Transfer Models
Procedures included in this category include the single-
pile method and the Bogard-Matlock method. The former is not'ZA
really a formal method of analysis which has been described .-.
and reviewed in the technical literature, but rather a means
of providing an upper bound on the predicted response of a
80
?..,--

0^%
pile group. All of the piles in the group, along with the
soil within the group are assumed to act as one unit. This
assumption should thus represent the extreme of group jinteraction in which the behavior of an individual pile is
insignificant. The response is computed by analyzing a
large, imaginary pile which has a flexural stiffness equal to
the sum of the stiffnesses of the individual piles. The
diameter of the imaginary pile is taken as the diameter of a
circular pile having the same area in plan as that of the
group. For this case, that diameter is 85 inches.
Obviously, no predictions are made about the distribution of
loads and stresses to the piles. Bending moments are -
estimated by dividing the moment computed for the large,
imaginary pile by the number of piles in the group.
The Bogard-Matlock procedure (1983) is an extension of
the concept of the single-pile method and provides a more
formalized procedure for limiting the ultimate soil
resistance. The procedure combines the single pile p-y• •
curves with a modification of the p-y curves for a large,
imaginary pile (similar to that described in the paragraph.' %
above) to produce p-y curves for the analysis of a generic
oile in the group. All piles in the group are assumed to
behave in the same manner. Although the authors recognize
that such behavior is not necessarily the case (their 0
procedure is not represented as a rigorously correct
81 %
W .

solution), they propose that variations are small and can
adequately be accommodated by a small overdesign. This
procedure was derived from an experimental study of circular
groups of 5 to 10 piles with 6-inch diameter (Matlock et al,
1980). The test site was located in Harvey, Louisiana, and
consists of soft clay.
Because both of the methods described above involve the
use of empirical p-y curves for a large, imaginary pile,
these procedures are quite sensitive to the particular Scriteria used for generating the p-y curves. Of special
importance is the influence of diameter on the predicted p-y -
response, a subject about which there is widespread
disagreement for even isolated piles. The p-y criteria for
soft clay (SO) recommended by Bogard and Matlock in their
pro- -ure, was used in these analyses, but the SO procedure
did not reproduce accurately the response of the isolated
pile. The site-specific criteria (SS), described previously,
was also used. The SS curves are thought to represent the "0
best use of the methods in principle, because the use of N
those curves actually will yield results that match results
of the test of the single pile. However, the SS p-y curves,
derived from a modification of the SO curves, are not unique
in that other criteria could also be used to match the
single-pile data. The use of a different form for the p-y
curves would result in different predictions for the
82

imaginary pile and subsequently would produce different
predictions for the group. Such is always the problem with a
method so dependent on empirical correlations; the approach
used herein represents an attempt to follow Bogard and
Matlock's concepts as closely as possible and still provide
feedback on the validity of the approach.
Presented in Figs. 3.27 and 3.28 are the load-deflection
predictions with the two modified unit-load-transfer
procedures. It is evident that these procedures
significantly overpredict deflections for a given load for
cycle 1. The single-pile procedure was not used to predict
the 100 cycle behavior because the gapping and degradation
around a large imaginary pile due to cyclic loading did not
appear to be relevant to this problem (no such large gap
occurred in the field experiment). The Bogard-Matlock method
was used to predict cyclic response with the SS criteria and
appeared to yield excellent results; this good agreement is
fortuitous, however, and is due solely to the fact that the
method grossly overpredicted the cycle-i deflections. The
loss in lateral resistance due to cyclic loading is very much
underpredicted relative to the cycle-I data.
0"I.
The predictions of ultimate soil resistance and bending
moment vs depth, shown in Figs. 3.29 and 3.30, give some •
indication of the effects of the Bogard-Matlock modifications
8 3 d -
% i

.1y~°~
200
PII
P lI h ead D eflection. ich es. ' .
Fig. 3.27 Predictions of load vs deflection by .,-,.,,
single-pile method, Cycle 1 (static)." *-.
M%.,,,-.
I%
84
-'e v.

%...4'
'O"t
'-
10.
00
Bogard-Matlock method, Cycle 1(static)
BOGARD-MTLOCK. S
- 0001.t* atL s .-t ,e
aOG RDftiTK
% S
b.Peitoso odv elcinbBogard-MatlockV. MehdCcl 0
MESUEOGRuP85,.
% % % % % % N %4%
0 23
AeItta aA Lpa Paate Ie.%a~

P.. UtICI..I. Soil Rooee..... lb./I.. o
0 too 400 600 G00 1000 I
2 <\-~~~ OGARO-MATLOCKt S0
2-* 1N
* \,\.-SINGLE PILE v/60 CRITERIA
* .. 4 SINGLE PILEs MEASURED A 66
tURED-GROUPKSOGARO-MATLOCKo 6
Fig. 3.29 Predictions Of ultimate soil resistance vsdepth by Bogard-Matlock method,Cycle 1 ~J
0 S00 1'000 0 500 '0000 0 L
-- '-ANGE2 -. o,'-RANOE
N N 'N
56 KIP ~ 4 139 KIP3\ \
26 M.EAS.-GROUP 6
BOGARO-MATLOCKCI/ ~__..O/
* EAS.aio - 7 ' -GROUP /
010 /
12 SS% i
@OGARO-MATLOCK ...
00 200 400 6?0 0 0 s0 100 150 'o
.2 --.- RANGE ' RANGE2.2
4 00 K6IPS ~ N/ 26 KIPS 0*
I / EAS./
- MEAS.-GROUP ,.- / ~SOGARO- , a.
* // ATLOCK0l So S.
BOGARD-MATLOCK 53
12 *"12
SB~ ,** .
Fig. 3.30 Predictions of bending moment vs depthby Bogard-Matlock method, Cycle 1
86
sksii

to the p-y curves. The procedure appears to match the trend
of the reduction in soil resistance with depth that was
observed in the experiment; the SO criteria originally
proposed by Bogard and Matlock for soft clay predicts only a
small loss due to group effects while the extension of the
method with the SS criteria overpredicts the loss in soil
resistance somewhat. Bending-moment predictions indicate an
increasing depth to maximum moment with increasing loads, and
are conservative for the SS criteria.
With regards to cyclic loading, the predicted load-
deflection response was observed to be quite good for the SS
criteria; this agreement is attributed largely to the fact
that the cycle-i soil resistance was significantly
underpredicted. As shown in Fig. 3.31, the reduction in soil A
resistance due to cyclic loading is greater than th-t 0
predicted by the Bogard-Matlock procedure when normalized to
the cycle-1 data. If the Bogard-Matlock predictions of
cycle-i behavior had been more nearly correct, the cyclic 0
response would have been unconservatively estimated.
In summary, it can be stated that the model proposed by •
Bogard and Matlock is the only design procedure reviewed
which predicts trends of nonlinearity in group response due
to reduced ultimate soil resistance of the piles in the
group. This appears to be the key to accurate prediction of
87
..........-.-

-~~ .0.- , 0
0 0.2 0.4 0.6 0.8 1.00 0
2 0
SINGLE PILE BOGARO-MATLOCK
4- w/ SS CRITERIA
5- MEAS., GROUP
7
*' %%.

J.,
group response. However, the method is empirical and based
upon the results of a single experimental study (the test
program at Harvey, Louisiana). Some elements of the
procedure appeared arbitrary because of forcing a fit with
the test data. Although Bogard and Matlock do not claim
their method to be a rigorously correct solution, the
application of such an approach to design problems is
extremely sensitive to calibration to experimental data and
to the p-y criteria that are used. This sensitivity does not
encourage designers to use the method without caution.
*'.' o .'
.89
* ,. |
89 % %%
-- 'L*". ' ,-'--','', ' - ' - ' .. "e ";" '_,'". ""' .'.. . .","'.".",Z "-",", r' w ' .''- , [. - -, r - -, ,- .4-, .
-"W_ _W , 'W* b -~ -
CHAPTER 4
BEHAVIOR OF LATERALLY LOADED PILES
AND PILE GROUPS IN SAND
In addition to the research in the native Beaumont clay,
*a study was made to investigate the behavior of pile groups
*. in sands. The work in sand took maximum advantage of the
existing group of instrumented piles and the testing S
arrangement. An excavation was made to a significant depth
in the clay and sand was placed under controlled conditions.
The sand was saturated by introducing water at the bottom of .
the excavation. The test setup is described briefly in
Chapter 2, and in detail in the report by Morrison and Reese
(1986). A lateral-load test of an isolated single pile was S
performed initially to provide baseline data for comparison
with group response. The single pile was instrumented and
loaded in a manner similar to that used for the group. After
completion of the load test of the group, additional
experiments were performed on the group piles in which
selected piles were subjected to small loads and all piles S
were monitored; this study was aimed at an experimental
determination of interaction factors for the piles in a
group. Interaction factors are employed in several design S
procedures, primarily those which model pile-soil-pile
interaction by use of the theory of elasticity.
1. "
4.--.-...

As was done in Chapter 3, this chapter is divided into
two major sections. The first deals with the behavior of
single piles in sand and test results are compared with
predictions made using available design criteria for both the
monotonic loading (cycle 1) and cyclic loading (cycle 100) %
,'.4
The second major section on pile groups in sand provides
a comparison of the response of the group with the response
of the single pile. In addition a comparison is presented of
the experimental results from the group with results from
computations with available analytical methods. Experimental
data from the study on interaction factors are also
summarized.
Finally, a summary of the major research findings,
relating to the behavior of piles and pile groups in sands,
is presented. The most important parameters influencing pile
response are listed, along with the major shortcomings in
existing analytical procedures. Areas are indicated where
additional research would be most fruitful. .*-
BEHAVIOR OF SINGLE PILES IN SAND SUBJECTED TO LATERAL
LOADING
As described at the beginning of this chapter, the
12.75-in.-diameter pile was tested in a soil condition which %.%
92-S
I..:.4 % % %v %/ % :d -~%44~44~
w.. % 4- % %44. %4'..

.% d,.
consisted of a 9.5-ft thickness of back-filled sand for the
first layer. Below the sand layer, the formations are the
same as those for clay tests. The information presented here ..
4s excerpted from the report by Morrison and Reese (1986).
Measured and Computed Results for Static Loading .
Response of Pile N
The variation of pile-head load with deflection for a
single pile under static loading is shown in Fig. 4.1. The
largest load that was applied was 28 kips and the maximum
deflection that was measured was 1.6 in. The variation of -
pile-head load with maximum bending moment in the pile is
shown in Fig. 4.2.
Response of Soil
Soil resistance curves (p-y curves) were derived from
the bending-moment data by procedures that were presented
earlier. The p-y curves for depths of 12 in. to 72 in. are
shown in Figs. 4.3 through 4.5. The predicted soil response
is based on the current p-y criteria for sand proposed by .
Reese, Cox, and Koop (1975) and does not agree well with the
measured p-y curves. An empirical multiplier of 1.55 for the V..
maximum soil resistance that is computed by the Reese-Cox- .% P.
Koop (RCK) method can provide a better prediction. The
comparison between measured p-y curves and predicted p-y
93

cl0-40 e ' 4J
co S
.-4
A S
C >
8 > (1) 0 0C-::P)%~(1 iC :44-
C)~0 LO OCQ4Ij
04 L4 0) mC a) %
OR-4 4-4rU%;
0 >'
0 41
o7 C: (3 -,z c:
0jr l= -4a-C 0 -
U) 04CL z 4- 0) l-4.f -
0)) E W
0- 0
4~ 1-4 r
-$ 02n C) 0 n
99
94 I
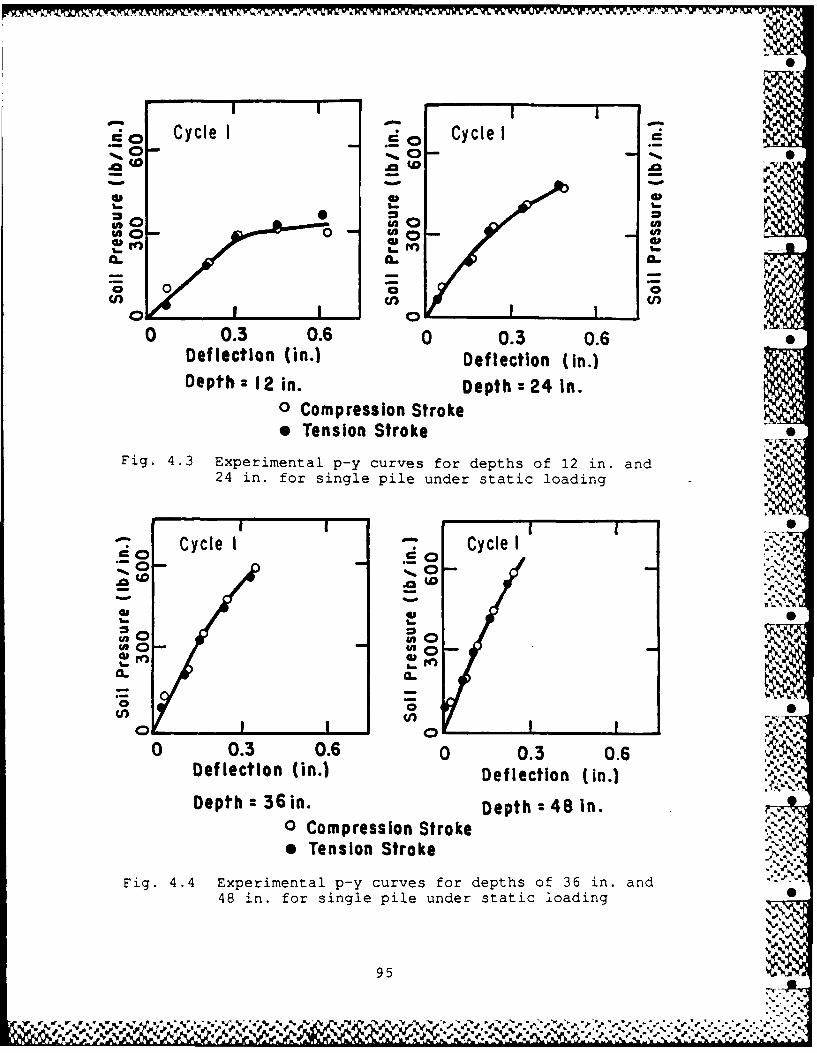
*~~ .. . . x
.C a Cycle I Cycle I2
0S
ow .
0- CL
00
0 0.3 0.6 0 0.3 0.6Deflection (in.) Deflection (in.)Depth : 12 in. Depth : 24 In.
o Compression Stroke0 Tension Stroke
Fig. 4.3 Experimental p-y curves for depths of 12 in. and24 in. for single pile under static loading
Cycle I Cycle I
0 0.3 0.6 0 0.3 0.6.Deflection (in.)
Depth -- 36 in. Depth -- 48 In...0 Compression Stroke,' ,4 Tension Stroke
Fig.4.4Experimental p-y curves for depths of 36 in. ad":
48 in. for single pile under static loading
... ... ... .. , . . . .... :: " : .
. o P 0" .'

Cycle 1 0 Cycle I" o0
.0h tAo
a. IL
0 0.3 0.6 0 0.3 0.6 0
Deflection (in.) Deflection (in.)Depth a 60 in. Depth : 72 in.
o Compression Stroke* Tension Stroke
Fig. 4.5 Experimental p-y curves for depths of 60 in. and72 in. for single pile under static loading
0 Cycle I Cycle I
00
b MRCK
0- -00: 0
U, ,, 0 R .
0 RCK
0 0.3 0.6 0 0.3 0.6Deflection (in.) Deflection (in.)Depth : 12 in. Depth : 24 in.
o Compression Stroke* Tension Stroke %.%
Fig. 4.6 Comparison of experimental and computed p-ycurves for single pile under static loading
96
,, '_+ r,¢ _' .. ,:+" '.: ., .- ,: .:'-'.".v .- ' , -" .", -, -" " ". .,.": " ;,:.",..> ; '.'''.; ''',,,",,.,','...4., I:.' '

curves are shown in Figs. 4.6 through 4.8. One set of curves
is labelled RCK and the set of curves based on the modified
procedure is labelled MRCK.
The p-y curves generated by the modified procedure were
then used in a computer program to compute deflection and
maximum moments for a pile with the properties of the pile 0
used in the load test. The deflections and moments computed
in this manner are compared with measured values in Figs. 4.9
and 4.10. It is believed that the p-y curves generated by
the modified procedure adequately predict the response of the
soil in this particular sand deposit.
The modified procedure was formulated in order to have a
site-specific method for the single pile that can be used for
studying the effects due to the placing of piles in a group.
0Measured and Computed Results for Cyclic Loaina.'j.
Response of Pl
For cyclic loading, a number of cycles of a constant
deflection was applied to the single pile. The deflection
found for the first cycle was maintained constant in both the
com pression and tension directions. In general, a total of
100 to 200 cycles were applied for most preselected loading
levels. A depression of the sand around a pile is generally
97~**~** ~ '~'~>~.~f 4 ~ -~&~f ?%*%t.A ,.4.'. "

07~ ~ Cyl I0 CceI M
'0 eCCl) U
0 0.3 0.6 0 0.3 0.6Def lection (in.) Deflection (in.)Depth z36 in. Depth :z48 in.
o Compression Stroke*D rension Stroke
Fig. 4 .7 Comparison of experimental and computed p-ycurves for single pile under static loading
MRCK RCK
01~
(n 4
0 0.3 0.6 0 0.3 0.6Deflection (in.) Deflection (in.) %2
Depth :60 in. Depth :72 ino Compression Stroke* rension Stroke
Fig. 4.8 Comparison of experimental and computed p-ycurves for single pile under static loading
98
V? "r

20 20- Cycle I - Cycle I
15 Single Pile 0 - Single Pile15 - 155Measured . -M
Measured
o,0 0
. 5 - Calculated -' 5 -=Calculated
0~ 00 I i I I I 0 ...I - ,I
0 0.2 0.4 0.6 0.8 1.0 1.2 0 400 800 1200 0Deflection at Loading Point (in.) Maximum Moment (in.- kips)
o Compression Stroke o Compression Stroke_-* Tension Stroke 0 Tension Stroke
N
Fig. 4.9 Comparison of Fig. 4.10 Comparison ofcomputed and measured computed anddeflections for the measured maximumsingle pile under bending momentstatic loading for It - single
pile Lu.ierstatic loading
N
99

p.,
found during cyclic loading. A typical shape of the
depression in sand at the end of 200 cycles for the fifth
loading level is shown in Fig. 4.11. 0
The experimental results indicate that the pile-head
deflections for 100 cycles of loading are slightly greater
than those for cycle 1 (static loading) as shown in Fig.
4.12. The measured moment curves for cycle 1 and cycle 100
for various loadings are shown in Figs. 4.13 through 4.15.
The moments are normalized by dividing by the pile-head load 5-
in order to compare curves for different loads. For the
first loading, the maximum normalized moment is slightly
smaller for cycle 100 than cycle 1. This implies that
cycling at small deflections caused the sand to densify and ,_'
the soil response to become stiffer. For the third and fifth %
loadings, the maximum normalized moment is larger fc- cycle
100 than for cycle 1. This implies that cycling at _arger
deflections causes the sand to loosen and the soil response
to become softer.
The relationships between pile-head load and maximumbending moment for both cycle 1 and cycle 100 are shown in
Fig. 4.16. As may be seen, for higher loads, the maximum
moment for cycle 100 is slightly larger than for cycle 1.
100

,.a. .. f A A- -. ,
Scole
N
0 +S
-2 0 0
20 in.,Scale
0
Elevations shown are relative to 0
original sand surface in inches.
Fig. 4. 11 Topography of depression around the singlepile
101
- "#.,r ,, ,, ,- , 5, - %, .. , ,p -" - '" %"%. .', # " ''" V 4' %""% ,,, , """ ,"'V"%""% .,,,, ,# " ,"'% % "" " ",",. W""' '"A V AA

30 1 .
25 /
Cycle I-L 20 -,
"~ / "
-J 15 "-- :
a%10
" 0 / Single Pile
Cycle 1005 - Compression Stroke
Tension Stroke0
0 0.2 0.4 0.6 0.8 1.0 1.2 1.4 1.6 1.8Deflection at Loading Point (in.)
Fig. 4.12 Load-deflection curves for single pile forcycle 100
102
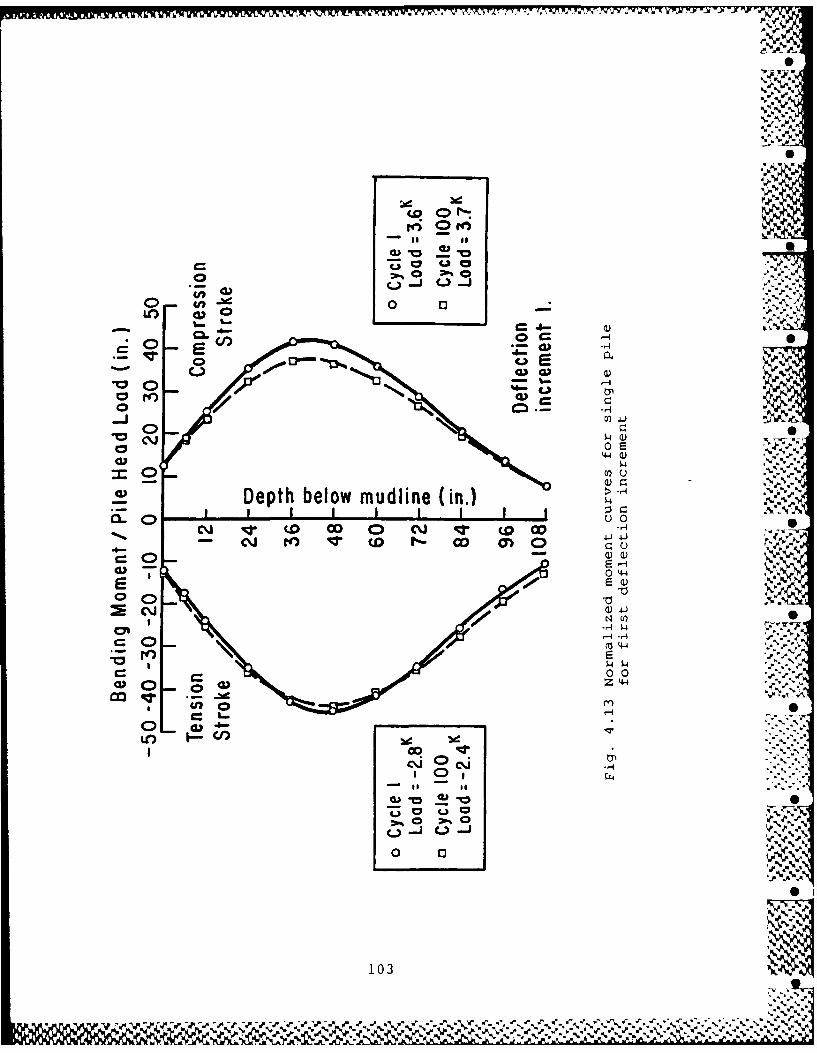
4. ..
.p. d.•
G,.b,
CI 4 (1)
o0 0 o_ _4
44) .'). -.
Depth below mudline (in.) $4
u 0I
W r, j (0 GO 'C . 00 4-4
N V)
-'.
o ,,'C 0
JC,-U24
cJc
J- 55 %
0-
A. .q
103

00~
oU CO~
0 4) W4
re) U) 4-
4-4 Q)
MuU
Depth below mudline (in.) U0
C)0
~0
H4
0 0
Z-4
CP~ 0
0 0
104

-4%
%*. ~% .
A. CI
0 C:-L~~ t
-4 ()
cu -4
V) u-
$4
Depth below mudline (in.) :
0 .1
04-
C 0N4-4
cl. N 4-)-4 4-4
0C~%
Z -4
0_ _ __ _ _ 0%
0 a
105
%.r IX. %.* %N '.~* ~ ~ ~ %* * '

4 - .. -4 . .* -- . - ,
20"*
Cycle I ' :_,,
0. 15 - '- 4-
20 4-_
5 /Cycle 00
" ~~Single Pile,.--,
%- 4-- ,/
'I)' .
0
0 400 800 1200-
Moximum Moment Oin.- kips )..-.s...=
E3 Compression Stroke-"--S Tension Stroke
Fig. 4 .16 Pile-head load vs maximum moment for ...,-_,._single pile during cyclic loading
106
0 40 800 120 .4 %1

The measured pile-head loads and corresponding
deflections of the point of loading for the two-way cyclic
tests are shown in Fig. 4.17 and 4.18. As can be seen from
these figures, deflections were maintained constant to within
about 0.02 in. For a given deflection, the pile-head load
only changed slightly as additional cycles of deflection were
applied. In most cases the pile-head load decreased slightly
up to cycle 10 and then increased slightly up to the last
cycle. The load measured on the tension stroke was always
less than that measured on the compression stroke.
Resoonse of Soil
The p-y curves obtained for cycle 1 and cycle 100 at
depths of 12 in. to 72 in. are shown in Figs. 4.19 through
4.21. The p-y curves become stiffer with increasing depth.
For depths of 12 in. to 36 in. the p-y curve for cycle 100 is
softer than for cycle 1. Below 36 in. cycling has negligible
effect on p-y curves. The predicted p-y curves based on the
procedure from Reese et al (1975) for cyclic loads
underestimate the soil resistance. The modified procedure
for static loads was used for cyclic loads and the predicted
and experimental p-y curves for cycle 100 are shown in Figs.
4.22 through 4.24. Good agreement for pile-head deflection
and maximum bending moment was found between the results for
experiment and from prediction using the modified p-y
criteria (Fig. 4.25). ..
/ ." y"j
107%7-
%•. K 1.--- - .. . -. o.,---.,- ,-v .- o.,".' - -. ; - : . c v . / .t. . .-.. -v~-.'-.-%

C)
CC
00to 045
0 -4 t.
~~~U- %
a U)4D C) u
r- 44
0 -4 Cy P- fn-4toi 0v %' ' ' ~
/4/.
(~0
10 04,~.
0 w -
LC 0 lO U') 0 U') 0FJ4
(Sdij) PDO1 POSH aOjI
108
.- %~~~4I . ... .:%.

* - - -
ci %
CD cn
cC C: -
C,, *c,'V-0
o~a~aC,
~0 - 1)
04
0U) _
0 af
-C
N C - -H-H -
0 4J-
-O LO C. 004
(sdij) ~~ ~ a)IPOH9!
109 k ,I
CD C% 0) _ 4-%40~~ %~~4-
N %
% % % % ~ ~-r FAL

I - ,I ,
Cycle 100 . Cycle 100
*_ - Cycle Io ~ Cycle 1 Do0-1A0 40 13
a1.
Cn
0 0.3 0.6 0 0.3 0.6Deflection (in.) Deflection (in.)Depth : 12 in. Depth : 24 in.
o Compression Stroke* 'Tension Stroke
Fig. 4.19 Experimental p-y curves for depths of 12 in. and24 in. for single pile under cyclic loading
I I
Cycle 00 ,Cycle t00
I Cycle I/ Cycle1. SGD U 00
COO
F0. 4.20_Exerimentl crvefo d0 o3i a0 0.3 0. 0o.3 0.6Deflection (in. Deflection (in.),Depth : 36 in. Depth :48 in._'
o Compression Stroke :-.--' '
* Tentsion Stroke -'
Fig. 4.20 Experimental p-y curves for depths of 36 in. and
48 in. for single pile under cyclic loading
110
*~~~ .1Y*~ ~* ,* j *.~~.~ :A1.I~fk4J zzA

o Cycle 100 Cycle 100
0 .0.3 0.6 0 0.3 0.6
Deflection (in.) Deflection (in.) .
Depth a 60 in. Depth -- 72 in. .0 Compression Stroke :e Tension Stroke ':'1"
Fg421Experimental p-y curves for depths of 60 in. and
Fig 4.219
72 in. for single pile under cyclic loading <
Cycle 100 ci o Cycle 100 ":5
n .,n RC
o 0R
cn
0 0.3 0.6 0 0.3 0.6Deflection (in.) Deflection (in.)
Depth: 12 in. Depth :24 in.Compression Stroke
* Tension Stroke S
5
Fig. 4.22 Comparison of experimental and computed p-ycurves for single pile under cyclic loading "
.0 0
ill 1
. , -'N

Cyce 00Cycle 100 MRCK
__MRCK .RCD
0 0.3 .6 0. 0.
Deflection (in.) Deflection (in.)Depth z36 in. Depth zz48 in.
* Compression Stroke* Tension Stroke
Fig. 4.23 Comparison of experimental and computed p-ycurves for single pile under cyclic loading -
*0
00
- 0
Cycl 100Cycle 100
0 0.3 0.600.06Deflection (in.) Dfeto i.
Depth : 60 in. Depth : 72 in.O Compression Stroke* Tension Stroke
Fig. 4.24 Comparison of experimental and computed p-ycurves for single pile under cyclic loading
112
~~ ~ %*%*4~~( - 4 ~~ ~ %. % ~ .. ~s:*4 *

06
CO-4--
0 4-
E
0 O 0 LO 0I w
(sdil) PDQ1 POOH ON ~ E44
ES
(00
0E o 4 Vo0 00M
u r- 000 4- I4-4
0±0
W o 0 rz
(sdni)) POl POH t1
040E r .
CL 0. C: :c
u4 m'
113Lr)-
V V ~~ .,W

Concluding Comment for Single Piles in Sand
The results of the lateral-load tests of a single pile
in sand have been summarized and the following conclusions
can be drawn.
1. The response of single piles to static loading is
stiffer than that to cyclic loading.
2. The maximum bending moment in a pile under cyclic
loading is greater than that for static loading.
3. The current p-y criteria recommended by API-RP2A
fail to predict the soil resistance for soils at the test
site. A modified procedure for the prediction of p-y curves
was presented for the purpose of evaluating the effects due
to the placing of piles in a group.
BEHAVIOR OF GROUPS OF PILES IN SAND SUBJECTED TO 0
LATERAL LOADING :INThis section is subdivided into three parts. The first
presents the major results of the experimental program and
provides a comparison of the pile-group behavior with that of
the single pile for monotonic and cyclic loading. The second
p -esents some predictions using available procedures of
analysis and comments upon the ability of these procedures to
, el the most important effects of pile-soil-pile
interaction in pile groups. The third presents the data from
114
A .... ". " ,2,',; . " . ..~ -, , .. :, ... .... . ,

the experimental study of interaction factors for pile groups
in sand and compares these results with those anticipated
using relevant guidelines for analytical models using
interaction factors.
Results of the Pile-Group Experiment and Comparison of
Pile-GrouR Behavior with Single-Pile Behavior
Load-Deflection Response
As expected, the group as a whole was observed to
deflect significantly more than the isolated pile when theV
average load per pile for the group was about the same as
that for the single pile. An examination of the pattern of
distribution of load to the piles indicated that the pile
response was closely related to row position within the
group; the piles in the front row were significantly stiffer
than the piles in trailing rows. No distinct pattern %
emerged regarding the effect of position within a given row. .
The load-deflection response for the single pile and for
each row in the pile group is presented in Fig. 4.26. The
data on the group are presented by row instead of as an
overall average because the difference in load-deflection
response between rows was much more significant in sand than
was the case in stiff clay. Although the pointq representing
actual measurements are shown for the single pile, the line "%
IN
115

0...
'.N
300
0 10- ..
0o.--Leadlng Row, Group. f ~--'-Mlddle Row, Group .
: O"~~C--oBock Row, Group ,,f
00.5 1.0 1.5 2.0
Deflection at Load Point, inches ' -.>%
Fig. 4.26 Pile-head load vs deflection by row position,cycle 1
~20 0
a. / q . V 'N
N %1
.Z..:.4 P
drawn for the single pile response represents the projected S
result for a pile having the slightly greater stiffness of
the piles in the group (the group piles were filled with
cement grout). The measured points shown for the rows of
piles in the group reflect the loading in each direction; the
leading row in the compression direction acted as the back
row in the tension direction. Because the response in each
direction was not precisely the same, the lines drawn
represent the average of the two sets of data.
The data presented in Fig. 4.26 clearly indicate that
the most significant group effect is associated with 6N
"shadcwing", in which the soil resistance of a pile in a
trailing row is reduced because of the shadowing effect of
the pile ahead of it. This effect was greater for the group
in sand than for the group in stiff clay, especially at small
loads (less than one-half of failure).
As shown in Fig 4.27, the shadowing effect was not
appreciably diminished by two-directional cyclic loading, as -
was the case for clays. It may be noted, however, that the
response of the group as a whole was not substantially •
softened by cyclic loading as was the response in clay. The .
relatively small effect of cyclic loading in sands can be _-
attributed in large part to densification of the sand around S
the piles during cycling. Ground-surface settlements in the
117
, .." - -- : % %

300
.Ccle 1...30"
.20 00a-~ 0
a- C)
.10 . 30
> 0- - 0 Single Pile/ "'- ----- Leading Row
/ --- '- Middle -Row '7..," ,----o Bock Row
0.5 1.0 1.5 2.0Deflection at Load Point, inches
Fig. 4.27 Pile-head load vs deflection by row position, " ecycle 100
%;. S.7,N'.'
.%8
118
-. W-W Wk -Cr - W%
range of 8 to 10 inches were noted in and around the group,
similar in magnitude to that measured near the single pile, V
as described earlier in this chapter.
Distribution of Bending Stresses
Maximum bending moments, as a function of average pile-
head load, are shown in Fig. 4.28 for the single pile and by
row for the piles in the group. For a given pile head load,
piles in the middle and back rows sustain Larger bending
m.oments; this trend reflects the loss of soil resistance due
to the shadowing effect discussed earlier. However, the load
to the piles in the group is distributed in greater
proportion to the piles in the leading row and, as a result,
the maximum bending moments for a given load on the pile
group tended to be in the leading-row piles. For the group
of piles in clay, the load was distributed with lesE bias to
the front row, and the absolute maximum bending mome-.ts were
often in the trailing-row piles.
A typical plot )f distribution of bending moment with
depth for the single pile and by row for the piles in the .
group is presented in Fig. 4.29. The maximum moment for the
trailing rows in the group occurs at a greater depth (due to
the reduced load transfer near the ground surface) and is
greater when normalized by pile head load. The datar ..7 _
presented in Fig. 4.29 illustrate the actual distribution of
119 % ,
A %

" ~CycSle I.-" .
' h
0
o0 O 0 Single Pile ._1> a Middle Row, Group
4 C3 Back Row, Group :: ,* . ' " .' -.0500 10050
Maximum Bending Moment, Inch-kips
.:,. '.
Fig. 4.28 Pile-head load vs maximum bending moment byrow position
' .,
,"% " .'.w "."% % %. " "% " ". . "'"" " " "
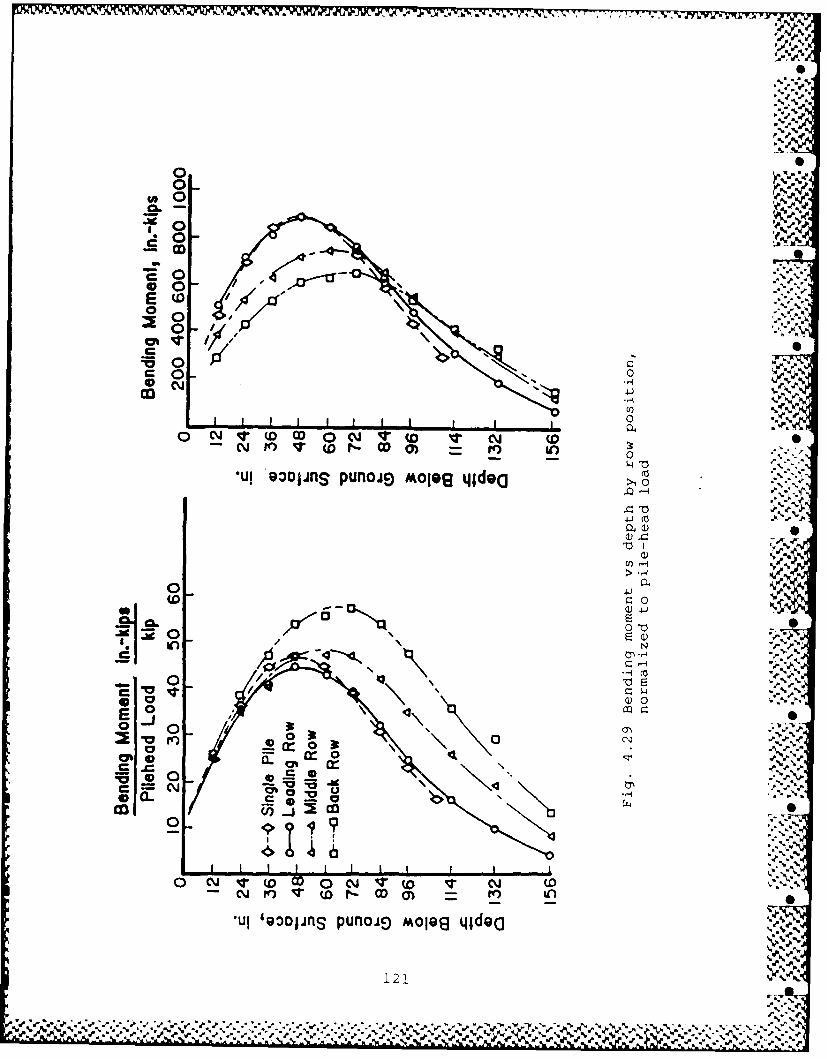
0000 , 01,S0W
-~~ 4eJ~.~
000
0
0 Cq-w z)0 C-i q W NJ wD
-uj solnS punoaE) A%~gq~
0 0A
(D 0
00
*0
o 0 X*
a. M.a 0-
.a,.
a. 121
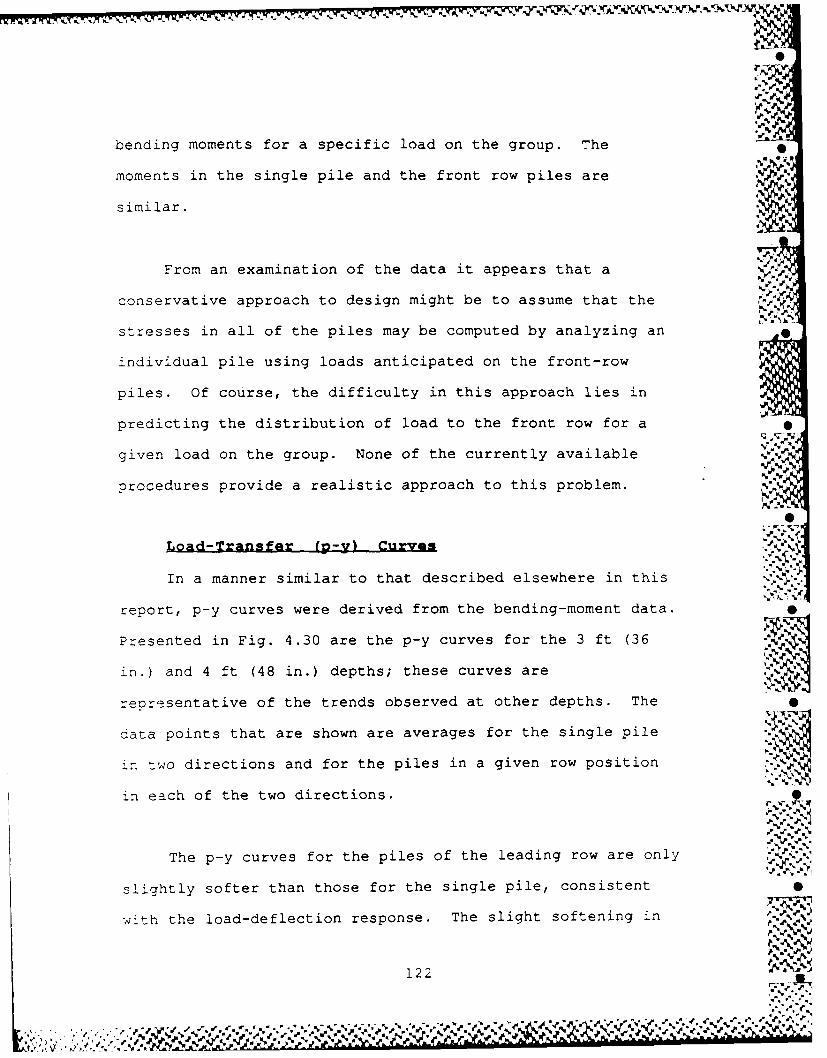
p . m -q .-*. _ _ .
.. %.J
bending moments for a specific load on the group. The O
moments in the single pile and the front row piles are
similar.
From an examination of the data it appears that a AI e
conservative approach to design might be to assume that the
stresses in all of the piles may be computed by analyzing an
individual pile using loads anticipated on the front-row
piles. Of course, the difficulty in this approach lies in
predicting the distribution of load to the front row for a
given load on the group. None of the currently available
procedures provide a realistic approach to this problem.
Load-Transfer (2-y) Curves
In a manner similar to that described elsewhere in this
report, p-y curves were derived from the bending-moment data.
Presented in Fig. 4.30 are the p-y curves for the 3 ft (36
in.) and 4 ft (48 in.) depths; these curves are
representative of the trends observed at other depths. The
data points that are shown are averages for the single pile
in two directions and for the piles in a given row position
4n each of the two directions.
The p-y curves for the piles of the leading row are only
slightly softer than those for the single pile, consistent
with the load-deflection response. The slight softening in
122
. . . . . ... . .. . ..-. , , :, . __..v:,,- .- ,. .v. , , % ,° -a ": - , - i , i , *

o
0-"/ le % 5,
1000 1000 -
:e / 48 In. depth ,=,
U / 36 In. depth t Cycle I500 / Cycle I C 500-
- - - - -- I . ..'~
M it
/ ..........
0 0.5
0 0.5 1.0 00.5 1.0 " -
Deflection, in ------ single pile Deflection, in.leading row)middle row
---- back row10 1o 000. j-,...,.,I000 36 In. depth ,. 0048 In. depthI J Cycle 100 S' '
Cycle 00 - ~Cycle 100 .
Cycleycl II0'
- - .U S\
.5000500 . 500
=-- % %MI
0* 0* _ _ _ _ _ _ _
0 0.5 1.0 0 0.5 1.0Deflection, In. Deflection, in.
Fig. 4.30 Typical p-y curves by row position
123 1k .,

V",~
the front row is likely due to the superposition of strains
in the far-field soils ahead of the front row piles; ,
increasing stiffness with increasing stresses apparently made
the front-row piles in sand less influenced by adjacent piles
than was the case for the front-row piles in clay.
The reduction in soil resistance in the trailing-row
piles is quite evident in the data presented in Fig. 4.30,
and correlate with observations made earlier regarding
distribution of load and bending moment. In contrast to the
p-y curves from the group test in clay, a significant bias in
soil resistance between rows is present at even relatively
small loads. •
As was evident from the load-displacement relationships
for the pile head, two-way cyclic loading did not produce a
great loss of soil resistance. This observation is in stark
contrast to the experimental results in stiff clay, in which
reductions in soil resistance due to cyclic loading were even
more significant for the group piles than for the single
pile. As discussed previously, the soil response during
cyclic loading in sands appears to be quite sensitive to load
history; cycling at small loads produced substantial
densification which appeared to improve the soil resistance
at subsequent larger loads. The amount of densification was
124
J. .1 .

%. %p
surprising, because a considerable effort was expended to
compact the sand during placement.
The densification during lateral loading appeared to be
related to compaction of the sand which falls into the void
behind the pile when the pile is loaded in the reverse
direction. It is likely that cyclic lateral loading, which
is primarily in one direction only (as opposed to the full
two-directional load cycles used in this experiment), would
not produce as much densification and would result in greater
loss of soil resistance with increasing cycles of load. In
this respect, the results of this experiment may not reflect
the "worst case" cyclic loading in sands for many field
conditions, although there are not sufficient experimental .
data to provide much judgement in this respect. It may also
be the case that many cycles of small lateral loads prior to 0
the occurrence of the design event may serve to improve the
response of a pile group, so long as significant permanent M
strains have not occurred.
125

S
In summarizing the results from the analysis of data
from the lateral-load test of the pile group in sand, it may
be concluded that:
1. The deflection of the pile group is significantly
larger than that of a single pile under a load equal to the
average load per pile,
2. The reduced efficiency of the group for lateral
loading is largely due to the effect of "shadowing" in which
the trailing row piles can mobilize only a limited soil
resistance,
3. Maximum bending moments occurred in the piles of the
leading row and were similar to those in the isolated pile
under the same load per pile,
4. The key element needed in predicting group effects is for
an understanding of the mechanisms producing the loss of soil
resistance in the piles within the trailing rows,
5. Cyclic loading in two directions had a relatively
small effect on pile response relative to a similar test
conducted in clay. ".
6. The relatively small loss of soil resistance due to
cyclic loading may be due to the significant amount of 0
densification which occurred during two-way cyclic loading.
126

WW. ..'VVV~LW N
%
Comparison of Experimental Results with Prediction.
Using Available Analytical Design Procedures
Introduction
This section provides a comparison of the results of the
group test in sand with the results predicted with the ..t.
analytical techniques which are available, and widely used,
at the time of this study. A more complete description of
these techniques is available in the report by Brown and
Reese (1985). A detailed presentation of the predictions
using these procedures is available in the report by Morrison
and Reese (1986).
A brief discussion of the procedures that are used was
presented in Chapter 3 and will not be repeated here. The
procedures described previously were used to analyze the
group in sand, with the exception of the computer code
PILGP2R. The elasticity-based procedures include DEFPIG and
the Focht-Koch method, while the modified unit-load-transfer
models include the single-pile procedure and the Bogard-
Matlock method. The paragraphs which follow provide a
summary of the relevant findings regarding the ability of
these models to reproduce the important aspects of the
problem of pile-soil-pile interaction.
S
127
JW

Elasticity-Based Methods S
Predictions of group behavior using the DEFPIG code and
the Focht-Koch procedure are presented in Figs. 4.31 through
4.33. The input parameters were "fitted" to the experimental
data for the single pile to minimize variability due to .
predictions of individual-pile behavior and to isolate the
pile-group effect.
As is clear from Fig. 4.31a, no single elastic modulus,
or even rate of increase of elastic modulus with depth, could
be found which modelled the nonlinear behavior of the single
pile. Input parameters for DEFPIG were therefore fitted for
each selected value of load per pile to produce the curve
shown in Fig. 4.31b. This curve is seen to overpredict N
deflection somewhat for the static-load case. It should be
noted that the use of a variable elastic modulus as a
function of depth is not incorporated rigorously in the
elastic theory; the solution uses an approximate technique to
include variable elastic properties. Although the code
includes provisions for limiting load transfer at given
depths along the pile (as for the p-y curve approach), this
is also an approximate technique and no guidelines exist for
estimating limiting values of load transfer outside of the
empirical p-y curve values. Limiting values of load transfer
were therefore not used. Z
128 U% %.or r _o
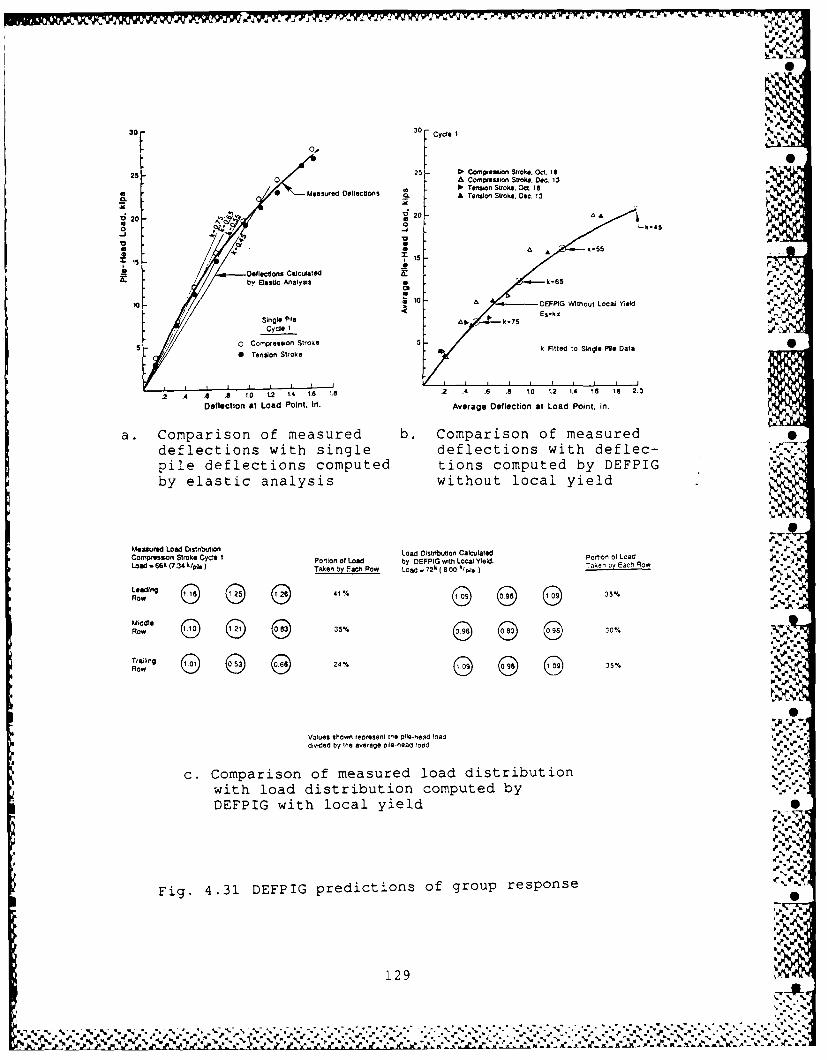
- - b. - . - -S.
300
30CycleI
25 25 Dt Compession Stroke. Oct. is0 A Compression Strke, De. 13
a Tension Stroke, OcL 18-- M. A Tension Stroke. Dec. 13
Id20- IS~ 20
V V~oa A k-,55-,
C.
E / / /C cl S in g le P ile/-Ck ° 7 5 E s -k x 1
a. Comparis n CIased
deflecti onso witok ksitdt ingle de le ti n wi h Df ect-a;,
pi e DeflectaLodint. com ute Averag DconputeLod Pont In. G ,, ,
by elastic analysis without local yield
Portion Of Load by DEFPIG ahth Local Yield. T eln f Lad %
Loading 135
G0 S I
MiddleP~
Valuopesin toes show epresnttoheping-eed lod ,Dat%"
Delc na o d Point. i by Averageeraflection at Load Point. in.
. Comparison of measured b.ompaisoniuto measure
pieweft ons comptioutetincpted by D"-FP"-
by ElasiGnlyi withou local yieldR Lo% 1% DEFdIG sredic tion Calu responsaLraling 1t 1*aRow 8- W
Trauin% .0 W4
Valus$ hown represent [he Pl14ehoad louddorded by thle average Pil-eatl load %
c. Comparison of measured load distributionwith load distribution computed byDEFFIG with local yield
Fig. 4.31 DEFPIG predictions of group response
129
% %. % % %"%

14
Although the load-deflection prediction for the group
sh-wn in Fig. 4.31b appears to be reasonably good, the
predictions of distribution of load shown in Fig. 4.31c
indicate that the elastic solution does not really model the *.
group behavior; the symmetric pattern of load spread to the
four corners of the group is at odds with the bias between
leading and trailing rows as revealed in the experiment.
The version of DEFPIG available for this research had no L
provisions for estimating bending moments or for including -
cyclic-load effects. Cyclic loading can presently be
accounted for only by empirical modifications.
Focht -Koch
The Focht-Koch procedure uses empirical p-y -u :ves to
reproduce nonlinear effects for a single pile, as is
typically done for routine design of piles for lateral
loading. The Focht-Koch predictions of static load vs
deflection for the group, shown in Fig. 4.32a, are seen to
match the gross behavior of the group in sand reasonably
well. As was the case with DEFPIG, the distribution of load
is incorrectly modelled. The symmetric distribution shown in
Fig. 4.32c does not match the row-by-row behavior observed in
the experiment.
130
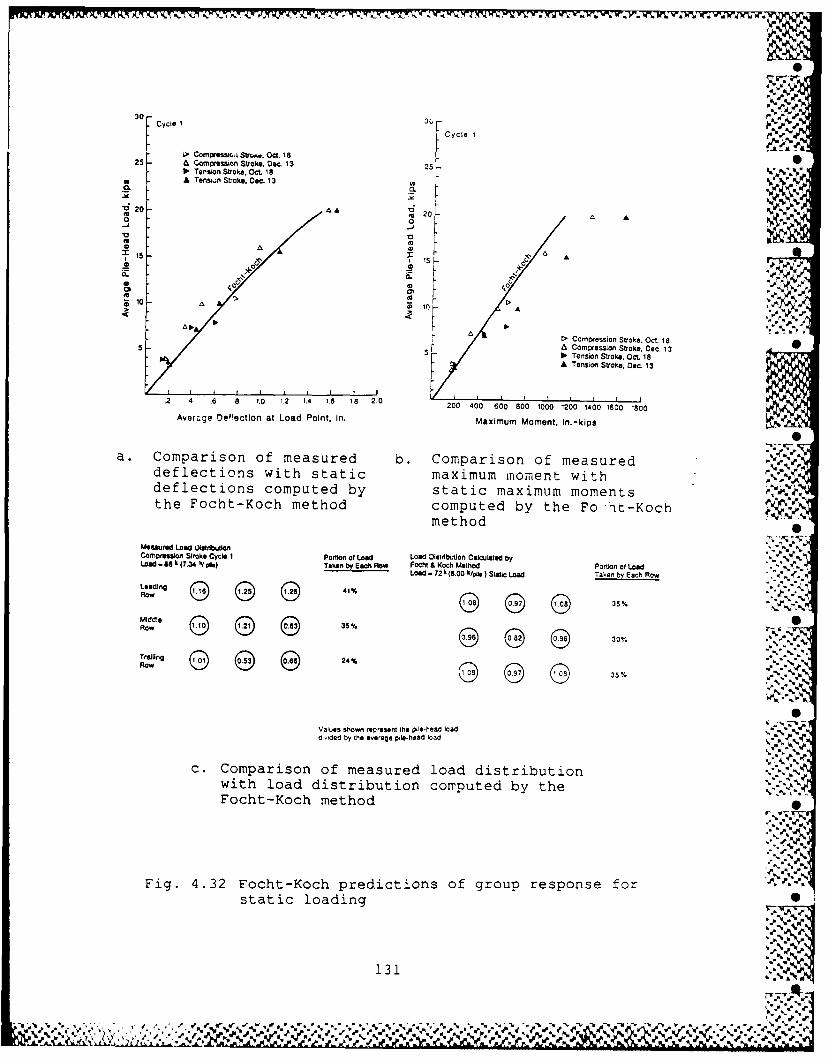
AF -A . ... . . .
30 -" "
0 Cycle 1 Cc l,F~Cyl CIl el ~1,CmINllsr,. Stro,. Oct. IS At
25 & Compression Stroke. Dec. 13 25, Ter>sion Stroke. Oct 18 16.
A TOn sTnnStroke Doc. 13 14
.20 4 A 200U.2 Aoj 0
ea
0"10
A 4
15 er g Ae~cln odPit n aiu Moet A.kpApA
D, Compression Stroke, Oct. 185FS A COMpeSSiOn Stroke. Dec. 13
5itcu Tension Stroke. Oct18A Tenso Stroke. Dec 13
.2 4 .6 .8 1.0 12 1.4 I's 1.8 2.0 200 40 600 80 10 20 10 60 0
Avera~ge Deflection at Load Point. In. maximum Moment. In.-kips
a. Comparison of measured b. Comparison of measured adeflections with static maximum moment withdeflections computed by static maximum momentsthe Focht-Koch method computed by the Fo 't-Koch
method
Mealured LowO L ti l t llo- ,Compression Stroke Cycle I Po%1io( of Lead Load Dlstdbutlon Celated by
LOW.66 k (7.34 IV 1p) Taenr by E& IRow Focht & Koch Method Poron of LoadLoad 17 2 k (8.00 k/l0 4 1 Statc Load Taken by Each Row
d" 1%Flow G
5
Middle0Row 135% r h - o%
Traielb te voegopieAa-lad%. , .
rolln 24%
ROW S
SS
Va]4eS Shown represent the pile-head loaddvided by the average pile-hiad load ~
c. Comparison of measured load distributionwith load distribution computed by the %- .,Focht-Koch method
N.
Fig. 4.32 Focht-Koch pred ictions of group response forstatic loading
131
v--.5-L-*,,. °1
E R.,"=' . , -
" ' ,/ t . '-' r~k' ' - .. . ' , %,• , , -v •"'" "-"-''- "t-" ;- 'l ' ' ""' " ""=-(* .* J"==J t 'l ,%

Maximum bending moments as a function of static load,-
shown in Fig. 4.32b, are seen to be unconservative at static
loads above a small value. The maximum moments plotted for
both the prediction and the experiment represent the maximum
value on any pile in the group. The bending moments are
unconservatively predicted, in spite of the reasonably good
prediction of gross deflection of the group, because of the
much larger proportion of load distributed to the front-row
piles than predicted. The Focht-Koch procedure also
underestimated the depth to maximum moment similarly to the
trend described for the group in clay, but with a less severe
error. The greatest factor contributing to the bending-
moment error -:as the load distribution effect.
Similar trends were noted for the Focht-Koch predictions
of cyclic-load response, shown in Fig. 4.33. Reasonable -
agreement was observed for the gross load-deflection
behavior, although the group response appeared more nonlinear
than predicted and Focht-Koch was somewhat unconservative
near failure. Patterns of distribution of load were .V.-%
incorrect and contributed to a significant underestimation of
bending stresses at virtually all levels of load.
Modified Unit-Load-Transfer Models
The procedures in this group include the single-pile
method and the Bogard-Matlock method. Both use empirical p-y
132
%CA .-- %

-~~1 - -. 0 --
30 [C0ce-to 30r
LFCycle10
25 F-Cce1021I20 20
4
10
A CL0
0 A*00
DACMrSIO toe Oct.I> Copes o toect. 1
I& Compression Stroke. De.13 A CopesinStoe .1Decnio tok.C . A Il CTntsio Srok Oct. 8
'& C-mp Cm'.:.. S > Tensions Stroke. Dec 1*10 ~ ~ ~~~ A Tension Stroke. Dec. 13 ATnInSrk.Dc 3'
A%
12 .41 .6 .8 1.0 1.2 1.4 1.6 18 200 400 600 800 1000 1200 1400 1600 1B00Average DefleCtion at Load Point. in. Maximum Moment. In.-kips %
a. Comparison of measured b. Comparison of measureddeflections with cyclic maximum moments with %*W~deflections computed by cyclic maximum momentsthe Focht-Koch method computed by the Focht-Koch
method 50
Measured Load Distribution - 0Compression Stroke Cycle !00 Portion ot Load Load Distribution Calculated by otnofLa
Load - 65 k(7.20 *I oft) Taken by Eacht Row Focht &Koch Methtod Po~nofLaLoad - 72k(B.00 ii/ie) Cyclic Load Taken by ach ow
Leading ( ~' - 42%Row35
Trailing 'TRow S2335%
SS
Vale en fll er~n the pile-head loaddivided by the average Pile-head load.
c. Comparison of measured load distributionwith load distribution computed by the Focht-Koch method
Fig. 4.33 Focht-Koch prediction of group response forcyclic loading
133
%* % %

curves and empirical modifications of these curves deriving
from the concept that the piles and the soil within the group
move together. Neither of these models was intended to b,:
used with pile groups in sand, and the predictions which
follow represent an "unauthorized extrapolation" of the
original intent. The researchers in this study felt that it
represents an interesting look at a different type of
analytical procedure.
Single-Pile Method
Using the p-y criteria of Reese, Cox, and Koop, fitted
to the single pile experimental data, the overall behavior of -$
the group was predicted. Analyses were performed considering
a circular pile with a circumference equal to the perimeter*.* - -*
of the group and a stiffness in bending equal to nine times
the stiffness of an individual pile. Presented in Fig. 4.34
are the predicted load-deflection relationships using this
procedure in terms of the average load per pile; the load is
assumed to be distributed uniformly. The deflection at a
zarticular load is greatly overpredicted, largely because the '..
deflection, y, used in the p-y relationship is a function of
pile diameter.
For the group in clay, the loss in soil resistance due
o cyclic loading was seen to be related to gapping around
individual piles as well as related to group effects; for the
134 %
.. % % ~ '.''

0~ 41
0QJ-'-
4 -voa 4-4 Q
4) 4-
0.04
00 p0 vp l
a) 09
4 46 C)U
coU
I ,..I... ... I 4M -U 0o 0 (l-a-
C=- 41 On-
0 >iH *
0~ S).-
4 U)10 040
0 >, -4 4
_ 09 04 **~t;-4 Q)
.00 *5 C
0 (3
(3
-I- ~ 0 ~ 'ra0 -- 4 a)-
O ~ -4-4~ *4.P
Q)04 -
4) - C) -- 4
4a VP )
(0 4 -4 1-0 = 4- 4.j.J
0 9)£ . c
0 ' 4 Cl)%
0J0
('1 N - 0 0 4 -~~,Ja
sdpq~~~- 4-)PSHSde~j~
135%

# be
group in sand the mechanisms are less clear. The
relationship between cyclic loading for a large imaginary
pile and for the grcup may be similar, but other factors
observed in the experiment such as the distribution of load
and the shadowing are not considered in the single-pile
method.
Bogard-Matlock Procedure
As described in Chapter 3, the Bogard-Matlock procedure
combines the p-y curves for an individual pile with a
modified "large-pile" p-y curve to account for group effects.
Presented in Figs. 4.35 and 4.36 are the load-deflection and
load-moment predictions using this procedure, for both static "
and cyclic loading. As for the single-pile method, the load
is assumed to be distributed uniformly to the piles.;, ~
Although the load-deflection relationships are seen to
be reasonably close, the method is unconservative as an 0,
indicator of maximum bending moment. As was the case for the
Focht-Koch method, this error is due partly to the fact that
the front-row piles support much greater loads than
oredicted. Because of the large differences in load between
rows in the experiment, any predictions based on a uniform
distribution of load cannot match both overall load
deflection response in the group and the maximum stresses in
the piles of the group. "0,
136
."% I
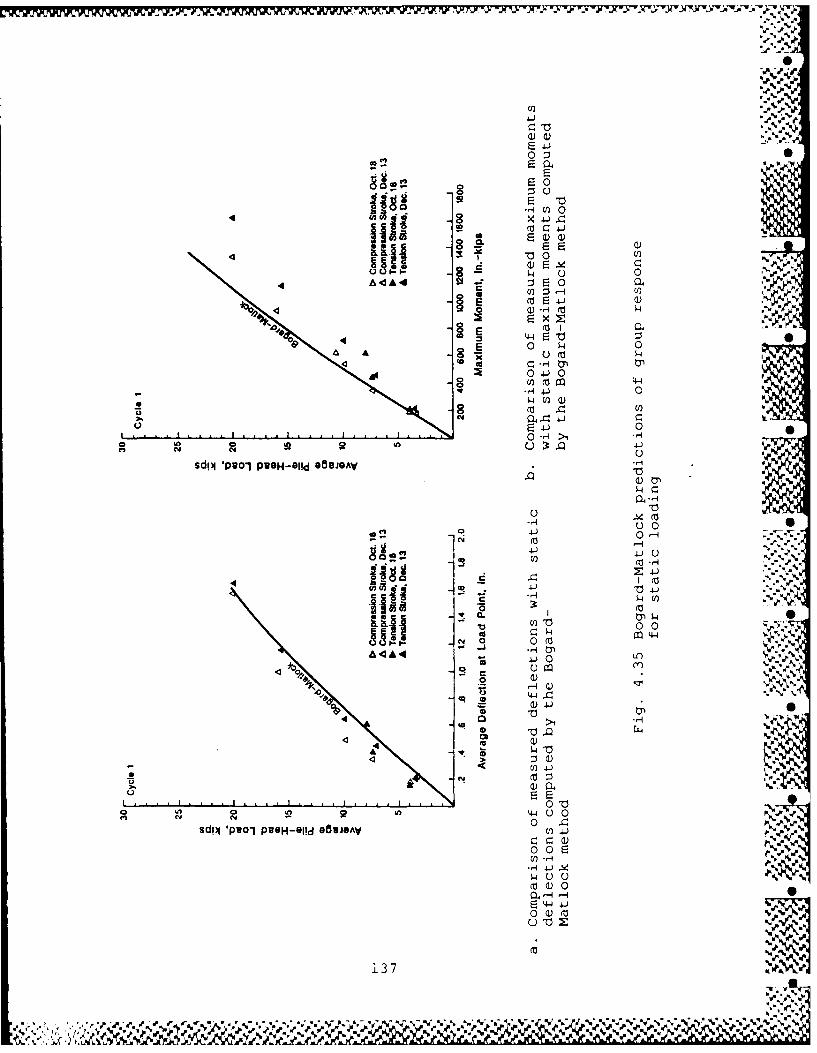
%- h .*
%
U)
0 :3•
cc.E 0
- 0
0 ,0 044
- - ( 4=
U. a) .,-I
"A u 0
i4 . . .. . . ,
U)
-8 c co" O 0 4
.1E 0 - 0 q,
4 V)ty
. 0 .'-- 0
... . . .. . .... .. .>
CY u N 9 i 0
sdij 'Peol PUSH-Ol1d G68JOAV 4 4
o
o 00
-,-'
4 ~14J - % %
0 d)-4 %
4 -j 4 -j
1'41
0 3 C4-4
'..)-6 "- %
N 0 0 000
w %)
(1Y)
*.1 C
.Q ,
q a 54
4 - -t .
4~ CU
C.).
0l Y 440 0
00
)-H %'4-~
-4 4-J -1
E 44 4J
L37 LA
% N % 4 4'..~ 4~*4

%
U) (L) ~
0 .
" 4 04J~ .,-+.,
4J N
A4m 004
Oo (0) .0 1:
4 Q5Q C 0
o 0 a)oo 0 -
I • ' -+
"I % %"
0l 44 :3l 04-
0 ' 0
sdP p9~ POH-I~dO~3SA~0 (~0 mH
uo -
U)0) ~
-4 00
es!l 'pvol POH-Old eBBJO^V E '
0g >1 0
* ~0L0
(0
U) 00
0I 00
-0 Ce4-
44 (V~0
doo
Qa) 00* 4 0 0
4- N0
;0.30
(o (Vrz-H
0 a) L0
(a -H wvdI 'pvo, POSH-Otid SBUJSAY 04 -4 (
0 >10
u co~~~~~ L~ 3 8 4 * 1
"?~~~~~~~ %, % ~V ~/.*\ ~-.

". ,€
Although the Bogard-Matlock procedure predicts
nonlinearity in the response of the group due to reduced
ultimate soil resistance, the relative differences between
soil resistance between rows in the group cannot be
predicted. The differences in load between rows in the group N
in sand was observed to be much greater than the differences
in clay, so the relative differences in load between the
piles in the group and an overall average are greater for the
case in sand.
The deflection of the group for cyclic loading, relative
to that for static loading, is seen in Fig. 4.36 to be
greater than actually observed. This overprediction of the
effects of cyclic loading is due in part to the p-y criteria
used with the method; similar overpredictions were observed 0
for the isolated pile. For the Bogard-Matlock proce lure, the ,
effects of cyclic loading on a large imaginary pile are quite
important in estimating the effect of cyclic loading on the
group. Although the mechanisms governing cyclic-load
behavior in groups of piles in sand are not well understood,
the concepts used in the Bogard-Matlock approach appear to
greatly oversimplify the problem.
Experimental Interaction Factors %. %A?
When a pile is subjected to a lateral load, the
flexibility of each pile in the group is influenced by the
139
%. , .... % %, .. . . . . . , %. , . .., -. .-. .- .- ./ " ,""-. ..- ,. . . . ., -,"",,""," '4 ", ," '." .' w ." " ', . . ', " ,,, .% ,, . ,, .. . . ., .,.% .. ,.,,i,.,, .,".,. ,',' . 'JIN~[

W .. 7j(
presence of neighboring piles. The load induces reaction in
the soil and, consequently, causes deformations in the soilmass surrounding the other piles. These deformations in
turn reduce the load required to produce a given deformation
in the pile being affected. Such an influence is quantified
in terms of pile-head behavior by the use of an a factor.
This section summarizes a factors from an experimental study
made by Ochoa and O'Neill(1986) for groups of free-head piles .I
in a nonlinear sand mass.
Interaction Factors
Poulos and Randolph computed interaction factors from
elastic solutions for a pair of identical, equally-loaded
piles embedded in an elastic half space. The use of
interaction factors for the analysis of pile groups under
lateral load provides a simplified method for engir ering
practice. However, the response of soil to lateral load is .
highly nonlinear and the use of interaction factors derived
from elastic theory may be inadvisable. Ochoa and O'Neill
developed interaction factors experimentally for groups of
laterally loaded piles embedded in sand under free-head %
conditions. The interaction factors from experimental
results can take into account the nonlinearity of soil ®r
resoonse and the shadowing effect. The interaction factors %
were derived as a function of the departure angle, the pile
140
r W W, % V% %de,, ,, ; ." 0

%
spacing, the magnitude of lateral load, and the number of
cycles of applied loads.
Figure 4.37 describes how interaction factors (aij) can
be used to form flexibility matrices for solving for the
distribution of deflection and load in simple free-head pile
groups (O'Neill, 1983). The interaction factor computed from
experimental results are presented in Figs. 4.38 to 4.42.
The symbol SP5% shown in those figures is defined as a load on
the single pile that causes A displacement at the pile head
corresponding to 5% of the pile diameter. Pj is the averaged
lateral load on each pile in a group; therefore, Pj/SP 5% .
represents a level for the magnitude of applied loads. The
departure angle 4 is defined in Fig. 4.43.
For conditions similar to the test conditions and for
free- or pinned-head pile groups, a-factors for "Cycle 1"
from Figs. 4.38 to 4.42 can be used for predictions for
monotonic loading and a-factors for "Cycle 100" can be used
for cyclic loading. Several features are evident in Figs.
4.38 to 4.42. First, the a-factor is lower for % = 00
(effect of trailing pile on leading pile) than for = 1800
(effect of leading pile on trailing pile). Second, the a- .%
factor increases with increasing magnitude of load and,
generally, decreases with increasing numbers of cycles of
applied load for in-line piles. For side-by-side piles, load
141
-. "" " %'
.....

~~Ap.
P P
Polw
W,
U) o.c N *
0..
LUU
0a
I L~z I L 0. C L C I-C
CL4
z 0 0accc.A0. A>
04
Q)a a a a a a - a
LU C)
4UU X 00 44
s a ia s a - a a a3 -
0--
U( (A
aa a a -- a a aC- CL 0 cI-
I 0~ 4Oa~~~~ a
CL too
* C Z ~-4U
a. a.X7,N-, U)L142
aJpJJ (N o

k.~~~ C14K K .. -s
UiA
CL CL 4
3iS
CL~
4 -j
0 -' ,
II 16.1
0d U) Z0
el 0
41 S
% % V
% -%

--44*' E'
0C 000I
0~I0))
Y..
Vn %
0. Cl%U)2
/ I-' .~ T4
/v%g .
%' "K,
1442
%2
- :+..,. :.I
0
"NUlU
o y- :-;,.
cm d CD,".,'-
o -+I -- i -0 C00
&-',Q II , .',
U) 0% %S
a%
c. ! 1 I L J I I C
j
0~I I 1
0. V
0 ;.--V.
Cf ,-.-.-
clI
00 /%/ 0"
-.
/le:
A2
C~CJco0
--
44-0 0I>
C, ) I - U 0
0
0 )O0 U ) f' -d" 0.
44 % e '. if-V
Cof
~ II (.1
*, k .
/%. ,,. "
-4 .
lop %%
I %
1462
AH %
AL
0
CCD-. 1 - .dy.
* - U) LU000)
** J 0 -
3p -1 _ V
LU - < t '
>-~~N' -i
o 1(
_*j 0~~l 0 144 '- .
I - -
0 0
-L < -a
C) C.) Cf i
C.l)
.0 J
- C-)
I- I
0) 00N (D ) V c Cm
c0 %'
0 ~. z < , i47
% %.'-o66 666o

*p -
VV
~OAD ON
LL
r LOAD ON LOAD ON LOAD ON
J . .% -,
EFFECT OF i EFFECT OF J EFFECT OF ioSON J, = ON i, C=1800 ON J, 0 =o90
LOAD ON LOAD ONLOAD ON LOAD ON
]' l .'
LOAD ON LOAD ON
EFFECT OF i EFFECT OF j EFFECT OF i r." W,
ON J, C=180 0 ON i, 0 0 ON J '=900
Fig. 4.43 Definition of
148
%- "W:~

magnitude had a minimal effect on (X, and it decreased with o-'
increasing numbers of load cycles. Finally, the a-factors . ,- - -•. Y Y~-
obtaine fo exeimna reslt in san wer generally~ -
This section provides a step-by step design procedure i
for the evaluation of the behavior of a free-head pile group !
embedded in medium to dense sand, using the experimental
interaction factors from Figs. 4.38 to 4.42. "
. Compute the average load per pile, Pj, in a group.
2. Compute the single-pile flexibility, fill (secant to i!! -
Single-pile load-deflection curve for the average load per .""- "
pile obtained in Step .). The load-distribution :: _ve is
cbtained from a load test or from some method of analysis., -
3. Normalize the average load per pile, ( Pj/Sp5%), by . -
,' .'S I
using a load for the single pile that corresponds to a
displacement of 5% of the diameter of the single pile. .,
'1 -'S.-%
for the pile group, based on Fig. 4.37.
5. Evaluate every element ((ij) in the matrix for a-.--
- ".5. " "
'-'S
inceaingnumbrsti of loadnumerf cycles,ll h la
obacined from dexperimentanle reutsein sancrtd wee penrlly•
, ..- ,D

6. Compute load distribution (P1. ........ Pn) and group .
deflection, 8g, by solving the flexibility-matrix equation.
Comparison of Experimental and Predicted Behavior
of Pile Group
The analysis for the nine-pile group embedded in sand,
conducted by Morrison and Reese (1986), was studied using the
interaction factors as described above. The distribution of
load among piles in the group and group deflection are
compared with the measured values. Figures 4.44 to 4.47
summarize the results obtained after solving the flexibility-
matrix equation using the recommended interaction factors.
The distribution of load among the piles in the group I '/
from Figs. 4.44 to 4.47 shows that the shadowing effect can
be evaluated reasonably accurately using the experi ental
interaction factors. Leading (front) piles developed loads
larger than the loads developed by the row of trailing (rear)
piles. Better agreement for distribution of load among the
piles in the group and deflection of the group was obtained
when the group was loaded to the south rather than to the
north. In general, this method underestimated loads on the
leading and second row and overestimated loads on the pilesS..- ", " ..[
in the rear row. The deflection of the pile group predicted -• -. '
by the interaction-factor method has good agreement with the
measured deflection as shown in Table 4.1. The experimental
150
"M r %
. - '. ,,',.% .%.'r. '.- '_"'-' ', , t ,- , , ,...
* ..- ,
CYCLECLADING NORTHAVERAGE LOAD PE9 PILE 7.34KLOADING :NORTH PGROUP LOAD : 66.08K P1 3
SP 5% .,
NORTH
14.07K 10.33K 14.07K - EXPERIMENTAL C.'s8.53K 9.16K 9.24K MORRISON'S TEST
10.71K 7.82K 10.71K POULOS-RANDOLPH a's .-
(D(
5.62K 3.00K 5.62K8.05K 8.86K 6.12K3.59K 0.38K 3.59K
5.33K 2.67K 5.33K7.40K 3.90K 4.82K
.
10.71K 7.82K 10. 71 K
AVERAGE LOAD PER ROW GROUP DEFLECTION -
EXPERIMENTAL Ws : 0.50 in. '.V
12.82K MORRISON'S TEST 0.35 in.8.97K
9.74K POULOS-RANDOLPH c's: 0.46 in.
2.52K."
4.44K 05.37K. . .9.74K .
Cycle 2, loading north, group load =6608 k
151-P,, ,,.,
SO'% "m % % 14 .44K..,-
, J [ ." ,, 7 % . ' ' ' _ ., , P5.r37 Ke ~ ' , j .. , . .: ' - t . J -- ¢ . " _ " = . . . - % " . " . " . ' - " . " " . . " " " " " '

• , . ~~~~~~~~~~~~~~~~ w h-wP'P- -,; .- ,w, r : JF . w - . .. . ,., _. ... ,.
CYCLE 1 AVERAGE LOAD PER PILE 7.05KLOADING SOUTH PeGROUP LOAD : 63.47K P = 0.32
SP 5%
NORTH
5.35K 2.74K 5.35K - EXPERIMENTAL a's5.26K 4.56K 5.69K - MORRISON'S TEST10.29K 7.51K 10.29K - POULOS-RANOOLPH a's %
oe5.54K 3.03K 5.54K 06.25K 4.70K 5.99K3.45K 0.36K 3.45K
13.15K 9.58K 13.15K9.24K 10.82K 10.97K10.29K 7.51K 10.29K
AVERAGE LOAD PER ROW GROUP DEFLECTION S
EXPERIMENTAL a's 0.50 in.
4.48K MORRISON'S TEST 0.45 in.5.17K9.36K POULOS-RANDOLPH a's: 0.46 in.
4.70K
2.42K,,, 1
11.96K - %10.34K
""
4.70K
9.36K
Fig. 4.45 Distribution of load and deflection of group for
Cycle 1, loading south, group load = 63.47 k
i52% % 'Fe e 0-%-Uese .':.% .

_', .' .-e14. %i
CYCLE 100 AVERAGE LOAD PER PILE 7.20K .,LOADING : NORTH _.GROUP LOAD : 64.C3K Pj= 0.40
sP 5% 0
NORTH
( 0 014.90K 12.56K 14.90K - EXPERIMENTAL a 's8.45K 9.24K 9.62K - MORRISON'S TEST
10.51K 7.67K 10.51K - POULOS-RANDOLPH a's
. ..
5.23K 3.53K 5.23K7.77K 8.76K 5.83K3.52K 0.37K 3.52K
3.36K 1.71K 3.36K7.19K 3.48K 4.47K
10.51K 7.67K 10.51K
AVERAGE LOAD PER ROW GROUP DEFLECTION
EXPERIMENTAL a's 0.46 in.
14.12K MORRISON'S TEST 0.34 In. "9.10K9.56K POULOS-RANDOLPH ct's 0.52 in.
4.66K7.45K2.47K
2.i1K
5.04K .',:"'
9.56K
Fig. 4.46 Distribution of load and deflection of group for
Cycle 100, loading north, group load = 64.83 k
a,' .'. '
15 3
.*& ~ *, .** '*' *'*' . .*.. -. . . . . .

t , M, : . M k' . , , = ..: ; , .. .. N '. , , * . , _- .L . . . . . ... . ' ,
V
CYCLE 100 AVERAGE LOAD PER PILE 6.49KLOADING : SOUTH -GROUP LOAD : 58.48K P 0.:0.37
Sp5%
NORTH
3.12K 1.63K 3.12K EXPERIMENTAL a'4.55K 4.22K 5.81K MORRISON'S TEST9.48K 6.92K 9.48K - POULOS-RANDOLPH a 's
4.87K 3.34K 4.87K5.29K 4.20K 5.85K3.18K 0.33K 3.18K
o013.19K 11.10K 13.89K7.96K 10.02K 10.57K -
9.48K 6.92K 9.48K
AVERAGE LOAD PER ROW GROUP DEFLECTION ,
EXPERIMENTAL a's 0.37 in.
2.62K MORRISON'S TEST 0.44 in.4.86K 08.63K POULOS-RANDOLPH Ws': 0.42 in.
CD4.36K5.11K2.23K
1 2.7.1K9. 51 K8.63K ,. ,
Fig. 4.47 Distribution of load and deflection of group for
Cycle 100, loading south, group load 58.48 k
154SI
.. . . . . . .. N/ v'V /V ~ V ~ V V V V V V~~

Table 4.1
Load by row, as per cent of total, anddeflection for nine-pile group, loading south
Row Experimental Morrison's Poulos-' Load Test Randolph a's
CYCLE 1
Front 56 % (0.50) 48 % (0.45) 44 % (0.46) S
Second 22 % (0.50) 26 % (0.45) 11 % (0.46)
Third 21 % (0.50) 24 % (0.45) 44 % (0.46)
CYCLE 100 -
Front 65 % (0.37) 48 % (0.44) 44 % (0.42) , yy
Second 22 % (0.37) 26 % (0.44) 11 % (0.42)
Third 13 % (0.37) 24 % (0.44) 44 % (0.42)
Note: Deflections shown in parentheses in inches
155
% N*- *' -

O-factors provided a better prediction of the pattern of
distribution of load than did the elasticity-based factors.
The design procedures available to analyze pile groups
for lateral loading are categorized into two types: the
elasticity-based models and the modified load-transfer
methods. Both types were seen to reproduce gross overall
group behavior with only moderate errors when carefully
calibrated by use of results from the testing of an
instrumented single pile. However, none of the methods -
properly predicts the distribution of load to the piles. No
conceptual models are available which can represent shadowing
and load bias in terms of leading vs trailing rows.
Elasticity-based models predict the distribution of the load
but the prediction is greatly in error. Modified loid- "
transfer methods have no provisions at all for predicting the
distribution of load to the various piles in the group.
Also, these empirical prcf.edures were developed for soft
clays and were not intended for use with sands.
All of the methods which have provisions for calculating
hpndina strpses were not conservative in this regard,
probably due in large part to the problems of distribution of , ,.
load. The methods also indicated incorrect depth to maximum •
156
% %-a-. .~. ... . . ..
moment due to reduced soil resistance near the ground
surface. IR
The errors in prediction of response to static loadingtended to be magnified somewhat for cyclic loading. Although
cyclic leading was less of a concern for groups in sand than
for groups in clay, the conceptual models used in these
procedures do not inspire confidence for design. The
elasticity-based Focht-Koch procedure presumes cyclic soil
response for piles in a group to be the same as that for
individual piles, while the modified load-transfer methods
limit soil response to that of a large imaginary pile .
encompassing the group. Neither approach predicts very well
the behavior that was observed.
The method using experimental interaction factors seems
to be promising. However, further studies covering a variety ..
of variables such as pile spacing, soil density, and pile-
head connection are needed before this method can be
confidently used in design.
157
%.,..--.4
CHAPTER 5
USE OF PRESSUREMETERS AT THE TEST
SITE FOR PREDICTING THE BEHAVIOR OF SINGLE PILES
INTRODUCTION
The pressuremeter has been recognized as a versatile in-
situ instrument for subsurface measurement and can be
employed in virtually any type of soils. The instrument is
showing promise as a means of obtaining p-y curves from the
results of field tests. A series of pressuremeter tests were
conducted by Dr. J. L. Briaud, Texas A & M University, and
his research team during 1985 to 1986 at the test site at the
University of Houston with the view of making predictions of A.pile response that could be compared with observed response-
(O'Neill and Dunnavant, 1984; Morrison and Reese, 1986). The .
soil-resistance curves were derived from pressuremeter
measurements and the pile behavior was predicted with these
derived p-y curves.
Two types of pressuremeters were used in this study; one . .
is the preboring pressure (PBPMT) (Fig. 5.1), and the other
one is known as the cone pressuremeter (CPMT) (Fig. 5.2).
Both pressuremeters are composed of a portable control unit
and a probe with a single inflatable cell. The primary
difference between these two is the insertion method. For
the preboring pressuremeter, a borehole is drilled and the .
159
- .a--." A

P* %
Fig. 5.j Scet fte.
ng Pressuremeter Odej
160
J-G%
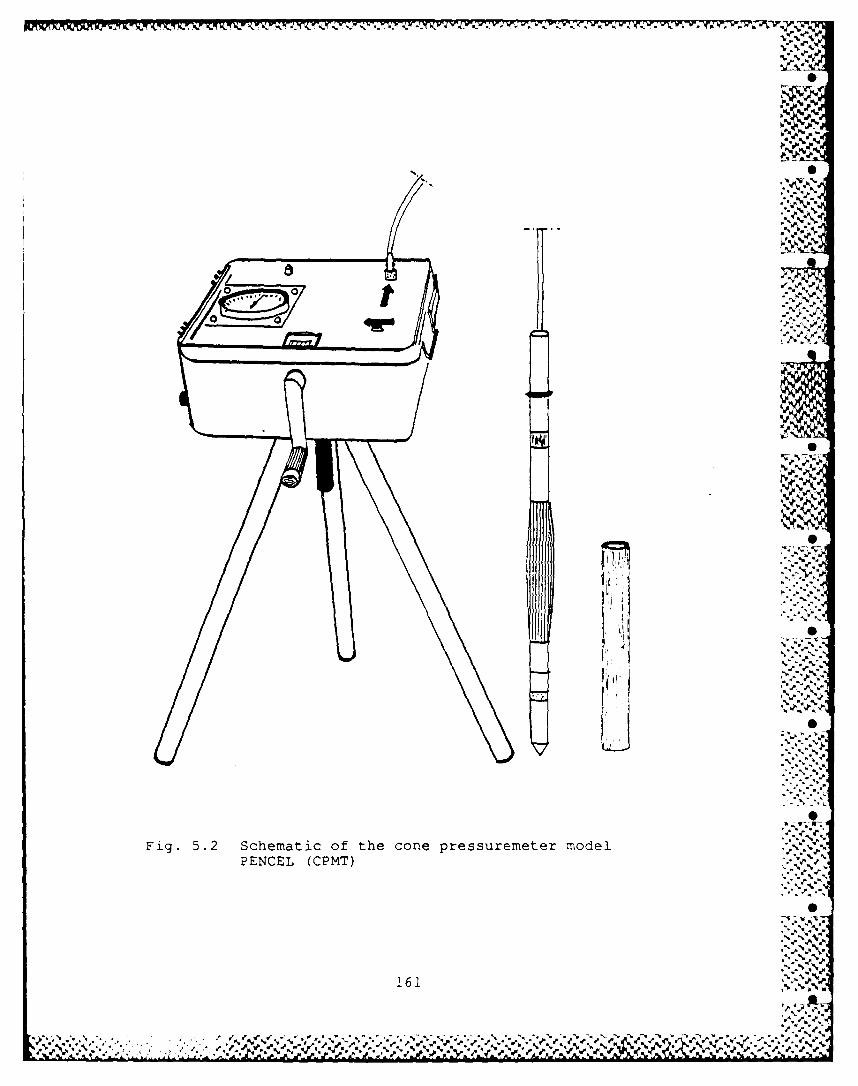
-ii
N. V
VP .p
00
% ,. % % %%
% %
z-".%%
. ...
r %k16 1 ," ?
L1 .' .%

- -. .D .
- - -,-
pressuremeter probe is inserted down to the test depth. For
the cone pressuremeter, the probe is either pushed into the l
soil at a constant rate or driven with a hammer.
L --
This chapter will summarize the methods of development 0
of p-y curves directly from pressuremeter data, the
procedures for in-situ testing, the measured soil response,
and the comparison between the predicted and the measured 0
pile behavior.
BASIC THEORY FOR SOIL-RESISTANCE CURVES 0
Sketches of a single pile subjected to a lateral force, "-.
Q, a vertical force, P, and a moment, M, are shown in Fig. .
5.3 and can be used to solve for the static equilibrium of
the pile. The stress components on an element abcd are the
radial stress Orr, the shear stresses Tro, Tze, and t , the
normal stress, Gzz and the tangential stress (70(. F r long
piles with a length-to-diameter ratio larger than 3, the soil
resistance is due mainly to the radial stress Grr and the
shear stress Tro.
.P 2 ""
The frontal resistance Q i the surface friction
resistance F (Fig. 5.4) per unit length of a pile with a
radius of ro can be computed by integrating the radial stress ..-
arr and the shear stress Tro along the pile surface. The unit 0
frontal resistance, Q, due to Grr is %-.
162. . . . . . . . . . .. . . . . . . . . . . . . . .. 4 . .
. .. P k i A. . ....... .. --- ,.

///..?//-"" ,, F --'-ID(SEE INSERT 1) , ,
T. . - -
, I
rN
Secion A-A ,- *
zS
bINSERT 1
rrzrCA
Z "-. %.
I a -.' *h
rr
C r. . &
d, 0 ',r
e ~ ~ l b r u m - -- - o f s t r e s s e s o n a p i l e ( a f t e r t ..Fig. 53Staticeqibru SDigioa, et al., 1981)
163
|rIl'l'i 1 i l l i ' ) z 0 II • • . .

* FRICTION FRONT RESISTANCE ,.."-JA r'.1
r de0-- .%
C
Shear force per unitlength of pile
(a) (b) (c)e
Fig. 5.4 Distribution of friction resistance and frontresistance (after Briaud, et al., 1983b)
SCALEPRESSURZ akPa) 1 METER 'A47.3Tu, RR,2 (MAX) ; .
200 100 0 0 100 200',' IERY
SIDE (c)--3.1T ,*. FRICTION [Lt.
SRD 28.6\V* __ B._ _ _, RR (' AX ) .. -"-SUFCE.- . L .C MEASURED
(a) O.OT FRONT REACTIONHORIZONTAL LOAD
80
" " 60".°
20
5.5T 0 0 2 4 6 8 - -T--'
GRO,"UND LINE DEFLECTION (CM) 0
Fig. 5.5 Texas A&M University bored pile load test:(after Kasch, et al., 1977)
%-.1 % %

I L . -- -%
-'.- 4.
r cos 0 dO 5.1
(rr o %.f5.2
Similarly, the unit friction resistance, F, due to TrO is
2
F sinOdO5.F rO r0.
2S
For a linear elastic soil, Baguelin et al (1978) gave
expressions for Orr and TrOas follows.
P "%, A p
csinoO, 0 5.4 •r ,max r @,max 2 ro
0
.'.. substitution of expressions for (Yrr and Tre into Eqs. 5.1 .--
~~,4, ". " ,.-
nd 5.2 leads to the following expressions: ,.
sine, t. 5.4
165
--% " ' %'mx " .,- " ". .. "

5.5
r r ,max 0
and %
U
F T 2r .1L 5.6r mrax 0 4
The total soil resistance p in force per unit length of
pile for a horizontal movement of the pile element is found
from the addition of the front resistance Q and the friction
resistance F.
The O-_ Curve and the Pressuremeter Curve
A test was performed with an instrumented pile (see Fig.
5.5) in order to verify the derivation shown above. Figure
5.5a shows the pile with the resisting forces, and Fig. 5.5b0
shows the load-deflection curve. Figure 5.5c shows a cross-
section of the pile and the location of three pressure cells
(A, B, and C) . The theoretical distribution of the
elementary forces dQ as shown in Fig. 5.5c was found to match
the measurements recorded on the three pressure cells. This
validated the use of Eq. 5.5, provided (rr(max) could be0
obtained. Pressuremeter tests were performed in a prebored -..
hole and the pressuremcter curve that was obtained is shown
in Fig. 5.6a. The front reaction curve was computed using
Eq. 5.7 and the curve is compared with the response from the
166
S.--.. . -...........-..- % "% -% , " -% . ~ %'%" J " .- , ' %y ".%
% % d
1 *%

pressure cells which measured arr(max) on the shaft and Fig.
5.6b shows the comparison. From the pressuremeter, p is the 0
cell pressure (arr(max)) and y/R is the lateral movement of
the cell y divided by the pile radius R. Figure 5.6b shows
very good agreement between pressure cells and pressuremeter
response (Smith, 1983). This tends to prove that the curve
obtained from a pressuremeter test, performed in a prebored
hole, simulates well the reaction of the front pressure cellfor a bored pile. In the proposed method the front .%
resistance will be obtained as follows:
Q(front) = p(pmt) * b(pile) * S(Q) 5.7
w h e r e .
Q(front) = the soil resistance due to front reaction
(in force/unit length of pile),
p(pmt) = the net pressuremeter pressure,
b(pile) = the pile width or diameter, andS(Q) = the shape factor 1.0 for square piles
= n/4 for round piles.
The lateral deflection of the pile can be obtained as
follows : % .0~R p i e )5 .8y(pile) = y(pmt) R (p m) Iv
R (pint)
2-. -Aw h e r eeI
y(pile) the lateral deflection of the pile,
R(pile) = pile radius,
167 _
v %'*

pa
P •A
PRESSUREMETER (kPa)CURVE N
(a) 0100
P O t A .. .
00 100 200 3"00 - V(CM3 1FRONT REACTION p(pmt)CURVE (kPa)
200 . RANGE OF CELL(b) 100 -RESPONSE
Q - p ( p m t ) B ( p i l e ) S ( Q ) 0 1_,_ ,_ _ _ _-- -Y0 4 8 12 R
FRICTION RESISTANCE T(kPa)CURVE20 200.•
(C) 100
F * ' B (p ile ) • S (F ) 0 ____,___y______ _0 4 8 12 R N -,
Fig. 5.6 Obtaining the Q-y and F-y curves from thepressuremeter curve (from Braiud, et al., 1983b)
,' . ' ,4"
168
% % % %% % %-

y(pmt) increase in radius of the soil cavity in 6
the pressuremeter test, and
R(pmt) initial radius of the soil cavity in the
pressuremeter test.
* •.
If a pile is driven and fully displaces the soil, one would
expect that the resulting Q-y curve would be different from
the one for a bored pile in the same soil. In the case of a
bored pile, preboring the hole for the pressuremeter seems to
be appropriate; in the case a closed-end pile that is driven,
it may be more appropriate to drive the pressuremeter in 0
place. Alternatively, the hole can be bored, the
pressuremeter expanded a first time to simulate the driving
of the pile, and then expanded a second time. The Q-y curve
for the driven pile is derived from the reload portion of the A'
pressuremeter curve. This procedure has not been confirmed
directly but has been proven reasonable by the gcoc
performance of the method in predicting the behavior of
driven piles.
The curve that is shown in Fig. 5.6c will be discussed
in the next section. .-
The F-y Curve and the Pressuremeter Curve .
Based on the previous theoretical and experimental
considerations, the friction on the sides of the pile
according to the proposed method is: S
169
% % . . . . . . .. .
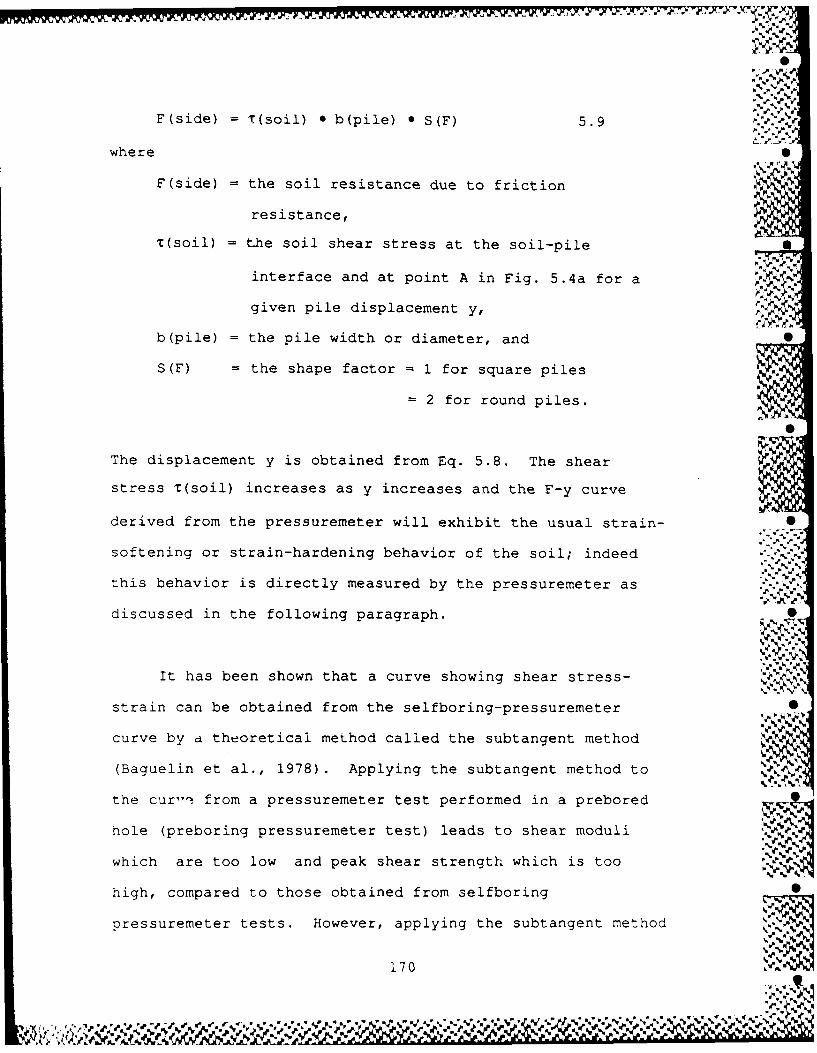
% %.% .1
F(side) T(soil) * b(pile) 0 S(F) 5.9
where ,
F(side) = the soil resistance due to friction
resistance,
T(soil) = the soil shear stress at the soil-pile
interface and at point A in Fig. 5.4a for a
given pile displacement y,,
b(pile) = the pile width or diameter, and
S(F) = the shape factor 1 for square piles
2 for round piles.
e
The displacement y is obtained from Eq. 5.8. The shear
stress t(soil) increases as y increases and the F-y curve
derived from the pressuremeter will exhibit the usual strain-
softening or strain-hardening behavior of the soil; indeed-. %
this behavior is directly measured by the pressuremeter as
discussed in the following paragraph.
It has been shown that a curve showing shear stress-
strain can be obtained from the selfboring-pressuremeter 6
curve by d theoretical method called the subtangent method
(Baguelin et al., 1978). Applying the subtangent method to ,.
the cur-'. from a pressuremeter test performed in a prebored
hole (preboring pressuremeter test) leads to shear moduli
which are too low and peak shear strength which is too -
high, compared to those obtained from selfboring 0
pressuremeter tests. However, applying the subtangent method
170
*~ ~ %'.~

0
to the reload curve from a preboring pressuremeter test (Fig. ..
5.6a) leads to shear moduli comparable to selfboring shear .
moduli. As a result, in the proposed approach, the reload
portion of the preboring pressuremeter curve is used to
obtain the T(soil) versus y(pmt)/R(pmt) curve as shown in Fig. --
5. 6c.• • . Z. m-
Critical Depth S
The ultimate soil resistance against a pile that is
loaded laterally is dependent on the depth below the ground
surface, with the minimum value occuring at the ground
surface. The analytical expressions that have been derived
for the ultimate soil resistance reflect, thus, two different
modes of behavior: an upward and outward movement of the soil
near the ground surface, and a flow-around movement at a
considerable depth below the ground surface. The depth at .. ,
which the analytical expressions yield the same ultin.ate soil .
resistance is called the "critical depth." The results from
the pressuremeter test must be adjusted to reflect the depth
at which the test was performed. -,
A study was made that led to a correlation between the
critical depth and the relative rigidity of the pile-soil -
system. The relative rigidity RR is defined as follows .
(Briaud, et al 1983a).
%
171
• ... , ..• . . o . ,, . . • . •-o.- -.. ,

AS
1 EIl,
RR 5.10P I-L
where
b pile diameter,
E = modulus of pile material,
I - moment of inertia, and
PL = limit pressure.
Figure 5.7 shows the results of a study (Briaud, et al.,t
1983b) that gives a correlation between the critical depth Dc
and the relative rigidity RR. A further study by Briaud, et
al. (1983b) led to the development of Fig. 5.8 which shows
the value of the reduction factor a as a function of the
relative depth z/Dc. 4ith a value of a, the F-y curve can be
reduced if the pressuremeter test were performed in a zone
above the critical depth.
In addition to the p-y curves being affected by the
depth below the ground surface, Baguelin et a] (1978) noted
that the results from the pressuremeter are also affected if
the test were performed in about the top one meter of the
soil. A study by Briaud, et al (1983b) led to the
development of Fig. 5.9 which shows the reduction factor 1 as
a function of the critical depth for the pressuremeter. The
critical depth for the pressuremeter zc is taken as 30
pressuremeter radii for clay and 60 pressuremeter radii for
172

E - MODULUS OF PILE MATERIALI - MODULUS OF INERTIA OF PILE
-l - NET PRESSURZMTER LIMIT PRESSURE
i - PILE DIAMETER OR WIDTHD = PILE CRITICAL DEPTH
8.J
= CLAY SABINE
S6- x SILT PLANCOET (H PILE)LAKEAUSTIN
o SAND
T E X S A M KPL A N C O E T (C A I S O N4. MUSTAG -.- OCK & DA 26
0 * s. a oR t a-, ai
0 2 4 6 8 10 12 14RELAIVE IGID 0E-
Fig. 5.7 Pile critical depth versus soil-pile relative 'rigidity (from Briaud, et a]., l983b) %
*MNO
TC T (C' -I.'
SCOHESIVE b, k 0. COHESIVE.. k""" ':._..-
TEA AI 0 t I I I~~O.6 ~, 0.6SO EINE
'08 0
S1 0 2 10 12 1
,''..A m'
Fig. 5.8 Pile reduction factor Fig. 5.9 Pressuremeter reduction(from Briaud, et al., factor (from Briaud, et .a-.-1.3"
1983) al., 1983b) i0.2- ,% " 0.2 -
E_, "2IF~.
' COHS IV
0.4~~ -,04- OHEIV
COHESIVECO N _.',-E 'ON-.S\0.6 -"06"OHEIOLE

sand. If the pressuremeter test were performed above the,. °2 ) .,
critical depth, the factor should be used to correct the
pressuremeter curve. .. .
PROCEDURES EMPLOYED AT TE TEST SITE
Tests with the preboring pressuremeter were conducted at
close spacings near the ground surface and down to a depth of
approximately 20-pile diameters. For the cone-pressuremeter
tests, the cone was pushed at a constant rate of penetration
of 0.1 in. per second. If the cone could not be pushed into S
a stiff layer, it was penetrated with a 27.9 lb hammer
dropping from 4 ft above the top of the cone until the
specified depth was reached.
The cycling of the pressure applied to the
pressuremeters was performed either between preset values of S
volume to be injected (volume-control tests) or preset values
of pressure (pressure-control tests). Cycling between preset
volumes was chosen when modeling the response of piles where S
the displacement was controlled, as were the Houston tests.
(Cycling between preset pressure values would have been used
had the load been controlled).
-. ,%When the probe was in place and the control unit was
ready for reading data, the pressure -,as then injected to the ,
probe. The probe was first inflated to about 25% of the
174
It..-

limit pressure. The limit pressure PL is the pressure
reached when the volume of the cavity equals two times the S
initial volume. At that injected volume Vcp and pressure
Pcp, the volume was held constant for a period of i5 seconds.
Then, the probe was deflated to a slightly positive pressure
Pr, equivalent to approximately half of the pressure Pcp.
The injected volume Vr, corresponding to the new pressure Pr, N.
was maintained for another period of 15 seconds. The probe
was then reinflated to the same injected volume Vcp in order
to complete a cycle (Fig. 5.10) . A total of one hundred
cycles were performed between Vcp and Vr. The period of all
cycles was 30 seconds. After the first series of test was
finished, a second series of 100 unload-reload cycles was .
performed with the pressure being increased to approximately 0
50% of the limit pressure. A third series of 100 unload- "P
reload cycles was performed after increasing the pressure to
approximately 75% of the limit pressure. 0
More detailed and background on test procedures for this
method can be found in Briaud, Smith, and Meyer (1983b) . -
PROCEDURES FOR CONSTRUCTING p-y CURVES
Staticr Loading
The data correction for directly measured pressuremeter .
curves is important for obtaining reliable soil-resistance -
curves. The initial pressure reading, Pi which was taken
175 *%.

V.Y . "
% '.
0
4J
s-I0
0 E
:n0) A
44
P0-
t -,.- - -d
with the probe simply supported in the air, may not equal to %
zero due to temperature variation or other system errors. S
The hydrostatic pressure, which is equal to the unit weight
of the system fluid multiplied by the difference in elevation Vo
between the gauge and the pressure cell, is not included in
the pressure-gauge reading, and must be added to each value .* ..
recorded during the test. Because the control system is not
entirely incompressible, a volume calibration was necessary. 0
The membrane-resistance calibration was also important to
determine the pressure actually required to inflate the probe
in the air to any given volume. The detailed correction for •
raw data is described in original reports. The procedures to
derive p-y curves by use of the pressuremeter method are
summarized in the following. 0
1. Correct the pressuremeter curves for membrane V.-'
resistance, system compressibility, and effects of 0
the pressuremeter critical depth.
2. Obtain the front reaction curves (Q-y) by using Eq.
5.7 and 5.8. and together with the pressuremeter 0
curves (Fig. 5.10) obtained from Step 2. It is
noted by Briaud et al that the reload pressuremeter
curves should be used for driven piles. S
3. For any test within the pile critical depth apply
the proper reduction factor to obtain the true Q-y
curves.
177
- . .. . .-. , - - - .- . . . - . . -. . - . - . , ,.j .. ,, -, "_-, ' ",_ . - ," % ,,-, % % ' % - % * ", % .".. . ..- % '' -' -
* * ~J U? . . :%o' fU PU. U . 1 * 41 ~ ~ 'US. '~~~~~ %P'~PU P~ - " ''

1" 79 EXPERIMENTAL RESEARCH INTO THE HANVIOR OF PILES AND 3/3PILE GROUPS SUIJECTE.. (U) ARMY ENGINEER HATERAWSEXPERIMENT STATION VICKSBUIG AS GEOEE..
UNCLASSIFIED L C REESE ET AL. JUN 66 HES/P/GL-6S-10 F/O 13/13
EhhhhhhhEl"",mmmmmm

iiil 1.0o ,. f~
111IIII"
UTION TEST CHART ,, 5 . 5,.
5* -.
-.., ,,-.,,-.
5, .- ,.,,_
_ •
• • • • • • • • • o • • • S.= ,,.-...,,. , . , . . . .. ,,. ,, ,, . .. .,,, , • w" ,".." ." ,,." ." ." ,,. ',,," - " , ,w- . ,,,- - ,. . .', w .' .'. - .- - , _,, _ , ,,'. ' ,' ,, ,,' _r_ ,., ". '_ _,P,,.,"." _. ,, _,,, .- ,," ",, 5%'.'-.' .,' ." ," ; ." " ,, .e ." .," " -" ," ." ,," ." " ." ,," ,," .. ." ,," ." .-" .''. .. ".. .. "w ".e
M
- .e.' ' ',.. '., ','w.,"' ," .,,",.-" .',"- % % . . -S; - ' - -. r" ", "",,'.," ","," "'"'-".K.-.,. ,' , -,. , -" " " ".' . .:, .,>:w ,w ,"', ,-'',',',,1 ,,'', 'w,, \ . ".,,%-. "
- .. " '.''.' .'.'." ".."w '. .'. .'. .". . " ". ",. ' "w " ,". . "," "," .-. "" "." ,,. '. -" , "w " - "" ", ' .- 'W-"W w,,'
',.,."",, '," '.'. " ' ,.", ,"-."[.,, - 'W "
-",-" - --- ,,--.

4. Obtain the friction resistance curve (F-y) by
applying the subtangent method to the reload S
pressuremeter curves and then using Eq.5.8 and 5.9.
5. Obtain the p-y curves by adding at each depth the
Q-y curve to the F-y curve.
Cyclic Loading
The method for cyclic p-y curves is an extension of the 5
method used for static loading (monotonic loading). The
difference is that in the case of cyclic loading the
resistance of the soil decreases as the number of cycles
increases. Soil degradation models are introduced into the
static p-y curves, derived from the above procedure, to
account for the degradation effect.
A degradation model, originally presented by Idriss et
al (1978), was used to study the degradation effects where 0
the number of cycles was less than 2000. Soil degradation is
determined by
=N 5.11G (1)
where Gs (1) and Gs(N) are the secant shear modulus to the
pressuremeter curve for cycle 1 and N respectively (Fig.
5.11). The larger the value of a, the larger the degradation S
-f Lhe soil stiffness with increasing number of cycles.
178 ~ ~~
fA Vr % %. %* % A- A .

Gs(1) -Gs (N)
7- b.-1
iRo
Gs'.p -a~
10100
CYCLE NUBR a
Fig. 5.11Cyclic dgraain aaetr efnto
Il
;~179
AA

A complex model (Makarim and Briaud, 1986) was proposed ,
where the number of loading cycles is greater than 2000. The
complex model is not shown here. The tests in Houston were V.
for less than 2000 cycles and only a few loads of relatively
large magnitude occur during an offshore storm. "
The following simplified procedures are used to derive S
p-y curves under cyclic loading.
1. Develop static p-y curves by following the
procedures described earlier. S
2. Find the average in-situ soil degradation
parameter, a, from the corrected pressuremeter
curves by using Eq. 5.11 if the number of cycles is 0
less than 2000. -
3. Calculate the cyclic p-y curves from the static p-1y
curves by multiplying the static soil resL .ance 0
Pstatic by the factor N-a.
PREDICTED RESULTS FROM PRESSUREMETER TESTS IN CLAY 0
The pressuremeter tests for piles in clay at the
University of Houston were conducted by investigators under
the direction of Professor J. L. Briaud in 1983, 1984, and
1985. Twelve cyclic tests were performed with the preboring
pressuremeter and 5 tests were perrormed with the driven or S
pushed pressuremeter. The results of the tests were analyzed
180

according to the procedures described briefly in the previous %
sections. 0
The results from the pressuremeter tests were employed
for the development of p-y curves which were then used for K
the prediction of behavior of the single piles under lateral
loading. A summary of the results of these studies for
static loading and for cyclic loading is presented in the
following sections.
Static Loading
Predictions of the static p-y curves of the 10.75-in.
and 48-in.-diameter piles were done by using the procedures
outlined earlier. The curves were predicted from the results 6
of the preboring pressuremeter (PBPMT), from the pushed-cone
pressuremeter (PCPMT)), and from driven-cone pressuremeter
(DCPMT)).
An example for one of the six sets of p-y curves that
were derived is shown in Fig. 5.12. The general shapes of
the other sets of curves are similar to those in Fig. 5.12
but there is some significant difference in the numerical
values.
The relatiozhipz between pile-hed load and deflection, .,
as predicted by the pressuremeter method, are shown in Figs S
5.13 and 5.14. As it may be seen, in general, the results
181
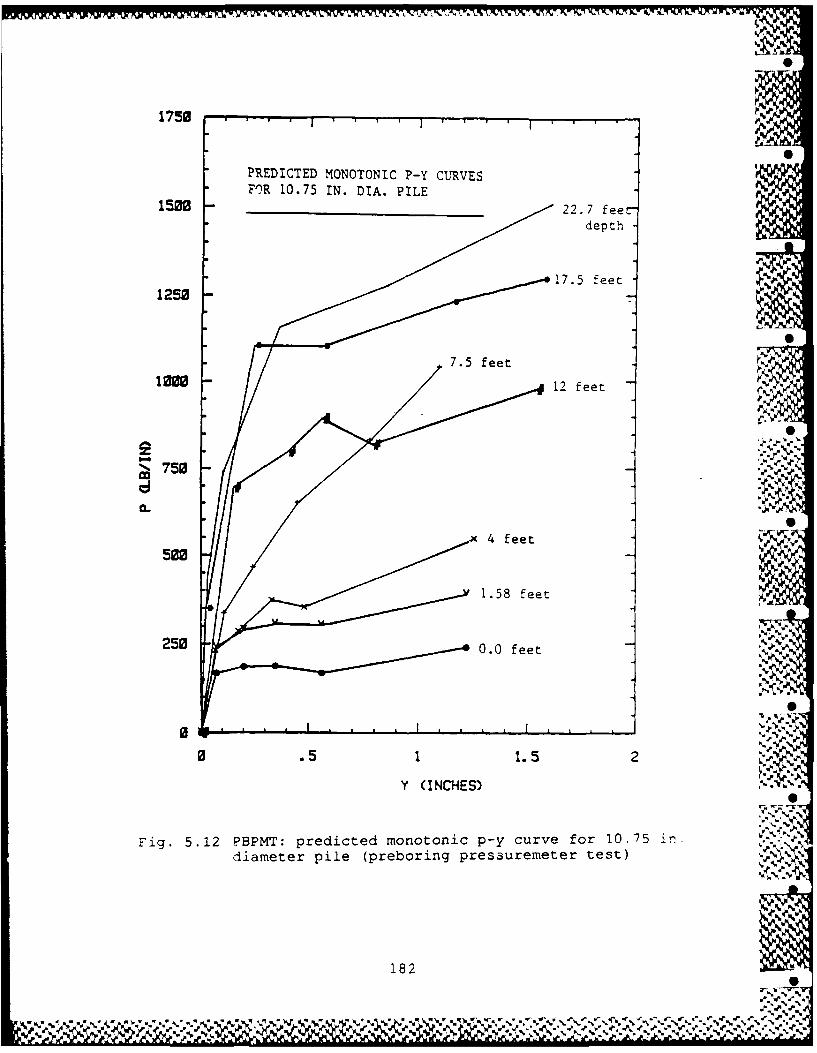
1750
PREDICTED MONOTONIC P-Y CURVESFO~R 10.75 IN. DIA. PILE
1500 _______________22.7 fee-
depth
17.5 fe-
1250
N. -
750
50 N
50
02
Y (INCHES)
Fig. 5.12 PBPMT: predicted monotonic p-y curve for 10.75 in.diameter pile (preboring pressuremeter test) %%
182
L- 11-V0
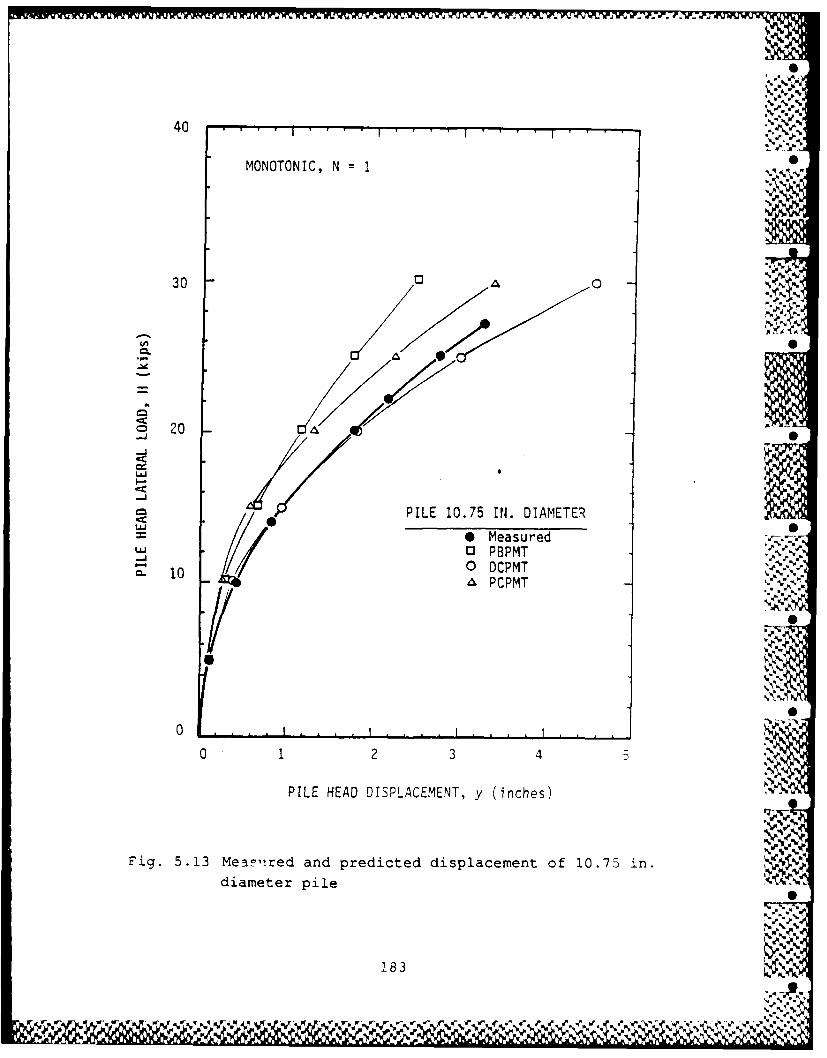
40
MONOTONIC, N 1I
30 A0
A'
20.
=0
PIL 107 N DAEE
0 P.E.075I..IMEE
00 1P2PMT
PIL 0A DIPAEET y iches)
Fig.~~~~~~~~ 5.3Mai n rdce ipcmt o 07 n//mee pile18
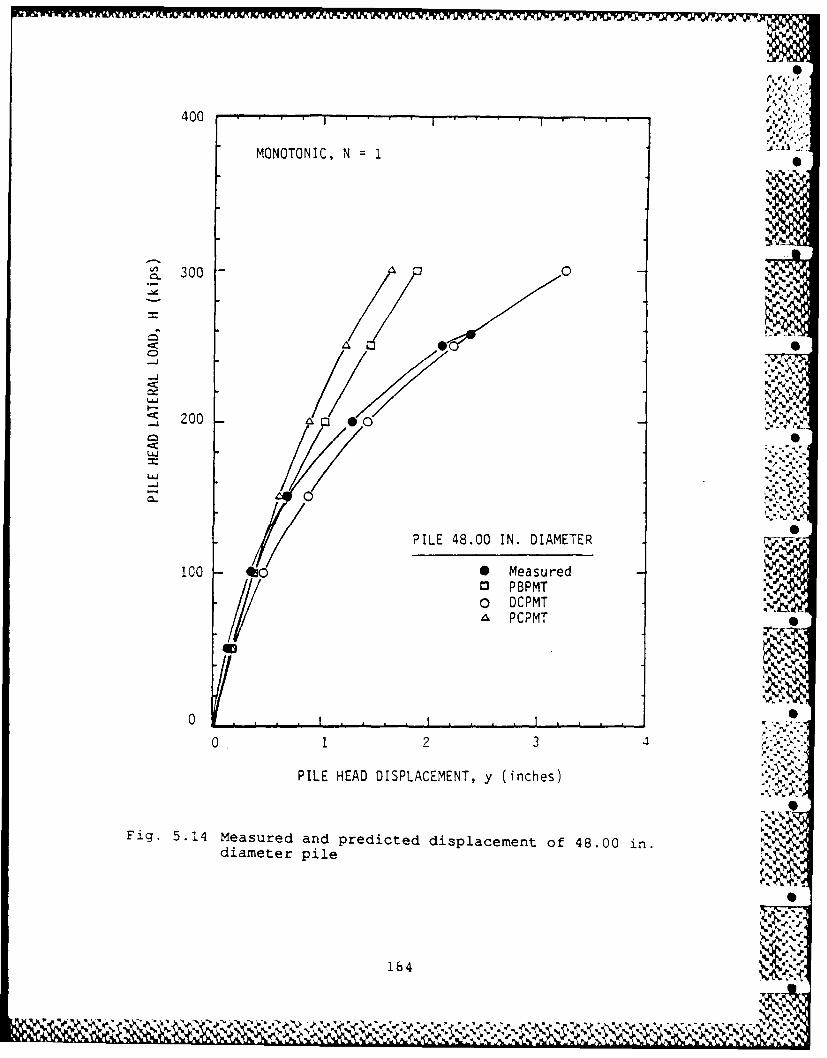
400 . . .
MONOTONIC, N 1 •
~.300 0
<
L.J200 A 0
... I .. . L. r
LI..:..I
PILE 48.00 IN. DIAMETER
100 • MeasuredC3 PBPMT0 DCPMT7 PCPMT •
400
0 1 2 3 4
PILE HEAD DISPLACEMENT, y (inches)
Fig. 5.14 Measured and predicted displacement of 48.00 in.diameter pile ' .
164
0'i' ,
& J. jI

IAbased on the pressuremeter tests have good agreement with the
measured data. The DCPMT gives better predictions for both S
piles, perhaps because of the similarity of the methods of
installation of the pile and tne pressuremeter into the soil.
Cyclic Loading
The cyclic p-y curves were calculated from the monotonic
p-y curves by multiplying the soil resistance by a factor of
N-a where N is the number of cycles and a is the soil
degradation parameter obtained from the cyclic tests. An
example of p-y curves from the PBPMT tests at a depth of 17.5
ft for the 10.75-in.-diameter pile is shown in Fig. 5.15.
Using the cyclic p-y curves derived from preboring
pressuremeter tests, the load-deflection curve for 100 cycles
for the 10.75-in-diameter pile is shown in Fig. 5.16 and
compared with the experimental curve. Similar information •
for the 48-in-diameter pile is shown in Fig. 5.17. As may be
seen, the agreement between the curves for the 10.75-in-
diameter pile is not very good with the pressuremeter under- 0
predicting deflection by a significant amount For the 48-..-
in-diameter pile, the loading of the experiment was stopped --
at about 125 kips. In that range of loading, the agreement S
between analysis and experiment is good. ..."-
185

_ ... %. .%
1500', . ,"%..
1350
monotonicN=
1200cyclic
A N - 10S1050
cyclicN- 100
''900
cyclicz N I000
750
500
MONOTONIC AND CYCLICP VS. Y CURVES
300 At 17.50 feet depth
For 10.75 in. Dia. File
• ikISO
0 2hii
0.5 1 1. 5 2 [%
DISPLACEMENT, Y (inches)
Fig. 5.15 PBPMT monotonic and cyclic p-y curves for 10.75 in.diameter pile at 17.00 ft. depth (degradationparameter a = 0.06) 0
%
186 I
or ?r W o r *r
% .,,'

300
304/
E-4*-
15/4A
/ fromepesrmete
00
% J,
15
0/
1z
10187
r%.r e
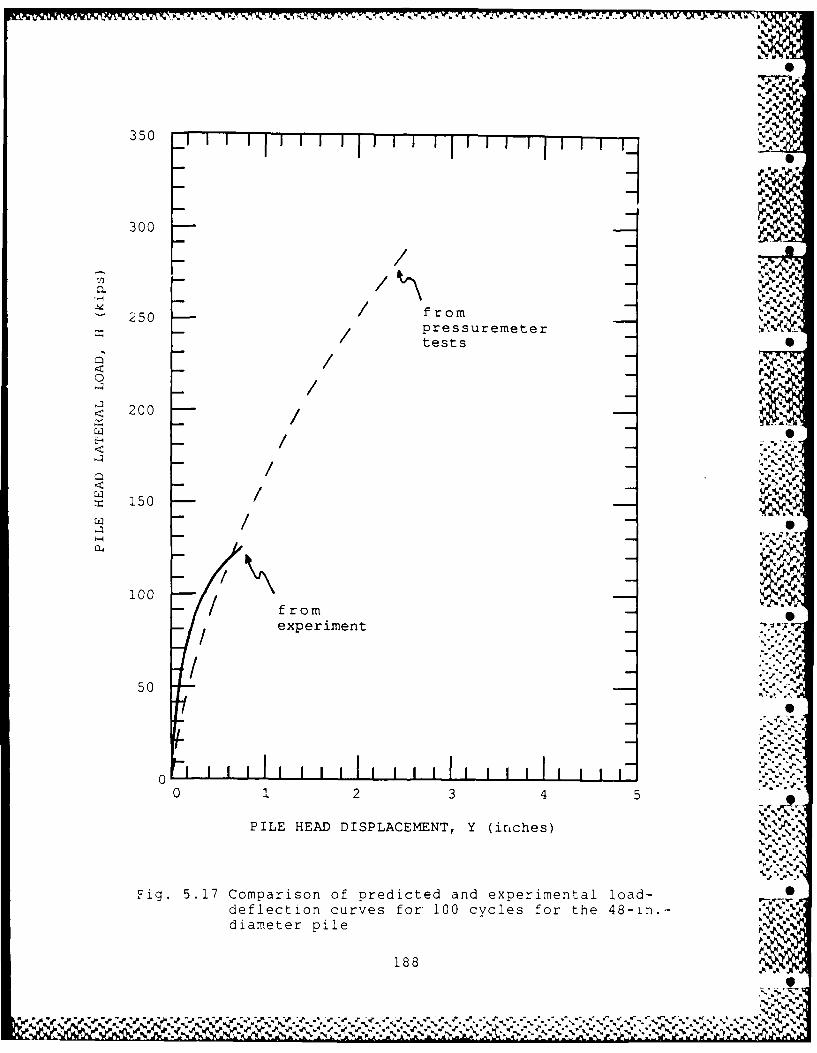
350
300 / @
/ from/ pressuremeter %
tests
15
< 200 / _' / -,-'
/ from
experiment
50
0 L0 1 2 3 4 5
PILE HEAD DISPLACEMENT, Y (inches)S5.'..f
Fig. 5.17 Comparison of predicted and experimental load- 0deflection curves for 100 cycles for the 48-in.-diameter pile%
188
'be i- jr r o r w 1 %

PREDICTED RESULTS FROM PRESSUREMETER TESTS IN SAND
In the spring of 1985, eleven pressuremeter tests were.. . -
conducted in sand at the University of Houston. As described
in the pile-loading test for single piles in sand, the top .. ,-..
9.5 ft of the original clay was replaced by fine sand. Three
different pressuremeter-insertion techniques were used as
listed in Table 5.1.
Static Loading
Development of the static p-y curves of the 10.75-in.-
diameter pile was performed by using the same procedures as
for clay. Three sets of p-y curves were developed for static
loading, one for each of the insertion techniques. An
example of one of the sets of p-y curves that were derived is ...
shown in Fig. 5.18. There is a considerable disagreement
betwee: the sets of p-y curves, probably because of -he
difference in the degree of disturbance of the sand from each.4.
of the insertion techniques.
The predicted load-deflection curves based on the
pressuremeter method and the measured load-deflection curve
for static loads are shown in Fig. 5.19 to Fig. 5.21. For .,
the pushed and driven pressuremeter tests, the p-y curves .. ,
were obtained by using the first-load pressuremeter-test -
curve. The large discrepancy between these predictions and
the measured response (Fig. 5.17 and 5.18) indicates the :u
189
, --, " .'' ... g . . ¢ ¢.;."1: '. .". " ""...". .'. ...."" . ."""?"%i".';./ 'A .' '', '' ' ' '.U :¢? ;'' " '. " ; "; '',,.... .. - , , , . ,, , _ , : :: .. ..'", .':., .".' ' _ -.:.' --,A.' -Lis." :"'

Table 5.1
Pressuremeter test performed at the Universityof Houston Foundation Test Facility Sand Site
Borehole Insertion Pressuremeter Type DateNumber Method
T3 Pre-bored PBPMT / TEXAM PMT 4 / 85
T4 Pre-bored PBPMT / TEXAM PMT 4 / 85
P2 Pushed-in PCPMT / Cone PMT 5 / 85
D1 Driven-in DCPMT / Cone PMT 5 / 85D3 Driven-in DCPMT / Cone PMT 5 / 85
Z'° '?
190
'. -,.
.5" *5" .i.
.- ," • ,. . . . . pw
° , . .. - - . . .. . " " °.- =- .- - . . - - - e - - - % - - . . . . " " " ." " ,4 ,L . J • ,
-. " ._." _ . -..- " ._'n'.- " ".'-""'.': .'." .'- '.. .' . - .-. ' ,- ; ." " " ,'.:","v . '% .%i-- " ,'ik'*5*5,." ' ,*5",
- - '- s~o~d ~li ~ . . ,, illi i
m mi-. i.i
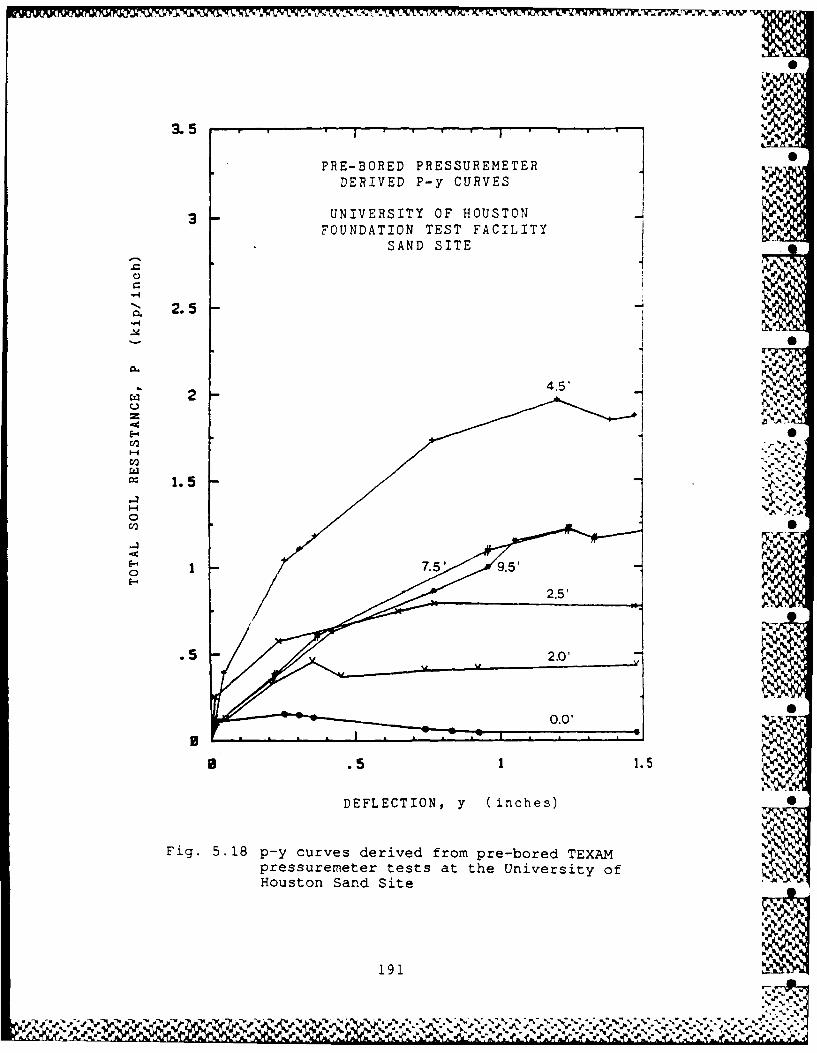
3.5 1
PRE-BORED PRESSUREMETERDERIVED P-y CURVES
3 UNIVERSITY OF HOUSTONFOUNDATION TEST FACILITY
SAND SITE
2.5 -
1..5
2.0'
1.5 ..5
Houto SadSt
.5.

%""-.
35
'NPREDICTED MONOTONIC RESPONSECOMPARED TO MEASURED RESULTS
PRE-BORED PRESSUREMETER
30 %
10.75 inch PIPE PILE
200
25 4
_15
//0 Measured Response, First "
Direction of Loading .
5 /Measured Response, Second .,~Direction of Loading
Predicted Response
TOP HORIIZONT'AL DISPLAC'EMENT (in), ., ,.
i. -0', .
Fig. 5.19 PBPMT: Predicted monotonic response of the sinle,,..,pile compared to the measured response
192
w2 *r-- - -
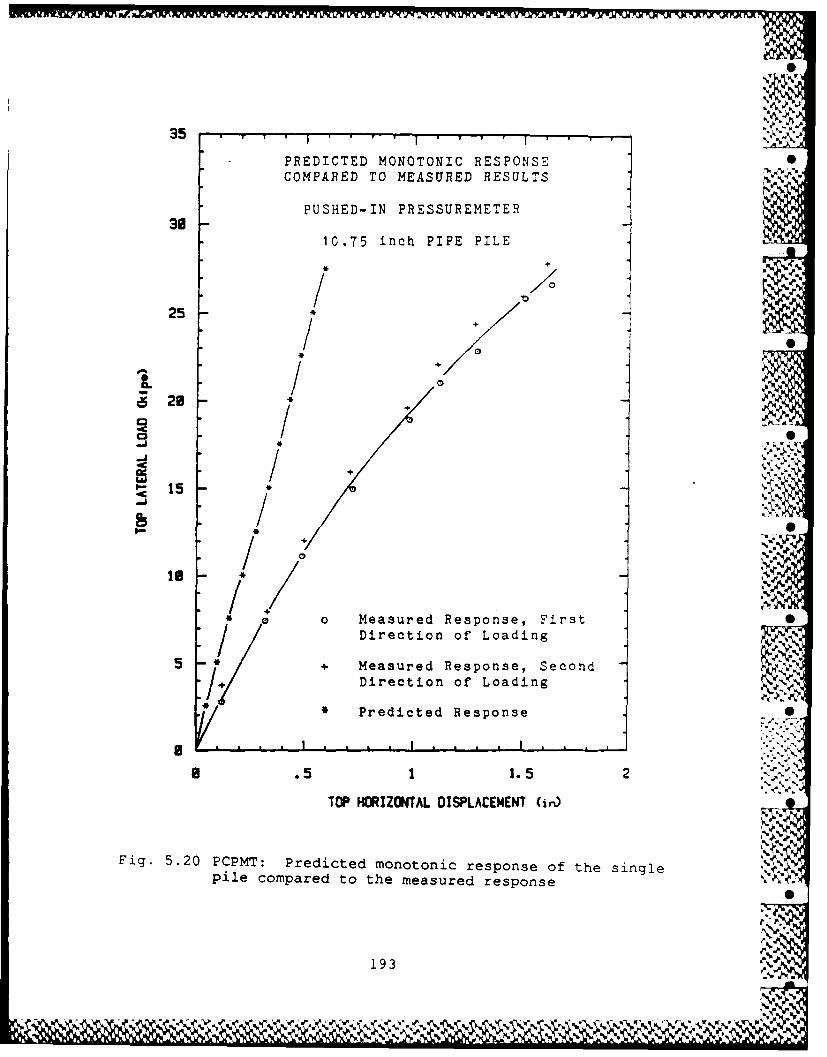
35
- PREDICTED MONOTONIC RESPOINSE1COMPARED TO MEASURED RESULTS1
PUSHED-IN PRESSUREMETER
10.75 inch PIPE PILE
25/
I +
200
QI
Prdite Repos 0
Fig.~ DirP~m:Prdce ontioni oesLodngeo h snlpil copae totmeasured response S on
TONCIWTLDSLACHN (i

PREDICTED MONOTONIC RESPONSECOMPARED TO MEASURED RESULTS
DRIVEN-IN PRESSUREMETER39
10.75 inch PIPE PILE
25 / 0/ 0/, /
5 + 0 R
/0
Direction of Loading5 + Measured Response, SecondI; Direction of Loading
/ Predicted Response
.... I.... I , , ,I,,,. .. --
*.5 1 1.5 2
TOP HORIZONTAL DISPLACEMENT (in)
Fig. 5.21 DCPMT: Predicted monotonic response of the single
pile compared to the measured response
194
W,*4 W,
' . V ~~~~~V .x~.~4~-.- .
= -
compaction of sand around the pile did not simulate the real
conditions around a driven or a pushed pile. However, the •
closeness between the predicted response by preboring
pressuremeter test and measured response implies the
compaction of the sand around the pile simulated more closely
the conditions around a bored pile. $
It appears that, in general, the predicted curve has a •
stiffer initial response. It should be noted that the
pressuremeter tests were conducted after the loading tests
had been completed; therefore, the densification in sand due
to previous loading tests could provide a high initial
modulus.
Cyclic Loading
The degradation parameter, a, based on the degradation
model-I is 0.26 for the preboring pressuremeter test, 0.23
for the pushed-cone-pressuremeter test, and 0.15 for the
driven-cone-pressuremeter test. These parameters were
applied to the static p-y curves to develop sets of cyclic p-
y curves in sand. The newly developed cyclic p-y curves for
the top sand layer and the p-y curves measured by strain-
gauge method for the lower clay layer were then used to study -
the pile behavior as shown in Fig. 5.22 through 5.24. :4
As may be seen from an examination of the figures, there
is a considerable difference in the results obtained from the P.,I
195
I4 PI M
LA 4"%P *-'- %

35
PRE-BORED PRESSUREMETER S
PREDICTED CYCLIC RESPONSEFOR THE 10.75 inch PIPE PILE
125
00
6196
.. ..":S:%
'5".- ,.
. " S ".
9 . 5 ! 1. 5 2 .. ,-
Fig. 5.22 PBPMT: Predicted cyclic response of the singlepile '
196 '

PUSHED-IN PRESSUREMETER
PREDICTED CYCLIC RESPONSEFOR THE 10.75 inch PIPE PILE
1 '%25
L1 100628
125 . p.is.
5
.5 1 1.5 2.
TOP HORIZONTAL OISPLACEMENT (in)
Fig. 5.23 PCPMT: Predicted cyclic response of the singlepile
197
- ~~e \ *,l*%E**Vr

35% .. . .
DRIVEN-IN PHESSUREMETER
PREDICTED CYCLIC RESPONSE30 FOR THE 10.75 inch PIPE PILE
25
-i1 100
~20
15
100
5
0 .5 1 1.5 2TOP HORIZONTAL DISPLACEMENT (in)
Fig. 5.24 DCPMT: Predicted cyclic response of the singlepile
198I

-1IW r* - 7 -.
three different types of pressuremeters. Also, for a given
lateral load, the increased deflection due to cycling is S
significant. For 100 cycles of loading, the predicted
deflection for a given load is in the order of twice ds much
as that for the static case. The results for cyclic loading
of the pile as predicted by the pressuremeter method are in
sharp contrast to the results from the experiment, not -.
repeated here, where the increased deflection due to cyclic 0
loading was relatively small.
CONCLUDING COMM(ENTS
The results of pressuremeter tests for piles embedded in
clay and in sand conducted by Dr. Briaud and his research
team have been summarized briefly in this chapter. Based on
the results presented, the following conclusion can be drawn.
1. The pressuremeter method in general gave a good ..
prediction of pile behavior in clay or in sand for static
(monotonic) loading when soil conditions around the pile and
the pressuremeter were judged to be the same. Thus, the
method of inserting the pressuremeter is important and shouldbe such to affect the natural soil conditions in the same
manner as the installation of the pile.
ell -" P.s.
2. For cyclic loading in clay, the pressuremeter method ,
yielded a pile response that was reasonably in agreement with
the results from experiment. The pile behavior predicted
199
~ 'r %V- %W ~.. ~ ~-
0
from the driven pressuremeter tests was in best agreement
with the measured results. S
3. In regard to the behavior of the 10.75-in.-diameter
pile in sand under cyclic loading, the pressuremeter method
was unable to make a good prediction. Good agreement was
found between analysis and experiment for the testing of a
1.4-in.-diameter pile in the laboratories at Texas A & M S
University, not reported here, where the soil conditions
around the pile and around the pressuremeter were carefully
controlled. However, results in the field and in the S
laboratory show that a pile in sand under cyclic lateral
loading will behave quite differently if the load is applied
in one direction only or i.s applied with the load being
reversed in direction. There is no manner in which the
pressuremeter can be operated to predict directly this
difference in cyclic behavior as a function of loading _
direction.
%..S.*.:'i
1S
CHAPTER 6
SUMMARY OF RESULTS AND
RECOMMENDATIONS FOR FURTHER STUDY
SUMMARY OF RESULTS A
This report has summarized the results of experimental
studies concerning the behavior of piles and pile groups ' 4
subjected to lateral loading. The tests were conducted from
1984 to 1987 at the Pile Test Facility of the University of
Houston. A total of six research studies were completed as
described in the Introduction and the six studies have been
combined in preparation of this summary report. Among those
previous studies, four of them were directly related to full-
scale tests for single piles and pile groups under lateral
loading; the other two studies were concerned with the use of -
the pressuremeter in predicting the behavior of single piles.
Significant results of all the experimental studies and %
findings in improving the understanding of the behavior of
single piles and pile groups can be summarized as follows.A
Single-Pile Tests
1. The response of single piles to static loading was ,. %v.
stiffer than that to cyclic loading. .
2. In testing of the single pile (and the group of -
piles) in the submerged stiff clay, significant gapping
201 -

F> -Y Py 7. - - .
between the piles and the surrounding soil was observed A,,
during cyclic loading and the gapping was intensified by
hydraulic erosion.
3. The appreciable cyclic degradation in clay did not• %7% -
begin until the pile-head displacement had reached about one
percent of the diameter of the individual piles, but, once -
started, did not appear to stabilize even after 200 cycles.
4. Cyclic loading of the test pile in sand did not
create gapping between the pile and the surrounding soil, but
resulted in densification of the sand around the pile.
5. The reduction of soil resistance due to cyclic
loading was much more pronounced for clay than for sand.-. - ., m,,.'-.--
6. The ultimate soil resistance determined
experimentally, varied significantly from than that
recommended by the current p-y criteria. Modified procedures
for the prediction of p-y curves were described and were used:j -e
to evaluate the pile behavior.
7. The maximum bending moment in a pile during cyclic
loads was greater than that for static loading under the same .J*
deflection at the pile top, due to softened soil resistance.
202
% % P V A.e
II

,.
Pile-GrouD Tests .5
1. The response of the single pile to lateral load was S
stiffer than the response of the average pile in a group.
2. The response of the piles to static loading was
stiffer that the response to cyclic loadin- U
3. The distribution of load to the piles in the group •
was not uniform. The leading row took a larger portion of ,, __b:
the load than the middle row, which in turn took a larger
portion than the trailing row. 0
,-.5'. .
4. The ultimate soil resistance for the leading row of "
piles was larger than the ultimate soil resistance for the 0
middle row, which in turn was larger than that for the
trailing row. ,
5. The reduced efficiency of the group for lateral
loading was largely due to the effect of "shadowing" in
which the trailing row of piles can mobilize only a 'imited S
soil resistance. . -
.- ^
6. The relatively smaller amount of loss of soil 0
resistance due to cyclic loading in sand than was observed "5%,
for clay may be due to the significant amount of 55
densification of the sand that occurred during two-way cyclic
loading. '
203
.'I
5,. IN. P~ J. k5

7. Although several of the analytical methods were able
to predict with reasonable accuracy either deflections or
maximum bending moment, no method was able to predict both
correctly. The key element needed to correctly predict group
effects is an understanding of the mechanisms producing the
loss of soil resistance in the piles within the trailing
rows. S
8. The analytical method based on the experimental
interaction factors is promising because the nonlinear soil
reaction and the "shadowing" effect in the trailing row can
be included in the analysis.
Pressuremeter Method for Predicting the Behavior of -A
Single Pile, %- .4.
1. 'The pressuremeter method in general gave a good S
prediction of pile behavior in clay or in sand for static
(monotonic) loading when soil conditions around the pile and
the pressuremeter were judged to be the same. S
2. For cyclic loading in clay, the pressuremeter method
yielded a pile response that was reasonably in agreement with
results from experiment.
3. The comparisons between the predicted and measured S
cyclic responses of the single 10.75-in.-diameter pile showed
204

poor agreement probably because the soil conditions around
the pile and the pressuremeter were different.
RECOMMENDATIONS FOR FURTHER STUDY
1. The results from recent tests, similar to those
described in this report, should be obtained and analyzed.
It is understood that tests have been performed in Europe and
that programs of testing of single piles and groups of piles
may be continuing in Europe and elsewhere.
2. On the basis of the findings reported herein, on
findings of other investigators, and on the analyses of data
that can be obtained on lateral loading, a report or reports S
should be prepared for the guidance of designers of single
piles and pile groups under lateral loading. The reports may
be preliminary but the results that have been obtai: ed at the S
Houston site should be implemented in a timely manner. .1
3. The basic procedure that was employed for the S
instrumentation of the single piles and the pile groups for
obtaining the response to lateral loading was successful and- "., .
advantage should be taken of the experience that was gained.
4. The critical need is for additional data and a
testing program or programs should be implemented in other 0
kinds of soil.
205J.KK

-W0 5L!II- TIVV _ .LVWV
5. A st udy should be implemented in order to take
advantage of the findings reported herein in the design of
-.perstructures that are pile-supported.
Z
N. N % %

P-IRQ.. .- V. F5W7
REFERENCES
API Recommended Practice for Planning. Designing, and o,,Constructing Fixed Offshore Platforms. AmericanPetroleum Institute, Washington, D.C., Tenth Edition,March, 1979.
Baguelin, F., Jezequel, J.F. and Shields, D.H., ThePressuremerer and Foundation Engineering, TranstechPublications, Rockport, Massachusetts, 1978.
Bogard, D. and Matlock, H., "Procedures for Analysis ofLaterally Loaded Pile Groups in Soft Clay," ProceedinZa,Specialty Conference on Geotechnical Engineering in 0Offshore Practice, American Society of Civil Engineers,Austin, Texas, April, 1983.
Briaud, J.L., Lytton, R.L. and Hung, J.T., "Obtaining Modulifrom Cyclic Pressuremeter Tests," Journal of theGeotechnical Engineering Division, ASCE, Vol. 109, No. 05, 1983a.
Briaud, J.L., Smith, T. D. and Meyer, B.J., "PressuremeterGives Elementary Model for Laterally Loaded Piles,"International SymPosium on In-Situ Testing of Soil andRock, Paris, 1983b. •
Brown, D. and Reese, L.C., "Behavior of a Large-Scale PileGroup Subjected to Cyclic Lateral Loading, "Geotechnical
1NEngineering Report GR85-12, Geotechnical EngineeringCenter, The University of Texas at Austin, Austin,Texas, May, 1985.
Digioa, A., Davidson, H.L. and Donovan, T.D., "LaterallyLoaded Drilled Piers A Design Model," Drilled Piersand Caissons, ASCE Convention, St. Louis, 1981.
Focht, J.A., Jr., and Koch, K.J., "Rational Analysis of the ,Lateral Performance of Offshore Pile Groups," Preprints,Fifth Offshore Technology Conference, Houston, Texas,Vol. 2, 1973, pp. 701-708.
Ha, H.B., and O'Neill, M.W., "Field Study of Pile GroupAction: Appendix A; PILGPI Users' Guide," Report No.FHWA/RD-81/003, Federal Highway Administration, March,1981.
Kasch, V.R, Coyle, H.M., Bartoskewitz, R.E. and Sarver, W.G., .4%"Lateral Load Tests of a Drilled Shaft in Clay,"Research Report 211-1, Texas Transportation Institute,Texas A&M University, 1977. .
207
or~ %

S.,
Little, R.L. and Briaud, J.L., "A Pressure Method for SinglePiles Subjected to Cyclic Lateral Loads in Sand,"Research Report No. 5357, Department of CivilEngineering, Texas A&M University, April, 1987.
Mahar, L.J. and O'Nill, M.W., "Geotechnical Characterizationof Desiccated Clay," Journal of GeotechnicalEngineerin, ASCE, Volume 109, No. GTI, Jan., 1983, pp.56-71.
Makarim, C.A. and Briaud, J.L., "Pressuremeter Method forSingle Piles Subjected to Cyclic Lateral Loads inOverconsolidated Clay," Research Report No. 5112, CivilEngineering Department, Texas A&M University, CollegeStation, Texas, 1986.
Matlock, H., "Correlations for Design of Laterally LoadedPiles in Soft Clay," Paper No. OTC 1204, Proceedings.Second Annual Offshore Technology Conference, Houston,Texas, Vol. 1, 1970, pp. 577-594.
Matlock, H., Ingram, W.B., Kelly, A.E., and Bogard, D.,"Field Tests of the Lateral Load Behavior of Pile Groupsin Soft Clay," P r, Twelfth Annual OffshoreTechnology Conference, OTC 38871, Houston, Texas, May,1980.
Matlock, H. and Ripperger, E.A., "Procedures andInstrumentation for Tests on a Laterally Loaded Pile,"Prneeding, Eighth Texas Conference on Soil Mechanicsand Foundation Engineering, Austin, Texas, 1956.
McClelland, B., "Design of Deep Penetration Piles for OceanStructures," Journal of the Geotechnical EngineeringDivision, ASCE, Vol. 100, No. GT7, July 1974, pp. 709-747. -
Morrison, C. and Reese, L.C., "A Lateral Load Test of a Full-Scale Pile Group in Sand," Geotechnical Engineering.- -.
Report GR 86-1, Geotechnical Engineering Center, TheUniversity of Texas at Austin, Austin, Texas, August,1986. _
Poulos, H.G., "Behavior of Laterally Loaded Piles: II - PileGroups," Journal of the Soil Mechanics and FoundationsD, ASCE, Vol. 97, No. SM5, 1971.
Ochoa, M. and O'Neill, M.W., "Lateral Pile-Group InteractionFactors for Free-Headed Pile Groups in Sand from Full-Scale Experiments," Report No. UHCE 86-12, Departmentof Civil Engineering, University of Houston - UniversityPark, Houston, Texas, October, 1986.
208
w.'. -. ,Z

O'Neill, M.W., "Group Action in Offshore Piles," Prociings,Specialty Conference on Geotechnical Engineering in -Offshore Practice, American Society of CivilEngineering, Austin, Texas, April, 1983.
O'Neill, M.W., and Dunnavant, T.W., "A Study of the Effectsof Scale, Velocity, and Cyclic Degradability onLaterally Loaded Single Piles in Overconsolidated Clay,"Report No. CE 84-7, Dept. of Civil Engineering,University of Houston University Park, Oct., 1984.
O'Neill, M.W., Hawkins, R.A., and Mahar, L.J., "Field Studyof Pile Group Action," Report No. FHWA-RD-81-002. U.S.Department of Transportation, Federal HighwayAdministration, Offices of Research and Development, SWashington, D.C., March, 1981.
O'Neill, M.W., Hawkins, R.A. and Audibert, J.M.E.,"Installation of Pile Group in Overconsolidated Clay,"Journal of the Geotechnical Engineering Division, ASCE,Vol. 108, NO. GT1I, 1982.
Reese, L.C., Cox, W.R., and Koop, R.D., "Analysis ofLaterally Loaded Piles in Sand," Prcednq, SixthAnnual Offshore Technology Conference, Vol. 2, paper no.
OTC 2080, Houston, Texas, 1974, pp.473-483.
Smith, T.D., "Pressuremeter Design Method for Single PilesSubjected to Static Lateral Load," Ph.D. Dissertation,Civil Engineering, Texas A&M University, 1983.
'.N
I209
I'll" Jll Ia -
11 11 1 1 11 1 1 1 '0