* Fermi National Accelerator Laboratory · 1999-12-07 · * Fermi National Accelerator Laboratory w...
16
* Fermi National Accelerator Laboratory w FERMILAB-Pub-94/1’73-X astro-ph/9407061 submitted to N&w-e THE CASE FOR A HUBBLE CONSTANT OF 30 km s-l Mpc-I James G. Bartlett,’ Alain Blanchard,’ Joseph Silk,2 and Michael S. Turner314 ’ Observatoire Astronomique de Strasbourg Universite’ Louis Pasteur 11, rue de l’llniversite’ 67 000 Strasbourg FRANCE 2Depaftments of Astronomy and Physics and Center for Particle Astrophysics University of California Berkeley, CA 94720 U.S. A. 3NASA/Fennilab Astrophysics Center Fermi National Accelerator Laboratory, Batavia, IL 60510-0500 U.S.A. ‘Departments f y o Ph sits and of Astronomy & Astrophysics Enrico Fenni Institute, The University of Chicago, Chicago, IL 606371433 U.S.A. Although cosmologists have been trying to determine the value of the Hubble constant for nearly 65 years, they have only suc- ceeded in limiting the range of possibilities: most of the current observational determinations place the Hubble constant between 50 km s-l Mpc-’ and 90 km s-l Mpc-’ [l]. The uncertainty is unfortu- nate because this fundamental parameter of cosmology determines both the distance scale and the time scale, and thereby affects al- most all aspects of cosmology. Here we make the case for a Hubble constant that is even smaller than the lower bound of the accepted range, arguing on the basis of the great advantages, all theoretical Operated by Universities Research Association Inc. under contract with the United Slates Department of Energy w
Transcript of * Fermi National Accelerator Laboratory · 1999-12-07 · * Fermi National Accelerator Laboratory w...
* Fermi National Accelerator Laboratory w
FERMILAB-Pub-94/1’73-X astro-ph/9407061
submitted to N&w-e
THE CASE FOR A HUBBLE CONSTANT
OF 30 km s-l Mpc-I
James G. Bartlett,’ Alain Blanchard,’ Joseph Silk,2 and Michael S. Turner314
’ Observatoire Astronomique de Strasbourg Universite’ Louis Pasteur
11, rue de l’llniversite’ 67 000 Strasbourg FRANCE
2Depaftments of Astronomy and Physics and Center for Particle Astrophysics
University of California Berkeley, CA 94720 U.S. A.
3 NASA/Fennilab Astrophysics Center Fermi National Accelerator Laboratory, Batavia, IL 60510-0500 U.S.A.
‘Departments f y o Ph sits and of Astronomy & Astrophysics Enrico Fenni Institute, The University of Chicago, Chicago,
IL 606371433 U.S.A.
Although cosmologists have been trying to determine the value of the Hubble constant for nearly 65 years, they have only suc- ceeded in limiting the range of possibilities: most of the current observational determinations place the Hubble constant between 50 km s-l Mpc-’ and 90 km s-l Mpc-’ [l]. The uncertainty is unfortu- nate because this fundamental parameter of cosmology determines both the distance scale and the time scale, and thereby affects al- most all aspects of cosmology. Here we make the case for a Hubble constant that is even smaller than the lower bound of the accepted range, arguing on the basis of the great advantages, all theoretical
Operated by Universities Research Association Inc. under contract with the United Slates Department of Energy w
nearly scale-invariant density perturbations and matter comprised mainly of very slowly moving particle relics such as axions or neutralinos. The simplest, version of CDM, where the perturbations are precisely scale invariant and the matter content consists exclusively of baryons and CDM particles, cannot simultaneously accommodate the amplitude of the fluctuations as measured by COBE, the large-scale structure as observed by galaxy surveys such as APM, QDOT, and others, the abundance of x-ray clusters, and the small- scale pairwise velocities of galaxies.
.4 quantitative estimate of the problems faced by standard CDM, by which we shall mean CDM with h = 0.5, comes from the observational power spectrum compiled by Peacock and Dodds [9]. Their work incorpo- rates corrections for redshift-space distortions and nonlinear clustering and utilizes five different catalogues that probe inhomogeneity on length scales from lOh-’ Mpc - 200h-’ Mpc (hereafter Ho G 1OOh kms-’ Mpc-‘). They conclude that the power spectrum of standard CDM has the wrong shape.
To be more precise, while the primeval density perturbations are scale invariant, the fact that the Universe made a transition from radiation domi- nation to matter domination at a redshift of about ZEQ N 2.4 x 10⁴Rah2 does impose scale on the power spectrum: kEQ N 0.5(520h2) Mpc-‘, the scale that crossed inside the horizon at matter-radiation equality. The shape of the power spectrum seen at late epochs is determined by this scale times Hi’ (since observations rely on redshift as a distance indicator), leading to the definition of a shape parameter I’ = S&h a kEQ x h-l Mpc, which in standard CDM assumes a value of about 0.5. Peacock and Dodds [9] conclude that the data are best fit by a shape parameter I? = 0.25 rf: 0.05.
The simplest way of achieving this is a low value for the Hubble constant! It has the additional effect of increasing the baryon fraction predicted by the theory of primordial nucleosynthesis (see below), which in turn further alters the shape of the power spectrum by suppressing power on galactic scales. To retain sufficient power on galactic scales, we favor a value of 30 km s-l Mpc-’ for the Hubble constant rather than 25 km s-l Mpc-‘. Figure 1 compares the power spectrum obtained by Peacock and Dodds with the prediction of CDM for several values of Ho. (We have used the CDM power spectrum of Ref. (lo], normalized to the COBE DMR fluctuation amplitude. The galaxy data is normalized to IRAS counts in spheres of 8h.-’ Mpc.)
Other fixes, such as mixed dark matter, CDM + cosmological constant. raising the energy level in relativistic particles (which delays matter-radiation
equality and therefore has the same effect as lowering the Hubble constant), and “tilting” the primeval power spectrum have also been proposed to ad- dress the “shape problem” [ll]. The power spectrum in the mixed dark mat- ter scenario falls dramatically on small scales and so this version of CDM has difficulty accounting for the early formation of objects such as QSOs and large, unbound groups of galaxies at high redshift. With the exception of the model containing a cosmological constant, these variants do not address the problem of the dark matter to baryonic matter ratio as measured in clusters like Coma, which we discuss below. The cosmological constant fix, however, cannot account for the large value of Ro inferred from the analysis of peculiar velocities in our local neighborhood [12]. At the very least, a low value for the Hubble constant is the most economical solution.
A problem for standard CDM not unrelated to the shape problem is excessive power on small scales. An often-used measure of inhomogeneity on small scales is the variance of the mass in spheres of radius 8h-’ Mpc, or 08; for reference, the variance of optical galaxy counts in such spheres is unity [13]. In standard, COBE normalized CDM, 08 = 1.2, while a Hubble constant of 30 km s-l Mpc-’ results in a significantly lower value, 08 = 0.6. This value agrees with the variance of IRAS galaxies (see Figure 1) and implies that bright, optical galaxies are a biased tracer of mass while IRAS galaxies better trace the mass distribution.
In the probably oversimplified linear-bias scheme, the bias factor b E (~WAL/%AL)/(~PIP) = l/08 is about 1.7. This agrees with the bias found by several authors using the abundance of galaxy clusters to probe the mass fluctuations on the same scale [14]. We have used the Press-Schechter for- malism [15] to calculate the distribution of x-ray emitting galaxy clusters as a function of temperature for several values of the Hubble constant. We compare these results to the data from Edge et al. [16] and Henry and Ar- naud [17] in Fig. 2. For COBE-normalized CDM models, h = 0.3 provides an excellent fit to the data; it is all the more remarkable considering the extreme sensitivity of the cluster abundance to the Hubble constant, which is caused by the additional suppression of power on small scales due to the higher baryon abundance. The fit is better than that obtained for standard CDM normalized to tht# same value of 08 because a lower Hubble constant results in a “flatter” power spectrum on these scales (see Fig. 1).
A problem that plagues all unbiased, R0 = 1 models is the predict,ion of galaxy pairwise velocities on scales of around 1 Mpc that are several times

larger than observed. While a bias of 1.7 helps significantly in reducing galaxy pairwise velocities, it does not do the whole job. However, Zurek et al. [18] argue that velocit,y bias, primarily due to merging, reduces the theo- retically predicted velocities by about 30 percent and that observational bias, which arises in interpreting pairwise velocities in a sample contaminated by Virgo infall (and may be corrected for by treating both data and simulations identically) raises “observed” pairwise velocities by about 50 percent. In ad- dition, Bartlett and Blanchard [19] have shown that the interpretation of the pairwise velocities is sensitive to the unknown distribution of mass around galaxies, and, on the basis of a simple mode!. suggest that this may alleviate the problem even further.
An often-debated issue within the context of CDM models [4], especially those with reduced power on small scales, is whether objects seen at high redshift such as quasars can indeed form sufficiently early [ZO]. Figure 3, adapted from Ref. [21], displays redshifts of formation for objects of various mass in COBEnormalized CDM models for different values of the Hubble constant. The formation redshift is the epoch when most of the baryons are in nonlinear objects of the specified mass. Since quasars and even mas- sive galaxies, especially those seen at high redshift, are rare objects, one can multiply the formation redshift (plus one) by, for example, a factor of 3 for 30 fluctuations, since the fluctuation amplitude in the linear regime grows as (1 + 2)-l, We conclude that even for a Hubble constant as low as 30 km s-l Mpc-‘, sufficiently early formation of rare massive galaxies, the likely hosts of quasars, can occur by z = 5, the epoch of formation of the first quasars.
The final important argument in favor of a low value for the Hubble constant comes from primordial nucleosynthesis and recent determinations of the ratio of dark-to-baryonic matter in rich, x-ray emitting clusters such as Coma. With a single parameter, the baryon-to-photon ratio 7, primordial nucleosynthesis successfully accounts for the abundances of the four lightest elements D, 3He, 4He, and ‘Li, provided that 77 2: (2.5 - 6) x 10-l’. This leads to the best determination of the baryon density, pi = (1.7 - 4.1) x 10e31 gcmv3 [22]. However, because the critical density depends upon the Hubble constant, pcrit = 3Hi/8rG, the fractional contribution of baryons to the critical density also depends upon the Hubble constant,

The fractional contribution of baryons increases with a lower Hubble con- stant. t,hough still must be less than about 0.2 even if h = 0.3. (An even more extreme view than ours has long been advocated by Shanks [23], who has argued for a value of Ho as low as 30 km s-l Mpc-’ in order to revive a baryon-dominated Universe. However, both primordial nucleosynthesis and recent detections of CBR anisotropy on various angular scales are inconsis- tent with s2s m 1 [24].)
.An accurate determination of Q;~B leads to a test of the orthodoxy that has been much emphasized recently: the ratio of total-to-baryonic mass in a system large enough to represent a fair sample of the Universe should be Q,’ = 50h2 - 100h2. Brie1 et al. [25] have pointed out that the baryon- to-dark matter ratio in clusters could be problematic. Based on their data, IVhite et al. [26] have concluded that the ratio of total mass to mass in x- raying emitting gas is about (20 f 5)h3i2. (Essentially all the “visible” mass in baryons is in x-ray emitting gas; in this analysis it is assumed that the dark matter in clusters is not comprised of dark baryons.)
No value of H,-, within the traditionally accepted range can account for this observation (for 00 = 1). For Ho = 30 km s-l Mpc-‘, the orthodoxy is consistent with the data, but only just; the measured ratio differs from the nucleosynthesis prediction by about two standard deviations. However, it is likely that systematic effects still remain, most of which go in the direction of increasing the total-to-baryonic mass ratio.
For example, the baryon-to-dark matter ratio is likely to be somewhat en- hanced due to the settling of baryons [26]. Mapping of the mass distribution in clusters by studying the shear of background galaxy images produced by gravitational lensing results in an estimated mass that exceeds that obtained from application of the virial theorem to the hot gas, in two separate cases by a factor of about three [27]. This result makes sense if the clusters are not in virial equilibrium, or if the gas is partially supported by magnetic fields. The former possibility is inferred to be the case for the hot, x-ray emitting gas that is still undergoing infall according to cluster simulations and is also seen to show substructure [28]. That this may be a more or less ubiquitous phe- nomenon is suggested indirectly by the requirement that substantial amounts of intracluster gas must have only merged recently, moving at a speed com- parable to the sound velocity, in order to provide enough ram pressure to account for radio source morphologies [29]. Ensuing gas clumpiness would also lower the inferred gas mass, and together with upward correction of

cluster mass estimates, could comfortably reconcile cluster gas content with nucleosynthesis predictions for Ho = 30 km s-l Mpc-‘.
While our arguments for a low value of the Hubble constant have revolved around the CDM cosmogony, even in the simplest cosmological model, one where baryons constitute the sole form of matter, the value of the baryon density given by nucleosynthesis is uncomfortably small compared to many estimates of G!o, unless the Hubble constant is small. In particular, assuming that the mass-to-light ratios derived for clusters are representative of the Universe as a whole, one can derive 520 from the mean luminosity density. Such measurements indicate that Ra N 0.1 - 0.4 [30]. In a pure baryonic model, the Hubble constant has to be smaller than about 32 kms-’ Mpc-’ to accommodate flo = s2B 2 0.2. Moreover, if the recent tentative detection of deuterium absorption at the level D/H w 2 x 10e4 in an intergalactic cloud towards a quasar at redshift z = 3.32 proves correct [31], then the problem is even more acute. To produce this much deuterium, fish2 must be around 0.005, which requires a Hubble constant of 22 km s-l Mpc-’ just to achieve flB z 0.1.
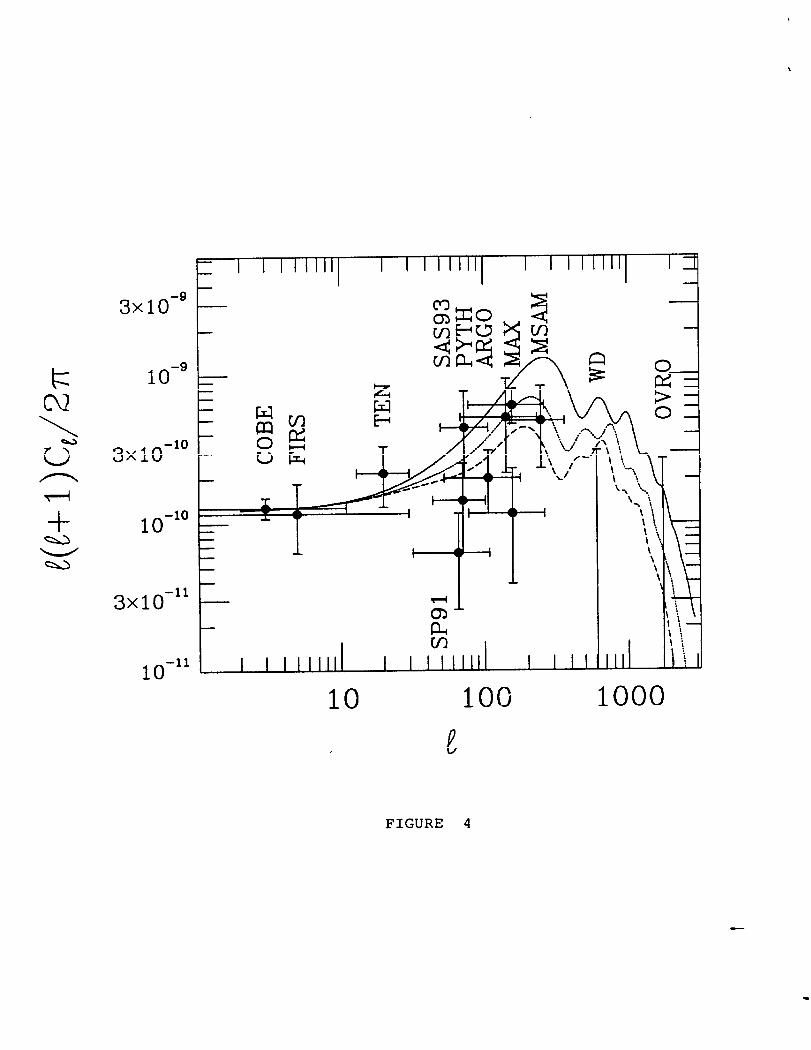
Finally, let us turn to the testing of our provocative suggestion. In the near term, the best prospects for indirect confirmation involve measurements of CBR anisotropy [32]. Compared to standard CDM, degree-scale CBR anisotropy is predicted to be about a factor of 1.5 larger (see Fig. 4). While the experimental situation on the degree scale is not settled at the moment, there is statistical support for the higher range of detections, such as those of the MAX [33] and Python [34] collaborations [35]. These detections are compatible with CDM, provided Ho 5 50 km s-r Mpc-‘.
The ultimate test of course is to measure the Hubble constant itself. It has recently been argued that a variety of techniques provide convinc- ing evidence for a Hubble constant of 80 f 10 km s-l Mpc-’ and that the question will soon be settled when Cepheid variables are studied by the re- furbished Hubble Space Telescope [l]. However, most of the techniques that are converging on this value, including Tully-Fisher, surface-brightness fluc- tuation, fundamental-plane, and planetary-nebulae techniques, involve the same lower rungs on the infamous distance ladder-and thus could have a common systematic error. From our perspective, the most troublesome measurements are those based upon type II (core collapse) supernovae: they “jump” the distance ladder-and thus do not share common systematic er- rors with the previously mentioned methods-and still give a value consistent
with 80 k 10 km s-l ?rlpc-’ (361. There are two lines of defense for our hypothesis: (I) common systematic
error in the empirically based determinations and an error in the type II supernovae determination; or (2) current measurements have yet to reach sufficient distances to sample the Hubble flow (or are still influenced b> lrlalmquist bias). Both possibilities have some merit [37].
The paucity of nearby giant elliptical galaxies means that the calibration of the of fundamental-plane, surface-brightness fluctuation, and planetary- nebulae techniques are entirely based upon the bulges of M3l and M32. and thus inadequate. Intermediate-age populations are found to be present in nearby examples of bulges and dwarf ellipticals [38], and their effect on these distance indicators is unexplored.
The Tully-Fisher technique has been criticized on the grounds that its local spiral calibrators are excessively blue (in B-I band) for their linewidths. If this is a stellar-population effect, it may be circumvented by working in I band or in the near infrared. However, two type Ia supernovae, which traditionally favor a low value of the Hubble constant, have been recently calibrated with Cepheids in Tully-Fisher calibrator galaxies. The calibration disagrees with the I-band Tully-Fisher distances, and to save the latter, this has been attributed to dust absorption in the vicinity of the supernovae [39]. This tends to raise the luminosities of the nearby supernovae used as calibrators. relative to distant, presumed dust-free supernovae, thereby bringing the two techniques into agreement for a larger value of HO. However if the nearby type Ia supernovae calibrators are intrinsically underluminous. as seems to be the case for at least half the type Ia’s [40], there could be a possible bias towards a lower global value of HO. This would leave one with a discrepancy in the Tully-Fisher distance indicators.
It is also worth considering the possibility that our local volume of the Universe may not be representative, which is reasonable as large-scale vari- ations are expected in any CDM model. A “large” local value for Ho would occur if we lived in an underdense region. Simulations have shown that a fifty percent reduction in Ho is possible if measurements are performed within about 20h-’ Mpc; specifically, the reduction is 90(-An,,l),~Q”.’ per cent [41]? where -Angal is the galaxy number underdensity. .A 70 percent underdensity would reduce Ho by 40 percent for 08 = 0.7; such fluctuations are expected out to about 20h-’ Mpc, or 4 correlation lengths. if one is uti- lizing luminous galaxies which are - 3a fluctuations. Such a local **hole”
is also consistent with, and would even account for, the apparent evolu- tion in number seen in .4PM galaxy counts [42] at an otherwise surprisingly low redshift ( 2 m 0.2). Finally, we note that the only truly global measure- ments of Ho (i.e., measurements at t 2 0.1 - 0.2), namely those utilizing the Sunyaev-Zel’dovich effect in galaxy clusters and time-delay measurements in the images produced by the gravitational lensing of a variable quasar, favor a value of Ho systematically lower than is obtained from the more local mea- surements. A recent study of A2218 using the Interferometric Ryle Telescope places Ho in the range 20-75 kms-’ Mpc-’ [43], while modeling of the dou- ble quasar Q0957+561 gives Ho = 37 f 14, if one adopts the time delay of Press eb al. [44] and the velocity dispersion of Rhee [45].
All this being said, reconciling Ho = 30 kms-’ Mpc-’ with the bulk of the measurements of the Hubble constant is not easy. In fact, our strongest argument for a significant systematic error in the distance scale is that his- tory is on our side! The techniques that both jump the distance ladder and provide a measurement of the global Hubble constant (Sunyaev-Zel’dovich ef- fect and time delay in gravitational lens systems) should eventually provide a definitive answer. Because of the many advantages of Ho = 30 km s-l Mpc-’ spelled out here, we believe that it is worth keeping an open mind.
Acknowledgments
We are very grateful to J. Peacock for kindly providing us with the power spectrum data presented in Fig. 1, to M. Tegmark for preparing Fig. 3, and to N. Sugiyama for preparing Fig. 4. This work was supported in part by the DOE (at Chicago and Fermilab), by the NASA through grant NAGW-2381 (at Fermilab), by the NSF and DOE at Berkeley, and by a Chateaubriand fellowship from the Centre International des Etudiants et Stagiaires (Stras- bourg).
References
[l] M. Fukugita, C.J. Hogan, and P.J.E. Peebles, Natzlre 366, 309-312 (1993).
[2] P. J.E. Peebles, D.N. Schramm, E. Turner, and R. Kron, Nature 352, 769-7’76 (1991).
[3] G.R. Blument.hal et al., Nature 311, 517-525 (1984); A.D. Liddle and D. Lyt.h, Phys. Repts. 231, l-105 (1993).
[4] J.P. Ostriker, Annu. Rev. Astron. Astrophys. 31, 689-716 (1993).
[5] H. Arp et al., Nutwe 346, 807-812 (1990).
[6] A. Sandage, Astron. J. 106, 719-725 (1993).
[7] H. Spinrad, A. Dey and J.R. Graham, Astrophys. J. Lett., submitted (1994).
[8] G.F. Smoot et al., Astrophys. J. 396, Ll-L5 (1992).
[9] J.A. Peacock and S.J. Dodds, Mon. Not. R. ustr. Sm. 267, 1020-1034 (1994).
[lo] J.M. Bardeen et al., Astrophys. J. 304, 15-61 (1986).
(111 See e.g., M.S. Turner, in Recent Directions in Particle Theory (TASI- 92), eds. J. Harvey and J. Polchinski (World Scientific, Singapore, 1993), p. 165.
[12] N. Kaiser et al., Mon. Not. R. ustr. Sot. 252, 1-12 (1991); M. Strauss et al., Astrophys. J. 397, 395-419 (1992); A. Dekel et al., ibid 412, 1-21 (1994).
[13] M. Davis and P.J.E. Peebles, Astrophys. J. 267, 465-482 (1983).
[14] -4. Blanchard and J. Silk, in Moriond Proceedings (Editions Frontieres. Gif-sur-Yvette, 1992), p. 93; J.G. Bartlett and J. Silk, Astrophys. J. 407, L45-L48 (1993); S.D.M. White, G. Efstathiou, and C.S. Frenk, Mon. Not. R. ustr. Sot. 262, 1023-1028 (1993).
[15] W.H. Press and P. Schechter, Astrophys. J. 187, 425-438 (1974).
[16] A.C. Edge et al., Mon. Not. R. ask. Sot. 245, 559-569 (1990).
[17] J.P. Henry and K.A. Arnaud, Astrophys. J. 372, 410-418 (1991)
[18] \v.H. Zurek, M.S. Warren, P.J. Quinn, and J.K. Salmon, in Proc. of the 9th IAP Meeting, eds. F.R. Bouchet and M. Lachieze-Rey (Editions Frontieres? Gif-sur-Yvette, 1993), p. 465-474.
[19] J.G. Bartlett and A. Blanchard, in Proc. of the 9th IAP Meeting, eds. F.R. Bouchet and M. Lachieze-Rey (Editions Frontieres, Gif-sur- Yvette, 1993), p. 281-284.
[20] G. Efstathiou and M.J. Rees, Mon. Not. R. astr. Sot. 230, 5P-12P (1988).
[21] M. Tegmark, J. Silk and A. Blanchard, Astrophys. J. 420, 484-496 (1994).
[22] J. Yang et al., Astrophys. J. 281, 493-511 (1984); T.P. Walker et al., ibid 376, 51-69 (1991); C. Copi, D.N. Schramm, and M.S. Turner, astro-ph/9407006 (1994).
[23] T. Shanks, Vistas in Astronomy 28, 595-609 (1985); see also T. Shanks, D. Hale-Suton, R. Fong and N. Metcalfe, Mon. Not. R. ask. Sot. 237, 589-610 (1989); T. Shanks, ibid, in press (1994).
[24] W. Hu and N. Sugiyama, Astrophys. J., in press (1994).
[25] U.G. Brie& J.P. Henry, and H. Bohringer, Astr. Astrophys. 259, L31- L34 (1992).
[26] S.D.M. White et al., Nature 366, 429-433 (1993).
[27] G. Fahlman, N. Kaiser, G. Squires, and D. Woods, CITA preprint CITA-94-16 (1994); H. Bonnet, Y. Mellier, and B. Fort, Astrophys. J., submitted (1994).
[28] A.E. Evrard, J.J. Mohr, D.G. Fabricant, and M.J. Geller, Astrophys. J.. in press (1994).
[29] J.O. Burns, G. Rhee, F. N. Owen and J. Pinkney, Astrophys. J. 423, 94-115 (1994).
[30] See e.g.. S. Faber and J.Gallagher, Annu. Rev. Astron. Astrophys. 17. 135-187 (1979); V. Trimble, ibid 25, 425-472 (1987).
[31] A. Songaila, L. Cowie, C.J. Hogan, and M. Rugers, Nutwe 368. 599- 604 (1994).
(321 M. White, D. Scott and J. Silk, Annu. Rev. Astron. Astrophys. 32, in press (1994).
[33] J.O. Gundersen et al., Astrophys. J. 413, Ll-L5 (1993); P.!vl. Meinhold et al., ibid 409, Ll-L4 (1993).
[34] M. Dragovan et al., Astrophys. J. 427, L6i-LiO (1994).
[35] D. Scott and M. White, in Proc. of Case Western Meeting on CBR, in press (1994).
[36] B.P. Schmidt et al., Astron. J. 107, 1444-1452 (1994).
[37] A. Sandage and G. Tammann, Astrophys. J., submitted (1994).
[38] W. Freedman, in Proceedings of CTIO/ESO conference on the Local Group, La Serenu, in press (1994).
[39] M. Pierce, Astrophys. J., in press (1994).
[40] D. Branch and D.L. Miller, Astrophys. J. 405, L5-L8 (1993).
[41] E. Turner, R. Cen, and J.P. Ostriker, Astron. J. 103, 1427-1437 (1992).
[42] S.J. Madd ox, W. Sutherland, G. Efstathiou, J. Loveday and B.A. Pe- terson, Mon. Not. R. ustr. Sot. 247, Pl-P5 (1990).
1431 M. Jones et al., Nutwe 365, 320-323 (1993).
[44] W.H. Press, G.B. Rybicki, and J. Hewitt, Astrophys. J. 385, 404-415 (1992).
[45] G. Rhee, Nature 350, 211-212 (1991).
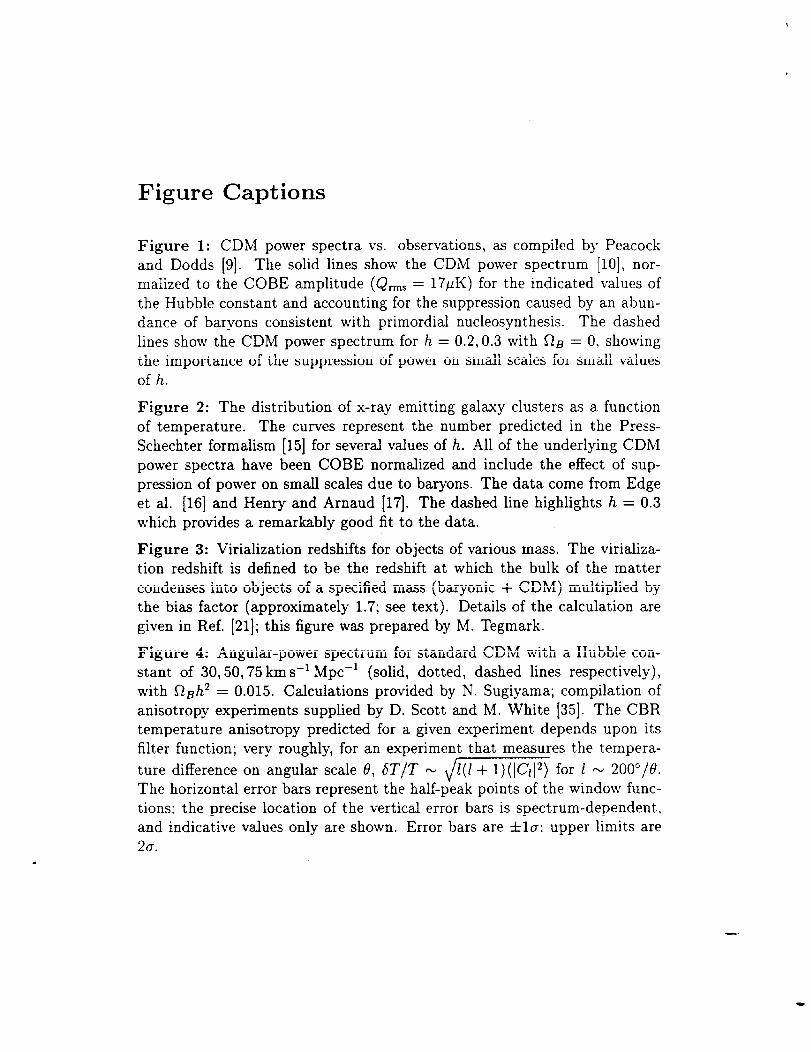
Figure Captions
Figure 1: CDM power spectra vs. observations, as compiled by Peacock and Dodds [9]. The solid lines show the CDM power spectrum [lo], nor- malized to the COBE amplitude (Q,, = 17~10 for the indicated values of the Hubble constant and accounting for the suppression caused by an abun- dance of baryons consistent with primordial nucleosynthesis. The dashed lines show the CDM power spectrum for h = 0.2,0.3 with fly = 0, showing the importance of the suppression of power on small scales for small values of h.
Figure 2: The distribution of x-ray emitting galaxy clusters as a function of temperature. The curves represent the number predicted in the Press- Schechter formalism [15] for several values of h. All of the underlying CDM power spectra have been COBE normalized and include the effect of sup- pression of power on small scales due to baryons. The data come from Edge et al. [16] and Henry and Arnaud [17]. The dashed line highlights h = 0.3 which provides a remarkably good fit to the data.
Figure 3: Virialization redshifts for objects of various mass. The virializa- tion redshift is defined to be the redshift at which the bulk of the matter condenses into objects of a specified mass (baryonic + CDM) multiplied by the bias factor (approximately 1.7; see text). Details of the calculation are given in Ref. [21]; this figure was prepared by M. Tegmark.
Figure 4: Angular-power spectrum for standard CDM with a Hubble con- stant of 30,50,75 kms-’ Mpc-’ (solid, dotted, dashed lines respectively), with RB!L* = 0.015. Calculations provided by N. Sugiyama; compilation of anisotropy experiments supplied by D. Scott and M. White [35]. The CBR temperature anisotropy predicted for a given experiment depends upon its filter function; very roughly, for an experiment that measures the tempera- ture difference on angular scale 0, ST/T - ,/m for I w 200”/8. The horizontal error bars represent the half-peak points of the window func- tions: the precise location of the vertical error bars is spectrum-dependent, and indicative values only are shown. Error bars are &l~: upper limits are 20.
i-. / / T.
_--- Cl,=0
h=l h--0.5 h=0.3 h=0.2
h=0.3 h=0.2
Peacock & Dodds 1994
.
k (h Mpc-')
FIGURE 1

0.001
0.0001
1o-Q - 1
10-S
1o-8
10-7
10-8
IO
T (keV)
\ \
\
FIGURE 2

4 -
L .-
N’ +
30
20
10
0 lo4 lo5 106 lo7 108 109 1O1O loll 10=
M, [&I FIGURE 3
cr N
cmi4c- p m 1
SC T -T ~- >I 0
-T‘-\‘,_ / 24f
’ \ /J-J)\
\ /- .’ \&/I
\ ‘i \ ? \\ l.
\ ‘r - !
I k
\ ! \ :i. \\ ’ : ‘1 \
i
10 100
,\ \ \ i LLLM
I \ 1 \
e
FIGURE 4