Hindalcohindalco.com/upload/pdf/Q4FY17_Investor_Presentation.pdf · Excellence by Design Financial...
29
Excellence by Design Hindalco Investor Presentation – Q4 FY17 Mumbai, May 30, 2017
Transcript of Hindalcohindalco.com/upload/pdf/Q4FY17_Investor_Presentation.pdf · Excellence by Design Financial...

Excellence by Design
Hindalco
Investor Presentation – Q4 FY17Mumbai, May 30, 2017

Excellence by Design
Forward Looking & Cautionary Statement
Certain statements in this report may be “forward looking statements” within the meaning of applicable securities laws and regulations. Actual results could differ materially from those expressed or implied. Important factors that could make a difference to the company’s operations include global and Indian demand supply conditions, finished goods prices, feed stock availability and prices, cyclical demand and pricing in the company’s principal markets, changes in Government regulations, tax regimes, economic developments within India and the countries within which the company conducts business and other factors such as litigation and labour negotiations. The company assume no responsibility to publicly amend, modify or revise any forward looking statement, on the basis of any subsequent development, information or events, or otherwise.
2

Excellence by Design
Agenda
Aluminium (India) Copper Novelis
3
Key Highlights
Result Highlights
Economy & Industry
1
2
3
Operational and Financial Performance4

Excellence by Design
Key Highlights

Excellence by Design
Key Highlights
5
Raised USD 500 mn through Qualified Institutional Placement (QIP)
◊ Largest non bank QIP in last 2 years
◊ Generated demand in excess of USD 1.5 bn (3x Subscription) with strong demand from FII
◊ Priced at 2.7% premium to floor price & zero discount to closing price
Prepaid Rs. 1,031 crore long term loan in FY 2017 & Rs. 4,505 crore in April 2017 – Till date
the total per payment stands at Rs. 5,536 crore
Refinanced USD 4.3 billion long-term debt at Novelis - annual cash interest reduced by USD 79
mn
Consolidated Net Debt to EBITDA* as on Mar 31, 2017 improved to 3.74x from 6.29x on Mar
31, 2016
Strengthening Balance Sheet
Strategic Divestment
Divestment of Aditya Birla Minerals Limited (Australia) completed in July 2016
Novelis entered into a Joint Venture agreement in May 2017 with Kobe Steel to sell 50%
of its ownership interest in its Ulsan, South Korea facility for USD 315 mn
* (EBITDA excluding treasury income)

Excellence by Design
Key Highlights
6
Copper EBITDA at Rs. 1,456 crore marginally lower as compared to FY16
Lower sales volume mainly on account of planned shutdown and subdued wire rod demand
Reduction in raw material prices offset by lower by-product realization
Operational efficiencies and strategic product shift drive record results – Adjusted EBITDA* up 13% to USD 1.09 billion
Record free cash flow of USD 361 million
Auto shipments up 17% FY17 versus FY16 - Share of Auto shipments increase to 20% in Q4FY17
* Adjusted EBITDA excludes metal price lag
Record production of Aluminium at 1,266 Kt and Alumina at 2,886 Kt
Record EBITDA at Rs. 3,473 crore vs. Rs. 2,009 crore in FY16 on the back of strong operations & supporting macros
GP IV/4 & GP IV/5 coal mines reached their peak capacity; Kathautia mine commenced operation in February 2017
Copper
Novelis
Coal Security With new coal linkage in fiscal year 2017 coal security improved to two thirds of annual coal
requirement for Aluminium business
Aluminium India

Excellence by Design
Economy and Industry

Excellence by Design
Economy
○ IMF projected world growth is expected to rise from 3.1 % in 2016 to 3.5 % in 2017
○ China registered more than expected growth of 6.9% in Q1 CY 2017; Going forward
growth is expected to moderate.
○ European Commission expects Euro area to grow by 1.7% in 2017 and 1.8% in 2018
○ As per the World Bank, the growth of Indian economy is expected to be around
7% in Fiscal Year 2016-17, followed by acceleration to 7.6% in 2017-18
○ Enhanced government focus on housing, electrification and infrastructure to drive
demand in future
Global Economy – Gaining momentum amidst challenges
Domestic Economy
8

Excellence by Design
Aluminium Industry
Environmental & Supply side restrictions in
China expected to drive LME up
◊ New smelting capacity growth is expected
to slow down significantly
◊ Under construction projects may be
delayed
◊ More than 4 mn ton of smelting capacity at
risk
Buoyant demand outlook and lower
inventory base to support price outlook
◊ In CY 2017 demand outside China expected
to surge as manufacturing PMI in major
geographies are on the rise
Trump Administration Opens Trade
Investigation on Aluminium imports
Aluminium Prices Trend (USD/t)
Global market is expected to be largely balanced in CY 2017
9
*May’17 Aluminium LME as on 26th May’2017
*
1,481 1,531 1,531
1,571 1,551 1,594
1,629 1,639 1,592
1,666
1,737 1,728 1,791
18571,902
1,931 1,950
JA
N-
16
FE
B-
16
MA
R-
16
AP
R-
16
MA
Y-
16
JU
N-
16
JU
L-
16
AU
G-
16
SE
P-
16
OC
T-
16
NO
V-
16
DE
C-
16
JA
N-
17
FE
B-
17
MA
R-
17
AP
R-
17
MA
Y-
17

Excellence by Design
Aluminium Industry Drivers
○ Realization improved significantly in H2FY2017 driven by Trump
infra plan, surge in input cost and expected production cut in
China
○ Regional premium moderated in FY2017
○ Domestic market remains oversupplied due to imports and
production enhancements
10
Key macro drivers FY16 FY17 YoY%
LME (US$ /T) 1592 1688 6%
Premium (MJP) (US$/T) 120 95 -21%
Rs./US$ 65.5 67.1 2%

Excellence by Design
Copper Industry
○ Mine disruption in Chile and exports ban from Indonesia impacted concentrate supply
and thereby affecting TcRc in H2 FY2017
○ Increase in scrap availability affecting the refined consumption especially in the
developed world - Growth in global refined copper consumption is likely to remain flat at
around 2% in CY 2017
○ Domestic copper demand remained subdued in FY 2017 - is expected to bounce back in
FY 2018
11
TCRC (USDc/lb) LME (USD/MT) Rs./USDAcid Price
(Rs./MT)
DAP Realization
(Rs./MT)
Key macro drivers (FY 17 vs FY 16)

Excellence by Design
Result HighlightsFY17- Strong operating performance

Excellence by Design
RevenueRs. 39,383 crore
(Y-o-Y up 7%)
FY17 – Standalone Highlights
Higher Aluminium volumes and realization
Lower input cost
Stable operations
Overall strong performance based on stable operations
Lower realization for Utkal resulting in lower input cost for Hindalco
EBITDARs. 5,819 crore
(Y-o-Y up 35%)
Net ProfitRs. 1,557 crore
(Y-o-Y up 182%)
13
Utkal EBITDARs. 672 crore
(Y-o-Y down 6%)

Excellence by Design
Operational PerformanceAluminium (India)

Excellence by Design
307 320 317
1,133 1,266
Q4 FY16 Q3 FY17 Q4 FY17 FY16 FY17
703 744 709
2,680 2,886
Q4 FY16 Q3 FY17 Q4 FY17 FY16 FY17
Production Trend
Strong production growth with increase
by 8% for Alumina and 12% for Metal -
Plants ramped up and operating at
designed capacities
VAP production increased by 14%
Alumina (KT) includes Utkal
Metal (KT)
15
1%
3%
8%
12
%
VAP incl. Wire Rod (KT)
118 119 125
423481
Q4 FY16 Q3 FY17 Q4 FY17 FY16 FY17
14
%
6%

Excellence by Design
Utkal
Plant achieved operations at
designed capacity
Cash cost of Alumina refinery is
amongst the lowest in the world
16
Production (KT)
364 393 361
1,396 1,500
Q4 FY16 Q3 FY17 Q4 FY17 FY16 FY177
%

Excellence by Design
Operational PerformanceCopper
Excellence by Design
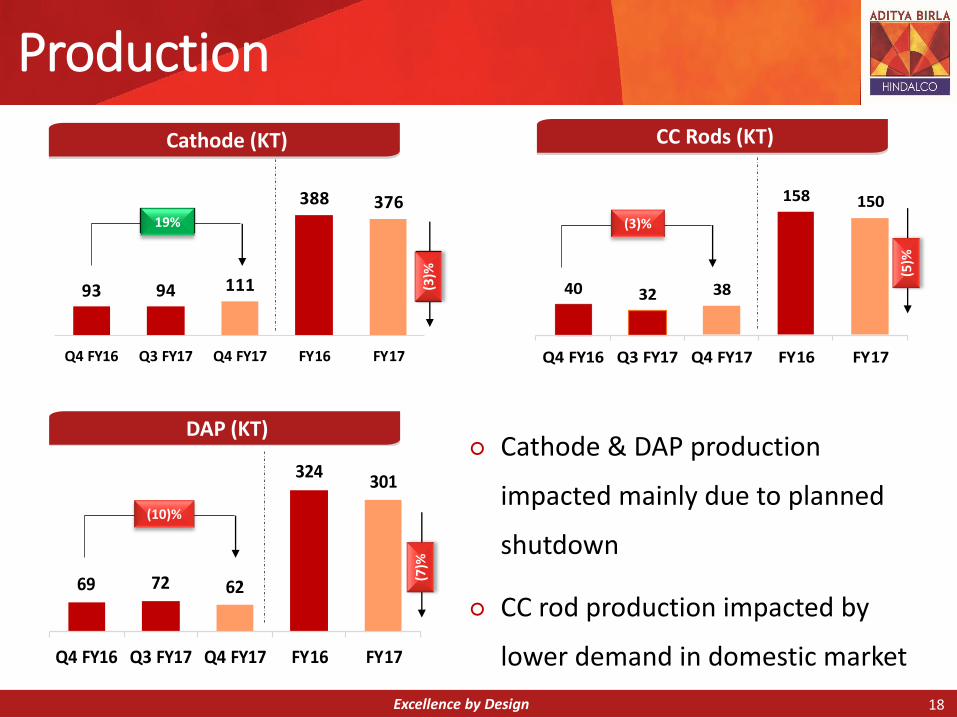
Production
○ Cathode & DAP production
impacted mainly due to planned
shutdown
○ CC rod production impacted by
lower demand in domestic market
Cathode (KT) CC Rods (KT)
DAP (KT)
18
93 94 111
388 376
Q4 FY16 Q3 FY17 Q4 FY17 FY16 FY17
40 32 38
158 150
Q4 FY16 Q3 FY17 Q4 FY17 FY16 FY17
69 72 62
324301
Q4 FY16 Q3 FY17 Q4 FY17 FY16 FY17
(3)%19%
(10)%
(3)%
(7)%
(5)%
19%
(3)%

Excellence by Design
Operational Performance Novelis

Excellence by Design
Key Highlights
○ Aluminium Auto sheet demand continued to
be robust
Share of Automotive shipments at 18% up from
15% last year.
○ Lower can shipments mainly due to weaker
economic conditions in Brazil and the
Middle East impacted overall shipments
○ Significant cost reduction through
improvement in productivity, asset
utilization and better metal mix
Inputs from recycled materials increased from
51% to 55% for FY2017
○ Continued ramp up of automotive capacity
and improvement in operational efficiencies
Total Shipments (KT)
20
788 750 790
3,123 3,067
Q4 FY16 Q3 FY17 Q4 FY17 FY16 FY17
Shipment Mix
(2)%
64%
15%
21%
FY16
Can Auto Specialties
60%
18%
22%
FY17

Excellence by Design
Financial Performance

Excellence by Design
Financial Highlights – Standalone
22
Q3
FY17 FY16 FY17 FY17 FY16
Revenue from Operations 11,747 9,263 9,915 39,383 36,713
Earning Before Interest, Tax and Depreciation (EBITDA)
Aluminium 918 837 876 3,473 2,009
Copper 497 384 330 1,456 1,467
Others 155 166 200 890 849
Total EBITDA 1,570 1,387 1,405 5,819 4,325
PBDT 1,029 814 817 3,496 1,935
Earning before Exceptional Items and Tax 648 473 459 2,068 653
Exceptional Income/ (Expenses) (Net) - - - 85 -
Profit Before Tax 648 473 459 2,153 653
Profit/ (Loss) After Tax 503 400 321 1,557 552
Earnings per Share (EPS) - Basic (In Rupees) 2.4 (1.2) 1.6 7.6 (0.6)
ParticularsQ4 Full Year
(Rs. crore)
After considering impact of expenses/losses not taken through P/L

Excellence by Design
Aluminium Standalone
Revenue (Rs. crore) EBITDA (Rs. crore)
• Strong performance on account of steady plant operations, higher volumes, supportive macro factors and lower input cost; However input cost started hardening in Q4 FY17
23
5,071 4,917 5,548
18,366 19,986
Q4 FY16 Q3 FY17 Q4 FY17 FY16 FY17
837 876 918
2,009
3,473
Q4 FY16 Q3 FY17 Q4 FY17 FY16 FY17
10%9%
9%
73
%

Excellence by Design
112 140
265
717 672
Q4 FY16 Q3 FY17 Q4 FY17 FY16 FY17
Utkal
EBITDA (Rs. crore)
• Strong performance on back of stable operations • During FY17 international alumina prices were relatively lower impacting
Utkal’s EBITDA. However lower alumina prices result in lower input cost for Hindalco
24
138%
(6)%

Excellence by Design
Copper
Revenue (Rs. crore) EBITDA (Rs. crore)
• Revenue up due to higher overall realization• EBITDA for FY17 slightly lower vs. last year: Lower volumes, lower by-
product realization & TcRC offset by lower input cost.
25
4,194 5,000 6,202
18,362 19,408
Q4 FY16 Q3 FY17 Q4 FY17 FY16 FY17
384 330
497
1,467 1,456
Q4 FY16 Q3 FY17 Q4 FY17 FY16 FY17
30%
48%
6%
29%
6% (1
)%

Excellence by Design
Novelis
Revenue (USD billion) Adjusted EBITDA* (USD million)
• EBITDA grew by 13% driven by higher auto shipments, operating efficiencies and better metal mix with higher percentage of recycled content
• Record Adjusted EBITDA per ton at USD 354 in FY17
* Adjusted EBITDA excludes metal price lag
26
2.4 2.3 2.6
9.9 9.6
Q4 FY16 Q3 FY17 Q4 FY17 FY16 FY17
277 255 292
963
1,085
Q4 FY16 Q3 FY17 Q4 FY17 FY16 FY17
6%
9%
13
%
(3)%

Excellence by Design
Financial Highlights - Consolidated
27
(Rs. crore)
FY17 FY16
Revenue from Operations 102,631 101,202
Earning Before Interest, Tax and Depreciation (EBITDA)
Aluminium 4,033 2,654
Copper 1,438 1,588
Novelis 7,194 5,039
Others 894 723
Total EBITDA 13,558 10,004
PBDT 7,816 4,870
Earning before Exceptional Items and Tax 3,347 362
Exceptional Income/ (Expenses) (Net) (8) (577)
Profit Before Tax 3,340 (214)
Profit/ (Loss) After Tax 1,900 (251)
Earnings per Share (EPS) - Basic (In Rupees) 9.2 (4.6)
ParticularsFull Year

Excellence by Design
Hindalco: Sustainable Performance
Stronger Balance Sheet
Robust Operational Performance
Improved Coal Security
World Class Alumina
Novelis
○ Robust performance on the back of stable plant operations along with higher Aluminium prices
○ GP IV/4 & GP IV/5 coal mines reached their peak capacity
○ Kathautia mine commenced operations in Feb’17
○ Continued cost advantage due to close proximity of the bauxite mine and efficient operations
○ Continued focus on high growth automotive segment and cost optimization
○ Accelerated the pace of deleveraging
28
Key Risk
○ Increasing Imports and domestic production
○ Drop in Aluminium prices, due to sustained high level of production in China
○ Increasing input cost

Excellence by Design
Thank You
REGISTERED OFFICE Century Bhavan, 3rd Floor, Dr. Annie Besant Road, Worli, Mumbai 400 030
Telephone- +91 22 6662 6666Website: www.hindalco.com
E mail: [email protected] Identity No. L27020MH1958PLC011238


![DESIGNED - NABARD - National Bank For Agriculture And Rural … · 2018-09-22 · [ 2 ] [2] crore and annual loan offtake of crore and loan outstanding of nearly crore crore households](https://static.fdocuments.in/doc/165x107/5e9f618ec5785a18cf42b9a3/designed-nabard-national-bank-for-agriculture-and-rural-2018-09-22-2-2.jpg)