ed317990.tif - ERIC - Education Resources Information Center · not emphasized in class. ... Ant...
119
DOCUMENT RESUME ED 317 990 CS 010 130 AUTHOR Langer, Judith A.; And Others TITLE Learning to Read in Our Nation's Schools: Instruction and Achievement in 1988 at Grades 4, 8, and 12. Report No. 19-R-02. INSTITUTION Educational Testing Service, Princeton, N.J.; National Assessment of Educational Progress, Princeton, NJ. SPONS AGENCY National Center for Education Statistics (ED), Washington, DC. REPORT NO ISBN-0-88685-102-5 PUB DATE Jun 90 GRANT G000720335 NOTE 119p.; For related reports, see ED 315 728 and CS 212 391. AVAILABLE FROM National Assessment of Educational Progress, Educational Testing Service, Rosedale Rd., Princeton, NJ 08541-0001 ($14.00). PUB TYPE Reports - Research/Technical (143) EDRS PRICE MF01/PC05 Plus Postage. DESCRIPTORS Elementary Secondary Education; *Grade 4; *Grade 8; *Grade 12; *Reading Achievement; Reading Attitudes; *Reading Comprehension; *Reading Instruction; Reading Tests; School Surveys; Student Evaluation; Teacher Attitudes IDENTIFIERS *National Assessment of Educational Progress ABSTRACT To assess the reading achievement of American school children; the National Assessment of Educational Progress (NAEP) surveyed nationally representative samples of approximately 13,00C students at grades 4, 8, and 12 attending public and private schools across the nation. Students read a variety of literary and informative passages and then auswered a series of multiple-choice and open-ended questions designed to measure their ability to read and comprehend these passages. In addition, students provided backyround information about their reading experiences both in and out of scaool. To supplement this information, the teachers of fourth graders participating in the assessment completed a questionnaire about the instruction their students received. Findings indicated that: (1) the average; reading proficiency of students increased substantially from grades 4 to 8 and less dramatically from grades 8 to 12; (2) at all three grade levels, there were great differences in reading proficiency according to socioeconomic status; (3) more proficient readers reported home aAd school environments that emphasized academic a.::hievema.nt; (4) students reported doing very little reading in school and for homework; (5) students' interest in books seems to decrease as they progress through school; (6) emphasis on beginning reacting instruction in grades 1, 2, and 3 is overwhelmingly phonics-based; (7) instruction for most fourth graders is based on a single basal reader; and (8) reasoning activities are not emphasized in class. (Extensive tables of data are included; a procedural appendix and an appendix of data are attached.) (NKA)
Transcript of ed317990.tif - ERIC - Education Resources Information Center · not emphasized in class. ... Ant...
DOCUMENT RESUME
ED 317 990 CS 010 130
AUTHOR Langer, Judith A.; And OthersTITLE Learning to Read in Our Nation's Schools: Instruction
and Achievement in 1988 at Grades 4, 8, and 12.Report No. 19-R-02.
INSTITUTION Educational Testing Service, Princeton, N.J.;National Assessment of Educational Progress,Princeton, NJ.
SPONS AGENCY National Center for Education Statistics (ED),Washington, DC.
REPORT NO ISBN-0-88685-102-5PUB DATE Jun 90GRANT G000720335NOTE 119p.; For related reports, see ED 315 728 and CS 212
391.
AVAILABLE FROM National Assessment of Educational Progress,Educational Testing Service, Rosedale Rd., Princeton,NJ 08541-0001 ($14.00).
PUB TYPE Reports - Research/Technical (143)
EDRS PRICE MF01/PC05 Plus Postage.DESCRIPTORS Elementary Secondary Education; *Grade 4; *Grade 8;
*Grade 12; *Reading Achievement; Reading Attitudes;*Reading Comprehension; *Reading Instruction; ReadingTests; School Surveys; Student Evaluation; TeacherAttitudes
IDENTIFIERS *National Assessment of Educational Progress
ABSTRACTTo assess the reading achievement of American school
children; the National Assessment of Educational Progress (NAEP)surveyed nationally representative samples of approximately 13,00Cstudents at grades 4, 8, and 12 attending public and private schoolsacross the nation. Students read a variety of literary andinformative passages and then auswered a series of multiple-choiceand open-ended questions designed to measure their ability to readand comprehend these passages. In addition, students providedbackyround information about their reading experiences both in andout of scaool. To supplement this information, the teachers of fourthgraders participating in the assessment completed a questionnaireabout the instruction their students received. Findings indicatedthat: (1) the average; reading proficiency of students increasedsubstantially from grades 4 to 8 and less dramatically from grades 8to 12; (2) at all three grade levels, there were great differences inreading proficiency according to socioeconomic status; (3) moreproficient readers reported home aAd school environments thatemphasized academic a.::hievema.nt; (4) students reported doing verylittle reading in school and for homework; (5) students' interest inbooks seems to decrease as they progress through school; (6) emphasison beginning reacting instruction in grades 1, 2, and 3 isoverwhelmingly phonics-based; (7) instruction for most fourth gradersis based on a single basal reader; and (8) reasoning activities arenot emphasized in class. (Extensive tables of data are included; aprocedural appendix and an appendix of data are attached.) (NKA)

Learning to Read inOur Nation's Schools:
THE NATION'SREPORT paw
CARD
INSTRUCTION AND ACHIEVEMENT IN 1988 AT GRADES 4, 8, AND 12
U.S. DEPARTMENT OF EDUCATIONOthce of Educational Research and Improvement
EDUCATIONAL RESOURCES INFORMATIONCENTER (ERIC)
(1 This document has been reproduced asreceived Irom the person or organizationor it
I' Minor changes have been made to improvereproduction quality
Points of view or opinions slated in this doir ument do not necessarily represent officialOERI DOSIIIOn Or 0011CV
crt rt
11
Prepared by EDUCATIONAL TESTING SERVICE under a grantfrom THE NATIONAL CENTER FOR EDUCATION STATISTICS
OFFICE OF EDUCATIONAL RESEARCH AND IMPROVEMENT U.S. DEPARTMENT OF EDUCATION
s:JBEST COPY AVAILABLE

What is The Nation's Report Card?
l'he Nation's Report Card, the National Assessment of Educational Progress INAEPI, is 'he onlynationally represertative trill continuing assessment of what America's students know and can do invarious subject areas. Since. 191;9.70, assessments have been conducted periodically in reading,mathematics, science, writing, history/geography, and Other fields. By making objective inhumation onstrident perfiamarice available to polkyrnakers at the national state, and local levels, NAEP is anintegral part of our nation's evaluation of the condition and progress of education. Only informationrelated to academic achievement is collected under this program. NAEP guarantees the privacy ofindividual students and their families.
NAEP is a congressionally mandated project of the National Center for Edia:atirm Statistics, the U.S.Department of Education. The Commissioner of Education Statistics is responsible, by law, for carryingout the NAEP project through competitive awards to qualified organizations. NAEP reports directly tothe Commissioner, who is also responsible for providing continuing reviews, including validationstudies and solicitation of piddle comment, on NAEP's conduct ar,d usefulness.
In the 1988 Amendments, Congress created the National Assessment Governing Hoard (NAG toformulate the polity guidelines for NAEP. 'The board is responsible for selecting the subject areas to beassessed, which may include adding to those specified by Congress; identifying appropriateachievement goals far each age and grade; developing assessment objectives; developing testspecifications; designing the assessment methodology; developing guidelines and standards for dataanalysis and kir reporting and disseminating results; developing standards and procedures forinterstate, regional, and national comparisons: improving the form and use of the National Assessment;and ensuring that all items selected for use in the National Assessment are free from racial, cultural,gender, or regional bias.
The National Assessment Governing BoardDr. (healer IL Finn, Jr., 1:hadrivaan
trtu..ation and%anderbill I 'inv.:siltyW'ashinglon n C
Honorable Wilhelmin... Delco, Vire-t :hair-man
H11114` ut IlepresentatnesAustin r c +AS
Mra. Phyllis WIllignmon UlrichCur' 'cutout CoordulatiiiSaratoga Springs. New York
Ma. Prancie Alexander.4.y.oeiatc stye! intend/4dCahn,' lila [typal-1:11N1 ill EducationSacramento. California
Mr. David Itartinihigh Iiistory l'eacheiCairo. 7si ew N't k
1k Richard A. HordI ntivc I hreentiMartha holden leititings FoundationClewlatid Ohio
Mr. Drum E. RrombarherMiddle ,11)11.111:1111'S EtcherI 'MINT Al Ohio
Honorable Michael N. Castle0,1,17.1i101 of I /rIIIN,111.
1.111nt41gtnn. Ilela,,aip
honorable Raul CoopermanCuntlnisinnrl 1 I i durationrm. Jeri.' ltepailinent of Education
lrenton. Nuw Jersey
Ma. Antonia Corteseire President
New Turk Stale Cnited leachersAlhaiw New SOrk
Mr. t;hrialopher 1'. Croon, E.r (Writ,Seel VI$1%
(Mill' of t. and11111111)V1`1111111
111'. Victor 11. PerryPliurlpal
soottmemiVaterfoill Cnneetklit
Mr. Michael S. tamed.iv%iiining Slate Hoard of Educate .1
Sal 'itoga iming
Mr. Dale It. GraluimIligh school Principal (1rtit.ed)Columbia City, Indiana
Mr. Elton JollyIh emitent and Et1.11111%f. Office!
ol Anie;Philacietphia. Penliwhania
111r. Cart J. MoserActull(1 nrrl tot of 1.1 111.1114F%' :11111
',el "MIMS: SOUK Lk
V1111114,111 ( 11111(11 Ntis,ouri !scum'Saint Louis, Nlitwouri
Mr. Mark Musicke..iilent
Southern Regional I chic:Ilion Mimi,,1tlanta.
Honorable Carolyn PollanArkait,a, tit HepreseitlatiwsFun Sunni. Arkansas
Dr. Matthew R. Prophet. Jr.sone: intendeni of School,Portland ( 11 egon
11r. Dorothy K. Rich1,11.sident
Muni. and S heel InstituteWashington. I) C
Rimorahle Richard 1A. Riley1.01111,1 I anrronr of South CarolinaColumbia. Smith Carolina
Mr. Thome* 'l'opureoM11'1'1111
I..1%1, I /WI, es of Faulk RogotienskiCorunado California
Dr. Herbert J. lialbergpriar,w), nt P,,Iii, ithi)I nrrisit%'Imago
Dr. Ilny TrubiI.11111i.1)111.11111, NA( inWatillillg(l1111 I)


U.S. Department of EducationLatiro F. CavazosSecretary
Office of Educational Research and ImprovementChristopher T. CrossAssistant Secretary
National Center for Education StatisticaEmerson J. ElliottActing Commissioner
This report, No. 19-R-02, can he ordered from the Natio al Assessment of Educational Progress,Edra.,ational Testing Service, Rosedale Road, Princeton, New Jersey 08541-0001.
1,ffirary of Congress, Catalog Card Numbs i . 90-1;1554
ISBN: 0.88685-10Z-5
The contents of Iltis booklet were developed tinder a grant from the Department of Education. However,those contents do nut 11VIVS. irily reflect the play of the Department of Education, anti you should notassume endorsement by the Federal Government.
The work upon which this pub.ication is based was performed pursuant to Grant No.G-0014720335 of the Office of Educational Research and Improvement.
Educational 'testing Service is an equal opportunity/affirmative action employer.
hducatimial 'testing Service, EIN, and I are registered trademarks of Educational 'resting Service,

Learning to Readin Our Nation's Schools:
INSTRUCTION AND ACHIEVEMENT IN 1988 AT GRADES 4, 8, AND 12
Judith A. Langer Arthur N. ApplebeeIna V.S. Mullis Mary A. Foertsch
JUNE 1990
THE NATIONAL ASSESSMENT OF EDUCATIONAL PROGRESS
Prepared by EDUCATIONAL TESTING SERVICE under a grant fromTHE NATIONAL CENTER FOR EDUCATION STATISTICS
OFFICE OF EDUCATIONAL RESEARCH AND IMPROVEMENT U.S. DEPARTMENT OF EDUCATION

TABLE OF CONTENTS
OVERVIEW 6
Major Findings 7
A Note an Interpretations 9
PART I: WHO READS BEM? 11
CHAPTER Demographic and Academic Factors RelatedONE: to Reading Achievement 12
Results for the Nation arid Demographic Subgroups 12
Emphasis on Academic Achievement 15
Parents' Level of Education 15
Amount of Homework 16
Amount of Reading for School 17
An Early Start in School 19
High School and Beyond 19
Summary 22
CHAPTER Students' Reading Experiences 23TWO: Independent Reading 23
A'ailability of Reading Materials 27The Value of Heading 32
Summary 36
CHAPTER Reading Instruction 38THREE: Initial Reading Instruction 38
Time Spent on Reading Instruction 39Classroom Organization for Reading Instruction 41
Emphasis on Reading Skills 43Instructional Material for Reading 50Other Instructional Resources 51Difficulty of Reading Materials 53Emphasis on Testing 54Recent Changes in Teaching Practices 56
Summary 57

CHAPTER The Characteristics of Fourth-Grade Reading Teachers:FOUR: A Closer Look 58
Gender and Race/ElImicity r8
Preparation to leach 59Teaching Experience 6(.1
Teacher Autonomy 61
Continuing Commitment to leachingSummary
PART II: HOW WELL DO STUDENTS READ? 65
CHAPTER An Analysis of Performance on Individual Reading Tatiks 67FIVE: Overview of the Results 68
Constructing MeaningCross-Grade Comparisons 88Constructing and Examining Meaning 90
Ant and Dove 91
Big Wind 92High Tech Pizza
Summary 95
Procedural Appendix 96
:ata Appendix 109
Li

OVERVIEW
This report from The Nation's Report Card is based or a1988 assessment of the reading achievement of American schoolchildrenconducted by the National Assessment of Educational Progress (NAEP).The survey involved nationally representative samples of approximately13,000 students at grades 4, 8, and 12 attending public and private schoolsacross the nation.
Students were asked to read a variety of literary andinformative passages and then to answer a series of multiple-choice andopcnended questions designed to measure their ability to r' ad andcomprehend these passages. Some multiple-choice questions asked themto identify the overall message or author's purpose in a reading passage.Other questions asked them to identify specific information, such as plotelement. The open -ended questions required students to extend themeaning they initially constructed from the text for example, bydiscussing the moral of a story or by describing the nature of certainevents, In addition, htudents were asked to provide backgroundinformation about their experiences with reading, such as the types ofreading they did in anti out of school, the nature of the instruction theyreceived, and their home support for reading. This report focuses on thebackground factors that are thought to be most closely related to readingperformance, including students' demographic characteristics, readingexperiences, and reading instruction.
To supplement the information reported by students, theteachers of fourth graders participating in the assessment were asked tocomplete a questionnaire about the instruction their students received.The teachers were asked to identify the ability level of each student'sreading class, and to provide information about assignments, resources,and instructional emphases. Thus, for the first time, NAEP can examinethe relationship between students' reading performance and theinstruction they receive, as reported by their teachers.

Major Findings
kl* The average reading proficiency of Americanschoolchildren increased twbstantially from grade 4 tograde 8 and somewhat less dramatically between grades 8and 12. in general, moderns appeared to have greatdifficulty with tasks that asked them to explain or elaborateon what they had read, and less difficuliy with questionsasking about overall meaning and specific details.
At all three grade levels assessed, there were largedifferences in reading proficiency according tosocioeconomic status. Twelfth-grade students fromdisadvantaged urban schools performed, on average, belowthe leve,1 of eighth-grade students from advantaged urbanschoois. Similarly, Black and Hispanic students did less wellthan White students at all three grade levels assessed.
ro. More proficient readers reported home and schoolenviromnents that emphasized academic achievement.More homework, more required reading, and moreadvanced coursework all seemed to be associated withhigher reading performance, as did attendance inpreschool and kindergarten.
Students reported doing very little reading in school andfor homework. At all three grade levels assessed,approximEitely half of the students (47 to 61 percentsreported reading 10 or fewer pages each day forschoolworx across the curriculum.
0 Not all students are "hooked on books," and their interest inbooks eerrs to decrease as they progress through school.Three-quarters of the fourth-grade students reportedreading for fun at least weekly, but only half of the twelfth-grade students reported doing so. Fewer students in theupper grades reported having more than 20 books of theirown. Also, students at grades 8 and 12 reported using thelibrary to take out books much less frequently than didfourth-grade students. Two-thirds of the fourth graderssaid they used the library at least weekly, compared to 24percent of the eighth graders and 12 percent of the twelfthgraders.
7

0 Students seem to prefer television over books. Sixty-ninepercent of the fourth graders reported watching threehours or more of television each day, while less than half(46 percent) reported reading for pleasure on a daily basis.
Students who reported more access to reading materialsincluding books and magazines of their own, as well asother reading materials available in their homes hadhigher average reading proficiency than students who didnot report as much access to such reading materials.
Approximately one-third of the eighth and twelfth gradersreported never discussing reading at home, and thesestudents had significantly lower reading proficiency.
Acc,rding to the fourth-grade teachers surveyed, theemphcsis in beginning reading instruction in grades 1, 2,and 3 was overwhelmingly on phonics-based or eclecticapproaches.
POP Instruction for most fourth-grade students is based on asingle basal reader, with other books and magazinesavailable for supplementary reading. As part of theirreading instruction, 79 percent of the students are assignedto ability-based reading groups. Of their instructional time,typically one hour each day, almost half is spent in smallgroups. Yet, 28 percent of the students are never or rarelyasked to discuss their reading in small groups.
According to their teachers, 28 percent of the fourthgraders receive daily instruction on word-attack skills and40 percent receive daily instruction on vocabulery. Fifty-seven percent receive workbook oi skill-sheet assignmentsevery day.
jlo- Higher-level reasoning activities, such as discussing,analyzing, or writing about what they have read, arcreportedly not emphasized routinely for students. Further,mJst students reported having little difficulty under-standing their reading and literature texts.
Additior 1 information provided by fourth-grade readingteachers indicated they are experienced and well trained.They reported considerable autonomy in decisions aboutthe sequence of classroom instruction, but little in theirchoices of what to teach. More students attendingdisadvantaged urban schools had teachers who reportedlimited autonomy.
The information provided by students and teachers givesan indication of how reading is being taught in American schools.Students across the grades appear to spend little time each week readingfor school or for pleasure on their own. Fourth-grade teachers reportusing skill sheets and workbook exercises particulavly with students inlower ability classes on a more regular basis than any otherinstructional resource. It may not be surprising, then, that students'performance was quite low on assessment itwns that requiredorganizational skills and the ability to synthesite information.
A Note on Inierpretations
Information about students' performance in the 1988 NAEPreading assessment was based on a wide range of reading materials,including literary and in:Jrmational passages covering a number ofsubject areas. The passages varied in length from brief selections on asingle concept to complex passages about specialized tupics in science orsocial studies. Comprehension of these passages was assessed by itemsranging from multiple-choice questions asking students to identify basicinformation to open-ended questions asking them to interpret and explainwhat they had read.
The Nation's Report Card presents information on theperformance of groups of students, not individuals. The two measures ofachievement included in this report are students' average readingperformance on the NAEP reading scale, and the percentages of studentsresponding correctly to particular subsets of the reading questions. TheNAEP reading scale summarizes students' performance on a 0 to 500 scalethat allows for direct comparisons across the grades and amongsubgroups of the population assessed, (See the Procedural Appendix forfurther information.)
Because achievement results are based on samples, theyare necessarily estimates. Like all estimate;, based on surveys, they aresubject to sampling error as well as measurement error. NAEP computesstandard errors using a complex procedure that estimates the samplingerror and other random error associated with the observed assessmentresults. The standard errors indicated in the tables in this report wereused to construct 95 percent confidence intervals around the estimatedresults, Thus, it can be said with approximately 95 percent certainty thatfor each population of interest, the average reading proficiency is within± 2 standard errors of the estimated value.
9

No one can control all the possible variables that influencea survey. Nor can all factors that influence achievement be considered inany particular interpretation of the data, because any particularrelationship between students' achievement and their characteristics andexperiences may be explained in more than one way. While theinterpretive comments in this report represent the best professionaljudgments of NAEP staff and consultants, they must stand the tests ofreasoi and critical discussion. It is hoped that the information containedin this report will stimulate interest in gaining a more thoroughunderstanding of the results, and motivate educators and the generalpublic to take appropriate action.
This report is divided into two parts. Part I focuses on therelationships between students' overall reading performance and a varietyof demographic and academic factors. The chapters in this section alsoinclude information on the perceptions of teachers and students oncurrent emphases and practices in reading, and on the relationshipbetween these factors and students' reading performance. Part II presentsan analysis of student performance on the individual reading tasksincluded in the 1988 assessment.
10

IWHO READS BEST?
Demographic, School, Home, awl InstructionalFactors Related to Reading Achievement
The first part of this report comprises four chapters thatdescribe the average reading proficiency of fourth, eighth, and twelfthgraders in relation to their background characteristics and the nature ofthe reading instruction they receive. Chapter 1 compares overall readingproficiency across the grades and across subpopulations defined by race/ethnicity, gender, and region, as well as by a variety of home and schoolcharacteristics. Chapter 2 summarizes information on students' readingexperiences. Chapter 3 discusses student and teacher reports of readinginstructional practices. For the first time, NAEP is able to link students'performance to descriptions of what happens in the classroom asreported by their teachers. Chapter 4 provides additional informationabout the characteristics of fourth graders' reading teachers.
11

1
12
Demographic and Academic Factors Relatedto Reading Achievement
To measure students' reading proficiency, NAEP based the1988 assessment on a wide range of reading materials and tasks. Thepassages chosen were diverse, including literary and expository selectionsfrom a variety of subject areas and a variety of sources, such as books andperiodicals. They ranged in length from brief passages expressing a singleconcept to long, complex articles about relatively specialized topics inscience or social studies. Comprehension of these passages was assessedin a variety of ways, ranging from multiple-choice questions askingstudents to identify basic information to open-ended questions askingthem to interpret and explain what they had read.
For the present report, NAEP used techniques based onitem response theory (IRT) to estimate reading performance at the threegrade levels on a common scale ranging from 0 to 500. The scale allowscomparisons of performance between grade levels and among subgroupsin the population. (See the Procedural Appendix for further information.)
NAEP assessments make it possible to examine therelationships between student proficiency and a wide variety ofbackground factors, relating performance to one or several variabEs at atime. The selection of background questions included in the NAEPassessments is guided by the wide body of available research about factorsinfluencing student learning. Thus, the NAEP survey results based onlarge samples of students often help to confirm our understanding ofhow school and home factors relate to achievement. Although the effectsof schooling are of prime concern, these analyses do not reveal theunderlying causes of the relationships between background factors andperformance. Therefore, the NAEP assessment results are most usefulwhen they are considered in light of other knowledge about theeducational system, such as trends in instruction, in the school-agepopulation, and in societal demands and expectations.
Results for the Nation and Demographic Subgroups
NAEP typically reports performance for the nation as awhole and for demographic subgroups defined by race/ethnicity, region,size and type of school community, and gender. The average readingproficiency results for these variables are summarized in "IARI,E, 1.1.

TA 131.E
1.1Average Reading Proficiency forStudents in Grades 4, 8, and 12 for theNation and Subpopuiations
Average Reading Proficien
Grade 4 Grade 8 nrada 12
Nation 230.4 (1.1) 262.8 (1.0) 287.1 (0.8)
Race/EthnicityWhite 238.1 (1.2) 269.2 (1.3) 292.6 (1.0)Black 210.6 (1.9) 245.7 (2.0) 270.3 (1.6)Hispanic 209.9 (2.4) 243.6 (2.1) 267.1 (2.4)
RegionNortheast 233.1 (2.8) 268.1 (1.8) 287.0 (2.1)Southeast 224.4 (2.5) 2593 (1.8) 284.3 (1.1)Central 234.6 (2.2) 264.3 (3.4) 289.3 (1.6)West 230.2 (2.3) 260.1 (1.4) 287.7 (1.5)
Size and Typeof Community
Advantaged Urban 247.5 (2.9) 273.9 (2.8) 296.0 (2.6)Disadvantaged Urban 208.3 (3.2) 247.4 (2.9) 269.4 (3.0)Rural 228.3 (2.9) 270.5 (3.4) 287.7 (3.2)
GenderMale 226.6 (1.5) 256.4 (1.3) 282.9 (1.1)Female 234.4 (1.2) 269.6 (1.1) 291.0 (1.1)
Standard ,.irrors appear in parentheses. It can be aid with approximately 95 percent certainty that for each population ofinterest, the average reading proficierry is within . 2 standard errors of the estimated value. Note: More detailed informationon these subpopulations is provided in the Proce Jural Appendix.
Results for the nation show, as would be expected, thatreading proficiency increases between grades 4 and 8, and again betweengrades 8 and 12. The difference between grades 4 and 8 is somewhatlarger than that between grades 8 and 12 (32 points versus 24 points,respectively, on the proficiency scale), indicating that the growth ofreading skills slows somewhat in the high-school years.
Students' average reading proficiency for subpopulations ofinterest provides a global look at differences in performance. Ininterpreting these differences, however, it should he recognized thataverages tend to mask the full distribution of reading achievement withinparticular subpopulations. For example, in looking at results for White,Black, and Hispanic students, it is clear that the performance of minoritygroups historically at-risk for school failure is lower than that of White
13

students, on average. By grade 12, the average performance of Black andHispanic students only reaches the level of eighth-grade White students.Nevertheless, at any given grade, some White students were among theleast proficient readers and some Black and Hispanic students wereamong the most proficient. (See the Data Appendix for more detailedinformation on the distributions of performance for various sub-populations.)
The results indicate that growth in reading achievementacross the grade levels is somewhat greater for Black and Hispanicstudents than for White students, particularly between grades 4 and 8. Forexample, whereas White students improved 31 points between grades 4and 8, Black students improved 35 points. Thus, across the grade levelsexamined, the performance gaps observed between the two group; ofminority students and their White counterparts did appear to narrowsomewhat. At grade 4, for example, Black students' average readingproficiency was 28 points lower than that of White students; by grade 12,the gap was reduced to 22 points.
In large part, these differences in performance reflectdifferences in socioeconomic status. The relationships betweensocioeconomic status and reading proficiency are indicated in thecomparisons of average reading proficiency for students who attendschools in advantaged urban, disadvantaged urban, and extreme ruralcommunities. The average reading proficiencies of students fromadvantaged and disadvantaged urban communities differed by nearly 40points at grade 4, a gap that decreased by as much as 14 points at grades 8and 12. The average performance of students from rural communityschools fell between performance by students from the two types of urbancommunity schools at all three grade levels 'xamined.
Regional differences in performance were also evident inthe overall results. At grade 4, students from the Southeast averaged nearly10 points lower in reading proficiency than students from the Central andNortheastern regions. Although average reading performance in theSoutheast continued to be somewhat lower than that in other regions atgrade 12, the gap was reduced to 5 points on the proficiency scale.
The final set of comparisons in Table 1.1 focuses on genderdifferences. As in previous NMI' assessments of literacy skills, the averagereading proficiency of females is significantly higher than that of males atall three grade levels, with no reduction in the gap at the upper gradelevels. The difference in performance went from 8 to 13 points betweengrades 4 and 8, and then returned to 8 points at grade 12.

Emphasis on Academic Achievement
Whatever subgroups they belonged to, students' levels ofperformance were related to the extent to which academic achievementswere emphasized. Indeed, some of the principal recommendations in therecent school reform movement have focused on ways to increase theemphasis on academic skills. These recommendations have taken manyforms, including broadening access to preschool or kindergartenprograms, beginning school earlier, requiring more advanced courses,and requiring more homework. The assessment included a number ofquestions related to these issues; the results are summarized in thissection.
Parents' Level of Education
Regardless of their level of education, parents are likely towant their children to do well in school, and to pursue academic careersat least as far as they were able, if not further. Students whose parents arebetter educated tend to perform better in the NAEP assessments in varioussubject areas and the reading results followed this pattern. TABLE 1.2relates fourth-, eighth-, and twelfth-grade students' average proficiencywith information they reported on their parents' highest levels ofeducation.
TABLE
1.2
Parents' HighestLevel of Education
Average Reading Proficiency byParents' Highest Level of Education
Grade 4
Average Proficiency
Grade 8 Grade 12
Did not graduatehigh school 204.4 (3.2) 244.8 (2.2) 271.4 (2.1)
Graduated high school 225.9 (2.1) 256.3 (1.5) 278.2 (1.1)Some college 240.8 (2.1) 268.6 (1.4) 288.6 (1.2)Graduated college 240.9 (1.3) 272.7 (1.2) 295.9 (1.2)
Standard errors appear in parentheses. It can be said with approximately 95 percent certainty that for each population ofinterest, the average reading proficiency is within .12 standard errors of the estimated value. Note: Parents' Highest level ofEducation Is a composite variable, developed from responses to two questions on the highest level of education attained byeach parent.
15
'J

At all three grades, there is a clear relationship betweenparents' level of education and students' reading proficiency. Studentswho reported that at least one parent had graduated from collegeaveraged from 25 to 37 points higher in reading proficiency than did thosewho reported that neither parent graduated from high school.
Amount of Homework
Another set of questions related to an emphasis onacademic achievement focused on the amount of homework required atgrades 4, 8, and 12. Generally, students who reported receiving andcompleting homework tended to read more proficiently than theirclassmates who either did not have homework assigned or did not dotheir homework. However, as has been true in previous assessments,there were differences between grades in the amount of homeworkassociated with the highest levels of reading proficiency (TABLE 1.3).
TABLE
1.3Average Reading Proficiency and Percentageof Students Reporting Different Amounts ofTime Spent on Homework Each Day
Time Spent on Homework
Grade 4
PercentageAverage
Proficiency
Have none 17.4 232.3 (2.2)Don't do 3.5 203.6 (4.4)1/2 hour or less 34.2 231.0 (1.4)1 hour 26.9 235.3 (1.6)More than 1 hour 18.0 226.1 (2.3)
Grade 8Have none 4.6 252.4 (3.7)Don't do 5.8 238.8 (5.1)1/2 hour or less 18.6 260.9 (1.5)1 hour 41.8 265.6 (1.1)2 hours 19.9 268.8 (1.2)More than 2 hours 9.3 265.1 (2.0)
Grade 12Have none 10.2 269.1 (2.6)Don't do 9.2 280.7 (2.4)1/2 hour or less 19.0 287.7 (1.8)1 hour 32.9 288.4 (0.9)2 hours 18.3 292.6 (1.6)More than 2 hours 10.5 296.2 (2.4)
Standard errors appear in parentheses. It can he said with approximately 95 percent certainty that for each population of
interest, the average reading proficiency is within ± '8 standard errors of the estimated value.
16

At grade 4, the highest average reading proficiency wasassociated with one hour of homework. However, this level of proficiencydid not differ extensively from the average proficiency of students who hadno homework or who only did about one-half hour of homework eachday. Fourth graders who reported working on their homework more thanone hour each day tended to have lower reading proficiency than theirclassmates who reported doing less homework, perhaps because poorerreaders take longer to complete their homework or are given additionalwork to help improve their reading skills. Reading teachers of fourthgraders did report assigning less homework to better readers (see Chapter3). The small percentage of fourth graders (4 percent) who reported notdoing their homework had by far the lowest reading proficiency.
At grade 8, students who reported having and doinghomework had higher average reading proficiency than theircounterparts who reported having no homework or not doing it. Studentswho reported two hours of homework per day tended to have the highestreading proficiency; incrementally higher proficiencies were noted withincreases 'n homework up to two hours.
By grade 12, the results indicate a clear relationshipbetween amount of homework and reading proficiency. Fir students whoare assigned homework and do it, the more homework they reportcompleting each day, the higher their reading proficiency. Highpercentages of high-school seniors reported that they usually have nohomework (10 percent) or that they have homework but do not do it(another 9 percent). Interestingly, compared to students in the lowergrades, the students who reported no assigned homework had the lowestaverage proficiency, lower even than their classmates who reported notdoing their homework. It appears that by grade 12, the poorest readers aretaking courses that involve little homework.
Amount of Reading for School
Closely related to the amount of homework is the amountof reading that students do for their school work, whether at school or athome. Students' reports of the number of pages read per day at grades 4,8, and 12 are summarized in TABLE 1.4. Especially at grades 8 and 12,them ;.; .,11 evident relationship between reading proficiency and amountof school reading, with those who do more reading having higher readingproficiencies.
17

18
Considering that students in the NAEP assessments ofmathematics, science, civics, and U.S. history reported their instructorsused textbooks as a primary instructional strategy, it is surprising to notethe low amount of school reading reported by students.' At all three gradelevels, approximately half the students reported reading 10 or fewer pageseach day for their schoolwork across all curriculum areas. Curiously,students in the upper grades reported reading somewhat fewer pageseach day for their schoolwork than did the fourth graders. Some 47percent of the fourth graders, for example, reported reading 10 or fewerpages per day, compared with 61 percent of the eighth graders and 56percent of the twelfth graders. The amount of reading associated with thehighest reading proficiency did rise somewhat across the grades, however.At grade 4, the highest average proficiency occurred for students reading11 to 15 pages per day, while at grades 8 and 12, it occurred for studentsreading more than 20 pages per day.
TABLE
1.4
Number of pagesread each for
Average Reading Proficiency andPercentage of Students ReportingVarious Amounts of Readingfor School Work
Grade 4
AverageProficiencyPercent
Grade 8
AveragePercent Proficiencyi I
Grade 12
AveragePercent Proficiency
dayschool and homework
5 or fewer6 to 1011 to 1516 to 20More than 20
23.323.614.8;16.222.1'
220.6 (1.8)234.3 (1.6)237.4 (2.1)232.2 (2.0)231.1 (2.1)
31.5 254.1 (1.3) 31.0 276.5 (1.0)29.9 , 265.9 (1.6) 25.1 287.1 (1.2)16.6: 267.8 (1.8) 16.8 293.0 (1.5)10.3 269.2 (2.1) 12.1 293.6 (2.0)11.7 271.6 (2.2) 14.9 298.1 (1.8)
Standard errni., appear in patenthiser,. It can he said miti approxenately 95 percent certainty that for each population of
interest, the averag2 reacting proficiency is within ± "2 standard errors of the estimated voice.
n.liiliti A Dohst..... Ilia Vs Mullis. Mary \l Lindquist. Umiak! L. Chambers. The Alatliemattc,s lieport Card 11)rincvloit. NJ:Educational 'testing tiers ice, National Assessment of Ethicati Progress. 1988i,
Ina 'S Mullis. I ,v nil .lenkins Victivienceliritort Card ilirinceton, NJ: Educational resting Service. NationaMssessinetilof Educational Progress, P1881
David Hammack Michael Ilartoonian. John !lime. Lunn Jenkins. Linda S Lcvslik. \tact tonald. Ina VSEugene h%vii the I '.S. ilistocvlieport Card (Princeton. NJ: Educational 'jesting Service. National Assessment of
Educational Progess 191101.
Lee ilium :sow Lynn It Jenkins. Jame.. Leming %Valle' IS \Lir' )(maid Ina V S .1.1111' 1111.1114. I11(11111 S
11.111.11.1. 111 ('ivies ii(1)1,11 Cal' (Princeton. NJ 1.(lucational 'jesting Service. National ,1si:eiisitient nl EducationalProwess, 1111101

An Early Start in School
It would seem likely that students who begin school earlierare also more likely to do well later on. lb examine this, fourth-gradestudents in the assessment were asked whether they had attendedpreschool, nursery, or daycare, and whether they had attendedkindergarten. Their responses are summarized in TABLE 1.5.
TABLE
1,5Average Reading Proficiency and Percentage ofStudents Reporting Attendance in Kindergartenor in Preschool, Nursery, or Daycare, Grade 4
AttendedPreschool, Nursery, or
Daycare
Yes
AttendedKindergarten
No Yes No
Average Average Average AveragePercent Proficiency Percent Proficiency Percent Proficiency Percent Proficiency
Nation 59.6 237.5 (1.3) 31.7 222.4 (1.4) 95.8 231.6 (1.1) 3.5 207.6 (4.9)
Race/EthnicityWhite 61.1 244.5 (1.2) 30.7 230.1 (1.9) 97.0 238.9 (1.2) 219.3 (6.8)Black 59.3 216.5 (2.6) 31.5 203.0 (2.9) 92.3 211.7 (1.9) 7.2 202.4 (9.7)Hispanic 52.2 217.6 (2.8) 36.8 205.5 (2.9) 93.9 211.5 (2.5) 4.7 192.5 (10.5)
Standard errors are presented in parentheses. It can be said with approxim=l-cly 95 percent certainty that for each populationof interest. the average reading proficiency is within ± 2 standard errors of the estimated value.
Sixty percent of the fourth graders reported some sort ofpreschool experience, and 96 percent reported that they had attendedkindergarten. In both cases, the average reading proficiency was higherfor students who reported having an earlier start. These relationshipswere evident for Black and Hispanic students, as well as for their Whitecounterparts.
High School and Beyond
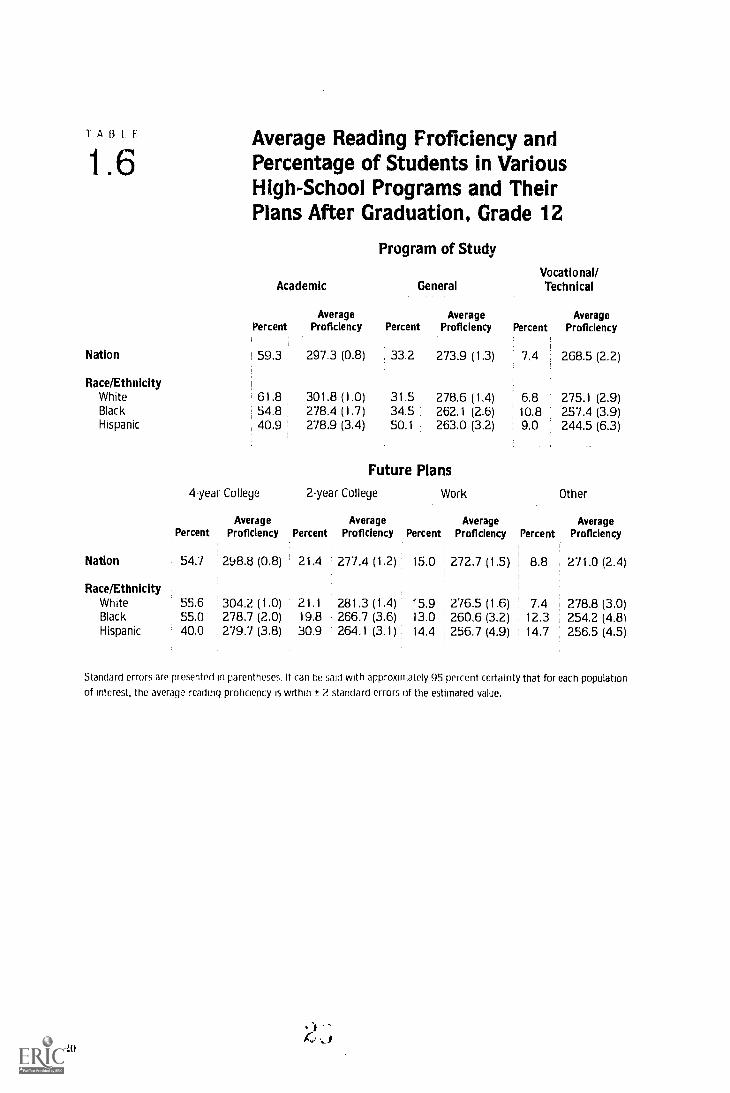
At the high-school level, students have a variety of choicesin coursework and programs, and they make decisions about whetherthey will continue their education after high school. TABLE 1.6 summar-izes twelfth-grade students' responses to questions about the emphasis intheir high-school program, as well as about their future plans.
19
T A 13 L E
1.6
Nation
Race/EthnicityWhiteBlackHispanic
Average Reading Proficiency andPercentage of Students in VariousHigh-School Programs and TheirPlans After Graduation, Grade 12
Program of Study
Vocational/Academic General Technical
Average Average AveragePercent Proficiency Percent Proficiency Percent Proficiency
59.3 297.3 (0.8) , 33.2 I 273.9 (1.3) 7.4 268.5 (2.2)
61.8!54.840.9
301.8 (1.0)278.4 (1.7)278.9 (3.4)
31.534.550.1
278.6 (1.4)262.1 (2.6)263.0 (3.2)
Future Plans
4 year College 2-year College Work
AveragePercent Proficiency Percent
6.81 10.8
9.0
275.1 (2.9)257.4 (3.9)244.5 (6.3)
Other
Average Average AverageProficiency Percent Proficiency Percent Proficiency
Nation 54.7 298.8 (0.8) 21.4 277.4 (1.2) I 15.0 272.7 (1.5) , 8.8 , 271.0 (2.4)
Race/EthnicityWhite 55.6 304.2 (1.0) 21.1 281.3 (1.4) 15.9 276.5 (1.6) 7.4 278.8 (3.0)Black 55.0 278.7 (2.0) 19.8 266.7 (3.6) 13.0 260.6 (3.2) 12.3 254.2 (4.81Hispanic 40.0 279.7 (3.8) 30.9 264.1 (3.1) 14.4 256.7 (4.9) 14.7 256.5 (4.5)
Standard errors are presented in parentheses. It can be said with approxinately 95 percent certainty that for each population
of Interest, the average reading proficiency is within ± 2 standard errors of the estimated value.
K./20
For the nation as a whole, 59 percent of the students atgrade 12 reported being enrolled in an academic program of study, and 55percent said they planned to go on to a four-year college. The expectationsof Hispanic students were noticeably lower than those of their White orBlack counterparts. Only 41 percent were enrolled in academic programs,and only 40 percent expected to go on to four-year colleges. In general,students in academic programs had higher average reading proficiencythan those in general or vocational/technical programs.
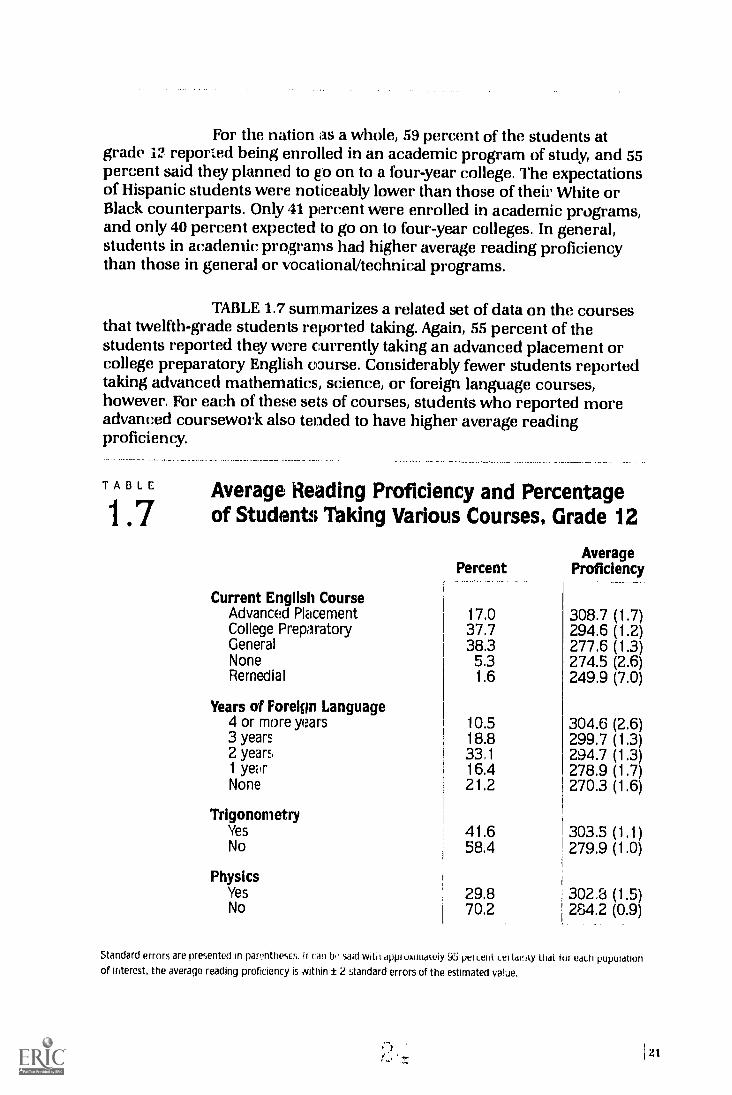
TABLE 1.7 summarizes a related set of data on the coursesthat twelfth-grade students reported taking. Again, 55 percent of thestudents reported they were currently taking an advanced placement orcollege preparatory English course. Considerably fewer students reportedtaking advanced mathematics, science, or foreign language courses,however. For each of these sets of courses, students who reported moreadvanced coursework also tended to have higher average readingproficiency.
TABLE
1.7Average Reading Proficiency and Percentageof Students Taking Various Courses, Grade 12
Current English Course
PercentAverage
Proficiency
Advanced Placement 17.0 308.7 (1.7)College Preparatory 37.7 294.6 (1.2)General 38.3 277.6 (1.3)None 5.3 274.5 (2.6)Remedial 1.6 249.9 (7.0)
Years of Foreign Language4 or more years 10.5 304.6 (2.6)3 years 18.8 299.7 (1.3)2 years 33,1 294.7 (1.3)1 year 16.4 278.9 (1.7)None 21.2 270.3 (1.6)
TrigonometryYes 41.6 303.5 (1.1)No 58.4 279.9 (1.0)
PhysicsYes 29.8 302.8 (1.5)No 70.2 284.2 (0.9)
Standard errors are presented in parentheses. It can bo said witi l dppl Uxllllatt ly yJ peiLeilt Lei trway tildt tui (kith pUpUldtIOii
of 'Merest, the average reading proficiency is within t2 standard errors of the estimated value.
'73 121

Summary
The assessment results for the naticn and for demographicsubgroups indicate that reading proficiency increases between graces 4and 8, and then rises somewhat more slowly between grades 8 and 12. Ingeneral, students attending schools in advantaged urban communities,White students, students from the Northeast and Central regions, .andfemales had somewhat higher average reading proficiency than didstudents in rural or disadvantaged urban community schools, Black andHispanic students, students from the Southeast, and males. Thesedifferences parallel those that have been found in previous assessments,but the magnitude of the differences in reading performance betweenmore advantaged and less advantaged students remains unacceptablylarge.
Analyses of the degree of emphasis on academicachievement indicate that students who have more academically orientedand challenging experiences were likely to be more proficient readers.Those students who reported doing more homework and more readingfor school had higher reading proficiency as did those students whoreported an earlier start in school through day-care or kindergarten.High-school seniors with higher reading proficiency reported beingenrolled in academic programs and taking more rigorous coursework. Itis not known, however, whether low enrollments in advanced courseswere due to students choosing not to take such courses, or the lack ofsuch course offerings in their schools.
ZZ J

2Students' Reading Experiences
In addition to their proficiency in reading, good readersdevelop an understanding of the purposes for reading, read a wide varietyof materials on their own for interest and enjoyment, and learn to sharetheir reading experiences with their friends and families. This chapter willexplore how often students choose to read on their own, what kinds ofreading they do, and the extent to which books and reading activitiesappear to be a part of their lives.
Independent Reading
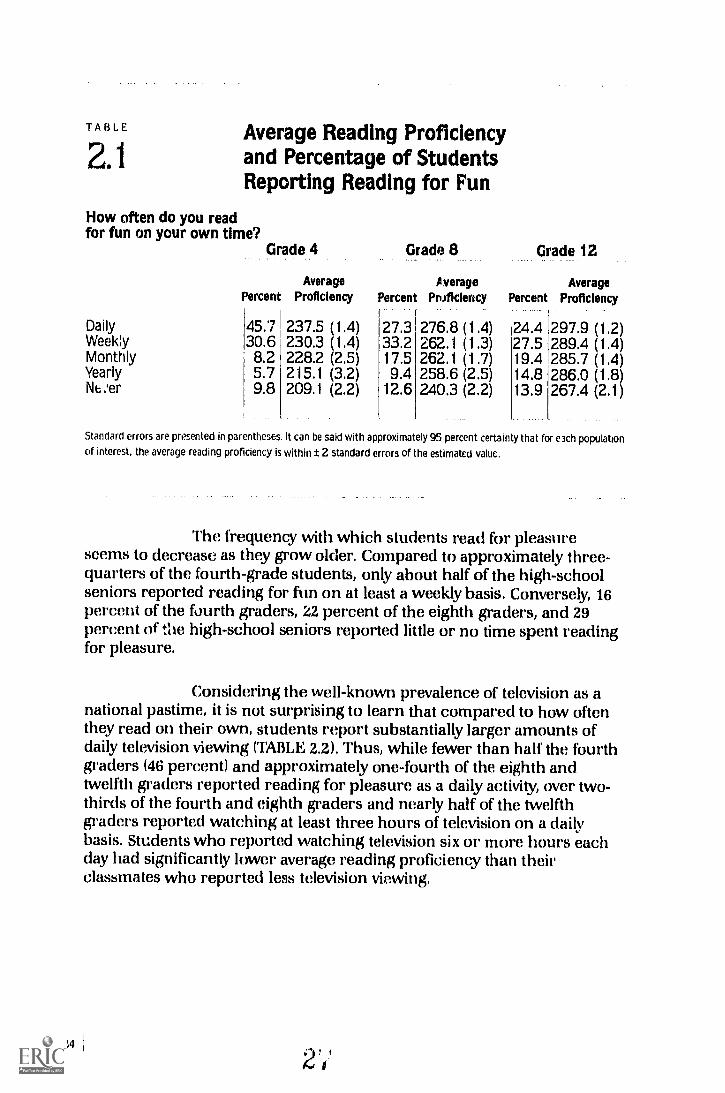
As shown in TABLE 2.1, the extent to which students readfor their own enjoyment is related to their reading proficiency. The moreoften that students reported reading for fun on their own time, the highertheir reading proficiency was likely to be. Although NAEP data cannot beused to determine whether better readers simply enjoy reading more and,therefore, read for fun more often, or whether more frequent reading forenjoyment increases proficiency, conventional wisdom suggests that it isprobably a combination of the two phenomena. The popular adage that"practice makes perfect" may be most apt for the younger studentsbecause literacy research suggests that children who grow up inenvironments that support reading activities develop better reading skills.'
'Dolores Durkin, Children Who Bead Early Now York: Teachers Coll lye Prow, Columbia University, 19610.
Shirley Brice Heath, W.v With Words: Language, Lift! and Work in Communities and Classrooms (Camb...idge: CambridgeUniversity Press, 19841,
23
TABLE
2.1Average Reading Proficiencyand Percentage of StudentsReporting Reading for Fun
How often do you readfor fun on your own time?
Grade 4 Grade 8 Grade 12
Average Average AveragePercent Proficiency Percent Proficiency Percent Proficiency
Daily 45.7 237.5 (1.4) 27.3 276.8 (1.4) 24.4 297.9 (1.2)Weekly 30.6 230.3 (1.4) 33.2 262.1 (1.3) 27.5 289.4 (1.4)Monthly 8.2 228.2 (2.5) 17.5 262.1 (1.7) 19.4 285.7 (1.4)Yearly 5.7 215.1 (3.2) 9.4 258.6 (2.5) 14.8 286.0 (1.8)Ne,.er 9.8 209.1 (2.2) 12.6 240.3 (2.2) 13.9 267.4 (2.1)
Standard errors are presented in parentheses. It can be said with approximately 95 percent certainty that for each population
of interest, the average reading proficiency is within ± 2 standard errors of the estimated value.
The frequency with which students read for pleasureseems to decrease as they grow older. Compared to approximately three-quarters of the fourth-grade students, only about half of the high-schoolseniors reported reading for fun on at least a weekly basis. Conversely, 16percent of the fourth graders, 22 percent of the eighth graders, and 29percent of the high-school seniors reported little or no time spent readingfor pleasure.
Considering the well-known prevalence of television as anational pastime, it is not surprising to learn that compared to how oftenthey read on their own, students report substantially larger amounts ofdaily television viewing (TABLE 2.2). Thus, while fewer than half the fourthgraders (46 percent) and approximately one-fourth of the eighth andtwelfth graders reported reading for pleasure as a daily activity, over two-thirds of the fourth and eighth graders and nearly half of the twelfthgraders reported watching at least three hours of television on a dailybasis. Students who reported watching television six or more hours eachday had significantly lower average reading proficiency than theirclassmates who reported less television viewing.
24

TABLE
2.2
How much televisiondo you watch each day?
0 to 2 hours3 to 5 hours6 hours or more
Average Reading Proficiencyand Percentage of StudentsReporting Various Amounts ofTelevision Viewing Each Day
Grade 4
AveragePercent Proficiency
31.1 230.8 (3.7)41.6 236.2 (2.0)27.3 216.5 (1.6)
Grade 8
AveragePercent Proficiency
29.5 266.1 (3.7)153.0 263.1 (1.8)117.5 250.2 (1.6)
Grade 12
AveragePercent Proficiency
291.5 (2.2)281.9 (1.8)267.5 (2.4)
Standard errors are presented in parentheses. It can be with approximately 95 percent certainty that for each populationof interest, the average reading proficiency is within ± 2 standard errors of the estimated value.
Students at grades 8 and 12 were also asked about the kindof reading they preferred to do in their spare time. At both grades, morestudents showed an interest in reading fiction than in reading non-fiction.Approximately one-fourth of the eighth and twelfth graders reportedreading both fiction and non-fiction in their spare time, as shown inTABLE 2.3. The proportion of eighth graders who reported readingprimarily fiction in their spare time was twice as great as the proportionreporting reading primarily non-fiction material. By grade 12, however,students were somewhat more equally divided among those who reportedreading primarily fiction, primarily non-fiction, a mixture of both, orhardly reading anything at all.
25

26
TABLE
2.3Average Reading Proficiency andPercentage of Students Reading Fictionor Non-Fiction in Their Spare Ti me
Which best describes the kind ofreading you do in your spare time?
Fiction
PercentGrade 8
Proficiency
NonFiction
Percent Proficiency
Both
Percent Proficiency
Reador
Percent
RarelyNever
Proficiency
Nation 37.3 272.6 (1.3) 16.5 258.5 (1.8) 27.4 269.1 (1.4) 18.8 241.1 (1.8)
GenderMale 29.2 265.7 (2.0) 21.6 259.1 (2.2', 22.7 265.7 (2.1) 26.4 238.8 (2.0)Female 45.8 277.2 (1.5) 11.2 257.1 (3.1) 32.4 271.5 (1.6) 10.7 247.0 (3.0)
Grade 12
Nation 32.0 293.6 (1.2) 24.1 283.6 (1.3) 25.9 295.6 (1.3) 18.1 269.3 (1.6)
GenderMale 24.6 288.5 (2.1) 31.6 283.0 (1.7) 22.1 294.0 (1.7) 21.6 265.s (2.3)Female 38.6 296.5 (1.3) 17.4 284.5 (1.8) 29.2 296.7 (1.6) 14.8 274.3 (2.2)
Standard errors are presented in parentheses. It can be said with approximately 95 percent certainty that for each population
of interest. the average reading proficiency is within ± 2 standard errors of the estimated value.
At both grades 8 and 12, 'hose students who reportedreading fiction - alone or in combination with non-fiction - had higheraverage reading proficiency than those students who reported readingonly non-fiction. The nearly one-fifth of the students who reported little orno reading as a leisure activity had the lowest average reading proficiency.It is also interesting to note that at both grades 8 and 12 more females thanmales reported reading fiction and tower reported reading non-fiction.
NAEP asked high-school seniors three additional questionsabout what and how often they read. As shown in TABLE 2.4,approximately half the high-school seniors reported reading thenewspaper on a daily basis, while fewer reported such frequent attentionto magazines (about one-fourth) or novels (13 percent). On a weekly basis,both newspapers and magazines appeared to be read with equalfrequency, while stories and novels still were the least reported.
cJ

TABLE
2.4How often do youreada. . . .
DailyWeeklyMonthlyYearlyNever
Average Reading Proficiency andPercentage of Students Reading Books,Newspapers, and Magazines, Grade 12
Story or Novel Newspaper Magazine
Average Average AveragePercent Proficiency Percent Proficiency Percent Proficiency
13.3 303.4 (1.8) 53.1 290.9 (1.0)19.1 297.3 (1.6) 29.9 285.9 (1.2)27.6 286.0 (1.5) 9.2 281.3 (2.7)23.4 284.0 (1.3) 3.8 275.9 (3.6)16.4 268.8 (1.6) 3.9 270.8 (3.3)
25.847.420.83.62.4
287.7 (1.4)289.6 (1.1)286.7 (1.4)269.0266.2 (4.5)
Standard errors are presented in parentheses. It can be said with approximately 95percent certainty that for each populationof interest, the average reading proficiency is within t 2 standard errors of the estimated value.
In summary, elementary students reported reading for tunmore frequently than middle- or high-school students. However, for thesefourth graders, reading was much less common than watching television.While 69 percent reported watching three hours or more of televisioneach day, only 46 percent reported reading for pleasure on a daily basis.
Just as many eighth graders (71 percent) as fourth gradersreported watching three or more hours of television a day, but even fewerreported reading for fun each day - only 27 percent.
High-school seniors reported both less television viewingand less reading than their younger counterparts. Eighteen percentreported hardly ever reading in their spare time and 29 percent reportedreading some fiction in their spare time. The materials they reportedreading most frequently were newspapers and magazines.
Availability of Reading Materials
To collect information about students' access to readingmaterials outside of their classrooms, NAM' asked students about thereading materials in their home and about their visits to the library.
Students at all three grade levels were asked in particularabout their own magazines and books, and the results are presented inTABLE 2.5. Almost half of the fourth graders and two-thirds of the eighthand twelfth graders reported having their own magazine subscriptions,and these students tended to have higher reading proficiency than theirclassmates.

TABLE
2.5Average Reading Proficiency andPercentage of Students ReportingVarious Amounts of Reading in Home
Do you buy or get anymagazines at homeJust for yourself? Grade 4 Grade 8 Grade 12
Average Average AveragePercent Proficiency Percent Proficiency Percent Proficiency
Yes 47.5 235.3 (1.3) 64.8 266.6 (1.2) 67.5 289.8 (1.0)No 52.5 225.9 (1.2) 35.2 256.3 (1.3) 32.5 281.7 (1.0)
About how many books,not counting yourschoolbooks orcomic books, doyou have at home?
10 or fewer 25.7 213.9 (1.6) 31.2 248.8 (1.2) 33.0 274.4 (1.3)11 to 20 15.5 231.4 (1.8) 23.5 263.9 (1.4) 21.6 287.7 (1.2)21 to 30 14.5 235.1 (2.6) 13.8 268.7 (1.8) 14.5 291.6 (2.0)More than 30 44.3 238.1 (1.2) 31.5 273.9 (1.7) 30.9 298.5 (1.3)
Standard errors are presented in parentheses. It can be said with approximately 95 percent certainty that for each population
of interest, the percentage of students and average proficiency are within ± 2 standard errors of the estimated value.
28

Students who reported having more of their own books athome also tended to have higher reading proficiency. At each grade level,the more books students reported having, the higher their average readingproficiency. In general, younger students reported having more booksthan the eighth and twelfth graders, a finding which parallels their reportsof more daily reading. Forty-four percent of the fourth graders reportedhaving more than 30 books, not counting schoolbooks or comic books.However, over one-fourth reported 10 or fewer such books, and theirreading proficiency was substantially lower than their classmates whoreported having more books at home.
The library can be a major resource in developingstudents' reading abilities. In addition to checking out books and obtainingreference information, students can use libraries as quiet places to read.Thus, as part of the assessment, NAEP asked students at all three gradelevels about how often they borrowed books from the library. The resultsare presented in TABLE 2.6. The teachers of the fourth graders were alsoasked how often their classes visited the library (TABLE 2.7).
TABLE
2.6Average Reading Proficiency andPercentage of Students ReportingTaking Books Out of the Library
How often do you takebooks out of the school orpublic library?
Grade 4
AveragePercent Proficiency
Daily 7.5 211.9 (2.9)Weekly ; 59.0 j 234.9 (1.2)Monthly ; 17.0 ! 239.1 (1.8)Yearly 6.7 1222.8 (2.9)Never
, 9.8 208.3 (2.7)
Grade 8 Grade 12
Percent
1 3.1! 20.539.418.218.8
AverageProficiency Percent
AverageProficiency
245.3 (3.1) i 1.9 ! 273.9 (5.6)1 266.2 (1.8) ! 10.2 290.4 (2.1)! 269.8 (1.1) 34.7 293.1 (1.1)! 264.3 (2.1) 132.1 288.6 (1.1)247.6 (1.9) 21.2' 275.1 (1.4)
Standard errors are presented in parentheses. It can be said with approximately 95 percent certainty that for each populationof interest, the average reading proficiency is withint 2 standard errors of the estimated value. Note: Grade 12 results did riotdiffer substantially for students who reported they were in academically-oriented programs. Thirteen percent of the seniorswho were in academic programs reported taking out library books on a weekly basis, 40 percent on a monthly basis. 31percent on a yearly basis, and 15 percent never.

T A 13 I. E
2.7Teachers' Reports of Frequencyof Visits to the Library, Grade 4
How often do you take or sendthe class to the library?
Percentage of Students
AveragePercent Proficiency
Daily 3.8 240.1 (3,7)Weekly 75.2 231.2 (1.3)Monthly 12.7 228.1 (3.8)Yearly 4.9 232.7 (6.5)Never 3.4 226.7 (9.1)
Standard errors are presented in parentheses. It can be said with approximately 95 percent certainty that for each population
of interest, the average reading proficiency is within ± 2 standard errors of the estimated value.
Elementary-school students appear to make frequent useof the library. Almost two-thirds of the fourth graders reported taking outlibrary books on at least a weekly basis and 79 percent had teachers whoreported taking or sending their classes to the library on a weekly basis.
Students at grades S and 12 reported using the library totake out books much less frequently than did filth' fourth-gradecounterparts. Further, using the library as a place to get books seems todecrease as students progress through school Nearly one-fourth of theeighth graders reported taking out books at least weekly compared to only12 percent of the twelfth graders. A majority of the twelfth gradersreported taking out library books only yearly, if ever. in terms of tht1relationship between library usage and proficiency reading, it appearsthat the small percentage of students who reported taking books out of thelibrary on a daily basis had lower average proficiency than those who saidthey used the library somewhat less frequently. It may be the case thatstudents who ire less successful readers are encouraged to take hooksfrom the library as part of special instructional efforts to improve theirreading ability.
au

In addition to asking students about their own readingmaterials and about their use of the library to take out books, NAM' askedstudents about other reading materials in their home. As shown in TABLE2.8, the .-najority of students have access to some reading materials in thehome. However, according to their reports, about 20 percent do not haveaccess in their homes to a daily newspaper and 5 percent live in homeswith fewer than 25 books.
TABLE
2.8Average Reading Proficiencyand Percentage of StudentsReporting Availability ofReading Materials in Home
Are there more than25 books in your home?
Grade
Percent
4
AverageProficiency
Grade
Percent
8
Average
Proficiency
Grade
Percent
12
AverageProficiency
Yes 88.6 233.8 (1.1) 92.1 265.3 (1.0) 93.4 288.9 (0.8)No 5.5 200.9 (2.9) 4.3 234.7 (3.0) 4.6 266.0 (3.0)
Does your family get anewspaper regularly?
Yes 73.8 234.1 (1.1) 76.6 266.1 (1.1) 82.6 289.4 (0.8)No 20.8 222.0 (1.7) 21.4 254.3 (1.6) 16.3 278.0 (2.0)
Does your family gelmagazines regularly?
Yes 62.4 235.0 (1.3) 76.4 267.5 (1.0) 84.9 290.3 (0.8)No 26.9 221.1 (1.3) 19.6 250.4 (2.0) 13.6 271.6 (1.7)
Is there an encyclopediain your home?
Yes 71.8 232.5 (1.1) 79.6'265.0 (1.1) 84.1 288.3 (0.8)No 22.0 225,6 (1.9) 18.1 258.6 (1.6) 14.7 283.5 (2.0)
Standard errors are presented in parentheses. l can be said With approximately 95 percent certainty that for each populationof interest. the E.'erage reading proficiency is within :t: 2 standard errors of Pie estimated value. Response percentages do nottotal 100 percent because small percentages of students reported that they did not know about the reading materials in theirhomes.
31

Students with access in their homes to books, newspapers,magazines, and an encyclopedia had higher average reading proficiencythan did students who did not have these materials in their homes.
In summary, elementary-school students seem to have anumber of opportunities to read books, both from home and from theirschool libraries. However, contact with books other than textbooks,perhaps seems to decrease as students progress through school.Although 60 percent of the fourth graders reported owning at least 20books, less than half of the students at grades 8 and 12 reported hating asmany books of their own. Only a quarter (24 percent) of the fourth-gradestudents reported taking out liI.rary books infrequently (monthly oryearly), compared to over half (58 percent) of the eighth graders andapproximately two-thirds (68 percent) of the high-school seniors.
The Value of Reading
Studies have shown that many specific reading behaviorsand a positive attitude toward literacy can be learned at home at an earlyage. Because of this intergenerational aspect of literacy childrentending to replicate their parents' skills and attitudes NAEP askedstudents how often their parents read them stories as a child, and whetheror not reading is a topic of conversation at home.
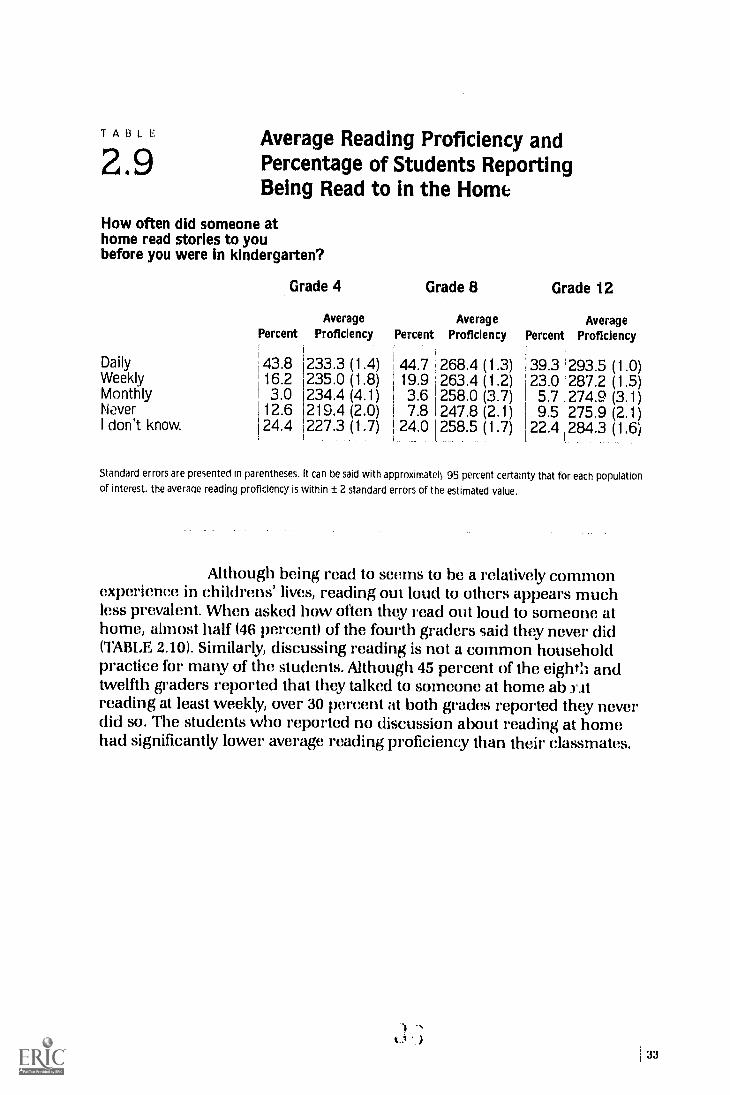
As shown in TABLE 2.9, the majority of students at all threegrade levels reported that when they were children, stories were read tothem on at least a weekly basis. Approximately the same percentage ofstudents at grades 4, 8 and 12 reported being read to weekly or more often
60 percent, 65 percent, and 62 percent, respectively. Students at allthree grades who reported being read to at least weekly had an averagereading proficiency that was 14 to 20 points higher than those whoreported never being read to by someone at home. Relatively few studentsat all three grade levels (from 8 to 13 pi :scent) reported that they werenever read to, while approximately one;- fourth said they could notremember.
32
TABLE
2.9Average Reading Proficiency andPercentage of Students ReportingBeing Read to in the Home
How often did someone athome read stories to youbefore you were in kindergarten?
Grade 4 Grade 8 Grade 12
Average Average AveragePercent Proficiency Percent Proficiency Percent Proficiency
Daily 43.8 233.3 (1.4) 44.7 268.4 (1.3) 39.3 293.5 (1.0)Weekly 16.2 235.0 (1.8) 19.9 263.4 (1.2) 23.0 287.2 (1.5)Monthly 3.0 234.4 (4.1) 3.6 258.0 (3.7) 5.7 274.9 (3.1)Never 12.6 219.4 (2.0) 7.8 247.8 (2.1) 9.5 275.9 (2.1)I don't know. 24.4 227.3 (1.7) 24.0 1 258.5 (1.7) 22.4 284.3 (1.6)
Standard errors are presented in parentheses. It can be said with approximatel\ 95 percent certainty that for each populationof interest. the average reading proficiency is within ± 2 standard errors of the estimated value.
Although being read to seems to be a relatively commonexperience in childrens' lives, reading out loud to others appears muchless prevalent. When asked how often they read out loud to someone athome, almost half (46 percent) of the fourth graders said they never did(TABLE 2.10). Similarly, discussing reading is not a common householdpractice for many of the students. Although 45 percent of the eighth andtwelfth graders reported that they talked to someone at home ab ratreading at least weekly, over 30 percent at both grades reported they neverdid so. The students who reported no discussion about reading at homehad significantly lower average reading proficiency than their classmates.
))
33

34
TABLE
2.10Average Reading Proficiencyand Percentage of StudentsReporting Reading Aloud andDiscussing Reading at Home
How often do you read outloud to someone at home?
Percent
Grade 4
AverageProficiency
Daily 17.1 1 217.0 (2.0)Weekly 23.7 , 230.4 (1.5)Monthly 13.4 , 242.5 (1.9)Never 45.7 231.8 (1.6)
How often do you talk tosomeone at home aboutsomething you read?
Grade 8 Grade 12
Average AveragePercent Proficiency Percent Proficiency
Daily 14.2 269.2 (2.1) 14.5 293.9 (1.8)Weekly 30.7 268.6 (1.4) 30.0 292.8 (1.3)Monthly 20.5 266.6 (1.4) 24.3 288.4 (1.4)Never 34.6 253.7 (1.4) 31.2 277.8 (1.4)
Standard errors are presented in parentheses. It can be said with approximately 95 percent certainty that for each population
of interest, the average reading proficiency is within ± 2 standard errors of the estimated value.
To further explore students' own attitudes toward readingand books, NAEP asked a series of questions about reading behaviors. Forexample, besides having books and taking them out of the library, peoplewho enjoy reading tend to buy books, recommend good books to theirfriends, and develop a liking for particular authors. Students' answers toquestions about these topics are presented in TABLE 2.11.
3
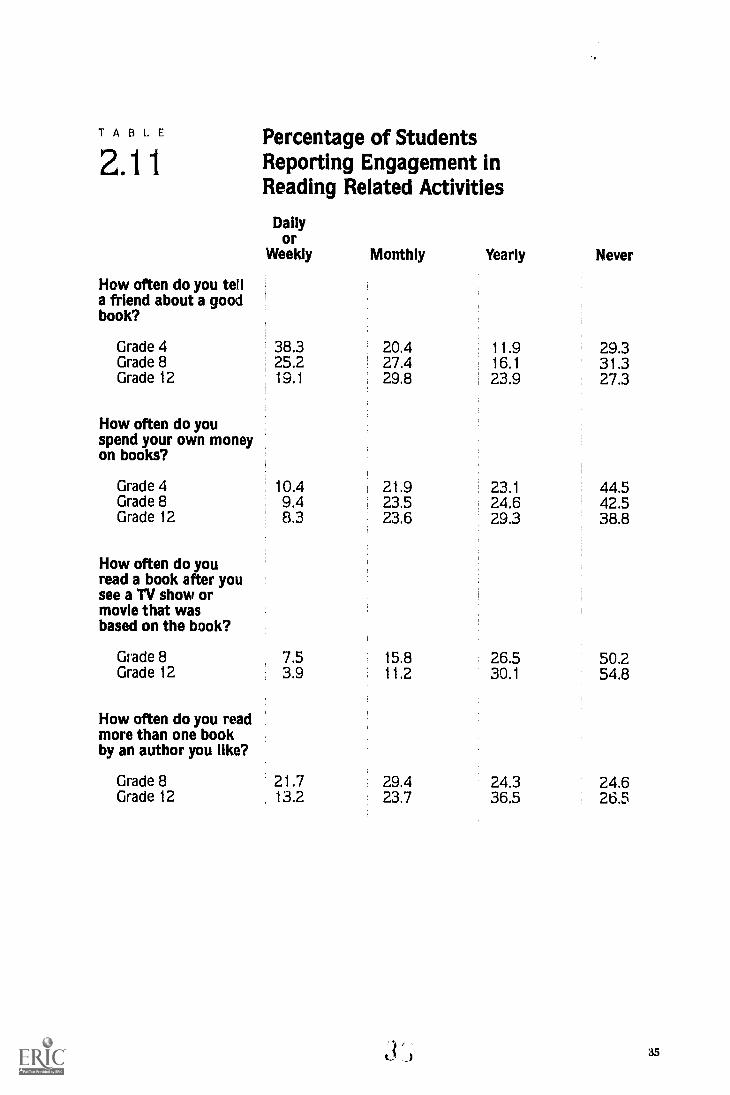
TABLE Percentage of StudentsReporting Engagement inReading Related Activities
How often do you tella friend about a goodbook?
Dailyor
Weekly Monthly Yearly Never
Grade 4 38.3 20.4 11.9 29.3Grade 8 25.2 27.4 16.1 31.3Grade 12 19.1 29.8 23.9 27.3
How often do youspend your own moneyon books?
Grade 4 10.4 21.9 23.1 44.5Grade 8 9.4 23.5 24.6 42.5Grade i2 8.3 23.6 29.3 38.8
How often do youread a book after yousee a TV show ormovie that wasbased on the book?
Grade 8 7.5 15.8 26.5 50.2Grade 12 3.9 11.2 30.1 54.8
How often do you readmore than one bookby an author you like?
Grade 8 21.7 29.4 24.3 24.6Grade 12 13.2 23.7 36.5 26.5
35

Similar to other responses previously discussed, olderstudents were less likely than younger students to report frequentlyrecommending books to friends, reading books by favorite authors, orfollowing up a movie by reading the book. For example, 59 percent of thefourth graders, 53 percent of the eighth graders, and 49 percent of thetwelfth graders reported recommending books to their friends at least ona monthly basis. Whereas 51 percent of the eighth graders reportedreading more than one book by an author they liked on a monthly basis,only 37 percent of the high-school seniors reported reading books byfavorite authors on such a regular basis.
Perhaps the most striking findings concern the largepercentage of students who reported never engaging in these activities. Atgrades S and 12, approximately half the students reported never reading abook after they had seen the movie or television show, and one-fourthreported never reading a second book by an author they liked. At all threegrades assessed, approximately 30 percent of the students said they nevertell their friends about good books and approximately 40 percent reportednever spending their own money on books.
In summary, a majority of students remember someonereading them stories, but the home emphasis on reading seems to declineas students grow older. About one-third of the eighth and twelfth gradersreported that they never talk with people they live with about reading.Neither do students appear to discuss reading with their friends. Forexample, about 30 percent of the students at all three grade levels assessedreported that they never tell their friends about a good book,
Summary
Not all American students seem to be "hooked on books".A majority of the fourth graders reported positive reading experiencesbeing read stories by someone at home, having at least 20 books of theirown, taking books out of the library every week, and telling their friendsabout a good book on a monthly basis and nearly half (46 percent)reported reading for fun almost every clay. However, students seem to heless book-oriented as they progress through school. In fact, by the timethey near high-school graduation, students seem to have very little to dowith reading activities beyond those required in school,
36

Over half of the twelfth-grade students reported reading forpleasure at least once a week, but nearly one-fifth reported never readingin their spare time. Slightly over half (53 percent) also said they read thenewspaper every day; however, 40 percent reported that they never readstories or novels Or only did so on a yearly basis. A majority of the high-school students said they rarely, if ever, took books out of the library ordiscussed reading at home.
Because better readers report reading more frequently andhaving access to a greater variety of reading materials, it is important toencourage young children to engage in a variety of reading experiences.Considering the seeming decline in students' interest in reading as theygrow older, it may be equally important to continue support for readingexperiences as students progress through school.
37

3
38
Reading Instruction
What instruction are students receiving to improve theirreading and comprehension skills? To examine this, students at all threegrades were asked questions about their teachers' instructionalapproaches in reading. Because of the emphasis in the elementary gradeson learning to read, NAEP sought to expand the background informationavailable about the fourth-grade students in the assessment by asking theirteachers to respond to questionnaires.3 The teachers of the assessedstudents were identified and asked to provide additional informationabout those particular students and the reading instruction they received.Specifically, they were asked the reading ability level of the students' classand about time spent on reading instruction, the organizational structureof the class, and the various reading skills emphasized. Thus, for the firsttime, NAEP is able to provide a relationship between students' readingperformance and the instruction students receive as reported by theirown classroom teachers.
Initial Reading Instruction
Teachers of fourth-grade students in the assessment wereasked to comment on the type of initial reading instruction these studentshad received in grades 1, 2, and 3. TABLE 3.1 summarizes information onthe early reading instruction received by fourth graders, as reported bytheir teachers.
The teachers were unable to comment on the initialreading instruction of a third of the students btu for the remainder theyreported almost equal emphasis on phonics -based and eclectic programs.Sight-word instruction and language experience approaches were rarelynoted.
'Mir fourth graders participating in the, assessment, NAEP collected inform:1MM hunt their teachers. In the ensuinganalyses, in forela:ion on students' performance and demographic characteristics was linkei I with information provided
Iry their teachers. Thus, the student rather than the teacher Is the unit of analysis. This approach makes it possible
to address questions such as, 'What percentage of the students have teachers who help them work on comprehensionskili during reading instruction?' More detailed information on the teacher questionnaire is contained in theProcedural Appendix.

TABLE Teachers' Reports of Previous3.1 Reading Program, Grade 4
What kind of reading program did thisstudent have in grades one, two, and three?
Percentage of Studentsin Each Type of Program
Primarily phonics 28.6Primarily sight words 3.5Primarily language experience 3.6An eclectic approach I 31.0Not known 33.3
Time Spent on Reading Instruction
To provide a context for their response: to questions aboutinstructional practice, teachers were asked to characterize the ability levelof each student's class. As shown in TABLE 3.2, 12 percent of the fourthgraders were identified as being in high-ability classes, and their averageproficiency was 256 on the reading scale. This was close to the averagereading proficiency for eighth graders (263). Forty-three percent of thestudents were identified by their teachers as in classes of average ability.These students performed at about the national average for fourth graders(230), as did the 32 percent of the students in classes of mixed ability levels.The 14 percent of the students identified as being in low-ability classes hadmuch lower reading proficiencies, on average, than did students in othertypes of classes.
TABLE
3.2Teachers' Reports of the Reading AbilityLevels of Students' Classes, Grade 4
What is the reading abilitylevel of the students in this class?
Percentage of AverageStudents Proficiency
Mostly high ability 12.3 256.0 (2.6)Mostly average ability 42.5 232.4 (1.7)Mostly low ability 13.5 208.2 (3.0)Mixed ability levels 31.7 229.0 (2.3)
Standard errors are presented in parentheses. It can be said with apps oximately 95 percent certainty that for each populationof interest, the average reading proficiency is within ± 2 standard errors of the estimated value.
39

'leachers of the fourth-grade students in the assessmentalso were asked about how much time each day they devoted to readinginstruction in each student's class. TABLE 3.3 summarizes their responsesfor the national sample of fourth graders, as well as for students in classesof different levels of reading ability.
A t3 L E:
3.3Teachers' Reports of Class TimeSpent on Reading InstructionEach Day, Grade 4
About how much time do you spend withthis class for direct instruction inreading on a typical day?
Percentage of Students Receiving DifferentAmounts of Reading Instruction
Mixed HighNation Ability Ability
AverageAbility
LowAbility
30 minutes or less 27.3 24.2 51.2 23.9 24.560 minutes I 53.7 49.0 42.1 61.0 51.690 minutes or more 19.0 26.8 15.1 23.9
Overall, as reportezi oy their teachers, the majority of fourthgraders receive approximately 60 minutes of reading instruction each day.The amount of instructional time did show some variation with abilitylevel: students in low-ability classes were likely to spend somewhat moretime receiving reading instruction than were those in high-ability classes.For example, 17 percent more students in the low-ability group than thehigh-ability group receive 90 minutes or more of instruction each day.
In high school, the reading instruction that students aremom likely to receive is in the context of reading literature. To examinethis, twelfth-grade students were asked a related question about theproportion of class time spent on literature instruction. Their responsesare summarized in TABLE 3,4, separately for students in academic,general, or vocational/technical programs.
40
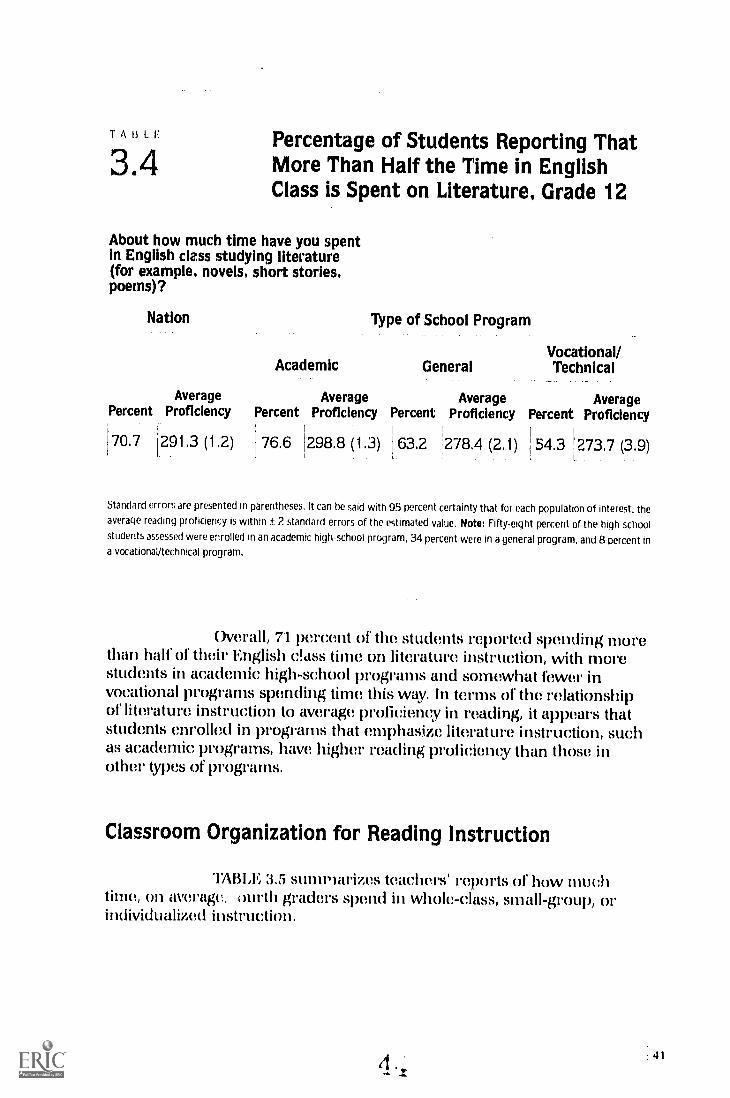
TABLE
3.4Percentage of Students Reporting ThatMore Than Half the Time in EnglishClass is Spent on Literature, Grade 12
About how much time have you spentin English class studying literature(for example. novels. short stories.poems)?
Nation Type of School Program
Percent
70.7
Vocational/Academic General Technical
Average Average Average AverageProficiency Percent Proficiency Percent Proficiency Percent Proficiency
291.3 (1.2) j 76.6 1298.8 (1.3) 63.2 278.4 (2.1) l 54.3 1273.7 (3.9)
Standard errors are presented in parentheses. It can be said with 95 percent certainty that for each population of interest. theaverage reading proficiency is within ± 2 standard errors of the estimated value. Note: Fifty-eight percent of the high-school
students assessed were enrolled in an academic high-school program. 34 percent were in a general program, and 8 percent ina vocational/technical program.
Overall, 71 percent of the students reported spending inurethan half of their English class time on literature instruction, with morestudents in academic high-school programs and somewhat fewer invocational programs spending time this way. In terms of the relationshipof literature instruction to average proficiency in reading, it appears thatstudents enrolled in programs that emphasize literature instruction, suchas academic programs, have higher reading proficiency than those inother types of programs.
Classroom Organization for Reading Instruction
TABLE 3.5 summarizes teachers' reports of how muchtime, On average, mirth graders spend in whole-class, small-group, orindividualized instruction.
41

TABLE
3.5Teachers' Reports of Time Spentin Different 'Types of ClassroomOrganization, Grade 4
What percent of your reading instructionwith this class is conducted in thefollowing modes?
Average Percent of Time Students Spend inWhole Class, Small Group, or Individualized Instruction
MixedNation Ability
HighAbility
AverageAbility
LowAbility
Whole-class instructionSmall-group instructionIndividual instruction
38.343.718.0
34.1 48.832.219.0
37.843.7
j 18.5
40.241.818.0
For the national sample as a whole, teachers reported thatfourth graders spend, on average, 38 percent of their class reading time inwhole-class instruction, with another 44 percent devoted to small-groupwork and 18 percent to individualized instruction. The emphasis shiftedsomewhat with classes of different ability levels, with teachers providingmore whole-class time and less small-group instruction for students inhigh-ability classes and more small-group work and less whole-groupinstruction in classes of mixed ability.
Fourth-grade teachers were also asked about their use ofreading groups. According to their responses, summarized in TABLE 3.6,an overwhelming majority of fourth-grade students 79 percent werebeing taught using reading groups, almost always based on the readingability of the students. This pattern was relatively stable across classes ofdifferent ability levels.
42
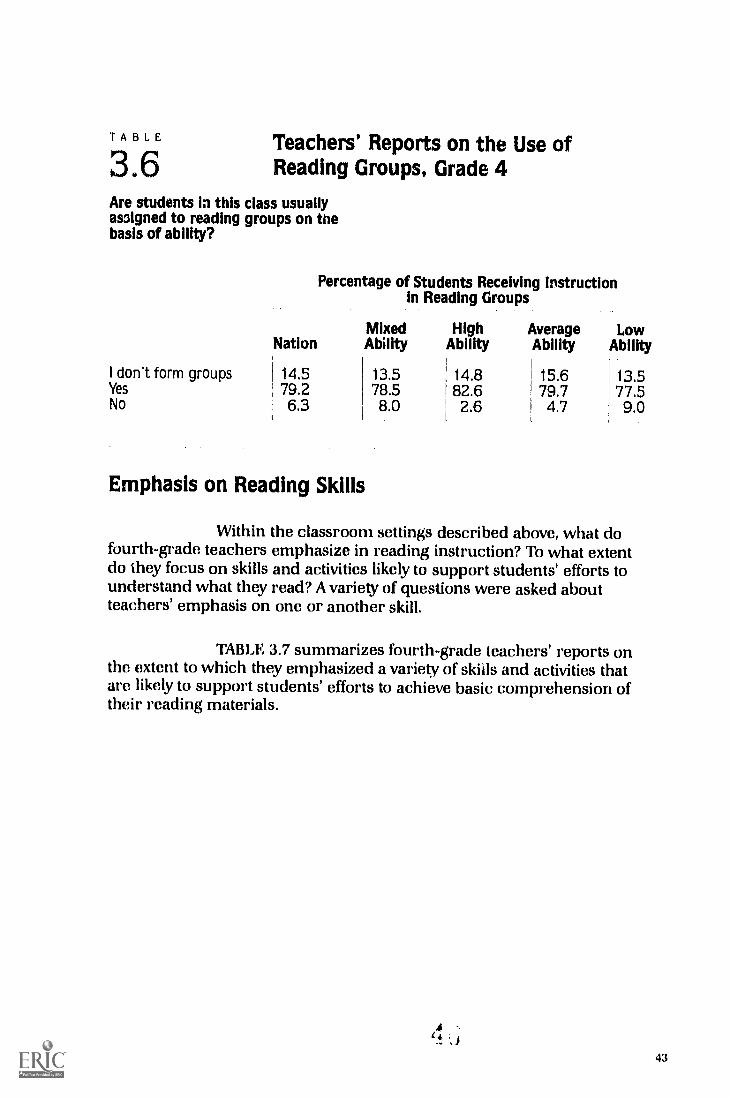
TABLE
3.6Teachers' Reports on the Use ofReading Groups, Grade 4
Are students in this class usuallyas3igned to reading groups on thebasis of ability?
Nation
Percentage of Students Receiving instructionin Reading Groups
Mixed High Average LowAbility Ability Ability Ability
I don't form groups 1 14.5 13.5 14.8 15.6 13.5Yes 79.2 78.5 82.6 79.7 77.5No 6.3 8.0 2.6 4.7 9.0
Emphasis on Reading Skills
Within the classroom settings described above, what dofourth-grade teachers emphasize in reading instruction? To what extentdo they focus on skills and activities likely to support students' efforts tounderstand what they read? A variety of questions were asked aboutteachers' emphasis on one or another skill.
TABLE 3.7 summarizes fourth-grade teachers' reports onthe extent to which they emphasized a variety of skills and activities thatare likely to support students' efforts to achieve basic comprehension oftheir reading materials.
(4;
43

TABLE
3.7Teachers' Reports ofSkills Emphasized, Grade 4
How often do you help this studentwork on the following things duringreading instruction?
Percentage of Students Receiving Daily Attention
Reading Reading Readingabove at below
Nation grade level grade level grade level
Reading aluud 28.0 24.3 23.3 41.1
Comprehension skills 49,5 42.8 47.9 58.5
Word-attack skills 27.6 18.4 23.7 43.3
Vocabulary 40.4 35.7 38.1 49.5
Note: Percentages do not total 100 because there were three possible response categories daily, several times each week,
and weekly or less and only the percentages for the daily category are presented here.
Among these skills and activities, teachers reported greatestemphasis on comprehension (emphasized daily for half of the students),followed closely by vocabulary (40 percent). Word-attack skills and readingaloud received somewhat less emphasis for students reading at or abovegrade level, Students reading below grade level were more likely to receiveinstruction On word-attack skills and reading aloud. All of these skills weremore likely to receive daily emphasis for weaker students, and less likely tobe emphasized so frequently for better readers.
Teachers' reports of the amount of homework in readingassigned to students on a daily basis are summarized in TABLE 3.8. Memajority of students (52 percent) are reportedly assigned 15 minutes ofhomework per day. Students reading at or above grade level are morelikely to be assigned no homework in reading (30 percent) than arestudents reading below grade level (21 percent). Audents reading belowgrade level are more apt to receive a half-hour or more of daily homework(25 percent) than are those students reading A grade level (20 percent) andthose students reading above grade level (24 percent).
44

TABLE
3.8Teachers' Reports ofHomework Assigned, Grade 4
How much homework in readingdo you usually give each day?
Percentage of Students ReceivingDifferent Amounts of Homework
Readingabove
Nation grade level
Readingat
grade level
Readingbelow
grade level
None 25.9 29.7 26.8 20.815 minutes 52.2 46,5 53.4 54.21/2 hour or more 21.9 23.8 19.8 25.0
TABLE 3.9 summarizes teachers' reports on a related set ofinstructional techniques. Two of there, discussing readings in smallgroups and writing about reading, seem likely to foster skills useful inexamining texts from in-depth perspectives. Another technique,completing reading workbooks or skill-sheet assignments, seems morelikely to provide initial help in constructing meaning. The final twotechniques included in this set of questions (reading aloud to students andasking them to read books they choose themselves) are both advocated asways to increase students' interest and motivation.
45

TABLE
3.9Teachers' Reports ofInstructional Techniques, Grade 4
How often do you do the followingthings as a part of reading instructionwith this class?
Nation
Have students talk in 1
pairs or small groupsabout what they read
Percentage of Students Receiving DifferentAmounts of Various Types of Instruction
Mixed High AverageAbility Ability Ability
LowAbility
Daily 11.7 16.3 14.1 10.0 9.0Weekly ' 33.1 33.0 30.5 34.8 32.1Monthly 27.6 13.9 27.7 31.2 29.6Yearly/Never j 27.6 36.8 27.7 24.0 29.3
Have students writeabout what they read
Daily 12.5 18.5 11.3 10.9 14.0Weekly , 46.7 37.0 47.5 50.4 42.5Monthly 1 30.1 1 23.7 32.6 29.3 33.2Yearly/Never 10.7 20.8 8.6 9.4 10.3
Have students complete!reading workbooks orskill-sheet assignments
Daily 57.4 49.7 1 54.2 60.2 61.6Weekly 39.1 43.6 41.7 37.6 35.8Monthly ' 2.2 I 1.2 3.2 1.6 1.7Yearly/Never 1.3 ' 5.6 0.9 0.6 0.9
Read aloud to studentsDaily 56.7 75.6 157.0 53.1 153.5Weekly 32.5 ' 17.1 35.3 35.0 1 31.8Monthly 7.0 , 5.9 , 5.5 7.7 8.8Yearly/Never 3.8 1.4 2.2 4.2 5.9
Have students readbooks they chosethemselves
Dilly 54.9 66.8 53.0 53.9 52.8Weekly 25.8 19.2 i 26 F 26.3 27.9Monthly 14.5 7.3 15.6 ' 15.6 14.9Yearly/Never 4.8 6.7 4.8 4.2 4.5
46

Among these activities, workbooks and skill-sheetassignments appear to receive the heaviest use: 57 percent of the fourth-grade students were asked to complete such assignments on a daily basis,and 97 percent at least weekly. Small group discussions and writing aboutreading, on the other hand, received less emphasis. According to theirteachers, only 12 percent of the fourth graders were given theseopportunities on a daily basis, and only about half (40 percent) were askedto do so even weekly. Eleven percent of the students were rarely (yearly ornever) asked to write about what they had read, and more than one-fourth(28 percent) were never or hardly ever asked to talk about what they readwith small groups of their classmates.
Table 3.9 also summarizes the teachers' reports separatelyfor students in high-, average-, and low-ability classes. Again, it is clear thatregardless of the reading ability level of the class, students are likely toreceive daily workbook or skill-sheet assignments, and are unlikely to beasked to examine their understanding through writing or discussion.Within this general pattern, however, students in low-abilityclasses seemsomewhat more likely to be asked to do daily workbook assignments andsomewhat less likely to engage in daily discussion or read books theychoose themselves.
Teachers reported the two activities designed to increasestudent motivation reading aloud to them and having them read booksthey choose to be in daily use with over half of the students and inweekly use with more than 80 percent. Students in high-ability classeswere less likely to read books of their own choice on a daily basis thanstudents in any other ability group. Fourth graders were less likely thantheir teachers to think of themselves as reading books of their ownchoosing, however. In responding to a similar question, only 32 percent ofthe fourth-grade students indicated they did such reading daily, and 31percent reported they never had such an opportunity (TABLE 3,10), asopposed to 55 and 5 percent, respectively, as reported by their teachers.
47

B L E
3.10Percentage of Students ReportingHow Often Their Teacher Asks Themto Read Books They Choose, Grade 4
How often does your readingteacher ask you to read booksyou choose yourself during school?
AveragePercent Proficiency
Daily 31.5 1227.6 (1.8)Weekly 24.9 229.9 (1.6)Monthly 12.2 236.2 (2.6)Never 31.4 231.7 (1.5)
Standard errors are presented in parentheses. It can be said with 95 percent certainty that for each population of interest, the
average reading proficiency is within ± 2 standard errors of the estimated value.
Students at grades 8 and 12 were asked similar questionsabout the extent to which their English teachers asked them to write aboutor discuss what they read. Their responses are summarized in TABLE3.11. Forty-one percent of the eighth-grade students reported that theirteachers expected them to discuss what they had read "a lot," and only 38percent reported writing about what they read at least weekly. Both ofthese activities showed some increase between grades 8 and 12. However,even for high-school seniors, discussing and writing about their readingdoes not appear to be routine. Only 65 percent of the seniors reported thattheir teachers expected them to discuss what they read "a lot", and only 41percent reported being asked to write about their reading on a weeklybasis.
48 I

TABLE
3.1Percentage of Students Reporting ThatTheir Teachers Ask Them to Analyze andWrite About Reading, Grades 8 and 12
lb what extent has your Englishteacher expected you to discussand analyze what you read?
Grade 8 Grade 12
Nation
A Lot 41.1Some 48.4Not at All
1
10.5
How often has your English teacherasked you to write about what youread for class?
Vocational/Academic General Technical
Nation Program Program Program
64.7 73.3 51.5 46.830.8 24.0 41.5 4524.4 2.7 7.0 8.0
GI ale 6 Grade 12
Academic GeneralNation Nation Program Program
Daily 11.7Weekly 26.4Monthly 30.5Yearly 13.6Never 17.7
Vocational/TechnicalProgram
14.3 14.8 13.4 13.040.7 44.4 34.9 33.128.3 28.1 27.8 33.010.3 8.0 14.7 11.66.4 4.7 9.3 9.2
49

When the responses of twelfth-grade students in academic,general, and vocational or technical programs are compared, it is clearthat students in academic programs are considerably more likely thanthose in general or vocational programs to be asked to extend theirresponses to reading through discussion or writing.
Instructional Materials for Reading
Recent years have seen a variety of calls for a broader-based instructional program in elementary-school reading, movingbeyond the traditional basal series to the inclusion of multiple basals oreven trade books as a fundamental part of the program. To examine theimpact of these discussions, fourth-grade teachers were asked about theiruse of different reading books within the same class. Their responses aresummarized in TABLE 3.12.
T ABLE
3.12Teachers' Reports of ReadingBook Usage, Grade 4
Do you usually use thesame reading book for allstudents in this class?
Yes, same book forall students
No, usually usedifferent levelswithin samebasal series
No, usually usedifferent basal series
No, usually use otherbooks or materials
50
Percentage of Students in Classes UsingSame or Different Reading Books
NationMixedAbility
HighAbility
AverageAbility
LowAbility
44.7 33.5 61.6 47.2 47.2
40.7 47.7 25.2 41.9 37.6
9.4 11.9 5.7 7.8 9.7
5.1 6.9 7.5 3.1 5.5

Overall, 45 percent of the ,urth graders were in classeswhere teachers reported using the same book for all students, andanother 41 percent were in classes that used different levels of the samebasal series. Only 9 percent were in classes where teachers made use ofmore than one basal series to meet the needs of different students, andonly 5 percent wcre in classes where teachers reported that they typicallyor generally used other books or materials.
The responses also indicate some differentiation for classesof different ability levels. In high-ability classes, students were more likelyall to be using the same reading book, while in mixed-ability classes,students were more likely to be using different levels of the same basal, oreven different basal series. This pattern of results seems to suggest thatteachers see students in mixed-ability classes as less homogeneous thanother groups, and, thus, see the need for within-class differentiation ofmaterials.
Other Instructional Resources
TABLE 3.13 summarizes teachers' reports on a number ofother resources that can be used to add depth and variety to theinstructional program. Of the classroom resources included in this seriesof questions, collections of children's books were the most popular, usedfor 76 percent of the fourth-grade students. Children's newspapers ormagazines and reading kits were also available for the majority ofstudents. Computers and accompanying software for reading instructionwere less widespread and were used for only 35 and 29 percent of thestudents, respectively.
51

TABLE
3.13Teachers' Reports of ResourcesUsed in the Classroom, Grade 4
Do you use any of the followingresources in the classroom?
A children'sbook collection
Classes
Nation
PercentageUsing
MixedAbility
of StudentsVarious Resources
HighAbility
in
AverageAbility
LowAbility
(trade books) 76.0 88.3 78.3 75.3 73.0
Children's newspaperand/or magazines 57.5 66.0 63.6 55.9 50.1
Reading kits 51.4 28.9 50.6 59.5 54.1
One or moremicrocomputersor terminals 35.3 31.8 36.7 36.8 36.2
Reading instructionsoftware 29.2 16.3 30.9 31.9 31.6
None or only oneof the above 23.2 13.0 8.2 20.6 27.,'
1Wo or threeof the above 53.7 ; 57.0 57.6 57.2 51.5
Four or fiveof the above 23.1 25.0 34.2 22.3 20.9
T able 3.13 also summarizes how many of these resourceswere used in classes of different ability levels. Overall, students in low-ability classes were less likely to have multiple resources than were thosein other classes. In the low-ability classes, for example, 21 percent of thestudents had access to four or five resources, compared with 34 percent ofthe students in high-ability classes.
Teachers' use of resources is inevitably constrained by theresources they have available. lo examine the iilluence of suchconstraints on the instructional program, teachers were asked to whatextent they got all of the resources and materials that they needed. Theirresponses are summarized in 1ABLE 3.14.
52

TABLE
3.14Teachers' Reports ofAvailability of Resources andInstructional Materials, Grade 4
Which of the following statementsbest characterizes your situationwith respect to getting instructionalmaterials and other resources you useto teach your students?
Percentage of StudentsWhose Teachers ReportedHaving Resources Available
Advantaged Disadvantaged RuralUrban Urban Communi-
Nation Communities Communities ties
Get all that are needed 15.4 21.5 6.9 14.0
Get most thatare needed 54.2 53.0 42.8 65.4
Get some or noneof what is needed 30.3 25.5 50.3 20.5
Fully 70 percent of the fourth-grade students had teacherswho reported getting all or most of the resources that they needed, with afortunate 15 percent of these in situations where teacher's got all that theyneeded. As would be expected, however, availability of resources waspartially related to the socioeconomic status of the school community. Theteachers of half the students in disadvantaged urban community schoolsclaimed that they got just some or none of what they needed, and that only7 percent of these students were in classes that received all of theresources needed. In contrast, the teachers of the students in advantagedurban areas reported getting all of the resources they needed for 22percent of their students, and getting only some or none for 26 percent oftheir students.
Difficulty of Reading Materials
At grades 8 and 12, students were a-,ked about how difficultit was to understand their reading or literature texts. Their responses aresummarized in TABLE 3.15.
ti ,1 53

TABLE
3.15Percentage of Students ReportingDifficulty in UnderstandingTheir Reading or Literature Text
How much difficulty have you hadunderstanding your reading orliterature textbook?
Grade 8 Grade 12
Vocational/Academic General Technical
Nation Nation Program Program Program,
1 1A lot j 5.1I 8.2 5.7 12.7. 13.0
Some 48.71
53.5 53.7 1 53.6 52.9None 46.2 i 38.3 40.7 1 34.3 34.0
Overall, few students at either grade reported having "a lot"of difficulty understanding their textbooks. At grade diere was somevariation in the degree of difficulty reported by students in differentprograms, but the variation was slight. At least half of the eighth andtwelfth graders reported some difficulty reading their literature text, but46 percent of the students at grade 8 and between 34 and el percent of thestudents at grade 12 reported they had no difficulty ,Almesting, perhaps,that much of what they are asked to read is not as challenging as it could be.
Emphasis on Testing
Formal testing has historically played an important role inreading instruction, both as a means of diagnosing students' needs and ofevaluating the success of instruction.
Professional attitudes toward such testing have varied overtime, and have remntly been divided between those who feel that moretesting is necessary as part of the process of raising academic standards,and those who feel that testing is already diverting too much time frominstruction.
54'I
LI
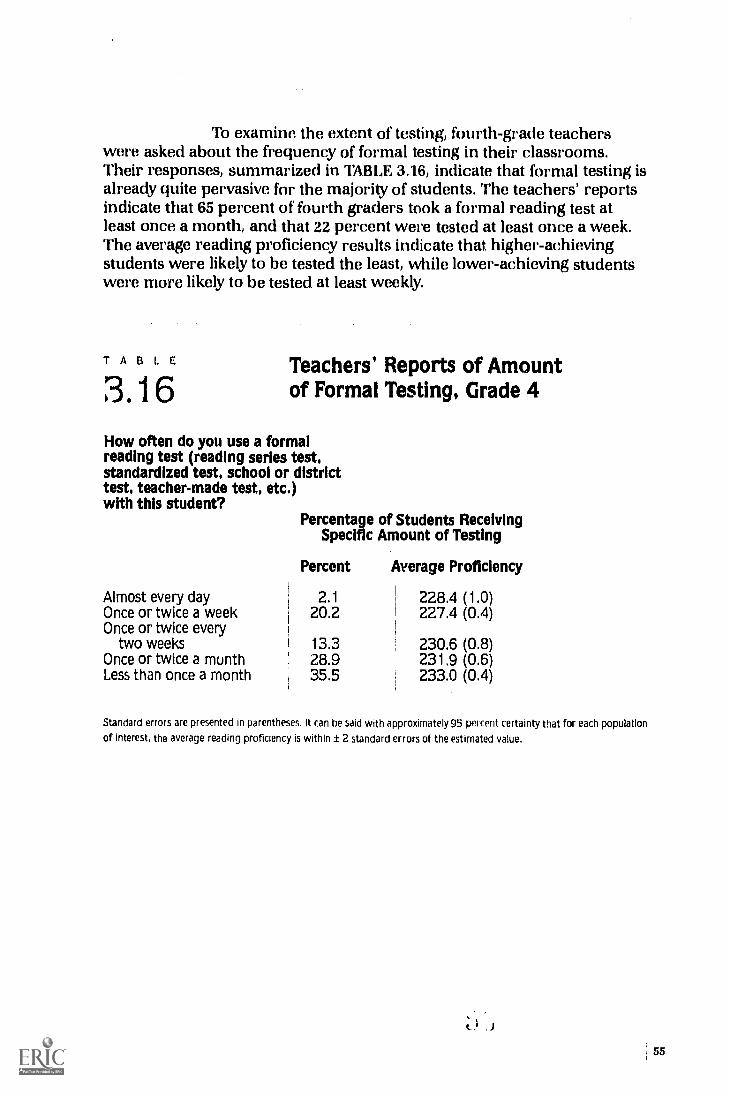
To examine the extent of testing, fourth-grade teacherswere asked about the frequency of formal testing in their classrooms.Their responses, summarized in TABLE 3.16, indicate that formal testing isalready quite pervasive for the majority of students. The teachers' reportsindicate that 65 percent of fourth graders took a formal reading test atleast once a month, and that 22 percent were tested at least once a week.The average reading proficiency results indicate that higher-achievingstudents were likely to be tested the least, while lower-achieving studentswere more likely to be tested at least weekly.
TABLE
3.16Teachers' Reports of Amountof Formal Testing, Grade 4
How often do you use a formalreading test (reading series test.standardized test. school or districttest. teacher-made test. etc.)with this student?
PercentageSpecific
of Students ReceivingAmount of Testing
Percent Average Proficiency
Almost every day 2.1 228.4 (1.0)Once or twice a week 20.2 227.4 (0.4)Once or twice every
two weeks 13.3 230.6 (0.8)Once or twice a month 28.9 231.9 (0.6)Less than once a month 35.5 233.0 (0.4)
Standard errors are presented in parentheses. It can be said with approximately 95 percent certainty that for each population
of interest, the average reading proficiency is within ± 2 standard errors of the estimated value.
t )
55

Recent Changes in Teaching Practices
The past few years have been marked by a variety of callsfor higher academic standards and stricter discipline. To examine theextent to which these calls have influenced reading programs, fougrade teachers were asked to indicate what changes, if any, had takenplace in their teaching during the past three years. Their responses,summarized in TABLE 3.17, suggest that changes in the past few yearshave been relatively modest affecting from one-quarter to one-third ofthe students in any one area. Twenty-six percent of the fourth waderswere being taught by teachers who reported making none of the changeslisted. The changes affecting the most students, approximately 30 percent,were stricter discipline and more difficult coursework. Between 25 and 27percent of the students were experiencing the effects of increasedamounts of homework and/or testing. Only 6 percent were being held tostricter attendance requirements.
TABLE
3.17Teachers' Reports ofChanges in Teaching Practices, Grade 4
Which, if any, of the following changeshave you made in your teaching practicesover the past three years?
Increased thedifficulty of courses
Increased theamount of homework
Increased theamount of testing
Enforced stricterdiscipline
Enforced stricterattendancerequirements
None of the above
Was not teachingthree years ago
56
Percentage of Students Affectedby New Teaching Practices
Nation
Advantaged Disadvantaged RuralUrban Urban Communi-
Communities Communities ties
; 29.5 35.5 20.7 31.5
26.7 31.1 39.2 27.2
25.4 30.7 35.0 22.2
30.3 19.4 33.7 35.8
5. / 3.1 11.8 2.0
262 25.7 27.5 23.6
12.8 11.4 10.3 15.8

Table 3.17 also summarizes differences in these changesfor students attending schools in communities defined as advantagedurban, disadvantaged urban, and rural. The figures suggest that studentsattending schools in disadvantaged urban communities have seensomewhat more change in the amount of testing, discipline, homework,and attendance requirements, while students attending schools inadvantaged urban communities have been more likely to notice anincrease in the difficulty of their courses. All of these changes are modest,however, and their overall impact is unclear, since teachers were notasked about changing their r equirements in the opposite direction and itis impossible to know the comparative practices of new teachers.
Summary
The portrait of reading instruction that emerges from thischapter is a very traditional one. Beginning reading insil uction, at least asreported from the perspective of fourth-grade teachers, is apt to be basedon phonics or eclectic approaches, as opposed to a language experienceapproach. At the fourth grade, the majority of teachers reported thatstudents are given an hour of reading instruction on a typical day,dominated by a combination of whole-class instruction and ability-basedreading groups. In almost all classes, instruction is based on basalreaders, although collections of children's books (trade books) are usuallyused as supplementary materials. There is little evidence that morebroadly based approaches, using newspapers, magazines, or evenmultiple series of basals, have been implemented in many classrooms.
The skills that are emphasized for all students are thosethat are most closely related to initial comprehension tasks of constructingmeaning, and this emphasis increases for students in low-ability classes.Activities that are likely to foster students' abilities to examine andelaborate upon their understanding in more depth, however, receiverelatively less emphasis for all students, and are used rarely in classeswhere students have lower reading proficiency.
Finally, in disadvantaged urban communities whereresources are critical, teachers of half the students reported receivingsome or none of the instructional materials they needed. This findingwarrants careful anent* and further study.
57

4
58
The Characteristics of Fourth-GradeReading Teachers: A Closer Look
The special teacher questionnaire designed to examine thecharacteristics of fourth-graders' reading instruction also included anumber of questions about the teachers' background and preparation.This chapter takes a closer look at the characteristics of the individualswho provide reading instruction to fourth-grade students.
Gender and Race/Ethnicity
TABLE 4.1 summarizes the distribution of fourth -gra&students by their teacher's gender and race/ethnicity. The overwhelmingmajority of students are taught by female teachers (88 percent), and this isrelatively constant across subgroups. Nationally, 88 percent of the studentsare taught by White teachers, but here the data suggest some differencesacross subgroups of students. A larger percentage of Black students thanWhite students have Black teachers and a larger percentage of studentsattending schools in disadvantaged urban areas, for example, have Blackteachers than do students in rural o. advantaged urban communityschools. This may reflect special efforts made by teacher colleges, statedepartments of education, and urban school districts to provide positiveminority role models for minority students.

TABLE
4.1
Student Groups
Nation
Race/EthnicityWhiteBlackHispanic
Size and Typeof Community
Advantaged UrbanDisadvantaged UrbanRural
Teachers' Reports of Their Genderand Race/Ethnicity, Grade 4
Percentage of Students with Teachersfrom Different Subpopuiations
Teacher TeacherGender Race/Ethnicity
Female
88.2
88.191.187.4
88.889.391.8
Preparation to Teach
Male White Black Hispanic
11.8 88.0 9.3 1.4
11.9 94.4 3.7 0.88.9 63.6 34.0 0.9
12.6 79.8 11.9 5.4
11.2 88.5 6.8 3.110.7 67.9 26.1 2.48.2 97.7 1.8 0.5
How well are these teachers formally prepared to teachreading? TABLE 4.2 summarizes the percentage of students whoseteachers reported having at least a master's degree, the highest level ofteaching certification offered by their state, and state certification in theteaching of reading.
59
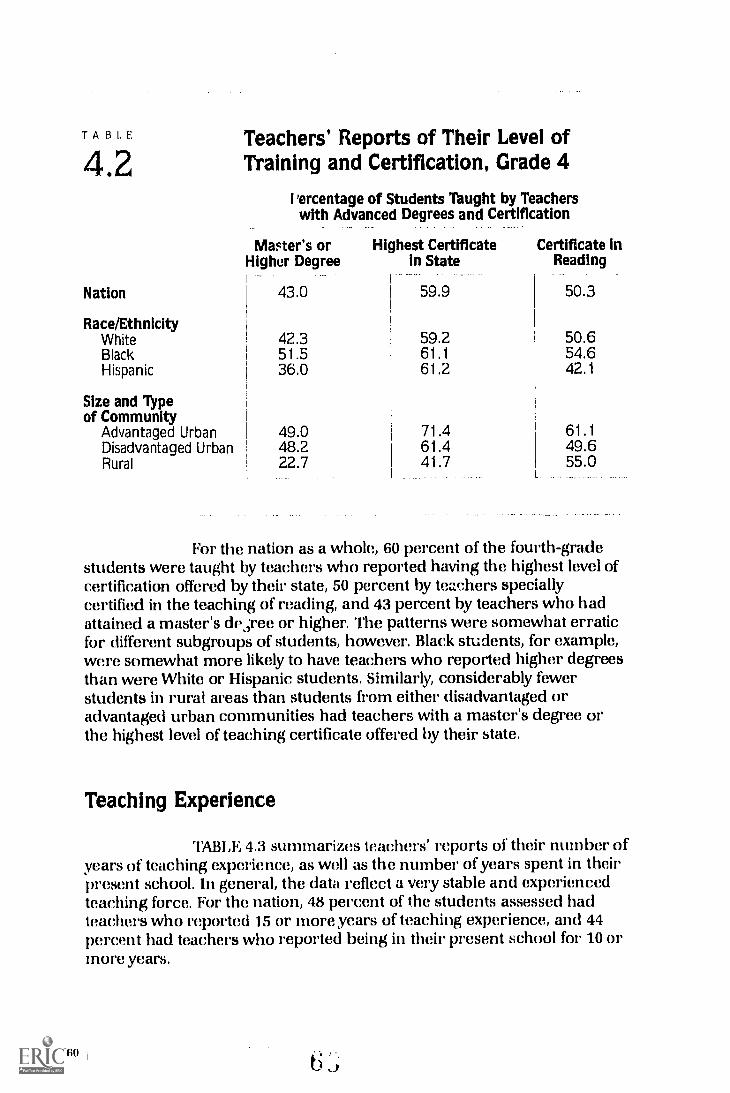
TABLE
4.2Teachers' Reports of Their Level ofTraining and Certification, Grade 4
rercentage of Students Taught by Teacherswith Advanced Degrees and Certification
Master's or Highest Certificate Certificate inHigher Degree in State Reading
Nation 43.0 59.9 50.3
Race/EthnicityWhite 42.3 59.2 50.6Black 51.5 61.1 54.6Hispanic 36.0 61.2 42.1
Size and Typeof Community
Advantaged Urban 49.0 71.4 61.1Disadvantaged Urban 48.2 61.4 49.6Rural 22.7 41.7 55.0
For the nation as a whole, 60 percent of the fourth-gradestudents were taught by teachers who reported having the highest level ofcertification offered by their state, 50 percent by teachers speciallycertified in the teaching of reading, and 43 percent by teachers who hadattained a master's de,;ree or higher. The patterns were somewhat erraticfor different subgroups of students, however. Black students, for example,were somewhat more likely to have teachers who reported higher degreesthan were White or Hispanic students. Similarly, considerably fewerstudents in rural areas than students from either disadvantaged oradvantaged urban communities had teachers with a master's degree orthe highest level of teaching certificate offered by their state.
Teaching Experience
TABLE 4.3 summarizes teachers' reports of their number ofyears of teaching experience, as well as the number of years spent in theirpresent school. In general, the data reflect a very stable and experiencedteaching force. For the nation, 48 percent of the students assessed hadteachers who reported 15 or more years of teaching experience, and 44percent had teachers who reported being in their present school for 10 ormore years.
60
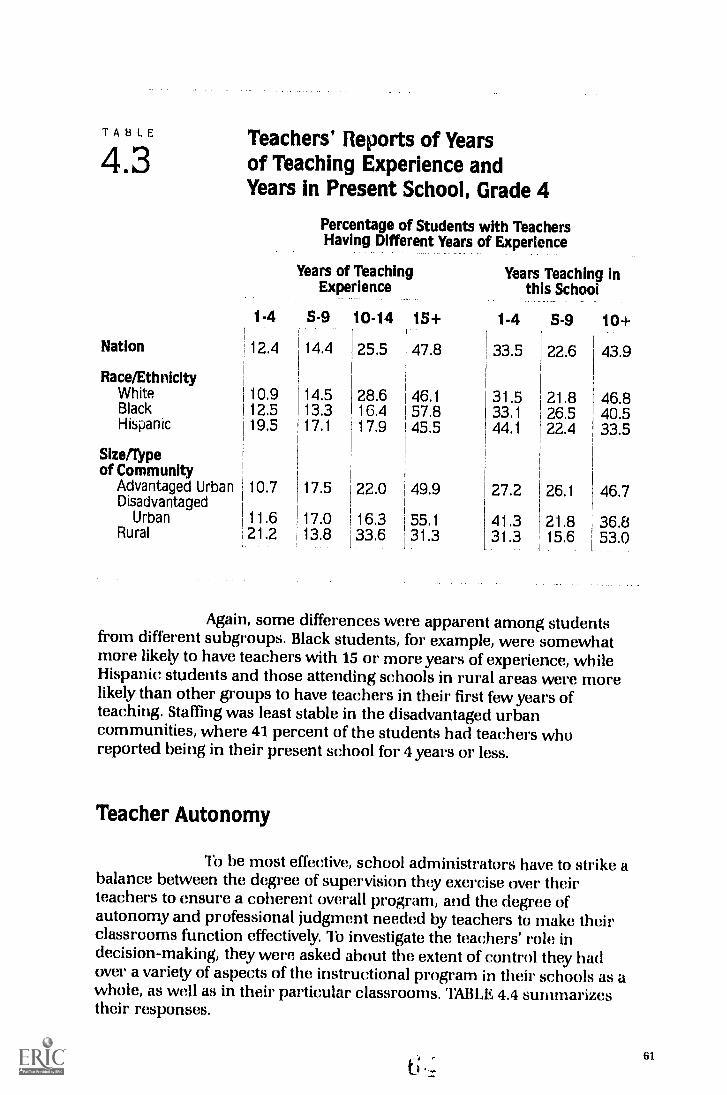
TABLE
4.3Teachers' Reports of Yearsof Teaching Experience andYears in Present School, Grade 4
Percentage of Students with TeachersHaving Different Years of Experience
Years of Teaching Years Teaching inExperience this School
1-4 5-9 10-14 15+ 1-4 5-9 10+
Nation 12.4 14.4 25.5 47.8 33.5 22.6 43.9
Race/EthnicityWhite 10.9 14.5 28.6 46.1 31.5 21.8 46.8Black 12.5 13.3 16.4 57.8 33.1 26.5 40.5Hispanic 19.5 17.1 17.9 45.5 44.1 22.4 33.5
Sizefrypeof Community
Advantaged Urban 10.7 17.5 22.0 49.9 27.2 26.1 46.7Disadvantaged
Urban 11.6 17.0 16.3 55.1 41.3 21.8 36.8Rural 21.2 13,8 33.6 31.3 31.3 15.6 53.0
Again, some differences were apparent among studentsfrom different subgroups. Black students, for example, were somewhatmore likely to have teachers with 15 or more years of experience, whileHispanic students and those attending schools in rural areas were morelikely than other groups to have teachers in their first few years ofteaching. Staffing was least stable in the disadvantaged urbancommunities, where 41 percent of the students had teachers whoreported being in their present school for 4 years or less.
Teacher Autonomy
To be most effective, school administrators have to strike abalance between the degree of supervision they exercise over theirteachers to ensure a coherent overall program, and the degree ofautonomy and professional judgment needed by teachers to make theirclassrooms function effectively. To investigate the teachers' role indecision-making, they were asked about the extent of control they hadover a variety of aspects of the instructional program in their schools as awhole, as well as in their particular classrooms. TABLE 4.4 summarizestheir responses.
61
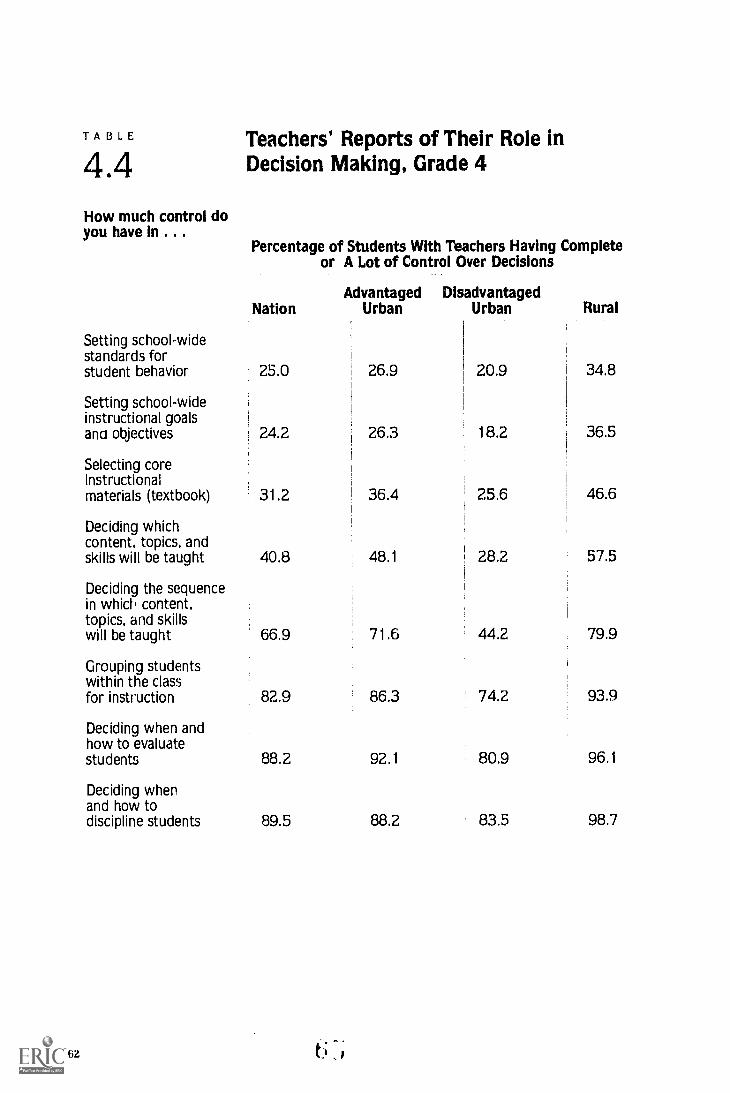
TABLE
4.4How much control doyou have in . . .
Teachers' Reports of Their Role inDecision Making, Grade 4
Setting school-widestandards forstudent behavior
Setting school-wideinstructional goalsand objectives
Selecting coreinstructionalmaterials (textbook)
Deciding whichcontent, topics, andskills will be taught
Deciding the sequencein which content,topics, and skillswill be taught
Grouping studentswithin the classfor instruction
Deciding when andhow to evaluatestudents
Deciding whenand how todiscipline students
62
Percentage of Students With Teachers Having Completeor A Lot of Control Over Decisions
NationAdvantaged Disadvantaged
Urban Urban
f
Rural
25.0 26.9 20.9 34.8
24.2 26.3 18.2 36.5
31.2 36.4 25.6 46.6
40.8 j 48.1 28.2 57.5
66.9 71.6 44.2 79.9
82.9 86.3 74.2 93.9
882 92.1 80.9 96.1
89.5 88.2 83.5 98.7

As would be expected, the degree of control that teachersreported in decision-making became greater the closer they got to theirown classrooms. For example, only a quarter of the students had teacherswho felt they had control of school-wide standards for student behavior orschool-wide instructional goals and objectives, but 88 to 90 percent hadteachers who felt they had control of decisions about when and how todiscipline and evaluate students in their classrooms. Only 41 percent ofthe fourth graders had reading teachers who felt they had control of thecontent of what they taught, although two-thirds had teachers whoindicated control over sequencing that instruction. Only 31 percent of thefourth-grade students had teachers who felt they had control overselecting core instructional materials.
In general, students in rural schools had teachers whoreported having considerably more control than those in urban settings.Students in disadvantaged urban settings were taught by teachers whoreported the least autonomy. Only 28 percent of these students hadteachers who indicated they had control of what they would teach(compared with 48 percent of their counterparts in auvantaged urbancommunities), and only 44 percent of the students had teachers who saidthey had control of decisions about the sequence in which content, topics,and skills will be taught (compared with 72 percent of the students inadvantaged urban settings).
Continuing Commitment to Teaching
Fourth-grade teachers were also asked whether they wouldstill become a teacher, if they had the opportunity to step back to theircollege days and start over again. As shown in TABLE 4.5, this group ofteachers reported a continuing commitment to teaching. Two-thirds ofth?, students (68 percent) had teachers who said they probably would stillchoose to teach, and only 16 percent of the students had teachers whosaid they probably would not. Interestingly, teachers from groups that hadreported the highest degree of autonomy in decision-making were alsothose most likely to report a continuing commitment to teaching. Thus,only 8 percent of the students in rural schools had teachers who said theyprobably would not teach if they had the chance to start over, but 34percent of those in disadvantaged urban community schools had teacherswho reported they would probably make a different choice.

TABLE
4.5Teachers' Reports of Their ContinuingCommitment to Teaching, Grade 4
Percentage of Students with Teachers HavingDifferent Levels of Commitment to Teaching
If you could start over, wouldyou become a teacher or not?
Certainly orProbably
Probably Not orMaybe Certainly Not
Nation 68.4 16.1 15.51
Race/EthnicityWhite 72.0 15.6 12.4Black 53.9 18.2 27.9Hispanic 66.0 14.8 19.3
Size and Typeof Community
Advantaged Urban 65.4 18.7 15.9Disadvantaged Urban 53.3 12.5 34.2Rural 76.2 15.5 8.3
Summary
As reflected by the teachers of a national sample of fourth-grade students, the teaching force as a whole is well prepared and veryexperienced. Males and minority groups, however, are underrepresented
only 12 percent of the fourth graders had male reading teachers, andonly about 22 percent were taught by either Black or Hispanic teachers.Some differences were evident among the teachers of different subgroupsof students. In particular, students in disadvantaged urban schools had ahigher proportion of Black teachers, which may in part reflect specialefforts to provide positive minority role models for minority students.
The degree of professional autonomy reported by teachersvaried with the closeness of the decisions being made to the immediateconcerns of their own classrooms. Most students had teachers whoreported little control over school-level standards and policies, butconsiderable control over the sequence of instruction, evaluation, anddiscipline within their own classrooms. However, the majority of studentsare taught by teachers who reported only some, little, or no control overdecisions about the content they taught. Overall, students in rural schoolsand those in advantaged urban schools had teachers who reported moreprofessional autonomy than those in disadvantaged urban schools, andalso expressed the greatest continuing commitment to teaching as acareer.
64

I IHOW WELL DO STUDENTS READ?
Performance on Individual Reading Tasks
The chapters comprising Part I of this report described theaverage reading proficiency of students in relation to a number of theirbackground characteristics and the type of reading instruction they hadreceived. Part II describes students' performance on individual readingtasks included in the 1988 assessment.
The description of students' performance focuses on twoaspects of students' reading behavior: Their ability to construct meaningfrom text and their ability to examine that meaning by extending,elaborating, and critically judging the information contained in a passage.
In addition to examining passage characteristics andpassage-item interactions, a panel of reading experts carefully studiedeach question included in the assessment to determine the types ofreading behavior that would be demonstrated by correct responses. Theseanalyses suggested that readers work with text in a variety of ways to buildunderstanding, extend meaning, and respond critically.
Because students encounter a variety of texts in theirschool and personal lives, both literary and informational passages wereused in the assessment. Each type of text required readers to use differentcomprehension and interpretive abilities. Literary tasks includedunderstanding a complex essay and interpreting a literary work.Informational tasks ranged from reading a science article tounderstanding an advertisement. Students were required to read andwrite about these different types of materials.
Multiple-choice questions in the 1988 NAEP readingassessment were designed to tap students' ability to construct the meaningof a passage by focusing on specific information or the overall message.Open-ended questions also assessed students' ability to construct meaningas well as examine and extend their initial understanding of a passage.These tasks required students to present their constructed meanings inwriting and go beyond, providing evidence for their ideas. The responsesto open-ended reading questions were evaluated by trained readers whoused detailed scoring guides.
The guides delineated four levels of task accomplishmentin common: Not Rated, Unsatisfactory, Adequate (reflecting success inconstructing an initial interpretation), and Elaborated (reflecting theability to examine the text and provide evidence to support aninterpretation). (See the Procedural Appendix for a description of thescoring procedure for the open-ended questions.)
65

66
Success in answering questions seemed to be related to anumber of factors, such as question and passage type. In general, studentswere successful in answering questions that required getting the gist ofpassage information. However, they seemed to have the greatest amount ofdifficulty answering questions that required them to go beyond the textand provide evidence for their responses. In addition, response formatseemed to play a role in students' performance: "'asks requiring studentsto put their answers in writing tended to be more difficult than multiple -choice questions.
Understanding a text results from an interaction among thetext's features, the reader's prior knowledge, and the reading task. Taskdemands are shaped by the relationship between the complexity of thepassage and the way in which the reader must go about finding theanswer to a question. The 1988 NAEP reading assessment was designed tocapture these interactions in a meaningful way.
The following chapter summarizes students' performanceon tasks requiring them to construct meaning from a passage, includingunderstanding the overall message and specific information, anddescribes students' ability to examine the meaning of a selection moreclosely in order to provide details and evidence in support of theirinterpretation. Levels of task accomplishment are presented for varioustasks, and for illustrative purposes, examples of students' writtenresponses to certain tasks are provided.
The following analysis of students' performance onindividual items differs from previous reports, where NAEP has used thereading scale to describe levels of proficiency.' Those earlier analysesindicated that students performing at the lower levels of the scale wereable to carry out simple reading tasks and understand specific orsequentially related information. Students at the upper levels could find,understand, summarize, and explain relatively complicated information.Few students perform at the highest proficiency levels, which arecharacterized by the ability to synthesize and learn from specializedreading materials.
Trends in 9-, 13-, and 17-year-olds' reading performancefrom 1971 tt; ;388 have been monitored using the NAEP reading scale, aridresults were published in The Reading Report Card, 1971-1988. Becausethe assessment on which the present report is based included readingtasks and evaluation methods that differ from those used in the readingtrend assessment, and involved students at different grade levels, NAEPhas taken this opportunity to investigate responses to individual readingtasks in more detail.
V.S. Mullis and Lynn B. Jenkins, The Beading input Can!, 1117188 (Princeton, N.I; Educational 'testing Service,
National Assessment of Educational Progress, 199e).
b I

An Analysis of Performance onIndividual Reading Tasks
Reading involves the interaction between a reader, a text,and a situation. Thus, comprehension is influenced by the type of text ormaterial read and the specific purposes for reading. For example, readersmay focus on particular parts of informational texts to build on what theyknow or read literary texts to become involved in a new experience.
Readers are guided by the special characteristics of a textby their expectations of how the text will be organized and by their
knowledge of what an author might do in a specific genre as well as bytheir purposes for reading. For this reason, the 1988 assessmentconsidered students' performance in situations that involved readingdifferent kinds of texts for different purposes. Reading tasks in the 1988assessment included both literary and informational texts, and weredesigned to assess two purposes for reading: constructing meaning andexamining meaaing. Both purposes require a range of cognitive abilities.For instance, in constructing meaning, readers reach an understanding ofthe text by forming an initial impression of it, and then filling in ordeveloping their understanding. In examining meaning, readers extendtheir understanding by adopting a critical stance by analyzing a text, orby judging its quality or its plausibility, and supporting these judgmentswith evidence.
Constructing Meaning involves understanding what isread by focusing on either specific information or the overall message.Reading to understand specific information occurs when readers find anduse details that appear either within or across the sentences of a text.Readers locate certain information and make a variety of text-basedinferences. In contrast, reading to get the overall message occurs whenreaders go beyond the details, to infer important concepts and link themacross parts of a text, interpret the author's purpose, or reflect ondominant stylistic features. It requires that readers consider the text as awhole. Although they are distinguished in the assessment for purposes ofanalysis and reporting, many school-based reading experiences involve ablending of both behaviors. For example, using a reference book to locateand take notes on relevant material for a book report may involve locatingand understanding particular information as well as the overall point.
67

Examining Meaning requires the reader to go beyond theinitial impression to develop a more complete understanding of what wasread. It involves shifting to more intense and analytical reading. Readerstry to build on or look critically at the meaning of a text, by standing apartfrom the text. Examining meaning involves a range of tasks, includingcomparing and contrasting ideas, evaluating the motives underlying acharacter's actions, and analyzing the quality or effectiveness of a story.
In addition to p-flecting different purposes for reading, thereading tasks included in the 1988 assessment presented students withliterary and informational passages dealing with a number of differenttopics, at a range of difficulty levels. Multiple-choice questions thatrequired students to construct meaning understand specificinformation or to get the overall message were developed for eachpassage. In addition, several open-ended questions were developed thatassessed students' ability to construct and examine meaning, by askingthem to arrive at thoughtful interpretations and explain them. TI'NAEN's report on reading comprehension provides a profile of students'abilities to construct and examine meaning,
Overview of the Results
Overall, the results suggest that students are much moreproficient at constructing meaning than examining meaning, withapproximately two-thirds to three-fourths of the students giving correctanswers to the constructing meaning tasks and only small percentap,sarswering the examining meaning questions in an elaborated way (TABLE
The results also indicate that more students understani thedetails of what they read than the overall message, particularly forinformative passages. Nearly three-fourths the students respondedcorrectly to questions about specific passage inform Aim, but only abouthalf to two-thirds answered the overall message questions correctly. Thissuggests that students know something about the information thatsupports the main argument of a passage, but seem to know considerablyless about the main argument itself. These findings are discussed ingreater detail in the sections that follow.
'the iiverageperreelage of students yonsiniting meaning is based on Illy 111111111N' of rnrrrrl revpu Itif'!: In 1111 1111111i1111!-
ChOil'll litillMil(1113.1111+ examining meaning percentages are based on corret responses In the ope. emitted questions.
68

T A B L. E Average Percentage of Students Constructing5.1 and Examining Meaning
at Grades 4, 8, and 12
Constructing Meaning
Literary Informative
ExaminingMeaning
Literary andSpecific Overall Specific Overall Informative
Information Message Information Message
Grade 4 73.8 (1.1) 64.2 (1.2) 73.3 (1.1) 54.6 (1,3) 6.3 (0.7)Grade 8 72.0 (1.0) 67.9 (1.0) 67.5 (1.0) 60.2 (1.1) 1.4 (0.4)Grade 12 71.5 (1.0) 69.8 (1.2) 73.5 (1.2) 63.2 (1.1) 4.9 (0.5)
Standard errors are presente,t in parentheses. It can be said with 95 percent certainty that the average percentage of students
responding correctly to the questions in each category is within ± 2 standard errors of the estimated value.
Constructing MeaningGrade 4
Fourth graders were asked to read and respond toquestions pertaining to 24 passages - 11 literary and 13 informational.The literary passages consisted of short stories, folk tales, and poems,while the informational passages focused on social studies, science, andhistory. For each passage, the questions were classified as requiringstudents to comprehend specific information or global information, andperformance was averaged across the questions within each type. TABLE5.2 summarizes the average percentages of fourth graders who respondedcorrectly to both types of constructing-meaning questions for eachreading passage - questions on specific information and those on overallmessage.
BO
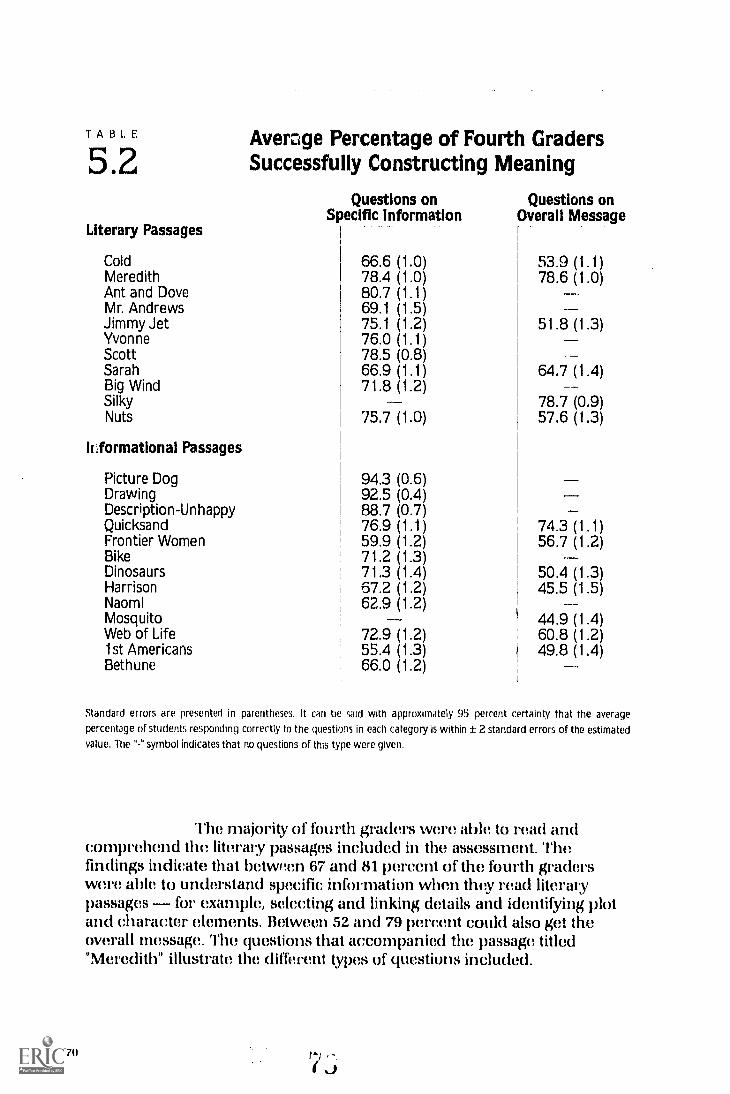
TABLE
52Average Percentage of Fourth GradersSuccessfully Constructing Meaning
SpecificLiterary Passages
Questions onInformation
Questions onOverall Message
Cold 66.6 (1.0) 53.9 (1.1)Meredith 78.4 (1.0) 78.6 (1.0)Ant and Dove 80.7 (1.1)Mr. Andrews 69.1 (1.5)Jimmy Jet 75.1 (1.2) 51.8 (1.3)Yvonne 76.0 (1.1)Scott 78.5 (0.8)Sarah 66.9 (1.1) 64.7 (1.4)Big Wind 71.8 (1.2)
Silky 78.7 (0.9)Nuts 75.7 (1.0) 57.6 (1.3)
ILformational Passages
Picture Dog 94.3 (0.6)Drawing 92.5 (0.4)Description-Unhappy 88.7 (0.7)Quicksand 76.9 (1.1) 74.3 (1.1)Frontier Women 59.9 (1.2) 56.7 (1.2)Bike 71.2 (1.3)Dinosaurs 71.3 (1.4) 50.4 (1.3)Harrison 67.2 (1.2) 45.5 (1.5)Naomi 62.9 (1.2)
Mosquito 44.9 (1.4)Web of Life 72.9 (1.2) 60.8 (1.2)
1st Americans 55.4 (1.3) 49.8 (1.4)Bethune 66.0 (1.2)
Standard errors are presented in parentheses. It can be said with approximately 95 percent certainty that the average
percentage of students responding correctly to the questions in each category is within ± 2 standard errors of the estimated
value. The "-" symbol indicates that no questions of this type were given.
The majority of fourth graders were able to read andcomprehend the literary passages included in the assessment. Thefindings indicate that between 67 and 81 percent of the fourth graderswere able to understand specific information when they read literarypassages - for example, selecting and linking details and identifying plotand character elements. Between 52 and 79 percent could also get theoverall message. The questions that accompanied the passage titled"Meredith" illustrate the different types of questions included.
70

MeredithMeredith looked at the coin. The face on it was frowning again.Meredith remembered that Mrs. Fleming had a desk drawerfull of things people had brought to class. There were a lot ofbaseball cards, several pea shooters and water guns, and atleast one set of jacks in the drawer. Mrs. Fleming kept it locked.She was going to give the things back on the last day of school.That was almost three months away.
If Mrs. Fleming thought Meredith was playing with the coin shemight lock it up in her drawer. Meredith picked it up and put itback into her pocket.
Specific Information
1. What did Meredith do with the coin?A Gave it to Mrs. Fleming.B Played with it during class.
71% *C Put it in her pocket.I) Hid it in her desk.
Overall Message
L. Why do you think Mrs. Fleming kept toys in her deskdrawer?
A Because she collected old toysB So that some children could play with them at
recess87% C To keep children from playing with them during
lessonsB To show them to the other teachers
Specific Information
3. Where was Meredith?A In the parkB On a busC At home
91% *1) At school
Overall Message
4. Now does the writer show that the coin it.. t maqic coin?A By telling ah(ut where Meredith put the coinB By telling about what was in Mrs. Fleming's
drawer70% 'C By telling about what the face on the coin was
doingI) By telling when the last day of school would be
Specific Inibrmation
5. Which of these things was in Mrs. Fleming's desk drawer?A A baseball
73% *B A set of jacksC A coinD A yo-yo
f71

Questions 1, 3, and 5 deal with specific information, whilequestions 2 and 4 tap overall meaning such as motivations for acharacter's actions and the manner in which an author conveysinformation. On average, 78 percent of the fourth graders respondedcorrectly to questions about specific information in the Meredith passage,and 79 percent responded successfully to questions that tapped theirability to understand more global information.
Although students, in general, tended to perform morepoorly on global items than specific information items, students who readthe Meredith passage performed similarly on both types of items. This"equality in performance" may best be explained by looking more closelyat the task demands of the assessment questions. For example, the overallmeaning questions for the Meredith passage tapped students'understanding of the teacher's motives and the special nature of the coin
both critical aspects of the piece. Such inferential questions weresometimes easier for them to answer than text-based questions thatconflicted with their expectations, such as "What did Meredith do with thecoin?" Only 71 percent of the students answered this detail-level questioncorrectly, while 87 percent cost ectly answered the more global secondquestion, "Why do you think Mrs. Fleming kept toys in her desk drawer?"
Similar to their performance on the literary passages,fourth graders had more difficulty understanding the overall messages ofthe informational passages than they did finding specific information.However, compared to their performance on the literary passages, most ofthe fourth graders were able to understand specific information inresponse to the informational pieces (60 to 94 percent), while more thanhalf were able to get the overall meaning (45 to 74 percent). For theinformational passage titled "Dinosaurs," for example, an average of 71percent of the students responded successfully to the specific informationquestions and 50 percent to the overall meaning questions. Of the fivequestions, the second and third tap overall meaning (in this case, the mainidea and author's purpose); the others tap the students' ability tounderstand specific information. The third question, asking about thepurpose of the passage, posed the greatest difficulty for students. Only 34percent answered it correctly.
72
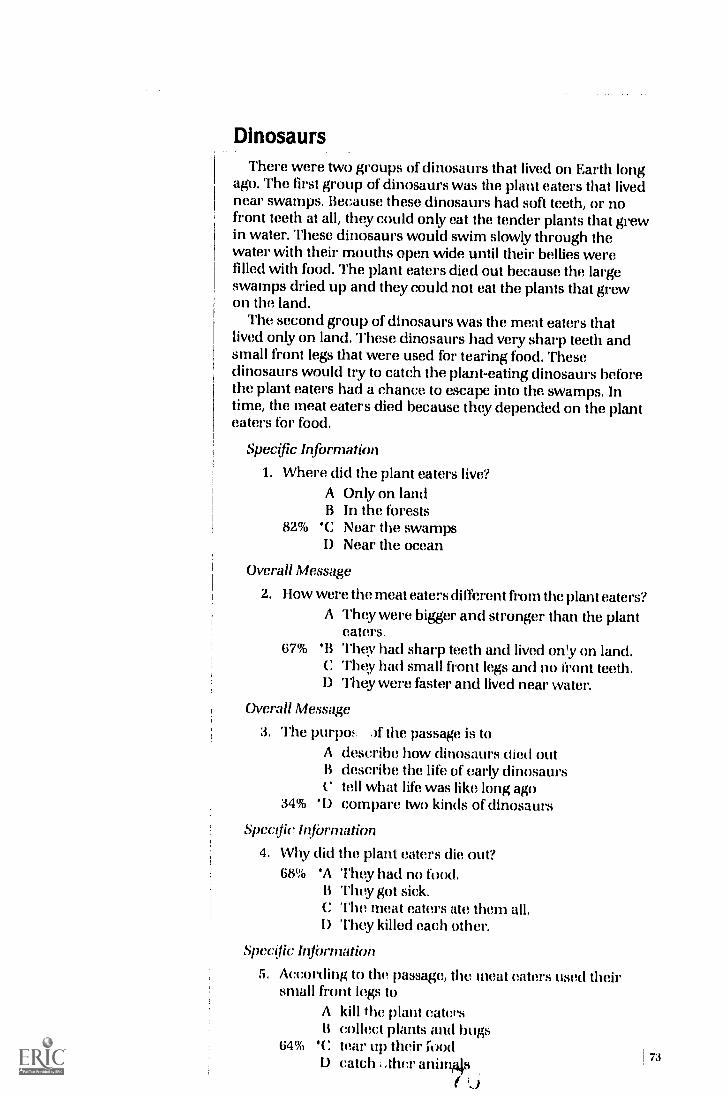
DinosaursThere were two groups of dinosaurs that lived on Earth long
ago. The first group of dinosaurs was the plant eaters that livednear swamps. Because these dinosaurs had soft teeth, or nofront teeth at all, they could only eat the tender plants that grewin water. These dinosaurs would swim slowly through thewater with their mouths open wide until their bellies werefilled with food. The plant eaters died out because the largeswamps dried up and they could not eat the plants that grewon the land.
The second group of dinosaurs was the meat eaters thatlived only on land. These dinosaurs had very sharp teeth andsmall front legs that were used for tearing food. Thesedinosaurs would try to catch the plant-eating dinosaurs beforethe plant eaters had a chance to escape into the swamps. Intime, the meat eaters died because they depended on the planteaters for food.
Specific Information
1. Where did the plant eaters live?A Only on landB In the forests
8Z% 'C Near the swampsI) Near the ocean
Overall Message
2. How were the meat eaters different from the plant eaters?A They were bigger and stronger than the plant
eaters.67% 'B They had sharp teeth and lived on'y on land.
C They had small front legs and no front teeth.I) They were faster and lived near water.
Overall Message
3. The purpm: the passage is toA describe how dinosaurs (tied outB describe the life of early dinosaursC tell what life was like long ago
34% 'D compare two kinds of dinosaurs
Specific Information
4. Why did the plant eaters die out?68% 'A They had no food.
B They got sick.C The meat eaters ate them all.D They killed each other.
Specific Information
5. According to the passage, the meat caters used theirsmall front legs to
A kill the plant catersB collect plants and bugs
64% $(.: tear up their foodB catch 73

Grade 8
Eighth graders read and responded to 27 passages - 6literary and 21 informational. The literary passages consisted of shortstories and excerpts from longer stories, while the informational passagesincluded a newspaper report, an article dispelling job hunting myths,several science passages, and advertisements. TABLE 5.3 presents theaverage percentages of eighth graders who responded correctly toconstructing meaning questions for each passage, for both specificinformation and overall meaning questions.
TABLE
5.3Average Percentage of Eighth GradersSuccessfully Constructing Meaniug
Questions on Questions onLiterary Specific Information Overall Message
Big Wind 83.3 (0.9)Captain Botchik 70.1 (1.2) 63.2 (1.2)Old Jim Bridger 61.9 (1.0) 61.0 (1.1)A Childhood Memory 57.3 (1.2) 46.3 (1.1)Silky 89.4 (0.6)Nuts 87.6 (0.8) 79.7 (0.8)
Informational
Naomi 85.1 (0.9)Bicycles 74.9 (1.2) 75.6 (1.1)Soccer 73.0 (1.0) 59.9 (1.0)Young Workers 75.1 (1.0) 77.1 (1.1)Cereals 42.2 (1.3) 52.6 (1.4)Business 84.7 (0.7) 48.7 (1.1)Bethune 86.3 (0.8)Goods to Market 77.6 (0.9)Mosquito 78.3 (1.1)Web of Life 82.7 (0.9) 70.1 (1.2)
Amei icans 71.1 (1.2) 74.9 (1.1)Wish 66.4 (1.5) 68.4 (1.4)Summer Job 65.5 (1.0)Meow-wow 62.6 (1.0)Arts 32.0 (0.9) 26.8 (1.0)Supreme Court 31.2 (0.8)'iruses 34.0 (1.0) 45.1 (1.2)
Garden in Park 82.5 (0.8) 61.3 (0.9)Skunk Cabbage 81.3 (0.8) 57.5 (0.9)Breathers 77.9 (0.8) 48.2 (1.1)Elephant Seals 64.1 (1.1) 58.1 (1.1)
Standard error.; are presented in parentheses. it can he said with approximately 9S percent certainty that the average
percentage of st.rdents responding correctly to the questions in each category Is within t 2 standard errors of the estimated
value. The "-" syn.bol indicates that n t questions of this type were given.
74

Similar to the performance at grade 4, a majority of theeighth graders were able to gain specific and global understanding fromthe literary passages they were asked to read. However, compared to thegrade 4 results, eighth graders' performer e across the two types ofquestions was more closely comparable. Average performance on thequestions asking about specific information ranged from 57 to 88 percentcorrect, while performance on questions measuring global understandingof aspects of passages averaged from 46 to 89 percent correct.
Old Jim Bridger, an old-time tale, appears to have beenaccessible to most of the students. The Bridger passage follows.
Old Jim BridgerOld Jim Bridger was a mountain man. Way hack when, in the
days before cowboys and desperados and the Pony Express, theonly living beings out West were animals and Indians and ahandful of mountain men. These last were fur trappers. Theytraveled on foot through the Rocky Mountains collectingbeaver skins for the dudes back East to make hats out of. OldJim Bridger was the travelingest of the lot.
When the U.S. Army sent out its surveyors to map theRockies, those young men were in for disappointments.Whenever they found what they thought was a brand-new, A-one, undiscovered mountain pass or river fork or salt lick, theysoon learned that Old Jim had already been there.
Once Jim heard a report of a strange valley where theground heaved and spouted steam through its cracks wherethe mud puddles boiled. John Colter, the mountain man whohad discovered the valley, had thought it was the Gateway toHell! He had got out of there before the Devil could rake himdown under. And he had never gone back.
When he had told his friends about his adventure, theythought he was either drunk or crazy. But to humor him, theycalled the place "Colter's Hell," and let it go at that.
Eventually Jim Bridger heard the story and decided to visitthe valley for a look-see. He found the ph ice, all right, Thewonders were all John Colter had claimed and then some!
There were ponds of pink and white mud boiling !ike mushin a kettle. When bubbles rose to the surface and burst,burning mud splattered fifty feet around. Jim had to look sharpto keep from being scalded. There were spouts of steam thatspurted up thicker than a man's body and higher than aflagpole and then were sucked back into the ground. Therewere lakes that had no bottom.
75
76
Jim found one spring that appealed to him particularly. Itwas icy at the bottom and boiling at the top. lie let down hisfishing line and hooked a good-sized trout. Then he pulled hiscatch very slowly through the hot water. By the time he landedit, the trout was cooked to perfection.
On the second day he spent in the valley, he had aremarkable experience. Directly ahead of him, say, about ahundred yards away, a fine elk grazed in a meadow. Jim had agood appetite. If there was one thing he loved to eat, it was elkmeat. He put his rifle to his shoulder, took aim, and pulled thetrigger. The elk went right on grazing.
Now Jim was a good shot. Somethint; :nusi have gone wrongfor him to miss an elk at a hundred yards. He checked his gun,reloaded it, aimed, and shot again. Nothing happened. The elkwent right on grazing.
Jim couldn't understand this. For the third time he loadedhis rifle, aimed carefully, and fired. And still the elk kept ongrazing. It didn't even look up at the sound of the shot.
This gave Jim an inkling as to what was the matter. The elkmust be deaf. The thing to do was to sneak up on it from therear and club it over the head with his gun. He started forwardat a jog trot. All of a sudden, smack! He ran into something ashard as a rock that he couldn't see. He was knocked back ontothe ground.
When he picked himself up, he groped his way forwardcautiously. His hand touched the invisible substance. It was awall of glass. He had run into a mountain of glass, so clear thatit acted like a telescopic lens. Instead of being a hundred yardsaway and within easy gunshot, the elk was actually twenty-fivemiles from its hunter.
Ayoung newspaperman heard about the discoveries andwent west to interview Jim. He wrote a long article about thestrange valley for his paper, but his editor refused to print it. Hesaid Jim Bridger was pulling the reporter's leg.
Many years later that editor was sorry. He learned from theU.S. Army officers who made the official survey of the area thatJim had been telling the truth.
The region that John Colter discovered and Old Jim Bridgerexplored we know as Yellowstone National Park. It has its shareof boiling springs and towering geysers. Right i the middle ofit is a hill of obsidian -- volcanic lava that cooled so fi-st itturned into dark, transparent rock. That hill is the mysteriousmountain of glass.
Perhaps Jim did exaggerate a little, but what he said wasessentially true, sure enough!
t'i_f

Specific Information
1. What kind of people were the mountain men?A CowboysB Desperadoes
73% *C Fur trappersI) IndiansE I don't know.
Overall Message
2. Which statement best describes Jim Bridger's storiesabout the strange valley?
A He invented everything he said.B He described things exactly as he saw them.
53% *C He sometimes stretched the truth.D He forgot how things really were.E I don't know.
Overall Message
3. In their writing. authors sometimes make use of similesdirect comparisons of two unlike things. The following
is an example of a simile:
The girl ran as fast as a deer.
Which of the following lines from the story is an exampleof a simile?65% *A There were ponds of pink and white mud
boiling like mush in a kettle.B Eventually Jim Bridger heard the story and
decided to visit the valley for a look-see.C He said Jim Bridger was pulling the rer )rter's
leg.I) But to humor him, they called the place "Colter's
Hell," and let it go at that.E I don't know.
Specific Information
4. According to the story, who discovered the land which isnow known as Yellowstone National Park?
A Jim Bridger60% *B John Colter
C L1,S. Army surveyorsI) Ayoung newspapermanE I don't know.
Specific InfOrmation
5. According to Jim Bridger's story, why did his shot missthe elk?
A Jim was a poor shot with a rifle.53% *B The elk was actually out of gunshot range.
C The elk m ed too quickly.I) The elk was probably deaf.E I don't know.
77

Overall Message
6. In their writing, authors sometimes make use ofhyperbole language characterized by excessiveexaggeration. The following is an example of hyperbole.
The boy was so tall his head touched the clouds.
Which of the following lines from the story is an exampleof hyperbole?
A Old Jim Bridger was the travelingest of the lot.B When he had told his friends about his
adventure, they thought he was either drunk orcrazy.
C It has its share of boiling springs and toweringgeysers.
65% 1) There were lakes that had no bottom.E I don't know.
Questions 1, 4, and 5 on the Bridger story tap students'understanding of specific Information such as the type of personexemplified by the characters; a detail about who discovered YellowstoneNational Park, and the relationship between a particular cause and itsoutcome. Questions 2, 3, and 6, on the other hand, focus on globalunderstandings that ii volve plot summary and literary conventions. Morethan 60 percent of the students, on average, demonstrated good meaningconstruction abilities, responding successfully to both specific informationand overall meaning questions based on this reading passage.
In general, eighth-grade students performed onlysomewhat less well on the informational than on the literary passages, inresponse to questions about specific information as well as about theoverall message: Between 31 and 86 percent answered specificinformation questions correctly, and between 27 and 78 percentsuccessfully answered questions requiring understanding the overallmessage.
As was to be expected, passages with the most technicalvocabulary "Arts", "Supreme Court", and "Viruses" posed the greatestdifficulty for students. In contrast, passages such as the "Young Workers"posed only moderate difficulty, with apnroximately three-quarters of thestudents correctly answering both types of questions. The "YoungWorkers" passage follows.
78

Young WorkersAddle, New York, Lower East Side District, 1900
My father made only four dollars a week and there were sixchildren, so my mother took in work. She would get bundles ofunfinished pants from this factory, There would be maybetwenty-five, thirty pants to a bundle. And she would bring themhome and finish them, and she would keep my sister and meout of school to help. When she started this, I was eight yearsold.
All day we would sit in the kitchen and sew. We would turnup the bottoms and sew them, and we would put a lining in thewaist and sew that. The next morning she would take thebundle back and get another one. I would go to school maybeonce, twice a week.
Jess, Western Nebraska, 1906-1910Starting when I was fourteen, I spent every summer working
on farms. packed my suitcase and took a train and would begone for three months.
Every morning I got the team ready. Then the farmer woulddrive a binder through his wheat and cut it and bind it intobundles. And I would follow behind and stack the bundles onend in shocks so they wouldn't get wet. When the shocking wasover, I'd help with the threshing. And when that was done, thesummer was gone.
Martha, Philadelphia, 1903When I was twelve years old my mother came to me, and she
said I had to leave school and get a job. We needed the money.So I got a job makin' buttonholes in vests.
It was the same. Day after day. Start at seven, work till six, sixdays a week. I was worn out. I got three cents for every twobuttonholes, and I made them by hand. Oh, you had to makean awful lot. The first week I made two hundred and sixty-five,and they gave me four dollars.
Joe, Northern Maine, 1885-1899The first year I worked in the woods I was fifteen years old.
This logging camp was twenty-five, thirty miles from thenearest town.
There were about eighty of us in that camp. and we all sleptin log cabins. On each side there'd be bunks and in the middlethere'd be a stove and a pile of wood. And they had a cook'sroom and an eatin' room and that sort of thing.
7J

At night, we'd get together in the eatin' room. And sowwould play the mouth harp (harmonica) and maybe somewould sing or step dance or tell stories. And there'd always besome clown carrying on like me. Just in fun, I'd go over andthrow a clipper of water on somebody. Well, that would alwaysstart a roughhouse.
But you had to do things like that to keep your spirits up.Takin' to the woods that way all winter, you worked hard andyou never got to town. That first winter I was up there twomonths straight. When I was eighteen, I stayed five months andeight days before I came out.
Overall Message
1. What did Martha think about her job?A It was better than going to school.B It was too difficult for children.C It was different and exciting.
75% "D It was tiresome and uninteresting.
Specific Information
2. What was one thing Joe found hard about his work?A Getting along with the loggers who liked to
roughhouseB Learning how to cook food on a wood stove
72% *C Staying in the woods for several mr piths withoutgoing to town
D Showing the men on the job that he was strongenough to work
Specific Information
3. Which person had a job at home?78% *A Acidic
B JessC MarthaB Joe
Overall Message
4. What did Jess do every clay at his job?A Ile cut wood and cooked food for the loggers.B He fed the cows and pigs on a farm.C He worked in a factory making clothes.
72% *D He stacked and threshed bundles of wheat.
Overall Message
5. What do all of the people in the passages above have incommon?
A They worked in the country on farms.85% "B They went to work when they were young.
C They worked in factories.I) They were from the country.
80

Questions 2 and 3 accompanying the "Young Workers"passage tap students' understanding of specific information regardingcharacterization, while questions 1, 4, and 5 focus on overall meaningssuch as drawing a conclusion, summarizing information, and exploringsimilarities and differences. The last question, designed to tap globalknowledge, asked students to identify a common theme across allpassages. This was apparently easier to answer than any of the otherquestions, since 85 percent of the students answered it correctly.
Grade 11The twelfth graders read and responded to 26 passages 4
literary and 22 informational. The literary passages consisted of historicalfiction, short stories, and a personal recollection. The informationalpassages included science selections, an advertisement, businessselections, an historical piece, and a passage dispelling commonmisconceptions about job hunting. TABLE 5.4 contains the averagepercentages of twelfth graders who responded correctly to both specificmeaning and overall message questions for each reading passage.
As at grade 8, student performance varied according to theparticular passage; however, differences in understanding between theinformational and literary passages was limited. For the literary passages,high-school seniors found questions about specific information andoverall message to be of comparable difficulty. Approximately 70 to 72percent, on average, tended to answer both types of assessment questionscorrectly.
Between 69 and 78 percent of the students respondedsuccessfully to the specific information questions on the literary passages.These questions focused on students' understanding of details aboutevents, settings, and characters. Similarly, between 62 and 75 percentresponded correctly to questions tapping their knowledge of the overallmessage (such as identifying the main idea or the author's purpose, ordemonstrating familiarity with particular literary genres and conventions).
81

TABLF.
5.4Literary
Old Jim BridgerA Childhood MemorySmall FruitsToaster
Informational
BusinessPlatinaMosquito FoodAtmosphereOceansJob MythsNaomiLark & AlpineVotingHigh TechSummer JobMeow-wowArtsSupreme CourtVirusesGarden in ParkSkunk CabbageBreathingElephant SealsHawaiiMigrationExpectation
Average Percentage of Twelfth GradersSuccessfully Constructing Meaning
Questions on Questions onCoeciflc Information Overall Message
73.1 (0.8) 72.3 (0.8)77.5 (1.0) 62.0 (1.1)68.5 (1.2) 70.0 (1.5)
74.9 (1.3)
80.4 (0.8) 70.5 (0.9)78.0 (1.2) 64.1 (1.0)66.5 (1.3) 81.3 (1.0)80.2 (1.1) 84.2 (1.0)75.8 (1.1) 43.5 (1.4)67.3 (1.3)92.0 (0.7)77.9 (1.3) 562 (12)72.0 (1.6) 81.5 (1.1)63.0 (1.5)84.4 (0.5)76.7 (0.9)43.1 (1.2) 43.1 (12)44.8 (1.2)57.7 (1.4) 59.1 (1.0)90.9 (0.5) 65.6 (1.2)88.3 (0.7) 68.3 (1.2)87.4 (0.7) 62.0 (1.2)79.4 (1.0) 70.1 (1.0)75.0 (1.0)74.2 (1.0) 60.9 (1.0)62.1 (1.1) 37.5 (1.0)
Standard errors are presented in parentheses. It can be said with approximately 95 percent certainty that the average
percentage of students responding correctly to the questions in each category is within t 2 standard errors of the estimated
value. The "-" symbol Indicates that no questions of this type were given.
82

as an example.A literary passage titled "A Childhood Memory" is presented
A Childhood MemoryYes, summer was rituals, each with its natural time and
place. The ritual of lemonade or iced-tea making, the ritual ofwine, shoes, or no shoes, and at last, swiftly following theothers, with quiet dignity, the ritual of the front-porch swing.
On the third day of summer in the late afternoon,Grandfather reappeared from the front door to gaze serenelyat the two empty eye rings in the ceiling of the porch. Moving tothe geranium-pot-lined rail, he wet his finger to test the wind,and shucked his coat to see how shirt sleeves felt in thewestering hours. He acknowledged the salutes of othercaptains on yet other flowered porches, out themselves todiscern the gentle ground swell of weather.
"All right, Douglas, let's set it up."In the garage they found, dusted, and carried forth the
howdah, as it were, for the quiet summer-night festivals, theswing chair which Grandpa chained to the porch-ceilingeyelets.
Douglas, being lighter, was first to sit in the swing. Then,after a moment, Grandfather gingerly settled his pontificalweight beside the boy. Thus they sat, smiling at each other,needling, as they swung silently back and forth, hack and forth.
Ten minutes later Grandma appeared vt,,th water bucketsand brooms to wash down and sweep off the porch. Otherchairs, rockers and straight-backs, were summoned from thehouse.
"Always like to start sitting early in the season," said Grandpa,"before the mosquitos thicken."
About seven o'clock you could hear the chairs scraping hackfrom the tables, t.omeone experimenting with a yellow-toothedpiano, if you stood outside the dining-room window andlistened. Matches being struck, the first dishes bubbling in thesuds and tinkling on the wall racks, somewhere, faintly, aphonograph playing. And then as the evening changed thehour, at house after house on the twilight streets, under theimmense oaks and elms, on shady porches, people wouldbegin to appear, like those fgures who tell good or badweather in rain-or-shine clocks.
Uncle Bert, perhaps Grandfather, then Father, and some ofthe cousins; the men all coming out first into the syrupyevening, blowing smoke, leaving the women's voices behind inthe cooling-warm kitchen to set their universe aright. Then thefirst male voices under the porch brim, the feeuip, the boysfringed on the worn steps or wooden rails where sometimeduring the evening something, a boy or a geranium pot, wouldfall off.
83

At last, like ghosts hovering momentarily behind the doorscreen, Grandma, Great-Grandma, and Mother would appear,and the men would shift, move, and offer seats. The womencarried varieties of fans with them, folded newspapers,bamboo whisks, or perfumed kerchiefs, to start the air movingabout their faces as they talked.
What they talked of all evening long, no one rememberednext day. It wasn't important to anyone what the adults talkedabout; it was only important that the sounds came and wentover the delicate ferns that bordered the porch on three sides;it was only important that the darkness tilled the town likeblack water being poured over the houses, and that the cigarsglowed and that the conversations went on, and on. The femalevoices moved out, disturbing the first mosquitoes so theydanced in frenzies on the air. The male voices invaded the oldhouse timbers; if you closed your eyes and put your head downagainst the floor boards you could hear the men's voicesrumbling like a distant, rumbling earthquake, constant,unceasing, rising or falling a pitch.
Overall Message
1.. What is the main reason the writer wrote this btory?A To describe the hanging of the porch swingB To describe a child's view of adult
conversationC To describe Grandfather's relationship with
his family60% st) To describe details of a summertime custom
E I don't know.
Overall Message
2. What was special about the front porch in thesunnocr?
A It was a place where the children couldentertain their friends.
80% '13 It was a comfortable place to gather and chat.C It was a pia: for dancing, music, and loud
jokes.U It was the only front porch in the
neighborhood.E I don't know.
Specific: Infirmation
3. Which word best describes the family life in this story?79% *A Close-knit
B IndependentC ItostileD DisorganizedE I don't know.
84

Specific Intbrrnation
4. What does SYRUPY mean in the phrase the men allcoming out first into the syrupy eve jog"?76% 'A humid
B rainyC coldD breezyE I don't know.
Overall Message
5. In the second paragraph, what image does the writercreate as the grandfather begins to set up the porchswing?
A Women appearing as ghosts46% °B Ships sailing on the ocean
C A rumbling earthquake in the distanceI) People acting like wooden figures in a clockE I don't know.
Questions 3 and 4 of the passage query students aboutspecific information such as a descriptive word to characterize the familyin the story; and the meaning of a particular word "syrupy" as it isused in the context of the story. Questions 1, 2, and 5, on the other hand,ask students about more global meanings such as the author's purpose,main idea, and imagery. The imagery question seemed to pose the greatestdifficulty for students, with just 46 percent answering the questioncorrectly. Perhaps the era and particular cultural customs described weresufficiently far removed from the students' experiences and the author'sstyle so unfamiliar that this piece was more difficult to comprehend.
In response to the informational passages, twelfth gradersfound the global questions somewhat more challenging than thoseeliciting particular pieces of information. Between 43 and 92 percent of thetwelfth-grade students responded successfully to the specific informationquestions and between 38 and 84 percent to the questions tapping overallcomprehension.
A science passage titled "Oceans" is presented as anexample. In general, this passage was the most technical of theinformational passages included in the assessment. The first, second, andthird questions focus on specific information regarding a distinguishingcharacteristic of sea level a', the equator, factual information aboutdistance, and the most salient feature of an ocean. Questions 4 and ri focuson the overall message, asking about the novel application of a scientificprinciple and the topic of the passage.
I 85

Oceans
The waters of the sea are always going somewhere. This factis true quite apart from the movement of the tides. Ifyou diveinto the surf at Na icket, some of the water particles thatcling to your back illay have just arrived, after a journey ofmany years, from Antarctica 9,000 miles away. Thu surfacewaters drift -- in mighty whirlpools half an ocean in size. Thedeep waters creep in journeys that may take centuries tocomplete.
This restlessness is a trait of the sea almost as basic as itswetness. The best way to understand it is to take a long-rangeview of what the Earth does in space. As it swings round theSun in almost circular orbit, it whirls on its axis in such a waythat the seas near the equator r eceive the direct rays of the Sunand consequently much more heat than the polar seas get.That fact alone would be enough to set the oceans stirring.When the Sun warms the surface water at the equator, thiswarm water expands, and the sea level actually tends to be afew inches higher at the equator. This expansion is not much,but it does produce a tiny slope. As a result, the surface waternear the equator tends to stream "downhill" toward the Northand South poles. And the heavier cold water (heavier becausewater contracts as it cools to about 39 degrees Fahrenheit)sinks beim,/ the warm and tends to spread slowly along thebottom toward the equator.
The interchange of warm equatorial waters for cold polarwaters is one of the most important of the ocean's movements.However, it is complicated by the :,weep of other great forcesthat are also set in motion by the whirling of the Earth.
As the Earth spins, at 1,000 miles an hour at the equator, ittends to spin right out from under the oceans and leave thembehind. Since the spin is eastward, the waters tend to pile upalong western shores of the oceans. But that is not all. TheEarth's spin has a curious effect on wind and water, and forthat matter, on all moving objects a boat, a ballistic missile,or even a thrown ball, This s! n effect causes them to turnslightly to the right in the Northern Hemisphere and to the leftin the Southern. This is called the "Coriolis effect,' after theFrench mathematician who first described it more than acentury ago. Artillery soldiers have learned that they mustmake allowance for the Coriolis effect if they wish to beaccurate with long-range guns.
86

Specific Information
1. What distinguishes sea level at the equator from sea levelat the poles?
A It is lower.67% 'B It is higher.
C It streams uphill.D It is made up of heavier water.
Specific Information
2. How many miles is Nantucket from Antarctica?A 1,000B 4,000C 8,000
93% 'D 9,000
Specific Information
3. According to the passage, what is considered to be one ofthe most important of the ocean's movements?68% 'A The interchange of warm equatorial waters for
cold polar watersB The movement of water along western shores
of the oceanC The drifting of surface waters and creeping of
deep waters
Overall Message
4. A person who was shooting a long-range gun in theSouthern Hemisphere could compensate for the Corioliseffect by pointing the gun slightly to which side of thetarget?
A The left49% 'B The right
C AboveD Below
Overall Message
5. Which of the following topics receives the most emphasisin the passage?
A The influence of the Sun's heat on tidesB Characteristics of surface water at the equator
38% 'C Causes of water currents between the equatorand the pole,
D The influence of the Earth's spin on global tides
187

The findings for the "Oceans" passage show that question 2,which asks about information easily located in the passage, was answeredcorrectly by 93 percent of the students, while the fifth question, about thetopic of the passage, was answered correctly by only 38 percent of thestudents.
Thus, across all ages and passages, it seems that readingproficiency is passage-specific, dependent on the topic and structure ofthe passage as well as on the question type. Although students at all threegrades tended to find the global information questions slightly moredifficult than questions about specifics, this generalization was not true forall of the passages. In response to passages or content with which studentswere likely to be familiar, the percentage of students who showed overallcomprehension of the message was comparable to (and sometimes higherthan) the percentage who showed comprehension of specific information.In general, close to three-fourths of the students at all grade levelssuccessfully constructed meaning from specific information and nearlytwo-thirds appeared to have an overall understanding of what they hadread. Further, although students did so in response to both literary andinformational texts, in general, it appeared that informational passageswere slightly more difficult than literary passages for students tounderstand from the point of the overall message, particularly for fourthgraders.
Cross-Grade Comparisons
A number of passages were administered at more than onegrade level, and students' responses to these passages are summarized inTABLE 5.5. Findings indicate sizable growth in students' ability to respondto both specific information and overall meaning questions. Performanceincreased substantially from grade 4 to grade 8, particularly in response tothe informational passages. During these years, students experiencesubstantial growth in school-type expository reading and writing abilities,suggesting that they have had less experience with expository writing thanwith the story forms they have heard since early childhood.6 Between 10and 33 percent more students answered both types of questions correctlyat grade 8 than at grade 4.
Similar, but less substantial, gains occurred for mostpassages between grades 8 and 12. With the exception of questions askingfor specific information in response to the "Business" passage, between 7and 22 percent more students responded correctly at grade 12 than atgrade 8.
'Judith A. !Anger, Gitilatrti livadin,14 and 1Vr ifing: Ntructuroy aad Mraiegiem (Norrmod, NJ: Ablex, 198(i)

TABLE
5.5Cross-Grade Comparisons of the AveragePercentage of Students SuccessfullyConstructing Meaning
Literary
Information
Grade 4
Specific
Grade 8 Grade 12 Grade 4
OverallMessage
Grade 8 Grade 12
Big Wind 71.8 83.3Old Jim Bridger 61.9 73.1 61.0 72.3A Childhood
Memory 57.3 '77.5 46.3 62.0Silky 78.7 89.4
InformationalNaomi 62.9 85.1Business 84.7 80.4 48.7 70.5Bethune 66.0 86.3Mosquito 44.9 78.31st Americans 55.4 71.1 49.8 74.9Web of Life 72.9 82.7 60.8 70.1Summer Job 65.5 34.4Meow-wow 62.6 76.7Arts 32.0 43.1 26.8 43.1Viruses 34.0 57.7 45.1 59.1Garden in Park 82.5 90.9 61.3 65.6Skunk Cabbage 81.3 88.3 57.5 68.3Breathing 77.9 137.4 48.2 62.0Elephant Seals 64.1 79.4 58.1 70.1Supreme Curt 31.2 44.8
The "-" symbol indicates that a passage was not given at a partial ar grade level.
1 89

Constructing and Examining Meaning
'lb examine students' abilities to go beyond their initialunderstandings, they were prompted to write their responses to questionson three passages: "Ant and Dove", "Big Wind", and "High Tech Pizza". Adescription of each passage follows.
"Ant and Dove" is a fable, leading to the moral that one goodturn deserves another. Students were asked to write aboutconnections they were able to make between what happensin the story and the moral.
"Big Wind" is a tall tale told by grandpa, '10 reminiscesabout the mayhem created by an incredibly big wind.Students were asked to indicate whether they thought thestory was true or not, and to tell why supporting theirinterpretation with evidence from the story.
"High Tech Pizza" is an article describing the ingredientsand preparation of precooked pizza. Students were asked towrite a paragraph describing the ways in which pizza isprepared in an automated factory.
In general, students' written responses to these passagesreflected three levels of understanding. Unsatisfactory responses reflected,at most, partial understanding of the passage and task. Though details ofthe passage might be cited, they reflected incomplete or partialcomprehension. Adequate responses included enough detail to indicatethat students had successfully constructed an initial understanding of thepassage, providing at least a generally appropriate response to thequestion that was asked. Elaborated responses went beyond the initialconstruction of meaning, including evidence to support the analyses andinterpretations. Such responses it dicated that the students had beensuccessful in examining meaning
The findings, summe,ri.;,ed in TABLE 5.6, indicate that themajority of students (51 to 88 percent) were successful in constructingmeaning in response to these passages, providing either adequate orelaborated responses. They had a great deal more difficulty in examiningmeaning (and writing about itl. At most, 13 percent of the open-endedresponses to any of the passages were rated as elaborated, reflecting theability to analyze and examine meaning in order to provide evidence forthe understanding that has been reached.
90

TABLE
5.6Ratings of Responses to Open-EndedQuestions by Grade Level
Grade 4
Percentage
Unsatisfactory
of Student Responses
Adequate Elaborated
Ant and Dove 49.3 38.2 12.5Big Wind 27.2 72.3 0.1
Grade 8Big Wind 11.7 86.9 1.4
Grade 12High Tech Pizza 40.2 54.9 4.8
Ant and Dove
Students' written responses to the "Ant and Dove" passagewere evaluated according to their ability to describe relevant actions of theant and the dove. Unsatisfactory papers failed to indicate how thecharacters helped each other, adequate papers provided evidence thatmeaning had been constructed, and elaborated papers provided supportrelating in detail how both the ant and dove helped each other.
In response to the "Ant and Dove" task, half the students atgrade 4 provided unsatisfactory responses, and only 13 percent were ableto provide detailed evidence from the text to support the moral, reflectinga successful attempt to examine meaning. The other 38 percent providedpartial information, reflecting an initial construction of meaning. Sampleresponses provided by fourth graders follow.
91
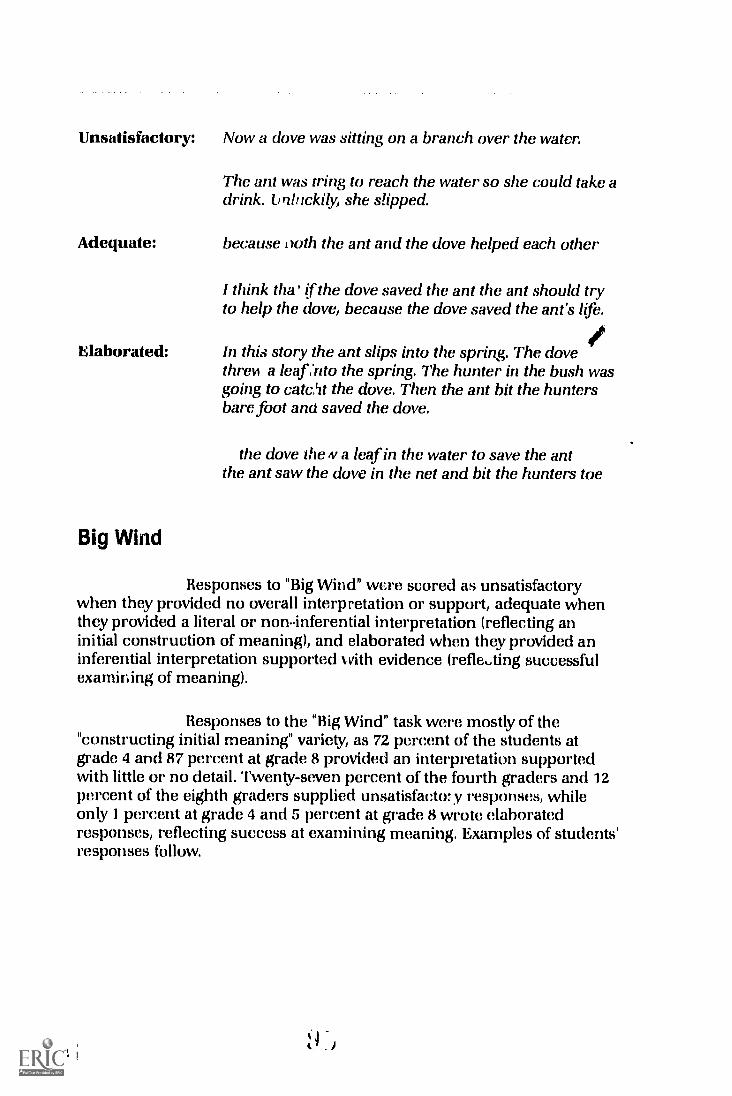
Unsatisfactory: Now a dove was sitting on a branch over the water.
The ant was ming to reach the water so she could take adrink. brzb ickily, she slipped.
Adequate: because oath the ant and the dove helped each other
I think tha' if the dove saved the ant the ant should tryto help the dove, because the dove saved the ant's life.
Elaborated: In this story the ant slips into the spring. The dovethree a leaf ..nto the spring. The hunter in the bush wasgoing to cateit the dove. Then the ant bit the huntersbare foot and saved the dove.
the dove the iv a leaf in the water to save the antthe ant saw the dove in the net and bit the hunters toe
Big Wind
Responses to "Big Wind" were scored as unsatisfactorywhen they provided no overall interpretation or support, adequate whenthey provided a literal or non-inferential interpretation (reflecting aninitial construction of meaning), and elaborated when they provided aninferential interpretation supported with evidence ( reflecting successfulexamining of meaning).
Responses to the "Big Wind" task were mostly of the"constructing initial meaning" variety, as 72 percent of the students atgrade 4 and 87 percent at grade 8 provided an interpretation supportedwith little or no detail. Twenty-seven percent of the fourth graders and 12percent of the eighth graders supplied unsatisfactory responses, whileonly 1 percent at grade 4 and 5 percent at grade 8 wrote elaboratedresponses, reflecting success at examining meaning. Examples of students'responses follow.
92

Unsatisfactory: It made the story more true when they said that theylived on a fat n
Adequate:
Elaborated:
I think the story has a lot of meaning and alot is true itmakes me think of it happening to my Grampas farm Ithink some of it could realy happen.
Parts that I think made this story fictional were:1) the cow flying around in the wind;2) the grandfather throwing wood at the wind;3) the wind giving grandpa the barn and then getting
the doors;4) the wind putting the pigeon house on top of the
barn.
I thought this story was made up for many reasons.First, because he said the wind blew a well out of theground. Second, he ran out of the house and threw apiece of wood at the wind instead of blowing away.Third, when the barn landed in his yard it didn't havedoors the man got mad so the wind blew it away andback. When it came back it had door. All of these thingsare unbelievable or fictional.
High Tech Pizza
Responses to "fligh Tech Pizza" were scored asunsatisfactory when thy did not give evidence of pulling information fromthe passage or when they overgeneralized without any reference to thesteps depicted in the passage. Essentially, unsatisfactory responsesprovided no real evidence that the student comprehended the passageeven though related information was included. Adequate responsesdescribed one or more of the critical steps, indicating successfulconstruction of initial meaning. Elaborated responses provided cohesive,detailed d-.scriptions of all the steps used to "fabricate" pizza. Some ofthese papers also offered a commentary or interpretation, reflecting theability to examine meaning.
Results indicate that twelfth graders had difficultyexplaining the information in this passage about factory production ofpizza. Although a slim majority of the high-school seniors' responses tothe "High Tech Pizza" task fell into the adequate category (55 percent), 40percent provided unsatisfactory responses, and only 5 percent providedelaborated answers that might indicate some ability to examine meaning.The following sample responses were provided by twelfth graders.
93

Unsatisfactory: fabrication is the making of FAKE Pizza
Adequate:
Elaborated:
94
The fabrication of a pizza in an automated factory is in5 stages.
1. Milling -- wheat grain milled & become grain, refinedflour becomes raw materal for pizza
2. Chemical Treatment refined flour treated w/chemicals so can last longer, cornstarch used in cheese& sauce so can resist heat.
3. Intermediate Fabrication products fabricated intoartificial cheese, tomatos & sausage to make eachingredient real like.
4. Final Fabrication putting everything together &partially cook it.
5. is reheating and cooking over & over.These are the 5 stages in in making a high-tech pizza.
Pizzas made in a automatic factory are not as simpleas one think. Instead ofjust making dough, addingsauce and putting on the toppings. First, wheat is milledand the flour fractured to yield bran, germ and starch.Second, the refined flour is treated with an oxidizingagent to improve the stretchability of the flour whenmade into dough, which is called chemical treatment.Third we have the immediate fabrication where thechemically modified basic products are fabricated intothe artificial toppings. So that each ingredientcontributes the traditional aroma, flavor and mouthfeel. The last there is the final fabrication where at lastthe intermediate ingredients are fashioned into a pizzathat will be partially or fully cooked, then frozen andpackaged.
t. 2

Summary
Looking at the results across various passages, it becomesapparent that, in general, a large percentage of the students canunderstand the particular details of what they read, but somewhat fewerstudents get the overall meaning and even fewer can examine theirunderstanding. Analysis of questions representing steps in constructingmeaning indicated that, by and large, students performed well on thespecific information questions, indicated that they understood a numberof details and, to some extent, how these details were related to the topic.Approximately two-thirds of the students performed well on the overallmeaning questions, indicating that they could go beyond the parts of apassage to comprehend the main argument that details were meant tosupport, and that they could accommodate general notions of what thetext was about.
The results discussed here also suggest that many studentsat all three grades have difficulties going beyond their overallunderstandings, to write about and explain what they read. As with themultiple-choice questions, the responses of the majority of students tooper .ended questions indicated some ability to construct initial meanings.Far fewer, however, indicated an ability to examine meaning by providingdetails or arguments to support their interpretations.

PROCEDURAL APPENDIX
A Description of the 1988 NAEP Reading Assessment
An Introduction to The Nation's Report Carol
The Nation's Report Card, the National Assessment ofEducational Progress (NAEP), is an ongoing, congressionally mandatedproject established in 1969 to obtain comprehensive and dependable dataon the educational achievement of American students. From its inceptionuntil 1980, NAEP conducted annual assessments of 9-, 13-, and 17-year-olds attending public and private schools, and it has carried out biennialassessments since then. It remains the only regularly conductededucational survey at the elementary-, middle-, and high-school levels. Todate, approximately 1.5 million American students have participated in theNAEP assessments.
Across the years, The Nation's Report Card has evaluatedstudents' proficiencies in reading, writing, mathematics, science, andsocial studios, as well as literature, art, music, citizenship, computercompetence, and career and occupational development. Several of thesesubjects have been assessed many times, permitting an analysis of trendsin student achievement. In the 1987-88 school year, U.S. history, writing,civics, and geography were assessed, in addition to reading. In total, theseassessments involved approximately 130,000 elementary-, middle-, andhigh-school students from 1,500 schools across the country.
NAEP assessments are developed through a broad-basedconsensus process involving educators, scholars, and citizensrepresentative of many diverse constituencies ar.d points of view. Panels ofexperts developed the 1988 reading assessment objectives, proposing goalsthat they felt students should achieve in the course of their education.After extensive reviews, the objectives were given to item writers whodeveloped assessment questions to fit the specifications set forth in theobjectives. A limited set of reading backgrounds vestions was prepared, inaddition to the general background and cognitive questions, to provide abasis for examining policy-relevant issues. These background questionsasked students for information on the kinds of reading instruction theyhad received, as well as on their reading activities, attitudes, andresources. Teachers of the fourth-grade students also completedquestionnaires about their instructional practices arid background.
96

All items for the 1988 assessment cognitive and ,
background alike underwent intensive reviews by subject-matter andmeasurement specialists and by sensitivity reviewers whose purpose wasto eliminate any material potentially biased or insensitive towardparticular groups. The items were then field tested, revised, andadministered to a stratified, multi-stage probability sample selected so thatthe assessment results could be generalized to the national population.
Following each NAEP assessment, the results are publishedin reports that describe patterns and trends in achievement in a givensubject area. The NAEP reports are widely disseminated to legislators,educators, and others concerned with improving education in thiscountry.
The Nation's Report Cara is supported by the U.S.Department of Education, Office of Educational Research andImprovement, and directed by the National Center for Education Statistics.Educational Testing Service has been the grantee for the project since1983. NAEP is governed by the National Assessment Governing Board, anindependent, legislatively-defined board.
The 1988 Reading Assessment
The objectives and items for the 1988 reading assessmentwere developed using a broad-based consensus process involvinguniversity professors, classroom teachers, social science researchers,school administrators, and curriculum specialists from across thecountry.?
For the 1988 reading assessment, the first objective"Comprehends What is Read" was considered central to the readingprocess, and the other objectives were outgrowths of this one.Encompassing the type of material, the reader's purpose, and the reader'sbackground knowledge, comprehension was described as an interactiveprocess by which the reader constructs meaning from a text.
Objective Two, Extends Comprehension, included theability to analyze, interpret, and evaluate what had been read. Managingthe reading experience was the focus of Objective Three, which includedusing the structure and organization of the text, readers' aids, flexibleapproaches to the task, and materials appropriate to the reading purpose.Objective Four comprised various aspects of valuing reading and engagingin reading experiences.
'19/16 and 19101 Heading ONvelives Ilorincifion, NJ! FAluct 'anal 'Jesting Service, National Assessment of EducationalProgress, June 19871.
1(L4 1 77

Sampling, Data Collection, and Scoring
The overall structure of the 1988 assessment used afocused-BIB spiral matrix design whereby not all students respond to allitems in the assessment. This enables broad coverage of the subject areabeing assessed while minimizing the burden for any one student. Eachassessment booklet required about one hour of student time. Students atgrades 8 and 12 were given five minutes to complete each of twobackground questionnaires one requesting general backgroundinformation and the other requesting information on their readingexperiences at home and in the classroom and 45 minutes for thereading passages and accompanying questions. At grade 4, thebackground questions were read to students, which took about 15minutes. Fourth graders were given 30 minutes to respond to the readingcontent questions. Most of the content questions were multiple choice, butsome open-ended questions were also included. Eighty-three cognitivequestions were administered at grade 4, 100 questions at grade 8, and 110questions at grade 12. Some of the items were given only at one grade,while others were given at more than one grade.
Seven 15-minute blocks of cognitive reading items wereprepared at grades 8 and 12, and seven 10-minute blocks at grade 4. Thebalanced incomplete block or "BIB" part of the 1988 NAEP design assignedthese seven reading blocks to booklets in such a way that each blockappeared in three booklets in each of the three possible positions andeach pair of blocks appeared in one of seven booklets. Approximately 1,800students responded to each question. The "spiralling" part of the methodcycled the booklets for administration with booklets from the othersubject areab assessed in 1988 so that typically only a few students in anyone session received the same booklet.
Sampling and data collection activities for the 1988assessment were conducted by WES1AT, Inc. As with all NAF,Passessments, the 1988 assessment was based on a deeply stratified, three-stage sampling design. The first stage involved stratifying primarysampling units (typically aggregates of continuous counties, but sometimesa single county) by region and community type and making a randomselection. Second, within each selected unit, public and private schoolswere enumerated, stratified, and randomly selected. Finally, student,' wererandomly selected from each school for participation in NAEP and thenrandomly assigned to assessment sessions. TABLE A.1 presents the studentand school sample sizes for the 1988 reading assessment of fourth, eighth,and twelfth graders, as well as the school cooperation and studentresponse rates.
1 ) 4
98

TABLE
A.1Grades
Student and School Sample Sizes: 1988
Percent PercentNumber of Number of Schools StudentStudents Schools Participating Completion
4 4,534 327 88.7 92.88 4,404 399 86.6 87.8
12 4,250 304 82.8 78.5
Total 13,188 1,030
Note: These figures were obtained from the Reports on NAEP Field Operation and Data Collection Activities, prepared by
Westat. Inc. Although sampled schools that refused to participate were replaced, school cooperation rates are computed based
on the schools originally selected for participation in the assessments. The student completion rat s represent the percentage
of students assessed of those invited to be assessed, including students assessed in follow-up sessions when necessary.
All data were collected by a trained field staff. Somestudent8 sampled (less than 5 percent) were excluded from the assessmentbecause of limited English proficiency or severe handicap. In 1984, NAEPbegan collecting descriptive information on these excluded students.
Following the session, the assessment administrators sentcompleted materials back to ETS for processing. All open-ended responseswere scored by professional readers who were trained to use theevaluative criteria developed for each question. The booklets were thenscanned and information was transcribed to the NAEP database. All datacollection and processing activities were conducted with attention torigorous quality control procedures.
Open-Ended Item Scoring
A scoring guide was developed for each open-endedreading question to focus raters' attention on how successfully students'responses accomplished the task set forth in the prompt. The guidesdefined four to five levels of task accomplishment for each task. For ease inreporting the results, the levels contained in some of the guides werecollapsed into four common levels: not rated, unsatisfactory, adequate,and elaborated, as illustrated in Figure A.1.
99

FIGURE
A .1Score
3
2
1
0
Levels of Reading Task Accomplishment
Elaborated. Students providing elaborated responses give evidenceof success in examining meaning. They extend and restructure ideasin texts and provide relevant support for their understandings. Theyidentify relationships among ideas even when the relationships arenot stated explicitly.
Adequate. Students providing adequate responses formulateunderstandings, but provide no or only partial evidence to supporttheir ideas.
Unsatisfactory. Students provdrig unsatisfactory responses showlittle evidence that they have understood the passage, althoughrelated information may have been presented.
Not Rated. A small perceritage of responses were blank,indecipherable, or completely off task, or contained a statement tothe effect that the student did not know how to do the task.
A group of trained ravers carried out the scoring over aperiod of several months. Prior to scoring the responses to each task, anintensive training session was conducted by NAEP staff in the use of thescoring guide for that task. Twenty percent of the responses were scoredby a second rater to give an estimate of interrater reliabilities. These aresummarized in TABLE A.2. Following the scoring of students' writtenresponses, the information from the b(,oklets was transcribed to the NAEPdata base. All data ceilection and processing activities were conductedwith attention to rigorous quality control procedures.
TABLE
A.2
Ant and DoveBig WindHigh-Tech Pizza
Intraclass Correlation Coefficientsand Percentages of Exact ScorePoint Agreement for Open-Ended ReadingQuestions
Grade 4 Grade 8 Grade 12
Correlation Percent Correlation Percent Correlation PercentCoefficients Agreement Coefficients Agreement Coefficients Agreement
.95 88.9
.92 93.4
Note: The scow ing was based on four categot ies.
look
.95 97.4 .93.93
92.992.9

The Data Analyses
Once the processing of the reading data had beencompleted, the data were weighted in accordance with the populationstructure. The weighting reflects the probability of selection of eachstudent, adjusts for nonresponse, and, through poststratification, assuresthat the representation of certain subpopulations corresponds to figuresfrom the Census and the Current Population Survey. (The NAEP 1987-88Technical Report will provide further details on weighting and its effectson proficiency estimates.)
Analyses included computing the percentages of studentsgiving various responses to the questions and estimating the averagepercentage of students responding correctly to particular sets of items.Because a nationally representative sample of students answered eachquestion, these results are also available for subgroups of students asdefined by gender, race/ethnicity, region, and other characteristics (seeDa4,a. Aopendix).
Item response theory (IRT) technology was used to estimateaverage reading proficiency for the nation and various subpopulations.The main purpose of IRT analysis is to provide a common scale on whichperformance can be compared across groups and subgroups whether ornot they are te:ited using the same sets of items.
1111' defines the probability of answering an item correctlyas a mathematical function of proficiency or skill. NAEP's estimatedstatistics describing national and subgroup proficiency are computed asexpectations of the values of the figures that would have been obtainedhad individual proficiencies '-9en observed, given the data that were infact observed that is, responses to the cognitive and background items!'
The NAEP assessments also make it possible to examinerelationships between student performance and a variety of backgroundfactors, relating achievement to one variable or composite variables. Indeveloping background questions for the assessments, NAEP staff andconsultants rely on existing educational research. Each question iscarefully crafted so that the data it yields can be used to confirm and buildon what is known about factors related to academic performance. Theanalysis of students' responses to the background questions can then beused to highlight particular' relationships of interest for example, therelationship between students' home and school environments and theirperformance in the NAEP assessments. These analyses, however, do notreveal the underlying causes of these relationships, which may beinfluenced by a number of variables. Similarly, the assessments do not
"For theoretical justification of the procedures emplos, ea, SIP Hobert J. Mislevy, E'ES Research Bulletin #M-54-0NR:hantlomizalion-based Inferences About Latent Variables frnr; Complex Samples (Princeton, NJ: Ethicatinnal TestingSet-vice, 19M). For computational details, see 19117-811 Technical lieporl In:int:Mon, NJ: Educational TestingService, National Assessment of Educational Progress, 1990).
101

capture the influence of unmeasured variables. Therefore, the results aremost useful when they are considered in combination with otherknowledge about the student population and the educational system, suchas trends in instruction, changes in the school-age population, andsocietal demands and expectations.
Fourth-grade Teacher Questionna:re
To supplement the information on reading instructionreported by students, the teachers of fourth-grade students sampled forparticipation in NAEP's 1988 reading assessment were asked to complete aquestionnaire that asked about their instructional practices, teachingbackgrounds, and characteristics. NAEP collected information from theteachers of 3,808 of the 4,534 fourth graders who participated in the 1988reading assessment. For the teacher questionnaire analyses reportedherein, these students were treated as the total sample.
The design of the teacher questionnaire was rathercomplex, consisting of three parts. The first part contained questions oneach student participating in the assessment, as some teachers had morethan one of their students assessed. Teachers were asked to proviacinformation on each student's reading level, primary grade readingprogram, and reading group, and on the instructional emphasis onparticular reading skills, homework, testing, and remediation.
In the second part of the questionnaire, teachers wereasked to provide information on each class they taught that includJd oneor more students who participated in the assessment. Teachers wereasked whether students were assigned to the class by ability level, thereading ability of the students in the class, the amount of time spent onreading instruction, the classroom organization for reading instruction,use of various resources, and the amount of time spent using a variety ofinstructional techniques.
The third part of the questionnaire asked about the teacher,including questions about his or her characteristics such as race/ethnicity and gender, as well as academic degrees held, teachingcertification and experience, special training, amount of control overschool decision-making, ability to get resources, and commitment toteaching.
102

All teachers who received the questionnaires were told ofthe students and classes for which they were to provide information. Thisinformation was transcribed onto the cover of the questionnaire using theidentification numbers assigned to each student participating in theassessment. Teachers were also given unique identification numbers. Inkeeping with NAEP's confidentiality policy, the namcs of the studentsassessed and the teachers who completed questionnaires never left theschools. Prior to data analysis, the student identification numbers andclass period designations on the front of each teacher questionnaire wereused to link the teacher questionnaire data to the records containinginformation on students' characteristics and their performance in thereading assessment.
Thus, in the 1988 assessment, NAEP was able for the firsttime to link information on students' reading performance withinstructional information provided by their teachers. Using the student asthe unit of analysis, rather than the teacher, it is possible to describeinstruction as received by nationally representative samples of fourth-grade students. This allns NAEP to address questions such as, what dothe teachers of fourth-grade students actually do in the classroom? Andhow do these practices relate to reading achievement?
The perspective provided by these analyses may differ fromwhat would be obtained by simply collecting information from a nationalsample of fourth-grade reading teachers. However, the approach used isin keeping with NAEP's goal of providing information about theeducational context and performance of students. Further, the results mayreflect more accurately what is actually going on in classrooms, becausethey indicate what the reading teachers of fourth graders are doing, ratherthan what all fourth-grade reading teachers are doing regardless of howmuch contact they have with actual students.
In reality, the difference between the two sets of resultsthat is, the results from surveying all teachers and results from surveyingthe teachers of students at a given grade may be quite small. Forexample, because most fourth graders are taught reading by femaleteachers, it is relatively safe to assume that fourth-grade reading teachersare predominantly female. However, to be cc nsistent with the analysesperformed, care was taken throughout this report to describe the resultsof the teacher questionnaire analyses in terms of students rather thanteachers. The information gleaned from these analyses helps to provide amore complete picture of the instructional experiences of NAEP'snationally representative sample of fourth-grade students.
103

Estimating Variability in Proficiency Measures
Since the statistics presented in this report are estimates ofpopulation and subpopulation characteristics, rather than the actual(unknown) values of those characteristics, it is important to have measuresof the degree of uncerta!nty of the estimates. There are two components ofuncertainty which are accounted for in statistics based on the NAEP data:(1) uncertainty due to sampling variability and (2) uncertainty arisingbecause scale values for c ach respondent are based on a relatively smallnumber of cognitive items.
The sampling variance provides a measure of thedependence of the results on the particular sample achieved. BecauseNAEP uses complex sampling procedures, conventional formula forestimating sampling variability that assume simple random sampling areinappropriate. le account or the characteristics of its complex sampledesign, NAEP uses a jackknife rerlication procedure to estimate thesampling variability. Briefly, the jackknife procedure estimates thesampling variance of a statistic by repeatedly altering the sample in acontrolled manner and recomputing the statistic based on the alteredsample.9 The jackknife variance estimate is based on the variability of thestatistics from the altered samples The square root of the jackknifevariance estimate of a statistic is the sampling standard error of thatstatistic. This standard error includes all possible nonsystematic errorassociated with administering specific items to designated students incontrolled situations.
The jackknifed standard error provides a reasonablemeasure of uncertainty for any statistic based on values observed withouterror. Population scores for cognitive items meet this requirement, butscale-score proficiency values do not. Because each student typicallyresponds to relatively few items, there exists a nontrivial amount ofimprecision in the measurement of the proficiency values for any givenstudent. This imprecision adds an additional component of variability tostatistics based on scale-score proficiency values. This component isestimated by assessing the dependence of the value of the statistic on theparticular set of student level estimated proficiencies used in itscomputation. The measure of the overall variability of a statistic based onscale scores is the sum of the component due to imprecision ofmeasurement and the jackknife sampling variance. The standard error ofthe statistic is the st, tare root of this sum.
"Eugene C. Johnson, 'Considerations and Techniques for the Analysis of NAEP Data.' Journal of Bducational Statistics,Vol, 14, No, 4 (December 1989).
1041
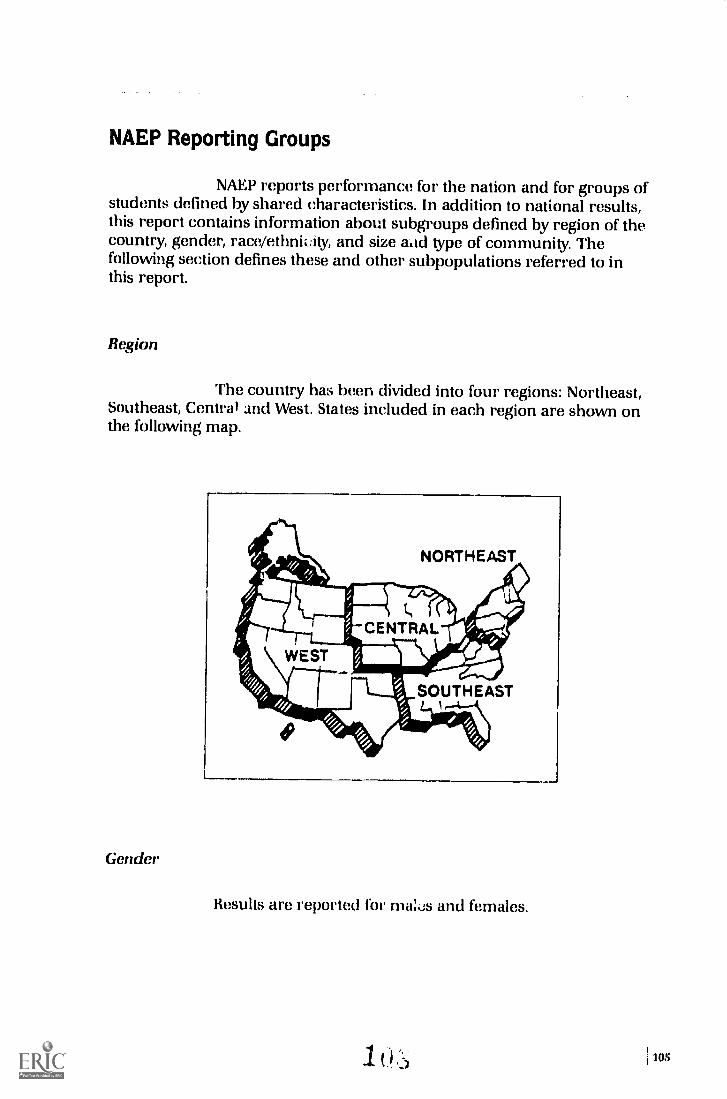
NAEP Reporting Groups
NAEP reports performance for the nation and for groups ofstudents defined by shared characteristics. In addition to national results,this report contains information about subgroups defined by region of thecountry, gender, race /ethnicity, and size a.id type of community. Thefollowing section defines these and other subpopulations referred to inthis report.
Region
The country has been divided into four regions: Northeast,Southeast, Central and West. States included in each region are shown onthe following map.
Gender
Results are reported for ma:ds and females.

Race/Ethnicity
Results are presented for Black, White, and Hispanicstudents, based on students' identification of their race/ethnicityaccording to the following categories: White, Black, Hispanic, Asian orPacific Islander, American Indian or Alaskan Native, and Other. Althoughthe sample sizes were insufficient to permit separate reliable estimates forall subgroups defined by race/ethnicity, all students were included incomputing the national estimates of average reading performance.
Size and Type of Community
Three extreme community types of special interest aredefined by an occupational profile of the area served by the school, as wellas by the size of the community in which the school is located. This is theonly reporting category that excludes a large number of respondents.About two-thirds do not fall into the classifications listed below. Results forthis remaining two-thirds are not reported in this breakdown, since theirperformance was similar to that for the nation.
Advantaged Urban Communities. Students in this groupattend schools in or around cities with a population greaterthan 200,000 where a high proportion of the residents are inprofessional or managerial positions.
Disadvantaged Urban Communities. Students in thisgroup attend schools in or around cities with a populationgreater than 200,000 where a high proportion of theresidents are on welfare or are not regularly employed.
Rural Communities. Student; in this group attend schoolsin areas with a population below 10,000 where many of theresidents are farmers or farm workers.
1061

Race/Ethnicity by Region and Advantaged/Disadvanteged Urban Communities
TABLE A.3 provides information on the cross-sectionbetween students' racial/ethnic characteristics and the regions in whichthey live and the types of communities in which they attend school.
Additional Background Factors
In addition to gathering information on students' gender,race/ethnicity, the region in which they live, and the type of community inwhich they attend school, NAF,P collects data from all students on anumber of background questions, including the type of school program inwhich they are enrolled, the number and types of reading materials in thehome, the highest level of parents' education. and the amount of timespent on homework. Students participating in the 1988 readingassessment were also asked a series of background questions specific totheir reading instruction. To report students' responses to these questionsin a useful way, NAEP has developed composite variables by analyzingstudents' responses to certain sets of the background questions.

TABLE
A.3Distribution of White, Black, andHispanic Students by Region and by Sizeand Type of Community
GRADE 4
Percentage
White
of Students
Black Hispanic
Total 69.7 (0.6) 15.9 (0.5) 10.3 (0.3)
RegionNortheast 70.6 (1.8) 15.9 (1.4) 8.8 (0.8)Southeast 62.4 (2.1) 29.8 (2.0) 5.6 (0.9)Central 82.7 (2.4) 8.7 (2.3) 6.6 (0.8)West 64.3 (1.5) 9.1 (1.7) 19.3 (0.9)
Size and Typeof Community
Advantaged urban 75.0 (3.4)! 9.0 (2.2)! 10.5 (2.5)!Disadvantaged urban 27.1 (5.6) 48.2 (7.4) 20.5 (3.7)
GRADE 8Total 69.8 (0.7) 15.2 (0.7) 10.7 (0.4)
RegionNortheast 73.8 (2.8) 15.3 (1.8) 8.2 (1.8)Southeast 68.9 (2.9) 23.6 (2.4) 5.6 (1.0Central 76.0 (2.4) 15.8 (2.3) 5.3 1,0.9)West 62.0 (2.1) 7.4 (1.4) 21.1 (1.3)
Size and Typeof Community
Advantaged urban 75.6 (4.8) 11.3 (4.0) 8.0 (2.9)Disadvantaged urban 32.9 (5.9) 40.7 (5.4) 18.9 (3.3)
GRADE 12Total 74.0 (1.0) 13.9 (0.7) 8.0 (1.5)
RegionNortheast 80.0 (3.1) 9.9 (2.0) 6.9 (1.9)Southeast 67.2 (3.3) 24.9 (2.8) 5.3 (1.6)Central 83.5 (2.5) 10.6 (1.7) 3.2 (0.6)West 65.3 (2.2) 10.8 (1.8) 16.2 (1.7)
Size and Typeof Community
Advantaged urban 85.7 (2.3) 6.2 (1.4) 3.9 (1.0)Disadvantaged urban 23.2 (6.9) 38.3 (7.5) 34.9 (6.1)
Standard errors are presented in parentheses. The 1- symbol indicates that the datz should be interpreted with caution
because the standard errors cannot be accurately estimated.
1081

DATA APPENDIX
Average Reading Proficiency and Standard Errors
Grade 4 Grade C
NATION 230.4 (1.1) 262.8 (1.0)
GenderMr) le 226.6 (1.5) 256.4 (1.3)Female 234.4 (1.2) 269.6 (1.1)
Race/EthnicityWhite 238.1 (1.2) 269.2 (1.3)Black 210.6 (1.9) 245.7 (2.0)Hispanic 209.9 (2.4) 243.6 (2.1)
RegionNortheast 233.1 (2.8) 268,1 (1.8)Southeast 224.4 (2.5) 259.3 (1.8)Central 234.6 (2.2) 264.3 (3.4)West 230.2 (2.3) 260.1 (1.4)
Size and Type of CommunityAdvantaged urban 247.5 (2.9) 273.9 (2.8)Disadvantaged urban 208.3 (3.2) 247.4 (2.9)Rural 228.3 (2.9) 270.5 (3.4)
Parental EducationNot graduated high school 204.4 (3.2) 244.8 (2.2)Graduated high school 225.9 (2.1) 256.3 (1.5)Some college 240.8 (2.1) 268.6 (1.4)Graduated college 240.9 (1.3) 272.7 (1.2)
Grade 12
1 287.1 (0.8)
:.82.9 (1.1)291.0 (1.1)
292.6 (1.0)270.3 (1.6)267.1 (2.4)
287.0 (2.1)284.3 (1.1)289.3 (1.6)287.7 (1.5)
296.0 (2.6)269.4 (3.0)287.7 (3.2)
271,4 ;2.1)278.2 (1.1)288.6 (1.2)295.9 (1.2)
109

Average Percentage of Students Constructing Meaning
Specific Information Average Percentage Correct
Informational Passages Grade 4 Grade 8 Grade 12
NATION 69.9 (0.6) 68.0 (0.5) 75.0 (0.4)
GenderMale 68.4 (0.8) 64.7 (0.8) 72.4 (0.6)Female 71.5 (0.7) 71.5 (0.5) 77.4 (0.5)
Race/EthnicityWhite 73.7 (0.7) 71.0 (0.7) 77.4 (0.5)Black 59.6 (1.2) 59.5 (1.0) 67.9 (0.9)Hispanic 59.1 (1.3) 58.7 (1.2) 65.4 (1.5)Other 69.1 (2.0) 69,3 (1.3) 73.2 (1.6)
RegionNortheast 72.1 (1.6) 71.0 (0.8) 7E.3 (1.1)Southeast 66.3 (1.4) 66.5 (1.0) 73.7 (0.5)Central 72.8 (1.1) 68.3 (1.8) 75.7 (0.9)West 69.0 (1,2) 66.4 (0.9) 75.1 (0.7)
Size and 'Type of CommunityAdvantaged Urban 58.6 (2.0) 60.7 (1.5) 66.3 (1.8)Disadvantaged Urban 78.1 (1.3) 72.4 (1.4) 79.1 (1.2)Rural 68.5 (1.3) 71.2 (1.8) 75.6 (1.8)
Parental EducationNot graduated high school 57.8 (1.9) 59.3 (1.4) 67.4 (1.2)Graduated high school 68.2 ( 1) 64.8 (0,8) 71.2 (0.6)Some college 75.5 (1.2) 70.5 (0.8) 75.7 (0.5)Graduated college 75.3 (0.7) 72.8 (0.6) 78.8 (0.6)Unknown 64.8 (0.8) 57.5 (1.4) 60.5 (3.3)
Literary Passages
NATION 73,4 (0,6) 74.1 (0.7) 69.7 (0.7)
SexMale 70.7 (0.8) 70.2 (0.9) 69.2 (0.9)Female 76.2 (0.6) 78.1 (0.6) 70.2 (0.9)
Race/EthnicityWhite 76.6 (0.6) 77.4 (0.8) 73.3 (0.8)Black 64.9 (1.1) 65.5 (1.5) 60.2 (1.2)Hispanic 64.6 (1.3) 62.6 (1.6) 54.8 (2.2)Other 71.0 (1.9) 74.4 (2.2) 62.5 (3.3)
RegionNortheast 74,3 (1.7) 77.3 (1.0) 69.1 (1.5)Southeast 71.1 (1.2) 71.8 (1.5) 68.3 (1.4)Central 75.1 (1.0) 75.0 (2.0) 72.8 (1.2)West 73.3 (1.0) 72.6 (1.1) 68.7 (1.2)

Average Percentage of Students Constructing Meaning (continued)
Specific information
Literary Passages (cont'd)
Size and Type of Community
Average Percentage Correct
Grade 4 Grade 8 Grade 12
Advantaged Urban 63.0 (1.7) 65.4 (1.8) 61.6 (2.8)Disadvantaged Urban 80.9 (1.1) 79.0 (1.7) 74.8 (1.9)Rural 72.4 (1.6) 77.5 (2.0) 72.0 (2.8)
Parental EducationNot graduated high school 60.9 (1.9) 63.7 (1.5) 62.0 (2.4)Graduated high school 72.3 (1.1) 71.0 (1.2) 65.5 (1.2)Some college 77.0 (1.3) 77.5 (1.0) 71.3 (1.0)Graduated college 77.7 (0.7) 7,..8 (0.8) 73.7 (1.1)Unknown 69.9 (0.6) 63.4 (1.7) 50.1 (5.9)
Overall Message
Informational Passages
NATION 54.8 (0.8) 61.4 (0.6) 61.6 (0.5)
GenderMale 54.5 (1.1) 58.9 (0.9) 60.4 (0.7)Female 55.3 (1.1) 64.0 (0.7) 62.7 (0.6)
Race/EthnicityWhite 58.9 (0.9) 64.7 (0.8) 64.1 (0.5)Black 43.1 (1.2) 51.0 (1.3) 53.6 (0.8)Hispanic 43.0 (1.7) 52.5 (1.4) 51.6 (1.5)Other 53.0 (3.0) 63.7 (1.7) 61.6 (1.7)
RegionNortheast 56.6 (2.2) 64.7 (0.9) 61.2 (1.1)Southeast 51.6 (1.9) 58.9 (1.0) 59.8 (0.8)Central 56.7 (1.4) 62.3 (1.9) 63.0 (1.0)West 54.6 (1.2) 60.0 (1.2) 62.4 (0.8)
Size and Type of CommunityAdvantaged Urban 41.9 (1.8) 53.0 (2.0) 51.9 (2.0)Disadvantaged Urban 63.2 (2.3) 68.0 (1.7) 65.4 (1.4)Rural 52.6 (2.8) 64.8 (2.3) 61.2 (1.9)
Parental EducationNot graduated high school 40.5 (2.6) 51.9 (1.4) 52.8 (1.4)Graduated high school 53.3 (1.6) 57.3 (1.0) 57.9 (0.6)Some college 61.9 (1.9) 64.4 (1.1) 61.5 (0.7)Graduated college 61.9 (1.0) 66.9 (0.7) 65.8 (0.8)Unknown 47.2 (1.0) 50.9 (1.3) 92.2 (4.4)

Average Percentage of Students Constructing Meaning (continued)
Overall Message
Literary Passages
Average
osade 4
Percentage Correct
Grade 8 Grade 12
NATION 67.0 (0.7) 63.2 (0.7) 66.2 (0.7)
GenderMale 65.1 (0.8) 58.9 (1.0) 63.7 (1 I )
Female 68.9 (0.9) 67.7 (0.8) 68.4 (J.9)
Race/EthnicityWhite 70.7 (0.8) 67.1 (0.9) 70.2 (0.8)Black 56.4 (1.2) 52.5 (1.3) 52.3 (1.8)Hispanic 58.3 (1.5) 51.0 (1.7) 49.9 (2.0)Other 64.9 (2.4) 64.1 (2.8) 64.9 (3.8)
RegionNortheast 69.3 (1.4) 67.4 (1.2) 66.1 (1.8)Southeast 64.1 (1.5) 59.4 (1.4) 64.8 (1.2)Central 68.4 (1.6) 64.9 (2.2) 68.2 (1.2)West 66.6 (1.3) 61.6 (1.1) 65.5 (1.5)
Size and Type of CommunityAdvantaged Urban 57.8 (1.7) 54.8 (1.9) 53.7 (2.7)Disadvantaged Urban 74.9 (1.6) 70.5 (1.5) 71.3 (2.5)Rural 67.1 (1.8) 67.4 (3.0) 69.7 (2.5)
Parental EducationNot graduated high school 54.9 (2.0) 53,6 (1.8) 56.4 (2.6)Graduated high school 64.4 (1.3) 58,8 (1.3) 60.2 (1.3)Some college 71.2 (1.5) 66.8 (1.3) 68.3 (1.4)Graduated college 72.4 (0.8) 69.0 (0.8) 71.6 (1.0)Unknown 62.7 (1.1) 50,0 (2.2) 40.0 (5.1)
1121 1 7

Average Percentage of Students Examining Meaning
Average Percentage Elaborated Responses
Grade 4 Grade 8 Grade 12
NATION 6.3 (0.7) 1.4 (0.4) 4.8 (0.5)
GenderMale 6.0 (1.0) 0.5 (0.2) 3.2 (0.6)Female 6.7 (0.8) 2,2 (0.7) 6.2 (0.9)
Race/EthnicityWhite 7.0 (0.8) 1.7 (0.5) 5.5 (0.6)Black 3.6 (1,4) 0.5 (0.5) 2.5 (1.5)Hispanic 3.9 (1.1) 0.6 (0.6) 2.2 (1.6)
RegionNortheast 7.3 (1.9) 1.8 (0.7) 7.2 (1.4)Southeast 6.8 (1.2) 1.1 (0.7) 3.6 (1.1)Central 4.6 (1.1) 1.0 (0.7) 3.8 (0.6)West 6.7 (1.1) 1.6 (0.9) 4.5 (1.2)
Size and Type of CommunityAdvantaged Urban 9.6 (1.6) 4.5 (2.2) 6.2 (1.6)Disadvantaged Urban 6.1 (2.0) 0.0 (0.0) 4.3 (3.1)Rural 4.2 (1.5) 2.0 (2.0) 1.9 (2.0)
Parental EducationNot graduated high school 3.3 (2.0) 0.0 (0.0) 0.5 (0.5)Graduated high school 7-2 (1.3) 1.1 (0.6) 3.8 (1.3)Some college 4.4 (1.4) 0.5 (0.4) 7.1 (1.5)Graduated college 8.6 (1.1) 2.5 (0.7) 4.8 (1.0)
113

Average Reading Proficiency, Standard Deviations, andPercentiles of Reading Distributions with Standard Errors
TOTALGrade 4 Grade 8 Grade 12
Average Proficiency 230.4 (1.1) 262.8 (1.0) 287.1 (0.8)Standard Deviation 41.4 (0.7) 37.3 (0.6) 34.8 (0.6)Percentiles 5 156.4 (1.3) 195.0 (2.6) 224.9 (2.4)
10 174.2 (2.3) 211.6 (1.4) 241.1 (1.4)25 204.3 (2.0) 239.8 (1.6) 265.9 (1.3)50 233.6 (1.2) 266.0 (1.1) 290.0 (1.0)75 259.0 (1.1) 288.6 (1.7) 310.8 (1.0)90 280.3 (0.9) 308.2 (1.0) 329.1 (1.3)95 293.2 (1.2) 320.1 (1.8) 340.0 (1.8)
MALE
Average Proficiency 226.6 (1.5) 256.4 (1.3) 282.9 (1.1)Standard Deviation 43.6 (1.0) 39.4 (0.8) 36.8 (0.81Percentiles 5 148.7 (2.5) 186.0 (3.7) 214.6 (2.3)
10 166.5 (4.4) 201.0 (1.9) 232.8 (1.9)25 198.7 (2.7) 230.7 (1.9) 259.7 (2.5)50 229.5 (1.4) 259.9 (2.1) 286.2 (1.5)75 257.1 (2.2) 284.2 (1.7) 307.9 (1.4)90 279.3 (1.9) 304.7 (1.9) 327.3 (0.9195 293.2 (2.3) 317.3 (1.8) 338.1 (2.2)
FEMALE
Average Proficiency 234.4 (1.2) 269.6 (1.1) 291.0 (1.1)Standard Deviation 38.5 (0.6) 33.8 (0.7) 32.4 (0.8)Percentiles 5 167.2 (2.0) 211.3 (1.6) 235.6 (4.2)
10 182.8 (1.5) 225.0 (1.6) 249.3 (1.5)25 210.1 (1.0) 248.5 (1.2) 270.6 (1.4)50 237.6 (1.1) 271.6 (1.2) 292.8 (1.3)75 260.6 (1.1) 292.2 (1.0) 313.2 (1.2)90 281.3 (1.7) 310.6 (1.2) 330.5 (1.7)95 292.9 (1.6) 322.4 (2.2) 341.3 (3.1)
114i
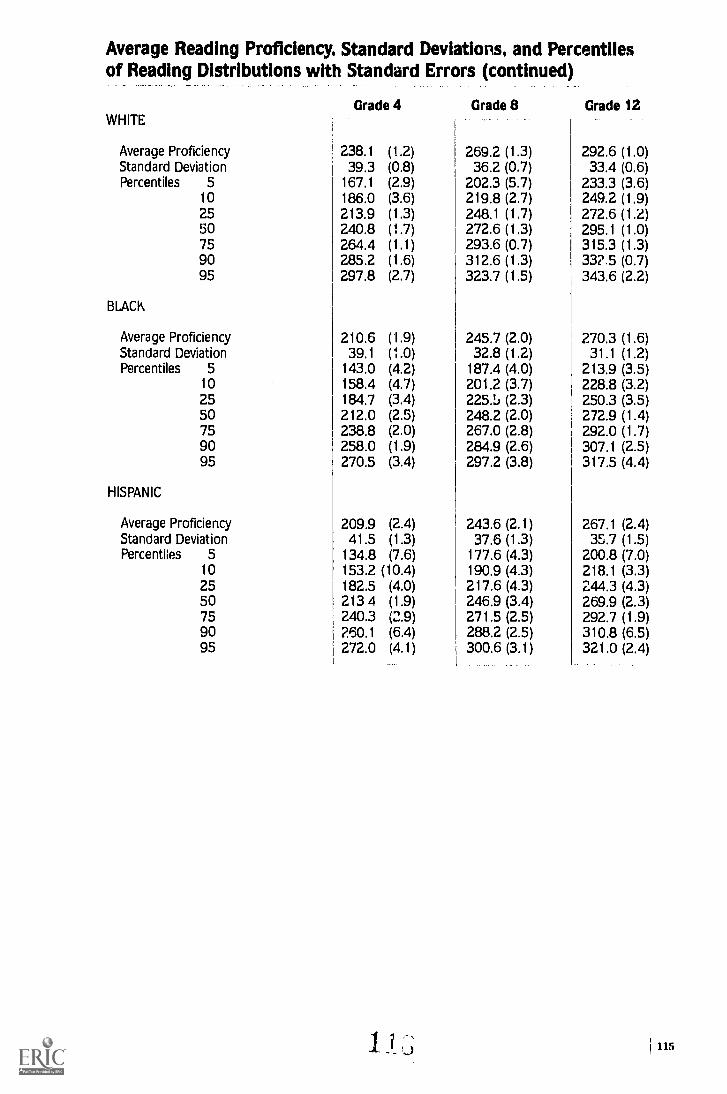
Average Reading Proficiency, Standard Deviations, and Percentilesof Reading Distributions with Standard Errors (continued)
WHITEGrade 4 Grade 8 Grade 12
Average Proficiency 238.1 (1.2) 269.2 (1.3) 292.6 (1.0)Standard Deviation 39.3 (0.8) 36.2 (0.7) 33.4 (0.6)Percentiles 5 167.1 (2.9) 202.3 (5.7) 233.3 (3.6)
10 186.0 (3.6) 219.8 (2.7) 249.2 (1.9)25 213.9 (1.3) 248.1 (1.7) 272.6 (12)50 240.8 (1.7) 272.6 (1.3) 295.1 (1.0)75 264.4 (1.1) 293.6 (0.7) 315.3 (1.3)90 285.2 (1.6) 312.6 (1.3) 332.5 (0.7)95 297.8 (2.7) 323.7 (1.5) 343.6 (2.2)
BLACK
Average Proficiency 210.6 (1.9) 245.7 (2.0) 270.3 (1.6)Standard Deviation 39.1 (1.0) 32.8 (1.2) 31.1 (1.2)Percentiles 5 143.0 (4.2) 187.4 (4.0) 213.9 (3.5)
10 158.4 (4.7) 201.2 (3.7) 228.8 (3.2)25 184.7 (3.4) 225.5 (2.3) 250.3 (3.5)50 212.0 (2.5) 248.2 (2.0) 272.9 (1.4)75 238.8 (2.0) 267.0 (2.8) 292.0 (1.7)90 258.0 (1.9) 284.9 (2.6) 307.1 (2.5)95 270.5 (3.4) 297.2 (3.8) 317.5 (4.4)
HISPANIC
Average Proficiency 209.9 (2.4) 243.6 (2.1) 267.1 (2.4)Standard Deviation 41.5 (1.3) 37.6 (1.3) 35.7 (1.5)Percentiles 5 134.8 (7.6) 177.6 (4.3) 200.8 (7.0)
10 153.2 (10.4) 190.9 (4.3) 218.1 (3.3)25 182.5 (4.0) 217.6 (4.3) 244.3 (4.3)50 213 4 (1.9) 246.9 (3.4) 269.9 (2.3)75 240.3 (2.9) 271.5 (2.5) 292.7 (1.9)90 260.1 (6.4) 288.2 (2.5) 310.8 (6.5)95 272.0 (4.1) 300.6 (3.1) 321.0 (2.4)
115
ACKNOWLEDGMENTS
This report is the culmination of effort by many individualswho contributed their considerable knowledge, experience, and creativityto NAEP's 1988 reading assessment, from developing and conducting theassessments to analyzing and reporting the results.
Under the NAEP grant to Educational Testing Service,Archie Lapointe served as the project director and Ina Mullis as the deputydirector. Statistical and psychometric activities were led by Albert Beaton,with consultation from Robert Mislevy. John Barone managed the dataanalysis activities; Jules Goodison, the operational aspects; and WalterMacDonald, test development. Kent Ashworth managed communicationswith the general public and participating schools. Sampling and datacollection activities were carried out by Westat, Inc., under the supervisionof Morris Hansen, Keith Rust, Renee Slobasky, and Nancy Caldwell.
Emerson Elliott, Acting Commissioner, National Center forEducation Statistics (NCES) provided consistent support, as did membersof his staff in particular, Eugene Owen, Gary Phillips, and David Sweet.
The development of objectives and items for the 1988reading assessment was conducted with guidance from a large network ofconsultants and reviewers. The contributions of the staff and advisors whoparticipated in the development process are gratefully acknowledged.
The reading analyses reported herein were designed andmanaged by Rebecca Zwick and conducted by David Freund withassistance from Minhwei Wang and Kate Pashley. Item development wascoordinated by Irwin Kirsch and open-ended scoring managed by AnneCampbell. The report was organized and written by Ina Mullis and MaryFoertsch with pi. lessors Judith Langer and Arthur Applebee of theUniversity at Albany, State University of New York. Bruce Kaplan and IraSample created the computer graphics. Special thanks for the completionand production of this report are due to Lynn Jenkins for her valuableeditorial assistance, and the many reviewers who suggested improve-ments. Alice Kass provided the excellent word-processing skills essential tothe project.
Finally, and above all, NAEP is grateful to the students andschool administrators whose participation in the 1988 reading assessmentmade this work possible.